Embed Size (px)
Citation preview
1
Electron paramagnetic resonance study of Eu2+
centers in melt-grown CsBr
single crystals
H. Vrielinck,a D. G. Zverev,
a,b, P. Leblans,
c J.-P. Tahon,
c P. Matthys
a and F. Callens
a
a) Ghent University, Department of Solid State Sciences, Krijgslaan 281-S1, B-9000 Gent,
Belgium
b) Max Planck Institute for Polymer Research, Ackermannweg 10, D-55128 Mainz, Germany
c) Agfa-HealthCare NV, Septestraat 27, B-2640 Mortsel, Belgium
Abstract
The structure of Eu2+
monomer centers in CsBr single crystals is investigated using electron
paramagnetic resonance (EPR) spectroscopy. These centers are produced by heating the
melt-grown crystals above 600 K in vacuum followed by a rapid quench to room
temperature (RT) or 77 K. The angular dependence of their EPR spectrum demonstrates that
these centers have cubic symmetry. At RT the EPR spectrum decays by aggregation of the
Eu2+
ions. This strongly contrasts with the situation for CsBr:Eu Needle Image Plates
synthesized by physical vapor deposition, where the Eu2+
-related EPR spectrum was
observed to exhibit long-term stability at RT.
PACS numbers : 87.59.bd, 76.30.Kg, 78.60.Lc
Corresponding author :
Henk Vrielinck, Ghent University–Department of Solid State Sciences,
Krijgslaan 281-S1, B-9000 Gent, Belgium.
Tel. : +32 9 264 43 56. FAX : +32 9 264 49 96
2
I. Introduction
It is well known that in alkali halides (AX) many divalent cations (M2+
) aggregate at ambient
temperature, these include Pb2+
,1,2 the transition metal ions Mn
2+ 3,4
and Fe2+
,5 and the rare-
earth ions Sm2+
, Eu2+
and Yb2+
.6,7
Very often, these divalent ions have a cation vacancy (VA) in
their direct vicinity which preserves charge compensation. Attraction between the electric
dipoles M2+
A–VA is considered to be the driving force for the aggregation, while vacancies
assure the mobility of the impurity ions. In many cases, the initial decay kinetics of the dipole
monomer centers were observed to be of third order, suggesting the formation of M2+
A–VA
trimers as a first step in the aggregation process.3,7
Direct trimer formation seems very
unlikely, in view of the low probability of coincidence for three M2+
A–VA dipoles. However,
Crawford demonstrated that a monomer dipole decay proportional to the third power of the
monomer concentration is observed if trimers are formed by capture of dipole monomers by
dimers, in which the monomers exhibit low binding energy.8 For many M
2+ impurity – AX
host combinations the location of the VA could be determined from the symmetry of the
defect, as established from angular dependent electron paramagnetic resonance (EPR)
studies on single crystals. Such experiments demonstrated that several vacancy
configurations may coexist and that charge compensation of divalent substitutional
impurities in alkali halides is not necessarily local (see e.g. also Rh2+
in NaCl9,10
and AgCl11
).
Among these systems, CsBr:Eu has regained interest in the past decade. Since the late 1990’s
research efforts have been directed towards the development of a CsBr:Eu2+
based X-ray
storage phosphor for medical image plates (IPs) in computer radiography, that would solve
the resolution problems of the BaFBr:Eu2+
powder IPs, while maintaining high sensitivity. It
was found that thermal evaporation of CsBr:Eu2+
on an Al substrate may result in oriented
needle growth (needle image plate, NIP), with needles only a few µm in diameter and up to
several 100 µm in length, matching resolution and sensitivity requirements.12-14
This in itself
is quite remarkable, as melt-grown Eu2+
doped single crystals perform rather poorly as
photo-stimulated luminescence (PSL) phosphors. Our EPR investigation of NIPs
demonstrated that they exhibit a Eu2+
-related spectrum which can be detected at room
temperature (RT), and whose intensity is correlated with the sensitivity of the plate.15,16
While at RT the spectrum can be interpreted as being due to a single type of Eu2+
centers
with axial symmetry around a <100> axis, below 20 K the spectrum exhibits two
contributions due to axial and orthorhombic centers, occurring in a fixed ratio.17
A detailed
electron nuclear double resonance (ENDOR) study revealed the presence of a H2O (or OH-)
molecule in the close vicinity of the Eu2+
ion, and a model was proposed in which a cesium
vacancy (VCs) accounted for the occurrence of two distinct centers at low temperature in a
fixed ratio (immobile VCs) while only one type of centers is observed at high temperature (VCs
bound to the complex, but free to move around it).18
Like the PSL properties, also the EPR spectra of NIPs and melt-grown single crystals of
CsBr:Eu differ substantially. In previous reports, no Eu2+
-related EPR spectra had been

3
detected in as-grown single crystals,19
which was attributed to the aggregation of Eu2+
ions in
CsBr forming diamagnetic pairs or larger clusters. Even earlier, Savel’ev et al.7 had shown
that Eu2+
ions in CsBr qualitatively exhibit the same behavior as in the rock-salt type alkali
halides : an EPR spectrum exhibiting a hyperfine structure typical for a natural abundant
mixture of 151
Eu/153
Eu is produced after quenching the crystals from T > 600 K to 77 K, but it
decays at RT following third-order kinetics in the early stage. Hence, the isolated Eu2+
centers
were assumed to be Eu2+
-VCs dipoles, although, unlike for the centers with a nearest
neighbor VA in the NaCl-type lattices,6 no angular dependent EPR spectra were presented,
specifying the position of the vacancy.
This paper is devoted to a study of the angular dependence of the EPR spectrum of these
quenched-in Eu2+
centers in CsBr crystals. It is further organized as follows. In Section III.A
the EPR spectrum of isolated Eu2+
centers in CsBr single crystals is introduced and its limited
stability at RT is examined, while in Section III.B the symmetry of the center is determined,
resulting in a defect model. The implications for the aggregation mechanism for the Eu2+
ions
is discussed in Section IV. Sections II and V present experimental details and conclusions,
respectively.
II. Experimental
A. Crystal growth and preparation
CsBr:Eu single crystals were grown using the vertical Bridgman technique from CsBr (8.37 g,
Sigma-Aldrich, 99.9% purity) and the Eu-dopant Cebla (CsEuBr3, 0.11g). The powders were
mixed in a grinder, transferred in a quartz ampoule (6 mm inner diameter) and dried in
vacuum at 540 K during 3 days. The evacuated quartz ampoule was fused and heated to 970
K during 4 h before growth (Carbolite two-zone furnace, upper hot zone at 940 K, lower cold
zone at 850 K, ampoule lowered at 2 mm/h) in order to obtain a homogeneous melt. After
growth, the oven was cooled to RT during 1 day. Undoped crystals grown in this way were
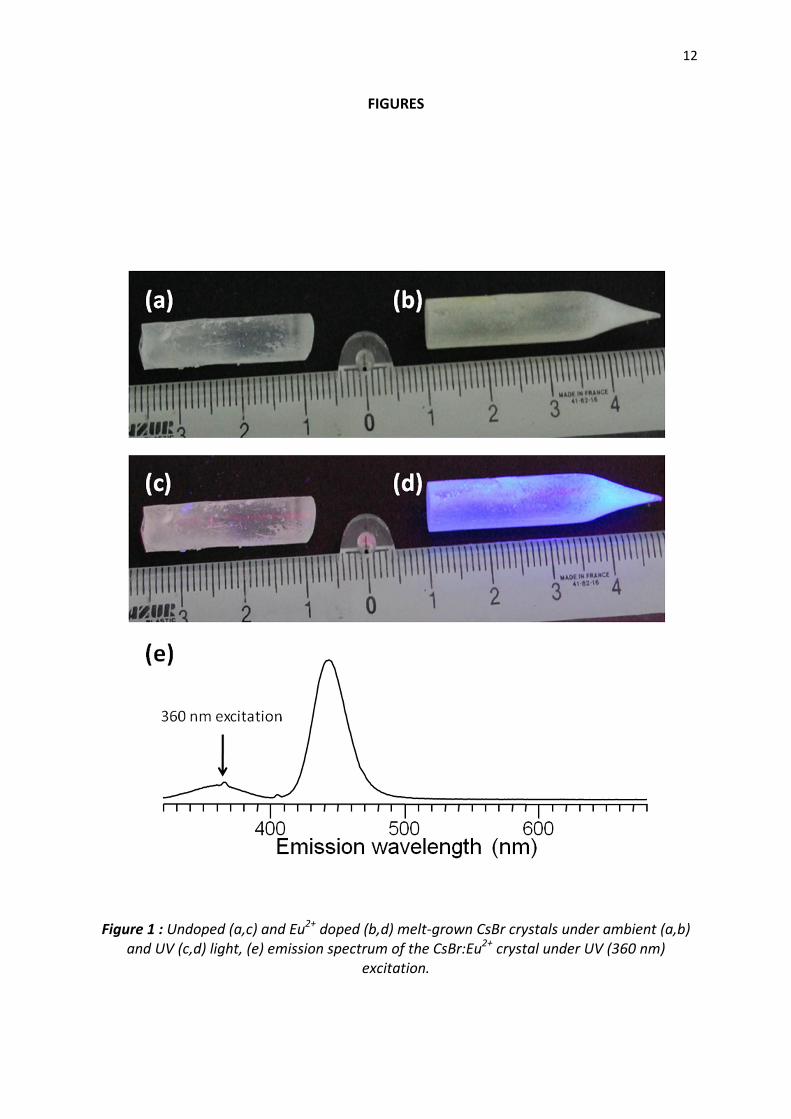
clear, transparent and showed no visible evidence of defects (twinning, cracks). The doped
crystal was slightly opaque and exhibited a faint yellow color. It had a central inhomogeneity
indicating segregation of the dopant. Under UV illumination it exhibited homogeneous
blue/purple Eu2+
-related luminescence (see figure 1, picture of the crystal in ambient light,
under UV excitation, emission spectrum).
Samples of appropriate size for X- (2x2x4 mm3) and Q-band (1x1x2 mm
3) measurements at
microwave frequencies (νµw) of 9.5 and 34.0 GHz, respectively, were cut from the as-grown
single crystal using a diamond wire saw and oriented with their long axis parallel to a
crystallographic <110> direction by inspection of pole figures on a Bruker D8 θ-θ X-ray
diffractometer, with an accuracy of a few degrees. The actual orientation of the samples was
determined by fitting the angular dependence of the EPR spectra. The samples were
transferred into quartz tubes which were evacuated and sealed. These tubes were annealed
4
in a preheated oven at 600-840 K typically for 30 min., then quenched to RT or 77 K, and
rapidly (within 5 min.) mounted on the EPR sample holders without raising their
temperature.
B. EPR measurements and analysis
EPR spectra were recorded in X-band using a Bruker ESP300E EPR spectrometer, with the
standard rectangular EPR cavity ER4102ST (TE102 mode) fitted to an ESR910 Oxford
continuous flow He cryostat, and in Q-band with a Bruker ElexSYS E500 spectrometer with
an ENDOR cavity (ER5106QT-E, TE013) and a CF935 continuous flow He cryostat. Field
modulation was employed at 100 kHz with an amplitude of 0.3 to 0.5 mT. In order to avoid
aggregation of centers7 during the lengthy recordings of the angular dependence of spectra,
these were performed at 20 K and low microwave power (160 µW). The spectra could,
however, easily be recorded, with virtually no loss of information, at temperatures up to 80
K and microwave powers of the order of a couple of mW. At RT the spectra exhibit excessive
broadening which prevents a detailed angular dependence study, and in addition, the
intensity slowly decays.
Spectrum simulations and fittings were performed using the EasySpin routines in Matlab.20
The usual spin Hamiltonian (SH) for Eu2+
centers (8S7/2 ground state, S = 7/2) was used,
21
which for each of the magnetic Eu isotopes (I(151/153
Eu) = 5/2) takes the form
( ) ( )kA q q A A
S B k kk 2,4,6 q k
ˆ ˆ ˆ ˆˆH Eu g B S B O S S A I= =−
= µ ⋅ + + ⋅ ⋅∑ ∑r r r tr r
(1)
with A = 151,153. The first term in the spin Hamiltonian represents the electronic Zeeman
interaction, here assumed to be isotropic, which is a good approximation for S-state ions.
The second term parameterizes the Zero Field Splitting (ZFS), with ( )qk
ˆO Sr
representing the
non-normalized extended Stevens operators20,22
associated with the coefficients qkB which
are real and given in MHz. The last term represents the hyperfine (HF) interaction of the
unpaired electrons with the central Eu nucleus. For simulations the weighed sum of the
spectral components corresponding to the two isotopes was calculated, explicitly taking into
account the known ratios for the HF constants and natural abundances of the isotopes
(A(151
Eu)/A(153
Eu) = gN(151
Eu)/gN(153
Eu) = 1.3887/0.6130, 47.81 % 151
Eu and 52.19 % 153
Eu).23
5
III. Results
A. Effect of annealing, quenching and aggregation
In Fig. 2, the EPR spectra of as-grown crystals, stored for a long time in a low humidity
environment at RT, and immediately after heating to 840 K and quenching to RT are
compared. In both cases the spectra are recorded at RT and at 80 K. It is interesting to note
that for crystals annealed to 700 K (or higher) in air, even after rapid quench to RT or 77 K,
no EPR spectrum is observed, indicating that during this anneal Eu2+
is oxidized to the EPR
silent Eu3+
state. In line with previous EPR reports19
on Eu2+
-doped CsBr crystals, we do not
observe a Eu2+
-related signal in as-grown crystals, but a long time after a previous annealing-
quenching cycle, the signal in Fig. 2a was recorded at RT. The structure observed in this
spectrum can be attributed to HF interaction with the magnetic Eu isotopes.
A sharp line in the spectra (indicated with an asterisk), probably related to an intrinsic defect
in CsBr, strongly grows in relative intensity when the recording temperature is lowered from
RT to 80 K Fig. 2b. The spectra (a) and (b) exhibit only small variations when the crystal is
rotated in the magnetic field. Inspired by previous reports on Eu2+
in CsBr7 and alkali halides
of the rock salt type (see Ref. 6 and references therein), we assume this signal is due to
aggregated Eu2+
in these crystals.
After heating to 840 K for 30 min. and quenching to RT or slightly below (273 K, ice-water
temperature) the EPR spectrum recorded at RT (Fig. 2c) still roughly exhibits the same
structure (and angular dependence), although the HF pattern is more pronounced. When
the sample is kept at RT, the spectrum experiences an important decay in the first few hours
and evolves to its stable state (see further in this section). If the spectrum after annealing
and quenching is recorded at lower temperature (80 K, here, Fig. 2d), it looks substantially
different. It consists of a large number of sharp and intense lines. In this respect, it better
resembles the spectra of Eu2+
centers observed in the alkali halides of the rock salt type.6
The twelve central, most intense lines result from the HF split MS : −1/2 → +1/2 allowed EPR
transition. A detailed study of the angular dependence of the spectrum (Section III.B)
demonstrates that all other lines in Fig. 2d belong to the other allowed EPR transitions of the
same Eu2+
center.
In Fig. 3a selected spectra from the time-evolution at RT of the EPR spectrum after annealing
to 840 K and quenching to RT are shown. It is clear that a component exhibiting pronounced
HF splitting disappears from the spectra in the first few hours. In Fig. 3b the decay of the
signal height at a magnetic field of 1215 mT is presented. In view of the scatter on the data,
it is not evident to establish the decay profile in an unambiguous way from the spectral time
evolution at a single magnetic field, however. Figure 4 shows the time evolution of the
double integrated spectra (total intensity), these allowed the fitting to various decay profiles
: exponential decay, pair recombination, recombination by formation of trimers.

6
These results suggest that in the later stage (after 1500 – 2000 s or 0.5 h) the decay is in a
good approximation exponential, with a time constant of about 5500 s (92 min, 1.5 h, see
red full line as guide for the eye). There is a marked deviation in the first half an hour, which
may simply be the result of an additional fast exponential component. Figs. 4b and 4c,
however, indicate that initial recombination in pairs or in triples, may also explain the fast
intensity decay immediately after the quench. In this respect the results are in qualitative
agreement with those of Savel’ev et al. who proposed trimer formation as primary step in
the aggregation of Eu2+
ions in CsBr.7 We assume that the same, or at least very similar, Eu
2+
centers are involved in our study. The relative contributions of distinct components in the
kinetics very probably depend on details of the crystal growth, the doping, and the anneal
and quenching.
B. Low temperature spectrum and model of the dominant Eu2+
center
To understand the aggregation mechanism of Eu2+
ions in CsBr, detailed knowledge of the
structure of the Eu2+
monomer centers is a prerequisite. In the rock-salt type AX lattices, the
model of a nearest-neighbor Eu2+
-VA <110> dipole is well-established from angular
dependent EPR measurements.6 In CsBr a similar <110> dipole was proposed as a model,
although in this case this implies that Eu2+
and the VCs occupy next-nearest-neighbor cation
positions.7,24
This identification is to the best of our knowledge not supported by EPR
spectral evidence. Even in a more recent EPR study,25
the proximity of a VCs to the Eu2+
ions
is assumed for explaining the aggregation of these ions, but in view of the complexity of the
spectra, no definite position for this vacancy is proposed. In fact, it is even suggested that
several Eu2+
centers with VCs at different positions contribute to the spectrum.
In Fig. 5 the angular dependences recorded at 20 K in {110} planes for crystals annealed at
840 K during 30 min. and quenched to 77 K, in X- (Fig. 5 a) and Q-band (Fig. 5b) are
presented. The angular pattern in the two figures is strikingly similar, and, as demonstrated
by simulations, can be completely explained by a single type of cubic centers with S = 7/2.
For each magnetic field orientation 7 HF packets of 12 lines (two isotopes with I = 5/2) are in
principle expected. The observed number of lines in the spectra is much smaller, on the one
hand because the HF packets overlap, and on the other because the outer packets are
broadened. In order to reveal the origin of this line broadening, simulations of the <100>
spectrum have been performed. The results are summarized in Fig. 6.
Fig. 6a shows the experimental spectrum and that in Fig. 6b is calculated using the SH
parameters from Table 1 and a residual line width (full width at half maximum, FWHM) of
0.8 mT. In the experimental spectrum the EPR lines corresponding to the HF packets 1, 2, 6
and 7 are much less pronounced than those for 3, 4 and 5, which is not the case in the
simulation 6b. One might consider that the spin of the system is 3/2 rather than 7/2 as an
explanation for this remarkable observation, but, in this case cubic ZFS parameters have no
7
influence on the energy levels and axial parameters B��
have to account for the angular
dependence of the spectrum. This leads to a lowering of the symmetry of the paramagnetic
center and the observation of several symmetry related paramagnetic centers, which were
not detected. Simulations of the roadmaps for the center with spin S=3/2 with various B��
combinations also demonstrated that the angular dependence of the EPR line positions is
completely different in this case.
A more plausible explanation for the broadening of the outer transitions is that, due to a
distribution of distant crystal imperfections, a distribution occurs in the ZFS parameters B��
.
In Figure 6c the simulated EPR spectrum of the cubic Eu2+
center is presented taking into
account a Gaussian distribution of the B�� parameter with a FWHM of 33kHz. This
simulation already reproduces the experimental spectral line heights and widths much
better. The remaining difference between experimental and simulated spectra is most
probably caused by the more complex way in which random crystal imperfections affect the
ZFS parameters and a distribution of B��
and B��
may also have to be taken into account. For
instance, the deviation between experimental and simulated spectra is even considerably
smaller if a Lorentzian distribution in the �� parameter with maximum at B�
� = 0MHz and a
FWHM of 4.38 MHz is applied (Figure 6d). The origin of such a distribution is not clear at this
moment, but a distribution of distant lattice defects, e.g. VCs, presents a plausible
explanation.
IV. Discussion : implications for the aggregation mechanism
In view of the earlier reports on Eu2+
centers in CsBr, our result that the symmetry of these
centers is cubic is highly surprising. Hence we verified that the same angular dependence is
recorded, without notable appearance of other spectral components, when varying the
experimental conditions in the following ways :
1. After subsequent annealing to temperatures up to 300 K
2. When the sample is quenched to 300 K or 273 K instead of to 77 K
3. When the annealing temperature is lower, e.g. 620 K rather than 840 K.
Differences with recently reported results,25
where relatively low annealing temperatures
were applied, are difficult to explain. They might be related with crystal quality (which might
lead to additional broadening of the transitions other than −1/2 → +1/2), annealing
atmosphere (not mentioned in Ref. 25, in air Eu3+
is produced above 700 K, at lower
temperatures maybe other species) or EPR recording temperatures and powers. Concerning
the latter, we did, indeed, observe that at 10 K the spectra strongly saturate, even at powers
of only a few 100 µW.
In any case, our results demonstrate that the dominant EPR observable monomer Eu2+
species in CsBr has cubic symmetry. This either implies that no vacancy is present in the first

8
few cation shells around the Eu2+
ion that would lower the symmetry, or that even at
temperatures down to 20 K such a vacancy is so mobile that it freely hops between various
neighboring positions around the divalent cation. The latter possibility can practically
certainly be excluded, in view of earlier dielectric loss and thermally stimulated current
experiments on divalent cation doped CsBr.26,27
From these experiments activation energies
and frequency factors for cation vacancy movement were estimated at ~0.6 eV and ~1010
Hz,
respectively, implying freeze-out of the vacancy mobility below 200 K. Hence, we conclude
that the dominant fraction of isolated Eu2+
centers in CsBr has no charge compensating VCs in
its first few surrounding shells.
Although the EPR results strongly indicate that after dispersion Eu2+
ions have no VCs in their
direct vicinity, aggregation of these centers at RT (see Section III.A) is hard to imagine if no
cation vacancies are involved. Nevertheless, in none of our experiments we could observe
centers with lower than cubic symmetry, even when the crystal was annealed for a
considerable time to RT, and a notable decay of the Eu2+
EPR signal intensity was observed.
The detection of centers with VCs in their direct vicinity may be hampered if the distribution
in their ZFS parameters are even larger than for the cubic center, although one would still
expect the −1/2 → +1/2 transition not to be strongly affected by such a distribution. An
interesting alternative explanation for these observations is that in the aggregation process
the trapping of a VCs is the rate determining step. This hypothesis implies that after Eu2+
Cs-VCs
dipole formation, the migration of such a dipole to others (forming dimers, trimers, clusters
or new crystal phases) is virtually instantaneous. Hence, one would expect the activation
energy of aggregation to be close to that of VCs migration through CsBr, although the
frequency factor may be largely different. Our attempts to measure the intensity decay of
the EPR spectrum as a function of temperature did not allow us to determine the activation
energy, though, most probably related to uncertainties in the sample temperature control
and measurement.
V. Conclusions
CsBr:Eu single crystals grown from the melt and NIPs differ substantially with respect to Eu2+
incorporation. In single crystals isolated Eu2+
ions are only produced when aggregates are
dispersed at elevated temperature while oxidation is prevented (e.g. by heating in vacuum).
They are frozen in by rapidly quenching the crystal to room or lower temperature. At RT the
EPR spectrum of Eu2+
ions is observed to decay as a result of reaggregation of the ions. In
agreement with literature, a fast and a slow component are discerned in this decay.
Surprisingly, only Eu2+
centers with cubic symmetry were detected with EPR, either
suggesting that Eu2+
-VCs dipoles cannot be observed with EPR or that VCs capture by a
substitutional Eu2+
ion is the rate-determining step in the aggregation. NIPs, on the other
hand, which exhibit a much stronger PSL response to X-ray exposure, have a Eu2-related EPR
spectrum with long-term stability at RT. Our earlier EPR and ENDOR studies have shown that

9
in these centers the Eu2+
ion has a H2O (or OH) molecule in its direct vicinity and most
probably also a VCs. The stability of these centers is most likely a direct consequence of this
particular structure.
Acknowledgements
The authors thank prof. D. Poelman and Ing. N. De Roo for their assistance in the making of
Fig. 1. H. Vrielinck acknowledges a Postdoctoral Fellowship of the Research Foundation
Flanders (FWO-Flanders).

10
References
1 M. Nikl, K. Polak, K. Nitsch, G. P. Pazzi, P. Fabeni, and M. Gurioli, Radiat. Eff. Defects
Solids 135, 787 (1995).
2 R. Aceves,V. Babin, M. Barboza Flores, P. Fabeni, A. Maaroos, M. Nikl, K. Nitsch, G. P.
Pazzi, R. Perez Salas, I. Sildos, N. Zazubovich, and S. Zazubovich, J. Lumin. 93, 27
(2001).
3 H. F. Symmons and R. C. Kemp, Br. J. Appl. Phys. 17, 607 (1966).
4 M. C. M. Delucas, F. Rodriguez, and M. Moreno, Phys. Status Solidi B 172, 719 (1992).
5 B. R. Yang, A. Bouwen, and D. Schoemaker, Phys. Status Solidi B 127, 657 (1985).
6 J. Rubio, J. Phys. Chem. Solids 52, 101 (1991).
7 V. P. Savel'ev, V. P. Avdonin, L. D. Dugarova, A. P. Nedashkovskii, and B. T. Plachenov,
Fiz Tverd Tela+ 16, 1090 (1974).
8 J. H. Crawford, J. Phys. Chem. Solids 31, 399 (1970).
9 M. Zdravkova, H. Vrielinck, F. Callens, E. Boesman, H. Vercammen, and D.
Schoemaker, J. Appl. Phys. 82, 2476 (1997).
10 M. T. Barriuso, P. Garcia-Fernandez, J. A. Aramburu, and M. Moreno, Solid State
Commun. 120, 1 (2001).
11 H. Vrielinck, K. Sabbe, F. Callens, P. Matthys, and D. Vandenbroucke, Spectrochim.
Acta A 56, 319 (2000).
12 P. Leblans, D. Vandenbroucke, and P. Willems, Materials 4, 1034 (2011).
13 P. J. R. Leblans, L. Struye, and P. Willems, P Soc Photo-Opt Ins 2, 59 (2001).
14 N. M. Winch and A. Edgar, Nucl. Instrum. Meth. A 654, 308 (2011).
15 F. Loncke, H. Vrielinck, P. Matthys, F. Callens, J. P. Tahon, and P. Leblans,
Spectrochim. Acta A 69, 1322 (2008).
16 F. Loncke, H. Vrielinck, P. Matthys, F. Callens, J. P. Tahon, and P. Leblans, Appl. Phys.
Lett. 92, Art. no. 204102 (2008).
17 F. Loncke, H. Vrielinck, P. Matthys, F. Callens, J. P. Tahon, P. Leblans, I. Ahmad, and E.
Goovaerts, Phys. Rev. B 79, Art. no. 174102 (2009).
18 H. Vrielinck, F. Loncke, J. P. Tahon, P. Leblans, P. Matthys, and F. Callens, Phys. Rev. B
83, Art. no. 054102 (2011).
19 S. Schweizer, U. Rogulis, S. Assmann, and J. M. Spaeth, Radiat. Meas. 33, 483 (2001).
20 S. Stoll and A. Schweiger, J. Magn. Reson. 178, 42 (2006).
21 A. Abragam and B. Bleaney, Electron paramagnetic resonance of transition ions
(Clarendon Press, Oxford, 1970).
22 C. Rudowicz and C. Y. Chung, J. Phys. Condens. Matter 16, 5825 (2004).
23 Bruker Biospin Almanac (Bruker Analytik GmbH, Rheistetten, 2010), p. 47.
11
24 F. Loncke, Magnetic resonance study of dopant related defects in X-ray storage
phosphors, Ph.D. thesis, Ghent University, 2009.
25 D. O. Tolmachev, A. G. Badalyan, R. A. Babunts, V. A. Khramtsov, N. G. Romanov, P. G.
Baranov, and V. V. Dyakonov, J. Phys. Condens. Matter 22 (2010).
26 S. Radhakrishna and S. Haridoss, Journal De Physique 38, 841 (1977).
27 S. Radhakrishna and K. P. Pande, Phys. Rev. B 7, 424 (1973).
12
FIGURES
Figure 1 : Undoped (a,c) and Eu2+
doped (b,d) melt-grown CsBr crystals under ambient (a,b)
and UV (c,d) light, (e) emission spectrum of the CsBr:Eu2+
crystal under UV (360 nm)
excitation.

13
Figure 2 : Q-band EPR spectra of (a,b) CsBr:Eu2+
crystals stored for a long time at RT and
(c,d), a short time after heating to 840 K and quenching to 273 K. Spectra (a,c) are recorded
at 265 K and (b,d) at 80 K. The line marked with an asterisk is not (directly) related to Eu2+
ions.

14
Figure 3 : Decay at RT of the intensity of the cubic Eu2+
Q-band EPR spectrum in melt-grown
CsBr:Eu single crystals, after heating to 840 K and quenching to RT. (a) Selected EPR spectra
recorded at different times after quench (measurement starts approximately 300 s after the
quench. (b) Time-dependence of the signal height at B = 1215 mT, marked with an arrow in
(a).

15
Figure 4 : Representations of the time evolution of the total intensity (I(t)) of the EPR
spectrum of isolated Eu2+
in CsBr (intensity of last spectrum in the time evolution subtracted)
after heating to 840 K and quenching to RT, for testing various decay models.
(a) ( ) ( )( )ln I 0 / I t : exponential decay modeled by ( ) ( )dI t dt I t= −α
(b) ( ) ( )( )I 0 / I t 1− : decay by pair formation modeled by ( ) ( )2dI t dt I t= −α
(c) ( ) ( )( )2I 0 / I t 1− : decay by trimer formation modeled by ( ) ( )3dI t dt I t= −α

16
Figure 5 : Angular dependence of the EPR spectrum, recorded at 20 K, of the dominant, cubic
Eu2+
center produced in melt-grown CsBr:Eu single crystals by heating to 770-840 K and
quenching the crystal to 300 K or 77 K, (a) in X-band (9.57 GHz) and; (b) in Q-band (33.99
GHz). Open square symbols represent experimental resonance positions and full lines
simulations for the two Eu isotopes (red 151
Eu, blue 153
Eu), using the spin Hamiltonian
parameters in Table 1.

17
Figure 6 : Experimental EPR spectrum and simulations of the cubic Eu
2+ spectrum produced in
melt-grown CsBr:Eu single crystals by heating to 840 K and quenching the crystal to 77 K. (a)
Q-band spectrum recorded at 80K in the <100> orientation and at νµw = 33.98 GHz. (b)
Simulated spectrum of cubic Eu2+
without distribution in the ZFS parameters. (c) and (d) Same
as (b) but with a Gaussian distribution in �� around 363��� with ���� = 33��� and a
Lorentzian distribution in �� around 0 MHz with ���� = 4.38���, respectively. The
labeling of the transitions is as follows : 1: -7/2 → -5/2, 2: -5/2 → -3/2, 3: -3/2 → -1/2, 4: -
1/2 → +1/2, 5: +1/2 → +3/2, 6: +3/2 → +5/2, 7: +5/2 → +7/2.

18
Table 1 : Spin Hamiltonian parameters for the cubic Eu2+
center produced in melt-grown
CsBr:Eu single crystals by heating to 770-840 K and quenching the crystal to 300 K or 77 K,
determined by fitting the angular dependence of the EPR spectra recorded at 20 K. Subscripts
indicate the error in the least significant digit.
g (dimensionless) 1.9931
A(151
Eu) (MHz) -92.92
B40 (MHz) 0.3636
B60 (kHz) -0.442