Embed Size (px)
Citation preview

Ann. Geophys., 30, 1345–1360, 2012www.ann-geophys.net/30/1345/2012/doi:10.5194/angeo-30-1345-2012© Author(s) 2012. CC Attribution 3.0 License.
AnnalesGeophysicae
Electron density profiles in the quiet lower ionosphere based on theresults of modeling and experimental data
V. Barabash1, A. Osepian2, P. Dalin3, and S. Kirkwood3
1Lulea University of Technology, Rymdcampus 1, 981 92 Kiruna, Sweden2Polar Geophysical Institute, Halturina 15, 183 023 Murmansk, Russia3Swedish Institute of Space Physics, Rymdcampus 1, 981 92 Kiruna, Sweden
Correspondence to:V. Barabash ([email protected])
Received: 23 August 2011 – Revised: 16 August 2012 – Accepted: 16 August 2012 – Published: 13 September 2012
Abstract. The theoretical PGI (Polar Geophysical Institute)model for the quiet lower ionosphere has been applied forcomputing the ionization rate and electron density profiles inthe summer and winter D-region at solar zenith angles lessthan 80◦ and larger than 99◦ under steady state conditions.In order to minimize possible errors in estimation of ioniza-tion rates provided by solar electromagnetic radiation and toobtain the most exact values of electron density, each wave-length range of the solar spectrum has been divided into sev-eral intervals and the relations between the solar radiation in-tensity at these wavelengths and the solar activity indexF10.7have been incorporated into the model. Influence of minorneutral species (NO, H2O, O, O3) concentrations on the elec-tron number density at different altitudes of the sunlit quietD-region has been examined. The results demonstrate that ataltitudes above 70 km, the modeled electron density is mostsensitive to variations of nitric oxide concentration. Changesof water vapor concentration in the whole altitude range ofthe mesosphere influence the electron density only in the nar-row height interval 73–85 km. The effect of the change ofatomic oxygen and ozone concentration is the least signifi-cant and takes place only below 70 km.
Model responses to changes of the solar zenith angle, solaractivity (low–high) and season (summer–winter) have beenconsidered. Modeled electron density profiles have beenevaluated by comparison with experimental profiles availablefrom the rocket measurements for the same conditions. It isdemonstrated that the theoretical model for the quiet lowerionosphere is quite effective in describing variations in ion-ization rate, electron number density and effective recombi-nation coefficient as functions of solar zenith angle, solar ac-tivity and season. The model may be used for solving inverse
tasks, in particular, for estimations of nitric oxide concentra-tion in the mesosphere.
Keywords. Ionosphere (Ion chemistry and composition;Ionization mechanisms; Modeling and forecasting)
1 Introduction
Characteristic features of the ion structure of the D-regionbetween 50–90 km heights are the presence of ion clusters,formation of simple and complex negative ions, interactionsbetween primary ions and chemically active minor neutralcomponents. Knowledge of the ionospheric structure, in par-ticular the height distribution of the electron number densityas a function of geographical location, season and time is im-portant for radio wave propagation. From a scientific point ofview, investigation of the lower ionosphere and examinationof its structure allow the study of coupling processes betweenthe neutral atmosphere and the ionospheric plasma, and be-tween space weather and Earth’s geospace.
Despite of development and improvement of radio-physical methods for measurements of the electron num-ber density, including ground-based techniques and sound-ing rockets, there is a large uncertainty in the obtained re-sults. Moreover, during quiet conditions and weak auroralevents, experimental data on electron density at altitudesbelow 80 km are often absent. Incoherent scattering of ra-dio waves gives reliable information about the height distri-bution of the electron number density during quiet periodsat altitudes above 75–80 km. The partial reflection methodallows reliable electron number density to be obtained inthe quiet ionosphere only at altitudes above 80 km. Rocket
Published by Copernicus Publications on behalf of the European Geosciences Union.

1346 V. Barabash et al.: Electron density profiles in the quiet lower ionosphere
measurements that apply the Faraday rotation method givethe most reliable data, but do not provide long-term data sets.In order to improve methods for prediction of radio wavepropagation and to ensure communication, better knowledgeof the spatial and temporal distribution of the electron den-sity under various conditions is needed, i.e. in geomagneticquiet and disturbed situations, for different seasons and solarzenith angles. There are several empirical and semi-empiricalmodels of the D-region (for example, Friedrich and Torkar,1992, 1998, 2001; Danilov, 2000; McKinnell and Friedrich,2007) that have been proposed as inputs to the InternationalReference Ionosphere model (IRI). However, these modelshave not been applied for description of the great variabil-ity in the electron number density below 75–80 km nor underspecific geophysical situations. This is especially importantfor stable operation, navigation and communications in verylow and low frequency (VLF/LF) ranges, since these wavesare reflected from the lower border of the D-region.
Theoretical models are useful tools for examining thestructure of the lower ionosphere during various geophys-ical situations and at any heights if they take into accountall basic processes and factors that influence the ionizationbalance. The principal purpose and the complexity of the-oretical model construction is the correct description of thephysical and chemical processes that create and support theionosphere in the D-region. These processes are ionizationand different types of chemical and recombination reactions.Efficiencies of ion-molecular reactions which, together withprocesses of ionization and recombination, form ionospherestructures depend on the local concentrations of long-livedspecies such as NO, H2O, O and O3. They, in turn, dependon solar illumination, season, ionization sources, solar activ-ity, turbulence, diffusion, transport and other factors. There-fore, it is important to incorporate, into any model, realisticheight profiles of the minor constituents that are appropriatefor a given geophysical situations. However, for the presentthere is a lack of accurate experimental information on theheight distribution of many of these constituents. Measure-ments demonstrate a significant difference in minor speciesconcentrations at the altitudes of the mesosphere for similargeophysical conditions. Theoretical estimations of numericaldensity of minor species, obtained with different diffusive-photochemical models, but for the same conditions, also dif-fer from each other and are not in good correlation with theexperimental data. This creates a problem for suitable choiceof minor constituents profiles in each concrete case and canlead to inaccuracies in the modeling of electron density andother ionospheric parameters.
The ion-chemical model developed by Smirnova etal. (1988) for the lower ionosphere has been used by Os-epian et al. (2008, 2009a, b) to investigate the influence ofthe atomic oxygen and ozone concentrations on the electrondensity and the ion composition at different altitudes in theD-region during solar proton events, when there are favor-able conditions for accurate measurements of electron den-
sity in the whole D-region, including the lower altitudes. Thetotal PGI (Polar Geophysical Institute) model of ionization-recombination cycle for the D-region takes into accountsources of ionization, ion-molecular reactions that form pos-itive cluster ions and complex negative ions from the pri-mary ions, their dependence on temperature and number den-sities of minor neutral constituents, electron attachment toneutrals, electron photo-detachment of negative ions, photo-dissociation of negative ions, recombination of positive ionswith electrons, reactions of ion-ion recombination. A com-puter algorithm for computation of ionization rates producedby solar protons has been developed and tested by Kirkwood(1988) and Kirkwood and Osepian (1995). Reliable mea-surements of solar proton fluxes in several energy intervals(by the satellites GOES) permit good estimations of ioniza-tion rates and electron number densities. Atomic oxygen andozone profiles which lead to model electron number densityprofilesNe(h) consistent with observations and which, con-sequently, are the most appropriate for polar mesospheric al-titudes under solar proton event conditions have been pre-sented by Osepian et al. (2008, 2009a).
In this study, the theoretical PGI model of the D-regionhas been modified to examine the structure of the lowerionosphere during quiet conditions and at any geographiclatitude. In order to minimize possible errors in estimationof ionization rates by solar electromagnetic radiation whichmight be neglected during solar proton precipitation, a new,more accurate algorithm for computation of solar radiationintensity at different levels of solar activity has been applied.For this aim the dependences of the solar radiation inten-sity on the solar indexF10.7 derived by Nusinov (1992) foreach wavelength range of the solar spectrum were used. Themodel of the lower ionosphere consists of the following mod-ules:
– model of the neutral atmosphere’s major constituents(MSIS-2000) (Hedin, 1991; Picone et al., 2002);
– height profiles of the minor neutral constituents;
– algorithm for calculating solar radiation intensity in dif-ferent wavelength ranges;
– algorithm for calculating the ionization rates taking intoaccount all sources of the ionization during quiet peri-ods;
– algorithm for calculating concentration of minor neutralconstituents for different solar zenith angles and differ-ent altitudes;
– ion chemistry model (Smirnova et al., 1988).
This type of model construction provides good opportuni-ties for model modification when new data on ionosphericand mesospheric parameters, ionization sources and chemi-cal processes appear.
Ann. Geophys., 30, 1345–1360, 2012 www.ann-geophys.net/30/1345/2012/
V. Barabash et al.: Electron density profiles in the quiet lower ionosphere 1347
The ion chemical model, implemented as a separate mod-ule in the theoretical model of ionization-recombinationcycle for D-region, has been developed by Smirnova etal. (1988). In this model the simple cluster ions NO+
·(H2O)nand O+
2 ·(H2O)n, formed from the primary ions NO+ and O+
2 ,are combined into a cluster family 1, Cl+
1 . Their recombina-tion coefficient with electrons is typically 2× 10⁻⁶ cm3 s−1.Proton hydrates H+·(H2O)n, are combined into a cluster fam-ily 2, Cl+2 . They recombine with electrons about five timesfaster than ions from Cl+
1 . The primary negative ions O−2 andO− initiate series of reactions with neutral constituents andproduce complex negative ions, in particular O−
3 , O−
4 , CO−
2 ,CO−
4 . These ions are intermediate, have short life time andlow concentrations. However, their role in formation of themajor intermediate ion CO−3 and the stable NO−3 ion, whichis formed from CO−3 , is very important.
In the ion-chemical model that was used in this study, theefficiency of the hydration chains of NO+ and O+
2 and re-action chains forming intermediate negative ions CO−
3 fromthe primary ions O−2 and O− are substituted by the effec-tive parametersB(N+
+),B(O+
2 ), B(O−
2 ) andB(O−) whichare determined by the expressions (A1)–(A4) given in theAppendix. The transformation of Cl+
1 to proton hydratesH+
·(H2O)n is described by the expression (A5). The rateconstants for positive and negative ion reactions are givenin Tables A1 and A2, respectively.
The input parameters for the model are date, local time, ge-omagnetic latitude, geographic latitude and longitude, tem-perature, altitude profiles for O2, N2, height profiles for mi-nor neutral constituents (NO, O, O3, H2O, O2(11g), NO2,CO2) for noon and midnight LT with a vertical step of 1 kmand solar activity indexF10.7. Due to the short lifetime ofions and electrons in the D-region, dynamical and transporteffects are ignored. The continuity equations for the mainpositive ions (NO+, O+
2 , Cl+1 , Cl+2 ) and negative ions (O−2 ,O−, CO−
3 , NO−
3 ) are solved under steady-state conditions.Electron number densityNe is calculated as the differencebetween positive and negative ion number densities. Underequilibrium conditions, effective recombination coefficientαeff is determined from the continuity equation for elec-tronsQ(h) = αeff · N
2e . More detailed description of the ion-
chemical model is given by Smirnova et al. (1988), Osepianet al. (2008).
The aim of this study is
– to model electron density profiles in the quiet lowerionosphere using NO, O, O3, and H2O profiles withdifferent values of concentration and evaluate their in-fluence on the electron number density at the differentaltitudes;
– to examine the response of the model to changes of thesolar zenith angle, solar activity and season;
– to verify the modeledNe(h)-profiles with experimentaldata in the sunlit summer and winter ionosphere and todetermine which profiles of minor neutral constituentslead to the best agreement between theoretical and ex-perimentalNe values for chosen situations.
A brief description of the ionisation sources in quiescent con-ditions is presented in Sect. 2. The height profiles of themesospheric minor neutral species (NO, O, O3, H2O) aregiven in Sect. 3. Model simulations of the ionospheric pa-rameters in the daytime summer and winter ionosphere aregiven in Sect. 4. Section 5 contains discussion and conclu-sions.
2 Sources of ionization in the quiescent conditions
2.1 Daytime conditions
Solar radiation is the leading source of ion production inthe daytime ionosphere under quiet geophysical conditions.Ionization of the D-region during the daytime is determinedby several wavelength ranges, namely, hard X-rays (lessthan 1 nm), soft X rays (1–10 nm), Ly-β (102.6 nm) and Ly-α (121.6 nm) emissions, the continuum radiation at 102.6–111.8 nm. The ion production rate at the altitudeh is deter-mined by the classic formula:
Qph(h) =
∑λ
J∞(λ)∑
i
σi(λ)ni(h)
exp
−
∑i
σi(λ)
∞∫h
Ni(z)Ch(χ)dz
(1)
whereJ∞(λ) is the intensity of the solar radiation on thetop of the atmosphere at wavelengthλ, σi(λ) is the ioniza-tion cross section,σi(λ) is the absorption cross section,ni(h)
is the concentration of the neutral component at the altitude
h and∞∫h
Ni(z)Ch(χ)dz is the content of absorbing compo-
nent in the atmosphere column above the given altitudeh,Ch(χ) is the Chapman grazing incidence function, whichcan be calculated according to Smith and Smith (1972). Ion-ization and absorption cross sections have been evaluated fordifferent wavelengths by Nicolet and Aikin (1960); Ivanov-Kholodniy and Velichanskiy (1973); Torr et al. (1979); Rees(1989); Nusinov (1986, 1992).
For each wavelength range of the solar spectrum, solarradiation intensity has a different dependence on the levelof solar activity where the latter can be described by theparameterF10.7. For calculation of solar X-ray and EUV-radiation intensities as functions of solar activity a methoddeveloped by Nusinov (1992) has been applied. According tothis method, solar radiation intensity in the wavelength range10–102.6 nm can be calculated using the expression:
Jλ(F10.7) = Rλ × J58.4(F10.7) (2)
www.ann-geophys.net/30/1345/2012/ Ann. Geophys., 30, 1345–1360, 2012

1348 V. Barabash et al.: Electron density profiles in the quiet lower ionosphere
where the wavelength of 58.4 nm is assumed to be a princi-pal line. The valueRλ for every line is calculated using thefollowing expression with coefficientsaλ andbλ as given byNusinov (1992):
Rλ = aλ + bλJ58.4(F10.7). (3)
The order and units ofJ58.4(F10.7) are 109 cm−2 s−1. It de-pends on the solar activity according to the expression:
J58.4(F10.7) = 1.38+ 0.111(Fb − 60)0.667
+0.0538(F10.7 − Fb)0.667. (4)
The photoionization and photo-absorption cross-sections forO2, N2 and O within the wavelength range 10–102.6 nm aretaken according to Torr et al. (1979) and Rees (1989).
Variation of the Ly-α intensity as a function of solar activ-ity is given by the expression:
J121.6(F10.7) = {134+ 39.9(Fb − 60)0.667
+5.47(F10.7 − Fb)0.667
} × 109 (5)
where,Fb is the background flux of the solar radio emissionat the wavelength of 10.7 cm. Variations ofFb during the so-lar cycle are defined as
Fb =
4∑i=0
[Ai cos(2πit/T ) + Bi sin(2πit/T )] (6)
with the coefficientsAi (82.1, −19.6, 1.778, 2.59,−2.33)andBi (0, 10.55,−0.956, 3.104,−0.925) incorporated intothe program from Nusinov (1992).T is the duration of thesolar cycle,t is the number of years from the solar cycle min-imum.
The X-ray intensity for varying solar activity conditionscan be expressed as
Jλ1−λ2 (F10.7) = J 0λ1−λ2
[Ir (F10.7)/16.8]d (7)
with parameterd determined as
d = 0.22+ 1.56/λ2. (8)
In Eq. (7)Ir (F10.7) is the energy flux given in µW m−2 withinthe wavelength interval 0.8–2.0 nm.Ir(F10.7) varies with thesolar activity according to:
Ir (F10.7) = 0.29F10.7 − 18 (9)
The values ofJ 0λ1−λ2 and the absorption and ionization cross-
sections for all intervals of the X-ray spectrum are given byNusinov (1986, 1992). The intensity of the continuum radi-ation within the wavelength range 102.7–111.8 nm dependson the solar activity according to Paulsen et al. (1972).
2.2 Nocturnal conditions
For calculation of the ion-production rate in nocturnal con-ditions, a semi-empirical approach developed by Kashirin(1986) has been applied. This approach is based on the com-bined analysis of theoretical and experimental data on spatialand time variations of the scattered radiation and providesthe total isotropic flux at an altitude of 300 km for four wave-lengths, i.e. 30.4 nm (He II), 58.4 nm (He I), 121.6 nm (Ly-α), and 102.6 nm (Ly-β). The flux is a function of solar zenithangleχ , solar activityF10.7 and season. The ion productionrate due to scattered radiation at wavelengthλ at altitudesbelow 300 km is given by
qλ= σ i
λni
2π∫0
dφ
π∫0
sinθdθJλ (θ,φ)exp[−τλ secθ ] (10)
where
τλ = σ aλ
hmax∫h
[O2] (h)dh. (11)
In Eqs. (10) and (11)σ iλ is the ionization cross section at
wavelengthλ, σ aλ is the absorption cross section,θ is the
zenith angle,φ is the azimuth angle,ni is the concentrationof the component that absorbs and scatters the radiation atthe characteristic altitudeh, i.e. NO for Ly-α radiation, O2for Ly-β line, O2, N2 and O for He I and He II lines. Thescattered radiation at 300 km is assumed to be isotropic overthe downward hemisphereJλ (θ,φ) = Jλ.
The model takes into account the ionization by galacticcosmic rays, whose intensity depends on geomagnetic lati-tude and solar activity,F10.7, according to Swider (1979).
3 The minor neutral constituents
Ion composition and ion molecular reactions in the D-regionare directly coupled to the local concentration of the long-lived minor neutral species including NO, H2O, O and O3.Nitric oxide, NO, is the most important component for theD-region ion chemistry under quiet conditions. Ions NO+
are the main source of cluster ions in the quiet lower iono-sphere. Molecules of NO actively participate in complexphotochemical reactions, resulting in formation of the fi-nal ions NO−
3 . Experimental data demonstrate the depen-dence of NO number density on latitude, solar activity andseason (Grossmann et al., 1985; Siskind and Rusch, 1992;Siskind et al., 1997, 1998). Theoretical studies have revealedthe processes controlling photochemical sources and sinksof nitric oxide (Ogawa and Shimazaki, 1975; Siskind et al.,1997, 1998). The reactions that are responsible for produc-tion of odd nitrogen, i.e. nitrogen oxide and atomic nitro-gen, in the lower thermosphere, are summarized in Table 1.
Ann. Geophys., 30, 1345–1360, 2012 www.ann-geophys.net/30/1345/2012/
V. Barabash et al.: Electron density profiles in the quiet lower ionosphere 1349
Table 1.Reactions responsible for odd nitrogen production (Ogawa and Shimazaki, 1975; Marov et al., 1996; DeMore et al., 1994; Sanderet al., 2003).
No. Reaction Rate constant, cm3 s−1
(R1) N2 + hν (800–1000A) → N + N 1.90× 10⁻⁸
(R2) N2 + hν (1–800A) → N + N 4.53× 10⁻⁸
(R3) N2O + hν (630–2490A) → NO + N 3.71× 10⁻⁸
(R4) NO2 + hν (2440–3980A) → NO + O 8.30× 10⁻³
(R5) NO2 + hν (1027–2440A) → NO + O(1D) 1.22× 10⁻⁴
(R6) N2 + p+→ N(2D) + N(4S) +p+ –
(R7) N2 + e → N(2D) + N(4S) +e –(R8) N+
2 + O → N(2D) + NO+ 1.4× 10−10· (300/T )0.44
(R9) NO+ + e → N(2D) + O 4.2× 10⁻⁷(300/T )0.85
(R10) N(2D) + O2 → NO + O 1.5× 10⁻¹¹· exp(−3600/T )
p+ is primary proton,e is secondary electron.
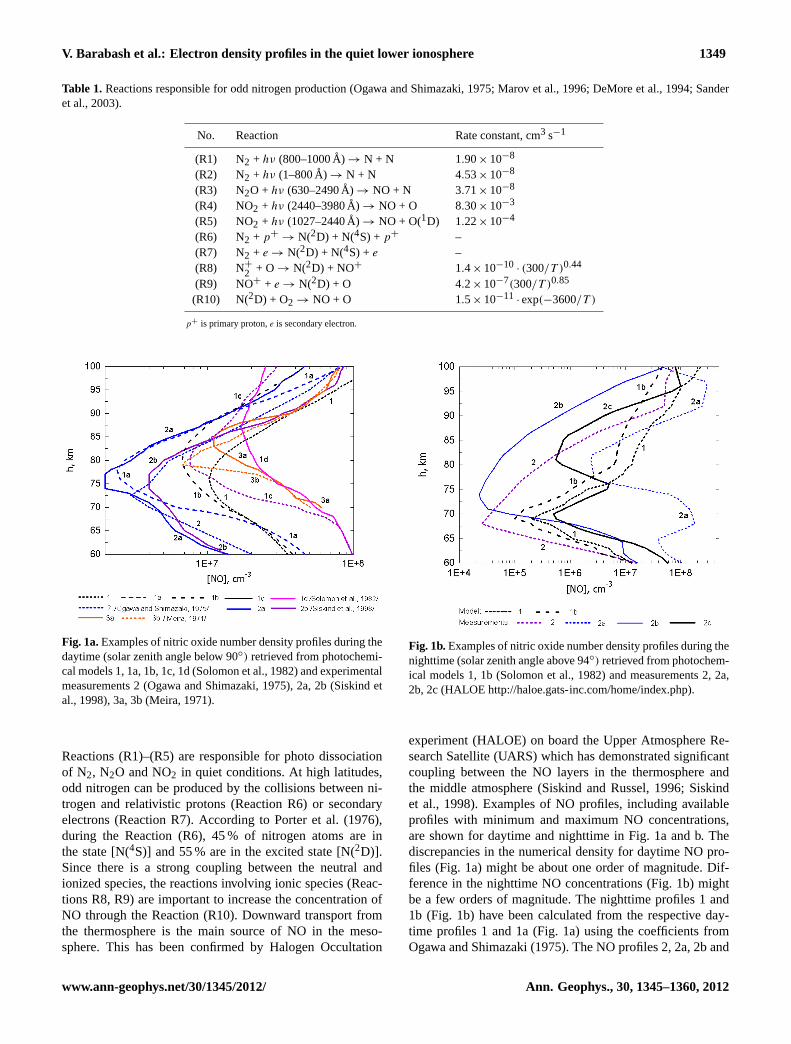
Fig. 1a.Examples of nitric oxide number density profiles during thedaytime (solar zenith angle below 90◦) retrieved from photochemi-cal models 1, 1a, 1b, 1c, 1d (Solomon et al., 1982) and experimentalmeasurements 2 (Ogawa and Shimazaki, 1975), 2a, 2b (Siskind etal., 1998), 3a, 3b (Meira, 1971).
Reactions (R1)–(R5) are responsible for photo dissociationof N2, N2O and NO2 in quiet conditions. At high latitudes,odd nitrogen can be produced by the collisions between ni-trogen and relativistic protons (Reaction R6) or secondaryelectrons (Reaction R7). According to Porter et al. (1976),during the Reaction (R6), 45 % of nitrogen atoms are inthe state [N(4S)] and 55 % are in the excited state [N(2D)].Since there is a strong coupling between the neutral andionized species, the reactions involving ionic species (Reac-tions R8, R9) are important to increase the concentration ofNO through the Reaction (R10). Downward transport fromthe thermosphere is the main source of NO in the meso-sphere. This has been confirmed by Halogen Occultation
Fig. 1b.Examples of nitric oxide number density profiles during thenighttime (solar zenith angle above 94◦) retrieved from photochem-ical models 1, 1b (Solomon et al., 1982) and measurements 2, 2a,2b, 2c (HALOEhttp://haloe.gats-inc.com/home/index.php).
experiment (HALOE) on board the Upper Atmosphere Re-search Satellite (UARS) which has demonstrated significantcoupling between the NO layers in the thermosphere andthe middle atmosphere (Siskind and Russel, 1996; Siskindet al., 1998). Examples of NO profiles, including availableprofiles with minimum and maximum NO concentrations,are shown for daytime and nighttime in Fig. 1a and b. Thediscrepancies in the numerical density for daytime NO pro-files (Fig. 1a) might be about one order of magnitude. Dif-ference in the nighttime NO concentrations (Fig. 1b) mightbe a few orders of magnitude. The nighttime profiles 1 and1b (Fig. 1b) have been calculated from the respective day-time profiles 1 and 1a (Fig. 1a) using the coefficients fromOgawa and Shimazaki (1975). The NO profiles 2, 2a, 2b and
www.ann-geophys.net/30/1345/2012/ Ann. Geophys., 30, 1345–1360, 2012

1350 V. Barabash et al.: Electron density profiles in the quiet lower ionosphere
Fig. 2a.Profiles of atomic oxygen and ozone in the sunlit and noc-turnal mesosphere (d – day; n – night).
2c have been obtained from the HALOE instrument (2011):(http://haloe.gats-inc.com/home/index.php). All profiles ofnitric oxide presented in Fig. 1a and b have been used asinputs for modeling the electron density profiles.
Modern knowledge on the height distribution of atomicoxygen in the quiet mesosphere, especially below 80 km, ismainly based on the results of the theoretical estimations de-rived from diffusion-photochemical models (Shimazaki andLaird, 1970, 1972; Turco and Sechrist, 1972; Keneshea etal., 1979; Zadorozhny, 1982; Brasseur and Offermann, 1986;Murray and Plane, 2005). The atomic oxygen is controlledby both photochemical and dynamical processes (turbulence,molecular and eddy diffusions, vertical and meridional trans-ports). During the daytime, concentrations of atomic oxygenat altitudes below 80 km are about 1010 cm−3. When the so-lar zenith angle exceeds 96◦, photochemical production ofatomic oxygen stops and its number density drops dramati-cally.
Ozone is continually formed and destroyed in the meso-sphere. Measurements (Zommerfields et al., 1989; Fussenet al., 2000; Kaufmann et al., 2003; Polyakov et al., 2005)and theoretical investigations (Shimazaki and Laird, 1970,1972; Thomas and Bowman, 1972; Zadorozhny, 1982; Ro-drigo et al., 1986; Sandor et al., 1997) show substantial diur-nal variations of ozone concentration with maximum valuesat nighttime. Theoretical values of ozone numerical densityare rather close to experimental values. It should be notedthat differences between maximum and minimum values ofozone, derived in different theoretical models for the sim-ilar conditions, are not as large as for NO and O concen-trations. During the nighttime, differences in theoretical es-timations of both atomic oxygen and ozone concentration
Fig. 2b. Profiles of water vapor number density (HALOEhttp://haloe.gats-inc.com/home/index.php). Curve w1 – for winter.Curves s1, s2 – for summer.
are more pronounced than during the daytime. Profiles ofatomic oxygen and ozone at local noon and midnight pre-sented in Fig. 2a are used as input parameters into the theo-retical model of the D-region. The O profiles 1 and 2 at al-titudes between 60 and 85 km are taken from the models byZadorozhny (1982) and Shimazaki and Laird (1972). The Oprofile above 85 km is taken from the MSIS-2000 neutral at-mosphere model. The O3-3 profiles are taken from the modelby Rodrigo et al. (1986). The profiles O-4 and O3-5 at alti-tudes above 70 km are taken from Gumbel et al. (1998). Theyhave been arbitrarily extrapolated downward to 60 km.
Water vapor profiles are taken from measurement by theHALOE instrument (Fig. 2b).
4 Results
To test the quality of the model and to determine which pro-files of minor neutral constituents are the most appropriatefor mesospheric altitudes under quiet conditions, simulatedelectron density profiles are compared with electron densi-ties obtained from rocket experiments in summer and winterfor solar zenith angles less than 80◦ (day) and larger than99◦ (night). Rocket data obtained by the Faraday rotationmethod in the Volgograd region (geographic coordinates are48.5◦ N, 45.6◦ E; geomagnetic latitude is 43.1◦ N) have beentaken from catalogues presented by Danilov and Ledomskya(1983), Smirnova et al. (1990).
Figure 3a shows electron density profiles in the altituderange between 70 and 90 km measured near Volgograd un-der similar geophysical conditions, i.e. solar zenith anglesof 30◦–52◦, low solar activity (F10.7 = 70–82), summertime.The electron density profile for the altitude interval between80 and 100 km at 37.8◦ N, geomagnetic latitude 49.3◦ N,
Ann. Geophys., 30, 1345–1360, 2012 www.ann-geophys.net/30/1345/2012/

V. Barabash et al.: Electron density profiles in the quiet lower ionosphere 1351
Fig. 3a.Electron number density profiles from rocket experiments(symbols) and the model (dashed and solid curves without sym-bols). Solar zenith angles for the rocket data 30.4◦–52◦. Modeledprofiles are calculated for 29 July 1976, solar zenith angle 44.6◦,F10.7 = 70.
solar zenith angleχ = 35◦, has been taken from Gintherand Smith (1975). Modeled electron density profiles havebeen calculated for 29 July 1976,χ = 44.6◦, F10.7 = 70at 48.5◦ N, 45.6◦ E using all profiles of the minor neutralspecies presented in Figs. 1a, 2a and b. Samples of theNe(h)-profiles calculated for O-1d, O3-3d (Fig. 2a), H2O-s1 (Fig. 2b), but for different nitric oxide profiles (1a, 1 and1d), are shown in Fig. 3a by the short dashed lines. It canbe seen that modeled values of electron density respond tochanges in the nitric oxide concentration only in the altitudeinterval between 68 and 85 km, since total ionization rate atthese altitudes is mainly due to ionization of NO moleculesby Ly-α emission (Fig. 3b). The difference between NO con-centration for profiles 1a and 1d (Fig. 1a) in the altitude range70–80 km can reach an order of magnitude. This leads tochanges of electron number density of 2.8–3.5 times. At alti-tudes above 85 km, ionization near noon is produced mainlyby other lines of the solar spectrum (Fig. 3b) and variationsof NO concentration by factors 3–5 does not change the mod-eled values of electron density.
In Fig. 3a the influence of water vapor and atomic oxygenconcentrations on the electron number density are shown. Adecrease of water vapor concentration, by more than a factorof 2 at all altitudes of the mesosphere (H2O-s1 and H2O-w1in Fig. 2b) leads to an increase of electron number densityonly in the height range between 73 and 85 km where thewater concentration changes by more than factor of 5. Aninfluence of atomic oxygen concentration (O-2d and O-4 inFig. 2a) on electron density is seen only at the altitudes be-
Fig. 3b. Profiles of the ionization rate of nitric oxide by Ly-α
emission (dashed lines) and total ionization rate (solid lines) for29 July 1976, solar zenith angle 44.6◦ on the basis of NO-1a, 1 and1d profiles.
Fig. 4. Electron density profiles measured at different solar zenithangles under low solar activityF10.7 = 67–85 (symbols). Ionizationrate (dashed lines) and electron number density (solid lines withoutsymbols) modeled for the same conditions on the basis of NO-1profile (Solomon et al., 1982).
low 70 km (red dashed lines). Above 70 km, both high (O-2dprofile) and very low (O-4 profile) values of oxygen com-pared to O-1d profile, don’t change electron number densityat daytime. Changes of ozone concentration, between the O3-3d profile and the O3-5 profile, do not influenceNe values ataltitudes above 70 km. Below 70 km, an increase of ozone by3–4 times leads to a decrease of electron number density byless than 1.3 times. The influence of ozone on electron den-sity is not shown in Fig. 3a. Comparing the summer mod-eled and experimental electron number densities, it can be
www.ann-geophys.net/30/1345/2012/ Ann. Geophys., 30, 1345–1360, 2012
1352 V. Barabash et al.: Electron density profiles in the quiet lower ionosphere
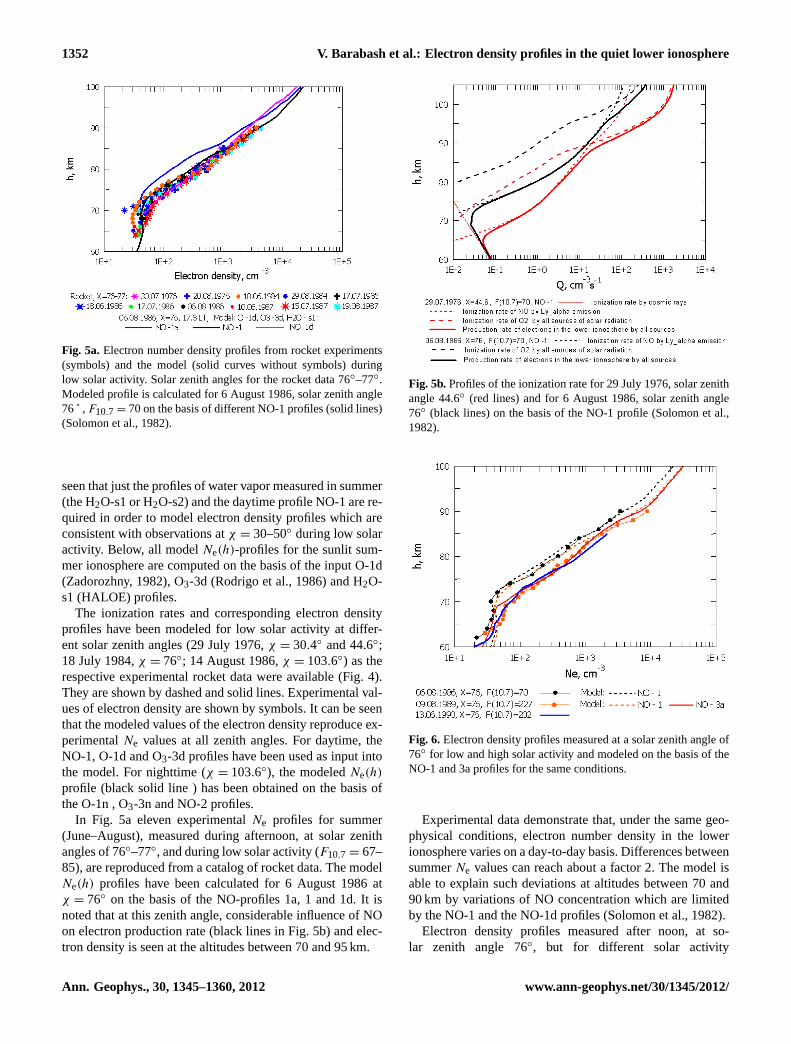
Fig. 5a.Electron number density profiles from rocket experiments(symbols) and the model (solid curves without symbols) duringlow solar activity. Solar zenith angles for the rocket data 76◦–77◦.Modeled profile is calculated for 6 August 1986, solar zenith angle76 ˚ ,F10.7 = 70 on the basis of different NO-1 profiles (solid lines)(Solomon et al., 1982).
seen that just the profiles of water vapor measured in summer(the H2O-s1 or H2O-s2) and the daytime profile NO-1 are re-quired in order to model electron density profiles which areconsistent with observations atχ = 30–50◦ during low solaractivity. Below, all modelNe(h)-profiles for the sunlit sum-mer ionosphere are computed on the basis of the input O-1d(Zadorozhny, 1982), O3-3d (Rodrigo et al., 1986) and H2O-s1 (HALOE) profiles.
The ionization rates and corresponding electron densityprofiles have been modeled for low solar activity at differ-ent solar zenith angles (29 July 1976,χ = 30.4◦ and 44.6◦;18 July 1984,χ = 76◦; 14 August 1986,χ = 103.6◦) as therespective experimental rocket data were available (Fig. 4).They are shown by dashed and solid lines. Experimental val-ues of electron density are shown by symbols. It can be seenthat the modeled values of the electron density reproduce ex-perimentalNe values at all zenith angles. For daytime, theNO-1, O-1d and O3-3d profiles have been used as input intothe model. For nighttime (χ = 103.6◦), the modeledNe(h)
profile (black solid line ) has been obtained on the basis ofthe O-1n , O3-3n and NO-2 profiles.
In Fig. 5a eleven experimentalNe profiles for summer(June–August), measured during afternoon, at solar zenithangles of 76◦–77◦, and during low solar activity (F10.7 = 67–85), are reproduced from a catalog of rocket data. The modelNe(h) profiles have been calculated for 6 August 1986 atχ = 76◦ on the basis of the NO-profiles 1a, 1 and 1d. It isnoted that at this zenith angle, considerable influence of NOon electron production rate (black lines in Fig. 5b) and elec-tron density is seen at the altitudes between 70 and 95 km.
Fig. 5b.Profiles of the ionization rate for 29 July 1976, solar zenithangle 44.6◦ (red lines) and for 6 August 1986, solar zenith angle76◦ (black lines) on the basis of the NO-1 profile (Solomon et al.,1982).
Fig. 6. Electron density profiles measured at a solar zenith angle of76◦ for low and high solar activity and modeled on the basis of theNO-1 and 3a profiles for the same conditions.
Experimental data demonstrate that, under the same geo-physical conditions, electron number density in the lowerionosphere varies on a day-to-day basis. Differences betweensummerNe values can reach about a factor 2. The model isable to explain such deviations at altitudes between 70 and90 km by variations of NO concentration which are limitedby the NO-1 and the NO-1d profiles (Solomon et al., 1982).
Electron density profiles measured after noon, at so-lar zenith angle 76◦, but for different solar activity
Ann. Geophys., 30, 1345–1360, 2012 www.ann-geophys.net/30/1345/2012/
V. Barabash et al.: Electron density profiles in the quiet lower ionosphere 1353
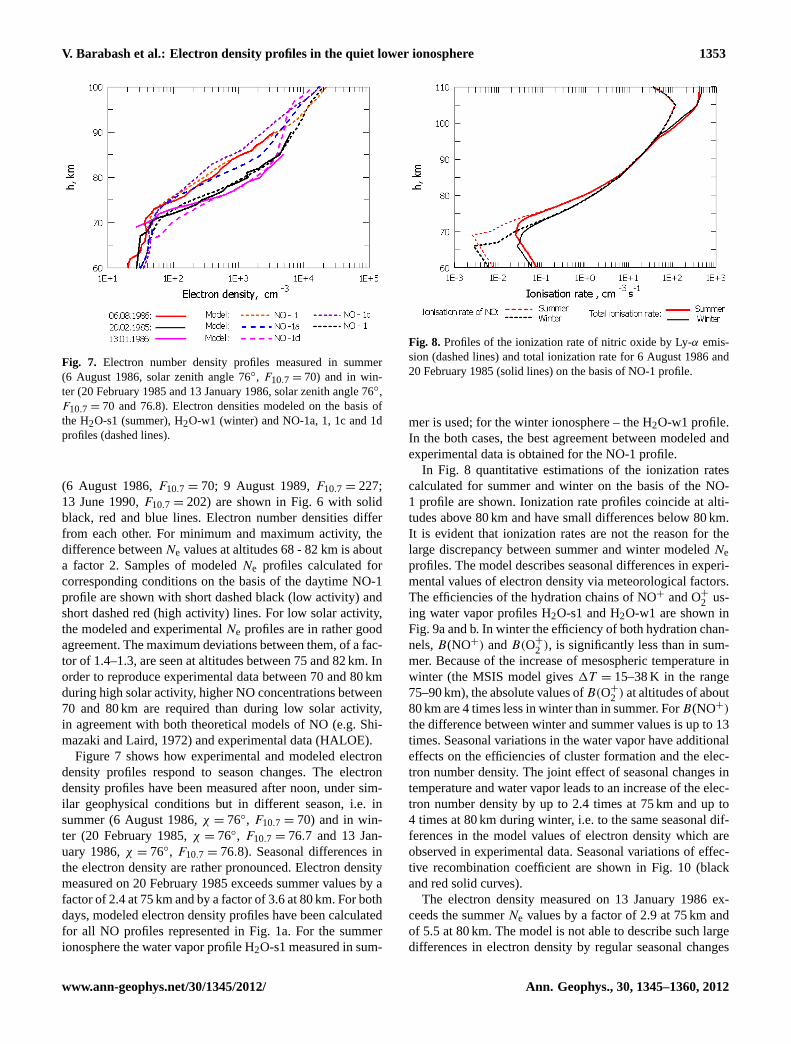
Fig. 7. Electron number density profiles measured in summer(6 August 1986, solar zenith angle 76◦, F10.7 = 70) and in win-ter (20 February 1985 and 13 January 1986, solar zenith angle 76◦,F10.7 = 70 and 76.8). Electron densities modeled on the basis ofthe H2O-s1 (summer), H2O-w1 (winter) and NO-1a, 1, 1c and 1dprofiles (dashed lines).
(6 August 1986,F10.7 = 70; 9 August 1989,F10.7 = 227;13 June 1990,F10.7 = 202) are shown in Fig. 6 with solidblack, red and blue lines. Electron number densities differfrom each other. For minimum and maximum activity, thedifference betweenNe values at altitudes 68 - 82 km is abouta factor 2. Samples of modeledNe profiles calculated forcorresponding conditions on the basis of the daytime NO-1profile are shown with short dashed black (low activity) andshort dashed red (high activity) lines. For low solar activity,the modeled and experimentalNe profiles are in rather goodagreement. The maximum deviations between them, of a fac-tor of 1.4–1.3, are seen at altitudes between 75 and 82 km. Inorder to reproduce experimental data between 70 and 80 kmduring high solar activity, higher NO concentrations between70 and 80 km are required than during low solar activity,in agreement with both theoretical models of NO (e.g. Shi-mazaki and Laird, 1972) and experimental data (HALOE).
Figure 7 shows how experimental and modeled electrondensity profiles respond to season changes. The electrondensity profiles have been measured after noon, under sim-ilar geophysical conditions but in different season, i.e. insummer (6 August 1986,χ = 76◦, F10.7 = 70) and in win-ter (20 February 1985,χ = 76◦, F10.7 = 76.7 and 13 Jan-uary 1986,χ = 76◦, F10.7 = 76.8). Seasonal differences inthe electron density are rather pronounced. Electron densitymeasured on 20 February 1985 exceeds summer values by afactor of 2.4 at 75 km and by a factor of 3.6 at 80 km. For bothdays, modeled electron density profiles have been calculatedfor all NO profiles represented in Fig. 1a. For the summerionosphere the water vapor profile H2O-s1 measured in sum-
Fig. 8. Profiles of the ionization rate of nitric oxide by Ly-α emis-sion (dashed lines) and total ionization rate for 6 August 1986 and20 February 1985 (solid lines) on the basis of NO-1 profile.
mer is used; for the winter ionosphere – the H2O-w1 profile.In the both cases, the best agreement between modeled andexperimental data is obtained for the NO-1 profile.
In Fig. 8 quantitative estimations of the ionization ratescalculated for summer and winter on the basis of the NO-1 profile are shown. Ionization rate profiles coincide at alti-tudes above 80 km and have small differences below 80 km.It is evident that ionization rates are not the reason for thelarge discrepancy between summer and winter modeledNeprofiles. The model describes seasonal differences in experi-mental values of electron density via meteorological factors.The efficiencies of the hydration chains of NO+ and O+
2 us-ing water vapor profiles H2O-s1 and H2O-w1 are shown inFig. 9a and b. In winter the efficiency of both hydration chan-nels,B(NO+) andB(O+
2 ), is significantly less than in sum-mer. Because of the increase of mesospheric temperature inwinter (the MSIS model gives1T = 15–38 K in the range75–90 km), the absolute values ofB(O+
2 ) at altitudes of about80 km are 4 times less in winter than in summer. ForB(NO+)
the difference between winter and summer values is up to 13times. Seasonal variations in the water vapor have additionaleffects on the efficiencies of cluster formation and the elec-tron number density. The joint effect of seasonal changes intemperature and water vapor leads to an increase of the elec-tron number density by up to 2.4 times at 75 km and up to4 times at 80 km during winter, i.e. to the same seasonal dif-ferences in the model values of electron density which areobserved in experimental data. Seasonal variations of effec-tive recombination coefficient are shown in Fig. 10 (blackand red solid curves).
The electron density measured on 13 January 1986 ex-ceeds the summerNe values by a factor of 2.9 at 75 km andof 5.5 at 80 km. The model is not able to describe such largedifferences in electron density by regular seasonal changes
www.ann-geophys.net/30/1345/2012/ Ann. Geophys., 30, 1345–1360, 2012

1354 V. Barabash et al.: Electron density profiles in the quiet lower ionosphere
Fig. 9a.Efficiency of the hydration chain of NO+ in summer (redline) and winter (black solid and dashed lines). Calculations aremade on the basis of NO-1 profile.
Fig. 9b. Efficiency of the hydration chain of O+2 in summer (redsolid line) and winter (black lines).
of the water vapor concentration and the neutral atmospheretemperature. In such cases higher concentrations of nitricoxide are required in order to produce additional electrondensity.
Figure 11 demonstrates variability in electron number den-sity from day to day in the winter ionosphere. It is muchmore pronounced than in summer (Fig. 5a). The model cal-culations show that it might be caused by variations of NOconcentration (3 solid curves in Fig. 11). It should be notedthat, in winter, the required concentrations of NO lie insidea wider range of values, between the NO profiles 1a and1d, compared to summer NO concentrations. On the otherhand, it is known that, apart from regular seasonal changes ofthe neutral atmosphere temperature, the mesosphere is also
Fig. 10. Height profiles of the effective recombination coefficientcalculated for summer, 6 August 1986 (red lines), and for winter,20 February 1985 (back lines), at solar zenith angles 76◦ (solidlines) and larger than 100◦ (dashed lines).
Fig. 11.Electron number density profiles measured in winter at so-lar zenith angles 76–77◦, F10.7 = 67–85 (dashed lines). Electrondensity profiles modeled for 20 February 1985 on the basis of theNO-1a, 1 and 1d profiles (solid lines).
characterized by temperature variations during each season,due to gravity and planetary waves, atmospheric tides andother factors (Hauchecorne et al., 1987; Aikin et al., 1991;Yu et al., 1997; States and Gardner, 1998; Shepherd et al.,2001). Significant (up to±30 K) and irregular temperaturefluctuations are observed often especially in the winter meso-sphere (Theon et al., 1967; Shepherd et al., 2001). This phe-nomenon is known as the winter anomaly (Aikin et al., 1977;Offermann, 1979). They might also be responsible for large
Ann. Geophys., 30, 1345–1360, 2012 www.ann-geophys.net/30/1345/2012/

V. Barabash et al.: Electron density profiles in the quiet lower ionosphere 1355
variability of electron number density on winter days. Sinceindividual temperature profiles can significantly differ fromthe mean temperature profiles provided by the MSIS model,the role of each factor (NO or1T ) in formation ofNe pro-files in the daytime winter ionosphere can be understood onlyby detailed studies using real temperature profiles of the win-ter mesosphere. Influence of atomic oxygen concentrationon the electron number density in the winter ionosphere isshown by two dashed red lines.
Figure 12 shows electron density profiles measured in thewinter ionosphere at solar zenith angles in the range of 100–110◦ during low solar activity. Calculations of the modeledelectron density profiles have been made on 15 January 1986,(χ = 108◦, F10.7 = 77.7), using different night profiles ofatomic oxygen, ozone and nitric oxide. The modeled pro-file that is very close to the experimental values has beenobtained on the basis of the O-1n, O3-3n and NO-2 profiles.This modeledNe(h) profile and theNe(h) profile calculatedfor 14 August 1986 atχ = 103.6◦ (Fig. 4), have been used todetermine the effective recombination coefficients at night-time in the winter and summer ionosphere (black and reddashed curves in Fig. 10). It can be seen, that the model pro-vides strong dependence of effective recombination coeffi-cient on both season and solar zenith angle.
5 Discussion and conclusion
Modeled ionization rates and electron number density, basedon different profiles of minor neutral constituents (NO, H2O,O and O3), covering a broad range of values, have been pre-sented in this study. Correct estimation of the role of the ni-tric oxide concentration in formation of the electron densityprofile depends, first of all, on accurate calculations of theionization rate. In Fig. 5b the ionization rates provided bydifferent solar sources at zenith angles 44.6◦ and 76◦; more-over, cosmic rays are shown. The model calculations con-firm that NO molecules ionized by Ly-α emission are themajor source of electrons and positive ions in the quiet sunlitD-region. The height interval where the ionization rate pro-duced by Ly-α is dominant depends on both the NO con-centration (Fig. 3b) and solar zenith angle (Fig. 5b). Nearnoon (χ = 44.6◦), the contribution of the Ly-α emission tothe electron production rate is the largest between 68 and85 km. Calculations using a wide spectrum of NO concentra-tions as model input, from minimum (the NO-1a profile) tomaximum (the NO-profile 1d or 3a) values, demonstrate thatthe difference between the minimum and maximum valuesof the ionization rate at 68–85 km might be up to a factor 10(Fig. 3b). Differences between the maximum and minimumvalues in the electron number density caused by NO varia-tions are of the order of 2.8–3.5 times (Fig. 3a). When thesolar zenith angle increases (χ = 76◦) and the contributionof the Ly-α emission to the electron production rate becomessignificant over a wider height range (Fig. 5b), the influence
Fig. 12.Electron number density profiles measured in winter at so-lar zenith angles 100◦–110◦, F10.7 = 67–85 (lines with symbols).Electron density modeled for 15 January 1986 at solar zenith angle108◦, F10.7 = 77.7 (black solid line).
of NO concentration on electron number density extends to100 km (Fig. 5a).
It has been demonstrated that if water vapor concentrationat all altitudes of the mesosphere decreases by more than afactor 2, significant increase of electron number density takesplace only in the height interval between 73 and 85 km andthen only if the water concentration at these altitudes changesby more than a factor 5. In the sunlit ionosphere, influence ofatomic oxygen and ozone concentrations on electron densityis seen only at altitudes below 70 km. A change in the atomicoxygen concentration at 65 and 60 km by a factor of 10 leadsto changes in the electron density by a factor of 1.5 and 2.3,respectively. The effect of the change of ozone concentra-tion is less significant. The model describes this altitude-dependent response of electron density to changes of water,atomic oxygen and oxygen in the frame of the ion-chemicalmodel through the participation of these species in the ion-molecular reactions.
Comparison between experimental and model electrondensity profiles, calculated in each individual case under thesame conditions (date, time, latitude, longitude,χ , F10.7),demonstrates that the model is able to reproduce the elec-tron density profiles in the quiet summer and winter iono-sphere on the basis of NO profiles which are inside the rangeof available NO values. On summer days, during low so-lar activity, the profile NO-1 provides coincidence betweenmodel and experimental data for most of the cases consid-ered. In order to keep agreement between the modeled andmeasured electron density profiles during high solar activity(F10.7 = 200–220) the number density of nitric oxide below80 km should be higher than during low (F10.7 = 70) activity
www.ann-geophys.net/30/1345/2012/ Ann. Geophys., 30, 1345–1360, 2012

1356 V. Barabash et al.: Electron density profiles in the quiet lower ionosphere
by 3–4 times (Fig. 6). This corresponds to both statisticaldata on NO concentration in the upper mesosphere obtainedfrom the satellite measurements for different levels of thesolar activity and the conclusions deduced from diffusionphotochemical models. The model calculation shows that de-viations (by a factor 2) in experimental summerNe valuesat altitudes 70–90 km can be stipulated by changes of NOconcentration which are limited by the NO-1 and the NO-1dprofiles.
Large variability in experimental winterNe values can becaused both by strong variability of NO concentration andstrong fluctuations of the temperature in the winter meso-sphere. Available NO profiles (between the NO-1a and theNO-1d) might explain deviations in experimental values ofelectron density above 70 km (Fig. 11). On other hand, be-cause of the strong inverse dependence of the NO+ hydra-tion channel efficiency on temperature, frequent and largetemperature oscillations in the winter mesosphere might bealso responsible for observed deviations in electron density.The real temperature profiles can significantly differ fromthe MSIS profiles, especially in the region of the mesopause.Positive fluctuations of temperature decrease the cluster ionsformation rate and effective recombination coefficient, andthe electron density can increase by several times, dependingon the altitude, compared to an average winter day, and viceversa. In order to understand the role of each factor (NO or1T ) in formation of theNe profile, it is necessary to incorpo-rate the real temperature profiles into the model. In this casethe possibility appears to determine which height profiles ofnitric oxide are the most appropriate for the mesosphere onwinter days.
Due to realistic assumptions concerning the dependenceof the main cluster ions formation processes on temperature,the model is able to explain regular seasonal variations in theelectron number density and effective recombination coeffi-cient (Figs. 7 and 10) in terms of temperature and water vaporseasonal variations.
The theoretical model for quiet lower ionosphere has beenapplied to compute ionization rate and electron density pro-files in the summer and winter D-region. In order to mini-mize possible errors in estimation of ionization rates by solarelectromagnetic radiation and obtain the best values of elec-tron density, each wavelength range of the solar spectrum hasbeen divided into several intervals and the relation betweenthe solar radiation intensity at these wavelengths and the so-lar activity indexF10.7, deduced by Nusinov (1992), has beenimplemented. The lack of reliable data on the height distribu-tion of minor neutral constituents in the mesosphere is also aproblem for reasonable estimation of the ionospheric param-eters in the quiet ionosphere. In this study we have examinedthe influence of minor neutral species concentration on theionization balance at different altitudes of the D-region andthe response of the modeledNe(h) profiles to changes in so-lar zenith angle, solar activity and season. Calculations havebeen made at solar zenith angles less than 80◦ and more than
99◦, under steady state conditions. Modeled electron densityprofiles have been evaluated by comparison with experimen-tal profiles available from the rocket measurements made inVolgograd region (48.5◦ N, 45.6◦ E).
We have shown that our theoretical model for the quietlower ionosphere is quite effective in describing variations inionization rate, effective recombination coefficient and elec-tron number density as functions of solar zenith angle, solaractivity and season (forT and H2O). The profiles O-1d or O-2d, and O3-3d (Fig. 2a) can be used to model electron densityin the sunlit ionosphere. The profiles H2O-s1, s2, and H2O-w1 (Fig. 2b) are suitable for modeling in the summer andwinter ionosphere, respectively. The NO-1 profile (Solomonet al., 1982) gives the best values of electron density in thedaytime summer ionosphere during low solar activity and theNO profiles with higher NO concentrations give the best val-ues during high solar activity. For modeling in the daytimewinter ionosphere the range of applied NO profiles is ratherwide. The modeling of the ionospheric parameters on winterdays is less successful than for summer conditions.
The results presented in this study are based on a theoreti-cal model for the lower ionosphere which is relatively simplecompared to the models on a planetary scale which includeseveral hundred chemical reactions, dozens of ions, electro-dynamics of plasma, neutral constituents chemistry, plasmaand neutral wind dynamics, optics and etc. (Kull et al., 1997;Verronen et al., 2002; Kazil et al., 2003; Enell et al., 2011).The complex models are extremely important for detailed re-search of ionosphere and magnetosphere physics. Along withtheir undeniable merits, they have also intrinsic limitations.First of all, the limitations may be associated with inadequa-cies in the reaction rate constants and the uncertainties ofsome chemical reaction paths included in the detailed ion andneutral chemical schemes. One of the goals for constructionof the “simple” models is to avoid such problems by meansof reasonable simplification of the ion-molecular processesscheme. In addition, the complete and simple models mayfulfill different tasks. For example, the simple model havingincorporated the appropriate minor neutral constituents pro-files (NO, O, O3, H2O, O2(11g), NO2, CO2) will allow moreaccurate modeling of electron and ion densities in a givengeophysical situation, without the need to apply completemodel calculations of all neutral species. In addition, the sim-ple model may be applied to solve the inverse tasks. It mayprovide the kernel for spectra recovering methods and tech-niques, for example, deducing flux-energy spectrum of elec-trons precipitating into the polar ionosphere from ground-based or rocket measurements of electron density profile (Os-epian and Kirkwood, 1996; Osepian and Smirnova, 1997).The model can be used for estimations of minor neutralspecies concentration in the mesosphere under quiet or dis-turbed conditions on basis of available experimental electrondensity profiles. This type of model can provide the quickinformation needed for calculation and forecasting of radiowaves propagation in a wide range of frequencies in various
Ann. Geophys., 30, 1345–1360, 2012 www.ann-geophys.net/30/1345/2012/

V. Barabash et al.: Electron density profiles in the quiet lower ionosphere 1357
Table A1. Rate constants for the positive ion reactions, cm3 s−1 (Smirnova et al., 1988).
r1 1.8× 10−28· (300/T )4.7 K2 3.0× 10⁻¹⁰
r2 2.0× 10−31· (300/T )4.4 K3 1.0× 10⁻¹⁰
r−2 1.5× 10⁶· T
−5.4· exp(−2450/T ) K4 2.2× 10⁻⁹
r3 1.0× 10⁻⁹ k5 4.4× 10⁻¹⁰
r4 1.0× 10⁻⁹ k6 1.0× 10⁻¹⁷
r5 7.0× 10−30· (300/T )3 ν1 8.0× 10−31
· (300/T )4.4
r−5 3.1× 10⁴· T
−4· exp(−4590/T ) α(O+
2 ) 2.0× 10−7· (300/T )
r6 1.0× 10⁻⁹ α(NO+) 4.0× 10−7· (300/T )
r7 1.0× 10−27· (300/T )4.4 α(Cl+1 ) 2.0× 10⁻⁶
K1 2.4× 10−30· (300/T )3.2 α(Cl+2 ) 1.0× 10⁻⁵
K−1 1.8× 10−5· (300/T )4.2
· exp(−5600/T )
Table A2. Rate constants for the negative ion reactions, cm3 s−1
(Smirnova et al., 1988).
β1 1.4× 10−29· (300/T )·exp(−600/T ) β12 4.0× 10−31
· (300/T )5
β2 1.0× 10⁻³¹ β13 2.0× 10−29· (300/T )5
β3 1.5× 10⁻¹⁰ β14 6.0× 10⁻¹⁰
β4 2.0 · 10−10 β15 9.0× 10−31· (300/T )5
β5 9.1× 10−12· (300/T )−1.46 β16 3.1× 10−28
· (300/T )5
β6 1.9× 10⁻¹⁰ β17 5.3× 10⁻¹⁰
β7 2.0× 10⁻¹⁰ ρ1 0.33β8 1.1× 10⁻¹⁰ ρ2 1.4β9 0.15 ρ3 1.5× 10⁻³
β10 1.1× 10⁻¹¹ αi 6.8 · T −0.4
β11 2.0× 10⁻¹⁰
geophysical conditions, i.e. they can be used for any certainpractical purpose.
Appendix A
Ion chemistry model
A block diagram of the ion-chemical model of the D-regionis illustrated by Smirnova et al. (1988) in Fig. 1. Equationsfor computing reaction rates for positive and negative ionsare given below:
d[O+
2 ]/dt = Q(O+
2 )−(k5[NO] + k6[N2] +B(O+
2 )
+α(O+
2 ) · Ne+ αi · N−) · [O+
2 ]
d[NO+]/dt = Q(NO+) + (k5[NO] + k6[N2]) · [O+
2 ]
−(B(NO+) + α(NO+) · Ne+ αi · N−) · [NO+]
d[Cl+1 ]/dt = B(O+
2 ) · [O+
2 ] +B(NO+) · [NO+]−(r7[H2O][N2]
+α(Cl+1 ) · Ne + αi · N−) · [Cl+1 ]
d[Cl+2 ]/dt=r7[H2O][N2][Cl+1 ]−(α(Cl+2 ) · Ne+ αi · N−) · [Cl+2 ]
d[O−
2 ]/dt = (β1[O2]2+ β2[O2][N2]) · Ne+ β8[O][CO−
3 ]
−(B(O−
2 ) + 2β3[O] +β4[O2(11g)]
+ρ1 + αi · N+) · [O−
2 ]
d[O−]/dt = β5[O3] · Ne+ β3[O][O−
2 ] +β9[CO−
3 ]−(β6[O]
+β7[O2(11g)] + ρ2 + B(O−) + αi · N+) · [O−
]
d[CO−
3 ]/dt = B(O−
2 ) · [O−
2 ] +B(O−) · [O−]−(β8[O] +β9
+β10[NO] +β11[NO2] +αi · N+) · [CO−
3 ]
d[NO−
3 ]/dt = (β10[NO] +β11[NO2]) · [CO−
3 ]
−(ρ3 + αi · N+) · [NO−
3 ]
The efficiencyB(NO+) of the channel NO+ → NO+·(H2O)
is given by the following expression:
B(NO+) = [H2O]
(r1[N2] +
r2[N2]2r4
c+
r6
r6[H2O]r−5[N2](r5[CP2][N2] +
r2[N2]2r5[CO2]
c
))(A1)
wherec = r−2[N2]+ r3[CO2]+ r4[H2O]. Reaction rate con-stantsr1, r2, r−2, r5 andr−5 depend on temperature and aregiven in Table A1.
The efficiencyB(O2+) of the channel O+2 → O+
2 ·(H2O) is
B(O+
2 )=K1[O2]
2+ ν1[N2]
2
K2[O]+K3[O2(11g)]+K−1[O2]
K4[H2O]+ 1
(A2)
whereK1, K−1, K2, K3, andK4 are the reaction rate con-stants given in Table A1. The constantsK1, K−1 andν1 de-pend on temperature.
Efficiencies of the channels O−2 → O−
3 , O−
4 , CO−
4 → CO−
3and O−
→ O−
3 → CO−
3 are given by the expressions:
B(O−
2 )=β12[O2]2+ β13[O2][CO2] +β14[O3] (A3)
www.ann-geophys.net/30/1345/2012/ Ann. Geophys., 30, 1345–1360, 2012

1358 V. Barabash et al.: Electron density profiles in the quiet lower ionosphere
B(O−)=β15[O2]2+ β16[O2][CO2] +β17[O3] (A4)
whereβ12−17 are rate constants given in Table A2.Proton hydrates H+·(H2O)n are formed from Cl+1 with rate
β according to
β = 10−27· (300/T )4.4
[H2O][N2][Cl+1 ] (A5)
Acknowledgements.The authors thank The Education, Audiovisualand Culture Executive Agency (EACEA) for support of this workwithin the frame of the Erasmus Mundus Master Course in SpaceScience and Technology – SpaceMaster, 2009–2013. The authorsthank M. Friedrich and the second referee for their valuable com-ments and suggestions.
Editor-in-chief M. Pinnock and Topical Editor P.-L. Blelly thankM. Friedrich and one anonymous referee for their help in evaluatingthis paper.
References
Aikin, A. C., Goldberg, R. A., Jones. W., and Kane, J. A.: Observa-tions of the mid-latitude lower ionosphere in winter, J. Geophys.Res., 82, 1869–1875, 1977.
Aikin, A. C., Chanin, M. L., Nash, J., and Kendig, D. J.: Temper-ature trends in the lower mesosphere, J. Geopys. Res. Lett., 18,416–419, 1991.
Brasseur, G. and Offermann, D.: Recombination of atomic oxygennear the mesopause: Interpretation of rocket data. J. Geophys.Res., 91, 10818–10824, 1986.
Danilov, A. D.: New ideas on the D-region modeling, Adv. SpaceRes., 25, 5–14, 2000.
Danilov, A. D. and Ledomskya, S. Y.: Empirical model for D region.Main principles and data base. Physics of the Upper Atmosphere,IEM. Ed 13(102), Moscow, 1983 (in Russian).
DeMore, W. B., Sander, S. P., Golden, D. M, Molina, M. J., Hamp-son, R. F., Kurolo, M.J, Howard, C. J., and Ravishankara, A.R.: Chemical kinetics and Photochemical Data for Use in Strato-spheric Modeling, JPL Publication 90-I, Jet Propulsion Labora-tory, California Institute of Technology, Pasadena, USA, 1994.
Enell, C.-F., Hedin, J., Stegman, J., Witt, G., Friedrich, M., Singer,W., Baumgarten, G., Kaifler, B., Hoppe, U.-P., Gustavsson, B.,Brandstrom, U., Khaplanov, M., Kero, A., Ulich, T., and Tu-runen, E.: The Hotel Payload 2 campaign: Overview of NO, Oand electron density measurements in the upper mesosphere andlower thermosphere, J. Atmos. Sol.-Terr. Phys., 73, 2228–2236,2011.
Friedrich, M. and Torkar, K. M.: An empirical model of the nonau-roral D-region, Radio Sci., 27, 945–953, 1992.
Friedrich, M. and Torkar, K. M.: Comparison between an empiricaland a theoretical model of the D-region, Adv. Space Res., 21,895–904, 1998.
Friedrich, M. and Torkar, K. M.: FIRI: A semi-empirical modelof the lower ionosphere., J. Geophys. Res., 106, 21409–21418,2001.
Fussen, D., Vanhellemont, F., and Bingen, C.: Ozone profiles from30 to 110 km measured by the Occultation Radiometer instru-ment during the period Aug. 1992–Apr. 1993. Geophys. Res.Lett., 27, 3449–3452, 2000.
Ginther, J. C. and Smith, L. G.: Studies of the differential absorp-tion. Rocket experiment, Aeronomy Report, 64, Aeron. Lab.,1975.
Grossmann, K. U., Frings, W. G., Offermann, D., Andre, L., Kopp,E., and Krankowsky, D.: Concentrations of H2O and NO in themesosphere and lower thermosphere at high latitudes, J. Atmos.Terr. Phys., 47, 1–3, 291–300, 1985.
Gumbel, J., Murtagh, D. P., Espy, P. J., Witt, G., and Schmidlin,F. J.: Odd oxygen measurements during the Noctilucent Cloud93 rocket campaing, J. Geophys. Res-Space Phys., 103, 23399–23414, 1998.
HALOE instrument: http://haloe.gats-inc.com/home/index.php,2011.
Hauchecorne, A., Shanin, M. L., and Wilson, R.: Mesosphere tem-perature inversion and gravity wave breaking, Geophys. Res.Lett., 14, 933–936, 1987.
Hedin, A. E.: Extension of the MSIS thermospheric model into themiddle and lower atmosphere, J. Geophys. Res., 96, 1159–1172,1991.
Ivanov-Kholodniy, G. S. and Velichanskiy, V. N.: Research in geo-magnetism, aeronomy and solar physics, 26, ed. Nauka, Moscow,1973 (in Russian).
Kashirin, A. I.: Photoionization in the nighttime ionosphere, Geo-magn. Aeronomy, 26, 563–568, 1986 (in Russian).
Kaufmann, M., Gusev, O. A., Grossmann, K. U., Martin-Torres, F. J., March, D. R., and Kutepov, A. A.: Satelliteobservations of daytime and nighttime ozone in the meso-sphere and lower thermosphere, J. Geophys. Res., 108, 4272,doi:10.1029/2002JD002800, 2003.
Kazil, J., Kopp, E., Chabrillat, S., and Bishop, J.: The Universityof Bern Atmospheric Ion Model: Time dependent modeling ofthe ions in the mesosphere and lower thermosphere, J. Geophys.Res., 18, 4432,doi:10.1029/2002JD003024, 2003.
Keneshea, T. J., Zummermann, S. P., and Philbrick, C. R.: A dynam-ical model of the mesosphere and lower thermosphere, Planet.Space Sci., 27, 385–401, 1979.
Kirkwood, S.: SPECTRUM – a computer algorithm to derive theflux-energy spectrum of precipitating particles from EISCATelectron density profiles., IRF Tech. Rep. 034, Swedish Instituteof Space Physics, 1988.
Kirkwood, S. and Osepian, A.: Quantitative studies of energeticparticle precipitation using incoherent scatter radar, J. Geomag.Geoelectr., 47, 783–799, 1995.
Kull, A., Kopp, E., Granier, C., and Brasseur, G.: Ions and electronsof the lower-latitude D-region, J. Geophys. Res., 102, 9705–9716, 1997.
Marov, M. Y., Shematovich, V. I., and Bisicalo, D. V.: Non-equilibrium aeronomic processes – a kinetic approach to themathematical modeling, Space Sci. Rev., 76, 1–204, 1996.
McKinnell, L. A. and Friedrich, M.: A neutral network based iono-spheric model for the auroral zone, J. Atmos. Solar Terr. Phys.,69, 1459–1470, 2007.
Meira, L. G.: Rocket measurements of upper atmospheric nitric ox-ide and their consequences to the lower ionosphere, J. Geophys.Res., 76, 202–212, 1971.
Ann. Geophys., 30, 1345–1360, 2012 www.ann-geophys.net/30/1345/2012/

V. Barabash et al.: Electron density profiles in the quiet lower ionosphere 1359
Murray, B. J. and Plane, J. M. C.: Modelling the impact of noctilu-cent cloud formation on atomic oxygen and other minor con-stituents of the summer mesosphere, Atmos. Chem. Phys., 5,1027–1038,doi:10.5194/acp-5-1027-2005, 2005.
Nicolet, M. and Aikin, A. C.: The formation D-region of the iono-sphere, J. Geophys. Res., 65, 1469–1483, 1960.
Nusinov, A. A.: Solar X-ray spectrum 0.1–10 nm at different activ-ity levels, Solar Data, 7, 57–58, 1986.
Nusinov, A. A.: Models for prediction of EUV- and X-ray solarradiation based on 10.7 cm radio emission, Proceedings of theWorkshop on the Solar Electromagnetic Radiation Study for So-lar Cycle 22, Boulder, Colorado, 354–359, 1992.
Offermann, D.: Recent advances in the study of the D-region winteranomaly, J. Atmos. Terr. Phys., 41, 735–752, 1979.
Ogawa, T. and Shimazaki, T.: Diurnal variations of odd nitrogenand ionic densities in the mesosphere and lower thermosphere:simultaneous solution of photochemical-diffusive equations, J.Geophys. Res., 80, 3945–3960, 1975.
Osepian, A. and Kirkwood, S.: High-energy electron fluxes derivedfrom EISCAT electron density profiles, J. Atmos. Terr. Phys., 58,479–487, 1996.
Osepian, A. and Smirnova, N.: Modeling of absorption layer duringabsorption events, J. Atmos. Sol. Terr. Phys., 59, 951–960, 1997.
Osepian, A., Tereschenko, V., Dalin, P., and Kirkwood, S.: The roleof atomic oxygen concentration in the ionization balance of thelower ionosphere during solar proton events, Ann. Geophys., 26,131–143,doi:10.5194/angeo-26-131-2008, 2008.
Osepian, A., Kirkwood, S., and Dalin, P.: The influence of ozoneconcentration on the lower ionosphere – modelling and measure-ments during the 29–30 October 2003 solar proton event, Ann.Geophys., 27, 577–589,doi:10.5194/angeo-27-577-2009, 2009a.
Osepian, A., Kirkwood, S., Dalin, P., and Tereschenko, V.: D-regionelectron density and effective recombination coefficients duringtwilight – experimental data and modelling during solar protonevents, Ann. Geophys., 27, 3713–3724,doi:10.5194/angeo-27-3713-2009, 2009b.
Paulsen, D. E., Huffman, R. E., and Larrabee, J. C: Improved pho-toionization rates of O2(11g)., Radio Sci., 7, 51–55, 1972.
Picone, J. M., Hedin, A. E., Drob, D. P., and Aikin, A. C.:NRLMSISE-00 empirical model of the atmosphere: Statisticalcomparisons and scientific issues, J. Geophys. Res., 107, 1468,doi:10.1029/2002JA009430, 2002.
Polyakov, A. V., Timofeyev, Y. M., Ionov, D. V., Virolainen, Y. A.,Steele, H. M., and Newchuch, M. J.: Retrieval of ozone and nitro-gen dioxide concentrations from Stratospheric Aerosol and GasExperiment III (SAGE III) measurements using a new algorithm,J. Geophys. Res., 110, D06303,doi:10.1029/2004JD005060,2005.
Porter, H. S., Jackman, C. H., and Green, A. E. S.: Efficiencies forproduction of atomic nitrogen and oxygen by relativistic protonimpact in air, J. Chem. Phys., 65, 154–165, 1976.
Rees, M. H.: Physics and chemistry of the upper atmosphere, Cam-bridge University Press, Cambridge, UK, 1989.
Rodrigo, R., Lopez-Moreno, J., Lopez-Puertas, M., Moreno, F.,and Molina, A.: Neutral atmospheric composition between 60and 220 km: A theoretical model for mid-latitudes, Planet. SpaceSci., 34, 723–743, 1986.
Sander, S. P., Golden, D. M., Kurylo, M. J., Moortgat, G. K., Rav-ishankara, A. R., Kolb, C. E., Molina, M. J., and Finlayson-Pitts,
B. J.: Chemical kinetics and photochemical data for use in at-mospheric studies, Evaluation Number 14, JPL Publication 02-25, Jet Propulsion Laboratory, California Institute of Technology,Pasadena, USA, 2003.
Sandor, B. J., Clancy, R. T., Rusch, D. W., Randal, C. E., Eckman,R. S., Siskind, S., and Muchleman, D. O.: Microwave observa-tions and modeling of O2(112) and O3 diurnal variation in themesosphere, J. Geophys. Res., 102, 9013–9028, 1997.
Shepherd, M. G., Reid, B., Zhang, S., Solheim, B., Shepherd, G.G., Wickwar, V. B., and Herron, J. P.: Retrieval and validationof mesospheric temperatures from Wind Imaging Interferometerobservation, J. Geophys. Res., 106, 24813–24829, 2001.
Shimazaki, T. and Laird, A.: A model calculation of the diurnal vari-ation in minor neutral constituents in the mesosphere and lowerthermosphere including transport effects, J. Geophys. Res., 75,3221–3235, 1970.
Shimazaki, T. and Laird, A.: Seasonal effect on distributions of mi-nor constituents in the mesosphere and lower thermosphere, Ra-dio Sci., 1, 23–43, 1972.
Siskind, D. E. and Rusch, D. W.: Nitric oxide in the middle to upperthermosphere, J. Geophys. Res., 97, 3209–3217, 1992.
Siskind, D. E. and Russel, J. M.: Coupling between middle and up-per atmospheric NO: constrains from HALOE observations, J.Geophys. Res. Lett., 23, 137–140, 1996.
Siskind, D. E., Bacmeister, J. T., Summers, M. E., and Russel, J. M.:Two-dimensional model calculations of nitric oxide transport inthe middle atmosphere and comparison with Halogen Occulta-tion Experiment data, J. Geophys. Res., 102, 3527–3545, 1997.
Siskind, D. E., Barth, C. A., and Russel, J. M.: A climatology of ni-tric oxide in the mesosphere and thermosphere, Adv. Space Res.,21, 1353–1362, 1998.
Smirnova, N. V., Ogloblina, O. F., and Vlaskov, V. A.: Modelling ofthe lower ionosphere, Pageoph., 127, 353–379, 1988.
Smirnova, N. V., Ogloblina, O. F., Vlaskov,, V. A., and Semyachk-ina, T. N.: Catalogue of the electron number density of the Dregion. Preprint PGI – 90 -04 – 72, Academy of Sciences USSR,1990 (in Russian).
Smith, F. L. and Smith, C.: Numerical evaluation of Chapman’sgrazing incidence integral, J. Geophys. Res., 77, 3592–3597,1972.
Solomon, S., Reid, G. C., Roble, R. G., and Crutzen, P. J.: Photo-chemical coupling between the thermosphere and the lower at-mosphere, 2. D region ion chemistry and the winter anomaly, J.Geophys. Res., 87, 7221–7227, 1982.
States, R. J. and Gardner, C. S.: Influence of the diurnal tide andthermospheric heat sources on the formation of mesospheric tem-perature inversion layers, Geophys. Res. Lett., 25, 1483–1486,1998.
Swider, W.: Ion production in the D-region, Solar Terrestrial Predic-tions Proceedings, Working Group Rep. and Rev., Boulder V.2,599–616, 1979.
Theon, J. S., Nordberg, W., Katchen, L. B., and Horvath, J. J.: Someobservations of the thermal behavior of the mesosphere, J. At-mos. Sci., 24, 428–438, 1967.
Thomas, L. and Bowman, M. R.: The diurnal variations of hydro-gen and oxygen constituents in the mesosphere and lower ther-mosphere, J. Atmos. Terr. Phys., 34, 1843–1858, 1972.
Torr, M. R., Torr, D. G., Ong, R. A., and Hinteregger, H. E.: Ioniza-tion frequencies for major thermospheric constituents as a func-
www.ann-geophys.net/30/1345/2012/ Ann. Geophys., 30, 1345–1360, 2012

1360 V. Barabash et al.: Electron density profiles in the quiet lower ionosphere
tion of solar cycle 21, Geophys. Res. Lett., 6, 771–774, 1979.Turco, R. P. and Sechrist, C. F.: An investigation of the ionospheric
D-region at sunrise. 1. Time variations of ozone, metastablemolecular oxygen and atomic oxygen, Radio Sci., 7, 703–716,1972.
Verronen, P. T., Turunen, E., Ulich, Th., and Kyrola, E.: Modellingthe effects of the October 1989 solar proton event on meso-spheric odd nitrogen using a detailed ion and neutral chemistrymodel, Ann. Geophys., 20, 1967–1976,doi:10.5194/angeo-20-1967-2002, 2002.
Yu, J., States, R., Franke, S. J., Gardner, C. S., and Hagan, M.:Observations of tidal temperature and wind perturbations in themesopause region above Urbana, IL (40◦ N, 88◦ W). Geophys.Res. Lett., 24, 1207–1210, 1997.
Zadorozhny, A. M.: Diffusion-photochemical model of minor neu-tral constituents in the lower ionosphere, edited by: Academy ofScience of USSR, Novosibirsk, 1982 (in Russian).
Zommerfields, W. C., Kinzni, K. F., Summers, M. E., Bevilacqua,R. M., Strobel, D. F., Allen, M., and Sawchuck, W. J.: Diurnalvariations of mesospheric ozone obtained by ground-based mi-crowave radiometry, J. Geophys. Res., 94, 12819–12832, 1989.
Ann. Geophys., 30, 1345–1360, 2012 www.ann-geophys.net/30/1345/2012/