Embed Size (px)
Citation preview

The 2012 World Congress on Advances in Civil, Environmental, and Materials Research (ACEM’ 12)Seoul, Korea, August 26-30, 2012
Electrokinetic Characterization of Particle Deposits from Coupled Streaming Potential and Permeate Flux Measurements
During Dead-End Filtration
Y. Lanteri1), W. Ballout2), *P. Fievet2), S. Déon2), A. Szymczyk3), P. Sauvade4)
1) Institut Européen des Membranes, 34095 Montpellier cedex 5, France.
2) Institut UTINAM, Université de Franche-Comté, 25030 Besançon cedex, France. 3) Université de Rennes 1, Institut des Sciences Chimiques de Rennes, 35042 France.
4) Degremont Technologie - AQUASOURCE, 31029 Toulouse, France. [email protected]
ABSTRACT The present study is devoted to the validation of a new method for in line electrokinetic characterisation of deposits on membrane surfaces. This method is based upon simultaneous measurements of transversal streaming potential and permeate flux at constant pressure before and during the deposit formation. Dead-end filtration experiments were conducted with negative flat membranes forming a narrow slit channel, negative hollow fiber membranes and mono-dispersed suspensions of (negatively charged) polystyrene latex and (positively charged) melamine particles at various concentrations. It was observed that the overall streaming potential coefficient increased in absolute value with the deposited latex quantity, whereas it decreased and changed of sign during the filtration of melamine suspensions. By considering a resistance-in-series model, the streaming potential coefficient of the single deposit (SPd) was deduced from the electrokinetic and hydraulic measurements. The independence of SPd with respect to growth kinetics validates the measurement method and the reliability of the proposed procedure for calculating SPd. It was found that SPd levelled off much more quickly when filtration was performed through the slit channel. This different behaviour could result from a non-uniform distribution of the deposit thickness along the membrane given that the position of measuring electrodes is different between the two cells. 1. INTRODUCTION Micro- and ultrafiltration membrane processes are widely used to filter complex fluids (such as wastewaters or surface waters) containing micro-organisms, colloidal and/or dissolved species. However, membrane fouling, especially fouling by the deposition of suspended materials during filtration is always posing a main obstacle for wider application of these processes. When the foulants are much larger than that the membrane pores themselves, they tend to form a cake layer on the external membrane surface, causing a permeate flux reduction. The magnitude of the flux decline depends

on both structure (thickness, porosity…) and surface (surface charge density) properties of fouling layers, the later having also an impact on their growth and morphological properties and thus, on their transport properties (permeate flux and solute rejection). Different methods are available to determine the surface electric properties of porous media. Among them, streaming potential measurement has become, thanks to its experimental simplicity, the most widely used method for characterising the electrokinetic charge of the clean and fouled membranes. Streaming potential arises when there is a relative motion between the fluid containing charged species and charged surface caused by a hydrostatic pressure gradient (Hunter 1981). This parameter is believed to be correlated with the interactions between the membrane surface and various charged foulants. Studies dedicated to the characterization of fouled membranes by streaming potential are scare and can be divided into two categories: ex-situ studies for which the steaming potential of the virgin membrane and fouled membrane are measured before and after fouling, and in-situ studies for which the streaming potential is monitored during fouling. The latter are obviously more favourable because they provide dynamic information on electrokinetic behaviour during membrane fouling. Le Bolay and Ricard (Le Bolay 1995) studied time evolution of transversal streaming potential coefficient (streaming potential-to-applied pressure ratio) during filtration of an albumin suspension on acrylate MF membrane. For a pH around 5.2, they observed two different variations of the streaming potential coefficient time evolution, which were linked to the flux decline trends and to a possible change of fouling mechanisms. However, no relation between time behaviour of streaming potential coefficient and fouling layer properties was proposed. More recently, Chun et al (2002 and 2004) and Sung et al (2003) investigated time evolution of transversal streaming potential during dead-end and cross-flow filtration of colloids or proteins. In the case of membranes and latex colloids, which have the same charge sign, these authors found that absolute values of the streaming potential coefficient tend to decrease with the progress of filtration in dead-end mode whereas an opposite trend was observed in a cross-flow mode. The decreasing behaviour was attributed to the reduction of the electrokinetic flow through the pores due to the development of the cake layer. According to the authors, the cross-flow characteristic would allow the particles to stay mainly in a suspended state above the outer surface of the membrane, forming a concentration polarisation layer, rather than being deposited onto the surface (Chun 2002 and 2004). As a result, the streaming potential coefficient would increase during the filtration because of the increasing effect of the concentration gradient. Irrespective of the filtration mode, it was also shown that both the cake layer thickness and particle concentration inside the cake increased with the increasing particle concentration of the suspension. In another study, the authors studied the behaviour of the streaming potential during the filtration of bovine serum albumin (BSA) solution under different surface charge conditions in crossflow filtration (Sung 2003). The time evolution of the streaming potential coefficient for opposite charge conditions (positively charged membrane and negatively charged latex) showed a reversal of charge sign resulting from BSA deposition onto the outer surface of the membrane. For the same charge sign conditions, the streaming potential coefficient was considerably increased with the

filtration progress. As previously, this behaviour was explained by the development of a concentration polarisation layer during the cross-flow filtration. It should be noted that in all these works, the streaming potential was measured by applying discrete pressure steps during the filtration at a given transmembrane pressure, with the system allowed to equilibrate at each pressure step. However, no information is given about the impact of transmembrane pressure steps on fouling layer properties. It should be noted that in most practical situations, the filtration of fluids containing particles or proteins leads to compressible deposits (Chloe 1986, Gourgues 1992, Murase 1995, Hamachi 1986, Mendret 2009). In such conditions, the application of overpressures might disturb the deposit formation (and thus, its structure properties) and influence the measurements themselves. Indeed, the compactness of the deposit might increase the conductivity of electrolyte inside deposit (due to a decrease in pore size) and thus, decrease the measured potential in the streaming potential experiments (Szymczyk 2002). As a result, the streaming potential coefficient would be dependent on the pressure difference. Very recently, Teychené et al (2011) developed a method that consists in measuring the transmembrane streaming potential at constant pressure during the cake layer build-up. Their method was applied to the electrokinetic characterisation of a MF polysulfone membrane during fouling by latex particles. Their results show that for a given mass of particles deposited on the membrane, the variation rate of the electric potential during fouling is directly linked to the transmembrane pressure and varies as the fouling rate. On the other hand, at constant pressure, the amplitude of the electric potential variation increases with deposited particle mass. Their method has the advantage not to disturb the build-up of the cake layer due to the no-variation of the pressure. However, the streaming potential occurring across the “membrane + deposit” structure is an overall signal, which does not reflect the electrokinetic properties of the sole active layer (i.e. the layer of interest). In this context, a new method for the characterisation of surface electrical properties of sole particle deposits during dead-end filtration was developed. The characterisation is based upon simultaneous transversal streaming potential and permeate flux measurements at constant pressure before and during the deposit formation. In order to validate the method, fouling experiments were conducted with calibrated rigid spherical particles of the same charge sign and opposite charge to the membrane through flat membranes forming a narrow channel and hollow fiber membranes. 2. THEORY 2.1. Streaming potential Let us consider a charged porous medium brought into contact with an electrolyte solution. A charge excess takes place in the electrical double layer that forms inside pores at the solid–liquid interface. When a pressure gradient is applied through the porous medium, the charges in the mobile diffuse layer are carried toward the low-pressure side. This constitutes a streaming current. The accumulation of charge at one end sets up an electric field which causes a conduction current in the opposite direction of the streaming current. When the conduction current equals the streaming current, a steady state is achieved (Hunter 1981). The resulting electric potential difference that

can be measured between the pore ends is the streaming potential (∆ϕs). However, it is useful to express the streaming potential as the electrical potential difference per unit pressure (SP = ∆ϕs/∆P) because this quantity is more informative than the single value of electrical potential difference (which depends on the pressure difference on either side of the porous medium). It is important to keep in mind that the streaming potential occurring across a “membrane + deposit” structure is an overall signal, which is necessarily influenced by the membrane itself because of the non-negligible pressure drop occurring through it. In addition, the contributions of the membrane and deposit to the overall streaming potential vary with the progress of filtration because of pressure drop variations occurring through both the membrane and cake layer during the filtration. It is then important to find a method allowing the determination of the streaming potential coefficient of the sole cake layer during its growth. The method proposed is based on simultaneous transversal streaming potential and permeate flux measurements at constant pressure on the sole membrane and the “membrane + deposit” structure. By considering a resistance-in-series model and applying Darcy’s law and conservation law for volume flux across the two-layer structure, the streaming potential coefficient of the deposit (SPd) can be expressed as follows:
( )( )mdm
mdmmdmd Lp/Lp1
Lp/LpSPSPSP+
++
−−
= (1)
where the symbol Lp denotes the hydraulic permeability, the subscript m referring to the membrane and m+d to the “membrane + deposit” structure. It should be emphasised that the validity of Eq. (1) implies that the streaming potential coefficient of deposit is independent of pressure drop across it. During the cake formation, the fraction of the constant applied pressure acting on both the membrane and the deposit is changing. For porous layers formed by large particles, the streaming potential coefficient is expected to be independent of the deposit pore size due to the presence of large pores (the surface conductance contribution is negligible in conditions of sufficiently large pore radius in respect with the electrical double layer thickness). In this case, a compaction of deposit should not influence its streaming potential coefficient. On the contrary, the streaming potential coefficient of the deposits formed by small particles is expected to depend on pore size (the surface conductance becomes non-negligible as compared with the conductivity of bulk electrolyte). In these conditions, Eq. (1) is always valid provided that the deposit does not compact otherwise the streaming potential coefficient becomes dependent on the pressure drop across the layer and Eq. (1) is not valid anymore. In order to ensure that no significant compaction occurs, the streaming potential of the deposit must be measured at various external pressures. The working external pressure must then be chosen in the pressure range where the streaming potential varies linearly with the pressure, i.e. where the streaming potential coefficient of the deposit is independent of the pressure (Szymczyk 2002).

2.2. Deposit permeability From a resistance-in-series model and applying Darcy’s law and conservation law for volume flux across the two-layer structure, the permeability of deposit (SPd) on membrane surface can be written as follows:
dmm
dmmd pL- Lp
pL LpLp+
+= (2)
For dead-end filtration under constant pressure (and in the absence of particle back-transport), the permeability Lp decreases with time and the mass of deposited particles, md, at the membrane surface can be expressed as: C V m cd = (3) where Vc is the cumulated volume of the permeate and C the particle concentration of the suspension. According to filtration theory, the deposit permeability can also be related to its specific resistance α by (Park 2007):
αµ
= V C
ALpc
md (4)
where Am is the membrane surface area and µ the viscosity of solution. If the deposit is considered as a porous stack of solid spheres, its specific resistance can also be related to particle properties by the Carman-Kozeny equation (Karode 2001, Park 2007):
2
32p
d )-(1 801 t Lp
εµ
εφ= (5)
with pm
d
d )-(1 Amt
ε= (6)
where φp denotes the particle diameter, ε the deposit porosity, t the deposit thickness and dp the particle density. Eqs (5) and (6) show that deposit porosity (ε) can be assessed during filtration from deposit permeability (Lpd) measurements as a function of the mass of deposited particles (md) provided that others parameters (Am, dp, φp) are known. 3. EXPERIMENTAL 3.1. Membranes and suspensions

Filtration tests were performed with polystyrene latex and melamine suspensions using flat-sheet polyethersulfone and hollow fiber polysulfone membranes. The properties of particles and membranes are given in Table 1. 10-3 M KCl solutions and particle suspensions with concentrations of 150, 450 and 750 mg L-1 in 10-3 M KCl solutions were filtered. All solutions and suspensions were prepared from salt of pure analytical grade (Fisher Scientific) and milli-Q quality water (conductivity < 1 µS cm-1). Their pH was adjusted at 5.5 ± 0.1. Given the size of colloids and membrane pores, total rejection of particles is expected during filtration.
Table 1. Properties of particles and membranes used for filtration experiments and dimensions of confined channels.
Particles
Polystyrene latex Melamine Manufacturer Granuloshop (France)
shape Spherical Volume median diameter φp ±
standard deviation (nm) 530 ± 25 480 ± 30
Particle density dp (g cm-3) 1.05 1.50 Membranes Polyethersulfone Polysulfone
Manufacturer Orelis (France) Degrémont Technologies-Aquasource (France)
Molecular weight cut-off (kDa) 150
Pure water permeability Lp (L h-1 m-2 bar-1)
240 ± 20 600 ± 50
Mean pore size (µm) ~ 0.1 Channels
Geometry and dimensions Slit length: 278 mm; width: 2
mm; height: 1 mm)
Tubular length: 140 mm; internal
diameter: 0.8 mm Filtration surface area (cm2) 11 3.5
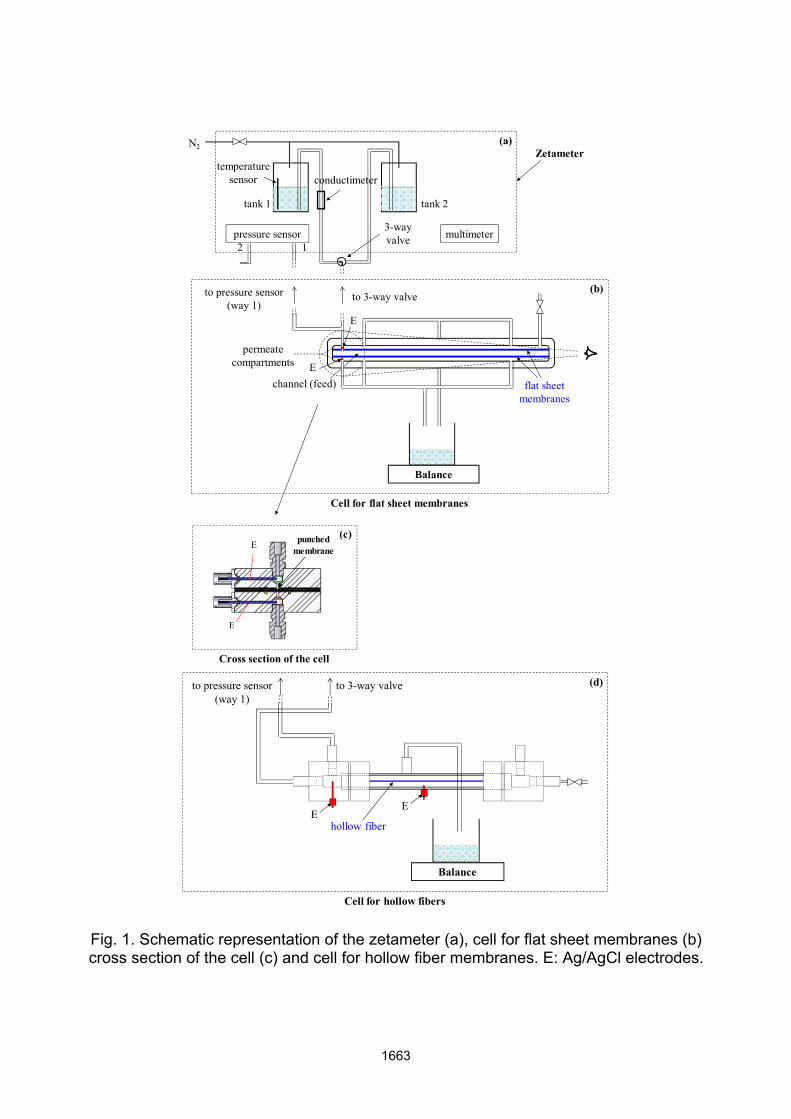
3.2. Experimental set-up The experimental set-up used in this work is depicted in Fig. 1. It is composed of a ZETACAD (CAD Inst., France) zeta-meter (Fig. 1a), an in-house-built measuring cell for flat sheet (Fig. 1b and c) or hollow fiber (Fig. 1d) membranes and an electronic balance (Sartorius, Model TE31025) connected to a PC. The filtration cell for flat sheet membranes is a sandwich-type cell with narrow parallelepiped-shaped channel formed by a couple of identical membranes. The channel is formed by clamping together two identical flat membranes separated by a PTFE spacer of 1 mm in thickness, each membrane being positioned in a PMMA plate.
conductimeter
N2
tank 1 tank 2
Zetameter
3-way valve multimeter
temperaturesensor
pressure sensor12
flat sheet membranes
permeate compartments
E
channel (feed)E
to 3-way valveto pressure sensor (way 1)
Cell for flat sheet membranes
Balance
••
E
E
punchedmembrane
Cross section of the cell
(a)
(c)
(b)
Cell for hollow fibers
hollow fiber
Balance
EE
to 3-way valveto pressure sensor (way 1)
(d)
Fig. 1. Schematic representation of the zetameter (a), cell for flat sheet membranes (b) cross section of the cell (c) and cell for hollow fiber membranes. E: Ag/AgCl electrodes.
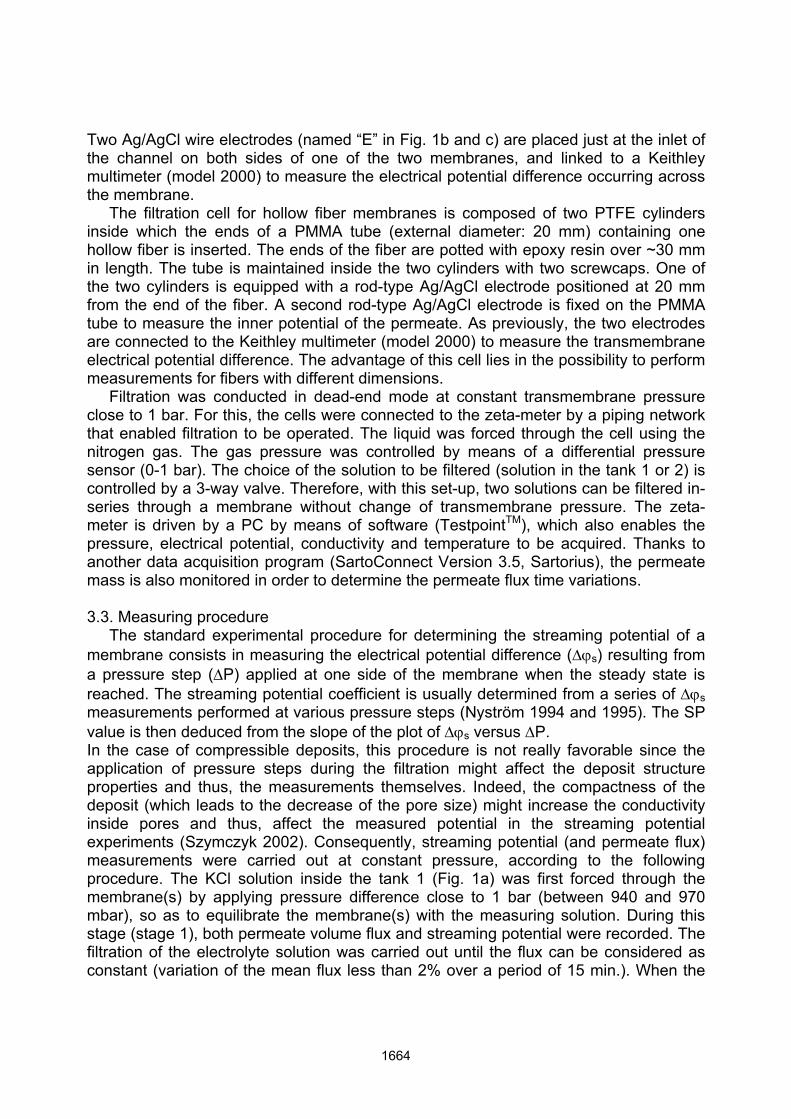
Two Ag/AgCl wire electrodes (named “E” in Fig. 1b and c) are placed just at the inlet of the channel on both sides of one of the two membranes, and linked to a Keithley multimeter (model 2000) to measure the electrical potential difference occurring across the membrane. The filtration cell for hollow fiber membranes is composed of two PTFE cylinders inside which the ends of a PMMA tube (external diameter: 20 mm) containing one hollow fiber is inserted. The ends of the fiber are potted with epoxy resin over ~30 mm in length. The tube is maintained inside the two cylinders with two screwcaps. One of the two cylinders is equipped with a rod-type Ag/AgCl electrode positioned at 20 mm from the end of the fiber. A second rod-type Ag/AgCl electrode is fixed on the PMMA tube to measure the inner potential of the permeate. As previously, the two electrodes are connected to the Keithley multimeter (model 2000) to measure the transmembrane electrical potential difference. The advantage of this cell lies in the possibility to perform measurements for fibers with different dimensions. Filtration was conducted in dead-end mode at constant transmembrane pressure close to 1 bar. For this, the cells were connected to the zeta-meter by a piping network that enabled filtration to be operated. The liquid was forced through the cell using the nitrogen gas. The gas pressure was controlled by means of a differential pressure sensor (0-1 bar). The choice of the solution to be filtered (solution in the tank 1 or 2) is controlled by a 3-way valve. Therefore, with this set-up, two solutions can be filtered in-series through a membrane without change of transmembrane pressure. The zeta-meter is driven by a PC by means of software (TestpointTM), which also enables the pressure, electrical potential, conductivity and temperature to be acquired. Thanks to another data acquisition program (SartoConnect Version 3.5, Sartorius), the permeate mass is also monitored in order to determine the permeate flux time variations. 3.3. Measuring procedure The standard experimental procedure for determining the streaming potential of a membrane consists in measuring the electrical potential difference (∆ϕs) resulting from a pressure step (∆P) applied at one side of the membrane when the steady state is reached. The streaming potential coefficient is usually determined from a series of ∆ϕs measurements performed at various pressure steps (Nyström 1994 and 1995). The SP value is then deduced from the slope of the plot of ∆ϕs versus ∆P. In the case of compressible deposits, this procedure is not really favorable since the application of pressure steps during the filtration might affect the deposit structure properties and thus, the measurements themselves. Indeed, the compactness of the deposit (which leads to the decrease of the pore size) might increase the conductivity inside pores and thus, affect the measured potential in the streaming potential experiments (Szymczyk 2002). Consequently, streaming potential (and permeate flux) measurements were carried out at constant pressure, according to the following procedure. The KCl solution inside the tank 1 (Fig. 1a) was first forced through the membrane(s) by applying pressure difference close to 1 bar (between 940 and 970 mbar), so as to equilibrate the membrane(s) with the measuring solution. During this stage (stage 1), both permeate volume flux and streaming potential were recorded. The filtration of the electrolyte solution was carried out until the flux can be considered as constant (variation of the mean flux less than 2% over a period of 15 min.). When the
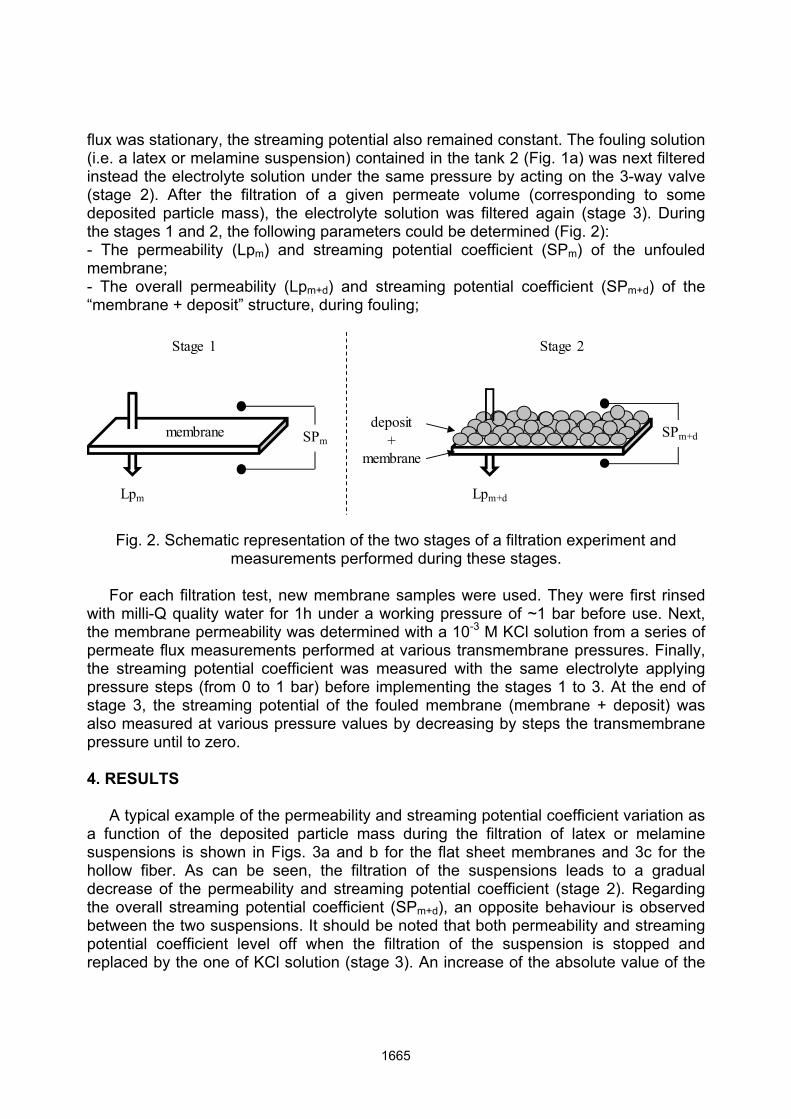
flux was stationary, the streaming potential also remained constant. The fouling solution (i.e. a latex or melamine suspension) contained in the tank 2 (Fig. 1a) was next filtered instead the electrolyte solution under the same pressure by acting on the 3-way valve (stage 2). After the filtration of a given permeate volume (corresponding to some deposited particle mass), the electrolyte solution was filtered again (stage 3). During the stages 1 and 2, the following parameters could be determined (Fig. 2): - The permeability (Lpm) and streaming potential coefficient (SPm) of the unfouled membrane; - The overall permeability (Lpm+d) and streaming potential coefficient (SPm+d) of the “membrane + deposit” structure, during fouling;
SPm
Stage 1 Stage 2
Lpm
membrane SPm+d
Lpm+d
deposit+
membrane
Fig. 2. Schematic representation of the two stages of a filtration experiment and measurements performed during these stages.
For each filtration test, new membrane samples were used. They were first rinsed with milli-Q quality water for 1h under a working pressure of ~1 bar before use. Next, the membrane permeability was determined with a 10-3 M KCl solution from a series of permeate flux measurements performed at various transmembrane pressures. Finally, the streaming potential coefficient was measured with the same electrolyte applying pressure steps (from 0 to 1 bar) before implementing the stages 1 to 3. At the end of stage 3, the streaming potential of the fouled membrane (membrane + deposit) was also measured at various pressure values by decreasing by steps the transmembrane pressure until to zero. 4. RESULTS A typical example of the permeability and streaming potential coefficient variation as a function of the deposited particle mass during the filtration of latex or melamine suspensions is shown in Figs. 3a and b for the flat sheet membranes and 3c for the hollow fiber. As can be seen, the filtration of the suspensions leads to a gradual decrease of the permeability and streaming potential coefficient (stage 2). Regarding the overall streaming potential coefficient (SPm+d), an opposite behaviour is observed between the two suspensions. It should be noted that both permeability and streaming potential coefficient level off when the filtration of the suspension is stopped and replaced by the one of KCl solution (stage 3). An increase of the absolute value of the

streaming potential coefficient with deposited mass is observed with latex suspension. The two membranes being negatively charged (SPm = - 5.2 and - 6.2 mV/bar for flat sheet and hollow fiber membranes, respectively), this increase (in absolute value) means that the streaming potential coefficient of the deposit (SPd) is higher (in absolute value) than the one of the membrane. Indeed, in a previous work, it was shown that the overall streaming potential coefficient of a two-layer structure is bounded between the streaming potential coefficients of the two layers when a series association of these layers is considered (Szymczyk 1998 and 2002). Moreover, it was found that the relative contribution of a layer to the overall electrical signal depends on the hydraulic permeability ratio between both layers. Given that the permeate flux is identical through the membrane and deposit, the hydraulic permeability ratio Lpm/Lpd equals to the reciprocal pressure drop ratio ∆Pd/∆Pm. Thus, at the beginning of the latex filtration, the overall electrical signal is dominated by the membrane, then, as the deposition proceeds, the contribution of the deposit to the overall streaming potential coefficient increases due to the increase in the pressure drop (that is, the driving force that gives rise to the streaming potential phenomenon) across the deposit and decreases across the membrane. A different behavior is observed with the melamine suspension: the streaming potential coefficient increases and its sign is reversed from negative to positive for some quantity of deposited particles. It can be shown from Eq. (1) that SPm+d equals zero when SPm Lpd = - SPd Lpm.
-25
-20
-15
-10
-5
0
100
125
150
175
200
225
250
-5 0 5 10 15 20 25 30 35 40 45 50 55 60
SPm
+d(m
V b
ar-1
)
Lpm
+d (L
h-1
m-2
bar-1
)
Deposited mass (g m-2)
Stage 1 (a) Stage 3
Stage 2

-10
-5
0
5
10
150
175
200
225
250
275
300
-5 0 5 10 15 20 25 30 35 40 45 50 55 60
SPm+d(m
V ba
r‐1)
Lpm
+d(L
h-1
m-2
bar-1
)
Deposited mass (g m-2)
Stage 1 (b) Stage 3
Stage 2
-50
-40
-30
-20
-10
0
150
250
350
450
550
650
-40 -20 0 20 40 60 80 100 120SP
m+d(m
V ba
r‐1)
Lpm
+d(L
h-1
m-2
bar-1
)
Deposited mass (g m-2)
Stage 1 (c) Stage 3
Stage 2
Fig. 3. Permeability (Lpm+d) and streaming potential coefficient (SPm+d) vs. deposited particle mass during filtration of a (a) latex suspension (450 mg L-1) through a flat membrane at 965 ± 10 mbar, (b) melamine suspension (450 mg L-1) through a flat
membrane at 950 ± 8 mbar and (c) latex suspension (750 mg L-1) through a hollow fiber at 955 ± 8 mbar. Stages 1 and 3: filtration of a 10-3 M KCl solution.
Fig. 4 shows the relative variation of the permeability versus deposited particle mass during the filtration of latex and melamine suspensions at various particle concentrations for the flat sheet membrane. It appears that the permeability drop is not influenced by particle concentration for the two suspensions. In other words, for a given structure, is not influenced by the deposition kinetics, which is higher for 750 mg L-1 than for 150 mg L-1. It is also seen that the permeability decrease is larger for the latex suspension than for the melamine one. However, no conclusion can be drawn because the latex and melamine particles have neither the same density nor the same size.

(a)
-50
-40
-30
-20
-10
0
0 5 10 15 20 25 30 35 40 45 50 55
(Lp m
+d-L
p m)/L
p m (%
)
Deposited mass (g m-2)
Latex C=150 mg/LLatex C=450 mg/LLatex C=750 mg/LMelamine C=150 mg/LMelamine C=450 mg/LMelamine C=750 mg/L
Fig. 4. Relative variation of the permeability ((Lpm+d – Lpm)/Lpm)) vs. deposited particle mass during filtration of latex and melamine suspensions at various particle
concentrations (150, 450 and 750 mg L-1). Thanks to measurements of Lp and SP performed during the stages 1 and 2 of filtration (Fig. 3a-c), the streaming potential coefficient of the alone deposit (SPd) can be determined from Eq. (1). The variation of SPd as a function of deposited particle mass for various latex and melamine concentrations is shown in the case of flat sheet membranes in Fig. 5a. Firstly, it must be kept in mind that when the cake is not thick enough and consequently, not resistive enough to the flow, as compared to the membrane, it does not contribute significantly to the overall streaming potential. Consequently, the SPd values calculated at the beginning of the deposition are not really reliable. As can be seen, beyond some deposited mass, SPd tends to the same value (-66 mV bar-1 and +40 mV bar-1) for latex and melamine deposits, respectively), regardless of the particle concentration, i.e. the deposition kinetics. If particles, which are mono-dispersed and rigid, pile up one upon another in an identical way during the filtration, it is then expected that the mean pore size of the cake layer does not vary during its growth and does not depend on growth kinetics. In these conditions, it is quite normal that SPd varies neither with the deposit thickness nor with the growth kinetics, since they are the same particles with the same surface charge density that participate in the cake growth. This result confirms the validity of the streaming potential method at constant pressure, as well as reliability of the proposed procedure for assessing the streaming potential coefficient of the sole deposit during its build-up.

-100
-80
-60
-40
-20
0
20
40
60
80
0 5 10 15 20 25 30 35 40 45 50 55
SPd
(mV
/bar
)
Deposited mass (g m-2)
Latex C=150 mg/LLatex C=450 mg/LLatex C=750 mg/LMelamine C=150 mg/LMelamine C=450 mg/LMelamine C=750 mg/L
(a)
-100
-90
-80
-70
-60
-50
-40
-30
-20
-10
0
0 10 20 30 40 50 60 70 80 90 100 110 120
SPd
(mV
/bar
)
Deposited mass (g m-2)
Latex C=150 mg/LLatex C=750 mg/L
(b)
Fig. 5. Streaming potential coefficients of (a) latex and melamine deposits (SPd) vs. deposited particle mass in the case of flat sheet membranes and (b) latex deposits
(SPd) vs. deposited particle mass in the case of hollow fiber membranes. As shown in Fig. 5b, the same asymptotic behavior with a similar SPd value (-60 mV bar-1) is observed in the case of the hollow fiber. This result is also a proof of the reliability of the proposed procedure since the streaming potential coefficient of the sole deposit is independent of the substrate on which it builds up. It is also seen that SPd is not affected by the particle concentration, i.e. the deposition kinetics, since curves for two different particle concentrations overlap each other. However, it appears that the particle mass to be deposited to reach the asymptotic value is much larger in the case of the hollow fiber (~80 g m-2 opposed to ~15 g m-2 for flat membranes). This difference could be the result of a non-uniform distribution of the deposit thickness along the membrane (for both fiber and flat membranes) and the position of measuring electrodes, which is different between the two cells (the two electrodes are positioned at the inlet of the channel for flat membranes whereas one is fixed at the inlet and the other at the middle of the channel for the hollow fiber). Indeed, if the cake is thicker at the inlet of the channel and decreases continuously along the channel, its contribution to the

overall streaming potential is expected to be stronger at the inlet and less at the middle of the channel, for a given deposited mass value. Since the SPd value can be considered as a local value whereas the deposited mass is a mean value on the whole membrane surface, it means that the deposited mass beyond which SPd becomes constant is underestimated for flat membranes (Fig. 5a) whereas it is overestimated for the hollow fiber (Fig. 5b). It should be mentioned that such longitudinal variations of cake thickness were highlighted by Mendret et al (2010) during ultrafiltration of clay suspension in a confined slit channel using an optical method. The asymptotic values of SPd lead to zeta potentials in the range -12.6 ─ -11.5 mV for latex deposits and +8.4 mV for melamine deposits, using the well-known Helmholtz–Smoluchowski relation (Hunter 1981). Nevertheless, these values are rough because the Helmholtz–Smoluchowski relation may not be strictly valid in the experimental conditions of the study. Indeed, the thickness of the electric double layer (~ 10 nm) is comparable to the pore radius of cakes. From a theoretical calculation, in the case of the hexagonal compact packing, the pore radius in the cake layer is expected to be equal to around 40 nm (Jons 1999). In these conditions, the pore conductivity might be higher than the bulk conductivity. The use of the Helmholtz–Smoluchowski relation would then lead to underestimation of the true zeta potential. In order to validate the streaming potential method at constant pressure in another way, the streaming potential coefficient of the fouled membranes was also assessed from measurements performed at various pressures by releasing pressure, at the end of the stage 3, from ~ 1 to 0 bar (decreasing pressure steps were then applied). Fig. 6a and b presents typical examples of such measurements for flat and hollow fiber membranes, respectively. Streaming potentials of clean membranes (before fouling), which were measured using the method by pressure steps (increasing pressure steps in the 0-1 bar range were applied), are also shown. As can be seen, the streaming potential of fouled membranes varies linearly with pressure on the studied pressure range, which means that the overall streaming potential coefficient SPm+d is independent on pressure up to 1 bar. This pressure independence of SPm+d justifies the use of Eq. (1).
(a)

-40
-35
-30
-25
-20
-15
-10
-5
0
5
10
0 0.2 0.4 0.6 0.8 1
∆ϕ(m
V)
∆P (bar)
membranemembrane + latex depositmembrane + melamine deposit
∆ϕm+d = 10.43 ∆Pm+d
∆ϕm = -7.28 ∆Pm
∆ϕm+d = -41.86 ∆Pm+d
(b)
Fig. 6. Streaming potential (∆ϕ) vs. applied pressure difference (∆P) in 10-3 M KCl in the case of (a) flat membranes and (b) hollow fibers. The streaming potential of the
membrane was measured using the method by pressure steps (pressure steps from 0 to 1 bar). The streaming potential of the “membrane + deposit” structure (deposited
mass of 55 and 110 g m-2 for flat and hollow fiber membranes, respectively) was measured at the end of stage 3 for various decreasing pressure values from ~ 1 to 0
bar.
It is also seen that streaming potential coefficients of fouled membranes calculated from the slopes of regressed lines are close to those obtained by the method at constant pressure, which confirms the reliability of the constant-pressure method. Figs. 7a and b display the plot of the deposit permeability (Lpd) calculated from Eq. (5) as a function of reciprocal deposited mass (Am/md) for the flat membranes fouled by latex or melamine particles (suspensions at 450 g L-1) and hollow fiber fouled by latex particles (suspensions at 750 g L-1), respectively. A linear trend can be observed at high deposited mass (md/Am > ~25 g m-2, i.e. Am/md < ~0.04 m2 g-1) for both latex and melamine suspensions. According to Eqs. (5) and (6), this result means that the overall porosity of deposits does not vary significantly with mass of deposited particles at md/Am > ~25 g m-2. The overall porosity of deposit ε was thus calculated from Eqs. (5) and (6) for each deposited mass and then used in Eq. (6) to determine the deposit thickness.

0
1000
2000
3000
4000
5000
6000
0.00 0.02 0.04 0.06 0.08 0.10 0.12 0.14 0.16 0.18 0.20
Lp d
(L h
-1m
-2ba
r-1)
Reciprocal deposited mass (m2 g-1)
LatexMelamine
(a)
0
2000
4000
6000
8000
10000
0.00 0.02 0.04 0.06 0.08 0.10 0.12 0.14 0.16 0.18 0.20
Lp d
(L h
-1m
-2ba
r-1)
Reciprocical deposited mass (m2 g-1)
(b)
Fig. 7. Deposit permeability (Lpd) vs. deposited particle mass during filtration of (a) latex and melamine suspensions at 450 mg L-1 through flat membranes and (b) a latex suspension at 750 mg L-1 through the hollow fiber. The variation of ε versus deposit thickness for latex and melamine deposits build up on the flat membranes is shown in Fig. 8a. It should be noted that ε data for thicknesses less than 5 µm, which represents 8-10 layers of particles, are not really reliable due to the too small contribution of deposit to the overall resistance. Moreover, all porosity value less than 26% cannot be considered as reliable since this value corresponds to the minimum porosity that can be obtained for a deposit build up from mono-dispersed rigid spherical particles. As can be seen, the porosity of the deposits levels off rather quickly, i.e. for deposit thickness greater than 15-20 µm and does not appear to be significantly affected by the particle concentration for the studied concentrations. Chun et al (2004) showed that the increase in latex concentration led to an increase in the packing density in the cake layer (i.e. a decrease in the cake

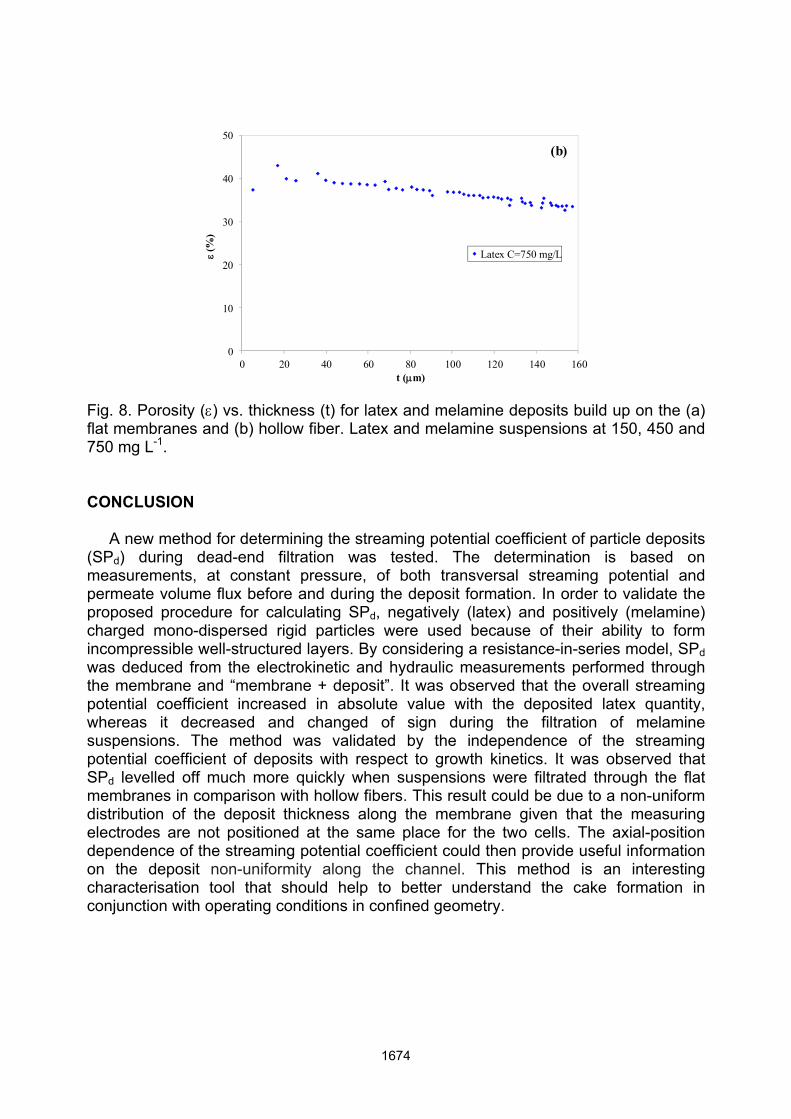
porosity). According to their relation giving the cake porosity as a function of latex concentration, a porosity variation of less than 3% should have been observed between 150 and 750 mg L-1. Therefore these concentrations are then too close to observe a significant variation of the porosity. Porosities of 31 and 33% are obtained for latex and melamine deposits, respectively. These values indicate that deposits have a compact structure close to a hexagonal packing (Jons 1999) as could be expected in the case of mono-dispersed rigid spherical particles. Porosity around 40% for deposit thicknesses greater than 40 µm was reported by Mendret et al (2009) in the case of bentonite deposits. This higher porosity as compared with the ones found in the present work is probably due to the parallelepiped shape of bentonite particles. Indeed, simulation results showed that the particle shape played the major role in the porosity of the cake formed by uniform-sized spheroїdal particles during the cake filtration, the structure of the cake becoming looser as the shape of the particles departed from spherical (Hwang 1996). It should be noted that the no-variation of ε with thickness shows that physico-chemical interactions, such as electrostatic forces between particles, are negligible compared to the hydrodynamic force. Fig. 8b displays the variation of ε versus the thickness of a latex deposit build up on the hollow fiber surface from a particle suspension at 750 mg L-1 in 10-3 M KCl. As explained previously, measurements can be considered as reliable when the contribution of deposit to the overall resistance becomes sufficient. By considering the same permeability drop (i.e. ~15%) as that determined with flat membranes, a deposit thickness of ~20 µm is estimated. It would be expected that this value is lower as that for flat membranes (~20 µm) due to higher permeability of hollow fibers. Actually, this result is explained by the larger initial porosity of the cake. Unlike deposits build up on the flat membranes, a slightly decreasing trend of ε with increasing thickness is observed in Fig. 8b. However, a similar porosity value (~33%) is obtained for large deposit thicknesses (145-160 µm).
0
10
20
30
40
50
0 10 20 30 40 50 60 70 80
ε(%
)
t (µm)
Latex C=150 mg/LLatex C=450 mg/LLatex C=750 mg/LMelamine C=150 mg/LMelamine C=450 mg/LMelamine C=750 mg/L
(a)
0
10
20
30
40
50
0 20 40 60 80 100 120 140 160
ε(%
)
t (µm)
Latex C=750 mg/L
(b)
Fig. 8. Porosity (ε) vs. thickness (t) for latex and melamine deposits build up on the (a) flat membranes and (b) hollow fiber. Latex and melamine suspensions at 150, 450 and 750 mg L-1. CONCLUSION A new method for determining the streaming potential coefficient of particle deposits (SPd) during dead-end filtration was tested. The determination is based on measurements, at constant pressure, of both transversal streaming potential and permeate volume flux before and during the deposit formation. In order to validate the proposed procedure for calculating SPd, negatively (latex) and positively (melamine) charged mono-dispersed rigid particles were used because of their ability to form incompressible well-structured layers. By considering a resistance-in-series model, SPd was deduced from the electrokinetic and hydraulic measurements performed through the membrane and “membrane + deposit”. It was observed that the overall streaming potential coefficient increased in absolute value with the deposited latex quantity, whereas it decreased and changed of sign during the filtration of melamine suspensions. The method was validated by the independence of the streaming potential coefficient of deposits with respect to growth kinetics. It was observed that SPd levelled off much more quickly when suspensions were filtrated through the flat membranes in comparison with hollow fibers. This result could be due to a non-uniform distribution of the deposit thickness along the membrane given that the measuring electrodes are not positioned at the same place for the two cells. The axial-position dependence of the streaming potential coefficient could then provide useful information on the deposit non-uniformity along the channel. This method is an interesting characterisation tool that should help to better understand the cake formation in conjunction with operating conditions in confined geometry.

REFERENCES Chun, M.-S., Cho, H.I. and Song, I.K. (2002). “Electrokinetic behavior of membrane zeta potential during the filtration of colloidal suspensions”, Desalination, Vol. 148, 363-367. Chun, M.S. and Park, W.C. (2004). “Time evolution of electrokinetic flow-induced streaming potential and flux in dead-end and cross-flow filtration of colloids through nanopores”, J. Membr. Sci., Vol. 243, 417-424. Chloe, T.B., Masse, P., Verdier, A. and Clifton, M.J. (1986). “Flux decline in batch ultrafiltration: concentration, polarization and cake formation”, J. Membr. Sci., Vol. 26, 1-15. Gourgues, C., Aimar, P. and Sanchez, V., (1992). “Ultrafiltration of bentonite suspensions with hollow fiber membranes”, J. Membr. Sci., Vol. 74, 51-69. Hamachi, M. and Mietton-Peuchot, M. (1999). “Experimental investigation of cake characteristics in crossflow microfiltration”, Chem. Eng. Sci., Vol. 54, 4023-4030. Hunter, R.J. (1981), Zeta potential in Colloid Science, Principles and Applications, Academic Press, San Diego. Hwang, K.-J., Wu, Y.-S. and Lu W.M. (1996). “The surface structure of cake formed by uniform sized rigid spheroids in cake filtration”, Powder Technology, Vol. 87, 161-168. Jons, S., Ries, P. and Mc Donald, C.J. (1999). “Porous latex composite membranes: fabrication and properties”, J. Membr. Sci., Vol. 155, 79-99. Karode, S.K. (2001). “Unsteady state flux response : A method to determine the nature of the solute and gel layer in membrane filtration”, J. Membr. Sci., Vol. 188, 9-20. Le Bolay, N. and Ricard, A. (1995). “Streaming potential in membrane processes: microfiltration of egg proteins”, J. Colloid Interface Sci., Vol. 170, 154-160. Mendret, J., Guigui, C., Schmitz, P. and Cabassud, C. (2009). “In situ dynamic characterisation of fouling under different pressure conditions during dead-end filtration: Compressibility properties of particle cakes”, J. Membr. Sci., Vol. 333, 20-29. Mendret, J., Guigui, C., Cabassud, C. and Schmitz, P. (2010). “Numerical investigations of the effect of non-uniform membrane permeability on deposit formation and filtration process”, Desalination, Vol. 263, 122-132. Murase, T., Ohn, T. and Kimata, K. (1995). “Filtrate flux in crossflow microfiltration of dilute suspension forming a highly compressed fouling cake layer”, J. Membr. Sci., Vol. 108, 121-128. Nyström, M., Pihlajamäki, A. and Ehsani, N. (1994). “Characterization of ultrafiltration membranes by simultaneous streaming potential and flux measurements”, J. Membr. Sci., Vol. 87, 245–256. Nyström, M., Kaipia, L. and Luque, S. (1995). “Fouling and retention of nanofiltration membranes”, J. Membr. Sci., Vol. 98, 249-262. Park, P.-K., Lee, C.-H. and Lee S. (2007). “Determination of cake porosity using image analysis in a coagulation–microfiltration system”, J. Membr. Sci., Vol. 293, 66-72. Sung, J.H., Chun, M.-S. and Choi, H.J. (2003). “On the behavior of electrokinetic streaming potential during protein filtration with fully and partially retentive nanopores”, J. Colloid Interf. Sci., Vol. 264, 195-202.

Szymczyk, A., Fievet, P., Reggiani, J.C. and Pagetti, J. (1998). “Determination of the filtering layer electrokinetic properties of a multi-layer ceramic membrane”, Desalination, Vol. 116, 81-88. Szymczyk, A., Fievet, P. and Foissy, A. (2002). “Electrokinetic characterization of porous plugs from streaming potential coupled with electrical resistance measurements”, J. Colloid Interf. Sci., Vol. 255, 323-331. Teychene, B., Loulergue P., Guigui, C. and Cabassud, C. (2011). “Development and use of a novel method for in line characterisation of fouling layers electrokinetic properties and for fouling monitoring”, J. Membr. Sci., Vol. 370, 45-47.