Embed Size (px)
Citation preview
Water 2020, 12, 1262; doi:10.3390/w12051262 www.mdpi.com/journal/water
Article
Electrodialytic Hydrogen Production and Critical
Raw Materials Recovery from Secondary Resources
Joana Almeida *, Cátia Magro, Eduardo P. Mateus and Alexandra B. Ribeiro *
Center for Environmental and Sustainability Research, Department of Sciences and Environmental
Engineering, School of Sciences and Technology, NOVA University Lisbon, Caparica Campus,
2829-516 Caparica, Portugal; [email protected] (C.M.); [email protected] (E.P.M.)
* Correspondence: [email protected] (J.A.); [email protected] (A.B.R.)
Received: 30 March 2020; Accepted: 27 April 2020; Published: 29 April 2020
Abstract: Electrodialytic technologies are defined as treatment processes that promote the
removal/recovery of substances in a matrix, based on the application of low-level current intensities.
Additionally, along these processes hydrogen is self-generated, allowing them to operationally
produce clean energy. This energy carrier is produced due to electrolysis reactions occurring at the
cathode end of the electrodialytic reactor, when using inert electrodes. Herein, hydrogen production
during the electrodialytic treatment of sewage sludge and mining residues suspensions (coupled
with effluent or sewage sludge), at 50 and 100 mA, was assessed. During the electrodialytic
treatment of sewage sludge, hydrogen purity production achieved 33%. When effluent or sewage
sludge were used as enhancements in mining residues suspensions, hydrogen purity reached 71%
and 34%, respectively. Furthermore, a proton-exchange membrane fuel cell was connected to the
cathode compartment of the electrodialytic reactor. The electrical energy generated from self-
hydrogen produced at 100 mA achieved ≈1 V in all performed experiments. Simultaneously, critical
raw materials extraction, namely phosphorus and tungsten, was evaluated. When the process was
applied to mining residue suspensions combined with sewage sludge, the highest extraction ratio
of phosphorus (71%) and tungsten (62%) was observed.
Keywords: electrodialytic technology; hydrogen production; proton-exchange membrane fuel cell;
energy; phosphorus; tungsten
1. Introduction
Raw materials are crucial to the European Union’s economy and, as the population grows [1],
more resources are needed to meet the demand. Raw materials are the main base to produce a broad
range of goods and applications for the quotidian life and modern technologies. However, the
unhindered access to certain raw materials is raising awareness across the globe. Regarding the high
economic importance and scarceness of certain raw materials, in 2017, the European Commission
presented a list with 27 critical raw materials to emphasize the need to find reliable alternative
suppliers [2].
Simultaneously, the targets presented by European Commission for the period of 2021 to 2030
also comply the reduction of greenhouse gas emissions in more than 40% (regarding 1990 levels) and
energy efficiency improvements above 32.5% [3].
Seeking for technology developments on clean energy production through non-fossil resources,
its storage and further uses called for new and integrated strategies [4]. Thus, coupling the recovery
of critical raw materials from secondary resources with the empowerment of clean energy production
will move towards circular economy principles [5].

Water 2020, 12, 1262 2 of 13
Technologies based in the electrodialytic process have proved their potential to remove/recover
a wide range of contaminants/substrates from environmental matrices [6–8]. Electrodialytic
technologies consist on the application of a direct or alternate low-level current density (mA/cm2) and
low potential gradient (V/cm), between a pair of electrodes. Herein, ion-exchange membranes allow
a selective separation of cations and anions in concentrated electrolytes’ solutions [9]. In this sense,
electrodialytic technologies are being shaped for critical raw materials upturn, namely phosphorus
(P) from sewage sludge [8] and tungsten (W) from secondary mining resources [10].
Treated effluent and sewage sludge are by-products from wastewater treatment plants (WWTP).
Sewage sludge can be regarded as a secondary resource of critical raw materials, e.g., due to its high
P content, when compared with effluent. However, treated effluent have also shown feasible reuses
in building products [11] and irrigation purposes [12], making electrodialytic treatment also
attractive. Sewage sludge can be applied in soil fertilization/remediation if a pre-treatment promotes
a product with high quality standards. Moreover, sewage sludge can be used as an energy resource
for power and heat by conventional/emerging technologies through the use of biogas and biofuels.
The reuse of sewage sludge can, therefore, be economically appealing and sustainable, preventing its
disposal as waste in landfills [13].
On the other hand, mining industries produce extremely high quantities of residues due to the
low ore grade concentrates [14]. Additionally, the disposal of these residues in open pits can cause
severe landscape issues and environmental deterioration. Located in the central region of Portugal,
Panasqueira mine has been active for more than one century, representing one of the largest tin (Sn)—
W deposits in Europe. Mining residues disposed in Panasqueira area can also be a source of critical
raw material, although their low ore grade in W, from wolframite [15].
Despite of promising results in substances removal and separation from a wide range of solid
and liquid environmental matrices, energy requirements for electro-based technologies operation are
still one of the main operational drawbacks of these treatments. Regarding current low-carbon
economy principles [16], this topic was addressed in a proof-of-concept work presented by Magro et
al., 2019 [17]. The use of hydrogen produced during the electrodialytic process due to water
electrolysis reactions was studied. The experimental reactor was coupled to a proton exchange
membrane fuel cell (PEMFC), at the cathode end. Water was reduced to hydrogen gas, with purity
levels up to 97% (mol/mol) and promoting the generation of ≈1 V electrical energy throughout the
course of wastewater treatment. However, many factors may decrease hydrogen cleanliness, namely
the typology of the process, the experimental matrix, and the presence of contaminants, involving
competitive redox reactions at the electrodes (e.g., chlorine gas, metals deposition) [17].
Sewage sludge and mining residues suspensions have in common high disposal rates and
critical raw materials contents, making them particularly attractive for electrodialytic technologies.
Coupling the self-hydrogen production and exploitation with the recovery of P and W, may lead to
the decrease of primary energy consumption while decreasing costs, particularly in a full-scale
perspective. In addition, treated matrices may be further applied for different purposes, such as in
the construction industry [11,18,19], promoting the much needed closed loop systems.
In the present work, the experimental set-up of a three-compartment electrodialytic reactor was
operated at 100 and 50 mA, for 1 h and 2 h, respectively. The aim was to compare hydrogen
production and purity rates during the electrodialytic treatment of effluent, sewage sludge, and
mining residues suspensions, with or without sewage sludge and effluent enhancements. In parallel,
the recovery of P and W from all matrices under treatment was assessed.
2. Materials and Methods
2.1. Materials
Secondary effluent (Lisbon, Portugal) and sewage sludge (Sesimbra, Portugal) samples were
collected from the secondary clarifier of the respective wastewater treatment plants. Mining residues
suspensions were prepared with a rejected fraction from the sludge circuit from Panasqueira mine
(Covilhã, Portugal).

Water 2020, 12, 1262 3 of 13
2.2. Experimental
The experimental set-up is presented on Figure 1. A three-compartment electrodialytic reactor
acryl XT (RIAS A/S, Roskilde, Denmark), with an internal diameter of 80 mm and unitary
compartment lengths of 50 mm was used. Anode and cathode compartments were separated from
the central sector by an anion exchange membrane, AR204SZRA, MKIII, Blank (Ionics, Ringwood, NJ
USA) and a cation exchange membrane, CR67, MKIII, Blank (Ionics, Ringwood, NJ, USA),
respectively. Electrodes composition were Ti/MMO Permaskand wire, with a diameter of 3 mm and
a length of 50 mm (Grønvold & Karnov A/S, Copenhagen, Denmark). A power supply E3612A
(Hewlett Packard, Palo Alto, USA) was connected to the electrodialytic reactor for constant current.
A magnetic stirrer was used in the central compartment to maintain the mixtures in suspension
(Figure 1).
Figure 1. Schematic electrodialytic reactor coupled with a proton-exchange membrane fuel cell
(PEMFC). CEM—Cation Exchange Membrane; AEMAnion—Exchange Membrane.
Sewage sludge tests were performed adding 200 mL of sample to the central compartment.
Suspensions with effluent or sewage sludge and mining residues were prepared at the same L/S (9),
adding 22.2 g of solid sample to 200 mL of liquid sample. Both anolyte and catholyte compartments
were filled with 250 mL of 0.01 M NaNO3.
Six electrodialytic experiments were carried out with three matrices and two current intensities
(50 and 100 mA), in duplicate: Sewage sludge, mining residues with effluent, and mining residues
with sewage sludge. The data from these experiments was compared with the effluent and mining
residues data from [17], and ten electrodialytic experiments were evaluated (Table 1).
Table 1. Electrodialytic experiments conducted and used to compare gas capture and critical raw
materials recovery.
Code Operation Time (min) Current Intensity (mA) Matrix
E50 * 120 50 Effluent
E100 * 60 100
SS50 120 50 Sewage Sludge
SS100 60 100
MR50 * 120 50 Mining Residues and Briny Water
MR100 * 60 100
MRE50 120 50 Mining Residues and Effluent
MRE100 60 100
MRSS50 120 50 Mining Residues and Sewage Sludge
MRSS100 60 100
E—Effluent; SS—Sewage sludge, MR—Mining residue. * Data from [17].
- +
H2
PEMFC
Power supply
Sample AnolyteCatholyte
AEM
Electrodialytic reactor
CEM

Water 2020, 12, 1262 4 of 13
The hydrogen produced at the reactor cathode was collected in a storage cylinder with 30 mL of
capacity (Horizon Fuel Cell Technologies, Singapore). The gas volume was measured every 10 min.
For hydrogen purity analysis, the cathode compartment exit vent was connected to a 500 mL tedlar
sample bag with a single polypropylene septum fitting (SKC, Cerritos, CA, USA) for 6 h. The gas was
analyzed by Gas Chromatography with Thermal Conductivity Detector (GC-TCD). Finally, for
electrical power generation, the cathode compartment was directly connected to a 32 mm × 32 mm ×
10 mm PEMFC, with a nominal voltage of ≈1 V (Horizon Fuel Cell Technologies, Singapore).
The electrodialytic reactor and the fuel cell open circuit voltage were monitored every 10 min
using a multimeter KT1000H (KIOTTO, Lisbon, Portugal) [17].
2.3. Methods
At the beginning and at the end of every electrodialytic experiment performed, pH and
conductivity were measured in central and electrolytes compartments by means of pH (EDGE,
HANNA, Providence, RI, USA) and conductivity meters (LAQUA twin, HORIBA Ltd., Kyoto, Japan).
Total concentrations of arsenic (As), calcium (Ca), cooper (Cu), potassium (K), magnesium (Mg),
sodium (Na), P, sulfur (S), Sn, W and zinc (Zn) were determined by Inductively Coupled Plasma with
Optical Emission Spectrometry (ICP-OES) (HORIBA Jobin-Yvon Ultima, Kyoto, Japan), equipped
with generator RF (40.68 MHz), monochromator Czerny-Turner with 1.00 m (sequential), automatic
sampler AS500 and dispositive CMA-Concomitant Metals Analyzer.
Sample preparation for elements´ quantification was performed through acid extraction of solid
matrices (dried for 48 h at ≈20 °C): 0.5 g of solid sample with 9 mL HNO3 (65%) and 3 mL HCl (37%)
were placed on a shaking table at ≈125 rpm for 48 h. Finally, the samples were diluted in deionized
water (1:25), filtered by vacuum through 0.45 μm MFV3 glass microfiber filters (Filter lab, Barcelona,
Spain) and analyzed by ICP-OES.
Hydrogen purity was determined by GC-TCD on a Trace GC Ultra (Thermo Electron
Corporation, Beverly, MA, USA), using a Carboxen 1010 plot column (0.32 mm of diameter, 30 m of
length). The analytical process was performed in isothermal mode at 35 °C for 50 min. A gastight
syringe (vici precision sampling, Baton Rouge, LA, USA) was used to inject a volume of 250 µL on
the GC system. The injector was set at 200 °C and the detector/transfer line at 120 °C.
Data statistical analysis was performed with GraphPad Prism software (version 7.0e). The
statistically significant differences between samples for 95% level of significance were assessed with
ANOVA tests.
3. Results and Discussion
Table 2 presents the initial concentrations of elements in the studied effluent, sewage sludge,
and mining residues.
Table 2. Initial characterization of elements in the studied matrices.
Element Matrix
Effluent (mg/L) * Sewage Sludge (mg/L) Mining Residues (mg/kg) *
As n.d. 0.06 ± 0.01 218.57 ± 132.31
Ca 51.74 ± 18.34 158.98 ± 48.21 91.11 ± 27.08
Cu 0.04 ± 0.00 1.90 ± 0.48 76.82 ± 39.30
K 47.80 ± 29.10 25.51 ± 1.30 n.d.
Mg 118.00 ± 137.17 14.87 ± 3.35 n.d.
Na 524.55 ± 532.55 23.63 ± 0.07 n.d.
S 84.89 ± 65.27 a 78.35 ± 17.45b 789.59 ± 214.13 A,B
Sn n.d. 0.17 ± 0.04 c 1.95 ± 0.53 C
Zn 0.07 ± 0.06 e 7.20 ± 0.99 E n.d.
Cl- 908.1 ± 1013.7 81 # 5.6 ± 2.3

Water 2020, 12, 1262 5 of 13
* Data from [17]; n.d.—not detected. # Value provided by the wastewater treatment plants (WWTP). Statistical
analysis performed through multiple comparisons at p < 0.05 (95% confidence interval). Data with
capital letters are statistically significantly different from the data with the same lower-case letter.
3.1. Characterization of Electrodialytic Experiments
Table 3 presents the pH and conductivity values at the beginning and at the end of the
electrodialytic experiments. As expected, the initial pH of the effluent (7.67 ± 0.16), sewage sludge
(6.68 ± 0.02), and mining residues suspensions (4.57 ± 1.74) presented different levels. The
combination of effluent or sewage sludge with mining residues (pH slightly acid), promoted the
neutralization of the matrices (pH of 7.24 ± 0.12 and 7.18 ± 0.04, respectively). Sufficient conductivity
on the media has to be guaranteed to assure the passage of the current, and consequently, the removal
of elements. The effluent was the matrix with higher conductivity values (2.41 ± 2.12 mS/cm),
enhancing the conductivity of mining residues when suspensions were mixed with effluent (from
1.82 ± 0.54 to 2.55 ± 1.92 mS/cm).
Table 3. Initial and final pH and conductivity values in the reactor compartments.
Experiment Compartment pH Conductivity (mS/cm)
Initial Final Initial Final
E50 * Anode 6.46 ± 0.55
2.20 ± 0.02 0.90 ± 0.06
2.70 ± 0.00 j
Cathode 12.21± 0.01 a 2.45 ± 0.21
Sample 7.67 ± 0.16 4.54 ± 2.55 2.41 ± 2.12 1.80 ± 0.86
E100 * Anode 6.46 ± 0.55
2.21 ± 0.04 0.90 ± 0.06
2.85 ± 1.06 k
Cathode 12.11 ± 0.01 b 1.94 ± 0.23
Sample 7.67 ± 0.16 2.85 ± 0.20 o 2.41 ± 2.12 1.49 ± 0.15
SS50 Anode 7.54 ± 0.38
2.27 ± 0.19 0.54 ± 0.06
1.24 ± 0.14 l
Cathode 11.77 ± 0.13 A,c 0.97 ± 0.02
Sample 6.68 ± 0.02 5.96 ± 0.18 0.81 ± 0.02 0.37 ± 0.01
SS100 Anode 7.54 ± 0.38
2.15 ± 0.11 0.54 ± 0.06
0.94 ± 0.17 K
Cathode 11.51 ± 0.08 B,d 1.06 ± 0.21
Sample 6.68 ± 0.02 5.86 ± 0.14 0.81 ± 0.02 0.30 ± 0.01
MR50 * Anode 6.46 ± 0.55
2.02 ± 0.11 0.90 ± 0.06
3.25 ± 0.21 L
Cathode 12.30 ± 0.01 C,e 2.40 ± 0.14
Sample 4.57 ± 1.74 5.91 ± 0.45 1.82 ± 0.54 1.41 ± 0.49
MR100* Anode 6.46 ± 0.55
1.99 ± 0.04f 0.90 ± 0.06
2.55 ± 0.07
Cathode 12.21 ± 0.25 D,g 2.08 ± 0.46
Sample 4.57 ± 1.74 4.42 ± 1.33 1.82 ± 0.54 0.24 ± 0.16
MRE50 Anode 6.46 ± 0.55
2.00 ± 0.02 0.90 ± 0.06
2.70 ± 0.14 n
Cathode 12.31 ± 0.02 C,h 2.12 ± 0.54
Sample 7.24 ± 0.12 6.50 ± 0.22 2.55 ± 1.92 1.17 ± 0.60
MRE100 Anode 6.46 ± 0.55
2.08 ± 0.01 0.90 ± 0.06
4.00 ± 0.99
Cathode 12.25 ± 0.03 D,i 2.20 ± 0.14
Sample 7.24 ± 0.12 7.51 ± 0.12 O 2.55 ± 1.92 1.68 ± 0.32
MRSS50 Anode 7.54 ± 0.38
2.36 ± 0.11 0.54 ± 0.06
1.00 ± 0.50 J,N
Cathode 11.65 ± 0.16 A,E,H 1.12 ± 0.28
Sample 7.18 ± 0.04 6.38 ± 0.23 0.65 ± 0.01 0.61 ± 0.37
MRSS100 Anode 7.54 ± 0.38
2.47 ± 0.18 F 0.54 ± 0.06
1.05 ± 0.30 K
Cathode 11.57 ± 0.11 B,G,I 0.91 ± 0.04 M
Sample 7.18 ± 0.04 6.31 ± 0.01 0.65 ± 0.01 0.43 ± 0.01
E—Effluent; SS—Sewage sludge, MR—Mining residue. * Data from [17]. Statistical analysis performed
through multiple comparisons at p < 0.05 (95% confidence interval). Data with capital letters are
statistically significantly different from the data with the same lower-case letter.
Water 2020, 12, 1262 6 of 13
After the electrodialytic process, almost all tested matrices turned slightly more acid (Table 3).
This occurred due to the anion exchange membrane permselectivity, which allows the passage of H+
to the sample compartment and, consequently, the pH tends to decrease. In the anode and cathode
compartment, pH values reached ≈2 and ≈12, respectively. This was expected since water electrolysis
promotes the generation of H+ at the anode and OH− at the cathode compartment. In addition,
conductivity in the sample compartment decreased after the experiments, suggesting the
electromigration of ions to the anolyte or to the catholyte.
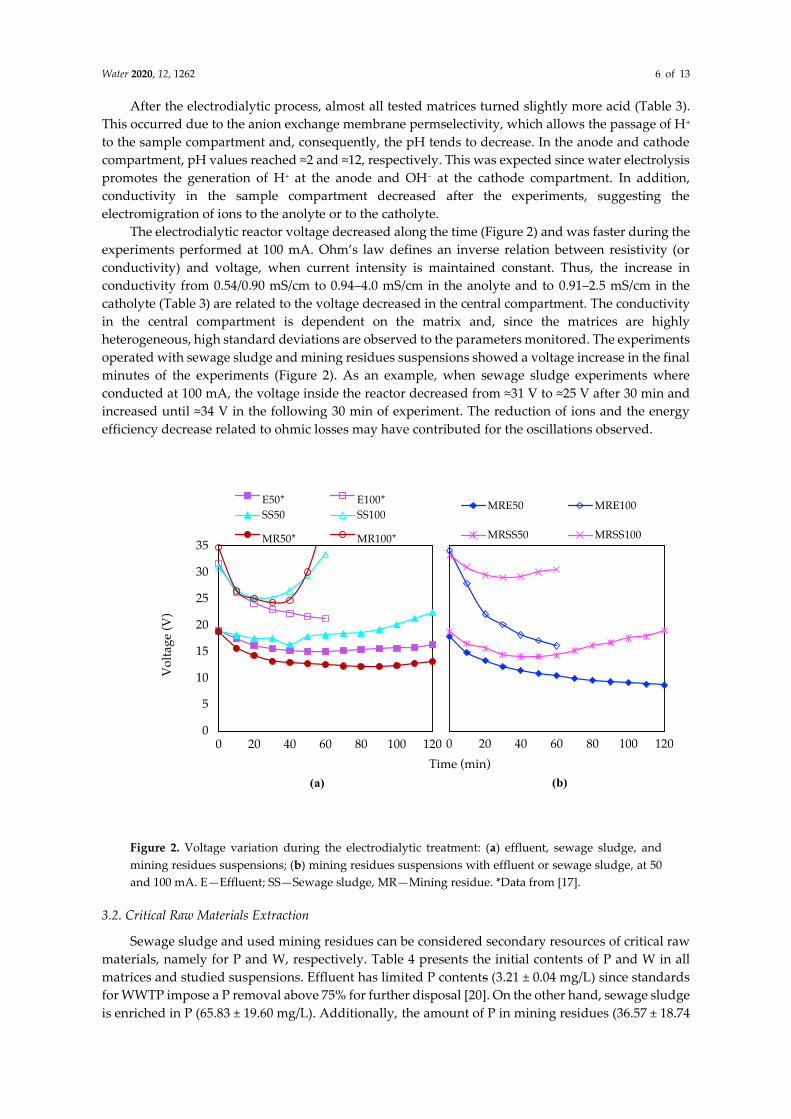
The electrodialytic reactor voltage decreased along the time (Figure 2) and was faster during the
experiments performed at 100 mA. Ohm’s law defines an inverse relation between resistivity (or
conductivity) and voltage, when current intensity is maintained constant. Thus, the increase in
conductivity from 0.54/0.90 mS/cm to 0.94–4.0 mS/cm in the anolyte and to 0.91–2.5 mS/cm in the
catholyte (Table 3) are related to the voltage decreased in the central compartment. The conductivity
in the central compartment is dependent on the matrix and, since the matrices are highly
heterogeneous, high standard deviations are observed to the parameters monitored. The experiments
operated with sewage sludge and mining residues suspensions showed a voltage increase in the final
minutes of the experiments (Figure 2). As an example, when sewage sludge experiments where
conducted at 100 mA, the voltage inside the reactor decreased from ≈31 V to ≈25 V after 30 min and
increased until ≈34 V in the following 30 min of experiment. The reduction of ions and the energy
efficiency decrease related to ohmic losses may have contributed for the oscillations observed.
Figure 2. Voltage variation during the electrodialytic treatment: (a) effluent, sewage sludge, and
mining residues suspensions; (b) mining residues suspensions with effluent or sewage sludge, at 50
and 100 mA. E—Effluent; SS—Sewage sludge, MR—Mining residue. *Data from [17].
3.2. Critical Raw Materials Extraction
Sewage sludge and used mining residues can be considered secondary resources of critical raw
materials, namely for P and W, respectively. Table 4 presents the initial contents of P and W in all
matrices and studied suspensions. Effluent has limited P contents (3.21 ± 0.04 mg/L) since standards
for WWTP impose a P removal above 75% for further disposal [20]. On the other hand, sewage sludge
is enriched in P (65.83 ± 19.60 mg/L). Additionally, the amount of P in mining residues (36.57 ± 18.74

Water 2020, 12, 1262 7 of 13
mg/kg), could potentially be recovered when suspensions are prepared with sewage sludge (108.66
± 38.34 mg/kg).
Table 4. Matrices’ initial and final critical raw materials content, at 50 and 100 mA.
Experiment Phosphorus Tungsten
Initial Final Initial Final
E50 * mg/L 3.21 ± 0.04 a
2.84 ± 0.51 b nd #
nd #
E100 * 3.30 ± 0.14 c nd #
SS50 mg/L 65.83 ± 19.60
156.97 ± 30.73 B,d nd #
nd #
SS100 146.83 ± 0.25 C,e nd #
MR50 * mg/kg 36.57 ± 18.74
20.73 ± 23.81 D 5.30 ± 1.56
5.64 ± 0.43 f
MR100 * 30.29 ± 4.88 E 4.88 ± 1.58 g
MRE50 mg/kg 39.80 ± 20.61
4.22 ± 0.64 D 5.30 ± 1.56
3.89 ± 0.13 h
MRE100 17.81 ± 22.15 E 3.76 ± 0.27
MRSS50 mg/kg 108.66 ± 38.34 A
29.59 ± 1.11 D 5.30 ± 1.56
1.71 ± 0.41 F,H
MRSS100 33.51 ± 0.66 E 1.63 ± 0.02 G
E—Effluent; SS—Sewage sludge, MR—Mining residue; * Data from [17]; # nd—not detected.
Statistical analysis performed through multiple comparisons at p < 0.05 (95% confidence interval).
Data with capital letters are statistically significantly different from the data with the same lower-case
letter.
After the electrodialytic treatment, differences on the final content of P and W were observed
(Table 4). Sewage sludge showed a higher P content after the experiments. Regarding phosphoric
acid speciation, for pH of suspensions between 2 and 6, H2PO4− is dominant. When pH increases from
6 to 10, HPO42− is the main specie present [21]. Thus, since pH turned to ≈6 in the central compartment
at 50 and 100 mA, H2PO4− is the main form in the suspension, being P more available in the media
and contributing for the increased P amount detected. Phosphorus availability can also be limited by
iron and aluminum at acidic pH and calcium at alkaline pH [22]. Sewage sludge has 158.98 ± 48.21
mg/L of calcium (Table 2). When pH is above 5.5, phosphates can react with calcium to form calcium
phosphates. Considering sewage sludge eventual contents on aluminum [23], when pH is below 5.5
it may react more readily with phosphates, reducing the amount of water-soluble P components
while increasing the amount of insoluble aluminum phosphates [24].
On the other hand, when mining residues suspension were prepared with sewage sludge, there
was a significant decrease of P in the final sample (≈32 mg W/kg; extraction ≈71%). P may form bonds
with sulfur (phosphorous sulfides), chloride (phosphorus chloride) ions and calcium (calcium
phosphates) [25]. Considering mining residues composition (Table 2), there are high contents of
sulfur (789.6 ± 214.1 mg/kg) and, in lower quantities, chloride (5.6 ± 2.3 mg/kg). The formation of
other chemical species and the removal of Al, Ca and Fe by the electrodialytic process may had
promoted the solubilization of P and increased P extraction/removal from the sample inside the
reactor central compartment.
Mining residues have tungsten in the form of (Fe, Mn) WO4 (wolframite), and contents of W
(5.30 ± 1.56 mg/kg). When mining residues suspension were electrodialytic treated with briny water
[17], the extraction of W was not significant for both current intensities applied: 5.64 ± 0.43 at 50 mA
and 4.88 ± 1.58 mg/kg at 100 mA (Table 4). Monomeric tungstate ion is only stable in neutral/alkaline
solutions (pH > 6.2), which may explain the differences of dissolved tungsten concentrations [26].
Contrarily, when mining residues suspensions were prepared with effluent, the extraction of W
was higher, meaning lower contents of W in the final sample (≈4 mg W/kg; extraction ≈25%). This
may have occurred due to complex formation, which promotes the extraction of W from mining
residues. Effluent is rich in calcium (Table 2), where W can form complexes such as CaWO4 [27].
When mining residues suspensions were mixed with sewage sludge, W extraction showed the
highest extraction rate. Less than ≈2 mg/kg of W (W extraction ≈62%) remained in the final sample

Water 2020, 12, 1262 8 of 13
(Table 4), which may be caused due to W complexes formation with P (tungsten phosphides, WP)
together with W calcium complexes [28].
Coupling mining residues with effluent and sewage sludge promoted a final pH range of the
suspension ≈6.3–7.5. In the absence of complexing substances, W in aqueous solution mainly exists
under the soluble form of tungstic ions (WO4)2− that are stable at neutral and alkaline pH (higher
solubility at alkaline pH). The W insoluble/slightly soluble species WO2 and W2O5 are stable between
pH 5 and 6.5, while WO3 is stable below pH 5 throughout all the oxidizing conditions [29,30].
3.3. Hydrogen Generation and Purity
Figure 3 presents the gas produced at the cathode compartment during the electrodialytic
experiments. A maximum of 30 mL was collected in all experiments due to the reservoir capacity.
The hydrogen flow rate production during electrodialytic treatments can be affected by the matrix
itself, competing cathode reactions, and the current intensity applied [17].
Figure 3. Gas collected during the electrodialytic treatment from the cathode compartment: (a)
effluent, sewage sludge, and mining residues suspensions at 50 and 100 mA; (b) mining residues
suspensions with effluent or sewage sludge, at 50 and 100 mA. E—Effluent; SS—Sewage sludge, MR—
Mining residue. * Data from [17].
At 100 mA, effluent, sewage sludge, and mining residues with or without wastewater resources,
showed similar rates of gas production (≈1 mL/min). However, at 50 mA, the gas production rates
were lower and more variable, from a minimum of 0.33 mL/min on sewage sludge compared to a
maximum of 0.68 mL/min on effluent [17] (Table 5).

Water 2020, 12, 1262 9 of 13
Table 5. Hydrogen flow rate (slope), its R-square and purity.
Experiment Hydrogen
Flow mL/min (Slope) R-Square (Slope) Purity w/w (%)
E50 * 0.68 0.97 -
E100 * 1.13 0.96 90.4 ± 0.3 a
SS50 0.33 0.97 -
SS100 1.02 0.94 32.6 ± 0.5 b
MR50 * 0.62 0.94 -
MR100 * 1.12 0.97 72.4 ± 0.7 A,B
MRE50 0.47 0.91 -
MRE100 1.05 0.96 71.3 ± 0.7 A,B,c
MRSS50 0.50 0.94 -
MRSS100 1.0 0.93 33.6 ± 4.9 A,B,C
E—Effluent; SS—Sewage sludge, MR—Mining residue; * Data from [17]. Statistical analysis
performed through multiple comparisons at p < 0.05 (95% confidence interval). Data with capital
letters are statistically significantly different from the data with the same lower-case letter.
The gas from the cathode compartment was collected in tedlar sample bags and analyzed. Table
5 shows the hydrogen purity for the experiments performed at 100 mA. Comparing the results from
the previous work [17], where the highest hydrogen purity (% w/w) was verified during effluent
electrodialytic treatment (90.4 ± 0.3%), in the present study sewage sludge reported the lowest
hydrogen purity (32.6 ± 0.5%). Effluent hydrogen purity has statistically significant differences (p <
0.05) from all the experiments, except from sewage sludge. Moreover, mining residue suspensions
with sewage sludge or effluent are statistically significant different between them.
The hydrogen production rate and purity may have been affected due to competing cathode
reactions. Comparing effluent and mining residues, sewage sludge is richer in organic matter [31].
Hydrogen production may be affected by methane (CH4), which is produced by methanogenic
organisms commonly present in most of mixed cultures. Hydrogenotrophic organisms may
transform CO2 and H2 to produce methane gas [32] (Equation (1)). Bacteria may move together
through direct current application by electroosmosis and electrophoresis phenomena [33].
Furthermore, some bacteria may adhere to several surfaces or other microorganism [34], promoting
also their movement to the cathode compartment. Microorganisms form clusters, due to their natural
behavior and may interact with environment in experimental conditions [35].
Hydrolysis and fermentation reactions may also lead to the generation of CH4 and CO2 gases in
the reactor (Equations (2) and (3)) [36]. Sewage sludge have also nitrogen contents (total nitrogen =
500 mg/L, data provided by the WWTP). This may have contributed for NO2 gas generation [17]
(Equation (4)), decreasing the purity of the hydrogen collected.
4H2 + CO2 ⟶ CH4 + H2O (1)
CH3COO− + H+ ⟶ CH4 + CO2 (2)
4HCOO− + 4H+ ⟶ CH4 + 3CO2 + 2H2O (3)
NO2 + H2O ⟶ NO3− + 2H+ (4)
Considering hydrogen capture conditions at 1 atm and 25 °C and comparing with [17] results at
100 mA, the hydrogen purity collected from each matrix decreased in the following sequence: E100 >
MR100 > MRE100 > MRSS100 > SS100 (Table 5).
3.4. Electrical Requirements and Savings
Electrodialytic experiments were carried out at a constant current of 50 and 100 mA. Thus, the
electrical energy required during each process, regarding the energy applied by the direct current

Water 2020, 12, 1262 10 of 13
power source, was determined by Equation (5), where I is the current intensity (mA) and Vreactor is the
voltage inside the electrodialytic reactor (V), between the initial (t0) and final (t) operation time (min):
E = I ∫ Vreactor(t) dtt
t0
(5)
Electrical energy requirements grow with the increase of electrical current applied, considering
the same circulated charge. The experiments performed at 100 mA required 9.5 ± 1.5 kJ of electrical
energy and the experiments carried out at 50 mA required 5.50 ± 1.40 kJ.
Considering a H2 heat of combustion of 141.8 MJ kg−1, and fuel cell energy conversion efficiencies
of 40–60% [37,38], between ≈5 to 8% of the electrical energy required in experiment MRE50 (the best
case reported) can be saved. This may also translate into economic benefits on the overall
electrodialytic treatment.
When the electrodialytic treatment is applied to liquid matrices, the energy requirements for the
electrolysis reactions are lower due to associated higher conductivity values. On the other hand, in
solid porous matrices, the electrodialytic process reaches higher voltage gradients due to the lower
conductivity, requiring longer treatments. Coupling fuel cell technologies may be a key factor in
electrodialytic energy savings, through the improvement on operation and energy efficiencies. In
addition, self-hydrogen produced in electrodialytic reactors can be stored and used/sold for energy
dependent industrial sectors.
In this sense, a proton-exchange membrane fuel cell (PEMFC) was connected directly to the
cathode compartment from all the experiments carried out at 100 mA. The PEMFC initial open circuit
voltage was between 1.2–1.4 V, showing a pronounced decrease in the first 10 min and remaining
stable until the end of the experiments (Figure 4). In all cases, chemical energy was converted to
electrical energy, supporting the versatility of PEMFC applicability to a broad range of matrices.
Although PEMFC chemical energy transformation into electrical energy is not directly dependent on
hydrogen quality, it may have repercussions on future PEMFC performance and long-term stability.
Impurities in the gas that flows inside the PEMFC, such as CO, H2S, NH3, and CH4, could cause
damage on electrodes, catalyst poisoning and, consequently, fuel cell functioning degradation [39].
Figure 4. Proton-exchange membrane fuel cell voltage variation. E—Effluent; SS—Sewage sludge, MR—
Mining residue. * Data from [17].
4. Conclusions
The present study proved the suitability of wastewater resources, as secondary effluent and
sewage sludge, to enhance electrodialytic critical raw materials recovery from mining residues.
Simultaneously, clean energy production was addressed due to the self-hydrogen generated during
the electroremediation of the environmental matrices.
0
0.2
0.4
0.6
0.8
1
1.2
1.4
0 10 20 30 40 50 60
PE
MF
C v
olt
age
(V)
Time (min)
E100*
SS100
MR100*
MRE100
MRSS100
Water 2020, 12, 1262 11 of 13
The electrodialytic extraction of P (71%) and W (62%) from sewage sludge and mining residues
suspensions was more effective when both matrices were combined. This can potentiate circular
economy while mitigating environmental negative impacts of waste disposal from both sewage
sludge and mining industries.
Regarding the potential of electrodialytic technologies as hydrogen sources, the experiments
performed demonstrated that hydrogen was produced in all tested cases, with purities between 33%
(sewage sludge) and 71% (mining residues suspension with effluent). Competitive cathode reactions
may affected the hydrogen purity, namely in sewage sludge due to its complex composition. Thus,
future works should address the composition of other gases to verify competitive cathode reactions.
Self-hydrogen produced during electroremediation of the matrices promotes a stable electrical
energy generation (1.2–1.4 V) and a way to reuse the previous energy recovered. This was validated
through a proton-exchange membrane fuel cell connected to the cathode compartment of the
electrodialytic reactor. Hydrogen generated at cathode electrolysis reaction can reduce electrical
energy requirements from 5% to 8%, namely in terms of electrodialytic treatments or other
remediation strategies concerning electrochemically induced transport.
The critical raw materials recovered and the energy achievements may empower the sustainable
growth of electrodialytic technologies, as these technologies can couple economic benefits.
Author Contributions: Conceptualization, J.A. and C.M.; Data curation, J.A. and C.M.; Formal analysis, E.P.M.
and A.B.R.; Funding acquisition, A.B.R.; Methodology, J.A.; Project administration, A.B.R.; Resources, E.P.M.,
and A.B.R.; Supervision, A.B.R.; Validation, E.P.M. and A.B.R.; Writing—original draft, J.A.; Writing—review &
editing, J.A., C.M., E.P.M., and A.B.R. All authors have read and agreed to the published version of the
manuscript.
Funding: This work received funding from the European Union’s Horizon 2020 research and innovation
program under Grant Agreement No. 776811, under the Marie Skłodowska-Curie grant agreement No. 778045,
and from Portuguese funds from FCT/MCTES through grant UIDB/04085/2020. J. Almeida acknowledges
Fundação para a Ciência e a Tecnologia and EcoCoRe Doctoral program for her PhD fellowship
PD\BD\135170\2017.
Acknowledgments: The authors acknowledge Carla Rodrigues and Nuno Costa from REQUIMTE for the ICP
and GC-TCD analysis, Olga Paredes from SIMARSUL Grupo Águas de Portugal for the sewage sludge samples
and characterization, and Manuel Pacheco from Panasqueira mine for providing the mining residues. Authors
also thank Adriana Silva for her help with the reactor drawing. This research is anchored by the RESOLUTION
LAB, an infrastructure at NOVA School of Science and Technology.
Conflicts of Interest: The authors declare no conflict of interest.
References.
1. Eurostat Statistics Explained People in the EU-population Projections. Available online:
https://ec.europa.eu/eurostat/statistics-explained/index.php?title=People_in_the_EU_-
_population_projections#Population_projections (accessed on 13 April 2020).
2. European Comission. Communication from the Comission to the European Parliament, the Council, the European
Economic and Social Committee and the Committee of the Regions on the 2017 list of Critical Raw Materials for the
EU; European Comission: Brussels, Belgium, 2017.
3. European Commission. 2030 Climate and Energy Policy Framework; European Commission: Brussels,
Belgium, 2014.
4. Hart, P.S.; Feldman, L. Would it be better to not talk about climate change? The impact of climate change
and air pollution frames on support for regulating power plant emissions. J. Environ. Psychol. 2018, 60, 1–8.
5. European Commission. Communication from the Comission to the European Parliament, the Council, the
European Economic and Social Committee and the Committee of the Regions-Closing the Loop-An EU Action Plan
for the Circular Economy; European Commission: Brussels, Belgium, 2015.
6. Ribeiro, A.B.; Mateus, E.P.; Ottosen, L.M.; Bech-Nielsen, G. Electrodialytic removal of Cu, Cr, and As from
chromated copper arsenate-treated timber waste. Environ. Sci. Technol. 2000, 34, 784–788.
7. Magro, C.C.; Guedes, P.R.; Kirkelund, G.M.; Jensen, P.E.; Ottosen, L.M.; Ribeiro, A.B. Incorporation of
different fly ashes from mswi as substitute for cement in mortar: An overview of the suitability of

Water 2020, 12, 1262 12 of 13
electrodialytic pre-treatment. In Electrokinetics Across Disciplines and Continents; Ribeiro, A.B., Mateus, E.P.,
Couto, N., Eds.; Springer International Publishing: Cham, Switzerland, 2016; pp. 225–247; ISBN
9783319201795.
8. Guedes, P.; Mateus, E.; Almeida, J.; Ferreira, A.; Couto, N.; Ribeiro, A. Electrodialytic treatment of sewage
sludge: Current intensity influence on phosphorus recovery and organic contaminants removal. Chem. Eng.
J. 2016, 306, 1058–1066.
9. Ribeiro, A.B.; Mateus, E.P.; Couto, N. (Eds) Electrokinetics across disciplines and continents: New strategies for
sustainable development; Springer International Publishing: Berlin/Heidelberg, Germany, 2016; 427 p; ISBN
9783319201795.
10. Almeida, J.; Craveiro, R.; Faria, P.; Silva, A.S.; Mateus, E.P.; Barreiros, S.; Paiva, A.; Ribeiro, A.B.
Electrodialytic removal of tungsten and arsenic from secondary mine resources—Deep eutectic solvents
enhancement. Sci. Total Environ. 2020, 710, 136364.
11. Magro, C.; Paz-Garcia, J.M.; Ottosen, L.M.; Mateus, E.P.; Ribeiro, A.B. Sustainability of construction
materials: Electrodialytic technology as a tool for mortars production. J. Hazard. Mater. 2019, 363, 421–427.
12. Ferreira, A.R.; Couto, N.; Guedes, P.; Pinto, J.; Mateus, E.P.; Ribeiro, A.B. Electrodialytic 2-compartment
cells for emerging organic contaminants removal from effluent. J. Hazard. Mater. 2018, 358, 467–474.
13. Kacprzak, M.; Neczaj, E.; Fijałkowski, K.; Grobelak, A.; Grosser, A.; Worwag, M.; Rorat, A.; Brattebo, H.;
Almås, Å.; Singh, B.R. Sewage sludge disposal strategies for sustainable development. Environ. Res. 2017,
156, 39–46.
14. Schmidt, S.; Berghau, W.; Hutten, A. From deposit to concentrate : The basics of tungsten mining Part 1:
Project generation and project development. Int. Tungsten Ind. Assoc. 2012, 4, 1–20.
15. Candeias, C.; Melo, R.; Ávila, P.F.; Ferreira da Silva, E.; Salgueiro, A.R.; Teixeira, J.P. Heavy metal pollution
in mine-soil-plant system in S. Francisco de Assis-Panasqueira mine (Portugal). Appl. Geochem. 2014, 44, 12–
26.
16. Ganiyu, S.O.; Martínez-Huitle, C.A.; Rodrigo, M.A. Renewable energies driven electrochemical
wastewater/soil decontamination technologies: A critical review of fundamental concepts and applications.
Appl. Catal. B Environ. 2020, 270, 118857.
17. Magro, C.; Almeida, J.; Paz-Garcia, J.M.; Mateus, E.P.; Ribeiro, A.B. Exploring hydrogen production for
self-energy generation in electroremediation: A proof of concept. Appl. Energy 2019, 255, 113839.
18. Kappel, A.; Ottosen, L.M.; Kirkelund, G.M. Colour, compressive strength and workability of mortars with
an iron rich sewage sludge ash. Constr. Build. Mater. 2017, 157, 1199–1205.
19. Almeida, J.; Ribeiro, A.B.; Silva, A.S.; Faria, P. Overview of mining residues incorporation in construction
materials and barriers for full-scale application. J. Build. Eng. 2020, 29, 101215.
20. Diário da República. Decreto-Lei n.o 152/2017 de 7 de Dezembro; Diário da República: Lisbon, Portugal,
2017;.
21. Ugilt Sø, H. Adsorption of Arsenic and Phosphate onto the Surface of Calcite as Revealed by Batch Experiments and
Surface Complexation Modelling; Technical University of Denmark: Lyngby, Denmark, 2011.
22. Goreau, T.J.; Larson, R.W.; Campe, J. Geotherapy: Innovative methods of soil fertility restoration, carbon
sequestration, and reversing CO2 increase. Choice Rev. Online 2015, 53, 1302.
23. Petzet, S.; Peplinski, B.; Bodkhe, S.Y.; Cornel, P. Recovery of phosphorus and aluminium from sewage
sludge ash by a new wet chemical elution process (SESAL-Phos-recovery process). Water Sci. Technol. 2011,
64, 693–699.
24. Mackenzie, A.F.; Amer, S.A. Reactions of iron, aluminum and calcium phosphates in six Ontario soils. Plant
Soil 1964, 21, 17–25.
25. Kouzbour, S.; Gourich, B.; Gros, F.; Vial, C.; Allam, F.; Stiriba, Y. Comparative analysis of industrial
processes for cadmium removal from phosphoric acid: A review. Hydrometallurgy 2019, 188, 222–247.
26. Dermatas, D.; Braida, W.; Christodoulatos, C.; Strigul, N.; Panikov, N.; Los, M.; Larson, S. Solubility,
sorption, and soil respiration effects of tungsten and tungsten alloys. Environ. Forensics 2004, 5, 5–13.
27. Wang, S.; Gao, H.; Sun, G.; Li, Y.; Wang, Y.; Liu, H.; Chen, C.; Yang, L. Structure characterization, optical
and photoluminescence properties of scheelite-type CaWO4 nanophosphors: Effects of calcination
temperature and carbon skeleton. Opt. Mater. 2020, 99, 109562.
28. Miyazaki, H.; Nose, A.; Suzuki, H.; Ota, T. Phosphorus solid solution effects of electric and dielectric
properties on sintered WO3 ceramics. J. Ceram. Soc. Jpn. 2011, 8, 650–653.

Water 2020, 12, 1262 13 of 13
29. Anik, M. pH-dependent anodic reaction behavior of tungsten in acidic phosphate solutions. Electrochim.
Acta 2009, 54, 3943–3951.
30. Deltombe, E.; De Zoubov, N.; Pourbaix, M. Tungsten. In Atlas of Electrochemical Equilibria in-Aqueous
Solutions; Pourbaix, M., Ed.; NACE: Houston, TX, USA, 1974; pp. 280–285.
31. Guedes, P.; Couto, N.; Almeida, J.; Rodrigues, A.M.; Mateus, E.P.; Ribeiro, A.B. Electrodialytic treatment of
sewage sludge: Influence on microbiological community. Int. J. Environ. Sci. Technol. 2018, 15, 1103–1112.
32. Rivera, I.; Schröder, U.; Patil, S.A. Microbial electrolysis for biohydrogen production. In Microbial
Electrochemical Technology; Elsevier: Amsterdam, The Netherlands, 2019; pp. 871–898.
33. Li, P.C.H.; Harrison, D.J. Transport, manipulation, and reaction of biological cells on-chip using
electrokinetic effects. Anal. Chem. 1997, 69, 1564–1566.
34. Gill, R.T.; Harbottle, M.J.; Smith, J.W.N.; Thornton, S.F. Electrokinetic-enhanced bioremediation of organic
contaminants: A review of processes and environmental applications. Chemosphere 2014, 107, 31–42.
35. Szumski, M.; Kłodzińska, E.; Buszewski, B. Separation of microorganisms using electromigration
techniques. J. Chromatogr. A 2005, 1084, 186–193.
36. Ebbers, B.; Ottosen, L.M.; Jensen, P.E. Electrodialytic treatment of municipal wastewater and sludge for the
removal of heavy metals and recovery of phosphorus. Electrochim. Acta 2015, 181, 90–99.
37. Salameh, Z. Energy storage. In Renewable Energy System Design; Elsevier: Amsterdam, The Netherlands,
2014; pp. 201–298; ISBN 9780123749918.
38. Staffell, I.; Green, R.; Kendall, K. Cost targets for domestic fuel cell CHP. J. Power Sources 2008, 181, 339–
349.
39. Seo, J.G.; Kwon, J.T.; Kim, J.; Kim, W.S.; Jung, J.T. Impurity effect on proton exchange membrane fuel cell.
In Proceedings of the 2007 International Forum on Strategic Technology; IFOST: Ulsan, Korea; 2007; pp. 484–487.
© 2020 by the authors. Licensee MDPI, Basel, Switzerland. This article is an open access
article distributed under the terms and conditions of the Creative Commons Attribution
(CC BY) license (http://creativecommons.org/licenses/by/4.0/).
![Application Example 09/2016 Exchange of large data volumes ...€¦ · Raw[3] Raw[4] GetTagRawWait Tag Raw R_ID Raw[0] Raw[1] Raw[2] Raw[3] Raw[4] SetTagRawWait. 3 Basic information](https://img.dokumen.tips/doc/110x75/5f1fce0444607025af2e69fc/application-example-092016-exchange-of-large-data-volumes-raw3-raw4-gettagrawwait.jpg)