Embed Size (px)
Citation preview

Electrocoagulation Utility in the Mining and Oil & Gas Industry
Brian Mikelson
Email – [email protected]
Phone – 775 455 5508

© 2015 HALLIBURTON. ALL RIGHTS RESERVED. 2
Agenda
▌Introduce Halliburton Energy Services & Baroid IDP
▌What is Electrocoagulation
▌Optimization Techniques
▌Case Histories

© 2015 HALLIBURTON. ALL RIGHTS RESERVED. 3
▌Secured a global licensing agreement with Water Tectonics in April of 2010.
▌ Technology used in treating wastewater from mining and Oil & Gas activities.

© 2015 HALLIBURTON. ALL RIGHTS RESERVED. 4
Our Technology

© 2015 HALLIBURTON. ALL RIGHTS RESERVED. 5
What is Electrocoagulation?
▌ Electrocoagulation - process utilizing “sacrificed” anodes to form active coagulants which are used to remove pollutants by precipitation in-situ.
▌ “Compared with traditional chemical coagulation, electrocoagulation has, in theory, the advantage of removing the smallest colloidal particles; the smallest charged particles have a greater probability of being coagulated because of the electric field that sets them in motion.” - MF Pouet, 1995
© 2015 HALLIBURTON. ALL RIGHTS RESERVED. 6
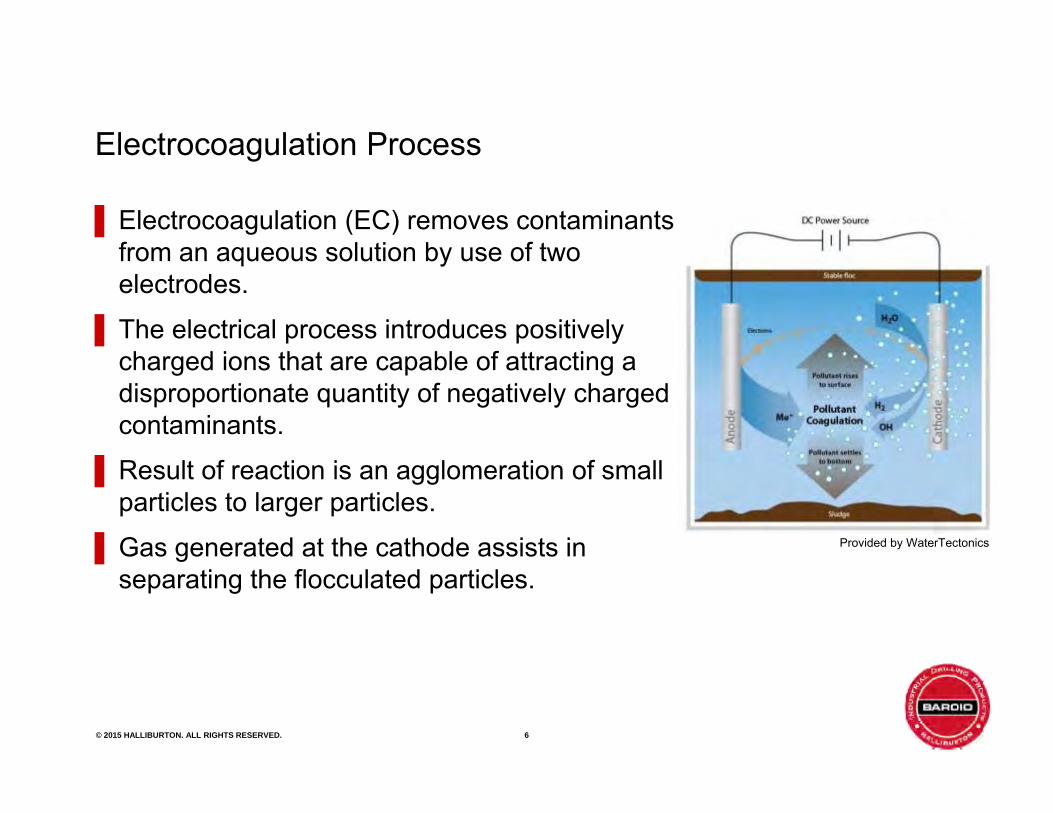
Electrocoagulation Process
▌Electrocoagulation (EC) removes contaminants from an aqueous solution by use of two electrodes.
▌ The electrical process introduces positively charged ions that are capable of attracting a disproportionate quantity of negatively charged contaminants.
▌Result of reaction is an agglomeration of small particles to larger particles.
▌Gas generated at the cathode assists in separating the flocculated particles.
Provided by WaterTectonics

© 2015 HALLIBURTON. ALL RIGHTS RESERVED. 7
EC Chemistry: Iron
The iron released during the electrocoagulation process is more active since it is not tied up ionically with sulfate, chloride or other
anions when added to the solution.

© 2015 HALLIBURTON. ALL RIGHTS RESERVED. 8
EC Cell Architecture
▌ The cells architecture provides the maximum amount of contact surface area and a tortuous path for the fluid to ensure mixing of the coagulants.
▌ The tortuous path of the flow and alternating the anode and cathode help keep the cell “clean” and prolong the cell life.
+ –- +
Provided by WaterTectonics

© 2015 HALLIBURTON. ALL RIGHTS RESERVED. 9Electrocoagulation
Typical EC Target Contaminants
Gravity Separation
Electrocoagulation Makes Particles Larger
Technology and the ContaminantsProvided by WaterTectonics

© 2015 HALLIBURTON. ALL RIGHTS RESERVED. 10
Ion Exchange
Ozone
Mechanical Filtration
Chemicals
UVSIMPLE
Today’s Treatment Technologies
Reverse Osmosis
Ultra Filtration
COMPLEX
Electrocoagulation

© 2015 HALLIBURTON. ALL RIGHTS RESERVED. 11
Advantages of EC
▌High energy reaction creates collisions and forms particles through precipitation and adsorption.
▌Does NOT add aqueous salts to the treated solution. No addition to osmotic loading on downstream processes.
▌ Ionically driven reaction, that, unlike a stoichiometric reaction, consumes 100% of the cation flocculent.
▌Produces less sludge when compared to traditional chemical precipitation.

© 2015 HALLIBURTON. ALL RIGHTS RESERVED. 12
Excellent Good Fair Marginal Inert>95% 70 ‐ 95% 25 ‐70% 10 ‐ 25% <10%
AlkalinityAluminumAntimony
ArsenicBariumCalcium
CadmiumChloride
ChromiumFluoride
IronLead
MagnesiumManganese
MercuryMolybdenum
NickelNitrateNitrite
pHPotassiumSelenium
SilverSilica
SodiumStrontium
SulfateSuspended Solids
Total Dissolved SolidsTurbidityUranium
**pH adjustment and solids separation dependent
Analyte
CleanWave® Removal Efficiency**

© 2015 HALLIBURTON. ALL RIGHTS RESERVED. 13
▌Redox Optimization
In-Situ dissolved oxygen control, if needed
▌CleanWave Electrocoagulation Flocculation
▌ pH adjustment, if needed
▌Compatible with Solids Separation and Media Filtration
Passive settling or mechanical separation
Mineral Media, UF and NF
FlocSeparation
Redox Adjust
CleanWave® EC pH Adjust
Typical Treatment Train with CleanWave® EC
© 2015 HALLIBURTON. ALL RIGHTS RESERVED. 14
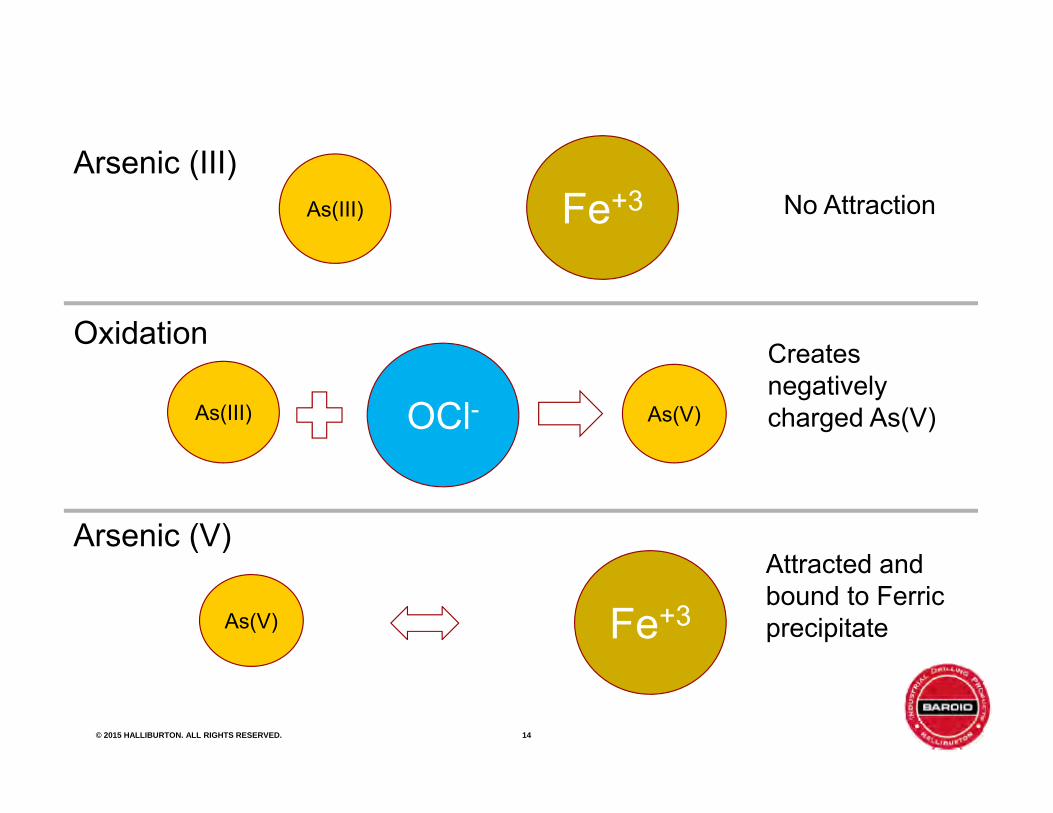
ARSENIC PRECIPITATIONAs(III) Fe+3
Arsenic (III)No Attraction
OCl-
Oxidation
As(III) As(V)
Creates negativelycharged As(V)
Fe+3
Arsenic (V)Attracted and bound to Ferric precipitateAs(V)
© 2015 HALLIBURTON. ALL RIGHTS RESERVED. 15
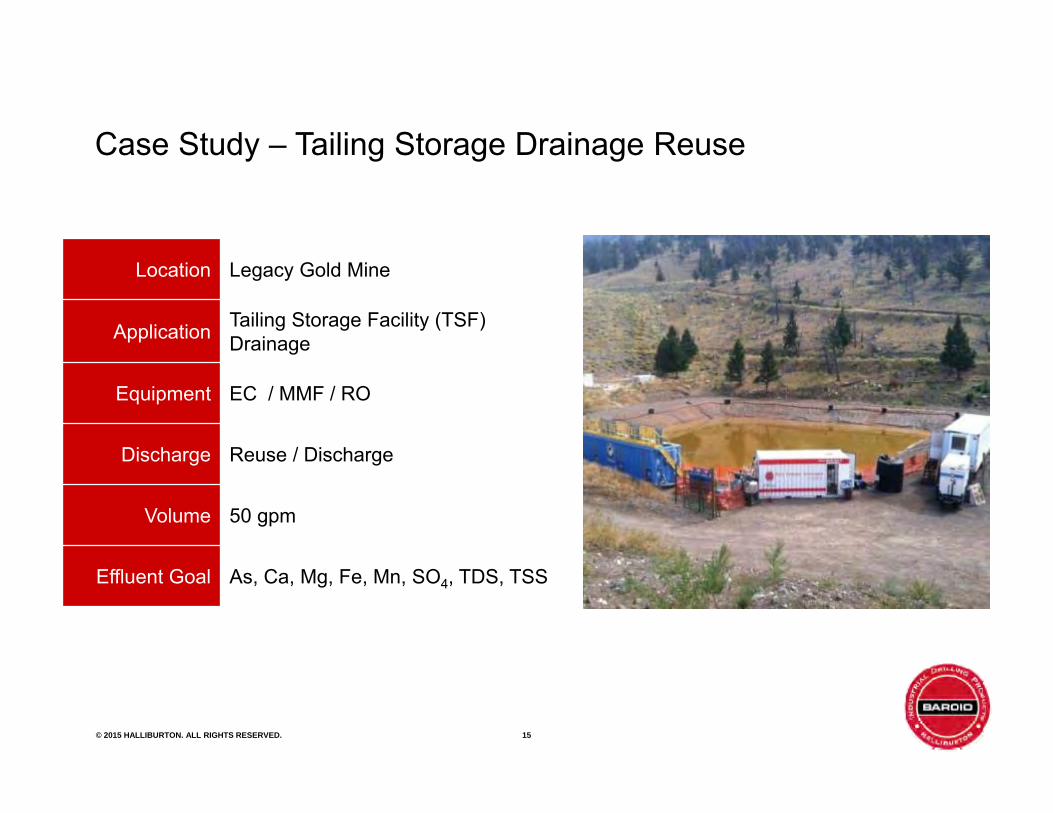
Location Legacy Gold Mine
Application Tailing Storage Facility (TSF) Drainage
Equipment EC / MMF / RO
Discharge Reuse / Discharge
Volume 50 gpm
Effluent Goal As, Ca, Mg, Fe, Mn, SO4, TDS, TSS
Case Study – Tailing Storage Drainage Reuse
© 2015 HALLIBURTON. ALL RIGHTS RESERVED. 16
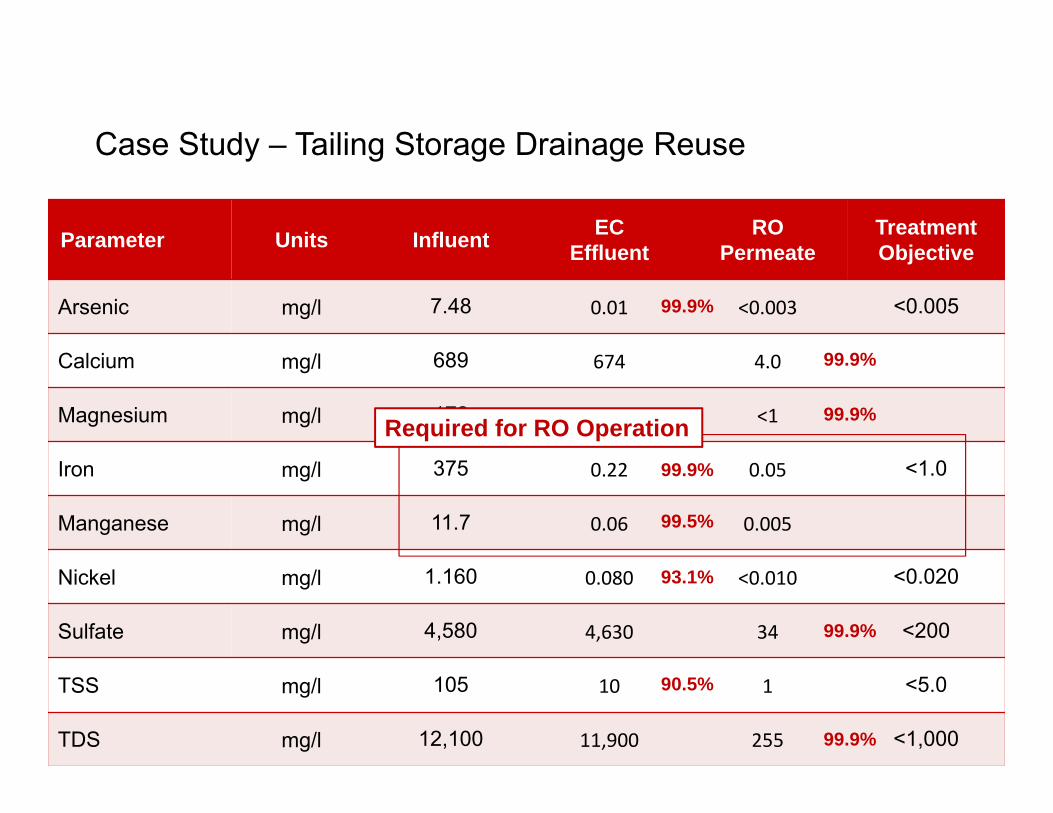
Parameter Units Influent EC Effluent
ROPermeate
Treatment Objective
Arsenic mg/l 7.48 0.01 <0.003 <0.005
Calcium mg/l 689 674 4.0
Magnesium mg/l 172 158 <1
Iron mg/l 375 0.22 0.05 <1.0
Manganese mg/l 11.7 0.06 0.005
Nickel mg/l 1.160 0.080 <0.010 <0.020
Sulfate mg/l 4,580 4,630 34 <200
TSS mg/l 105 10 1 <5.0
TDS mg/l 12,100 11,900 255 <1,000
Case Study – Tailing Storage Drainage Reuse
99.9%
99.9%
99.5%
93.1%
90.5%
99.9%
99.9%
99.9%
99.9%
Required for RO Operation

© 2015 HALLIBURTON. ALL RIGHTS RESERVED. 17
Case Study – Closed Mine/Open Pit
Location Legacy Barite Mine
Application Closed Open Pit MineLake/Drainage
Equipment EC / Clarifier / UF/ RO (and NF)
Discharge Discharge
Volume 550 gpm
Effluent Goal Cu, Pb, Ni, Zn, Ag, Se, SO4, TDS

© 2015 HALLIBURTON. ALL RIGHTS RESERVED. 18
CleanWave Unit

© 2015 HALLIBURTON. ALL RIGHTS RESERVED. 19
1
10
100
1000 Copper
Lead
Nickel
Selenium
Silver
Zinc
TDS
Sulfate
Concen
tration
DischargeStandard By color
Influent Clarifierfeed
UFEffluent
ROEffluent

© 2015 HALLIBURTON. ALL RIGHTS RESERVED. 20

© 2015 HALLIBURTON. ALL RIGHTS RESERVED. 21

© 2015 HALLIBURTON. ALL RIGHTS RESERVED. 22

© 2015 HALLIBURTON. ALL RIGHTS RESERVED. 23
Case Study – Producing Lead Mine
Location Missouri
Application Pb, Zn, Cu, and Cd removal
Equipment EC / UF
Discharge Surface stream
Volume 300 gpm
Effluent Goal
Pb – 11.5 µg/LZn – 160.7 µg/LCu – 49.6 µg/LCd – 0.5 µg/L
Electricity usage – Average $25.33/day- includes 300 GPM CleanWave EC, Ultrafiltration, and all transfer pumps between equipment
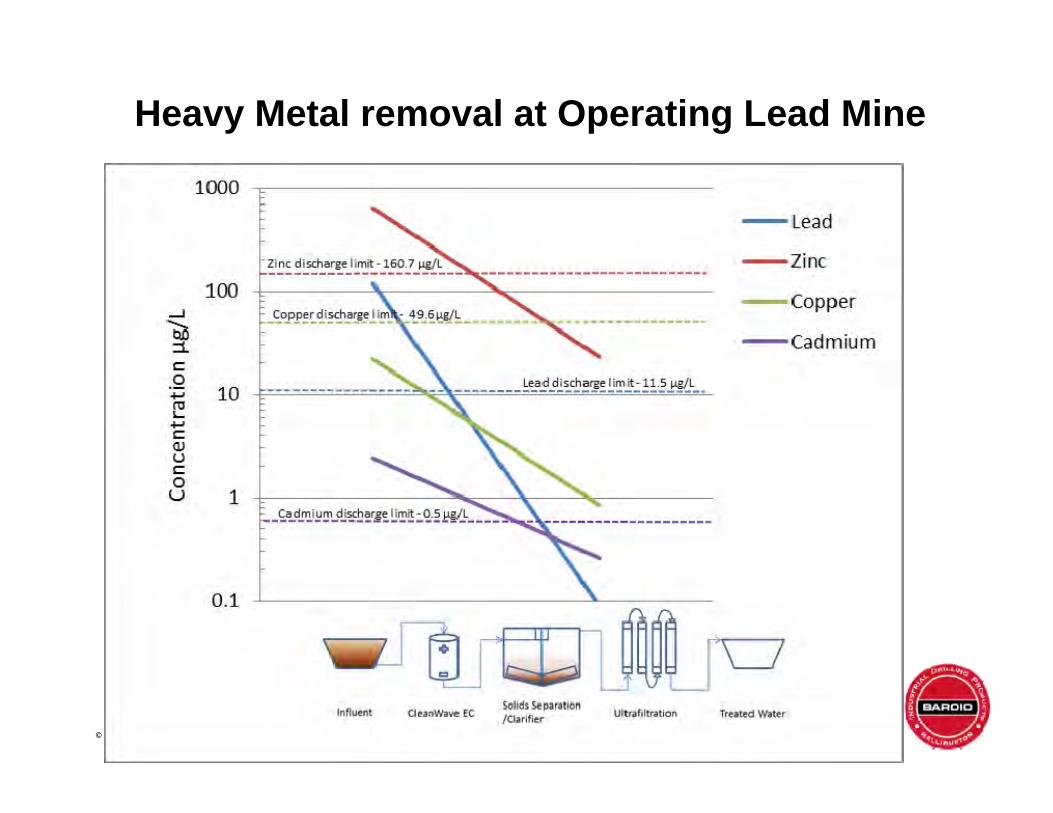
© 2015 HALLIBURTON. ALL RIGHTS RESERVED. 24
Heavy Metal removal at Operating Lead Mine

© 2015 HALLIBURTON. ALL RIGHTS RESERVED. 25
Case Study – Former Lead Smelter
Location Missouri
Application Pb, Zn, Cu, CD, As, Tl, and Sb removal
Equipment EC / UF / GAC
Discharge River
Volume 100 gpm
Effluent Goal
Pb – 1.26 lb/dayZn – 3.73 lb/dayCu – 1.4 lb/dayCd – 0.61 lb/dayAs – 1.69 lb/dayTl – report onlySb – report only

© 2015 HALLIBURTON. ALL RIGHTS RESERVED. 26
Heavy Metal Removal from Lead Smelter
© 2015 HALLIBURTON. ALL RIGHTS RESERVED. 27
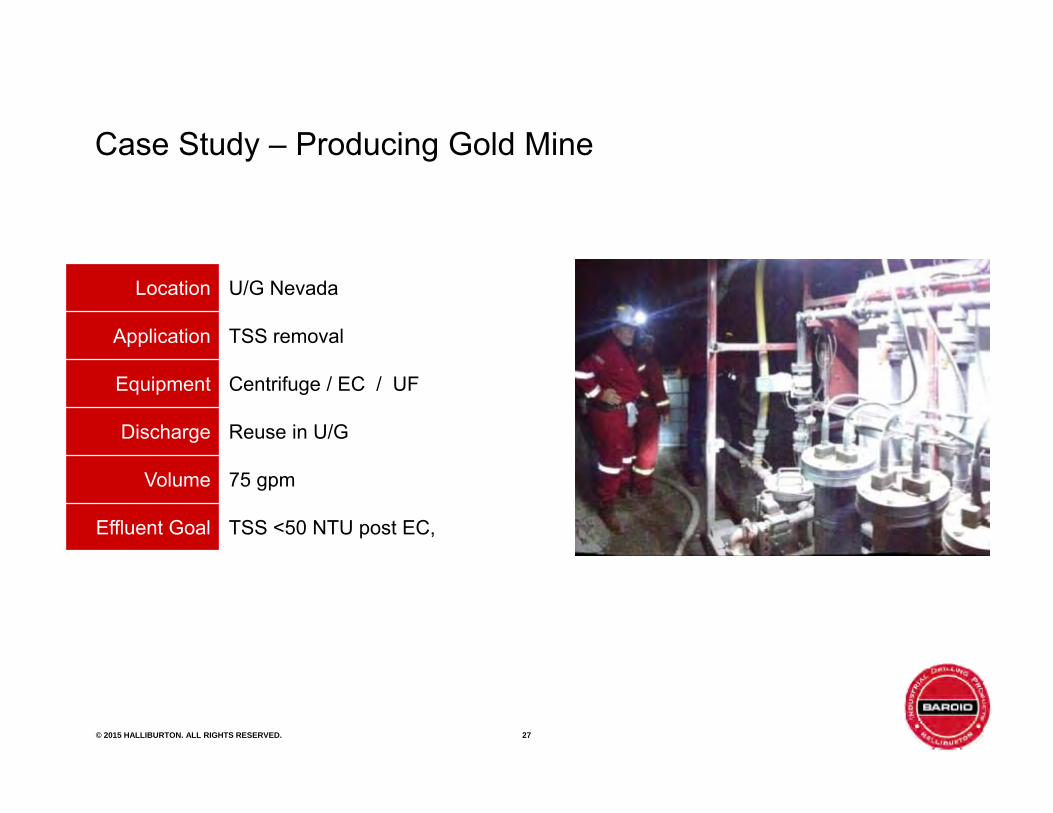
Case Study – Producing Gold Mine
Location U/G Nevada
Application TSS removal
Equipment Centrifuge / EC / UF
Discharge Reuse in U/G
Volume 75 gpm
Effluent Goal TSS <50 NTU post EC,

© 2015 HALLIBURTON. ALL RIGHTS RESERVED. 28
▌Other considerations:
Permitting if water goes to surface
Improve water quality to surface WTP (MF/RO)
Ore recovery from dewatered slimes
TSS (mg/L)
Date Influent Post CleanWave® Post UF
12-15-14 80 36 9.312-18-14 19,900 147 7.212-19-14 2,400 63 10.7
© 2015 HALLIBURTON. ALL RIGHTS RESERVED. 29
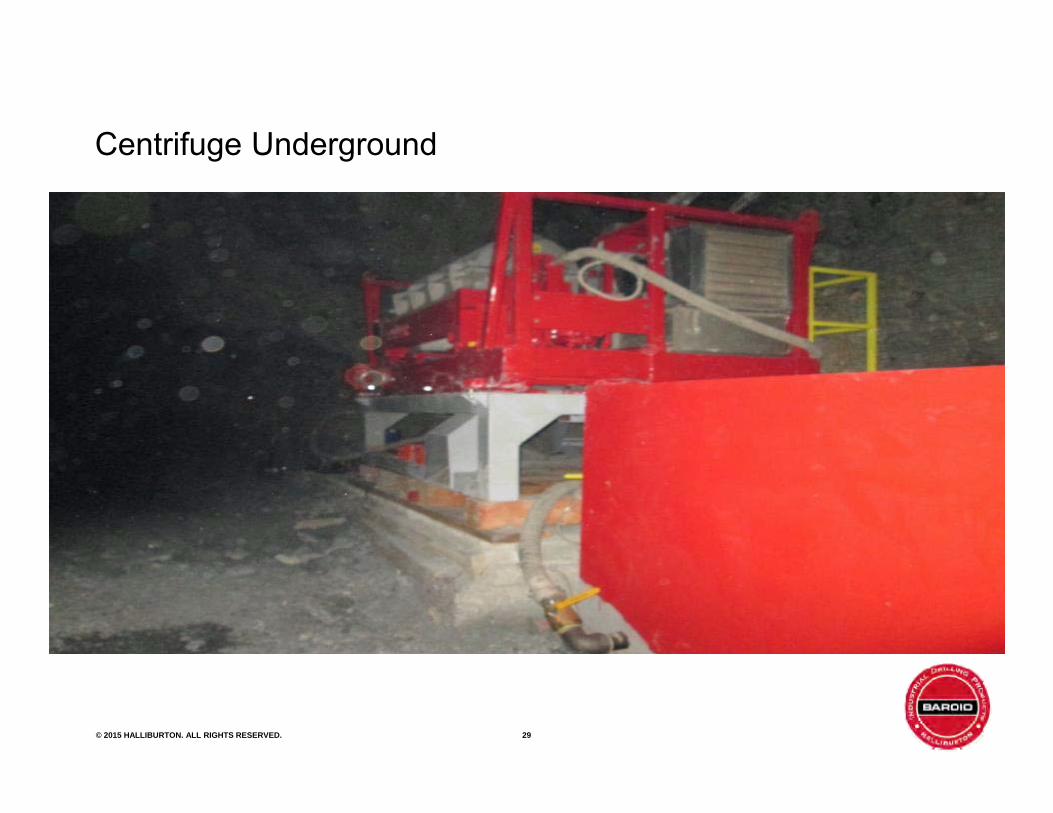
Centrifuge Underground

© 2015 HALLIBURTON. ALL RIGHTS RESERVED. 30
Centrifuge separating solids

© 2015 HALLIBURTON. ALL RIGHTS RESERVED. 31
EC Underground

© 2015 HALLIBURTON. ALL RIGHTS RESERVED. 32
Treatment Opportunities with CleanWave® EC
▌U/G
Clarification (turbidity) for reuse U/G
Permitting friendly pre-treatment for membrane processing
▌Mobil metals and solids pre-treatment
Closure
Dewatering
AMD applications
▌Pretreatment for existing membrane
▌ Incorporating EC into comprehensive treatment strategy
© 2015 HALLIBURTON. ALL RIGHTS RESERVED. 33
0
20
40
60
80
100
120
140
0 1000 2000 3000 4000 5000 6000 7000
KW
Per
100
0 G
PM (E
C O
nly)
Conductivity (uS)
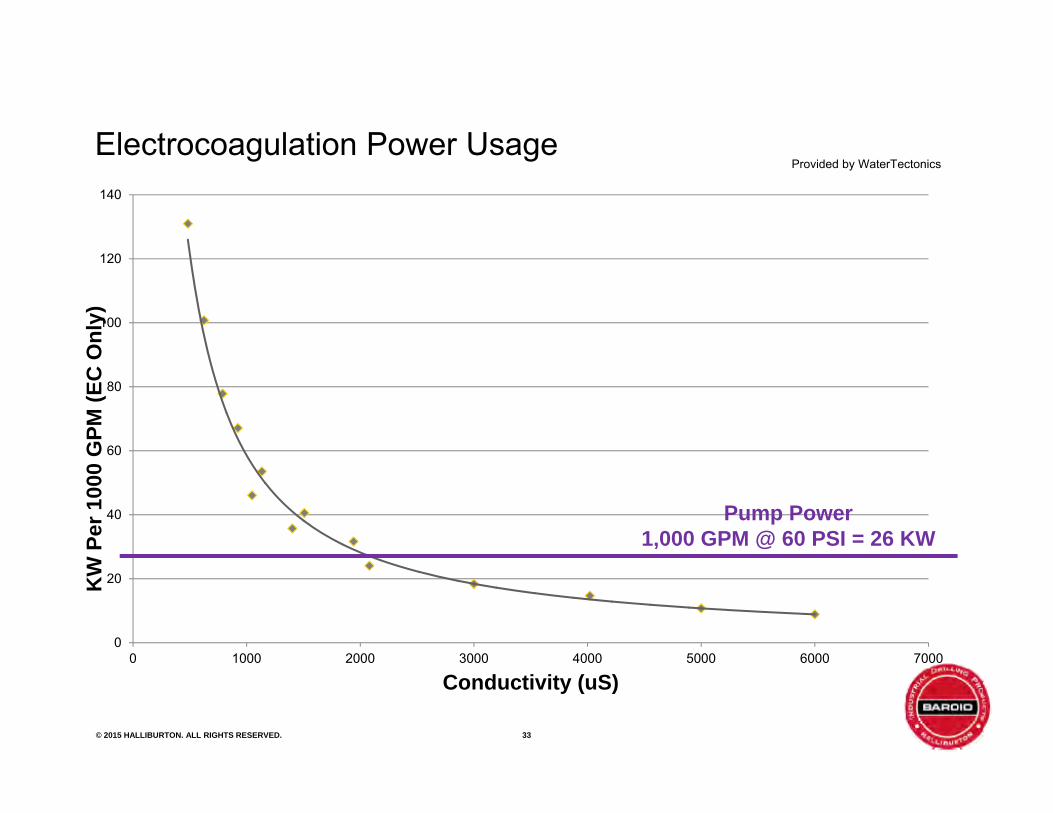
Pump Power1,000 GPM @ 60 PSI = 26 KW
Electrocoagulation Power UsageProvided by WaterTectonics

© 2015 HALLIBURTON. ALL RIGHTS RESERVED. 34
CleanWave® EC Pre-treatment Equipment: Automated, Scalable and Mobile

© 2015 HALLIBURTON. ALL RIGHTS RESERVED. 35
Lab Bench Testing and Field Confirmation
▌ Lab-based solutions
▌Commissioning report
Water performance targets
Solids characterization
OPEX estimates
▌Process design
▌Rental vs. CAPEX/OPEX

© 2015 HALLIBURTON. ALL RIGHTS RESERVED. 36
Questions and Discussion