Embed Size (px)
Citation preview
7/21/2019 Electrochemical Synthesis of Silver Nanoparticles
http://slidepdf.com/reader/full/electrochemical-synthesis-of-silver-nanoparticles 1/6
Electrochemical Synthesis of Silver Nanoparticles
L. Rodrıguez-Sanchez,* M. C. Blanco, and M. A. Lopez-Quintela
Department of Physical Chemistry, UniV ersity of Santiago de Compostela, E-15706 Santiago de Compostela, Spain
ReceiV ed: May 11, 2000; In Final Form: July 21, 2000
An electrochemical procedure, based on the dissolution of a metallic anode in an aprotic solvent, has beenused to obtain silver nanoparticles ranging from 2 to 7 nm. By changing the current density, it is possible toobtain different silver particle sizes. The influence of the different electrochemical parameters on the finalsize was studied by using different kinds of counter electrodes. The effect of oxygen presence in the reactionmedium as well as the type of particle stabilizer employed have also been investigated. In some conditionsan oscillatory behavior is observed. Characterization of particles was carried out by TEM and UV-visspectroscopy. The maximum and the bandwidth of the plasmon band are both strongly dependent on the sizeand interactions with the surrounding medium. The presence of different silver clusters was detected by UV-vis spectroscopy. By using this technique, the existence of an autocatalytic step in the synthesis mechanismis proposed.
1. Introduction
Metal small particles have received increasing attention inthe last years.1,2 These particles are usually prepared by chemicalreduction of metal salts3. Reetz et al.4 have described anelectrochemical procedure to obtain particles in which a metalsheet is anodically dissolved and the intermediate metal saltformed is reduced at the cathode, giving rise to metallic particlesstabilized by tetraalkylammonium salts. Some of the advantagesof this method are the high purity of the particles and thepossibility of a precise particle-size control achieved by adjustingthe current density. The primary aim of this work is to adjustthe general scheme to the synthesis of silver nanoparticles. Forthe optimization, it is necessary to take into account thefollowing parameters: the choice of the right solvent, supportingelectrolyte, type of electrode, and the current density. It is well-known that colloidal dispersions of metals exhibit absorptionbands in the UV-vis region, due to collective excitations of the free electrons (surface plasmon band).5 Optical propertiesof clusters have been investigated for many years.6 For a singlecluster, the width and position of the plasmon modes areinfluenced by the shape, volume, and surface/interface effects.In many cluster samples, interactions between clusters and thesurrounding media, due to the presence of stabilizers or to theexistence of cluster size or shape distributions, made theunderstanding of the optical behavior difficult.7 Charge transferfrom/toward the ligands may change the electron density, andlead to blue or red shifts of the plasmon resonance band.Henglein and co-workers8 have demonstrated the influence of redox reactions upon the position when reduction or oxidationtake place, showing blue and red shift, respectively.
In the present work, the optical properties of the obtainedsilver colloids are correlated with the silver particle size. Theevolution of the optical properties has been used for theunderstanding of some kinetic aspects of the synthesis mech-anism.
2. Experimental Section
All chemicals were of analytical grade and used withoutfurther purification: H2SO4 from Merck, tetrabutylammoniumbromide (TBABr) and acetate (TBAAcO) from Aldrich, alu-minum oxide, alpha; 99.99%, 1.0 µm from Alfa, were employed.
An Autolab PGSTAT 20 potentiostat was used both in thesynthesis and the electrochemical study. Temperature was keptat 25 ( 0.1 °C using a Grant thermostatic bath. All potentialswere measured against Ag/AgCl reference electrode. Theexperiments were carried out in a standard Metrohm electrolysisbeaker containing a sacrificial silver sheet as anode (counterelectrode), and the same size platinum sheet was used as cathode(working electrode). These two electrodes were vertically placed
face-to-face inside the cell. Platinum electrode was hand-polished with 1 µm alumina powder to a mirror-like finish.Then, the electrode was activated by triangular potential cyclingbetween 1.35 and -0.15 V, at a scan rate of 500 mV s-1 for 5min in 1.0 M H2SO4. Before each experiment, the silverelectrode was hand polished by fine grade emery paper andwashed with bidistillated water and a small amount of acetone.The electrolyte solution consisting of tetrabutylammoniumbromide 0.1 M dissolved in acetonitrile was deaerated bybubbling nitrogen for about 15 min, keeping an inert atmosphereduring the whole process. A freshly prepared dissolution wasused in each experiment. Strong stirring was kept during thegalvanostatic electrolysis.
TEM measurements were performed on a transmissionelectron microscope JEOL 2000, working at 200 kV andequipped with an EDXA detector. Samples were prepared byadding acetonitrile to a fraction of the obtained sol, and a dropletof it was placed on a carbon-coated copper grid covered withan acetatecellulose polymer. Silver particle formation wasconfirmed by dispersive X-ray energy analysis. Size data wereaveraged over 100-200 particles from different TEM micro-graphs
To obtain the absorption spectra, ultracentrifugation of thesol at 10000 rpm, for 10 min in a Sigma 2-15 ultra-centrifuge,was carried out to make faster the sedimentation process of the
* Author to whom correspondence should be addressed. Fax: 00 34 81595 012. E-mail: [email protected].
9683 J. Phys. Chem. B 2000, 104, 9683-9688
10.1021/jp001761r CCC: $19.00 © 2000 American Chemical SocietyPublished on Web 09/23/2000
7/21/2019 Electrochemical Synthesis of Silver Nanoparticles
http://slidepdf.com/reader/full/electrochemical-synthesis-of-silver-nanoparticles 2/6
particle aggregates, which are always present during the particlesynthesis. Spectra from the supernatant were recorded on adiode-array Hewlett-Packard HP8452 spectrophotometer in 1cm light path length cuvettes.
3. Results and Discussion
Optimization of Synthesis Variables. (1) SolV ent and
Supporting Electrolyte. Although the solvent proposed in themethod described by Reetz et al.4 was a mixture of acetonitrileand tetrahydrofurane, this mixture was found unsuitable for thesilver synthesis, because the presence of tetrahydrofuraneinduces the aggregation of the metal particles obtained, whichcan be detected by the blue color of the solution. The samecolor was found when silver colloidal particles are agglomeratedin the presence of hydrogen peroxide.9,10 For this reason, pureacetonitrile was used as solvent. Its aprotic character is necessarybecause when protons are in the medium, passivation of thesilver anode occurs, and the synthesis cannot take place.
It is necessary to have a supporting electrolyte as well as astabilizer of the particles in the medium. When synthesis iscarried out in 0.1 M NaClO4 (a supporting electrolyte recom-mended in electrochemical literature when acetonitrile is the
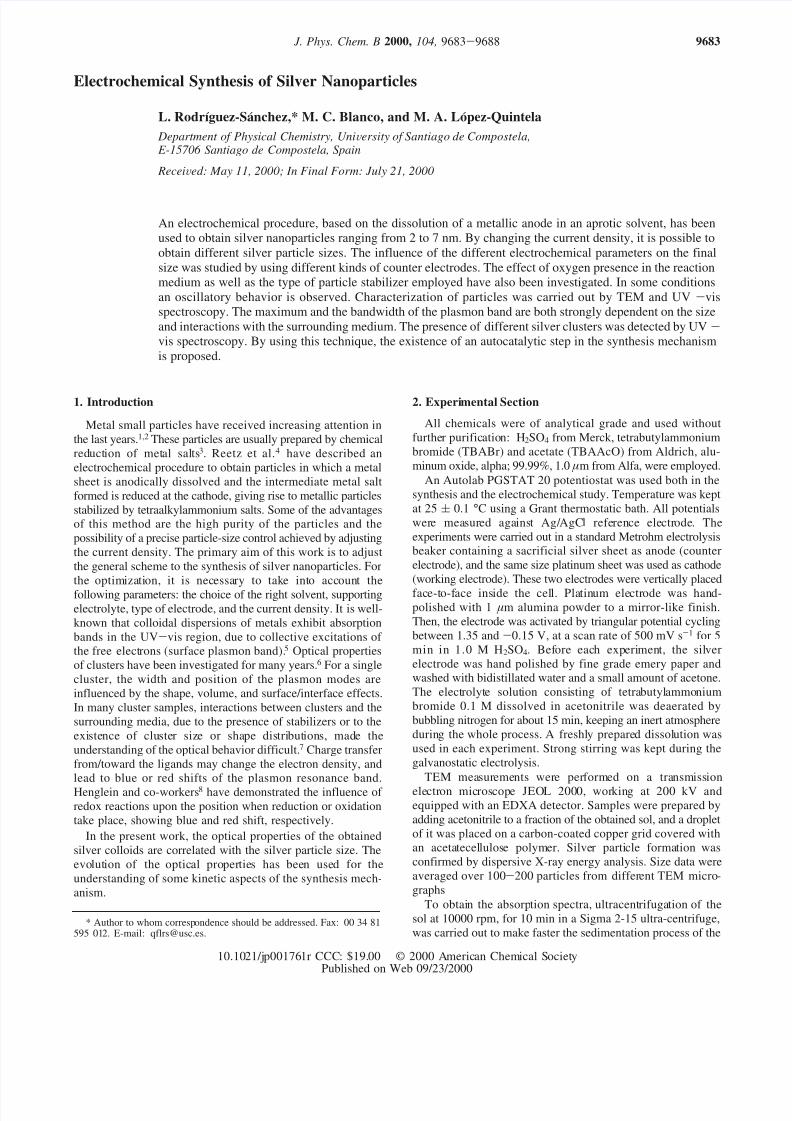
solvent), no particles are obtained; the electroreduction producessilver deposition on the cathode. By using tetrabutylammoniumbromide or acetate, which act as supporting electrolytes and asstabilizers, silver nanoparticles are obtained. Cyclic voltamme-tries of these two salts were recorded. As it can be seen in Figure1a, both salts are electrochemically inert in the range 0.8-1.8V. The processes that occur at higher and lower potentials arethe following:
The solvent must be oxygen free, to avoid the oxidation of thesmall metal particles produced; but this is not the only reason:in silver reduction, oxygen interferes with the electrochemicalprocess. Figure 1b shows the potential evolution when asupporting electrolyte 0.1 M tetrabutylammonium bromide isused, the solution initially deoxygenated without keeping theinert atmosphere during the electrolysis. In the beginning, thesynthesis occurs at -2.75 V but as the time goes by (about1000 s), oscillations in the potential can be observed, and finally(about 2200 s) the potential is not high enough to let the silverreduction take place and no particles are obtained. Figure 1cdisplays linear voltammetries of the system, using two platinumelectrodes, in the presence of different amounts of O2. The
presence of a reduction peak about -1.5 V, shows clearly theoxygen reduction at this potential, therefore the oscillations inthe potential can be attributed to the diffusion of small amountsof O2 from the atmosphere into the solution. The oscillatorybehavior disappears when tetrabutylammonium acetate is em-ployed, which clearly shows a participation of bromide in thisoscillatory phenomenon.
It is also observed that the solution becomes slightly yellowas the synthesis takes place at any of the current densitiesemployed. This also happens when silver is not in the medium.Figure 2 shows the spectrum of the bromide salt solution afterelectrolysis using platinum electrodes, under the same experi-mental synthesis conditions. A wide absorption band, attributedto the anodic formation of Br2, at 364 nm is evident. Taking
into account that the silver plasmon band appears at about 400nm, this secondary reaction is undesirable for any spectroscopicstudy of silver particles. For this reason, acetate salt wasemployed in this work.
A typical synthesis of silver nanoparticles is carried out inacetonitrile using 0.1 M tetrabutylammonium acetate. Underthese conditions, upon applying the current, the electrolyte
Anodic potentials: Cathodic potentials:
(1) 2 CH3CO2-f 2 CH3CO2
‚+ 2 e- NBu4
++ 1e-f NBu3 + Bu‚
(2) Br-f Br‚ + 1 e-
2 Br‚ f Br2Figure 1. A) Linear voltammetries of supporting electrolytes using
Pt electrodes. B) Potential variation with time in TBA bromide 0.1 M,without inert atmosphere. Working electrode: Pt, Counter electrode:Ag. Current density: -1.25 mA cm-2. C) Linear voltammetries usingPt electrodes in TBA bromide 0.1 M. (A) O2 free. Bubbling O2: (B)10 s. (C) 15 s.
Figure 2. Spectrum of tetrabutylammonium bromide after Br2
electrolysis at current density of -3 mA cm-2.
9684 J. Phys. Chem. B, Vol. 104, No. 41, 2000 Rodrıguez-Sanchez et al.
7/21/2019 Electrochemical Synthesis of Silver Nanoparticles
http://slidepdf.com/reader/full/electrochemical-synthesis-of-silver-nanoparticles 3/6
becomes dark yellow and as the reduction process goes on, ablack precipitate is formed. This precipitate can be redispersedby dilution with acetonitrile and the dark yellow color reappears.Therefore, this color change can be explained because, whenthe concentration of silver colloidal particles is too high,interactions between the stabilizer chains increase and floccula-tion takes place. These flocculated particles can be redispersedagain when enough solvent is added.
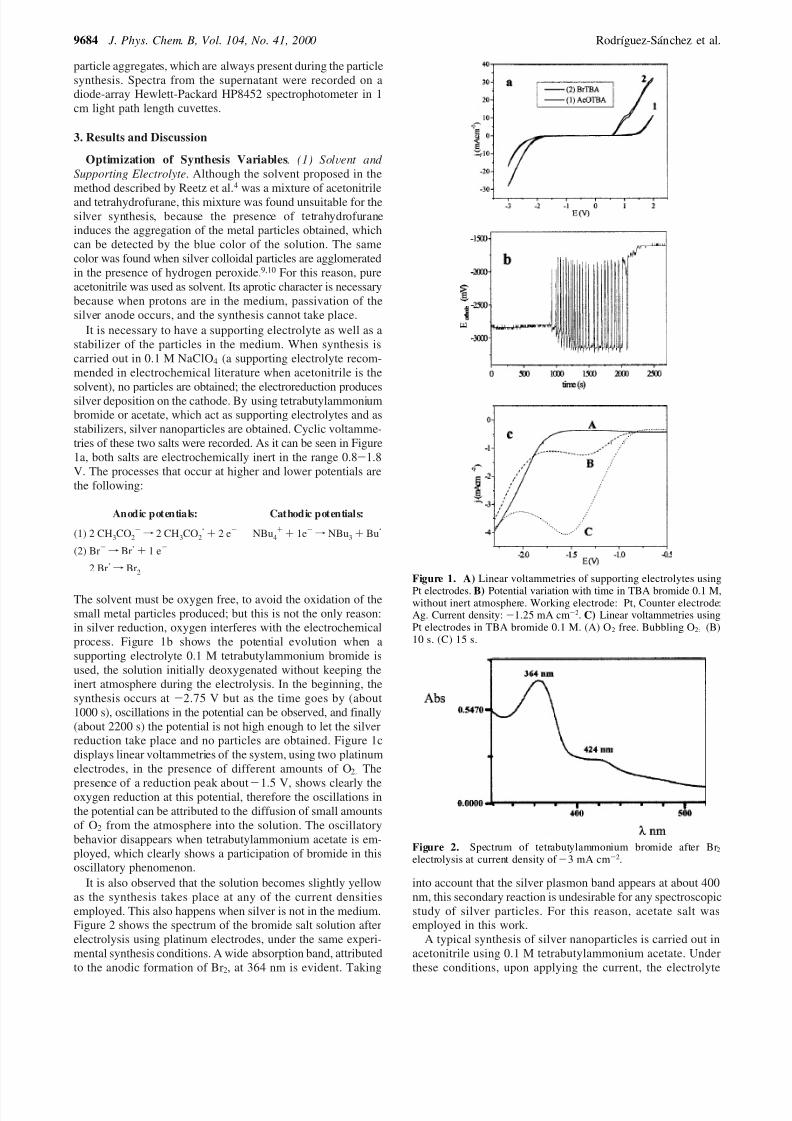
(2) Current Density and Type of Electrode. Table 1 showsthe reduction products obtained in different conditions, employ-ing platinum or aluminum as cathode. The morphology of the
cathodic deposits obtained using platinum as cathode at differentcurrent densities is shown in Figure 3. These results are inaccordance with other results already reported in the literature:11,12,13 when the growth of a new phase takes place close to thethermodynamic equilibrium (low current densities), a rathercompact phase is formed. Conversely, when the growth condi-tions are far from equilibrium (high current densities), irregularaggregates may be formed. The study of these parameters showsthe existence of a competition between two different cathodesurface processes that are summarized in Figure 4: the particleformation, by reduction and stabilization of silver ions by thetetrabutylammonium salt, and the film deposition at the cathodesurface (see Table 1). This second process limits the yield of the particle synthesis, and must be minimized, because when
the electrode surface is totally covered by silver deposition, theonly process that occurs is the silver deposition. Table 2 showsthe crystallographic characteristics and atomic radius of silverand the different materials employed. The similarity betweensilver and aluminum may explain the high tendency to the silverdeposition on aluminum and the fact that, in this case, noparticles are obtained. On the contrary, the difference in radiusand lattice parameters for platinum and silver leads mainly toparticle formation.
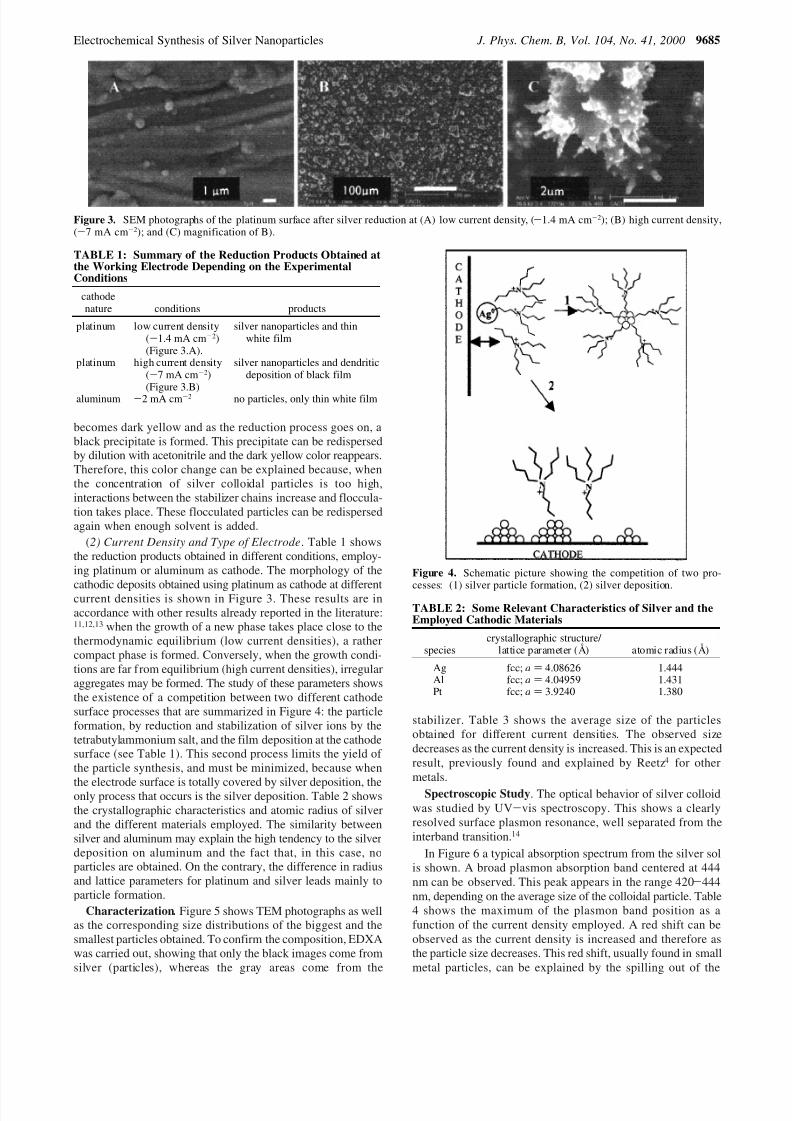
Characterization . Figure 5 shows TEM photographs as wellas the corresponding size distributions of the biggest and thesmallest particles obtained. To confirm the composition, EDXAwas carried out, showing that only the black images come fromsilver (particles), whereas the gray areas come from the
stabilizer. Table 3 shows the average size of the particlesobtained for different current densities. The observed sizedecreases as the current density is increased. This is an expectedresult, previously found and explained by Reetz4 for othermetals.
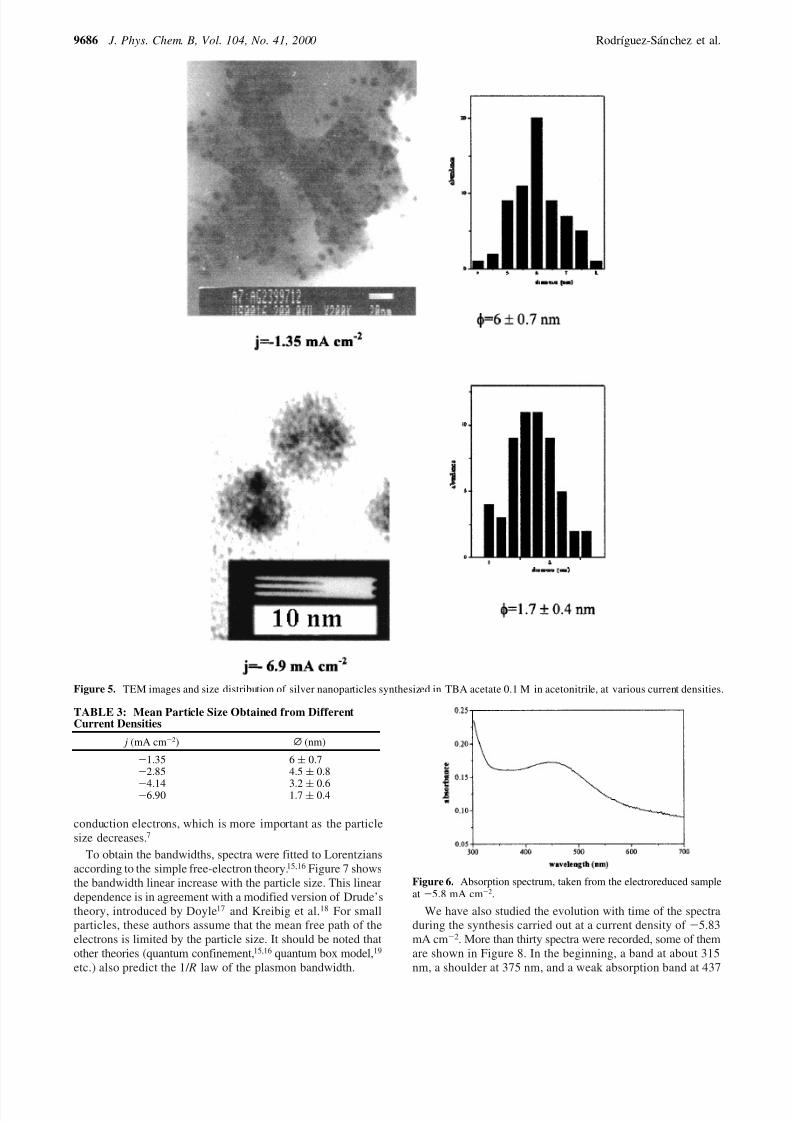
Spectroscopic Study. The optical behavior of silver colloidwas studied by UV-vis spectroscopy. This shows a clearlyresolved surface plasmon resonance, well separated from theinterband transition.14
In Figure 6 a typical absorption spectrum from the silver solis shown. A broad plasmon absorption band centered at 444nm can be observed. This peak appears in the range 420-444nm, depending on the average size of the colloidal particle. Table4 shows the maximum of the plasmon band position as afunction of the current density employed. A red shift can beobserved as the current density is increased and therefore asthe particle size decreases. This red shift, usually found in smallmetal particles, can be explained by the spilling out of the
Figure 3. SEM photographs of the platinum surface after silver reduction at (A) low current density, (-1.4 mA cm-2); (B) high current density,(-7 mA cm-2); and (C) magnification of B).
TABLE 1: Summary of the Reduction Products Obtained atthe Working Electrode Depending on the ExperimentalConditions
cathodenature conditions products
platinum low current density(-1.4 mA cm-2)(Figure 3.A).
silver nanoparticles and thinwhite film
platinum high current density(-7 mA cm-2)(Figure 3.B)
silver nanoparticles and dendriticdeposition of black film
aluminum -2 mA cm-2 no particles, only thin white film
Figure 4. Schematic picture showing the competition of two pro-
cesses: (1) silver particle formation, (2) silver deposition.TABLE 2: Some Relevant Characteristics of Silver and theEmployed Cathodic Materials
speciescrystallographic structure/
lattice parameter (Å) atomic radius (Å)
Ag fcc; a ) 4.08626 1.444Al fcc; a ) 4.04959 1.431Pt fcc; a ) 3.9240 1.380
Electrochemical Synthesis of Silver Nanoparticles J. Phys. Chem. B, Vol. 104, No. 41, 2000 9685
7/21/2019 Electrochemical Synthesis of Silver Nanoparticles
http://slidepdf.com/reader/full/electrochemical-synthesis-of-silver-nanoparticles 4/6
conduction electrons, which is more important as the particlesize decreases.7
To obtain the bandwidths, spectra were fitted to Lorentziansaccording to the simple free-electron theory.15,16 Figure 7 showsthe bandwidth linear increase with the particle size. This lineardependence is in agreement with a modified version of Drude’stheory, introduced by Doyle17 and Kreibig et al.18 For smallparticles, these authors assume that the mean free path of theelectrons is limited by the particle size. It should be noted thatother theories (quantum confinement,15,16 quantum box model,19
etc.) also predict the 1/ R law of the plasmon bandwidth.
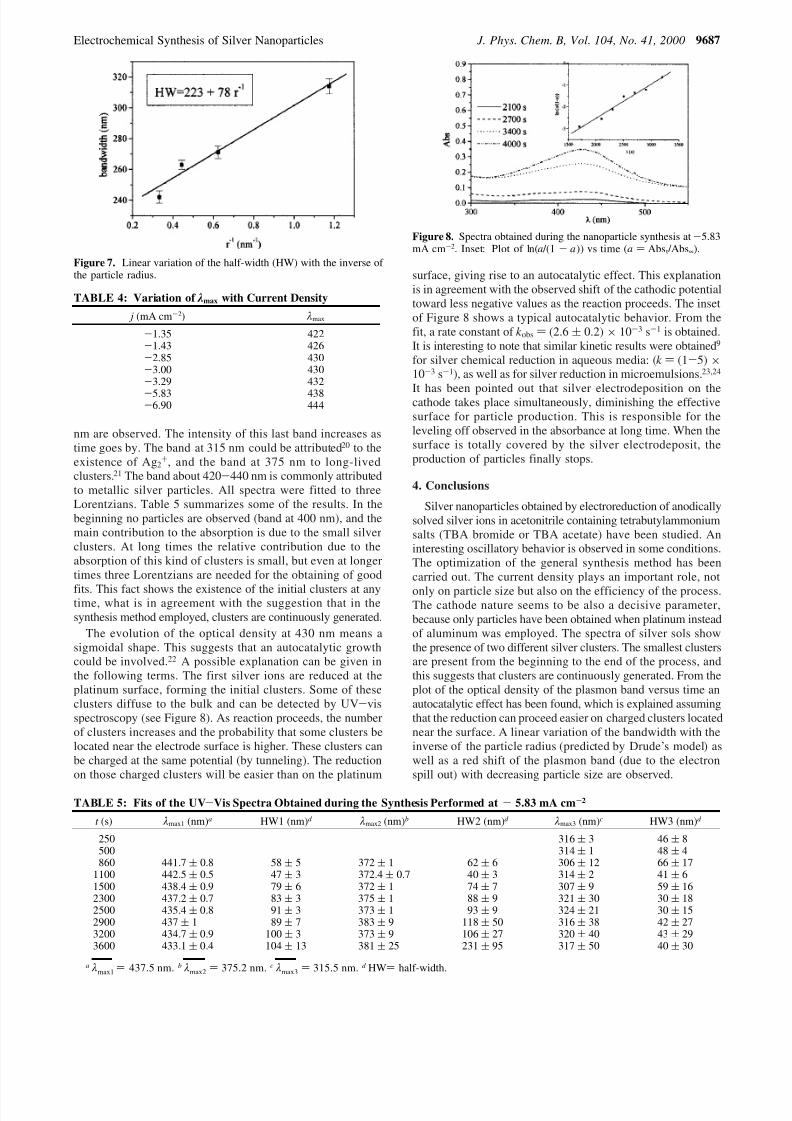
We have also studied the evolution with time of the spectraduring the synthesis carried out at a current density of -5.83mA cm-2. More than thirty spectra were recorded, some of themare shown in Figure 8. In the beginning, a band at about 315nm, a shoulder at 375 nm, and a weak absorption band at 437
Figure 5. TEM images and size distribution of silver nanoparticles synthesized in TBA acetate 0.1 M in acetonitrile, at various current densities.
TABLE 3: Mean Particle Size Obtained from DifferentCurrent Densities
j (mA cm-2) L (nm)
-1.35 6 ( 0.7-2.85 4.5 ( 0.8
-4.14 3.2 ( 0.6-6.90 1.7 ( 0.4
Figure 6. Absorption spectrum, taken from the electroreduced sampleat -5.8 mA cm-2.
9686 J. Phys. Chem. B, Vol. 104, No. 41, 2000 Rodrıguez-Sanchez et al.
7/21/2019 Electrochemical Synthesis of Silver Nanoparticles
http://slidepdf.com/reader/full/electrochemical-synthesis-of-silver-nanoparticles 5/6
nm are observed. The intensity of this last band increases astime goes by. The band at 315 nm could be attributed20 to theexistence of Ag2
+, and the band at 375 nm to long-livedclusters.21 The band about 420-440 nm is commonly attributedto metallic silver particles. All spectra were fitted to threeLorentzians. Table 5 summarizes some of the results. In thebeginning no particles are observed (band at 400 nm), and themain contribution to the absorption is due to the small silverclusters. At long times the relative contribution due to theabsorption of this kind of clusters is small, but even at longertimes three Lorentzians are needed for the obtaining of good
fits. This fact shows the existence of the initial clusters at anytime, what is in agreement with the suggestion that in thesynthesis method employed, clusters are continuously generated.
The evolution of the optical density at 430 nm means asigmoidal shape. This suggests that an autocatalytic growthcould be involved.22 A possible explanation can be given inthe following terms. The first silver ions are reduced at theplatinum surface, forming the initial clusters. Some of theseclusters diffuse to the bulk and can be detected by UV-visspectroscopy (see Figure 8). As reaction proceeds, the numberof clusters increases and the probability that some clusters belocated near the electrode surface is higher. These clusters canbe charged at the same potential (by tunneling). The reductionon those charged clusters will be easier than on the platinum
surface, giving rise to an autocatalytic effect. This explanationis in agreement with the observed shift of the cathodic potentialtoward less negative values as the reaction proceeds. The insetof Figure 8 shows a typical autocatalytic behavior. From thefit, a rate constant of k obs ) (2.6 ( 0.2) × 10-3 s-1 is obtained.It is interesting to note that similar kinetic results were obtained9
for silver chemical reduction in aqueous media: (k ) (1-5) ×10-3 s-1), as well as for silver reduction in microemulsions.23,24
It has been pointed out that silver electrodeposition on thecathode takes place simultaneously, diminishing the effectivesurface for particle production. This is responsible for theleveling off observed in the absorbance at long time. When thesurface is totally covered by the silver electrodeposit, theproduction of particles finally stops.
4. Conclusions
Silver nanoparticles obtained by electroreduction of anodicallysolved silver ions in acetonitrile containing tetrabutylammoniumsalts (TBA bromide or TBA acetate) have been studied. Aninteresting oscillatory behavior is observed in some conditions.The optimization of the general synthesis method has beencarried out. The current density plays an important role, not
only on particle size but also on the efficiency of the process.The cathode nature seems to be also a decisive parameter,because only particles have been obtained when platinum insteadof aluminum was employed. The spectra of silver sols showthe presence of two different silver clusters. The smallest clustersare present from the beginning to the end of the process, andthis suggests that clusters are continuously generated. From theplot of the optical density of the plasmon band versus time anautocatalytic effect has been found, which is explained assumingthat the reduction can proceed easier on charged clusters locatednear the surface. A linear variation of the bandwidth with theinverse of the particle radius (predicted by Drude’s model) aswell as a red shift of the plasmon band (due to the electronspill out) with decreasing particle size are observed.
Figure 7. Linear variation of the half-width (HW) with the inverse of the particle radius.
TABLE 4: Variation of λmax with Current Density
j (mA cm-2) λmax
-1.35 422-1.43 426-2.85 430-3.00 430-3.29 432-5.83 438-6.90 444
TABLE 5: Fits of the UV-Vis Spectra Obtained during the Synthesis Performed at - 5.83 mA cm-2
t (s) λmax1 (nm)a HW1 (nm)d λmax2 (nm)b HW2 (nm)d λmax3 (nm)c HW3 (nm)d
250 316 ( 3 46 ( 8500 314 ( 1 48 ( 4860 441.7 ( 0.8 58 ( 5 372 ( 1 62 ( 6 306 ( 12 66 ( 17
1100 442.5 ( 0.5 47 ( 3 372.4 ( 0.7 40 ( 3 314 ( 2 41 ( 61500 438.4 ( 0.9 79 ( 6 372 ( 1 74 ( 7 307 ( 9 59 ( 162300 437.2 ( 0.7 83 ( 3 375 ( 1 88 ( 9 321 ( 30 30 ( 182500 435.4 ( 0.8 91 ( 3 373 ( 1 93 ( 9 324 ( 21 30 ( 152900 437 ( 1 89 ( 7 383 ( 9 118 ( 50 316 ( 38 42 ( 273200 434.7 ( 0.9 100 ( 3 373 ( 9 106 ( 27 320 ( 40 43 ( 293600 433.1 ( 0.4 104 ( 13 381 ( 25 231 ( 95 317 ( 50 40 ( 30
a λmax1 ) 437.5 nm. b λmax2 ) 375.2 nm. c λmax3 ) 315.5 nm. d HW) half-width.
Figure 8. Spectra obtained during the nanoparticle synthesis at -5.83mA cm-2. Inset: Plot of ln(a /(1 - a)) vs time (a ) Abs t /Abs∝).
Electrochemical Synthesis of Silver Nanoparticles J. Phys. Chem. B, Vol. 104, No. 41, 2000 9687

7/21/2019 Electrochemical Synthesis of Silver Nanoparticles
http://slidepdf.com/reader/full/electrochemical-synthesis-of-silver-nanoparticles 6/6
Acknowledgment. Partial financial support by the Xuntade Galicia is gratefully acknowledged (PGIDT99PXI20905B).
References and Notes
(1) Ozin, G. A. Ad V . Mater . 1992, 4, 612.(2) Henglein, A. Chem. ReV . 1989, 89, 1861.(3) Lopez-Quintela, M. A.; Rivas, J. Curr. Opin. Colloid Interface Sci.
1996, 1, 806.(4) Reetz, M. T.; Helbig, W. J. Am. Chem. Soc. 1994, 116 , 7401.(5) Wilcoxon, J. P.; Williamson, R. L.; Baughman, R. J. Chem. Phys.
1993, 12, 9933.(6) a) Hughes, A. E.; Jain, S. C. Ad V . Phys. 1979, 20, 717, andreferences therein. (b) Kreibig, U.; Fragstein, C. Z. Phys. 1962, 224, 307.
(7) Kreibig, U.; Vollmer, M. Optical Properties of Metal Clusters;Springer-Verlag: Berlin, Heidelberg, 1995.
(8) Henglein, A.; Mulvaney, P.; Linnert, T. Faraday Disc. 1991, 92,31.
(9) Huang, Z.-Y.; Mills, G.; Hajek, B. J. Phys. Chem. 1993, 97 , 11542.(10) Kreibig, U. Z. Phys. B: Condens. Matter Quanta 1978, 31, 39.(11) Stranski, J.; Krastanov, L. Akad. Wiss. Math. Nat. K111b 1938,
797.
(12) Franck, F. Van der Merwe, J. Proc. R. Soc. London, Ser. A 1981949, 205.
(13) Volmer, M.; Weber, A. Z. Phys. Chem. 1926, 119, 277.(14) Henglein, A. J. Phys. Chem. 1993, 97 , 5457.(15) Kawata, A.; Kubo, R. J. Phys. Soc. Jpn. 1966, 21, 1765.(16) Kubo, R. J. Phys. Soc. Jpn. 1962, 17 , 1765.(17) Doyle, W. T. Phys. ReV . 1958, 111, 1067.(18) Kreibig, U.; Fragstein, C. V. Z. Phys. 1969, 224, 307.(19) Genzel, L.; Martin, T. P.; Kreibig, U. Z. Phys. B 1975, 21, 339.(20) Ershov, B. G.; Janata, E.; Henglein, A.; Fojtik, A. J. Phys. Chem.
1993, 97 , 4589.(21) Henglein, A.; Linnert, T.; Mulvaney, P. Ber. Bunsen-Ges. Phys.
Chem. 1990, 94, 1449.(22) Boudart, M. Kinetics of Chemical Processes; Prentice Hall:
Englewood Cliffs, NJ, 1968; Chapter 6.(23) Rivadulla, J. F.; Vergara, M. C.; Blanco, M. C.; Lopez-Quintela,
M. A.; Rivas, J. J. Phys. Chem. 1997, 101, 8997.(24) Tojo, C.; Blanco, M. C.; Rivadulla, J. F.; Lopez-Quintela, M. A.
Langmuir 1997, 13, 1970.
9688 J. Phys. Chem. B, Vol. 104, No. 41, 2000 Rodrıguez-Sanchez et al.