Embed Size (px)
Citation preview

1
Supporting Information
Local visualization of catalytic activity at gas evolving
electrodes using frequency-dependent scanning
electrochemical microscopy
Xingxing Chen,a,b Artjom Maljusch,a Rosalba A. Rincón,a Alberto Battistel, c
Aliaksandr S. Bandarenka,a,d* Wolfgang Schuhmanna,*
a Center for Electrochemical Sciences - CES, Ruhr-Universität Bochum,
Universitätsstr. 150, 44780 Bochum, Germany
b School of Chemical Engineering, University of Science and Technology
Liaoning, Qianshan Road 185, 114051 Anshan, China
c Semiconductor & Energy Conversion – Center for Electrochemical
Sciences (CES); Ruhr Universität-Bochum
Universitätsstr. 150, D-44780 Bochum, Germany
d Present address: Physik-Department ECS, Technische Universität München,
James-Franck-Straße 1, 85748 Garching, Germany
Contents:Experimental
1. Chemicals and solutions
2. Materials
3. Preparation of model samples
4. SECM measurements
5. The parameter
1. Chemicals and solutions
Ruthenium (IV) oxide (99.9%) was obtained from Aldrich (Taufkirchen, Germany). NaOH,
HCl (37~38%) and H2SO4 (95~97%) were purchased from J.T. Baker (Deventer,
Electronic Supplementary Material (ESI) for ChemComm.This journal is © The Royal Society of Chemistry 2014

2
Netherlands). Electrolyte (0.1 M NaOH, 0.5 M H2SO4 and 6 M HCl) were prepared using
water purified and deionized with a Milli-Q system (Millipore, Bedford, USA).
2. Materials
Gold wires (purity: 99.99%, diameter 100 µm) were obtained from Goodfellow (Bad
Nauheim, Germany). Borosilicate capillaries (outer diameter 1.5 mm, wall thickness of 0.375
mm for fabrication of SECM tips) and glass capillaries (outer diameter 1.5 mm, wall
thickness of 0.375 mm for fabrication of cavity electrodes) were obtained from Hilgenberg
(Malsfeld, Germany).
3. Preparation of model samples
A 100 µm Au-disk electrode was firstly pretreated in a similar way as the Pt-disk electrode
described in the manuscript text. Then the electrode was further electrochemically polished by
running 10 cyclic voltammograms in 0.5 M H2SO4 between 0 and 1.7 V vs. Ag/AgCl/3M KCl
with a scan rate of 200 mV/s. In order to create a cavity, electrochemical etching of gold was
performed in 0.6 M HCl by cycling the potential between 0 and 1.3 V vs. Ag/AgCl/3M KCl at
500 mV/s for 10 cycles to obtain ~10 µm deep cavities. A second electrochemical polishing
was performed in H2SO4 before using the cavity electrode. Ruthenium (IV) oxide (99.9%)
powder was then filled into the cavity of the electrode by slightly pressing the electrode tip
onto a glass slide on which the powder was placed.
4. SECM measurements
A four-electrode system controlled by a bipotentiostat (Jaissle PG100, IPS, Münster,
Germany) has been used. A homemade glass insulated 25 µm Pt-disk microelectrode has been
used as WE1. Either a cavity electrode filled with RuO2 or an industrial O2-evolving electrode
has been used as the sample (WE2). The reason to exchange the connection of the working
electrodes in contrast to the traditional SECM set-up, in which the sample and the SECM tip
are typically connected as WE1 and WE2, respectively, is to exclude unnecessarily instant
potential fluctuation at the small tip, whose potential is generally modulated by the big sample.
A homemade agar-based Ag/AgCl/3M KCl electrode (0.209 V vs. NHE) and a Pt-wire
(Goodfellow, Bad Nauheim, Germany) with a high surface area shaped to form a coil around
the RE and WE1, have been utilized as reference electrode and counter electrode, respectively.
The schematic drawing of the SECM set-up is presented in Figure S1A; both WE1 and RE
were individually fixed at the SECM holder, and the distance between these two electrodes

3
was kept to 2 mm horizontally (Figure S1B). An optical video microscope has been used to
preposition the tip above the active sample surface. An approach curve at Etip = -0.400 V in
the feedback mode of SECM in presence of 5 mM [Ru(NH3)6]Cl3 in 0.1 M KCl as supporting
electrolyte was used to adjust the distance between the tip and the sample surface to 10 µm or
20 µm during the area scan of the model and industrial samples, respectively. A distance of 50
µm was chosen for studying of the sample potential influence on the bubble detachment.
Figure S1. (A) Schematic drawing of the SECM setup, (B) a photographic image of the tip and RE in
a close proximity to the sample surface at the gas evolving spot, (C) scheme of the experiments
including FFT-data acquisition obtained from the tip current.
The subsequent studies were carried out in an air-saturated 0.1 M NaOH by applying the
sample generation-tip collection (SG-TC) mode of SECM with the SECM tip polarized at -
0.400 V vs. Ag/AgCl/3M KCl-Agar RE. For monitoring the bubble-detachment frequency at
different sample potentials, the tip was positioned as shown in Figure S1B so that the gas
evolving spot was located between the WE1 and RE, however, much closer to the WE1.
Figure S1C shows a scheme of the experiment including FFT-data acquisition obtained from
the tip current. To evaluate the influence of sample potential on the bubble detachment
frequency, the sample was polarized from 0.200 V to 0.690 V. The area scanning of the
model sample and the industrial gas diffusion electrode sample has been carried out at Esample

4
= 0.700 V with an increment of 25 µm in both x- and y-direction. To accurately localize the
model sample, a SECM feedback mode study in 5 mM [Ru(NH3)6]Cl3 with 0.1 M KCl has
been carried out at Etip = -0.400 V while the sample (WE2) was kept at open circuit potential
prior to the study in alkaline solution.
A special software has been designed and integrated into the normal SECM software
(Sensolytics, Bochum, Germany) so that fast data acquisition and processing could be
achieved. A Krohn-Hite (model 3202) low pass filter was put at 20 Hz to cut the high
frequency noise. Instead of only one current value being finally read out at each location
using the sample SG-TC mode of SECM, the current at the tip was monitored with a sampling
frequency of either 1000 Hz for 240 s for evaluating the sample potential influence on the
frequency of bubble-detachment or 100 Hz for 30 s at each scanning grid point during an area
scan. Data processing was carried out using Origin Pro9, in the study of sample potential
influence on the frequency of bubble-detachment, and a home-made software employing the
library Exocortex.DSP for FFT, for area scans. MIRA (G. Wittstock, Software and Consulting,
Oldenburg, Germany) was used to produce SECM images. The highest peak between 1 to 4
Hz in the FFT-spectra was automatically chosen for plotting amplitude-by-frequency ρ(x;y),
amplitude α(x;y), and frequency ν(x;y) images. This frequency range was chosen knowing that
the detaching frequencies of the bubbles were in this range. If there were no peaks in the FFT,
this algorithm would automatically take a frequency of 1 Hz and amplitude equal to the noise
level. Whenever this happened, a frequency of 0 Hz was taken instead, meaning the absence
of characteristic frequency in that point.
Figure S2A shows a photographic image of the model sample surface where active RuO2 is
located in approximately the middle of the image. Figure S2B represents a feedback mode of
SECM image taken over the active RuO2 catalyst. This image confirms that the active
material forms a circular structure with a diameter of ~100 μm and is placed in the center of
the scanned area. Figure S2C shows a SECM images taken in the sample generation/tip
collection mode (SG-TC).

5
(A) (B) (C)-10
-12
-14
-16
-18
0
-20
-40
-60
i (nA) i (nA)
Figure S2. (A) Photographic image, (B) feedback mode image and (C) SG-TC mode image of the
model RuO2 sample surface.
To further support the explanation of Figure 3 in the manuscript, one possible extreme case is
explained in Figure S3. Considering an electrolyte volume close to the sample surface, which
is partially saturated with oxygen. The tip positioned away from the active area will detect a
quasi-stable cathodic current due to electrochemical reduction of the dissolved oxygen (Figure
S3A). However, if the tip is positioned close to the gas evolving area, the current would
fluctuate quasi-periodically. Three factors would contribute to the amplitude and the average
value of the current in this case. The first one considers convection effects due to the bubble
departure leading to the increase of the surface concentration of oxygen at the surface of the
tip. In this case, the average current value would be more negative as compared to those
related to the position of the tip away from the active spot. The second one considers a
situation when the departing gas bubbles locally increase the effective electrolyte resistance.
Under potentiostatic conditions, this will periodically decrease the tip current and, in some
cases, lower the average current values close to the active area. The third one considers an
already existing bubble which will grow up by removing the oxygen from the supersaturated
solution in close proximity to the tip, thus reducing the supersaturation of the electrolyte and
the reductive current detected at the tip, as schematically explained in Figure S3B. The
resulting SG-TC SECM image would therefore depend on the relative contribution of these
three main factors.

6
Location away froman “active spot”
Average current
Location close toan “active spot”
Average current
Figure S3. Schematics illustrating the importance of frequency analysis of current transients in SECM
investigations of gas evolving electrodes. Under potentiostatic conditions, departing gas bubbles
locally increase the effective electrolyte resistance and can lower the average current values close to
the “hotspots”.
Figure S4 shows the individual amplitude α(x;y) and frequency ν(x;y) images, which
correspond to the amplitude-by-frequency ρ(x;y) images in Figure 3 of the main text.
0 50 100 150 200
200
150
100
50
0
y/ µ
m
x / µm
(A)
0 50 100 150 200
200
150
100
50
0
y/
µm
x / µm
(B)y
/ µm
0 50 100 150 200
200
150
100
50
0
y/
µm
x / µm
(C)
α (nA)α (nA)α (nA)
0 50 100 150 200
200
150
100
50
0
y/
µm
x / µm
(D)
0 50 100 150 200
200
150
100
50
0
y/
µm
x / µm
(E)
y/
µm
0 50 100 150 200
200
150
100
50
0
y/
µm
x / µm
(F)
v (Hz)v (Hz)
4
3
2
0*
4
3
2
0*v (Hz)
4
3
2
0*
16
12
8
4
0
16
12
8
4
0
16
12
8
4
0
Figure S4. (A-C) amplitude, α(x;y), and (D-F) frequency, ν(x;y), images taken over the RuO2 surface.
White dotted lines indicate the approximate position of the cavity filled with RuO2 (Esample = 0.700 V).
Figure S5 shows the individual amplitude α(x;y) and frequency ν(x;y) images, which
correspond to the amplitude-by-frequency ρ(x;y) images in Figure 4 of the main text.

7
0 100 200 300 400 500
400
300
200
100
0
3
2
1
0*
x / µm
3
2
1
0
400
300
200
100
0
y/
µm
v (Hz)
(A) (B)
0 100 200 300 400 500 α (nA)x / µm
y/
µm
1 12 2
3 3
Figure S5. (A) Amplitude, α(x;y), and (B) frequency, ν(x;y), images taken over a dimensionally stable
anode (DSA) surface (Esample = 0.700 V).
8
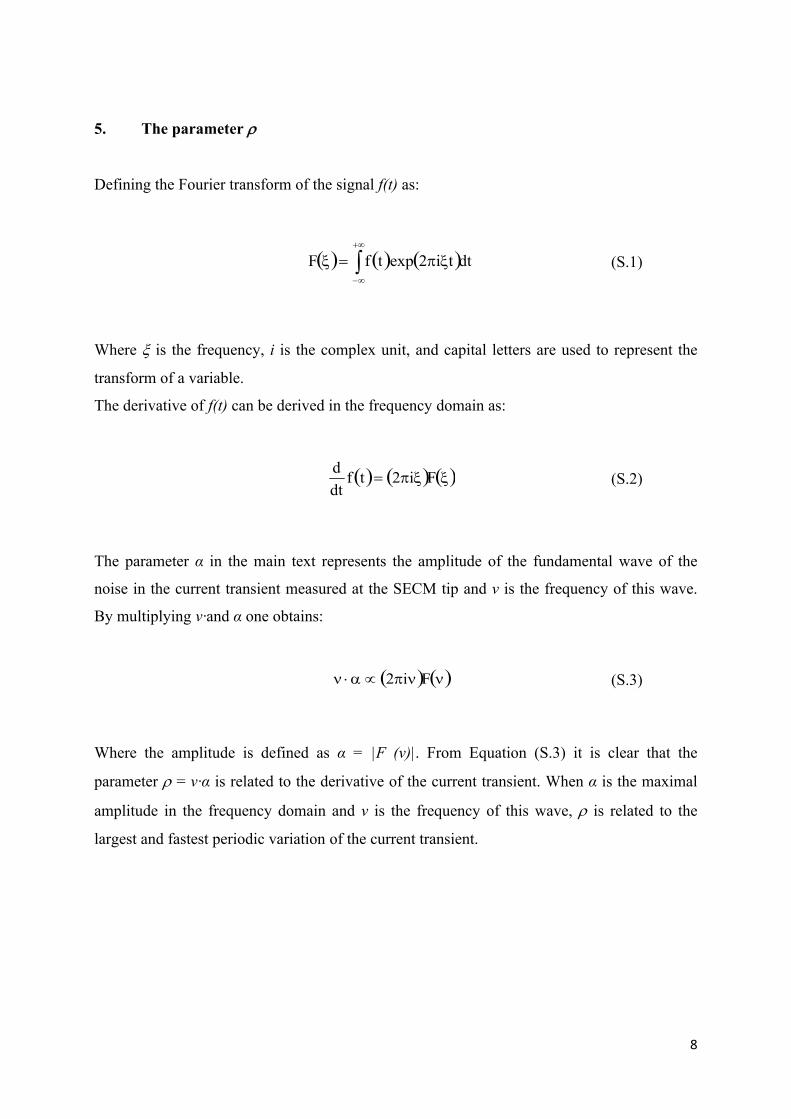
5. The parameter
Defining the Fourier transform of the signal f(t) as:
dtti2exptfF (S.1)
Where is the frequency, i is the complex unit, and capital letters are used to represent the
transform of a variable.
The derivative of f(t) can be derived in the frequency domain as:
Fi2tfdtd
(S.2)
The parameter α in the main text represents the amplitude of the fundamental wave of the
noise in the current transient measured at the SECM tip and ν is the frequency of this wave.
By multiplying ν·and α one obtains:
Fi2 (S.3)
Where the amplitude is defined as α = |F (ν)|. From Equation (S.3) it is clear that the
parameter = ν·α is related to the derivative of the current transient. When α is the maximal
amplitude in the frequency domain and ν is the frequency of this wave, is related to the
largest and fastest periodic variation of the current transient.