Embed Size (px)
Citation preview

ORIGINAL RESEARCH
Electrochemical Kinetics: a Surface Science-Supported Pictureof Hydrogen Electrochemistry on Ru(0001) and Pt/Ru(0001)
M.P. Mercer1 & H.E. Hoster1
Published online: 24 May 2017# The Author(s) 2017. This article is an open access publication
Abstract In this short review, we compare the kinetics ofhydrogen desorption in vacuum to those involved in the elec-trochemical hydrogen evolution/oxidation reactions (HER/HOR) at two types of atomically smooth model surfaces: bareRu(0001) and the same surface covered by a 1.1 atomic layerthick Pt film. Low/high H2 (D2) desorption rates at room tem-perature in vacuum quantitatively correspond to low/high ex-change current densities for the HOR/HER in electrochemis-try. In view of the Bvolcano plot^ concept, these represent twosurfaces that adsorb hydrogen atoms, Had, too strongly and tooweakly, respectively. Atomically smooth, vacuum annealedmodel surfaces are the closest approximation to the idealizedslab geometries typically studied by density functional theory(DFT). A predictive volcano plot based on DFT-based adsorp-tion energies for the Had intermediates agrees well with theexperiments if two things are considered: (i) the steady-statecoverage of Had intermediates and (ii) local variations in filmthickness. The sluggish HER/HOR kinetics of Ru(0001) al-lows for excellent visibility of cyclic voltammetry (CV) fea-tures even in H2-saturated solution. The CV switches betweena Had- and a OHad-/Oad-dominated regime, but the presence ofH2 in the electrolyte increases the Had-dominated potentialwindow by a factor of two. Whereas in plain electrolyte twoelectrochemical adsorption processes compete in formingadlayers, it is one electrochemical and one chemical one inthe case of H2-saturated electrolyte. We demonstrate andquantitatively explain that dissociative H2 adsorption is more
important than H+ discharge for Had formation in the lowpotential regime on Ru(0001).
Keywords Model surfaces . Hydrogen evolution . Hydrogenadsorption . Single crystal . Temperature programmeddesorption . Density functional theory
Introduction
The synergy between vacuum-based analysis and electro-chemistry has a long history [1–7]. However, particularly forlow mass and highly mobile species such as hydrogen, thedirect quantification of coverages by in situ electrochemicaltechniques, which by now are highly developed [8–13], hasstill proven elusive. In addition, the quantification of electro-chemical signals to determine such adlayer coverages is oftenfraught with uncertainties due to the presence of parasitic sideprocesses which can introduce their own pseudocapacitance.However, the determination of accurate thermodynamic andkinetic parameters relevant in electrocatalysis, including thosepertaining to the long studied hydrogen evolution reaction(HER) and hydrogen oxidation reaction (HOR), actually de-pends on these coverages being determined with a reasonableprecision [14–17]. Therefore, in this work, we relate the de-sorption kinetics obtained in vacuum with the electrocatalysisof the HER/HOR, and we analyse the electrochemical behav-iour in view of the surface coverage according to cyclic volt-ammetry data (with and without H2 in the solution).
Single crystalline surfaces play an important role in theunderstanding of the link between structure and reactivity inelectrocatalysis [18–29]. The research strives to elucidate re-actions relevant to proton exchange membrane (PEM) fuelcells [30–32]. Technically, those rely on particles ofelectrocatalysts, but research makes frequent use of planar
* M.P. [email protected]
1 Department of Chemistry, Lancaster University, Bailrigg,Lancaster LA1 4YB, UK
Electrocatalysis (2017) 8:518–529DOI 10.1007/s12678-017-0381-y

single crystalline systems as model surfaces. Among otheradvantages, those allow more specific insights on the role ofadsorbed species for key reactions such as hydrogenevolution/oxidation (HER/HOR) [33–35], CO oxidation [21,22, 36, 37], and oxygen reduction (ORR) [3, 27, 38, 39]. Froma fundamental research point of view, planar model surfacescome with the advantage that they closely resemble the slabsthat are used in density functional theory (DFT) calculations[40–42]. This facilitates the link between theory and experi-ment and enables easier cross-validation between the two.
Most of these catalysts are based on Pt, by far the mostactive monometallic catalysts for HER/HOR as well asORR. A well-explored strategy is to allow Pt with anothermetal, thereby reducing the Pt content. In the case ofPtxRu1 − x [30, 43–45] and many other alloy systems[46–49], the alloying component is known to suppress COpoisoning during the oxidation of hydrogen feedstocks obtain-ed from reformate methane or methanol. It is well known thatelectronic and geometrical modification from the alloyingcomponent can also influence (positively or negatively) thereaction with hydrogen itself [33–35, 38, 45, 46, 50, 51].There are challenges associated with the preparation of highquality Ru(0001) surfaces, which have a high bonding enthal-py for a range of different adsorbates [52, 53]. Ultra-highvacuum (UHV)-based preparation and analysis techniquestherefore provide an opportunity to gain increased insight intothis system. It is also known that up to four atomic layers of Ptcan be grown pseudomorphically on Ru(0001) [40, 52, 54],which allows the catalytic properties to be tuned in a con-trolled manner and further assist the comparison with models.In a recent review paper concerned primarily with quantitativeimaging of UHV prepared Ru(0001) and Pt/Ru(0001) modelsurfaces, we flagged precisely how sensitive the adsorption ofH, O, and CO is to slight local variations in the structure of thesurface [7], which is a factor often neglected in overlayersystems such as Pt/Ru(0001).
In terms of model surfaces, this work will restrict itself totwo examples and look deeper into their chemical and elec-trochemical interaction with hydrogen at the solid/gas and thesolid/liquid interfaces. We will discuss UHV-preparedRu(0001), with and without a 1.1-ML pseudomorphic filmof Pt [35], which are structurally similar (which is down tothe same lateral spacing in the surface layer) but very differentin their interaction with hydrogen. In combination withexisting trends and data known for Pt(111), this permits acomparison of surfaces that bind hydrogen strongly(Ru(0001), close to optimally (2ML Pt/Ru(0001)) and weakly(1 ML Pt/Ru(0001)). Moreover, the low electrocatalytic activ-ity of bare Ru(0001) yields well-defined cyclo-voltammetricfeatures not only in plain but also in H2-saturated electrolyte.This provides textbook-like insights not only into the HER/HOR kinetics (steady-state Butler-Volmer type profile) butalso in the potential dependent sequence of adlayers formed
on Ru(0001), with and without H2 in the solution. We high-light that, under conditions where H2 is in the electrolyte oraccumulated there during HER, the driving force to adsorbhydrogen underpotential/overpotential deposition (UPD/OPD) may be stronger for non-electrochemical adsorptionrather than proton discharge.
From understanding gained from temperature programmeddesorption (TPD) of D2 molecules, we highlight that it is im-portant to account for the actual adsorbate coverage under realelectrochemical conditions [55, 56], rather than simply assum-ing that the results obtained from DFTcalculations at an adsor-bate coverage of 0.25 ML [57], as commonly used for othernoble metals, or 1 ML [15], as used in the models of Nørskovet al. on Ru(0001), are representative of real reaction condi-tions. Due to the scaling of the computational cost of densityfunctional theory (DFT) models with the system size, suchmodels are often constrained to examine only periodic, fixedstoichiometric adlayer coverages, such as 0.25, 0.5, or 1 ML,neglecting the fact that the relevant adlayers under reactionconditions may be disordered and/or non-stoichiometric.
The understanding of hydrogen adsorption and reactionthus gained may be of relevance for systems beyondRu(0001), particularly ones in which the potential regionsfor H and O adsorption overlaps. A recent work by Quainoet al. [16] highlighted that all of the metals that, on the tradi-tional volcano plot [58], bind H too strongly in reality arecovered by an oxide layer, which makes the interaction of Hwith their surfaces in metallic state irrelevant from a modelperspective. Once the oxide covered metals are disregarded,there is actually no convincing evidence of a volcano on thathalf of the plot. However, Ru(0001), which undergoes a placeexchange of OHad with Had in the potential region where Hevolution occurs [2, 59, 60], provides an important data pointon the high H-binding energy side of the volcano, providedthat the true adsorbate coverage taken into account in theanalysis.
However, after taking proper account of these phenomena,and collating together the data from other works, we show thatit is possible to display a volcano plot that adequately corre-lates the variation in H-binding energy with the number of Ptlayers on Ru(0001), as well as on bare Ru(0001) itself, withthe measured exchange current density of the HER/HOR. Thishas implications for the best approaches for the examinationand interpretation of other surface-sensitive reaction systems,particularly the ones on the high H/O-binding energy side ofthe volcano.
Ru(0001): Cyclic Voltammetry in Perchloric Acid
The electrochemistry of Ru(0001) in perchloric acid electro-lyte is central to the results reviewed in this paper and will thusbe briefly summarized in the following. Figure 1a shows the
Electrocatalysis (2017) 8:518–529 519

cyclic base voltammetry for two different cathodic limits andgives an evaluation/interpretation of the resulting key featuresalong the lines thoroughly discussed in refs. [2, 59, 61, 62].Note that the potential scale for this figure and all subsequentcyclic voltammograms is with respect to the reversible hydro-gen electrode (RHE). The assignment of the different poten-tial regions to a domination of Had, OHad, and Oad (bottomline) relies on CO displacement data (see explanation be-low) [2, 59], charge integration in cyclic voltammograms,and ex-situ studies of the potential-dependent adlayers byelectron diffraction [1].
The voltammograms are best understood by starting fromthe most positive potential limit and considering a cathodicpotential sweep. Peaks C/C′ exhibit a pronounced hysteresis,indicating that they reflect more complex, less reversible sur-face processes that possibly involve place exchange betweenRu and O atoms. This is supported by ex-situ STM studieswhich showed clear evidence of morphology changes afterpotential scans beyond 0.9 V [63]. For the discussions in thispaper, however, those two peaks play only a spectator role.
Although peaks B/B′ (Fig. 1b) have been observed bymany groups, it is surprising that one aspect was not yetdiscussed: they present a textbook-like BNernstian^ shape(Fig. 1c), i.e., the profile that one would expect forLangmuir adsorption without adsorbate-adsorbate attractionor repulsion or for the behaviour of an adsorbed electroactive
species [64]. The characteristic bell shapes of those peaksreflect the configurational entropy of a random distributionof adsorbates and vacancies or of oxidized and reduced spe-cies in the adlayer [65]. Since there is no in situ structuralinformation available about the adlayers that form peaks B/B′, an interpretation based on the CO displacement charge, thevoltammetric charge, and some ex-situ electron diffractionpatterns [1] was performed in refs. [61, 62]. It suggests thereversible protonation of 0.5 ML Oad (which would form a2 × 1 pattern on Ru(0001)) towards 0.5 ML OHad as a likelyscenario behind peak B/B′ (see Fig. 1b). This process is there-fore a form of UPD-Had, but not forming on the bare metal buton an Oad layer. In another view, Oad/OHad could beinterpreted as an adsorbed redox couple [64], possibly as partof a few-layer hydrogen-bonded H2O adlayer.
The Ru(0001) base CV in the range 0.1 V < E < 1.1 V bearsmany similarities with the one of polycrystalline platinum,which is why peaks B/B′ were initially assigned to UPD-Had
and C/C′ to OHad reduction/formation, both peak couples sep-arated by a double-layer regime. This interpretation did notstand up to scrutiny in deeper analyses: in ref. [59], currenttransients were recorded whilst CO was admitted into theelectrochemical cell with the Ru(0001) electrode at constantpotential. If peak B′ was passed in a cathodic scan and thepotential halted at around 0.1 V, a negative current transientwas observed, indicating that the non-electrochemical CO
Fig. 1 a Detailed H2-free voltammograms of the Ru(0001) surface(0.1 M HClO4, 50 mV s−1). The vertical lines mark adlayer structuresaccording to ex-situ low-energy electron diffraction (LEED) [1] and thetransferred charges in multiples of electrons per surface atom (the solidblack line indicates the potential 0.1 V, where the dominating adlayer
switches between OHad and Had) [2, 59, 60, 62]. Reproduced withpermission from ref. [62]. b Close-up of peak B/B′, which reflects thereversible hydrogenation of 0.5 ML Oad and shows a textbook-likeNernstian peak shape. c Textbook figure reproduced with permissionfrom ref. [64]
520 Electrocatalysis (2017) 8:518–529

adsorption displaces a species that needs to be electrochemi-cally reduced to remove it from the surface. This could beOHad or Oad. Only a positive current transient would indicateHad as a dominating surface species, which would release anelectron upon Bdesorption^ into dissolved H+. Such a positivetransient was only observed if the cathodic peak A′was passedprior to CO admission. This indicates that Had adsorption onlyoccurs when the negative potential limit is extended in thewindow shown by the red dotted line in Fig. 1a. The sameresults were found for Ru(0001) modified by Pt islands [2].The integrated charge of peak A′ and of the mentioned COdisplacement transients indicates that the peak reflects the re-placement of ~0.5 ML OHad by ~0.5 ML Had. In contrast toPt(111), there is no actual Bdouble-layer^ region whereRu(0001) is free of adsorbates. This fact has recently beenshown by DFT calculations performed by Sakong and Groß(Fig. 1b of ref. [66]).
Peaks A/A′ are the most important ones for the discussionsin the following section. As discussed in detail in refs. [61,62], those two peaks most likely involve an EC mechanism,i.e., electrochemically formed precursors that feed into subse-quent chemical surface reactions. Specifically, peak A′ reflectsthe formation of Had, which is initially consumed by a subse-quent chemical surface reaction with the incumbent OHad.Only after all OHad is removed, the Had layer, which is ther-modynamically more favourable below 0.1 V (vertical dottedline in Fig. 1a), dominates the Ru(0001) surface [2, 59, 60,62]. In the positive going scan, Had is stable against H
+ for-mation up to rather high potentials [2] but the even morefavourable OHad will tend to displace it at E > 0.1 V. Again,that process is sluggish, which can be interpreted as resultingfrom a two-step reaction: dissociative H2O adsorption,forming OHad and Had, with Had getting oxidized at ratherlow rates and thus leaving the surface crowded and hinderingongoing H2O adsorption. It should be highlighted that thehysteresis between peaks A and A′ is drastically reduced inthe presence of even small amounts of Pt at the surface, whichcan act as a channel for much faster Had formation and oxida-tion [2, 60, 62]. This implies that the hysteresis between A andA′ on unmodified Ru(0001) is a kinetic, rather than thermody-namic, effect. The strong interaction of Ru(0001) with Had andthe related sluggishness of any H2 or H+ involving surfacereactions on Ru(0001) are recurring themes in the followingdiscussions.
Kinetic Analysis of Electrochemical Flow Cell Datafor Ru(0001) and Pt/Ru(0001)
The dotted line in Fig. 2a depicts a CV of a clean, UHV-prepared Ru(0001) surface in 0.1 M HClO4 solution. Thisvoltammogram was measured with the same potential limitsas the one shown by the red dotted line in Fig. 1a, albeit at a
different sweep rate. The red solid line in Fig. 2a shows theeffect of saturating the electrolyte with H2 on the voltammo-grams. These results were obtained in a flow cell under con-ditions of enhanced mass transport; further details of howthese experiments were performed are available elsewhere[27, 39, 62]. The flow rate in these experiments was on theorder of 1 mL s−1, which allowed diffusion limited currentdensities of about 2 mA cm−2 to be reached (on sufficientlyactive surfaces, such as Pt/Ru(0001) as shown in Fig. 2b),enabling accurate kinetic measurements.
In a flow of H2-saturated electrolyte, the CVonly changesin the region −0.1 V < E < 0.4 V, whereas peaks E, C, and C′remain largely unaffected. This is because the surface is cov-ered by 0.5 ML (or more) of Oad at E > 0.4 V, as shown in thedetailed voltammograms of the H2-free Ru(0001) surface(Fig. 2a) and explained in the preceding section. Looking atthe negative going potential sweep, hydrogen oxidation onlybegins to occur during peak B′. In H2-saturated electrolyte(Fig. 2a, solid line), the transition between a CV that is essen-tially identical to the H2-free voltammogram and a textbook-like Butler-Volmer profile (dashed line) is rapid in either scandirection. It is safe to assume that in the BButler-Volmer^regime the surface is dominated by Had. In H2-saturated solu-tion, the replacement of OHad by Had already occurs at 0.2 V;the onset potential of peak A′, associated with the same placeexchange in plain electrolyte, is at or below 0.1 V [2, 59, 60,62] (likewise for the opposite process). Hence, the potentialwindow where a Had-dominated surface is more stable thanthe OHad-dominated one is twice as large in H2-saturatedelectrolyte.
This observation has not been interpreted in detail be-fore, although it is quite significant for an understandingof the interfacial chemistry at conditions where HOR/HER takes place. For Pt surfaces, the formation of UPDor OPD-Had is typically discussed in the context of H+
discharge [14, 17, 67–70]. This is the right approach inplain electrolyte, but in H2-containing solution, the driv-ing force to form Had out of H2 may be higher than theone for H+ discharge under certain circumstances, i.e., itmay be closer to a gas-phase adsorption situation than toelectrochemical Had formation.
The interplay of non-electrochemical adsorption withpotential-dependent adlayer formation is easier to disentangleif the non-electrochemical species is not an H2O fragment. Forinstance, Ru(0001) shows well-defined stationary CVs in CO-saturated electrolyte, which are totally different from the onesin plain electrolyte due to the competition between electro-chemical and chemical adsorbates for the same sites (CO ox-idation currents are rather small on Ru(0001)) [61].BChemically formed^ adsorbates do not involve charge trans-fer and thus do not generate their own peaks in CVs, but theycan change the position, shape, and amplitude of the otherpeaks.
Electrocatalysis (2017) 8:518–529 521

In H2-saturated acidic electrolyte, Had can form by H+ dis-charge or by H2 dissociation. An important Gedanken exper-iment is that if the H2 activity (or partial pressure in the gasphase above the electrolyte) was high enough, H2 dissociationwould always dominate. For a given potential, that can resultin a higher Had coverage than would be obtainable from apurely electrochemical process. On Ru(0001), Had competeswith OHad for adsorption sites. Above 0.1 V, OHad is morestable and cannot be displaced by Had from H+ discharge. Ifthe surface was kept at, say, 0.2 V, however, a sufficiently highH2 concentration would raise the chemical potential high
enough that the gain in free energy through an adsorptionprocess would be sufficient to thermodynamically displaceOHad (in the sameway that CO can do this, as discussed above[2, 59]).
In the following, we will show that dissolved H2 with apartial pressure around atmospheric pressure (equivalent to areversible hydrogen reference electrode) will necessarily dom-inate the Had layers over the electrochemically (OPD/UPD)formed ones. Figure 3 schematically plots the free energydifference between the Had or OHad covered and the plainRu(0001) surface, as a function of the electrode potential, in
Fig. 2 a Cyclic voltammograms of Ru(0001) in flowing H2-saturated(solid curve) and H2-free (dotted curve) electrolyte (0.1 M HClO4,10 mV s−1). The dashed curve shows j(E) according to the Butler-Volmer equation (see text). The point where the number value of theHER current density surpasses that of the exchange current density, j0,is marked on the plot. For the numbers 1, 2, and 3 and the related verticallines, see the discussion of Fig. 3. The blue dotted curve is similar to thedotted line shown in Fig. 1a (mind the different scan rates). Inset: STMimage [2] of UHV prepared Ru(0001), 150 × 150 nm2, with an overlaidatomic resolution image (2.6 × 2.6 nm2). b Voltammogram of a UHVprepared 1.1 ML/Ru(0001) surface in a flow of H2-saturated 0.1 M
HClO4 electrolyte; scan rate 10 mV s−1. The curve for Ru(0001) isplotted for comparison but nearly vanishes on this scale. c STM imageof UHV prepared 1.1 ML/Ru(0001), 200 × 200 nm2. The variation insample height along the line profile is visualized. d Film thicknesshistogram obtained from image c. e Cyclic base voltammograms(0.1 M HClO4, 50 mV s−1) of 1.1 ML Pt/Ru(0001) (blue solid line),Pt(111) (grey dashed line), and sigmoidal fit to the Pt(111)voltammogram (orange dotted line), shifted negatively to account forthe binding energy difference of H on 1.1 ML Pt/Ru(0001) with respectto Pt(111). Reprinted with permission from ref. [35]
522 Electrocatalysis (2017) 8:518–529
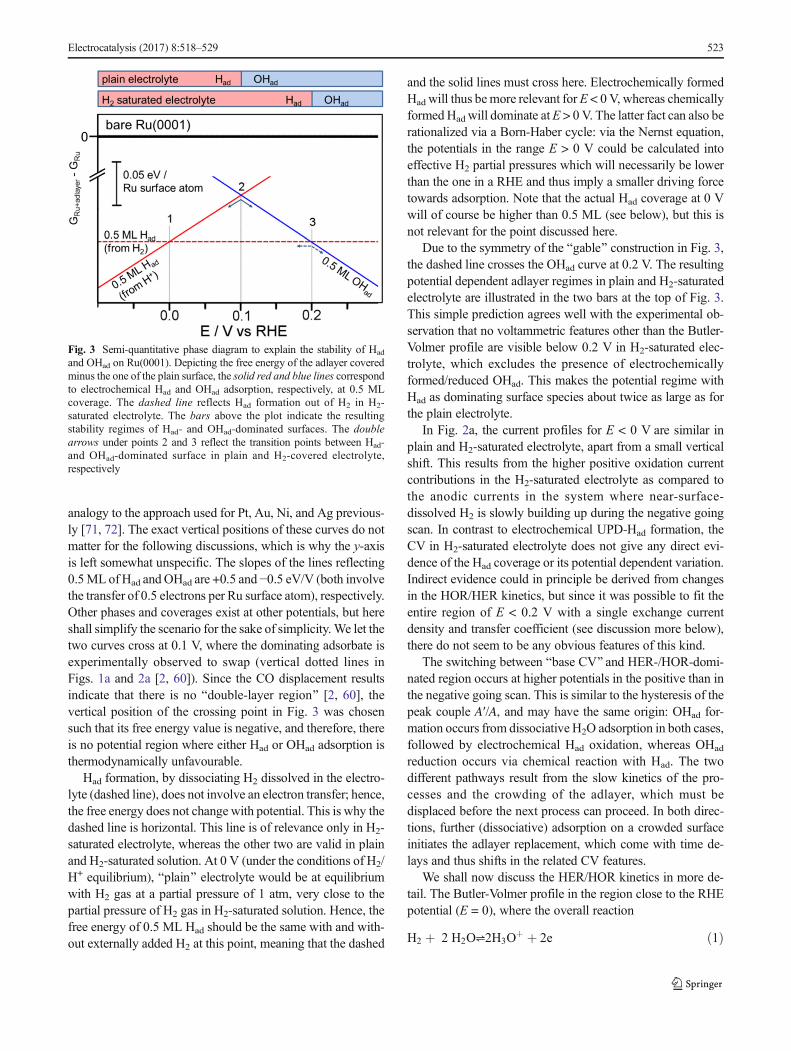
analogy to the approach used for Pt, Au, Ni, and Ag previous-ly [71, 72]. The exact vertical positions of these curves do notmatter for the following discussions, which is why the y-axisis left somewhat unspecific. The slopes of the lines reflecting0.5ML ofHad andOHad are +0.5 and −0.5 eV/V (both involvethe transfer of 0.5 electrons per Ru surface atom), respectively.Other phases and coverages exist at other potentials, but hereshall simplify the scenario for the sake of simplicity.We let thetwo curves cross at 0.1 V, where the dominating adsorbate isexperimentally observed to swap (vertical dotted lines inFigs. 1a and 2a [2, 60]). Since the CO displacement resultsindicate that there is no Bdouble-layer region^ [2, 60], thevertical position of the crossing point in Fig. 3 was chosensuch that its free energy value is negative, and therefore, thereis no potential region where either Had or OHad adsorption isthermodynamically unfavourable.
Had formation, by dissociating H2 dissolved in the electro-lyte (dashed line), does not involve an electron transfer; hence,the free energy does not change with potential. This is why thedashed line is horizontal. This line is of relevance only in H2-saturated electrolyte, whereas the other two are valid in plainand H2-saturated solution. At 0 V (under the conditions of H2/H+ equilibrium), Bplain^ electrolyte would be at equilibriumwith H2 gas at a partial pressure of 1 atm, very close to thepartial pressure of H2 gas in H2-saturated solution. Hence, thefree energy of 0.5 ML Had should be the same with and with-out externally added H2 at this point, meaning that the dashed
and the solid lines must cross here. Electrochemically formedHad will thus bemore relevant for E < 0V, whereas chemicallyformedHad will dominate atE > 0V. The latter fact can also berationalized via a Born-Haber cycle: via the Nernst equation,the potentials in the range E > 0 V could be calculated intoeffective H2 partial pressures which will necessarily be lowerthan the one in a RHE and thus imply a smaller driving forcetowards adsorption. Note that the actual Had coverage at 0 Vwill of course be higher than 0.5 ML (see below), but this isnot relevant for the point discussed here.
Due to the symmetry of the Bgable^ construction in Fig. 3,the dashed line crosses the OHad curve at 0.2 V. The resultingpotential dependent adlayer regimes in plain and H2-saturatedelectrolyte are illustrated in the two bars at the top of Fig. 3.This simple prediction agrees well with the experimental ob-servation that no voltammetric features other than the Butler-Volmer profile are visible below 0.2 V in H2-saturated elec-trolyte, which excludes the presence of electrochemicallyformed/reduced OHad. This makes the potential regime withHad as dominating surface species about twice as large as forthe plain electrolyte.
In Fig. 2a, the current profiles for E < 0 V are similar inplain and H2-saturated electrolyte, apart from a small verticalshift. This results from the higher positive oxidation currentcontributions in the H2-saturated electrolyte as compared tothe anodic currents in the system where near-surface-dissolved H2 is slowly building up during the negative goingscan. In contrast to electrochemical UPD-Had formation, theCV in H2-saturated electrolyte does not give any direct evi-dence of the Had coverage or its potential dependent variation.Indirect evidence could in principle be derived from changesin the HOR/HER kinetics, but since it was possible to fit theentire region of E < 0.2 V with a single exchange currentdensity and transfer coefficient (see discussion more below),there do not seem to be any obvious features of this kind.
The switching between Bbase CV^ and HER-/HOR-domi-nated region occurs at higher potentials in the positive than inthe negative going scan. This is similar to the hysteresis of thepeak couple A′/A, and may have the same origin: OHad for-mation occurs from dissociative H2O adsorption in both cases,followed by electrochemical Had oxidation, whereas OHad
reduction occurs via chemical reaction with Had. The twodifferent pathways result from the slow kinetics of the pro-cesses and the crowding of the adlayer, which must bedisplaced before the next process can proceed. In both direc-tions, further (dissociative) adsorption on a crowded surfaceinitiates the adlayer replacement, which come with time de-lays and thus shifts in the related CV features.
We shall now discuss the HER/HOR kinetics in more de-tail. The Butler-Volmer profile in the region close to the RHEpotential (E = 0), where the overall reaction
H2 þ 2 H2O⇌2H3Oþ þ 2e ð1Þ
Fig. 3 Semi-quantitative phase diagram to explain the stability of Had
and OHad on Ru(0001). Depicting the free energy of the adlayer coveredminus the one of the plain surface, the solid red and blue lines correspondto electrochemical Had and OHad adsorption, respectively, at 0.5 MLcoverage. The dashed line reflects Had formation out of H2 in H2-saturated electrolyte. The bars above the plot indicate the resultingstability regimes of Had- and OHad-dominated surfaces. The doublearrows under points 2 and 3 reflect the transition points between Had-and OHad-dominated surface in plain and H2-covered electrolyte,respectively
Electrocatalysis (2017) 8:518–529 523

is (by definition) in equilibrium, clearly splits into a posi-tive and a negative branch which reflect HOR and HER, re-spectively. Figure 4 depicts the HER/HOR CV in a semi-logplot. The straight lines for |E| > 0.75V confirm the exponentialprofile of the curves. From the slope of the anodic branch, wededuce a transfer coefficient α = 0.377, which is equivalent toa Tafel slope of 165 mV/decade [73]. The intersection of thestraight line with the j-axis yields an exchange current densityof j0 = 4.6 μA cm−2. The accuracy of these parameters can beverified by the dashed curve in Fig. 2a which is a plot of theresult of the Butler-Volmer equation
j Eð Þ ¼ j0 � exp α kT.e
� �−1E
� �−exp α−1ð Þ⋅ kT
.e
� �−1E
� �� �; ð2Þ
using j0 = 4.6 μA cm−2, α = 0.377, kT/e = 0.0256 V (atT = 297 K), E = potential vs. RHE. The value of j0 will bediscussed in more detail below.
Figure 2b shows the same experiment for a UHV preparedPt thin film on Ru(0001) (black curve). For comparison, thecorresponding curve for bare Ru(0001) (i.e., the CV fromFig. 2a) is plotted as a red line into the same graph. Due tothe much higher currents attained at the Pt film, however, theRu(0001) related curve is hardly distinguishable from the j = 0line. The Pt film is the 1.1ML Pt/Ru(0001) surface depicted inFig. 2c which was found to have very weak adsorption relatedfeatures in its base CV (Fig. 2e). It is dominated by areas with1 ML Pt, with a few holes of exposed Ru, and a few islandswith locally 2 ML Pt. The structure of this surface is mostclearly shown by the STM image (Fig. 2c) and histogram ofthe populations of Pt islands of each height (Fig. 2d).
For the Pt film, an evaluation of the exchange current den-sity via a half-logarithmic plot does not appear feasible.Instead, we follow the procedure used by Markovic et al. inref. [74], in which the slope dj/dE is evaluated in an interval of−0.01 V < E < 0.01 V, i.e., just close to the equilibrium po-tential E = 0 V. We find a slope of 100 mA cm−2 V−1.Assuming j0 = (kT/e) (dj/dE) = 8.617 × 10⁻⁵ V K−1, 297 K,and 100 mA cm−2 yields j0 = 2.6 mA cm−2. This is more thanfive times higher than the value reported for Pt(111) at 303 K(j0 = 0.45 mA cm−2) [74]. It should be pointed out, however,
that the evaluation of the micropolarisation region to deter-mine the exchange current density is potentially problematic,since the shape of the curve obviously does not resembleButler-Volmer characteristics in the same way that the onefor Ru(0001) does. In general, the exchange current densityof highly active metals such as platinum will beunderestimated by this method since transport effects candominate over electrochemical kinetics even in themicropolarisation region [75, 76].
The orders of magnitude that distinguish the HER/HORexchange current densities at Ru(0001) with and without thePt layer are a necessary consequence of the Sabatier principle[77]. Ru(0001) has a high affinity to all kinds of adsorbates.Here, it will readily dissociate H2 and form Had, with a highstability that makes H+ formation comparably unfavourable,thus introducing a high barrier for this process and also thereverse one of forming H2 out of 2 Had (Tafel reaction). ForHER/HOR at atomically smooth surfaces, Greeley, Kitchin,and coworkers suggested a simple kinetic model, which, incombination with adsorption energy values for H2, was al-ready shown to have a good predictive capability [34, 57].Apart from inputting DFT calculated adsorption energies,the model only requires a single fitting parameter, which is apre-exponential factor derived from the known behaviour ofsome pure metal surfaces.
One important question that arises is the reason that thetransfer coefficients α and (1 −α) in the Butler-Volmer curveof Ru(0001) on either side of the E = 0 V line are the same,even though the Had coverage in the region −0.1 V < E < 0 Vmay deviate somewhat from the 0.5 ML assumed here, due tothe possibility of a superposition of the electrochemical andchemical routes to forming the adlayer. One possibility is thatthe coverage varies only slightly in this potential region. It alsofurther possible that the HER/HOR activity is dominated bythe presence of a few step edges on Ru(0001), and is thereforenot strongly sensitive to the adsorbate coverage. However, inthe subsequent section, we compare data from temperatureprogrammed desorption experiments to provide a more accu-rate value for the coverage under the relevant reaction condi-tions, and relate this to a volcano plot for the HER/HOR.
Re-examination of the Volcano Plot for HER/HORon Pt/Ru(0001)
Figure 5 shows a volcano-curve calculated according tothe principles described in refs. [34, 57]. Rationalizingthe results discussed here requires the adsorption ener-gies of Had on Ru(0001), 1 ML Pt/Ru(0001) and 2 MLPt/Ru(0001). Those energies are listed in Table 1 andare shown in Fig. 6. The table also includes the Gibbsfree energies of hydrogen adsorption and the resulting
Fig. 4 Semi-log plot of the data in Fig. 2a as used to determine transfercoefficient α and exchange current density j0
524 Electrocatalysis (2017) 8:518–529

predicted exchange current densities for HER/HOR (cal-culated according to the procedures in ref. [57]).
The calculated points in Table 1 are represented by opencircles along the line of the volcano plot itself (Fig. 5). ForRu(0001), a very reactive surface, one has to expect a Had
coverage higher than 0.25 ML under conditions of H2 in thesolution. A reasonable upper limit would be 1 ML Had, whichaccording to ref. [78] will make the adsorption energy lessnegative by roughly 0.1 eV as compared to 0.25 ML Had.This is in agreement with trends found in thermal desorptionexperiments (also known as temperature programmed desorp-tion, TPD) of deuterium on Ru(0001) in UHV [79–81], aswell as the discussion in the previous section, in which aconstant coverage of 0.5 ML was assumed for the potentialregion E < 0.2 V in H2-saturated electrolyte and E < 0.1 V inH2-free electrolyte. D2 is commonly used in place of H2 in
TPD experiments, because its background signal from theresidual gas in the vacuum chamber of the mass spectrometeris much lower. Figure 7a shows a set of thermal desorptionspectra of D2 from Ru(0001) recorded after increasing gasdosages [80, 81]. The leading edges of the spectra indicatesthe temperature region where desorption sets in at relevantrates. The initial coverage of each desorption profile isreflected in the integrated area under the curve. The saturationcoverage is θ(Dad) = 1 ML, corresponding to the curve withthe highest peaks in Fig. 7a. Integration of this spectrum al-lows a normalisation factor to be determined that can be usedto compute the initial coverages of all of the other curves. Forreference, the spectrum starting with θ(Dad) = 0.83 ML isdrawn as a dotted line. The dataset underlines that measurabledesorption rates at 300 K require a coverage way beyondθ(Dad) = 0.25 ML.
For comparison of the TPD spectra with the HER/HORexchange current density at the solid/liquid interface, we sug-gest the following Gedanken experiment: let us assume thatthe HER follows a Volmer-Tafel mechanism, i.e., 2 H+ +2e− → 2 Had followed by 2 Had → H2, with the latter step
Fig. 5 Volcano plot showing the DFT predicted and measured exchangecurrent densities for HER/HOR on various model surfaces (see text). Onthe left-hand side, the strongly adsorbing Ru(0001) will have a highercoverage than the 0.25ML commonly used for the DFT-based adsorptionenergy. On the right-hand side, the coexistence of areas with differentlocal properties has to be taken into account. Reprinted with permissionfrom ref. [35]
Fig. 6 Binding energies of atomic hydrogen calculated from DFT. Thepoints are plotted as a function of the number of pseudomorphicoverlayers of Pt on Ru(0001). The left-hand energy scale is the absolutebinding energy; the right-hand scaleΔEbind is the energy with respect tothe binding energy of Had on the hcp site of Pt(111), which is representedas a dashed line. Reprinted with permission from ref. [40]
Electrocatalysis (2017) 8:518–529 525
Table 1 Enthalpies of adsorptionΔHads for ½H2 → Had, free energiesof adsorptionΔGH*on selected model surfaces, and HER/HOR exchangecurrent density j0 according to theory and experiment (see text); ΔHads
values according to DFT calculations in ref. [40] for Had coverage of0.25 ML (for the value at ~1.1 ML Had on Ru(0001): see text); andΔGH* = ΔHads (H2) + 0.24 eV [57]
Surface ΔHads/(eV) for ½H2 ΔGH*/(eV) j0 (HOR/HER)/(mA cm−2) theory j0 (HOR/HER)/(mA cm−2) experiment
Ru(0001) at 0.25 ML Had −0.531 −0.291 0.0006 0.0046 (Had coverage ≈ 0.7 ML)Ru(0001) at ~1 ML Had −0.431 −0.191 0.029
Pt(111) −0.351 −0.111 0.65 (ref. [74]) 0.45
2 ML Pt/Ru(0001) −0.231 +0.009 20.9 2.1 (1.1 ML Pt) 2.6
1 ML Pt/Ru(0001) −0.081 +0.159 0.1 (1.1 ML Pt)
The estimated Had coverage value on Ru(0001) under experimental conditions is explained in the discussion of Fig. 7

being rate determining. A current density of j0 = 4.6 μA/cm−2
(i.e., the number value of the exchange current density, seealso Fig. 2a) would then have to be matched by a desorptionrate of 0.018 ML s−1 under steady-state conditions. The cross-hair in Fig. 7a marks the point where this desorption rate isreached at 300 K. By integrating the dotted TPD spectrumonwards from the marked point, it can be determined thatthe Dad coverage corresponding to this desorption rate wouldbe about θ(Dad) = 0.7 ML. Any initial coverage under 0.5 MLwould lead to one of the spectra with a single peak centred onpoint β2, which all have negligible desorption rates at 300 K.This comparison highlights that the desorption rates involvedin the HER can only be achieved at Had coverages that wouldbe required to allow for the corresponding desorption rates atthe solid/vacuum interface. We caution that desorption ratesobtained at the solid/vacuum interface may differ somewhatfrom those at the solid/electrolyte interface due to solvationeffects and the presence of the electrical double layer.However, previous DFT calculations on Pt(111) reveal thatthe difference in the Had-binding energy with or without thepresence of the water layer is negligible for a Had coverage<1 ML (Fig. 1a of ref. [65]). Thus, a quantitative comparisonbetween the two desorption rates can be made. Furthermore,the high coverage destabilizes the adsorbed state viaadsorbate-adsorbate repulsion, reducing the binding energyof the adsorbate. With Ru(0001) binding Had too strongly
when the adsorbate coverage tends to zero, the adsorbate-adsorbate repulsion and the resulting destabilisation of Had
will increase the HER/HOR exchange current density(Sabatier principle). This brings it closer to the peak of thevolcano as shown in Fig. 5.
For the 1.1 ML Pt/Ru(0001) surface, on the other hand, theset of TPD spectra in Fig. 7b confirms that this surface shouldbe essentially free of hydrogen at 300 K (a vertical line isadded to guide the eye). This is also consistent with the ratherfeatureless cyclic voltammograms recorded for this type ofsurface, as shown in Fig. 2e.
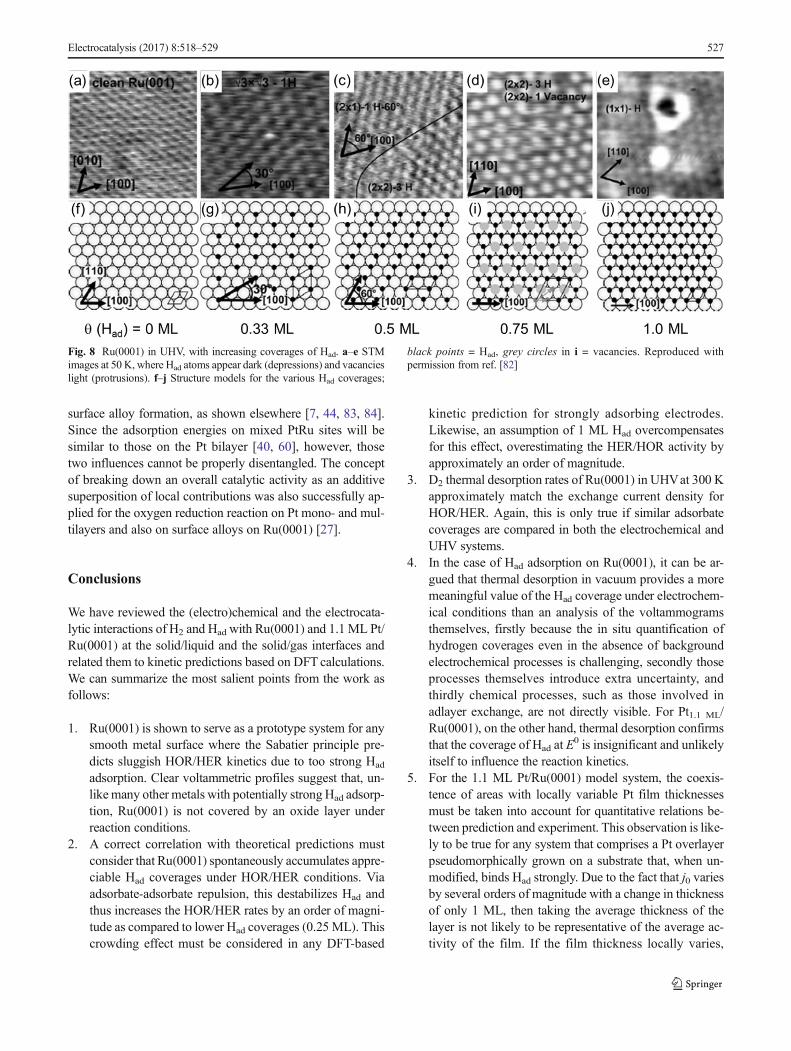
To give an idea about the possible lateral distribution of Had
(or Dad) with increasing coverage at the solid/gas interface,Fig. 8 gives an overview of a UHV-STM study imaging fourdifferent Had layers on Ru(0001) at 50 K [82]. Given that thesestructures are essentially determined by adsorbate-adsorbaterepulsions in combination with the underlying lattice, it is notunlikely that the structures at the solid/liquid interface underreaction conditions are similar. In that picture, a coverage ofθ(Had) = 0.7 ML would be realized by a coexistence of thestructures in Fig. 8h and Fig. 8i.
The value of j0 measured for Ru(0001) lies between thepredictions for high and low Had coverage. This is indicatedby the two full circles connected by a horizontal line on the leftside of Fig. 5. The horizontal line reflects the experimentallyobserved value for j0, whereas the two terminating circlesstand for two different DFT-based predictions for the adsorp-tion energies, which coincide with the two possible extremecases of the Had coverage under reaction conditions (0.25 and1 ML). According to a prediction that can be inferred from acombination of the data presented in refs. [40], 2 ML Pt onRu(0001) should have adsorption properties close to the opti-mum that one can achieve at planar model surfaces—veryclose to the prediction for a Pd monolayer on a PtRu alloy[34]. One monolayer Pt on Ru(0001), however, should still beslightly less active than Pt(111) because it binds H too weakly.
For a quantitative comparison of the experimentally pre-pared 1.1 ML Pt surface with the DFT-based predictions, onemust thus consider that the STM data in Fig. 2c reveals thecoexistence of areas with local layer thicknesses of 0, 1, and2 ML Pt. According to Table 1, the areas with locally 2 ML Ptshould be expected to be much more active than those with1ML Pt, specifically, by a factor of more than 200. Hence, the10% of the surface that has a local Pt thickness of 2 ML willdominate the overall activity and should yield an exchangecurrent density of 2.1 mA cm−2 averaged over the surface, ingood agreement with the experimental value of 2.6 mA cm−2.In Fig. 5, the 1.1 ML Pt surface is represented by a shorthorizontal line that is terminated by two circles representing1 and 2 ML Pt. The lines terminated by the open and closedcircles represent the predicted and measured exchange currentdensities, respectively. It should be noted that the results forthe Pt covered surface may be partially influenced by parasitic
Fig. 7 Temperature programmed desorption spectra of D2 from aRu(0001) and b 1.15 ML Pt/Ru(0001) [81]; initial Dad coveragedecreases from left to right; maximum coverage: θ(Dad) = 1 ML; dottedline in a: θ(Dad) = 0.83 ML; crosshairs: see text; inset: coveragedependent desorption energy EDes [80]. Reproduced with permissionfrom refs. [80, 81]
526 Electrocatalysis (2017) 8:518–529
surface alloy formation, as shown elsewhere [7, 44, 83, 84].Since the adsorption energies on mixed PtRu sites will besimilar to those on the Pt bilayer [40, 60], however, thosetwo influences cannot be properly disentangled. The conceptof breaking down an overall catalytic activity as an additivesuperposition of local contributions was also successfully ap-plied for the oxygen reduction reaction on Pt mono- and mul-tilayers and also on surface alloys on Ru(0001) [27].
Conclusions
We have reviewed the (electro)chemical and the electrocata-lytic interactions of H2 and Had with Ru(0001) and 1.1 ML Pt/Ru(0001) at the solid/liquid and the solid/gas interfaces andrelated them to kinetic predictions based on DFT calculations.We can summarize the most salient points from the work asfollows:
1. Ru(0001) is shown to serve as a prototype system for anysmooth metal surface where the Sabatier principle pre-dicts sluggish HOR/HER kinetics due to too strong Had
adsorption. Clear voltammetric profiles suggest that, un-likemany other metals with potentially strongHad adsorp-tion, Ru(0001) is not covered by an oxide layer underreaction conditions.
2. A correct correlation with theoretical predictions mustconsider that Ru(0001) spontaneously accumulates appre-ciable Had coverages under HOR/HER conditions. Viaadsorbate-adsorbate repulsion, this destabilizes Had andthus increases the HOR/HER rates by an order of magni-tude as compared to lower Had coverages (0.25 ML). Thiscrowding effect must be considered in any DFT-based
kinetic prediction for strongly adsorbing electrodes.Likewise, an assumption of 1 ML Had overcompensatesfor this effect, overestimating the HER/HOR activity byapproximately an order of magnitude.
3. D2 thermal desorption rates of Ru(0001) in UHVat 300 Kapproximately match the exchange current density forHOR/HER. Again, this is only true if similar adsorbatecoverages are compared in both the electrochemical andUHV systems.
4. In the case of Had adsorption on Ru(0001), it can be ar-gued that thermal desorption in vacuum provides a moremeaningful value of the Had coverage under electrochem-ical conditions than an analysis of the voltammogramsthemselves, firstly because the in situ quantification ofhydrogen coverages even in the absence of backgroundelectrochemical processes is challenging, secondly thoseprocesses themselves introduce extra uncertainty, andthirdly chemical processes, such as those involved inadlayer exchange, are not directly visible. For Pt1.1 ML/Ru(0001), on the other hand, thermal desorption confirmsthat the coverage of Had at E
0 is insignificant and unlikelyitself to influence the reaction kinetics.
5. For the 1.1 ML Pt/Ru(0001) model system, the coexis-tence of areas with locally variable Pt film thicknessesmust be taken into account for quantitative relations be-tween prediction and experiment. This observation is like-ly to be true for any system that comprises a Pt overlayerpseudomorphically grown on a substrate that, when un-modified, binds Had strongly. Due to the fact that j0 variesby several orders of magnitude with a change in thicknessof only 1 ML, then taking the average thickness of thelayer is not likely to be representative of the average ac-tivity of the film. If the film thickness locally varies,
Fig. 8 Ru(0001) in UHV, with increasing coverages of Had. a–e STMimages at 50 K, where Had atoms appear dark (depressions) and vacancieslight (protrusions). f–j Structure models for the various Had coverages;
black points = Had, grey circles in i = vacancies. Reproduced withpermission from ref. [82]
Electrocatalysis (2017) 8:518–529 527
quantitative surface imaging is required for a comparisonbetween theory and experiment. Areas of the film with afilm thickness coinciding with the peak of the volcanowould dominate the observed HER/HOR current.
6. Finally, we have discussed the role of dissolved H2 as areference reservoir that is in equilibrium with Had as anadsorbed reaction intermediate. Higher H2 concentrationsin the electrolyte increase the potential windowwhere Had
is more favourable than other adsorbates on the electrode,and within this window, the majority of adsorbates mayresult from chemical rather than electrochemical adsorp-tion. For Ru(0001), this was inferred from the electro-chemical and LEED data and rationalized in a simplethermodynamic model. For electrodes with higher elec-trocatalytic activity, one can assume similar trends, butthey are less visible due to the absence of unambiguousadlayer-related voltammetric features on top of the elec-trocatalytic reaction currents.
Open Access This article is distributed under the terms of the CreativeCommons At t r ibut ion 4 .0 In te rna t ional License (h t tp : / /creativecommons.org/licenses/by/4.0/), which permits unrestricted use,distribution, and reproduction in any medium, provided you give appro-priate credit to the original author(s) and the source, provide a link to theCreative Commons license, and indicate if changes were made.
References
1. M.S. Zei, G. Ertl, Phys. Chem. Chem. Phys. 2, 3855 (2000)2. H. Hoster, B. Richter, R. Behm, J. Phys. Chem. B 108, 14780
(2004)3. T.P. Johansson, E.T. Ulrikkeholm, P. Hernandez-Fernandez, M.
Escudero-Escribano, P. Malacrida, I.E.L. Stephens, I.Chorkendorff, Phys. Chem. Chem. Phys. 16, 13718 (2014)
4. N.M. Markovic, P.N. Ross, Surf. Sci. Rep. 45, 121 (2002)5. H. Hoster, H. Gasteiger, Handb. Fuel Cells 541, 137 (2003)6. M. P. Soriaga, D. A. Harrington, J. L. Stickney, andA.Wieckowski,
in Modern Aspects of Electrochemistry, edited by B. E. Conway, J.O. Bockris, and R. E. White. Plenum Press, New York, 1996.
7. M.P. Mercer, H.E. Hoster, Nano Energy 29, 394 (2016)8. M. Heinen, Y.X. Chen, Z. Jusys, R.J. Behm, Electrochim. Acta 52,
5634 (2007)9. A. Lagutchev, G.Q. Lu, T. Takeshita, D.D. Dlott, A.Wieckowski, J.
Chem. Phys. 125, 154705 (2006)10. J.X. Wang, N.S. Marinković, H. Zajonz, B.M. Ocko, R.R. Adžić, J.
Phys. Chem. B 105, 2809 (2002)11. C. Lu, C. Rice, R.I. Masel, P.K. Babu, P. Waszczuk, H.S. Kim, E.
Oldfield, A. Wieckowski, J. Phys. Chem. B 106, 9581 (2002)12. A.E. Russell, Phys. Chem. Chem. Phys. 10, 3607 (2008)13. A.E. Russell, S. Maniguet, R.J. Mathew, J. Yao, M.A. Roberts, D.
Thompsett, J. Power Sources 96, 226 (2001)14. G. Jerkiewicz, A. Zolfaghari, J. Electrochem. Soc. 143, 1240
(1996)15. E. Skúlason, V. Tripkovic, M.E. Björketun, S. Gudmundsdóttir, G.
Karlberg, J. Rossmeisl, T. Bligaard, H. Jónsson, J.K. Nørskov, J.Phys. Chem. C 114, 18182 (2010)
16. P. Quaino, F. Juarez, E. Santos, W. Schmickler, Beilstein J.Nanotechnol. 5, 846 (2014)
17. G. Jerkiewicz, Electrocatalysis 1, 179 (2010).18. V.R. Stamenkovic, B.S. Mun, M. Arenz, K.J.J. Mayrhofer,
C.A. Lucas, G.F. Wang, P.N. Ross, N.M. Markovic, Nat.Mater. 6, 241 (2007)
19. M. Koper, Surf. Sci. 548, 1 (2004).20. T.P. Johansson, E.T. Ulrikkeholm, P. Hernandez-Fernandez, P.
Malacrida, H.a. Hansen, a.S. Bandarenka, J.K. Nørskov, J.Rossmeisl, I.E.L. Stephens, I. Chorkendorff, Top. Catal. 57, 245(2013)
21. W.F. Lin, M.S. Zei, M. Eiswirth, G. Ertl, T. Iwasita, W. Vielstich, J.Phys. Chem. B 103, 6968 (1999)
22. F. Maillard, G.-Q. Lu, A. Wieckowski, U. Stimming, J. Phys.Chem. B 109, 16230 (2005)
23. P. N. Ross, in Electrocatalysis, edited by J. Lipkowski and P. N.Ross. Wiley-VCH, New York, (1998), pp. 43–74.
24. J.S. Spendelow, A. Wieckowski, Phys Chem.Chem.Phys. 6, 5094(2004)
25. B.E. Hayden, M.E. Rendall, O. South, J. Mol. Catal. A Chem. 228,55 (2005)
26. L. A. Kibler, ChemPhysChem 7, 985 (2006).27. S. Brimaud, A.K. Engstfeld, O.B. Alves, H.E. Hoster, R.J. Behm,
Top. Catal. 57, 222 (2014)28. A. Gross, Top. Catal. 37, 29 (2006)29. M.P. Mercer, D. Plana, D.J. Fermίn, D. Morgan, N. Vasiljevic,
Langmuir 31, 10904 (2015)30. S.J. Lee, S. Mukerjee, E.A. Ticianelli, J. McBreen, Electrochim.
Acta 44, 3283 (1999)31. P. Strasser, S. Koh, T. Anniyev, J. Greeley, K. More, C. Yu, Z. Liu,
S. Kaya, D. Nordlund, H. Ogasawara, M.F. Toney, A. Nilsson, Nat.Chem. 2, 454 (2010)
32. Z. Al Amri, M.P. Mercer, N. Vasiljevic, Electrochim. Acta 210, 520(2016)
33. L. Kibler, Electrochim. Acta 53, 6824 (2008)34. J. Greeley, J.K. Nørskov, L.A. Kibler, A.M. El-Aziz, D.M. Kolb,
ChemPhysChem 7, 1032 (2006)35. H. E. Hoster, MRS Proc. 1388 (2012).36. G. Samjeské, X.Y. Xiao, H. Baltruschat, Langmuir 18, 4659 (2002)37. M.T.M. Koper, T.E. Shubina, R.A. van Santen, J. Phys. Chem. 106,
686 (2002)38. H. Inoue, S.R. Brankovic, J.X. Wang, R. Adzic, Electrochim. Acta
47, 3777 (2002)39. S. Brimaud, A.K. Engstfeld, O.B. Alves, R.J. Behm, J. Electroanal.
Chem. 716, 71 (2014)40. H.E. Hoster, O.B. Alves, M.T.M. Koper, ChemPhysChem 11, 1518
(2010)41. S. Sakong, C. Mosch, A. Gross, PhysChemChemPhys. 9, 2216
(2006)42. D.C. Ford, Y. Xu, M. Mavrikakis, Surf. Sci. 587, 159 (2005)43. H. Rauscher, T. Hager, T. Diemant, H. Hoster, F. Buatier de
Mongeot, R.J. Behm, Surf. Sci. 601, 4608 (2007)44. A.K. Engstfeld, J. Klein, S. Brimaud, R.J. Behm, Surf. Sci. 631,
248 (2014)45. J.X. Wang, S.R. Brankovic, Y. Zhu, J.C. Hanson, R.R. Adzic, J.
Electrochem. Soc. 150, A1108 (2005)46. R.R. Adzic, J. Zhang, K. Sasaki, M.B. Vukmirovic, M. Shao, J.X.
Wang, A.U. Nilekar, M. Mavrikakis, J.A. Valerio, F. Uribe, Top.Catal. 46, 249 (2007)
47. N.M.Marković, B.N. Grgur, C.A. Lucas, P.N. Ross, J. Phys. Chem.B 103, 487 (1999)
48. H. Baltruschat, S. Ernst, ChemPhysChem 12, 56 (2011)49. J.S. Spendelow, A. Wieckowski, ChemInform 36, 5094 (2005)50. N. Marković, P.N. Ross, Surf. Sci. Rep. 45, 117 (2002)51. M.E. Björketun, G.S. Karlberg, J. Rossmeisl, I. Chorkendorff, H.
Wolfschmidt, U. Stimming, J.K. Nørskov, Phys. Rev. B 84, 45407(2011)
528 Electrocatalysis (2017) 8:518–529

52. A. Schlapka, M. Lischka, A. Gross, U. Käsberger, P. Jakob, Phys.Rev. Lett. 91, 16101 (2003)
53. M. Gsell, P. Jakob, D. Menzel, Science 280, 717 (1998)54. P. Jakob, A. Schlapka, Surf. Sci. 601, 3556 (2007)55. B.N.J. Persson, M. Tushaus, A.M. Bradshaw, J. Chem. Phys. 92,
5034 (1990)56. S. Renisch, R. Schuster, J. Wintterlin, G. Ertl, Phys. Rev. Lett. 82,
3839 (1999)57. J.K. Nørskov, T. Bligaard, A. Logadottir, J.R. Kitchin, J.G. Chen, S.
Pandelov, U. Stimming, J. Electrochem. Soc. 152, J23 (2005)58. S. Trasatti, J. Electroanal. Chem. Interfacial Electrochem. 39, 163
(1972)59. A.M. El-Aziz, L.A. Kibler, Electrochem. Commun. 4, 866 (2002)60. H.E. Hoster, M.J. Janik, M. Neurock, R.J. Behm, Phys. Chem.
Chem. Phys. 12, 10388 (2010)61. O.B. Alves, H.E. Hoster, R.J. Behm, Phys. Chem. Chem. Phys. 13,
6010 (2011)62. H. E. Hoster and R. J. Behm, in Fuel Cell Catalysis: a Surface
Science Approach, edited by M. T. M. Koper (John Wiley &Sons, Inc., USA, 2009), pp. 465–505.
63. A.K. Engstfeld, S. Brimaud, R.J. Behm, Angew. Chem. Int. Ed. 53,12936 (2014)
64. A.J. Bard and L.R. Faulkner, in Electrochemical Methods:Fundamentals and Applications (Wiley & Sons, New York,2002), pp. 589–593.
65. G.S. Karlberg, T.F. Jaramillo, E. Skúlason, J. Rossmeisl, T.Bligaard, J.K. Nørskov, Phys. Rev. Lett. 99, 1 (2007)
66. S. Sakong, A. Groß, ACS Catal. 6, 5575 (2016)67. N.M. Marković, T.J. Schmidt, B.N. Grgur, H.A. Gasteiger, R.J.
Behm, P.N. Ross, J. Phys. Chem. B 103, 8568 (1999)68. G. Jerkiewicz, Prog. Surf. Sci. 57, 137 (1998)
69. A. Zolfaghari, G. Jerkiewicz, J. Electroanal. Chem. 420, 11 (1996)70. N. Garcia-Araez, V. Climent, J.M. Feliu, J. Solid State Electrochem.
12, 387 (2007)71. H.A. Hansen, J. Rossmeisl, J.K. Nørskov, Phys. Chem. Chem.
Phys. 10, 3722 (2008)72. J. Rossmeisl, J.K. Nørskov, C.D. Taylor, M.J. Janik, M. Neurock, J.
Phys. Chem. B 110, 21833 (2006)73. C.H. Hamann, A. Hamnett, W. Vielstich, Electrochemistry
(Weinheim, Wiley VCH, 2007)74. N.M. Markovic, B.N. Grgur, P.N. Ross, J. Phys. Chem. B 101,
5405 (1997)75. J. Durst, A. Siebel, C. Simon, F. Hasche, J. Herranz, H.A. Gasteiger,
Energy Environ. Sci. 7, 2255 (2014)76. A.R. Kucernak, C. Zalitis, J. Phys. Chem. C 120, 10721 (2016)77. P. Sabatier, La Catalyse En Chimie Organique (Librairie
Polytechnique Béranger, Paris, 1913)78 I. Ciobica, A. Kleyn, R.A. van Santen, J. Phys. Chem. B 107, 164
(2003)79 P. Feulner, D. Menzel, Surf. Sci. 154, 465 (1985)80 H. Hartmann, T. Diemant, A. Bergbreiter, J. Bansmann, H.E. Hoster,
R.J. Behm, Surf. Sci. 603, 1439 (2009)81 H. Hartmann, T. Diemant, J. Bansmann, R.J. Behm, Phys. Chem.
Chem. Phys. 14, 10919 (2012)82 M. Tatarkhanov, M. Rose, E. Fomin, D.F. Ogletree, M. Salmeron,
Surf. Sci. 602, 487 (2008)83 H. E. Hoster, in Surface and Interface Science, Volume 3: Properties
of Composite Surfaces: Alloys, Compounds, Semiconductors(2014), pp. 329–367.
84 M. Pedersen, S. Helveg, A. Ruban, I. Stensgaard, E. Lægsgaard,J.K. Nørskov, F. Besenbacher, Surf. Sci. 426, 395 (1999)
Electrocatalysis (2017) 8:518–529 529


![Stochastic Electrochemical Kinetics · PDF filearXiv:1608.07507v2 [ ] 18 Sep 2016 Stochastic Electrochemical Kinetics Ot´avio Beruski Instituto de Qu´ımica de](https://img.dokumen.tips/doc/110x75/5abbc4fa7f8b9a76038d1bff/stochastic-electrochemical-kinetics-160807507v2-18-sep-2016-stochastic-electrochemical.jpg)


