Embed Size (px)
Citation preview
R
Eb
JA
a
ARRAA
KDRGRP
C
1
sci
c
0d
Biosensors and Bioelectronics 26 (2010) 1205–1217
Contents lists available at ScienceDirect
Biosensors and Bioelectronics
journa l homepage: www.e lsev ier .com/ locate /b ios
eview
lectrochemical DNA hybridization sensors applied to real and complexiological samples
.P. Tosar, G. Branas, J. Laíz ∗
nalytical Biochemistry Unit of the Nuclear Research Center, Faculty of Science, Universidad de la República, Montevideo, Uruguay
r t i c l e i n f o
rticle history:eceived 15 April 2010eceived in revised form 30 July 2010ccepted 17 August 2010
a b s t r a c t
DNA hybridization biosensors, also known as genosensors, are analytical devices for the detection of spe-cific DNA “target” sequences in solution, upon hybridization of the targets with complementary “probes”immobilized on a solid substrate. Electrochemical genosensors hold great promise to serve as devicessuitable for point-of-care diagnostics and multiplexed platforms for fast, simple and inexpensive nucleic
vailable online 24 August 2010
eywords:NA biosensoreal samplesenomic DNA
acids analysis. Although a lot of progress has been made in the past few years, the performance of genosen-sors in complex biological samples has been assayed in only a small fraction of published research articles.This review covers such a group of reports, from the year 2000 onwards. Special attention is played in thenature and complexity of the samples and in the way matrix effects were treated and specificity controlswere performed.
NACR
© 2010 Elsevier B.V. All rights reserved.
ontents
1. Introduction . . . . . . . . . . . . . . . . . . . . . . . . . . . . . . . . . . . . . . . . . . . . . . . . . . . . . . . . . . . . . . . . . . . . . . . . . . . . . . . . . . . . . . . . . . . . . . . . . . . . . . . . . . . . . . . . . . . . . . . . . . . . . . . . . . . . . . . . . . 12052. Detection of RNA samples without target amplification . . . . . . . . . . . . . . . . . . . . . . . . . . . . . . . . . . . . . . . . . . . . . . . . . . . . . . . . . . . . . . . . . . . . . . . . . . . . . . . . . . . . . . . . . . . . 1209
2.1. Detection of ribosomal 16S/18S rRNA . . . . . . . . . . . . . . . . . . . . . . . . . . . . . . . . . . . . . . . . . . . . . . . . . . . . . . . . . . . . . . . . . . . . . . . . . . . . . . . . . . . . . . . . . . . . . . . . . . . . . . . 12092.2. Detection of specific mRNAs . . . . . . . . . . . . . . . . . . . . . . . . . . . . . . . . . . . . . . . . . . . . . . . . . . . . . . . . . . . . . . . . . . . . . . . . . . . . . . . . . . . . . . . . . . . . . . . . . . . . . . . . . . . . . . . . . 12102.3. Detection of microRNAs . . . . . . . . . . . . . . . . . . . . . . . . . . . . . . . . . . . . . . . . . . . . . . . . . . . . . . . . . . . . . . . . . . . . . . . . . . . . . . . . . . . . . . . . . . . . . . . . . . . . . . . . . . . . . . . . . . . . . . 1211
3. Detection of DNA samples without target amplification . . . . . . . . . . . . . . . . . . . . . . . . . . . . . . . . . . . . . . . . . . . . . . . . . . . . . . . . . . . . . . . . . . . . . . . . . . . . . . . . . . . . . . . . . . . . 12123.1. Detection of genomic DNA . . . . . . . . . . . . . . . . . . . . . . . . . . . . . . . . . . . . . . . . . . . . . . . . . . . . . . . . . . . . . . . . . . . . . . . . . . . . . . . . . . . . . . . . . . . . . . . . . . . . . . . . . . . . . . . . . . . 12123.2. Detection of sequences inserted into plasmids . . . . . . . . . . . . . . . . . . . . . . . . . . . . . . . . . . . . . . . . . . . . . . . . . . . . . . . . . . . . . . . . . . . . . . . . . . . . . . . . . . . . . . . . . . . . . . 1213
4. Detection of PCR products obtained with a low number of PCR cycles and electrochemical real-time PCR . . . . . . . . . . . . . . . . . . . . . . . . . . . . . . . . . . . . . . . 12135. Detection of PCR amplicons obtained with more than 20 PCR cycles . . . . . . . . . . . . . . . . . . . . . . . . . . . . . . . . . . . . . . . . . . . . . . . . . . . . . . . . . . . . . . . . . . . . . . . . . . . . . . . 1214
5.1. PCR detection with reagent-less methods . . . . . . . . . . . . . . . . . . . . . . . . . . . . . . . . . . . . . . . . . . . . . . . . . . . . . . . . . . . . . . . . . . . . . . . . . . . . . . . . . . . . . . . . . . . . . . . . . . . 12155.2. PCR detection with reagent-based approaches . . . . . . . . . . . . . . . . . . . . . . . . . . . . . . . . . . . . . . . . . . . . . . . . . . . . . . . . . . . . . . . . . . . . . . . . . . . . . . . . . . . . . . . . . . . . . . 1215
6. Concluding remarks . . . . . . . . . . . . . . . . . . . . . . . . . . . . . . . . . . . . . . . . . . . . . . . . . . . . . . . . . . . . . . . . . . . . . . . . . . . . . . . . . . . . . . . . . . . . . . . . . . . . . . . . . . . . . . . . . . . . . . . . . . . . . . . . . . 12167. Future perspectives . . . . . . . . . . . . . . . . . . . . . . . . . . . . . . . . . . . . . . . . . . . . . . . . . . . . . . . . . . . . . . . . . . . . . . . . . . . . . . . . . . . . . . . . . . . . . . . . . . . . . . . . . . . . . . . . . . . . . . . . . . . . . . . . . . 1216
Acknowledgments . . . . . . . . . . . . . . . . . . . . . . . . . . . . . . . . . . . . . . . . . . . . . . . . . . . . . . . . . . . . . . . . . . . . . . . . . . . . . . . . . . . . . . . . . . . . . . . . . . . . . . . . . . . . . . . . . . . . . . . . . . . . . . . . . . . 1216References . . . . . . . . . . . . . . . . . . . . . . . . . . . . . . . . . . . . . . . . . . . . . . . . . . . . . . . . . . . . . . . . . . . . . . . . . . . . . . . . . . . . . . . . . . . . . . . . . . . . . . . . . . . . . . . . . . . . . . . . . . . . . . . . . . . . . . . . . . . 1217
. Introduction hybridization assays (Wang, 2000). Today, 10 years after, we mayask how close is the field of electrochemical DNA hybridization
In light of the progress made during the 1990s, DNA biosen-ors and gene chips offered, by the beginning of the XXIst century,onsiderable promise for obtaining sequence-specific informationn a faster, simpler and cheaper manner compared to traditional
∗ Corresponding author at: Centro de Investigaciones Nucleares, Facultad de Cien-ias, Mataojo 2055, 11400 Montevideo, Uruguay.
E-mail address: [email protected] (J. Laíz).
956-5663/$ – see front matter © 2010 Elsevier B.V. All rights reserved.oi:10.1016/j.bios.2010.08.053
biosensors to make an impact on the society by bringing new andrevolutionary technologies to the medical clinic and the patientbedside.
Some authors expect that, with further development andresources, portable electrochemical devices will speed up the diag-
nosis of certain diseases such as cancer, playing an important andsignificant role in the transition towards point-of-care diagnostics(Wang, 2000). DNA hybridization biosensors with electrochemi-cal detection have a very important strength which is the ease of
1 Bioele
isots
teehmooisbwdt
rcfnitm
gtuglpp
Fdhhc
206 J.P. Tosar et al. / Biosensors and
mplementation in a miniaturized and automated device. The con-olidated success obtained with glucose amperometric biosensorspens the question if similar hand-held analyzers may be designedo detect specific nucleic acid sequences in unprocessed biologicalamples.
Many different strategies have been described for the elec-rochemical detection of nucleic acids. They rely on the intrinsiclectrochemical properties of DNA or in the concentration oflectroactive species near the electrode, either before or afterybridization. The different methods are usually classified into twoain categories: label-free or label-based approaches, depending
n the nature of the electrochemical signal. Label-free meth-ds imply that the signal arises from the hybridization event bytself, without the need of concentrating any special electroactivepecies on the electrode surface, apart from target DNA. Label-ased approaches rely on the use of other electroactive moleculeshich can discriminate between single-stranded DNA (ssDNA) andouble-stranded hybrids (dsDNA), or are concentrated on the elec-rode surface only after target DNA is present.
A slightly different classification divides the literature intoeagent-less (Fig. 1) and reagent-based methods (Fig. 2). The con-ept behind this classification is not strictly the same and we willocus on it for practical reasons. A reagent-less method avoids theeed of introducing a reagent during the protocol, and then wash-
ng the reagent out. For this reasons, they are easier to automatehan reagent-based methods which may be time-consuming or
ore expensive.Intrinsic electrochemical properties of DNA, i.e., oxidation of
uanine moieties, can be exploited for sequence-specific detec-ion of DNA. However, both target sequences and DNA probes
sually contain guanine residues, making it difficult to assign theuanine oxidation signal to the probes or to the targets. This prob-em was solved by replacing guanine residues in the immobilizedrobes by inosine (Wang et al., 1998), a base which is not naturallyresent in DNA but can also base-pair with cytosine, as guanineig. 1. Reagent-less methods for the electrochemical detection of DNA hybridization. (esigned by replacing guanine (red circles) with inosine (yellow circles). (B) Detectionybridization. Oligonucelotide probes are shown in red, and complementary DNA targeybridization represents measurable changes in the electrochemical properties of the inomplementary DNA probes. (For interpretation of the references to color in this figure le
ctronics 26 (2010) 1205–1217
does (Fig. 1A). Since DNA is a polyanionic molecule, hybridiza-tion usually results in considerable changes in the electrochemicalproperties of the interface, which can be measured by differentelectrochemical methods (Fig. 1B). Fan et al. (2003) first describedthe use of immobilized partially self-complementary DNA probeslabeled with an electroactive reporter as the hybridization sens-ing element (Fig. 1C). On hybridization, the distance between thelabel and the electrode is significantly altered due to conforma-tional changes in the probes, leading to a measurable signal change.It should be noticed that although this method is label-based, it isstill reagent-less, as the label is bound to the probes and there is noneed of a labeling step in the protocol.
Reagent-based methods usually rely on electroactive specieswhich bind specifically to either ssDNA (Fig. 2A) or dsDNA (Fig. 2B).Probably the most widely used of such a kind of redox indicators ismethylene blue (MB). Many reports have shown how the reductioncurrent of MB is diminished after hybridization, as MB binds specif-ically to free guanine bases present in ssDNA (Yang et al., 2002).However, it is also shown that MB can bind dsDNA with high affin-ity, by either electrostatic, groove or intercalative binding (Zhouet al., 2008). For this reasons, many reports seem contradictive,as MB reduction signal may increase or decrease after hybridiza-tion depending on the experimental conditions. Besides, as targetDNA sequences are usually larger than oligonucleotide probes,hybridization both increases the amount of dsDNA and ssDNA nearthe electrode surface (Fig. 1A), yielding a difficult interpretation ofthe results.
Apart from the immobilized probes and the hybridized targetsequences, a third redox-labeled reporter sequence may be exoge-nously added. If the reporting sequence is complementary to the
target in a different region to the sequence which is recognized bythe probes, then detection can be performed by what is called asandwich approach. One advantage of this kind of strategies is thatthey are very insensitive to non-specific cross-hybridization. Sand-wich approaches are also very useful to concentrate redox enzymesA) Detection by guanine oxidation. Guanine-free oligonucleotides probes may beby monitoring changes in the electrochemical properties of the interface after
ts are represented in green. The different distribution of anions and cations afterterface. (C) Hybridization-induced conformational changes of redox-labeled self-gend, the reader is referred to the web version of the article.)
J.P. Tosar et al. / Biosensors and Bioelectronics 26 (2010) 1205–1217 1207
Fig. 2. Reagent-based methods for the electrochemical detection of DNA hybridization. Oligonucelotide probes are shown in red, and complementary DNA targets arerepresented in green. (A) Redox indicators with affinity towards single-stranded DNA (blue arrowheads). (B) Redox indicators with affinity towards double-stranded DNA(red ellipses). Some of such indicators may have electrocatalytic properties towards guanine oxidation. (C) Signal amplification by concentration of redox enzymes throughs conjus oduct,r
ncwwfiams
oratcbbFb(e
teucdc
isF
andwich hybridization assays. Labeled reporter probes are shown in blue. Enzyme-ubstrate is denoted by the letter S, which is later converted to an electroactive preferred to the web version of the article.)
ear the electrode after hybridization (Fig. 2C). Enzymes catalyzeonversion of many substrate molecules to electroactive products,hich are oxidized or reduced at the electrode’s surface. In thisay, substrate molecules can be regenerated, leading to an ampli-cation of the signal. Some other strategies were also described,s the use of silver and gold nanoparticles (Steel et al., 1998), butost of the articles reviewed herein fail into one of the schemes
ummarized in Figs. 1 and 2.A rule of thumb is that, when describing a new detection method
r introducing a new variation, initial experiments should be car-ied out with synthetic oligonucleotides which are complementarynd not-complementary to the immobilized probes (Fig. 3A). Theseypes of experiments are necessary since they serve as the proof ofoncept that the immobilization and detection method which iseing investigated does work, and that it is able to discriminateetween complementary targets and unspecific DNA sequences.urthermore, ultrasensitive detection at femtomolar levels haseen achieved by many authors using synthetic oligonucleotidesBaur et al., 2010; Liu et al., 2008; Zhang et al., 2004, 2006; Hansent al., 2006).
Although these results are encouraging, the performance ofhe genosensor with a real complex biological sample may bentirely different. Indeed, results cannot be extrapolated to these of more complex samples without the inclusion of adequateontrols, as the matrix in which the target sequence is embed-ed may give a background signal which should be taken into
onsideration.Some of the problems which may be encountered when chang-ng the experimental conditions from synthetic oligonucleotides inolution to a complex biological sample are schematized in Fig. 3.or instance, the target sequence may be present, but hybridiza-
gated antibodies specific to the labeled reporter are shown in orange. The enzyme’sP. (For interpretation of the references to color in this figure legend, the reader is
tion is impaired because the matrix components can “block” theelectrode surface leading to a false negative result (Fig. 3B). Oth-erwise, matrix components may bind the electrode surface withhigh affinity, either by cross-hybridization with the probes orby unspecific adsorption. If these unspecific binding resist thewashing steps, then false positives may also appear (Fig. 3C).Hybridization may take place normally, but matrix componentsmay be able to suppress the analytical signal for a variety of rea-sons (Fig. 3D). Especially true when working with RNA, the targetsequence may be degraded by enzymes present in the sample(Fig. 3E).
The importance of analyzing the performance of electrochem-ical genosensors with a variety of complex biologically relevantsamples has been addressed by other authors (Luong et al., 2008;Sadik et al., 2009). Only a very small fraction of research articles inthe field of electrochemical genosensors have gone beyond the useof synthetic oligonucleotides and evaluated the performance of thesystem in real samples. The actual scope of this review is to addressprogress achieved in this direction.
A hierarchical classification of the most common types of sam-ples used in the articles reviewed herein is given in Fig. 4. Thisclassification takes into consideration both the strategies used forsample pre-processing and the complexity of the resulting matrix.As the same type of sample may be obtained by different methods,the degree of complexity is actually variable. It may be argued thata method which has a good performance with the most complex
samples (a crude cell extract, for example) is robust. We will use the“target to interference ratio” as a means to illustrate the analyticalchallenge of detecting a specific target sequence in a sample whichcontain an excess of other sequences and molecules which we willgenerally group as “interferences”.
1208 J.P. Tosar et al. / Biosensors and Bioelectronics 26 (2010) 1205–1217
Fig. 3. Matrix effects can affect the performance of a genosensor when performing detection with real biological samples. Studies made with pure synthetic complementaryand non-complementary oligonucleotides in solution (A) are compared with different situations which can arise when incubating the electrodes in biological material (B–E).Immobilized probes are represented in blue, complementary targets are painted green and interferences are shown in red. The grey circles represent free electroactive dsDNAintercalators. Intercalators which have bound to DNA are shown as black circles. (For interpretation of the references to color in this figure legend, the reader is referred tothe web version of the article.)

J.P. Tosar et al. / Biosensors and Bioelectronics 26 (2010) 1205–1217 1209
F usini
2
tafR
taisspMesi
2
sravio(maft
(caet
ig. 4. Different types of biological material which can be used for target detectionnterference ratio increases downwards.
. Detection of RNA samples without target amplification
Only a very small percentage of genomic DNA codes for pro-eins. However, it is well known that a very large fraction of DNA isctively transcribed to RNA (Gerstein et al., 2007). Thus, significantractions of RNA species present in a cell extract are non-codingNAs distinct from mRNAs.
Researchers are not only interested in the detection and quan-ification of protein-coding RNAs. Ribosomal RNAs are highlybundant and conserved molecules which can be used for speciesdentification without the need of in vitro nucleic acid amplificationteps. Regulatory RNAs such as miRNAs can regulate the expres-ion of a large subset of genes and are implicated in many humanathologies included cancer (Esquela-Kerscher and Slack, 2006).any times the aim of the analysis is not focused in host gene
xpression but in the detection of pathogens. It should then be con-idered that many viruses are RNA viruses, and carry their geneticnformation in the form of RNA molecules.
.1. Detection of ribosomal 16S/18S rRNA
Ribosomal 16S RNA (16S rRNA) forms part of the smallerubunit of the prokaryotic ribosome (in eukaryotes, the smalleribosome subunit contains a larger 18S rRNA). Since it is function-lly constant, shows a mosaic structure of conserved and moreariable regions, occurs in all prokaryotic organisms, has limitedntragenomic heterogeneity between multiple 16S rRNA oper-ns and is present in a very high copy number in cell extractsCoenye and Vandamme, 2003), it is widely used as a target
olecule in genosensor articles in which prokaryotic organismsre detected at the RNA level. The high copy number is a decisiveactor, since it enables detection without prior in vitro amplifica-ion.
In the year 2001, Gau et al. designed a microelectromechanical
MEMS) system capable of detecting 1000 Escherichia coli (E. coli)ells without PCR amplification. Bacteria cultures were lysed and anmount of biotinylated oligonucleotides was added to the crude cellxtract in order to perform solution-phase hybridization betweenhe ssDNA probes and bacterial rRNA. Fluorescein-conjugatedg genosensors. Upper samples are less processed and more complex. The target to
detector probes, complementary to a different sequence of thebacterial rRNA, were also added. Thus, an ssDNA–rRNA–ssDNAsandwich hybrid was formed. An amount of this mixture wasplaced on the streptavidin-coated working electrodes of theMEMS detector array. By doing so, the solution-formed sandwichhybrid was immobilized due to the biotin–streptavidin interaction.After washing, anti-fluorescein antibodies conjugated to perox-idase were added. A second washing step eliminated unboundantibody–enzyme conjugates. The substrate of the enzyme (H2O2)was then introduced, together with the redox soluble mediator3,3′,5,5′-tetramethylbenzidine (TMB), which can carry electronsfrom the electrode to the oxidized form of the enzyme, andvice versa. 20 s after addition of substrate, the electrical currentcorresponding to the reduction of oxidized TMB was registeredamperometrically. The authors compared the electrical signalsobtained after different dilutions of an E. coli lysate with thatobtained after incubation with an extract from Bordetella bron-chiseptica, an unrelated bacterium. They found that the electricalcurrent from as low as 1000 E. coli cells was more than twice that of2.5 × 105 cells of B. bronchiseptica (Gau et al., 2001). With the excep-tion that the probe/target/reporter sandwich hybrid was formedin solution in this case, the overall strategy is the same to thatschematized in Fig. 2C.
It should be noticed that the nature of the sample in the abovementioned report was a crude cell extract, the highest type of sam-ple in terms of complexity of those shown in Fig. 4. The backgroundsignal was defined using another crude extract obtained upon lysisof an average number of cells from an unrelated organism. Thus, thebackground signal accounts not only for the unspecific adsorptionof enzymes and substrates and the possible cross-hybridizationwith rRNA from a different organism, but also serves to estimatethe effect of unspecific adsorption of different components of thesample on the analytical signal (matrix effect).
A very similar approach was followed by Sun et al. (2005)
for rapid, species-specific detection of uropathogens based on thesequence of their 16S rRNA. In this case, the fluorescein-conjugateddetector probes where hybridized in solution with the bacteriallysates, and the mixture was deposited on the working electrodesof a 16-sensor array developed by GeneFluidics Inc. (Montrey Park,
1 Bioele
Cwapftwaacwesta
tolm(mhn((ac
hsbfbwnaesbtbit1igct
(olrpaTtcopamcfs
210 J.P. Tosar et al. / Biosensors and
A). The working electrodes were coated with streptavidin, tohich 35-mer biotinylated capture probes were immobilized. The
uthors compared the signal obtained with capture and detectionrobes specific to E. coli 16S rRNA, after incubation with lysatesrom different uropathogenic bacteria. The signal corresponding tohe E. coli lysate was about 20 times higher than when incubatingith lysates from Proteus mirabilis, Klebsiella oxytoca, Pseudomonas
eruginosa, Klebsiella pneumoniae and Enterobacter cloacae. The neg-tive samples gave electrical signals very similar to the negativeontrol, without bacterial nucleic acids. Thus, they showed that itas possible to electrochemically discriminate E. coli from differ-
nt uropathogens in non-amplified crude cell extracts. The authorshowed that detection could be carried out in 40 min and at roomemperature, although the signal to background ratio was highert 65 ◦C (Gau et al., 2005; Sun et al., 2005).
Gabig-Ciminska et al. (2004) described an electric chip for detec-ion and quantification of nucleic acids, and evaluated the detectionf 16S rRNA in a total RNA extract from a E. coli culture. The biotiny-ated capture probes were immobilized on strepatividin-coated
agnetic beads. After incubation with the sample, a digoxigeninDIG)-labeled detection probe was added, which was comple-
entary to a different region of the target. Upon completion ofybridization, the magnetic beads were separated using an exter-al magnet, washed, and exposed to anti-DIG–ALP conjugatesALP stands for alkaline phosphatase). p-Aminophenol phosphatepAPP) was added, which was hydrolyzed by bounded ALP, yieldingn electroactive product which could be detected amperometri-ally after transfer to the electric chip (Gabig-Ciminska et al., 2004).
LaGier et al. (2005) also developed an electrochemical RNAybridization assay for detection of E. coli, based on its 16S rRNAequence. Probe-modified magnetic beads were used, and incu-ated with either RNA extracts from E. coli (from 108 colonyorming units, CFU) or E. coli cell lysates (from 109 CFU). Magneticeads were separated and washed after hybridization, and treatedith sulfuric acid in order to hydrolyze nucleic acids and releaseucleotides into solution. Guanine nucleotides were accumulatedt a graphite electrode and were afterwards detected by differ-ntial pulse voltammetry (DPV; the guanine oxidation method ischematized in Fig. 1A). A blank run without E. coli RNA gave theackground signal corresponding to the guanine bases present inhe oligonucleotide probes. The authors also incubated magneticeads not conjugated to DNA probes with total E. coli RNA extracts,
n order to show that there was negligible non-specific adsorptiono the beads. The capture probe was designed to bind not only E. coli6S rRNA but also rRNA from other species belonging to the fam-
ly Enterobacteriacae. Indeed, all Enterobacteriacae species testedave positive and similar signals, while P. aeruginosa and Enterococ-us fecalis (non-enterobacteria) gave signals indistinguishable fromhe background (LaGier et al., 2005).
A sandwich hybridization assay was developed by Metfies et al.2005) for detection of the toxic dinoflagellate (algae) Alexandriumstenfeldii. A biotinylated capture probe and a digoxigenin (DIG)-abeled detection probe were designed against A. ostenfeldii 18SRNA. The capture probe was immobilized to the surface of a dis-osable avidin-coated sensor chip. Peroxidase was concentratedt the electrode surface by conjugation to anti-DIG antibodies.he redox mediator p-aminodiphenylamin (ADPA) was used inhis case, and its reduction current was measured amperometri-ally using a hand-held device. The hybridization conditions wereptimized changing the salt concentration, the hybridization tem-erature, and evaluating heat fragmentation of the rRNA and the
ddition of helper oligonucleotides which hybridize to other seg-ents of the 18S rRNA and help to keep the rRNA in an “opened”onfiguration. Total RNA extraction from algae cultures was per-ormed, and the signal intensities of three different A. ostenfeldiitrains were compared to different Alexandrium species and found
ctronics 26 (2010) 1205–1217
to be much higher in the three cases. Furthermore, the two specieswhich gave a weak but measurable signal were those closer to A.ostenfeldii in phylogenetic tree analysis (Metfies et al., 2005).
A portable, multi-probe and semi-automated device using a sim-ilar detection system was later designed for taxon specific detectionof toxic algae (Diercks et al., 2008). Again, the probe specificitytests were done comparing laboratory strains with closely relatedspecies, in order to avoid false positives and to guarantee that onlydesired strains were detected.
We have stated above that incubation with extracts from similarbut unrelated organisms may serve as an adequate negative controlin order to account for the background signal given by unspe-cific adsorption of reactants and matrix components. However,when the aim is to perform species-specific detection, comparisonsshould be made between the closest neighbors in the phylogenetictree, as the appearance of a “false positive” signal is more prob-able to arise from cross-hybridization (Fig. 3C). Probes should becarefully designed so that they are 100% complementary to the tar-get sequence in the desired specie/s, but they contain a reasonablenumber of mismatches towards the target sequence in its closestneighbors (Sun et al., 2005; LaGier et al., 2005).
2.2. Detection of specific mRNAs
The copy number of a specific mRNA in a particular cell typevaries drastically from an mRNA to another, and depends on a seriesof factors which are usually related to the molecular function of theprotein for which that mRNA codifies. In general, the copy numberof a particular mRNA in a cell extract is much smaller than the copynumber of ribosomal rRNA molecules, although some viral mRNAsor mRNAs expressed from artificially introduced expression vectorscan also be transcribed to high intracellular levels. Thus, detectionof specific mRNAs without prior amplification is a challenging task,due to the low target to interference ratio which would probablyexist.
In the year 2004, Xie et al. described a method for detec-tion and quantification of breast cancer susceptibility genes bymicroarrays with electrochemical detection (Xie et al., 2004a). Theauthors immobilized 24-mer oligonucleotides in each spot of an8 × 8 sensor array, which were complementary to the sequencesof breast cancer susceptibility genes such as p53, HSP90, BRCA1and Histone H4, plus a house-keeping gene (GAPDH) used for nor-malization. mRNA was extracted from both healthy and cancerhuman breast tissues and total mRNA was labeled with cisplatin-coupled biotin conjugates. Labeled mRNA was hybridized to thearray surface and incubated with avidin–glucose oxidase and thenthe surface was overcoated with a cationic redox polymer contain-ing osmium–bipyridine complexes. This type of redox polymerswere previously shown to interact and electrochemically activateanionic enzymes such as glucose oxidase (Xie et al., 2004b). Theoxidation current of glucose in solution was detected amperomet-rically at 0.36 V vs. Ag/AgCl.
By comparing glucose oxidation currents in 20 ng mRNA usingoligonucleotide probes complementary and not-complementary top53, the authors demonstrated the specificity of the assay. The sen-sitivity was evaluated by addition of a specific mRNA into 50 ng oftotal mRNA. It was possible to unambiguously detect “gene expres-sion differences” of less than 1-fold. The authors also validatedtheir method by comparing their results with another conventionalnon-electrochemical method for gene expression quantification(ribonuclease protection assays) obtaining very good agreement
for the five genes that were tested. The lowest detectable amountof a specific gene which could be detected was found to be around800 copies in 1.5 ng of mRNA.There are several aspects in this seminal work that we thinkshould be highlighted. We have previously shown examples of how
Bioele
st(fsbtmsspaackpec
woisabdt
ameionai(sispw(pa
gipcrttg
2
nnciAtde
J.P. Tosar et al. / Biosensors and
pecificity of a given method may be addressed, by the use of con-rol experiments with extracts from similar but unrelated samplese.g., extracts from different organisms, different cell types, or dif-erent experimental conditions). In this case, the authors kept theame sample but changed the sequence of the probe. Shifting theases of the probe in order to design an irrelevant sequence withhe same base composition may be the best way of evaluating the
atrix effect. Testing the same probes in a similar but unrelatedample may give complementary information, provided that theamples are similar enough in composition and that there is inde-endent evidence that the target nucleic acid is absent or expressedt negligible levels. These kinds of negative controls are conceptu-lly different than testing the genosensor in extracts derived fromlose evolutionary related species. As we have stated before, thatind of experiments are used for demonstrating the possibility oferforming species-specific detection, since the control sample isxpected to express the target sequence in similar levels, thoughontaining at least one mismatches.
Another aspect that we would like to highlight is the way inhich the sensitivity of the assay was evaluated. Serial dilutions
f a pure synthetic complementary oligonucleotide are not verynformative because they do not take the “matrix effect” into con-ideration. When informing the detection limit, it is much moreccurate and analytically relevant to express the minimum num-er of copies/grams/moles of the target sequence that could beetected in a given amount of total mRNA, because that illustrateshe target to interference ratio.
Tansil et al. (2005) also reported a nucleic acid biosensorpproach for detection of the oncogene p53 (also called TP53) inRNA extracted from rat liver tissues, without a RT-PCR step. The
lectroactive intercalator PIND-Ru was used in this case. PIND-Runtercalates very strongly to dsDNA and can be electrochemicallyxidized at 0.62 V vs. Ag/AgCl. The authors also showed how gua-ine bases in the target sequences were catalytically oxidizedt that potential by PIND-Ru, since the anodic current at 0.62 Vncreased almost linearly with the guanine content in the targetsthis type of detection strategy is schematized in Fig. 2B). Theelectivity of the biosensor was evaluated in 1.0 �g mRNA, compar-ng the signal obtained with probes containing perfectly matchedequences to probes which contained one-base mismatch to the53 mRNA. The current increment for the one-base mismatchedas only about 40% of that of the perfectly matched sequence
Tansil et al., 2005). Since the sample is the same for both com-arisons, it can be stated that the sensor has a very good specificitynd is sensible to single base mismatches.
There are many reports that intend to show that a givenenosensor is sensible to single base mismatches by simply chang-ng incubation in a pure aqueous solution of synthetic targets by aure aqueous solution of synthetic one-base mismatched oligonu-leotides. As performed by Tansil et al. (2005), when working witheal samples the sequence of the probe should be changed in ordero introduce the mismatches, except samples from patients knowno contain single-nucleotide polymorphisms (SNPs) in the targetene are available.
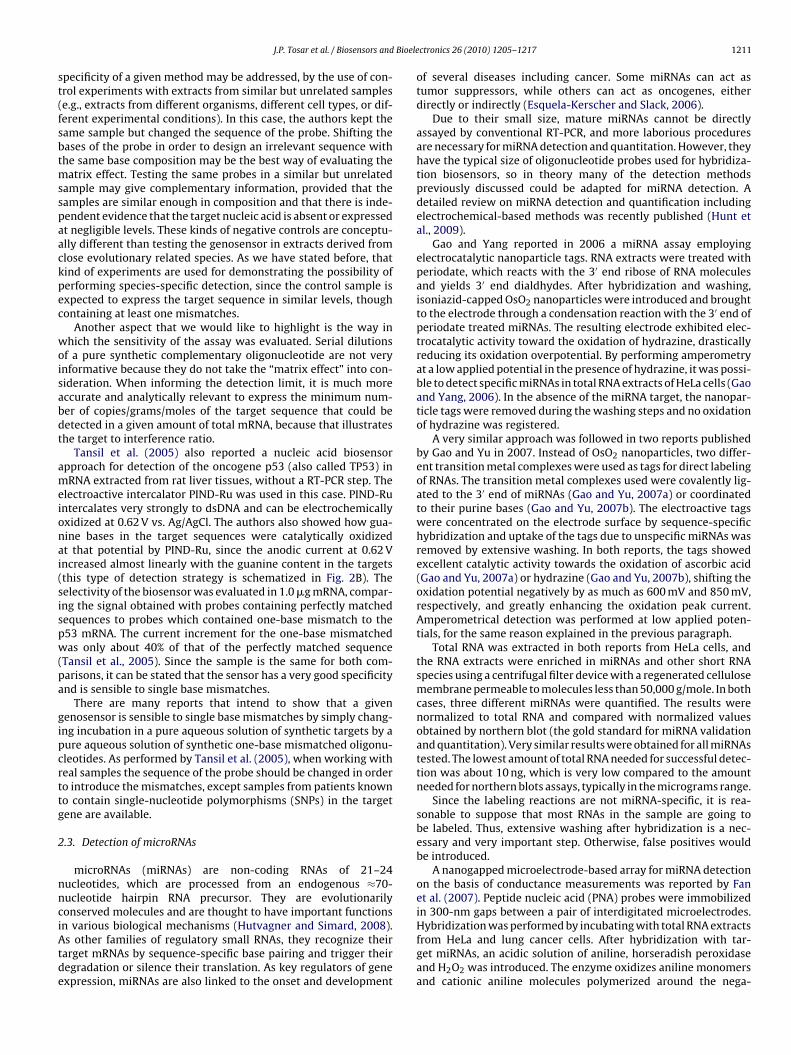
.3. Detection of microRNAs
microRNAs (miRNAs) are non-coding RNAs of 21–24ucleotides, which are processed from an endogenous ≈70-ucleotide hairpin RNA precursor. They are evolutionarilyonserved molecules and are thought to have important functions
n various biological mechanisms (Hutvagner and Simard, 2008).s other families of regulatory small RNAs, they recognize theirarget mRNAs by sequence-specific base pairing and trigger theiregradation or silence their translation. As key regulators of genexpression, miRNAs are also linked to the onset and development
ctronics 26 (2010) 1205–1217 1211
of several diseases including cancer. Some miRNAs can act astumor suppressors, while others can act as oncogenes, eitherdirectly or indirectly (Esquela-Kerscher and Slack, 2006).
Due to their small size, mature miRNAs cannot be directlyassayed by conventional RT-PCR, and more laborious proceduresare necessary for miRNA detection and quantitation. However, theyhave the typical size of oligonucleotide probes used for hybridiza-tion biosensors, so in theory many of the detection methodspreviously discussed could be adapted for miRNA detection. Adetailed review on miRNA detection and quantification includingelectrochemical-based methods was recently published (Hunt etal., 2009).
Gao and Yang reported in 2006 a miRNA assay employingelectrocatalytic nanoparticle tags. RNA extracts were treated withperiodate, which reacts with the 3′ end ribose of RNA moleculesand yields 3′ end dialdhydes. After hybridization and washing,isoniazid-capped OsO2 nanoparticles were introduced and broughtto the electrode through a condensation reaction with the 3′ end ofperiodate treated miRNAs. The resulting electrode exhibited elec-trocatalytic activity toward the oxidation of hydrazine, drasticallyreducing its oxidation overpotential. By performing amperometryat a low applied potential in the presence of hydrazine, it was possi-ble to detect specific miRNAs in total RNA extracts of HeLa cells (Gaoand Yang, 2006). In the absence of the miRNA target, the nanopar-ticle tags were removed during the washing steps and no oxidationof hydrazine was registered.
A very similar approach was followed in two reports publishedby Gao and Yu in 2007. Instead of OsO2 nanoparticles, two differ-ent transition metal complexes were used as tags for direct labelingof RNAs. The transition metal complexes used were covalently lig-ated to the 3′ end of miRNAs (Gao and Yu, 2007a) or coordinatedto their purine bases (Gao and Yu, 2007b). The electroactive tagswere concentrated on the electrode surface by sequence-specifichybridization and uptake of the tags due to unspecific miRNAs wasremoved by extensive washing. In both reports, the tags showedexcellent catalytic activity towards the oxidation of ascorbic acid(Gao and Yu, 2007a) or hydrazine (Gao and Yu, 2007b), shifting theoxidation potential negatively by as much as 600 mV and 850 mV,respectively, and greatly enhancing the oxidation peak current.Amperometrical detection was performed at low applied poten-tials, for the same reason explained in the previous paragraph.
Total RNA was extracted in both reports from HeLa cells, andthe RNA extracts were enriched in miRNAs and other short RNAspecies using a centrifugal filter device with a regenerated cellulosemembrane permeable to molecules less than 50,000 g/mole. In bothcases, three different miRNAs were quantified. The results werenormalized to total RNA and compared with normalized valuesobtained by northern blot (the gold standard for miRNA validationand quantitation). Very similar results were obtained for all miRNAstested. The lowest amount of total RNA needed for successful detec-tion was about 10 ng, which is very low compared to the amountneeded for northern blots assays, typically in the micrograms range.
Since the labeling reactions are not miRNA-specific, it is rea-sonable to suppose that most RNAs in the sample are going tobe labeled. Thus, extensive washing after hybridization is a nec-essary and very important step. Otherwise, false positives wouldbe introduced.
A nanogapped microelectrode-based array for miRNA detectionon the basis of conductance measurements was reported by Fanet al. (2007). Peptide nucleic acid (PNA) probes were immobilizedin 300-nm gaps between a pair of interdigitated microelectrodes.
Hybridization was performed by incubating with total RNA extractsfrom HeLa and lung cancer cells. After hybridization with tar-get miRNAs, an acidic solution of aniline, horseradish peroxidaseand H2O2 was introduced. The enzyme oxidizes aniline monomersand cationic aniline molecules polymerized around the nega-
1 Bioele
tpTopca
3
3
Dconedd
cntoitmbttenTaiaf
colaewTtetua
rspbwttcss
ei
212 J.P. Tosar et al. / Biosensors and
ively charged miRNA/PNA hybrids. By doping with HCl vapors,olyaniline was expanded to form a disordered conductive net.he formation of such a conductive net depends on the presencef negatively charged miRNAs hybridized to the uncharged PNArobes, and can be easily detected by monitoring changes in theonductivity of the solution between the microelectrodes (Fan etl., 2007).
. Detection of DNA samples without target amplification
.1. Detection of genomic DNA
If a genosensor is designed to detect a specific gene in a genomicNA extraction, the target to interference ratio will vary signifi-antly according to the size of the genome (which is a propertyf the species), but it will be very low even if the sample doesot contain any other material apart from the genomic DNA. How-ver, some genes are present at high copy numbers in the genomeue to gene duplication events, and conserved sequences withinuplicated genes may be used for design of capture probes.
Another possibility is to design oligonucleotide probes whichan hybridize to regions of the genome which are conserved but doot codify for proteins. In fact, intergenic regions account for 75% ofhe human genome (Lander et al., 2001; Venter et al., 2001), manyf which is under evolutionary selection (Gerstein et al., 2007). Anmportant fraction of intergenic regions is composed of differentypes of repeated elements such as satellite DNA, minisatellites,
icrosatellites, and tandem repeats, which consist of blocks of DNAases which are repeated in tandem a variable number of times inhe genome. These may serve as convenient sequences to use asargets, since they are naturally amplified. The same happens, forxample, with rRNA genes (rDNA), which are present in high copyumbers in the genome, and are suitable for species discrimination.he target to interference ratio is significantly higher if detection ofmulti-copy sequence such as 16S rDNA is intended in an organ-
sm with a small genome such as E. coli, rather than detection ofsingle-copy gene in genomic DNA extractions of vertebrate cells,
or example.Mascini et al. (2005) described a label-free method for identifi-
ation of mammalian species (bovine and sheep) in DNA extractsbtained from unprocessed tissues, based on the sequences of satel-ites DNA and on the guanine oxidation signal. According to Pech etl., 29% of the total bovine genome consists of satellite DNA (Pecht al., 1979). Due to the high copy number of the target sequence, itas possible to perform detection without prior PCR amplification.
he report served as a proof of concept that species identifica-ion with electrochemical label-free detection in unamplified DNAxtracts was possible. The authors stated that rapid characteriza-ion of food samples to determine whether or not they containnwanted species seems suitable using this technique (Mascini etl., 2005).
Probes were carefully designed in order to hybridize withegions within satellite DNA which showed the least degree ofimilarity between different mammalian species. This enabled toerform species-specific detection by avoiding cross reactivityetween different samples. Inosine-modified, guanine-free probesere used as previously described. In that way, the appearance of
he guanine oxidation peak could be assigned to the hybridizedargets, though unspecifically adsorbed nucleic acids would alsoontribute to the guanine oxidation signal. This fact should be con-
idered when performing detection based on the guanine oxidationignal in real samples.Purified genomic DNA was fragmented with the restrictionnzyme EcoRI. This step aimed to reduce the size of DNA fragmentsn order to avoid steric hindrance during hybridization. DNA sam-
ctronics 26 (2010) 1205–1217
ples were thermally denaturalized by dipping the vial containingthe sample in a boiling water bath at 95 ◦C for 5 min, followed by1 min in an ice-water bath. A drop of this solution was deposited onthe probe-modified working electrode for 10 min and square-wavevoltammetry was performed in order to detect the appearance ofthe guanine oxidation signal.
The authors tested the selectivity of the sensor using bovine-and sheep-specific probes, while incubating with genomic DNAextracted from bovine and porcine tissues. Thus, three types of neg-ative controls were included: bovine probes with porcine extracts,sheep probes with bovine extracts, and sheep probes with porcineextracts. The three negative controls did not differ significantlyfrom each other and presented signals much lower than thoseobtained when the bovine probes and the bovine samples wereused (a guanine peak area increase of more than 4-fold wasobserved for sample concentrations of 20–80 �g/mL).
Arora et al. (2007) reported an electrochemical sensor based onthe signal of methylene blue, for detection of E. coli based on a 5′-biotin-labeled probe specific to E. coli, immobilized on a Pt diskelectrode via avidin-modified polyaniline (PANI). E. coli genomicDNA (0.01 ng/�L) was used as the sample, but detection was alsoachieved in total cell extracts from E. coli cultures. Furthermore,the sensor could be reused 5–7 times at temperatures of 30–45 ◦C(Arora et al., 2007). Reusability is an important factor to considerwhen electrodes are made from expensive material such as Pt.The same group published another report in which genomic DNAfrom Mycobacterium tuberculosis could be detected within 1 minof hybridization time using NH2-modified peptide nucleic acid(PNA) probes covalently immobilized to PANI/Au electrodes. Again,methylene blue was used for detection and reusability of the elec-trodes was also studied (Prabhakar et al., 2008). In both reports,genomic DNA was fragmentized by sonication.
In 2009, another report from the group of Bansi Malhotra waspublished, in which a specific gene from the etiologic agent ofGonorrhoea (the Gram negative bacterium Neisseria gonorrhoeae)was detected in DNA extracted directly from patients’ endocer-vical and urethral swabs. 20-Mer biotinylated probes specific tothe Opa gene from N. gonorrhoeae were immobilized on avidin-modified PANI/ITO electrodes (Singh et al., 2009). Detection wasperformed using differential pulse voltammetry (DPV), by mon-itoring the redox behavior of methylene blue. When incubatingthe electrodes with N. gonorrhoeae genomic DNA extracted frompatients or from N. gonorrhoeae cultures, a significant decrease ofthe methylene blue signal was observed. Genomic DNA extractedfrom the relative bacterium Neisseria meningitides and from thenon-related Gram negative bacterium E. coli were used as controlsof specificity. These negative controls generated an increase ratherthan a decrease of the methylene blue signal. Detection was alsoperformed on the basis of the guanine oxidation signal. In this case,a significant increase of the guanine peak was observed when incu-bating with N. gonorrhoeae DNA, while it decreased after incubationwith the negative samples (Singh et al., 2009).
We would like to highlight the criteria used for the election of thetarget sequence. The Opa genes codify for surface proteins impor-tant for bacterial attachment to different cell types encounteredduring infection and are present in high copy number in the N. gon-orrhoeae genome. A single strain can harbour up to 12 Opa genesin its genome (Hauck and Meyer, 2003) and there is near-perfectidentity in DNA sequence over approximately 80% of the length ofthe coding sequence (Dempsey et al., 1991). Thus, the election of aconserved sequence within a multi copy gene increases the target
to interference ratio in the sample without the need of any arti-ficial amplification steps, increasing the analytical performance ofthe method.Another article from the Malhotra’s group aimed at detectionof E. coli using methylene blue as the electroactive hybridiza-
Bioele
tagwpNwbgbttfs(ihwgf
cfclwManpvwsahfas
iss(pmsWtg
3
sTipattancidt
J.P. Tosar et al. / Biosensors and
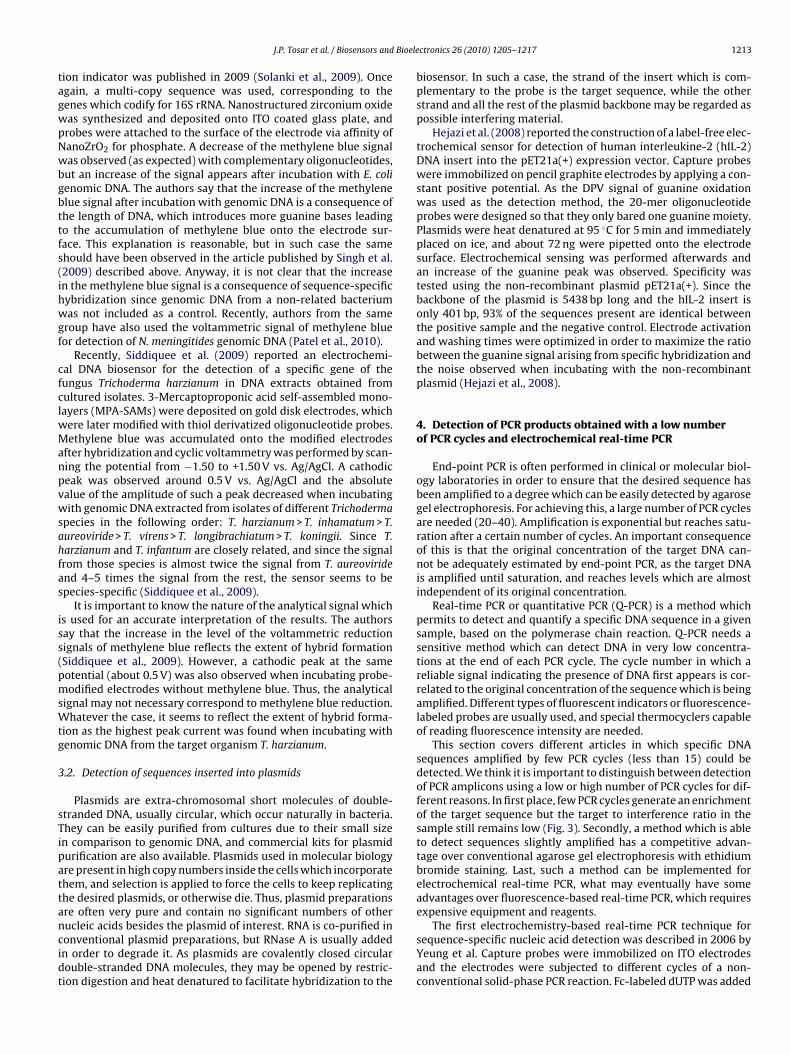
ion indicator was published in 2009 (Solanki et al., 2009). Oncegain, a multi-copy sequence was used, corresponding to theenes which codify for 16S rRNA. Nanostructured zirconium oxideas synthesized and deposited onto ITO coated glass plate, androbes were attached to the surface of the electrode via affinity ofanoZrO2 for phosphate. A decrease of the methylene blue signalas observed (as expected) with complementary oligonucleotides,
ut an increase of the signal appears after incubation with E. colienomic DNA. The authors say that the increase of the methylenelue signal after incubation with genomic DNA is a consequence ofhe length of DNA, which introduces more guanine bases leadingo the accumulation of methylene blue onto the electrode sur-ace. This explanation is reasonable, but in such case the samehould have been observed in the article published by Singh et al.2009) described above. Anyway, it is not clear that the increasen the methylene blue signal is a consequence of sequence-specificybridization since genomic DNA from a non-related bacteriumas not included as a control. Recently, authors from the same
roup have also used the voltammetric signal of methylene blueor detection of N. meningitides genomic DNA (Patel et al., 2010).
Recently, Siddiquee et al. (2009) reported an electrochemi-al DNA biosensor for the detection of a specific gene of theungus Trichoderma harzianum in DNA extracts obtained fromultured isolates. 3-Mercaptoproponic acid self-assembled mono-ayers (MPA-SAMs) were deposited on gold disk electrodes, which
ere later modified with thiol derivatized oligonucleotide probes.ethylene blue was accumulated onto the modified electrodes
fter hybridization and cyclic voltammetry was performed by scan-ing the potential from −1.50 to +1.50 V vs. Ag/AgCl. A cathodiceak was observed around 0.5 V vs. Ag/AgCl and the absolutealue of the amplitude of such a peak decreased when incubatingith genomic DNA extracted from isolates of different Trichoderma
pecies in the following order: T. harzianum > T. inhamatum > T.ureoviride > T. virens > T. longibrachiatum > T. koningii. Since T.arzianum and T. infantum are closely related, and since the signalrom those species is almost twice the signal from T. aureoviridend 4–5 times the signal from the rest, the sensor seems to bepecies-specific (Siddiquee et al., 2009).
It is important to know the nature of the analytical signal whichs used for an accurate interpretation of the results. The authorsay that the increase in the level of the voltammetric reductionignals of methylene blue reflects the extent of hybrid formationSiddiquee et al., 2009). However, a cathodic peak at the sameotential (about 0.5 V) was also observed when incubating probe-odified electrodes without methylene blue. Thus, the analytical
ignal may not necessary correspond to methylene blue reduction.hatever the case, it seems to reflect the extent of hybrid forma-
ion as the highest peak current was found when incubating withenomic DNA from the target organism T. harzianum.
.2. Detection of sequences inserted into plasmids
Plasmids are extra-chromosomal short molecules of double-tranded DNA, usually circular, which occur naturally in bacteria.hey can be easily purified from cultures due to their small sizen comparison to genomic DNA, and commercial kits for plasmidurification are also available. Plasmids used in molecular biologyre present in high copy numbers inside the cells which incorporatehem, and selection is applied to force the cells to keep replicatinghe desired plasmids, or otherwise die. Thus, plasmid preparationsre often very pure and contain no significant numbers of other
ucleic acids besides the plasmid of interest. RNA is co-purified inonventional plasmid preparations, but RNase A is usually addedn order to degrade it. As plasmids are covalently closed circularouble-stranded DNA molecules, they may be opened by restric-ion digestion and heat denatured to facilitate hybridization to thectronics 26 (2010) 1205–1217 1213
biosensor. In such a case, the strand of the insert which is com-plementary to the probe is the target sequence, while the otherstrand and all the rest of the plasmid backbone may be regarded aspossible interfering material.
Hejazi et al. (2008) reported the construction of a label-free elec-trochemical sensor for detection of human interleukine-2 (hIL-2)DNA insert into the pET21a(+) expression vector. Capture probeswere immobilized on pencil graphite electrodes by applying a con-stant positive potential. As the DPV signal of guanine oxidationwas used as the detection method, the 20-mer oligonucleotideprobes were designed so that they only bared one guanine moiety.Plasmids were heat denatured at 95 ◦C for 5 min and immediatelyplaced on ice, and about 72 ng were pipetted onto the electrodesurface. Electrochemical sensing was performed afterwards andan increase of the guanine peak was observed. Specificity wastested using the non-recombinant plasmid pET21a(+). Since thebackbone of the plasmid is 5438 bp long and the hIL-2 insert isonly 401 bp, 93% of the sequences present are identical betweenthe positive sample and the negative control. Electrode activationand washing times were optimized in order to maximize the ratiobetween the guanine signal arising from specific hybridization andthe noise observed when incubating with the non-recombinantplasmid (Hejazi et al., 2008).
4. Detection of PCR products obtained with a low numberof PCR cycles and electrochemical real-time PCR
End-point PCR is often performed in clinical or molecular biol-ogy laboratories in order to ensure that the desired sequence hasbeen amplified to a degree which can be easily detected by agarosegel electrophoresis. For achieving this, a large number of PCR cyclesare needed (20–40). Amplification is exponential but reaches satu-ration after a certain number of cycles. An important consequenceof this is that the original concentration of the target DNA can-not be adequately estimated by end-point PCR, as the target DNAis amplified until saturation, and reaches levels which are almostindependent of its original concentration.
Real-time PCR or quantitative PCR (Q-PCR) is a method whichpermits to detect and quantify a specific DNA sequence in a givensample, based on the polymerase chain reaction. Q-PCR needs asensitive method which can detect DNA in very low concentra-tions at the end of each PCR cycle. The cycle number in which areliable signal indicating the presence of DNA first appears is cor-related to the original concentration of the sequence which is beingamplified. Different types of fluorescent indicators or fluorescence-labeled probes are usually used, and special thermocyclers capableof reading fluorescence intensity are needed.
This section covers different articles in which specific DNAsequences amplified by few PCR cycles (less than 15) could bedetected. We think it is important to distinguish between detectionof PCR amplicons using a low or high number of PCR cycles for dif-ferent reasons. In first place, few PCR cycles generate an enrichmentof the target sequence but the target to interference ratio in thesample still remains low (Fig. 3). Secondly, a method which is ableto detect sequences slightly amplified has a competitive advan-tage over conventional agarose gel electrophoresis with ethidiumbromide staining. Last, such a method can be implemented forelectrochemical real-time PCR, what may eventually have someadvantages over fluorescence-based real-time PCR, which requiresexpensive equipment and reagents.
The first electrochemistry-based real-time PCR technique forsequence-specific nucleic acid detection was described in 2006 byYeung et al. Capture probes were immobilized on ITO electrodesand the electrodes were subjected to different cycles of a non-conventional solid-phase PCR reaction. Fc-labeled dUTP was added

1 Bioele
tRpoptaeeP
tccawbcAPdric
tgwcnilpaawhrawdco2
bsciTthactabdt
otPilt
214 J.P. Tosar et al. / Biosensors and
o the reaction mixture. Uracil is a nucleotide naturally found inNA but not in DNA molecules, but DNA polymerases can incor-orate uracil if it is included in the reaction mixture in the formf dUTP. After hybridization, the temperature was raised and DNAolymerases started the elongation process. Immobilized probeshat were hybridized to larger DNA molecules served as primersnd Fc-labeled uracil was incorporated to the probes during thelongation process. Thus, immobilized probes were elongated inach PCR cycle, incorporating more redox label as the number ofCR cycles increased (Yeung et al., 2006a).
Later on, the same authors published another article in whichhe same method was further studied. They found that for a highoncentration of template DNA in the unamplified material (3 × 10⁶
opies/�L) the onset thermal cycle, defined as the cycle where thenalytical signal begins to be distinguishable from the background,as much lower (just 3–5 PCR cycles) than that of the fluorescence-
ased counterparts. However, the onset thermal cycle increasedonsiderably as the DNA initial concentration was lowered down.s electrochemical sensing of the electrodes interfered with theCR reaction, the authors decided to only scan the electrodes onceuring the whole reaction. Using different electrodes and settingeactions in parallel, real time analysis was performed, though eachndividual electrode was scanned in only one determined thermalycle (Yeung et al., 2008).
In the same year, Lermo et al. (2008) described another methodowards electrochemical quantitative PCR. In this case, the eaeAene of pathogenic E. coli was used as the target sequence. PCRas performed and stopped after 5, 10, 15, 20, 25 or 30 thermal
ycles. The methodology described has the particularity that it isot strictly a genosensor-based approach as no capture probe is
mmobilized in the electrode surface. Instead, PCR primers wereabeled with biotin (forward primers) or digoxigenin (DIG; reverserimers), and the double-tagged PCR amplicons were immobilizedfter completion of the reaction on avidin-modified electrodes.nti-DIG antibodies conjugated to horseradish peroxidase (HRP)ere added, and after washing steps to remove unbound enzyme,ydrogen peroxide was added together with hydroquinone as aedox mediator. Hydroquinone is oxidized to quinone by HRP,nd the electrical current corresponding to quinone reductionas registered amperometrically. In a second set of experiments,ouble-tagged PCR amplicons were immobilized in straptavidin-oated magnetic beads, which were concentrated using a magnetnto the surface of a graphite-epoxy biocomposite (Lermo et al.,008).
Comparative studies were performed using standard Q-PCRased on TaqMan fluorescent probes and agarose gel electrophore-is. For a DNA template concentration of 2 ng/�L, the onset thermalycle was 10 and 13 for magnetic and non-magnetic electrochem-cal strategies, respectively, 15 for gel electrophoresis and 17 foraqMan Q-PCR. The detection limit was defined as the lowest DNAemplate concentration which gave a cathodic current significantlyigher than that which arises from a blank experiment (no DNAdded to the PCR reaction mixture), for a given number of PCRycles. For the magnetic bead strategy, the authors report detec-ion limits of 0.45 ng/�L, 4.5 pg/�L and 0.45 pg/�L template DNAt 10, 15 and 20 PCR cycles, respectively. When performing immo-ilization of double-tagged amplicons to avidin-coated electrodes,etection limits were 4.5 ng/�L, 0.45 ng/�L and 4.5 pg/�L, respec-ively (Lermo et al., 2008).
Electrochemical real-time PCR microfluidic devices were devel-ped by Fang et al. (2009), where both the amplification of the
arget sequence and subsequent electrochemical detection of theCR amplicon were realized simultaneously at selected PCR cyclesn the same device. PCR mixture containing template DNA wasoaded in a chamber present in the microdevice and pumped alonghe chip following a serpentine arrange of microchannels. The chipctronics 26 (2010) 1205–1217
contained three thermoelectric coolers which were responsible ofgenerating three zones in the chip with different temperatures, cor-responding to the temperatures needed for PCR reaction. Due to theloops present in the microchannels, the PCR mixture was pumpedseveral times across zone 1 (denaturation), 2 (annealing) and 3(extension), and a total of 26 PCR cycles were included in the chip.11 sets of electrochemical detection stations were fabricated onthe chip. Each station comprised a platinum working, counter andpseudo-reference microelectrode connected to an external poten-tiostat by an insulating wire. Electrochemical detection stationswere placed at only some selected PCR cycle numbers: 5, 8, 10,12, 14, 16, 18, 20, 22, 24 and 26.
This mechanism of in situ electrochemical detection of PCRamplicons is based on the DNA intercalation of methylene blue.Square-wave voltammetry measurements were performed at eachdetection station and the signal corresponding to the reversible oxi-dation of methylene blue at the platinum electrodes was registered.As the number of PCR cycles increases, more double-stranded DNAis present in solution at the end of each extension step. Accordingly,more methylene blue binds DNA and so the number of indicatormolecules which can suffer reversible oxidation at the electrodesurface is reduced. As expected, it was observed that the peak inten-sities decreased with the PCR cycle number. Peak intensities vs.PCR cycle number were plotted to obtain the threshold cycle (Ct),which is the number of cycle in which the electrochemical sig-nal reaches a particular threshold. Comparisons were made withconventional fluorescence-based real-time PCR using SYBR Green.The Ct values for both the electrochemical and fluorescence-basedassays decreased linearly with the increase of the input target quan-tity (Fang et al., 2009) but Ct values were about 7 cycles lower forconventional fluorescence detection.
Neither probes nor PCR amplicons were immobilized on theelectrodes in this method, so this report is not strictly based ongenosensor technology. Nevertheless, it is important to highlightthat the method is able to electrochemically detect PCR ampliconsamplified by a low number of cycles (5, 8 10, 12. . .), enabling bothquantitative and real-time PCR.
5. Detection of PCR amplicons obtained with more than 20PCR cycles
Starting from a very complex sample which may eventually con-tain very small amounts of DNA from different organisms togetherwith a variety of other compounds, PCR can amplify a fragmentseizing less than a hundred to more than a thousand base-pairslong. Amplification may be performed to such high levels that asingle and intense DNA band of the expected size may be seenafter agarose gel electrophoresis and ethidium bromide staining.If this type of PCR product is going to be used for detection using agenosensor, the target to interference ratio approximates the valueof 1, as the strand which is complementary to the probe will be the“target stand” while the complementary strand may act as “theinterference”. Thus, it may happen that a detection method whichworks efficiently for detection of PCR amplicons may not have sucha performance with other types of samples with lower target tointerference ratios.
If both forward and reverse primers are not included in simi-lar concentrations in the PCR reaction mixture, then asymmetricPCR takes place. Due to the excess of one of the primers, one DNAstrands is preferentially amplified over the other, and the PCR prod-
uct after a large number of cycles gets mainly single-stranded.This avoids the need of heat denaturing before hybridization withthe probe-modified electrode. Furthermore, if amplification is effi-cient, the target to interference ratio may acquire values greaterthan 1. Asymmetric solution-phase and solid-phase PCR are used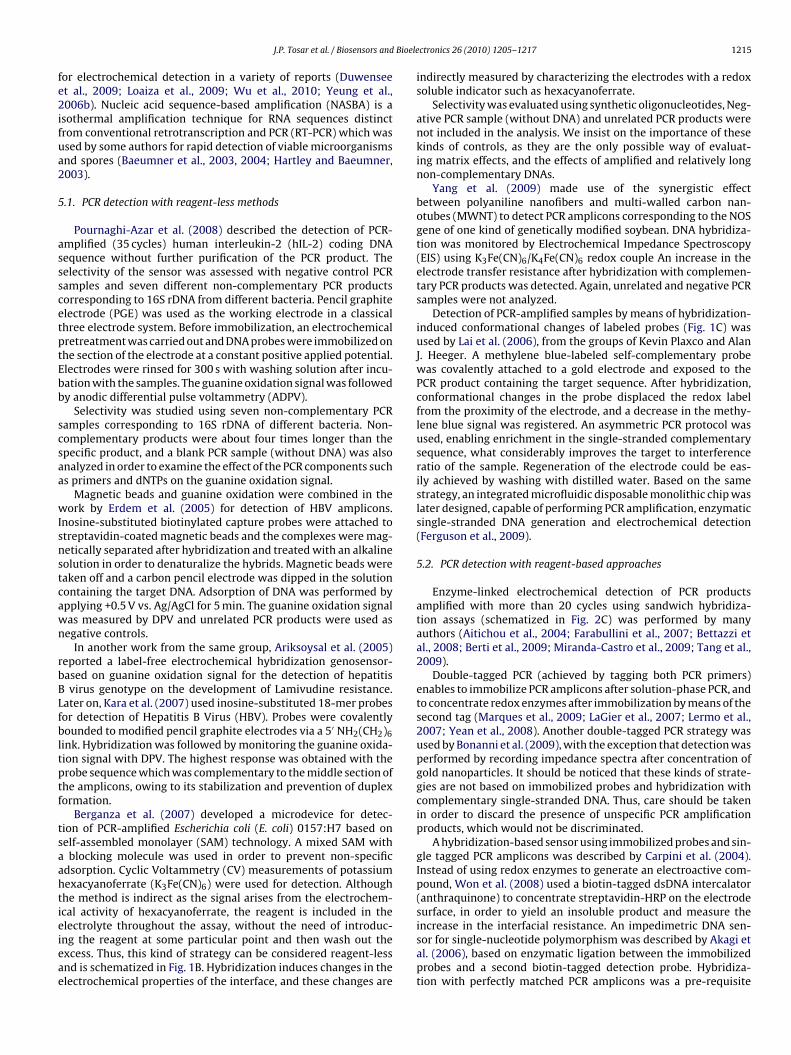
Bioele
fe2ifua2
5
assscetptEbb
scsaa
wIsnstcawn
rbBLfbltptf
tsaahtieieae
J.P. Tosar et al. / Biosensors and
or electrochemical detection in a variety of reports (Duwenseet al., 2009; Loaiza et al., 2009; Wu et al., 2010; Yeung et al.,006b). Nucleic acid sequence-based amplification (NASBA) is a
sothermal amplification technique for RNA sequences distinctrom conventional retrotranscription and PCR (RT-PCR) which wassed by some authors for rapid detection of viable microorganismsnd spores (Baeumner et al., 2003, 2004; Hartley and Baeumner,003).
.1. PCR detection with reagent-less methods
Pournaghi-Azar et al. (2008) described the detection of PCR-mplified (35 cycles) human interleukin-2 (hIL-2) coding DNAequence without further purification of the PCR product. Theelectivity of the sensor was assessed with negative control PCRamples and seven different non-complementary PCR productsorresponding to 16S rDNA from different bacteria. Pencil graphitelectrode (PGE) was used as the working electrode in a classicalhree electrode system. Before immobilization, an electrochemicalretreatment was carried out and DNA probes were immobilized onhe section of the electrode at a constant positive applied potential.lectrodes were rinsed for 300 s with washing solution after incu-ation with the samples. The guanine oxidation signal was followedy anodic differential pulse voltammetry (ADPV).
Selectivity was studied using seven non-complementary PCRamples corresponding to 16S rDNA of different bacteria. Non-omplementary products were about four times longer than thepecific product, and a blank PCR sample (without DNA) was alsonalyzed in order to examine the effect of the PCR components suchs primers and dNTPs on the guanine oxidation signal.
Magnetic beads and guanine oxidation were combined in theork by Erdem et al. (2005) for detection of HBV amplicons.
nosine-substituted biotinylated capture probes were attached totreptavidin-coated magnetic beads and the complexes were mag-etically separated after hybridization and treated with an alkalineolution in order to denaturalize the hybrids. Magnetic beads wereaken off and a carbon pencil electrode was dipped in the solutionontaining the target DNA. Adsorption of DNA was performed bypplying +0.5 V vs. Ag/AgCl for 5 min. The guanine oxidation signalas measured by DPV and unrelated PCR products were used asegative controls.
In another work from the same group, Ariksoysal et al. (2005)eported a label-free electrochemical hybridization genosensor-ased on guanine oxidation signal for the detection of hepatitisvirus genotype on the development of Lamivudine resistance.
ater on, Kara et al. (2007) used inosine-substituted 18-mer probesor detection of Hepatitis B Virus (HBV). Probes were covalentlyounded to modified pencil graphite electrodes via a 5′ NH2(CH2)6
ink. Hybridization was followed by monitoring the guanine oxida-ion signal with DPV. The highest response was obtained with therobe sequence which was complementary to the middle section ofhe amplicons, owing to its stabilization and prevention of duplexormation.
Berganza et al. (2007) developed a microdevice for detec-ion of PCR-amplified Escherichia coli (E. coli) 0157:H7 based onelf-assembled monolayer (SAM) technology. A mixed SAM withblocking molecule was used in order to prevent non-specific
dsorption. Cyclic Voltammetry (CV) measurements of potassiumexacyanoferrate (K3Fe(CN)6) were used for detection. Althoughhe method is indirect as the signal arises from the electrochem-cal activity of hexacyanoferrate, the reagent is included in the
lectrolyte throughout the assay, without the need of introduc-ng the reagent at some particular point and then wash out thexcess. Thus, this kind of strategy can be considered reagent-lessnd is schematized in Fig. 1B. Hybridization induces changes in thelectrochemical properties of the interface, and these changes arectronics 26 (2010) 1205–1217 1215
indirectly measured by characterizing the electrodes with a redoxsoluble indicator such as hexacyanoferrate.
Selectivity was evaluated using synthetic oligonucleotides, Neg-ative PCR sample (without DNA) and unrelated PCR products werenot included in the analysis. We insist on the importance of thesekinds of controls, as they are the only possible way of evaluat-ing matrix effects, and the effects of amplified and relatively longnon-complementary DNAs.
Yang et al. (2009) made use of the synergistic effectbetween polyaniline nanofibers and multi-walled carbon nan-otubes (MWNT) to detect PCR amplicons corresponding to the NOSgene of one kind of genetically modified soybean. DNA hybridiza-tion was monitored by Electrochemical Impedance Spectroscopy(EIS) using K3Fe(CN)6/K4Fe(CN)6 redox couple An increase in theelectrode transfer resistance after hybridization with complemen-tary PCR products was detected. Again, unrelated and negative PCRsamples were not analyzed.
Detection of PCR-amplified samples by means of hybridization-induced conformational changes of labeled probes (Fig. 1C) wasused by Lai et al. (2006), from the groups of Kevin Plaxco and AlanJ. Heeger. A methylene blue-labeled self-complementary probewas covalently attached to a gold electrode and exposed to thePCR product containing the target sequence. After hybridization,conformational changes in the probe displaced the redox labelfrom the proximity of the electrode, and a decrease in the methy-lene blue signal was registered. An asymmetric PCR protocol wasused, enabling enrichment in the single-stranded complementarysequence, what considerably improves the target to interferenceratio of the sample. Regeneration of the electrode could be eas-ily achieved by washing with distilled water. Based on the samestrategy, an integrated microfluidic disposable monolithic chip waslater designed, capable of performing PCR amplification, enzymaticsingle-stranded DNA generation and electrochemical detection(Ferguson et al., 2009).
5.2. PCR detection with reagent-based approaches
Enzyme-linked electrochemical detection of PCR productsamplified with more than 20 cycles using sandwich hybridiza-tion assays (schematized in Fig. 2C) was performed by manyauthors (Aitichou et al., 2004; Farabullini et al., 2007; Bettazzi etal., 2008; Berti et al., 2009; Miranda-Castro et al., 2009; Tang et al.,2009).
Double-tagged PCR (achieved by tagging both PCR primers)enables to immobilize PCR amplicons after solution-phase PCR, andto concentrate redox enzymes after immobilization by means of thesecond tag (Marques et al., 2009; LaGier et al., 2007; Lermo et al.,2007; Yean et al., 2008). Another double-tagged PCR strategy wasused by Bonanni et al. (2009), with the exception that detection wasperformed by recording impedance spectra after concentration ofgold nanoparticles. It should be noticed that these kinds of strate-gies are not based on immobilized probes and hybridization withcomplementary single-stranded DNA. Thus, care should be takenin order to discard the presence of unspecific PCR amplificationproducts, which would not be discriminated.
A hybridization-based sensor using immobilized probes and sin-gle tagged PCR amplicons was described by Carpini et al. (2004).Instead of using redox enzymes to generate an electroactive com-pound, Won et al. (2008) used a biotin-tagged dsDNA intercalator(anthraquinone) to concentrate streptavidin-HRP on the electrodesurface, in order to yield an insoluble product and measure the
increase in the interfacial resistance. An impedimetric DNA sen-sor for single-nucleotide polymorphism was described by Akagi etal. (2006), based on enzymatic ligation between the immobilizedprobes and a second biotin-tagged detection probe. Hybridiza-tion with perfectly matched PCR amplicons was a pre-requisite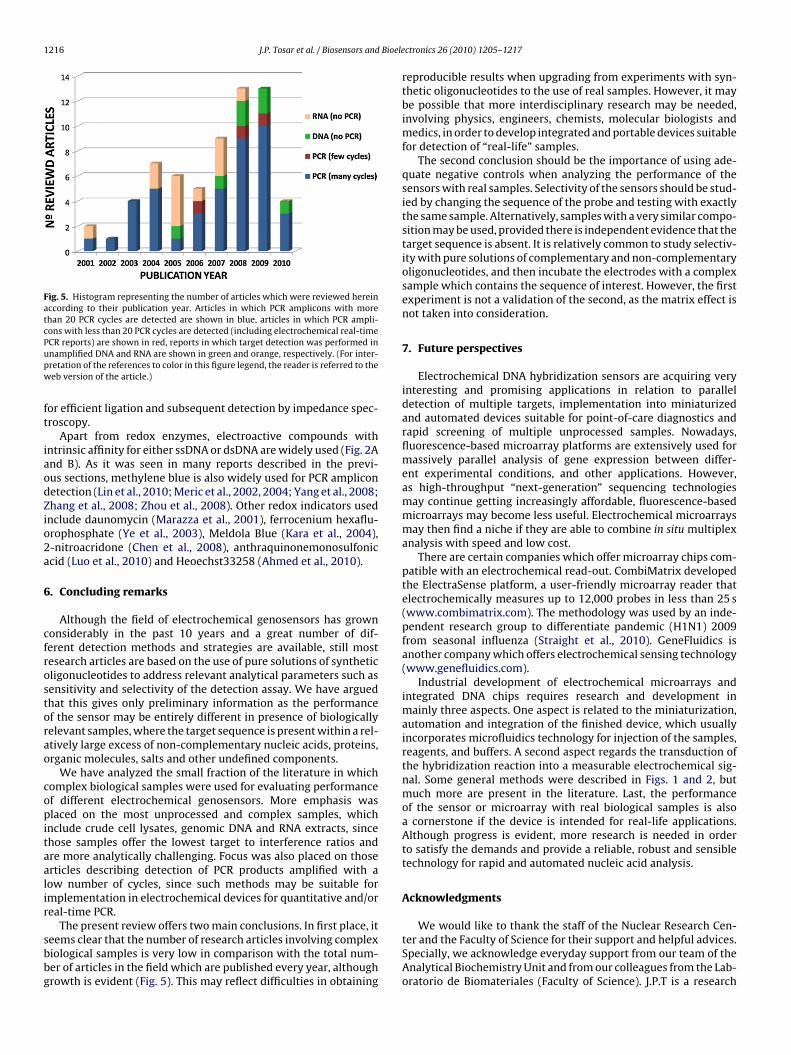
1216 J.P. Tosar et al. / Biosensors and Bioele
Fig. 5. Histogram representing the number of articles which were reviewed hereinaccording to their publication year. Articles in which PCR amplicons with morethan 20 PCR cycles are detected are shown in blue, articles in which PCR ampli-cons with less than 20 PCR cycles are detected (including electrochemical real-timePupw
ft
iaodZio2a
6
cfrostorao
copitaalir
sbbg
CR reports) are shown in red, reports in which target detection was performed innamplified DNA and RNA are shown in green and orange, respectively. (For inter-retation of the references to color in this figure legend, the reader is referred to theeb version of the article.)
or efficient ligation and subsequent detection by impedance spec-roscopy.
Apart from redox enzymes, electroactive compounds withntrinsic affinity for either ssDNA or dsDNA are widely used (Fig. 2And B). As it was seen in many reports described in the previ-us sections, methylene blue is also widely used for PCR ampliconetection (Lin et al., 2010; Meric et al., 2002, 2004; Yang et al., 2008;hang et al., 2008; Zhou et al., 2008). Other redox indicators usednclude daunomycin (Marazza et al., 2001), ferrocenium hexaflu-rophosphate (Ye et al., 2003), Meldola Blue (Kara et al., 2004),-nitroacridone (Chen et al., 2008), anthraquinonemonosulfoniccid (Luo et al., 2010) and Heoechst33258 (Ahmed et al., 2010).
. Concluding remarks
Although the field of electrochemical genosensors has grownonsiderably in the past 10 years and a great number of dif-erent detection methods and strategies are available, still mostesearch articles are based on the use of pure solutions of syntheticligonucleotides to address relevant analytical parameters such asensitivity and selectivity of the detection assay. We have arguedhat this gives only preliminary information as the performancef the sensor may be entirely different in presence of biologicallyelevant samples, where the target sequence is present within a rel-tively large excess of non-complementary nucleic acids, proteins,rganic molecules, salts and other undefined components.
We have analyzed the small fraction of the literature in whichomplex biological samples were used for evaluating performancef different electrochemical genosensors. More emphasis waslaced on the most unprocessed and complex samples, which
nclude crude cell lysates, genomic DNA and RNA extracts, sincehose samples offer the lowest target to interference ratios andre more analytically challenging. Focus was also placed on thoserticles describing detection of PCR products amplified with aow number of cycles, since such methods may be suitable formplementation in electrochemical devices for quantitative and/oreal-time PCR.
The present review offers two main conclusions. In first place, iteems clear that the number of research articles involving complexiological samples is very low in comparison with the total num-er of articles in the field which are published every year, althoughrowth is evident (Fig. 5). This may reflect difficulties in obtaining
ctronics 26 (2010) 1205–1217
reproducible results when upgrading from experiments with syn-thetic oligonucleotides to the use of real samples. However, it maybe possible that more interdisciplinary research may be needed,involving physics, engineers, chemists, molecular biologists andmedics, in order to develop integrated and portable devices suitablefor detection of “real-life” samples.
The second conclusion should be the importance of using ade-quate negative controls when analyzing the performance of thesensors with real samples. Selectivity of the sensors should be stud-ied by changing the sequence of the probe and testing with exactlythe same sample. Alternatively, samples with a very similar compo-sition may be used, provided there is independent evidence that thetarget sequence is absent. It is relatively common to study selectiv-ity with pure solutions of complementary and non-complementaryoligonucleotides, and then incubate the electrodes with a complexsample which contains the sequence of interest. However, the firstexperiment is not a validation of the second, as the matrix effect isnot taken into consideration.
7. Future perspectives
Electrochemical DNA hybridization sensors are acquiring veryinteresting and promising applications in relation to paralleldetection of multiple targets, implementation into miniaturizedand automated devices suitable for point-of-care diagnostics andrapid screening of multiple unprocessed samples. Nowadays,fluorescence-based microarray platforms are extensively used formassively parallel analysis of gene expression between differ-ent experimental conditions, and other applications. However,as high-throughput “next-generation” sequencing technologiesmay continue getting increasingly affordable, fluorescence-basedmicroarrays may become less useful. Electrochemical microarraysmay then find a niche if they are able to combine in situ multiplexanalysis with speed and low cost.
There are certain companies which offer microarray chips com-patible with an electrochemical read-out. CombiMatrix developedthe ElectraSense platform, a user-friendly microarray reader thatelectrochemically measures up to 12,000 probes in less than 25 s(www.combimatrix.com). The methodology was used by an inde-pendent research group to differentiate pandemic (H1N1) 2009from seasonal influenza (Straight et al., 2010). GeneFluidics isanother company which offers electrochemical sensing technology(www.genefluidics.com).
Industrial development of electrochemical microarrays andintegrated DNA chips requires research and development inmainly three aspects. One aspect is related to the miniaturization,automation and integration of the finished device, which usuallyincorporates microfluidics technology for injection of the samples,reagents, and buffers. A second aspect regards the transduction ofthe hybridization reaction into a measurable electrochemical sig-nal. Some general methods were described in Figs. 1 and 2, butmuch more are present in the literature. Last, the performanceof the sensor or microarray with real biological samples is alsoa cornerstone if the device is intended for real-life applications.Although progress is evident, more research is needed in orderto satisfy the demands and provide a reliable, robust and sensibletechnology for rapid and automated nucleic acid analysis.
Acknowledgments
We would like to thank the staff of the Nuclear Research Cen-ter and the Faculty of Science for their support and helpful advices.Specially, we acknowledge everyday support from our team of theAnalytical Biochemistry Unit and from our colleagues from the Lab-oratorio de Biomateriales (Faculty of Science). J.P.T is a research
Bioele
f(
R
A
A
A
A
A
B
B
B
B
B
B
B
M
C
C
CD
D
D
E
EF
F
F
F
F
G
GGGG
G
G
H
HHH
HHKK
L
J.P. Tosar et al. / Biosensors and
ellow from the Agencia Nacional de Investigación e InovaciónANII).
eferences
hmed, M.U., Hasan, Q., Hossain, M.M., Saito, M., Tamiya, E., 2010. Food Control 21,599–605.
itichou, M., Henkens, R., Sultana, A.M., Ulrich, R.G., Sofi Ibrahim, M., 2004. Mol. CellProbes 18 (6), 373–377.
kagi, Y., Makimura, M., Yokoyama, Y., Fukazawa, M., Fujiki, S., Kadosaki, M., Tanino,K., 2006. Electrochim. Acta 51, 6367–6372.
riksoysal, D.O., Karadeniz, H., Erdem, A., Sengonul, A., Sayiner, A.A., Ozsoz, M., 2005.Anal. Chem. 77 (15), 4908–4917.
rora, K., Prabhakar, N., Chand, S., Malhotra, B.D., 2007. Anal. Chem. 79 (16),6152–6158.
aeumner, A.J., Cohen, R.N., Miksic, V., Min, J., 2003. Biosens. Bioelectron. 18 (4),405–413.
aeumner, A.J., Leonard, B., McElwee, J., Montagna, R.A., 2004. Anal. Bioanal. Chem.380 (1), 15–23.
aur, J., Gondran, C., Holzinger, M., Defrancq, E., Perrot, H., Cosnier, S., 2010. Anal.Chem. 82 (3), 1066–1072.
erganza, J., Olabarria, G., Garcia, R., Verdoy, D., Rebollo, A., Arana, S., 2007. Biosens.Bioelectron. 22 (9–10), 2132–2137.
erti, F., Laschi, S., Palchetti, I., Rossier, J.S., Reymond, F., Mascini, M., Marrazza, G.,2009. Talanta 77 (3), 971–978.
ettazzi, F., Lucarelli, F., Palchetti, I., Berti, F., Marrazza, G., Mascini, M., 2008. Anal.Chim. Acta 614 (1), 93–102.
onanni, A., Pividori, M.I., Campoy, S., Barbe, J., del Valle, M., 2009. Analyst 134 (3),602–608.
arques, P.R., Lermo, A., Campoy, S., Yamanaka, H., Barb, J., Alegret, S., Pividori, M.I.,2009. Anal. Chem. 81 (4), 1332–1339.
arpini, G., Lucarelli, F., Marrazza, G., Mascini, M., 2004. Biosens. Bioelectron. 20 (2),167–175.
hen, J., Zhang, J., Wang, K., Huang, L., Lin, X., Chen, G., 2008. Electrochem. Commun.10, 1448–1451.
oenye, T., Vandamme, P., 2003. FEMS Microbiol. Lett. 228 (1), 45–49.empsey, J.A., Litaker, W., Madhure, A., Snodgrass, T.L., Cannon, J.G., 1991. J. Bacteriol.
173 (17), 5476–5486.iercks, S., Metfies, K., Medlin, L.K., 2008. Biosens. Bioelectron. 23 (10), 1527–
1533.uwensee, H., Mix, M., Stubbe, M., Gimsa, J., Adler, M., Flechsig, G.U., 2009. Biosens.
Bioelectron. 25 (2), 400–405.rdem, A., Ariksoysal, D.O., Karadeniz, H., Kara, P., Sengonul, A., Sayiner, A.A., Ozsoz,
M., 2005. Electrochem. Commun. 7, 815–820.squela-Kerscher, A., Slack, F.J., 2006. Nat. Rev. Cancer 6 (4), 259–269.an, C., Plaxco, K.W., Heeger, A.J., 2003. Proc. Natl. Acad. Sci. U.S.A. 100 (16),
9134–9137.an, Y., Chen, X., Trigg, A.D., Tung, C.H., Kong, J., Gao, Z., 2007. J. Am. Chem. Soc. 129
(17), 5437–5443.ang, T.H., Ramalingam, N., Xian-Dui, D., Ngin, T.S., Xianting, Z., Lai Kuan, A.T., Peng
Huat, E.Y., Hai-Qing, G., 2009. Biosens. Bioelectron. 24 (7), 2131–2136.arabullini, F., Lucarelli, F., Palchetti, I., Marrazza, G., Mascini, M., 2007. Biosens.
Bioelectron. 22 (7), 1544–1549.erguson, B.S., Buchsbaum, S.F., Swensen, J.S., Hsieh, K., Lou, X., Soh, H.T., 2009. Anal.
Chem. 81 (15), 6503–6508.abig-Ciminska, M., Holmgren, A., Andresen, H., Bundvig Barken, K., Wumpel-
mann, M., Albers, J., Hintsche, R., Breitenstein, A., Neubauer, P., Los, M., Czyz, A.,Wegrzyn, G., Silfversparre, G., Jurgen, B., Schweder, T., Enfors, S.O., 2004. Biosens.Bioelectron. 19 (6), 537–546.
ao, Z., Yang, Z., 2006. Anal. Chem. 78 (5), 1470–1477.ao, Z., Yu, Y.H., 2007a. Sens. Actuators B 121, 552–559.ao, Z., Yu, Y.H., 2007b. Biosens. Bioelectron. 22 (6), 933–940.au, J.J., Lan, E.H., Dunn, B., Ho, C.M., Woo, J.C., 2001. Biosens. Bioelectron. 16 (9–12),
745–755.au, V., Ma, S.C., Wang, H., Tsukuda, J., Kibler, J., Haake, D.A., 2005. Methods 37 (1),
73–83.erstein, M.B., Bruce, C., Rozowsky, J.S., Zheng, D., Du, J., Korbel, J.O., Emanuelsson,
O., Zhang, Z.D., Weissman, S., Snyder, M., 2007. Genome Res. 17 (6), 669–681.ansen, J.A., Mukhopadhyay, R., Hansen, J.O., Gothelf, K.V., 2006. J. Am. Chem. Soc.
128 (12), 3860–3861.artley, H.A., Baeumner, A.J., 2003. Anal. Bioanal. Chem. 376 (3), 319–327.auck, C.R., Meyer, T.F., 2003. Curr. Opin. Microbiol. 6 (1), 43–49.ejazi, M.S., Pournaghi-Azar, M.H., Alipour, E., Karimi, F., 2008. Biosens. Bioelectron.
23 (11), 1588–1594.unt, E.A., Goulding, A.M., Deo, S.K., 2009. Anal. Biochem. 387 (1), 1–12.
utvagner, G., Simard, M.J., 2008. Nat. Rev. Mol. Cell. Biol. 9 (1), 22–32.ara, P., Meric, B., Zeytinoglu, A., Ozsoz, M., 2004. Anal. Chim. Acta 518, 69–76.ara, P., Cavdar, S., Meric, B., Erensoy, S., Ozsoz, M., 2007. Bioelectrochemistry 71(2), 204–210.aGier, M.J., Scholin, C.A., Fell, J.W., Wang, J., Goodwin, K.D., 2005. Mar. Pollut. Bull.
50 (11), 1251–1261.
ctronics 26 (2010) 1205–1217 1217
LaGier, M.J., Fell, J.W., Goodwin, K.D., 2007. Mar. Pollut. Bull. 54 (6), 757–770.Lai, R.Y., Lagally, E.T., Lee, S.H., Soh, H.T., Plaxco, K.W., Heeger, A.J., 2006. Proc. Natl.
Acad. Sci. U.S.A. 103 (11), 4017–4021.Lander, E.S., Linton, L.M., Birren, et al., 2001. Nature 409 (6822), 860–921.Lermo, A., Campoy, S., Barbe, J., Hernandez, S., Alegret, S., Pividori, M.I., 2007. Biosens.
Bioelectron. 22 (9–10), 2010–2017.Lermo, A., Zacco, E., Barak, J., Delwiche, M., Campoy, S., Barbe, J., Alegret, S., Pividori,
M.I., 2008. Biosens. Bioelectron. 23 (12), 1805–1811.Lin, L., Chen, J., Lin, Q., Chen, W., Chen, J., Yao, H., Liu, A., Lin, X., Chen, Y., 2010. Talanta
80 (5), 2113–2119.Liu, G., Wan, Y., Gau, V., Zhang, J., Wang, L., Song, S., Fan, C., 2008. J. Am. Chem. Soc.
130 (21), 6820–6825.Loaiza, O.A., Campuzano, S., Pedrero, M., Garcia, P., Pingarron, J.M., 2009. Analyst 134
(1), 34–37.Luo, X., Xu, J., Barford, J., Hsing, I.-M., 2010. Electrochem. Commun., 1036,
doi:10.1016/j.elecom.2010.1001.Luong, J.H., Male, K.B., Glennon, J.D., 2008. Biotechnol. Adv. 26 (5), 492–500.Marazza, G., Tombelli, S., Mascini, M., Manzoni, A., 2001. Clin. Chim. Acta 307 (1–2),
241–248.Mascini, M., Del Carlo, M., Minunni, M., Chen, B., Compagnone, D., 2005. Bioelectro-
chemistry 67, 163–169.Meric, B., Kerman, K., Ozkan, D., Kara, P., Erensoy, S., Akarca, U.S., Mascini, M., Ozsoz,
M., 2002. Talanta 56 (5), 837–846.Meric, B., Kerman, K., Marazza, G., Palchetti, I., Mascini, M., Ozsoz, M., 2004. Food
Control 15, 621–626.Metfies, K., Huljic, S., Lange, M., Medlin, L.K., 2005. Biosens. Bioelectron. 20 (7),
1349–1357.Miranda-Castro, R., de-Los-Santos-Alvarez, N., Lobo-Castanon, M.J., Miranda-
Ordieres, A.J., Tunon-Blanco, P., 2009. Biosens. Bioelectron. 24 (8), 2390–2396.Patel, M.K., Solanki, P.R., Kumar, A., Khare, S., Gupta, S., Malhotra, B.D., 2010. Biosens.
Bioelectron. 25 (12), 2586–2591.Pech, M., Streeck, R.E., Zachau, H.G., 1979. Cell 18 (3), 883–893.Pournaghi-Azar, M.H., Alipour, E., Zununi, S., Froohandeh, H., Hejazi, M.S., 2008.
Biosens. Bioelectron. 24 (4), 524–530.Prabhakar, N., Arora, K., Singh, H., Malhotra, B.D., 2008. J. Phys. Chem. B 112 (15),
4808–4816.Sadik, O.A., Aluoch, A.O., Zhou, A., 2009. Biosens. Bioelectron. 24 (9), 2749–2765.Siddiquee, S., Yusof, N.A., Salleh, A.B., Bakar, F.A., Heng, L.Y., 2009. Bioelectrochem-
istry.Singh, R., Prasad, R., Sumana, G., Arora, K., Sood, S., Gupta, R.K., Malhotra, B.D., 2009.
Biosens. Bioelectron. 24 (7), 2232–2238.Solanki, P.R., Kaushik, A., Chavhan, P.M., Maheshwari, S.N., Malhotra, B.D., 2009.
Electrochem. Commun. 11, 2272–2277.Straight, T.M., Merrill, G., Perez, L., Livezey, J., Robinson, B., Lodes, M., Suciu, D.,
Anderson, B., 2010. Influenza Other Resp. Viruses 4 (2), 73–79.Steel, A.B., Herne, T.M., Tarlov, M.J., 1998. Anal. Chem. 70 (22), 4670–4677.Sun, C.P., Liao, J.C., Zhang, Y.H., Gau, V., Mastali, M., Babbitt, J.T., Grundfest, W.S.,
Churchill, B.M., McCabe, E.R., Haake, D.A., 2005. Mol. Genet. Metab. 84 (1), 90–99.
Tang, L., Zeng, G., Shen, G., Li, Y., Liu, C., Li, Z., Luo, J., Fan, C., Yang, C., 2009. Biosens.Bioelectron. 24 (5), 1474–1479.
Tansil, N.C., Xie, F., Xie, H., Gao, Z., 2005. Chem. Commun. 8, 1064–1066.Venter, J.C., Adams, M.D., Myers, et al., 2001. Science 291 (5507), 1304–1351.Wang, J., 2000. Nucleic Acids Res. 28 (16), 3011–3016.Wang, J., Rivas, G., Fernandes, J.R., Lopez Paz, J.L., Jiang, M., Waymire, R., 1998. Anal.
Chim. Acta 375 (3), 197–203.Won, B.Y., Lee, D.W., Shin, S.C., Cho, D.Y., Lee, S.S., Yoon, H.C., Park, H.G., 2008. Biosens.
Bioelectron. 24 (4), 665–669.Wu, G., Wang, Z., Zhang, H., Yang, N., Du, J., Lu, X., Kang, J., 2010. J. Biotechnol. 145
(1), 1–8.Xie, H., Yu, Y.H., Xie, F., Lao, Y.Z., Gao, Z., 2004a. Clin. Chem. 50 (7), 1231–1233.Xie, H., Zhang, C., Gao, Z., 2004b. Anal. Chem. 76 (6), 1611–1617.Yang, W., Ozsoz, M., Hibbert, D.B., Gooding, J.J., 2002. Electroanalysis 14 (18),
1299–1302.Yang, T., Zhang, W., Du, M., Jiao, K., 2008. Talanta 75 (4), 987–994.Yang, T., Zhou, N., Zhang, Y., Zhang, W., Jiao, K., Li, G., 2009. Biosens. Bioelectron. 24
(7), 2165–2170.Ye, Y.K., Zhao, J.H., Yan, F., Zhu, Y.L., Ju, H.X., 2003. Biosens. Bioelectron. 18 (12),
1501–1508.Yean, C.Y., Kamarudin, B., Ozkan, D.A., Yin, L.S., Lalitha, P., Ismail, A., Ozsoz, M.,
Ravichandran, M., 2008. Anal. Chem. 80 (8), 2774–2779.Yeung, S.S., Lee, T.M., Hsing, I.M., 2006a. J. Am. Chem. Soc. 128 (41), 13374–13375.Yeung, S.W., Lee, T.M., Cai, H., Hsing, I.M., 2006b. Nucleic Acids Res. 34 (18), e118.Yeung, S.S., Lee, T.M., Hsing, I.M., 2008. Anal. Chem. 80 (2), 363–368.Zhang, Y., Pothukuchy, A., Shin, W., Kim, Y., Heller, A., 2004. Anal. Chem. 76 (14),
4093–4097.
Zhang, J., Song, S., Zhang, L., Wang, L., Wu, H., Pan, D., Fan, C., 2006. J. Am. Chem. Soc.128 (26), 8575–8580.Zhang, W., Yang, T., Huang, D., Jiao, K., Li, G., 2008. Journal of Membrane Science 325,
245–251.Zhou, L., Zhao, R., Wang, K., Xiang, H., Shang, Z., Sun, W., 2008. Sensors 8, 5649–
5660.