Embed Size (px)
Citation preview

ENERGY SECTOR
in the Republic of Serbia
Coal and Electricity
Milena Đakonović
Dpt. for Sustainable Development
and Climate Change in Energy Sector
Ministry of Mining and Energy
Republic of Serbia

Structure of the Serbian Energy Sector
- COAL SECTOR (Underground, underwater and open pit exploitation, Processing of coal in the
dryer, Import, export and trade in coal).
- POWER SECTOR (Generation, Electricity supply, Transmission and distribution, Organization of
bilateral and balance market) OIL SECTOR (Exploitation, Import and Export of crude
oil/derivatives, Production of oil derivatives, Storing of crude oil/derivatives, Pipeline Transport
of crude oil, Distribution and trade of oil/ derivatives)
- NATURAL GAS SECTOR (Exploitation, Processing, Storage, Transport and Distribution)
- HEAT SECTOR (Heat production, distribution and supply)
- INDUSTRIAL ENERGY SECTOR
- RES (Production of electricity and heat, Production of solid, liquid and gas biomass, Import and
export of biomass)
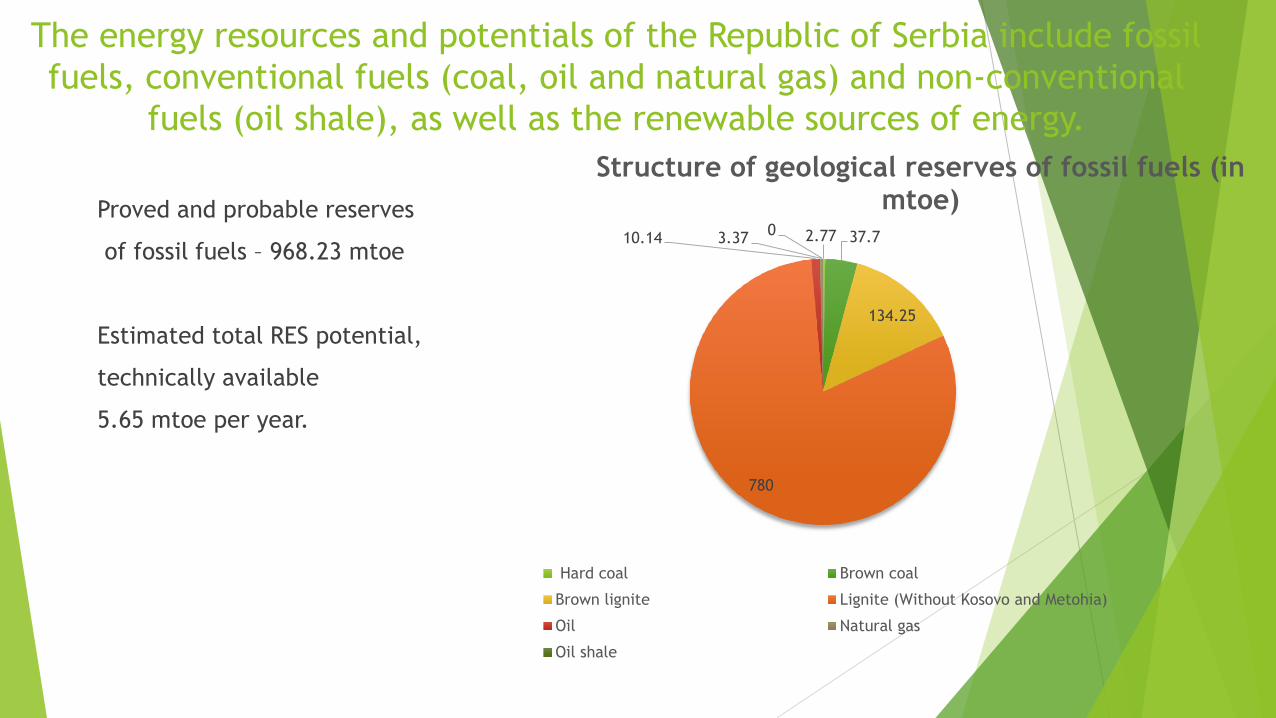
The energy resources and potentials of the Republic of Serbia include fossil
fuels, conventional fuels (coal, oil and natural gas) and non-conventional
fuels (oil shale), as well as the renewable sources of energy.
Proved and probable reserves
of fossil fuels – 968.23 mtoe
Estimated total RES potential,
technically available
5.65 mtoe per year.
2.77 37.7
134.25
780
10.14 3.37 0
Structure of geological reserves of fossil fuels (in mtoe)
Hard coal Brown coal
Brown lignite Lignite (Without Kosovo and Metohia)
Oil Natural gas
Oil shale

67%
11%
4%
8%
<1% 10%
0%
Structure of primary energy production per energy sources in Serbia in 2013
Угаљ/ Coal
Нафта/ Oil
Гас/ Natural gas
Хидропотенцијал/ Hydro
Геотермална енергија/ Geothermal energy
Биомаса/ Biomass
Биогас/Biogas, Енергија сунца/Solar energy, Енергија ветра/Wind energy
A total of 11.354 M toe of primary energy was generated in Serbia in 2013

Use of coal: Total amount, share of energy mix,
total amount and share in electricity production
and industry
The most significant coal reservoirs in the Republic of Serbia are the lignite
reservoirs (soft brown coal). The geological reserves of lignite compared to
geological reserves of other types of coal in the Republic of Serbia constitute
93%. Other types of coal (hard, brown lignite or solid brown coal) constitute only
7% of the geological reserves of the Republic. Of 8.88 billion tons of lignite,
around 4.5 billion is located in the Kosovo and Metohia basin, whereas 3.99
billion of tons is located in central Serbia, i.e. in the Kolubara and Kostolac
basin.
Total coal reserves that can be exploited are significant and represent realistic
basis for further long-term development of the energy sector in general and
particularly for the electricity generation.

Exploitation and processing of coal
The exploitation of coal in the Republic of Serbia is performed within:
Open Pit mines in three mining basins: Kolubara, Kostolac and Kosovo-Metohia, which are
temporarily not operating as part of the energy system of Serbia.
The mine with underground exploitation Vrška Čuka, Ibar mines, Bogovina, Soko, Jasenovac,
Šravalj, Lubnica, Aleksinac.
Mines with underwater exploitation, Kovin.
The mining basins Kolubara and Kostolac are part of PE "Elektroprivreda Serbia" (PE EPS).
Of the total domestic coal production, 98% comes from open pit mining, whereas the rest from
underground and underwater exploitation. Since the domestic production mainly produces low-
quality lignite, the need for higher quality types of coal is met through import. Hence, the domestic
production meets 98.5% of the total demand for coal, and the rest is imported.
The total domestic coal production in 2013 amounted to 40297 t or 7.7 Mtoe

Balance of coal for 2010 - 2013
In 2013 The total amount of coal available for consumption amounted to 7.901 Mtoe. From this
amount, 7.518 Mtoe was spent for the transformation processes, of which 6.994 Mtoe (93%) in
thermal power plants, and 7% in industrial power plants, heating plants, blast furnaces and coal
processing plants.
ENERGY BALANCE OF COAL IN THE REPUBLIC OF SERBIA WITHOUT K&M 2010 2011 2012 2013
Mtoe Mtoe Mtoe Mtoe
PRIMARY PRODUCTION 7.228 7.823 7.277 7.669
IMPORT 0.766 0.802 0.412 0.31
EXPORT 0.039 0.008 0.006 0.035
STOCK CHANGES -0.204 0.123 -0.06 -0.043
GROSS INLAND CONSUMPTION 7.75 8.741 7.623 7.901
TRANSFORMATION INPUT 7.124 7.862 7.038 7.518
THERMAL POWER PLANT 6.258 7.065 6.577 6.994
CHP 0 0 0 0
INDUSTRIAL COGENERATION PLANTS 0.192 0.173 0.097 0.124
DISTRICT HEATING PLANTS 0.066 0.078 0.072 0.069
BLAST FURNACE PLANTS 0.41 0.347 0.109 0.146
COAL TRANSFORMATION 0.198 0.2 0.183 0.185
TRANSFORMATION OUTPUT 0.452 0.472 0.291 0.294
BLAST FURNACE PLANTS 0.219 0.234 0.072 0.076
COAL TRANSFORMATION 0.234 0.239 0.218 0.218
LOSSES 0.055 0.053 0.02 0.016
TOTAL FINAL CONSUMPTION 1.023 1.298 0.856 0.661
FINAL NON-ENERGY CONSUMPTION 0.026 0.027 0.028 0.029
FINAL ENERGY CONSUMPTION 1 1.271 0.828 0.632
INDUSTRY 0.418 0.501 0.347 0.242
TRANSPORT 0 0 0 0
HOUSEHOLDS 0.297 0.388 0.307 0.259
AGRICULTURE 0.002 0 0 0
OTHER USERS 0.281 0.381 0.173 0.131

Percentage of Coal Used by TPPs and by Industry
93.00%
93.50%
94.00%
94.50%
95.00%
95.50%
96.00%
96.50%
97.00%
97.50%
2010 2011 2012 2013 2014*
% of Coal for Electricity Production
0.00%
0.50%
1.00%
1.50%
2.00%
2.50%
2010 2011 2012 2013 2014*
% of Coal used by Industry
0
5000
10000
15000
20000
25000
30000
35000
40000
45000
2010 2011 2012 2013 2014*
000 t Coal production in PU EPS
*Decreased production due to the floods

Structure of consumption of coal for energy
purposes per sectors of final consumption
during 2013
38%
41%
<1%
21%
Индустрија / Industry
Домаћинства / Households
Пољопривреда / Agriculture
Јавне и комерцијалне делатности / Public and commercial activities

Electricity Production in Republic of Serbia
0 10 20 30 40 50 60 70 80 90 100
France
Belgium
Italy
Hungary
Spain
UK
Romania
Bulgaria
Germany
Greece
Czech…
Poland
EU 27
SEE Region
Serbia
coal nuclear gas oil others (hydro/biomass)
Electricity generation
TWh Coal share %
3.357.958 29
161.743 92
84.361 59
60.789 53
636.600 42
45.843 41
62.698 40
398.327 38
303.007 22
35.859 20
314.122 14
85.535 8
574.473 4
167.000 55
38.000
70
Source: EUROSTAT – Energy / Yearly Statistics 2006

PU EPS Electricity Production
Hydro power
plants 2,835 MW
Thermal power
plants 5,171 MW* 3,936 MW**
Combined heat
and power
plants
353 MW
Total 8,359 MW* 7,124 MW**
Last power plant built in 1991.
*With K&M ** Without K&M, end of 2013
Electricity
Production 37.5 TWh**
Number of
customers 3.5 mil **
Number of
employees 33,335**
As of June 1999 PE EPS does not operate its Kosovo and
Metohija capacities (K&M)

LCPs within the PU EPS
Plant name Fuel type MW GWh/a Start up Load factor %
Nikola Tesla A1 L 210 1231 1970 73.6
NikolaTesla A2 L 210 1198 1970 71.6
Nikola Tesla A3 L 305 1923 1976 78.4
Nikola Tesla A4 L 309 1989 1978 81.1
Nikola Tesla A5 L 309 1999 1979 81.5
Nikola Tesla A6 L 309 1987 1979 81
Nikola Tesla B1 L 620 4151 1983 81.7
Nikola Tesla B2 L 620 4004 1985 78.8
Kolubara A1 L 32 175 1956 68.9
Kolubara A2 L 32 116 1957 45.5
Kolubara A3 L 64 135 1961 26.5
Kolubara A4 L 32 0 1961 0
Kolubara A5 L 110 626 1979 71.5
Plant name Fuel type MW GWh/a Start up Load factor %
Kostolac A1 L 100 560 1967 71
Kostolac A2 L 210 1196 1980 71.5
Kostolac B1 L 348 1937 1987 69.1
Kostolac B2 L 348 1895 1991 67.6
Novi Sad 1 NG 135 189 1981 20
Novi Sad 2 NG 110 175 1984 20
Zrenjanin NG 110 66 1989 10
Sr Mitrovica 1NG 32 123 1979 50
Data Source: EnC Study on Modernization of LCPs
Low Efficiency Efficiency of particular unit depends on the characteristics of the unit
(i.e. age, implemented measures for the efficiency improvement during
the overhauls) and it goes up to 35,2%

Potential Energy Efficiency Measures
that would lead to the CO2 reduction
Potential measures for the improvement of the TPPs efficiency:
• Improvement of the technical efficiency of steam boilers and turbines
• Introduction of Coal Homogenization System
Potential measures for the improvement of the distribution system efficiency:
• Reduction of Losses
• Reconfiguration of distribution network
• Voltage regulation Smart metering, etc.
Improvement of the efficiency in the mining sector
New TPP units that would replace the old ones
Introduction of CCS
RES…

Climate Change Policies
Serbia has ratified the United Nations Framework Convention on Climate
Change (UNFCCC) in 2001 and the Kyoto Protocol in 2008, as a non-Annex I
Party.
Draft Biennial Report to the UNFCCC:
In 2013 Energy Sector: 49.661,06 GgCО2еq - 79,4% of total GHG
Emissions in Serbia (62.520,88 Gg CO2)
2010-2013 trend -2,6%
1990 – Base Year Share of Energy Sector in total GHG emissions – 78,7%
Given its status as an EU candidate country and member of the Energy
Community, Serbia is developing its national policy initiatives in line with
European policies on climate change and energy.
Serbia announced the INDC pledge to cut emissions 9.8% by 2030, as measured
against 1990 levels, ahead of the 2015 UNFCCC conference of parties in Paris.

Thank you for attention!
Milena Đakonović
Ministry of Mining and Energy
Republic of Serbia