Embed Size (px)
Citation preview

Electricity Outage and Reliability StudySeptember 2010
Consumer Component

Contents
Methodology
Key Findings
Context
Satisfaction with Unplanned Outages
Experience with Power Outages
Impact of Power Outages
Customer Service Ratings and Impact
Expectations for Number and Duration of Outages
Price Sensitivity Measures
22010 Consumer Survey

2010 Consumer Survey
Background and Methodology
• On behalf of the Ontario Energy Board, Pollara conducted a study among Ontario residents about electricity outages and related reliability issues. The objectives of the research were to explore residential consumers’ views on:
• Their perceptions regarding the number, duration, and frequency of power outages they have experienced;
• Their reactions to and level of tolerance for power outages;• Their willingness to pay for fewer outages or higher reliability; and,• Measures of satisfaction with regard to distributor communications about power outages.
3

Background and Methodology
• In order to meet the objectives of research, Pollara conducted a telephone survey of 905 Ontarians from July 6 to 20, 2010. Of those surveyed, 634 Ontarians experienced at least one power outage in the last year.
• At the analysis stage, a household weight was applied to the data to represent the regional distributions of Ontarians according to the most recent census data for home ownership. The overall margin of error for a sample of this size is estimated to be ±3.3%, nineteen times out of twenty.
• The results among the subset of Ontarians who have experienced at least one unplanned outage in the past year (634) has an associated margin of error of ±3.9%, nineteen times out of twenty.
2010 Consumer Survey

2010 Consumer Survey
Ontario’s Regions
5
Northern Ontario: Extending north and west from Nipissing and Parry Sound Counties; includes such cities as Bracebridge, North Bay, Sault Ste. Marie, and Thunder Bay.
Eastern Ontario: South from Renfrew County and extending east from Lennox & Addington County; includes such cities as Belleville, Kingston, Ottawa, and Cornwall
GTA Shadows: Includes Hastings, Peterborough, and the Kawarthas, extending west to Simcoe and Grey Counties; includes such cities as Peterborough, Barrie, and Acton.
GTA: Includes York, Durham, and Peel Regions, as well as portions of Halton region. Includes such cities as Mississauga, Vaughan, Oshawa, and Markham. Toronto: Includes the amalgamated regions
of the City of Toronto: York, North York, East York, Etobicoke, Scarborough, and the City of Toronto.
Steel Triangle: Three-pointed area encompassing Hamilton, Brant, Haldimand, and Waterloo Counties, and portions of Waterloo county. Includes such cities as Hamilton, Niagara, Brantford, and Kitchener.
Southwest: Extending south and west from the Bruce Peninsula, including such cities as Windsor, London, Sarnia, and Chatham.

2010 Consumer Survey
Key Findings: Benchmark Summary
6
Current Future Expectations
Overall Satisfaction with Electricity Reliability (% Total Satisfied) 89%
Importance of Reducing Number of Outages (% Total Important) 79%
% of Ontarians not willing to accept more outages for reduced bill 57%
Average Acceptable Per-Bill Increase to Reduce Outages (Among those willing to pay any amount greater than $0) $16.20
Reported Number of Unplanned Outages (mean, annual) 4.78 3.43
Reported Five-Year Trend (% “Increased”) 18%
Reported Length of Most Recent Outage (Hours) 2.79 1.99
Time of Day of Most Recent Reported Outage (% Noon to Midnight) 57%
Reach of Most Recent Reported Outage (% “Neighbourhood”) 46%
Tolerance – Maximum Number of Outages before confidence in system undermined (mean, annual) 3.44
Tolerance – Length of Outage before confidence in system undermined (Hours, mean) 2.94

Key Findings: Context
• Ontario’s electricity consumers are highly tolerant, and adaptive to power outages.• Many report little emotional response to outages, and few report high levels of concern.• There is a willingness – and an expectation - to accept that there may be a few power outages of a few hours in
length each year.
• Ontario’s electricity market is highly cost-conscious.• A majority of Ontarians (57%) are not willing to pay more to improve their system reliability to near-zero outages.• Three in ten report a price sensitivity issue as the most important energy/electricity issue facing their community
– price increases accounting for the greatest proportion of this number (25%).• In order for the majority of customers who pay between $100 and $500 on their electricity bills to accept more
outages, distributors would have to offer discounts in excess of 10%, on average.
• Customer satisfaction levels, overall, are strong – with some caveats.• Three-quarter majorities report satisfaction with their distributors’ response to power outages in general, and the
amount of time it takes to restore power. After discussing their experiences with a power outage, satisfaction levels drop slightly.
• Satisfaction levels are substantially weaker surrounding customer/distributor interaction during an outage: whether responding to questions about the outage, providing estimates of when power would be restored, or providing a cause of the outage, fewer customers report being satisfied overall.
72010 Consumer Survey

Key Findings
• Strengths: Managing Expectations• Generally speaking, customers do expect to experience a few power outages a year, for a
couple of hours at a time. One-in-five (22%) report that the impact they most noticed was the loss of electronic devices (including the television and computer) and only 12% say that they were not able to go on with their normal daily activities.
• Additionally, respondents do not respond with fear or anxiety – though the longer the outage, the more often they report being angry or frustrated with it.
• Weaknesses: Regional Differences• Ontarians in different parts of the province can have vastly different experiences with outages.
Those in Eastern Ontario, for example, report longer outages, on average, and lower-than- average levels of satisfaction with distributors’ ability to provide answers on why and how long an outage is taking place, and when it will be fixed. Those in the North experience longer outages, but are more often able to speak with a live person, and expect that their outages will be somewhat longer than they often are. By contrast, Torontonians fret more than others about their quality of life during an outage – but are no more likely than others to say they find the answers they seek when they call their distributor to ask questions about the outages they experience.
• Urban/rural divides do exist, however are often accounted for in regional differences noted throughout.
82010 Consumer Survey
Key Findings
• Opportunities• Increasing communications may improve perceptions and ratings: no fewer than 20% of
Ontarians who experienced an outage say that they don’t know enough to rate distributors on their ability to provide responses to questions on the length and cause of outages, or when the outage can be repaired. And, among those who reported the outage they experienced, in just under 20% of cases, respondents report that the distributor did not know about the outage, prior to the call.
• Risks• An highly cost-conscious consumer electricity market. The HST, combined with the impact of
Smart Meters, and an overall increase in energy prices (as well as other cost-of-living increases, such as gas, insurance, and food prices), means that costs have risen (or will rise) in double-digit percentages for many consumers in just over the span of a year. Given this sensitivity, measures taken to improve reliability, customer service, or infrastructure which impact a customer’s bill run the risk of decreasing overall satisfaction with the provider.
• Notably, 41% of Ontarians are not willing to pay more for improvements to the system, nor are they willing to pay less if more outages were to occur.
• These findings are consistent with other research that Pollara has conducted in the electricity sector.
92010 Consumer Survey

Context

11
1. What would you say is the most important energy or electricity-related issue facing your local community today? [OPEN, ACCEPT 1] (N=905)
Most Important Electricity/Energy-Related Issue in Community
• Over three-in-ten Ontarians see cost issues as the top concern with regard to electricity in their area (“Rates Increasing” 25%; “HST” 3%; “Cost of Electricity” 3%). Increasing rates are a significant concern among Northern Ontarians, where 43% say that this is the top issue in their community. Rural Ontarians are also more concerned about rising rates than urban Ontarians (34% and 23%, respectively).
• Only 6% mention blackouts/brownouts as a top electricity concern in their community, while 3% mention capacity or supply issues (which often referenced the shutdown of plants, either permanently or in order to conduct maintenance operations.)

12
2. On a scale of 1 to 10, where 1 is “not at all satisfied” and 10 is “extremely satisfied”, how satisfied are you with the reliability of the electricity provided to you overall? (N=905)
Overall Satisfaction with Reliability of Electricity• A majority of Ontarians say that they are satisfied with the reliability of the electricity provided to them, overall.
• Ontarians living in the Eastern and Southwest portions of the province are less satisfied, on average, than Ontarians overall (7.82 and 7.86, respectively). Renters are more likely to be satisfied than homeowners (8.45 and 7.97, respectively).
Mean: 8.11
Total Not Satisfied: 11%
Total Satisfied: 89%

13
3. And what is the main reason why you provide this rating? [Open, Accept 2][Multiple Mention, Combined Response] (Total N=900; 1-4 rating n=31, 5,6 rating n=112, 7-10 rating n=757)
Motivations for Satisfaction Rating25% of those who provide a high satisfaction rating of their electricity reliability say that they have experienced brownouts or unplanned outages – but that they were short-lived or barely noticed.
• Among those who provide high satisfaction ratings, most suggest that it is because the electricity they receive is reliable (31%), or that they’ve never really had problems (30%). As noted caveats, some note power outages (25%) despite their positive rating overall, but most of this group say that the issues have been short-lived and/or infrequent.
• By comparison, those providing negative ratings frequently cite power interruptions (62% among negative ratings, 49% among neutral ratings) as a reason for their rating. 37% of those who provide a negative rating say that this is based on the cost of their electricity.

Satisfaction with Unplanned Outages

15
4-8. Now, I’d like to talk to you specifically about unplanned power outages. On a scale of 1 to 10, where 1 means “very dissatisfied” and 10 means “very satisfied”, how satisfied are you with your electricity provider on the following, when it comes to unplanned power outages, overall? What about... [N for each = 905]
Satisfaction Ratings on Outages
Mean
7.52
7.34
6.40
6.36
6.04
• Overall, three-quarters of Ontarians are satisfied with their providers’ response to outages, overall (75%) and 73% are satisfied with the time it takes to restore power to homes. Significantly fewer are satisfied with providers’ abilities to respond to questions about outages (42%), communicate when power will be restored (52%), or communicate why an outage occurred (46%); although a significant proportion of Ontarians say that they don’t know enough to provide a rating on these attributes.
• Renters are slightly more likely than homeowners to feel satisfied with the time it takes their providers to restore power (7.64 and 7.22 out of 10, respectively). Rural residents are slightly less likely than their urban-dwelling counterparts to feel similarly (7.17 and 7.38, respectively).

16
4-8. Now, I’d like to talk to you specifically about unplanned power outages. On a scale of 1 to 10, where 1 means “very dissatisfied” and 10 means “very satisfied”, how satisfied are you with your electricity provider on the following, when it comes to unplanned power outages, overall? What about... [N for each = 905]
Satisfaction Ratings on OutagesThose experiencing outages are more often satisfied with overall response and time taken to restore power, but less intensely satisfied, on average, than those who have not experienced an outage.
Those who have NOT experienced an outage in the past year.
Those who HAVE experienced an outage in the past year.
% Satisfied Mean % Satisfied Mean
Responding to Power Outages, Overall 66% 7.93 79% 7.36
Communicating Why an Outage Occurred 51% 7.13 43% 5.63
Communicating When Power will be Restored 55% 7.22 50% 6.01
Time it Takes to Restore Power 65% 7.77 78% 7.18
Ability to Respond to Questions Regarding Outages 42% 7.10 42% 6.12

17
35-39. Now, I’d like to talk to you specifically about unplanned power outages. On a scale of 1 to 10, where 1 means “very dissatisfied” and 10 means “very satisfied”, how satisfied are you with your electricity provider on the following, when it comes to unplanned power outages, overall? What about... [N for each = 634]
Satisfaction Ratings on Outages – Post-DiscussionSatisfaction ratings among those who have experienced at least one outage in the past year, after discussing that outage.
Mean
7.22
7.10
5.98
5.62
5.56
• Those Ontarians who indicated that their home had lost power over the past year were once again asked to rate their satisfaction with their distributor’s response to outages at the conclusion of this portion of the survey, in order to discern if prompted recall of events affected their satisfaction ratings.
• Clear majorities remain satisfied with their distributors’ response to power outages, overall (71%) and the amount of time it takes to restore power (74%), however fewer than half are satisfied with the ability of representatives to answer questions about outages (37%), communicating when power will be restored (48%), or their ability to communicate why an outage occurred (40%).
• Eastern Ontarians who say they experienced an outage this past year are least frequently satisfied with their provider’s response to outages (mean = 6.91), followed by those living in the GTA (6.99).

Mean: 7.18
Mean: 7.22
18
Among those who have experienced outage in the past year, Pre- to Post-Test (N=634)4-8 and 35-39. Now, I’d like to talk to you specifically about unplanned power outages. On a scale of 1 to 10, where 1 means
“very dissatisfied” and 10 means “very satisfied”, how satisfied are you with your electricity provider on the following, when it comes to unplanned power outages, overall? What about...
Among Those who Experienced Outage:Satisfaction with Provider, Before and After Discussion of Outage
• After discussing their most recent power outage experience, Ontarians are less satisfied, overall, on all attributes tested. However, while most dips are slight, the overall impression score drops most – eight points from 79% to 71% over the course of the questionnaire.
Mean: 7.36
Mean: 7.10
Mean: 6.12
Mean: 5.98
Mean: 6.01
Mean: 5.62
Mean: 5.63
Mean: 5.56

Price Sensitivity Measures

20
47. On a scale of 1 to 10, where 1 is “not important at all” and 10 is “very important”, how important is it that your electricity provider introduces improvements to the electricity system to decrease power outages to near-zero? (N=905)
Importance of Reducing Number of Outages• In total, 79% of Ontarians say that it is either very (49%) or somewhat (30%) important to reduce the number of outages to near-zero, through
improvements to the electricity system. This is highest among Torontonians (85%), GTA residents (80%) and those in the North (80%), while it is lowest among Eastern Ontarians (72%) and Steel Triangle residents (74%).
Mean: 7.92Total Important: 79%
Total Not Important: 16%

21
48. And, if these improvements were made, what is the highest increase you would be willing to pay, if anything, on your electricity bill in order to pay for these improvements? (N=905)
Acceptable Bill Increase to Reduce Outages• More than half of Ontarians say that they would not be willing to pay more in order to pay for improvements to the electricity system (58%).
This being said, all things considered, the average dollar amount that Ontarians would be willing to pay is $4.59 in an average bill. Among those who are willing to pay any amount greater than $0, the average rises to $16.20 per bill.
• Those in the Southwest and Steel Triangle portions of Ontario are most likely to say they are not willing to pay (both 66% “$0”).
Average Acceptable Per- Bill Increase: $4.59
Average Acceptable Per- Bill Increase (Among
those willing to pay any amount greater than $0):
$16.20

If YES then:
22
49. Would you be willing to accept your provider not making these improvements, and therefore, having the number of unplanned outages increase, if it meant that you paid less on your electricity bill? (N=905)
50. [IF YES TO PREVIOUS] And by what amount must your bill decrease, in order to compensate for the increase in unplanned outages? In other words, what is the smallest reduction that you would accept on your bill? (N=283)
Willingness to Accept More Outages for Lower Bill
Willing to accept more outages for lower bill?
How much of a reduction required?
• Over half of Ontarians say they would not be willing to accept more outages, even if it meant a reduction in their bill (57%), while 31% say that they would be willing to do so. Among those who pay over $100 a month in electricity bills, however, more say that they would be willing to accept more outages for a lower bill (37%), however, the decrease would have to be substantial (more than a 10% reduction for someone who pays a $100-$500 bill.)
• Approximately 41% of Ontarians say that they will neither pay more for improved service, nor accept a lower bill if additional outages were to occur. This group represents the most intensely reliability-conscious consumers in the Ontario market, who are frequently more cost-conscious as well.
Average Expected Bill Decrease: $27.85

Experience with Power Outages
If YES then:
24
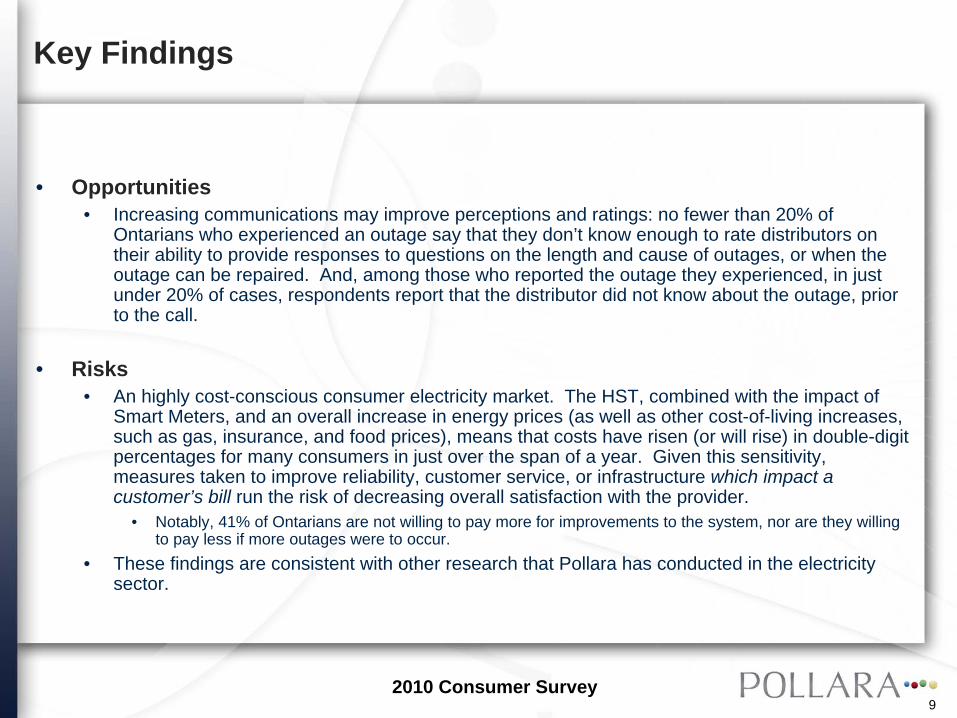
9. Thinking back over the past year, did your home ever experience a power outages? (N=905)10. [IF YES TO 9] Approximately how many times has your house lost power in the past year?
[PROBE: Best estimate is fine.] (N=634)
Experience with Power Outages – Past Year
Has Home Lost Power in Past Year? How Many Times in Past Year?
(Ontario, Overall)
• Just over two-thirds of Ontarians say that they have experienced a power outage in the past year; of this group, 85% say that they have had six or fewer outages, the equivalent of one outage every two months, or less frequent than that. On average, Ontarians experience just over one power outage every quarter, or 4.78 outages per year. Less than one per cent of those who have experienced an outage in the last year say that their power has gone out more than 100 times in the past year, or once every 3-4 days.
Toronto GTA 905 GTA Shadows Eastern Southwest Steel
Triangle Northern
Mean # of Outages 3.80 4.45 4.66 5.34 6.48 4.42 4.69
Mean: 4.78

25
19. Over the past five years, would you say that the number of power outages your home has experienced has [rotate] increased, decreased, or stayed about the same? (N=634)
Experience with Power Outages – Five Year Trend
• Just over three-in-five say that the number of power outages they have experienced has stayed about the same over the course of five years; equal proportions say that the outages have increased (18%) as decreased (17%). This suggests that for the past five years, Ontarians believe they have experienced about 4-5 power outages each year (Average number of reported outages, 2010: 4.78).
• Among Southwest residents, 23% say that the number of outages they experience has increased, while 23% of Eastern Ontarians who have experienced an outage in the past year note the opposite is true for them. One-quarter of Toronto residents say the number of outages they experience has increased in the past five years.

26
11. Thinking about your most recent power outage, approximately what time of day did it start? Was it...[Probe: Your best estimate is fine.] (N=634)
When Most Recent Outage Occurred (Time of Day)• Just under one-in-five Ontarians who have experienced an outage in the last year say that the most recent one occurred overnight, that is, the
period between midnight and 6AM. The majority of Ontarians who have experienced an outage say that it happened during the waking hours (72%; 15% between 6AM and 12PM, 29% between 12PM and 6PM, 28% between 6PM and 12AM).
Toronto GTA 905 GTA Shadows Eastern Southwest Steel
Triangle Northern
% of overnight outages
18% 16% 12% 21% 24% 22% 13%
% of midday outages (12- 6PM)
43% 22% 29% 27% 19% 38% 26%
27
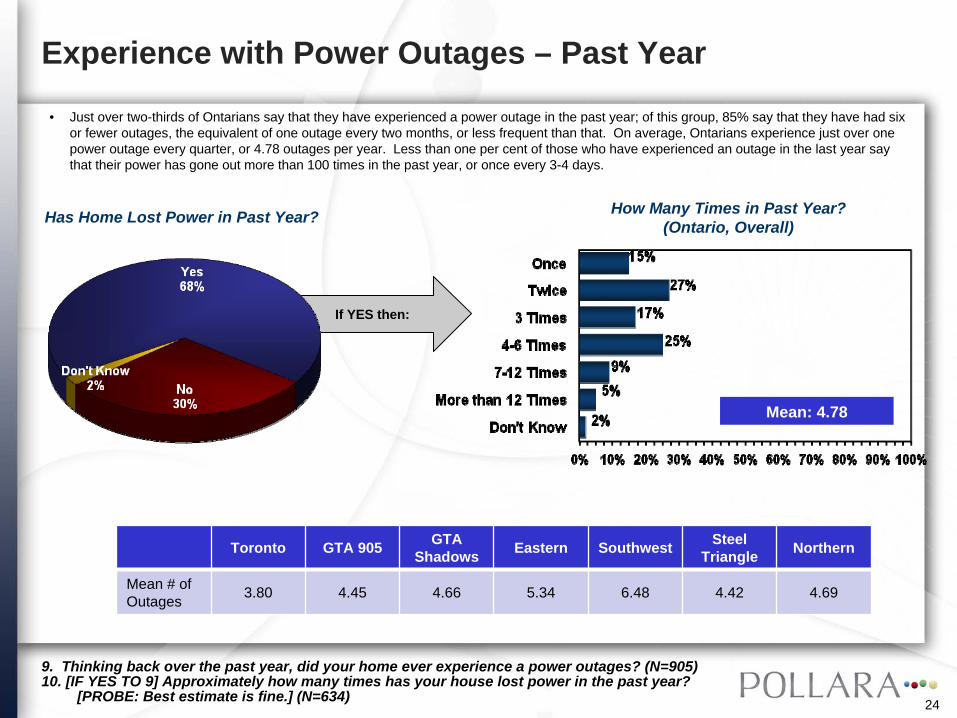
12. And, to the best of your recollection, what season of the year was that most recent outage? Was it during... (N=634)
When Most Recent Outage Occurred (Season)Field dates and responses indicate that most recent reported outage occurred in past few months.
• Just over three-quarters say their most recent outage experience was in a warmer month (77% in spring or summer). This experience is highest among Northern Ontarians (87% in spring or summer), and lowest among Eastern Ontarians (66% spring or summer).
Note Field Dates:July 6 to 20, 2010

28
15H. Approximately how long (in hours) did the outage last? [COMBINED VARIABLE] (N=634).
How Long Most Recent Outage Lasted• 33% of Ontarians who have experienced a power outage in the last year say that their most recent outage was less than one hour long; just
over one-quarter say that it lasted between 1 and 3 hours. Ontarians in rural areas report power interruptions that are more than twice as long, on average, than urban Ontarians (5.37 hours and 2.15 hours, respectively).
Average Outage Length, Overall:
2.79 Hours
Toronto GTA 905 GTA Shadows Eastern Southwest Steel
Triangle Northern
Average Length of Outage (Hours) 2.34 2.11 2.65 4.09 4.00 1.64 3.08

29
16. Overall, would you consider that to be the typical length of the power outages you experience? Or would you say that most of your power outages have been longer or shorter than that? And is that a lot longer/shorter, or only somewhat longer/shorter? (N=634)
Representativeness of Most Recent Outage• Two-in-five Ontarians say that the average outage that they experience is shorter than the most recent one that they have had, while an
additional two-in-five say that the outage they just experienced is about average. Half of Eastern Ontarians and Southwest residents – who experience the longest outages, on average – say that most of their outages are “about the same length” as their most recent experience (50% and 46%, respectively)..
Average Outage Length: 2.79 Hours

30
17. Again, thinking about the most recent power outage you experienced, can you recall how widespread the outage was? Was it... (N=634)
Most Recent Outage – How Widespread• Just under half of Ontarians who have experienced an outage in the past year say that it affected their neighbourhood, and a further 19% say
that it was more widespread (13% entire city/town; 6% more widespread than entire city/town). One third of Northern Ontarians say that the outage they experienced most recently was more widespread than their entire neighbourhood (33%).
Average Outage Length: 2.79 Hours

31
Perceived Cause of Most Recent Outage
18. And, to the best of your knowledge, what caused the most recent power outage that you experienced? [OPEN, ACCEPT TWO; MULTIPLE MENTION COMBINED] (N=634)
• Two-fifths of Ontarians say that they don’t know or can’t recall the cause of the most recent outage they experienced; this is highest among those in Eastern Ontario (48%) and lowest among those in the Southwest (33%).
• Three-in-ten say that the weather caused their most recent outage (30%), while 14% attribute their outage to a transformer failure.

Impact of Power Outages

33
Emotional Response to Most Recent Outage
20. And, thinking again about that most recent power outage, what sort of emotion best reflects how you felt when the power went out, if any? [OPEN, ACCEPT TWO; MULTIPLE MENTION COMBINED] (N=634)
• A plurality of Ontarians who experienced an outage in the last year say that their most recent experience wasn’t particularly moving: they felt no strong emotion or nothing at all when the lights went out (41%). One-quarter, on the other hand, expressed frustration (26%) while a further 8% say that they were fearful.
• Those who have experienced more than six outages in the past year were more likely than those who had fewer to express anger or frustration at the situation (39% and 25%, respectively). Length of outage also translates to increased feelings of anger: 34% of those whose outages lasted at least five hours reported feeling angry or frustrated; only 23% of those whose most recent outage lasted less than two hours report feeling similarly.

34
Household Impact of Outage
21. And, did it have any impact on you or your family? AMONG 29% “YES”: What impact did it have? [OPEN, ACCEPT THREE; MULTIPLE MENTION COMBINED] (N=182)
• Of those who report that the outage had an impact on their family, just over one-in-five say that the greatest impact was felt through the loss of electronic equipment, from the TV to the computer to the stove (22%).
• Just over one-in-ten say that their regular activities were interrupted (12%), a further five per cent say that it impacted their productivity in some way (late for work 2%, had to stop working 3%).
• Young men noted the loss of electronics most frequently (18-34: 45%), while women of the same age most often reported having their daily routine interrupted (19%). Just under one-quarter of Steel Triangle residents reported having lost A/C (23%), while 11% in the GTA Shadows (the region that includes the Kawarthas, Haliburton and Peterborough) report having lost access to water. One-quarter of GTA residents missed a meal (26%).

35
22-26. Thinking back to that most recent power outage again, and using a 1 to 10 scale where 1 is “not at all concerned” and 10 is “very concerned”, how concerned were you about the following? What about...? [N for each = 634]
Concern about Impact of Outage on Household
Mean
4.21
3.84
3.12
3.11
3.06
• A plurality of Ontarians who have experienced an outage in the past year report not being concerned at all for any of the household measures tested; fully 62% were not concerned at all for their home’s security, and 40% felt similarly about their food storage.
• Those who contacted their provider about the outage were consistently more concerned about all indicators, on average, than those who did not contact their electricity distribution company. And, though they report the shortest outages on average, Torontonians are the most frequently concerned about how long their food would last (mean: 4.56).

36
First Action at Power Outage
27. Now, when the power went out most recently, what did you do first? [OPEN, ACCEPT ONE ONLY] (N=634)
• About one-quarter say that they sought out candles or flashlights when the power went out in their home most recently, while a near-equal proportion did nothing at all (28% and 25%, respectively).
• Torontonians were the most likely to look to surrounding homes to try to determine how widespread the outage was (23%), while those in the Southwest and Steel Triangle areas of the province were the most likely to simply wait for the power to return (34% and 38%, respectively). 14% of Northern residents were first compelled to call their electricity provider.

Customer Service Ratings and Impact

38
28. Did you contact your electricity provider to report this most recent power outage, or to find out more information about the outage in your area? [N=634]
Customer Reporting of Outages
• Only 17% of Ontarians who say that they experienced an outage in the past year reported that outage to their distributor. Rates of reporting were higher in the GTA Shadows (24%), Eastern Ontario (28%), and Northern Ontario (25%). Reporting rates were lowest in Southwestern Ontario (8%).
• Rural residents were almost twice as likely to report their outage than urban residents (27% and 15%, respectively).

39
29-33. And when you contacted your provider, did they...? [N for each=119]
Customer Service when Contacted about Outage
• Of the 17% of Ontarians who reported their most recent power outage, 78% say that when they called to report it, the distributors already knew about the situation. While still a majority, a comparatively lower 65% of residents of the GTA say that their provider was aware of the outage that they called to report. For nearly half of Northern Ontarians, their provider was able to provide the cause of the outage (46%).
• For fewer than three-in-ten Eastern Ontarians who reported their outage, the provider gave an accurate estimate of when power would be restored (28%), much lower than the average across Ontario (43%).

40
34. [IF YES TO 28] When you called your electricity provider about the power outage, did you speak to a live person, or was it an automated response? (N=119)
Response to Provider Contact
• Equal proportions say that when they called to report the outage, they spoke to a live person (44%) or got only an automated response (42%).
• A majority of Steel Triangle and Northern Ontario residents who reported their outages spoke to a live person (72% and 60%, respectively) while half of those in the GTA Shadows received an automated response (57%).

Expectations for Number and Duration of Outages

42
40. Now, thinking about the electricity distribution system in Ontario and your local electrical utility...How many unplanned power outages do you expect to happen at your home in a typical year?
Expectations for Number of Outages
• In total, 18% of Ontarians say that they expect that they will not have any power outages at all in a typical year; two-thirds say that they expect between 1 and 6 outages. By comparison, 30% of Ontarians say that they have not had any outages in the past year, and 85% of those who respond that they have had an outage say that they experienced between 1 and 6 outages in the past year.
• Those who live in Eastern Ontario (4.06), the Southwest (4.81), and Northern Ontario (4.24) anticipate more outages, on average, than those in other parts of the province; in particular, Toronto (2.70) and the GTA Shadows (3.02).
Average number of anticipated outages:
3.43/annum
Average number of reported outages
(current): 4.78/annum

43
15H. Approximately how long (in hours) did the outage last? [COMBINED VARIABLE] (N=634).42H. And, on average, how long (in hours) do you expect the typical outage to be? [COMBINED
VARIABLE] (N=905)
Expectations for Length of Outage• On average, Ontarians expect that outages they experience will be just under two hours long; the average reported experience, however, is
about 48 minutes longer (0.8 hours).
Average Expected Outage:
1.99 Hours
Average Reported Outage Length: 2.79
Hours
Toronto GTA 905 GTA Shadows Eastern Southwest Steel
Triangle Northern
Average Length of Outage (Hours) 2.34 2.11 2.65 4.09 4.00 1.64 3.08
Expected Length of Outage (Hours) 1.68 1.39 2.15 2.39 1.91 1.40 4.49
Difference 0.66 0.72 0.5 1.7 2.09 0.24 -1.41

44
43A. All things considered, approximately how many unplanned power outages per year would you consider acceptable? That is, what would be the maximum number of outages that you would consider reasonable that would not significantly impact your satisfaction with or confidence in the electricity system? (N=437)
45A. And, thinking about how natural accidents, fallen trees, wildlife and weather interference as well as equipment failure can cause unplanned power outages, approximately how many unplanned power outages per year would you consider acceptable? (N=463)
Expectations for Number of Outages• In order to ascertain if there was any difference in tolerance for outages when considering the potential causes of outages, this question was
asked two different ways: what was the maximum number of outages you would experience before losing confidence in the system, and what is the maximum number of outages you would expect, considering the potential causes of an outage?
• For both tested questions, Ontarians believe that the greatest number of outages that they can or will expect is just over three per year.
Maximum # of Outages before confidence
undermined (average): 3.44
Acceptable # of Outages – considering
environmental factors:3.30

45
44A. And, all things considered, what would you consider an acceptable length of time for an average unplanned outage? That is, what would be the maximum length of an outage that you would consider reasonable, that would not significantly impact your satisfaction with or confidence in the electricity system?? (N=456)
46A. And, still thinking about how natural accidents, fallen trees, wildlife and weather interference as well as equipment failure, can cause unplanned power outages, what would you consider an acceptable length of time for an average unplanned outage(N=449)
Expectations for Length of Outage• There is little room for manoeuvring on the number of outages – that is, the number of outages that residents would deem acceptable before
their confidence in the system were undermined, and the number of outages residents would consider acceptable given all environmental and contextual considerations are virtually equal. However, there is more “wiggle room” on the length of those average outages, if caused by a storm or other environmental factor: it may be tolerated for approximately a half-hour longer than one with an unspecified cause (3.54 hours, compared to 2.94 hours, on average, in general).
Length Of Outage before confidence undermined
(average): 2.94
Length of Acceptable Outage – considering
environmental factors:3.54

1255 Bay Street, Suite 900Toronto, Canada M5R 2A9
Tel: 416.921.0090 | Fax: 416.921.3903www.pollara.com