Embed Size (px)
Citation preview

EU Electrical Generation & Distribution
APPA Institute, Providence, September 2017 1
Electrical Generation EU
1
Erin F. Hazen
Renewable Energy Business Development Manager
University of Iowa
Generation Topics to Cover
• Forms of Generation • Turbine Generators
• Solar
• Combined Heat and Power
• The Case for Self‐Generation
• Cost Considerations• Understand Energy Use vs Demand
• What’s your Generation Strategy?
• Technology Selection• Renewable Energy Generation
2
HOW?
WHY?
HOW MUCH?
WHICH KIND?

EU Electrical Generation & Distribution
APPA Institute, Providence, September 2017 2
3
How Does Generation Work?
Turbine Generators• 80% of world’s electricity generated by steam turbines driving rotary generators
• Turbines extract energy from fluid flow and convert it to useful work
• Fluid flow acts on the turbine blades to produce rotation of a shaft (rotor) attached to generator
• Prime Mover: the mechanical means of turning the generator rotor
• STEAM Turbine: Steam raised in a boiler which is heated by the combustion of coal, gas, or biomass
• GAS/DIESEL Turbine: flow of gas caused by the combustion of fossil fuels
• WIND Turbine: air flow caused by sun’s uneven heating of earth’s surface
• HYDRO Turbine: water flow from run‐of river, dam, or artificial pumped water storage
4

EU Electrical Generation & Distribution
APPA Institute, Providence, September 2017 3
Adaptation of centuries‐old technology
5
A Peek Inside the Turbine
6
Wind Turbine GeneratorSteam Turbine Generator
Gas‐fired Turbine GeneratorTurbine Blade Cross‐section
HIGH
LOW

EU Electrical Generation & Distribution
APPA Institute, Providence, September 2017 4
What’s Going on Inside the Generator?
A conductive coil is rotated within a magnetic field
Dynamic interaction between coil and field induces voltage
The voltage pushes on & dislodges free electrons in the conductor (wire)
Copper is a highly efficient conductor due to molecular structure
7
Electricity = flow of electrons
Other Generation ModalitiesSolar PV: Direct conversion of solar irradiance into electricity. No generator needed.
• PV panels contain silicon layers which carry a negative and positive charge
• Silicon molecules, like copper, are prone to losing electrons
• Photons from the sun dislodge electrons in the atoms from the negative layer
8
• Electron ping‐pong game ensues
• Conductors embedded • in panel collect the flowing electrons
• Output from all panels is combined and sent to grid
Electricity = flow of electrons

EU Electrical Generation & Distribution
APPA Institute, Providence, September 2017 5
District Energy: Central power plant distributes heating and cooling to all buildings via underground hot and chilled water pipes.
Conserves energy & avoids need for each building to have furnace & A/C
Standard Electric Power Plant: Energy contained in the primary fuel is used to make electricity only. On average, 66% of that energy is wasted.
Combined Heat & Power: Primary fuel converted to multiple forms of useful energy. Only 20‐25% energy wasted.
9
Iowa’s Combined Heat & Power Overview
10
Purchased Electricity from GridPurchased Electricity from Grid
Energy in primary fuel converted to steam
Steam passed thru turbines to make electricity
Steam leaves turbines and goes out to heat buildings
Steam also runs chiller plants to cool bldgs

EU Electrical Generation & Distribution
APPA Institute, Providence, September 2017 6
11
Why Self‐Generate?
The Case for Self‐Generation
Continuity of service despite grid outages
Agile response to market conditions
Time of Day and Seasonal pricing factors• Rates vary by on‐peak/off‐peak periods, and summer/winter
Demand Response/Curtailment Agreement• Lower rates/rebates utility for curtailment (load reduction) • Curtailment triggered by congestion, wholesale market price spikes, grid reliability
concerns • University of Iowa’s 2015 rebate: $1,012,000
Base Load Generation vs. Peak Shaving• Base Load: Continuous operation serving all or most of campus demand• Peak Shaving: Rapid response generation to offset load during high demand hours• Energy Storage is another tool to achieve peak shaving—system costs rapidly coming
down
12

EU Electrical Generation & Distribution
APPA Institute, Providence, September 2017 7
13
How Much $$$?
Levelized Cost of Energy:Installed Cost, new build‐to‐new build
14

EU Electrical Generation & Distribution
APPA Institute, Providence, September 2017 8
Technology Selection and System Size: Consider Efficiencies and Net Capacity Factors
Efficiency– how much of the primary energy stored in the fuel is converted to useful power?
15
Net Capacity Factor
Ratio of actual output to its potentialoutput if operating continuously at full capacity
For renewable energy, NCF demonstrates the impact of intermittent resource on output
Captures how many hours/year the facility is expected to produce energy
Solar PV NCF: 15‐35% Varies by region. Tracking can add ~10%.
Windpower NCF: 35‐50% Highly site specific. Many options to boost NCF (tower height, blade length, turbine mfr.)
Natural Gas 32-38%Coal 39-47%Solar 18-20%Wind 35-55%CHP 80-85%
16
Rate Type cents/KWh
Summer On Peak Rate 11.022
Summer Off Peak Rate
4.142
Winter On Peak Rate
4.024
Winter Off Peak Rate
3.836
Cost of Generation Purchased Electricity
Cost Avoidance
EU Electrical Generation & Distribution
APPA Institute, Providence, September 2017 9
Power (KW) vs. Energy (KWh)
Power: The rate at which energy is supplied (KW). Also called “Demand.”
Energy: The amount of Power delivered over time (KWH)
17
Energy (KWh)
24‐Hour period
PricePower (KW)
Driving Analogy: Power/Demand = miles per hour. Energy = total distance traveled.
Demand and Energy effects on Costs
Energy Charge: $/KWh for total Energy Use (entire blue area)
On‐peak Demand Charge: $/KW
Charge based on your highest Demand (highest rate of energy consumption) during On‐Peak hours.
Demand is expensive because power plants, transmission, etc must be sized to meet peak demand.
18
Peak Demand: 652 KWDemand Charge $6.77/ KW
Applied to ENTIRE month’s usage
Energy (KWh)

EU Electrical Generation & Distribution
APPA Institute, Providence, September 2017 10
A Day in the Life….
What changes might this facility take to reduce its electricity bill?
Scheduling options
Generation options
Load‐following Generation?
Net metering?
Energy storage?19
Begin cooling bldgs
Staff arrives
Classes in full swing
Outdoor temps rising
Plug in the EV’s to charge o’night Evening
classes wrap up
Custodial, dorm lighting
Price
20
Which Kind?

EU Electrical Generation & Distribution
APPA Institute, Providence, September 2017 11
Purchase or Generate? And Which Technologies?
Consider institutional priorities
Utilities Cost Reduction
Budget Stability
• Fixed Costs – Construction & Regulatory
• Marginal Costs – Fuel and O&M
Energy Security
Continuity of Services/Emergency Power
Environmental Impacts
University branding
Research and Learning opportunities
21
Consider limitations
• Available Capital
• Regional Energy Resources
• Physical Space / Existing Infrastructure
• Permitting Regime
• Community Support
• Timeline, Scalability
• Staffing & In‐house Expertise
• Bring in third party operators?
• Sell utilities enterprise entirely? 22
Purchase or Generate? And Which Technologies?

EU Electrical Generation & Distribution
APPA Institute, Providence, September 2017 12
How About Renewable Energy?
• Intrinsic environmental benefits
• Branding: students expect and demand it
• Dramatic CoE reductions‐ some regions at grid parity
• Understand available incentives and market value of
Renewable Energy Credits
• Seek partners with tax appetite for CAPEX reduction
• Forward curve projections of coal/gas prices: a flat PPA may
be a great bet. (…Or it may not.)
• What’s your clout with your utility? Get them to do
the heavy lifting!
23
Wind?• Increasingly cost‐competitive vs fossil fuels
• Siting and the wind resource are critical
• Not a load‐following generation source (usually)
• Technology choice matters greatly
• Not conducive to phased implementation‐ high mobilization costs
• Engage permitting experts
24
• Load‐following (usually)
• Less picky about siting, easier to permit
• Economics (usually) depend on tax incentives
• Scalable‐‐fairly easy to construct in phases
• PV Panels essentially commoditized, but supplier quality can vary
EU Electrical Generation & Distribution
APPA Institute, Providence, September 2017 13
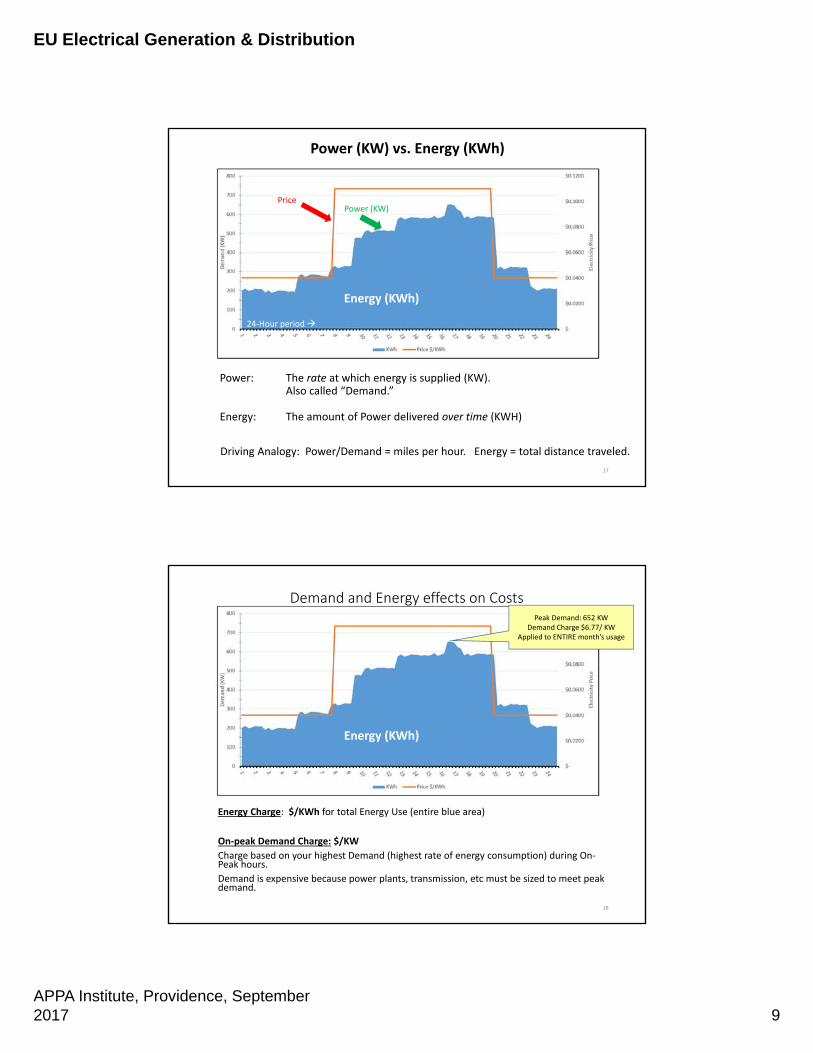
Windpower Success Story
• $5.2MM to install one 1.65MW Vestas turbine
• Serves 41% of campus load
• 15‐year payback period
• Projected 4.3MWh annual production (actual: 4.8 MWh)
• Utility offers favorable net metering at retail rate
• Financing: $950k US DoE grant & $512k IL Clean Energy Community Foundation
grant.
• College‐issued bonds will be repaid with energy cost savings
25
Annual expense $755k $420k
(while other HCC campuses went up 40%‐65%)
Solar Parking Canopies
26
Upcoming EPA Webinar: September 26, 2017
12:00pm CDT
• Control energy costs, reduce carbon footprint, and develop real‐world teaching tools.
• Highly visible demonstration of commitment to RE (but what are campus planning implications?)
• Solar carports shade and protect cars from the elements
• Reduce parking lot temperatures
• Michigan State University: will cover 5 parking lots with 10 megawatts of solar PV panels. Expected to meet 5% of the campus load.
• University of Massachusetts: 11.6 acres of solar carports financed through a 20‐year power purchase agreement.

EU Electrical Generation & Distribution
APPA Institute, Providence, September 2017 14
Biomass Project at University of Iowa
• Goal: Zero Coal by 2025, majority to be achieved by replacing coal with biomass
• Renewable fuels currently in use: oat hulls, engineered fuel pellets, miscanthus grass, and wood chips
• >800 acres planted of Miscanthus. 12ft height at maturity, displaces ~4 tons of coal per planted acre
• Moving from R&D to commercial reality‐‐currently developing cost‐effective, diverse biomass supply chain
• Future fuels include short rotation woody crops, timber management output, and non‐recyclable manufacturing by‐products from in‐state businesses
27
Electrical Distribution
EU
28
Erin F. Hazen
Renewable Energy Business Development Manager
University of Iowa

EU Electrical Generation & Distribution
APPA Institute, Providence, September 2017 15
Distribution Topics to Cover
• Getting Electricity from A to B: The Basics
• Distribution vs. Transmission• High Voltage Transmission
• Medium – Low Voltage Distribution
• Key Components • Xxxx
• Xxxx
• Outage Recovery (i.e. “You only care about us when we’re gone.”)
29
Voltage vs Current vs Resistance
• Voltage (volts)= potential energy created by difference in charge between two points
• Current (amps) = rate at which the charge is flowing
• Resistance (ohms) = the material’s tendency to resist the flow of charge.
30
Plumbing analogy: Voltage = water pressure. Current = flow rate. Resistance = pipe size.
Now it’s time to geek out:
Voltage = Current x Resistance

EU Electrical Generation & Distribution
APPA Institute, Providence, September 2017 16
Electrical Power
Power is the rate that electrical energy is converted into something useful (heat, mechanical energy, etc.)
Measured in watts (kilowatts, megawatts)
31
More geek stuff:
Power = Voltage x Current
(Pressure x Flow)
More plumbing analogies: Increasing Power
You need to wash off a grimy lawn chair with a garden hose. You give the hose spigot a few turns, and the water runs over the chair ‐‐ but it’s not getting much crud off. You need more power.
What are two things you might do to get the dirt off?
• Put your thumb over part of the hose opening = Increased pressure(voltage)
• Go to the spigot and turn it all the way open= Increased flow (Current)
Captain Kirk: Arm your Phasers!
Single Phase Power:
• Two wires (phase and neutral) to complete a circuit
• Appropriate for residential and low commercial loads
• Delivers power in pulses (50‐60 cycles per second).
32
Three‐Phase Power:
• Three phase wires • More efficient and cost‐effective
• Delivers 3x power vs. single‐phase• Better for large loads and motors; delivers continuous flow of power
EU Electrical Generation & Distribution
APPA Institute, Providence, September 2017 17
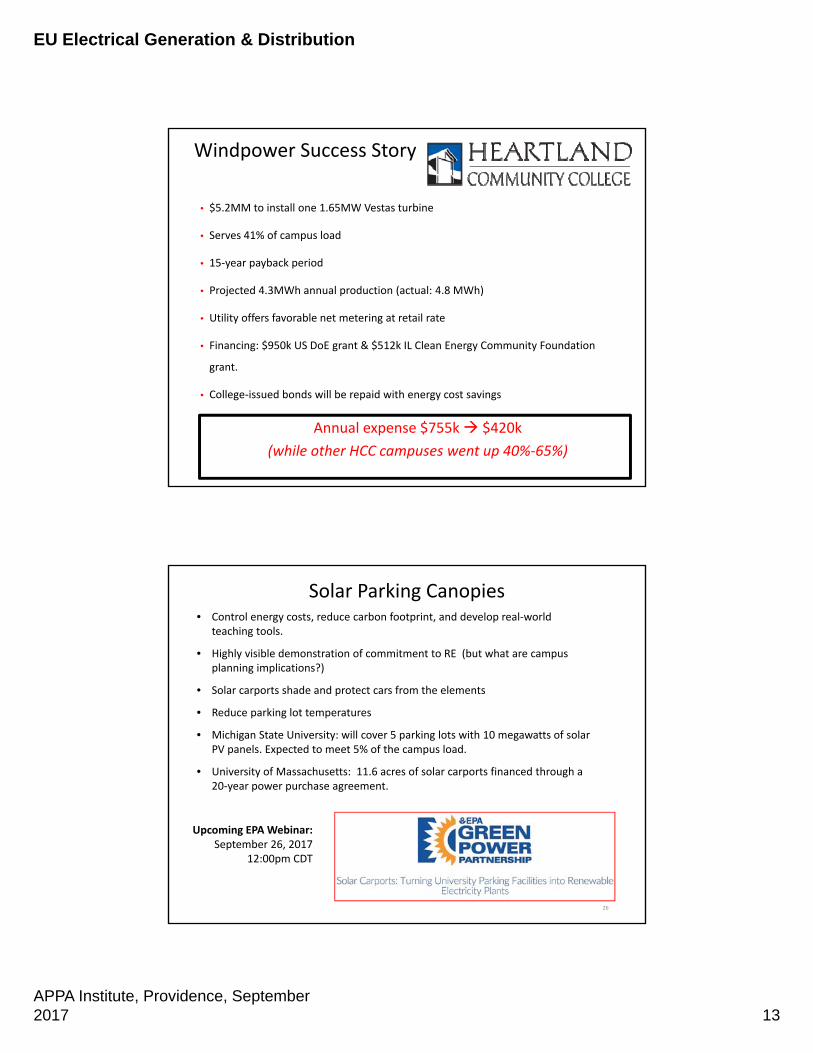
Transmission vs. Distribution
33
Distribution lines (Medium Voltage):
• Common voltages: 7,200‐13,800 volts
• May be overhead or underground. U/G is much more reliable but up to 10X the cost of O/H. (Campus aesthetics another consideration!)
• If U/G, conduit may be direct buried, or encased in concrete “duct bank”.
• Different utilities often share the same pole. Highest voltage electrical lines are always on top. Fiber optic, cable TV, telephone lines are installed below
High Voltage Transmission lines:
• 69,000 volts and up
• Installed overhead for cost and efficiency.
• Not insulated.
• Insulation = resistance = wasted energy in the form of heat
• Heavy load causes lines to sag
Cable is a major cost for any utility. Copper 15‐kv cable runs ~$30 per foot.
University of Iowa has 30 miles of 15kV cable installed on campus.
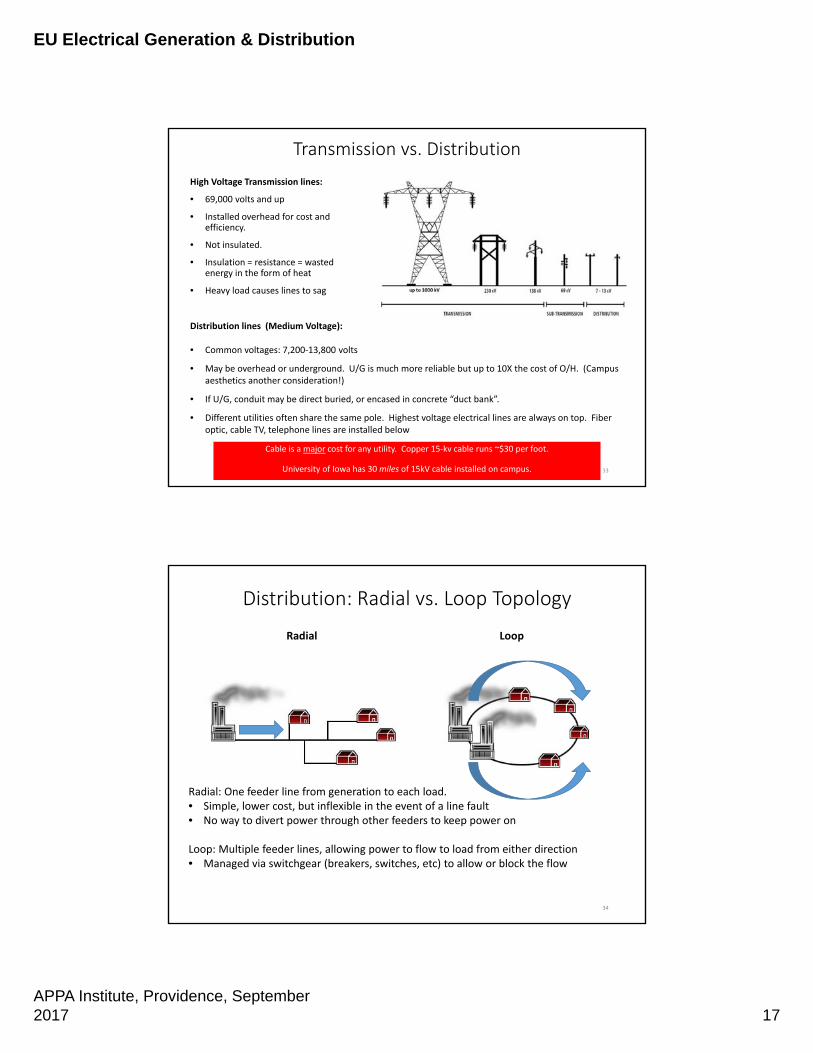
Distribution: Radial vs. Loop Topology
Radial Loop
34
Radial: One feeder line from generation to each load. • Simple, lower cost, but inflexible in the event of a line fault• No way to divert power through other feeders to keep power on
Loop: Multiple feeder lines, allowing power to flow to load from either direction• Managed via switchgear (breakers, switches, etc) to allow or block the flow

EU Electrical Generation & Distribution
APPA Institute, Providence, September 2017 18
35
Insert screenshot of UI loop
Example of a Campus Loop
36
Power Outages

EU Electrical Generation & Distribution
APPA Institute, Providence, September 2017 19
37
Call to Emergency Services from a passerby: FIRE AT SUBSTATION!
At Power Plant, steam boilers trip, blows pressure release valve. Audible from several blocks around.
Call from Housing maintenance tech: 3 blower motors in basement just shorted out at same time. Weird: seems like they’re getting single‐phase power (but it’s a 3‐phase system)?
Key staff head toward substation from multiple points. Other staff dispatched to the field to open switches, to electrically isolate the sub.
New call: hospital administrative building reports a complete power outage.
New call: FIRE AT RESEARCH BUILDING!
The high side of the sub is 161kV, controlled by the outside utility. What are they seeing?
Decision by Distribution: Dump Load, now. We dispatch staff out to the field to open switches, shutting off power to much of campus. Need to isolate ourselves from the outside utility, Our Across‐Campus Tie can’t support the load of entire campus The outside utility independently makes the same decision for their network, and starts to
dump load. Tens of thousands of customers in surrounding communities lose power.
We’re about 12 minutes into this event.
Getting Back Online
Sectionalize
• Isolate circuits closest to problem.
• Expand isolation until problem fully contained.
• Using loop topography, maintain power to as many buildings as possible.
Diagnose
• Entire buildings or just parts?
• Cable integrity‐‐is the fault in a splice in an underground vault, or somewhere along duct bank?
• Our side of the substation, or theirs?
Repair & Test
• Methodically, safely clear each circuit
• Apply test voltage to look for leakage
Restore
Methodically bring load back online
Must avoid inrush current that will trip the system all over again
Distribution’s realities may not match customers’ priorities
38
EU Electrical Generation & Distribution
APPA Institute, Providence, September 2017 20
39
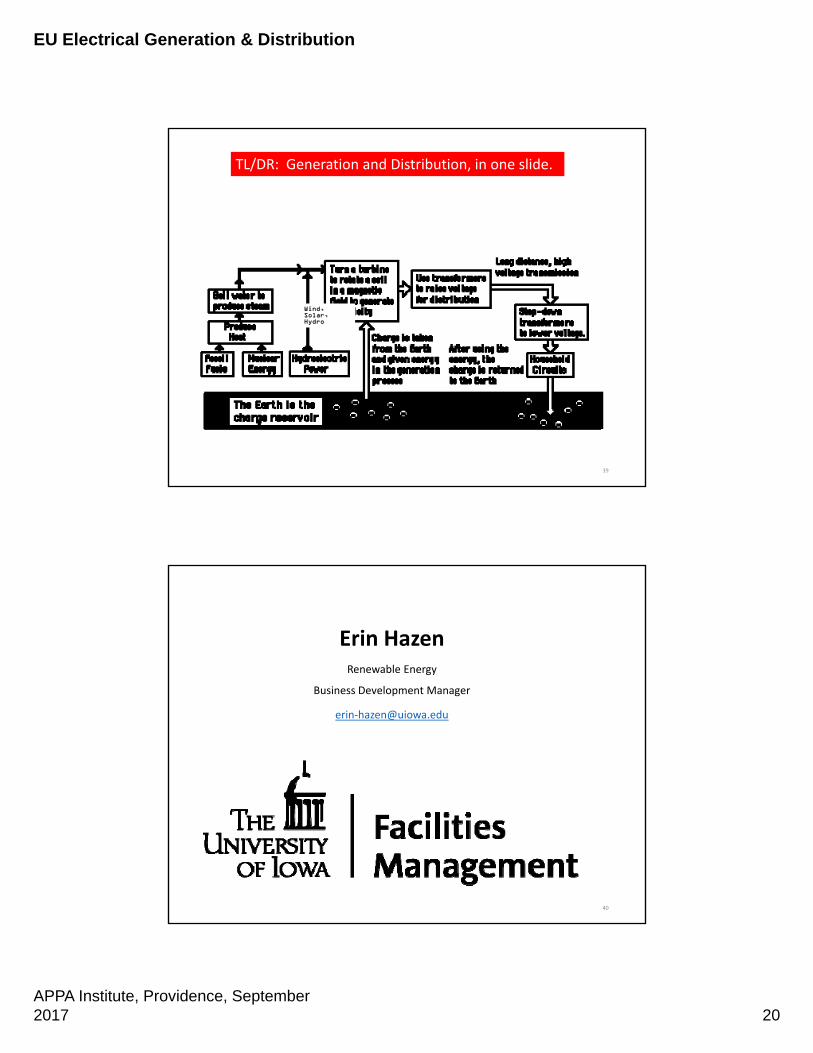
Wind, Solar, Hydro
TL/DR: Generation and Distribution, in one slide.
Erin HazenRenewable Energy
Business Development Manager
erin‐[email protected]
40
EU Electrical Generation & Distribution
APPA Institute, Providence, September 2017 21
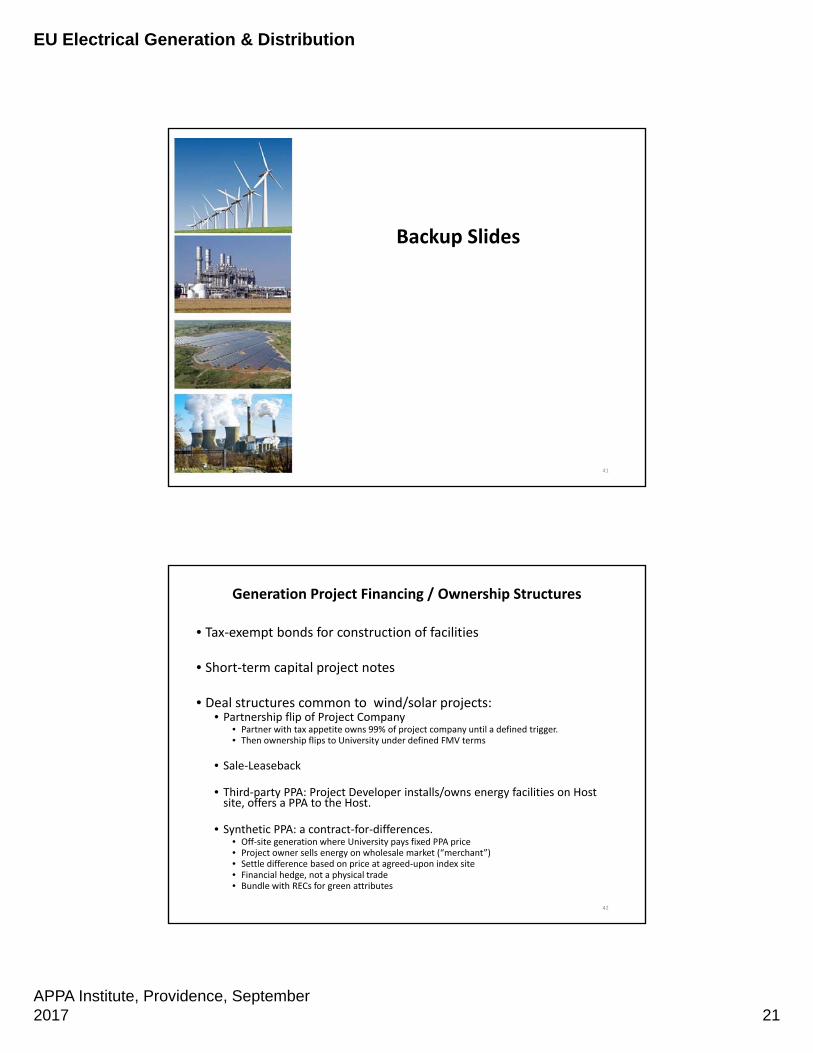
Backup Slides
41
Generation Project Financing / Ownership Structures
• Tax‐exempt bonds for construction of facilities
• Short‐term capital project notes
• Deal structures common to wind/solar projects:• Partnership flip of Project Company
• Partner with tax appetite owns 99% of project company until a defined trigger. • Then ownership flips to University under defined FMV terms
• Sale‐Leaseback
• Third‐party PPA: Project Developer installs/owns energy facilities on Host site, offers a PPA to the Host.
• Synthetic PPA: a contract‐for‐differences. • Off‐site generation where University pays fixed PPA price • Project owner sells energy on wholesale market (“merchant”)• Settle difference based on price at agreed‐upon index site• Financial hedge, not a physical trade• Bundle with RECs for green attributes
42

EU Electrical Generation & Distribution
APPA Institute, Providence, September 2017 22
Other Project Financing Options (if you really want to get fancy….)
43
Sale / Leaseback Third‐Party Power Purchase Agreement
Renewable Energy Information Resources
Comprehensive tally of available RE incentives, net metering by state
www.DSIREUSA.org
Berkeley Lab RE publications
https://emp.lbl.gov/reports/re
Searchable database of NREL publications
http://www.nrel.gov/research/publications.html
NREL’s LCOE (Levelized Cost of Energy) calculator
http://www.nrel.gov/analysis/tech_lcoe.html
44