Embed Size (px)
Citation preview

Page 1
ELECTRICAL DESIGNS IN A SERIES PLUG IN HYBRID
ELECTRIC VEHICLE
A Design Project Report
Presented to the Engineering Division of the Graduate School
Of Cornell University
In Partial Fulfillment of the Requirements for the Degree of
Master of Engineering (Electrical)
by
Andrew Tomson Gifft
Project Advisor: Professor Bruce Robert Land
Degree Date: August 2010


Abstract
Master of Electrical Engineering Program
Cornell University
Design Project Report
Project Title: Electrical Designs In A Series Plug In Hybrid Electric Vehicle
Author: Andrew Tomson Gifft
Abstract:
The goal of Cornell’s CU100+MPG Team was to design, build, and test a series hybrid vehicle
capable of achieving at least 100 miles per gallon equivalency while meeting Federal Motor Vehicle
Safety Standards (FMVSS) and Progressive Insurance Automotive X-Prize (PIAXP) competition
requirements. This was an extremely difficult undertaking as our car would have to not only be
functional, but durable enough to drive at high speeds through a rough simulated road course, drive a
combined distance of hundreds of miles without needing servicing, provide vehicle safety and
crashworthiness equal to production cars, while providing passenger comfort and amenities. We also
had to design our car to be marketable to today’s consumers.
Our electrical systems were monitored and controlled by custom software running on a National
Instruments cRIO microcontroller which handled nearly all vehicle functionality. I wrote software for
this device that monitors pedal position, commands torque from the drive motor, starts and stops the
genset, and monitors battery health and limiting driving when an error occurred.
Most of our vehicle was custom build which meant I had to build two vehicle fuse/relay boxes, run
conduit through the car with over 100 distinct wires, design and build a custom instrument cluster, and
write custom control systems for the powertrain, batteries, charger and user interface controls.
Our vehicle has driven over two hundred miles as well as passed all PIAXP technical and safety
inspections. We made it through the first round of competition and had some difficulty during the
second round with our batteries and had to withdraw from competition. An analysis of a likely cause
of this failure is given at the end of this report.
This report discusses the design and implementation of the major hardware and software components I
designed and built. It is meant to both describe the design process I went through when designing
these systems and as a service manual for the car which will hopefully continue to be improved.
Report Approved by
Project Advisor: ___________________________________________Date: ________________

Page 2

Page 3

Page 4
Table of Contents
1 Executive Summary .............................................................................................................................. 6
2 Design Specifications and System Requirements ................................................................................. 7
3 Overview of Major Electrical Subsystems ........................................................................................... 8
3.1 Electrical Drivetrain ...................................................................................................................... 8
3.2 High Voltage Batteries and Provided BMS .................................................................................. 9
3.3 High Voltage Battery Charger .................................................................................................... 11
3.4 High Voltage Schematic and Significant Components ............................................................... 13
4 Vehicle Software................................................................................................................................. 15
4.1 Drive Control Strategy ................................................................................................................ 15
4.2 Genset Startup / Automated Control Strategy ............................................................................ 17
4.3 High Level Battery Management System ................................................................................... 19
4.4 User Interface .............................................................................................................................. 20
4.5 Dashboard Switch Panel ............................................................................................................. 27
4.6 User Interface Data Sender ......................................................................................................... 27
5 Selected Low Voltage Electrical Hardware ........................................................................................ 28
5.1 cRIO IO interface boards ............................................................................................................ 28
5.2 Ground Fault Detector Support Circuitry ................................................................................... 29
6 Data and Results ................................................................................................................................. 30
6.1 Data Log ..................................................................................................................................... 30
6.2 Driving Videos ............................................................................................................................ 30
7 Vehicle Analysis and Conclusions ..................................................................................................... 32
7.1 Potential Switching Noise Interference on Battery Control Boards ........................................... 32
7.2 Potential explanation for SOC Board Damage During Knockout Stage .................................... 34
7.3 Conclusion .................................................................................................................................. 36
8 Appendices ......................................................................................................................................... 37
8.1 MATLAB Code .......................................................................................................................... 37
8.2 Touch Screen LabVIEW code .................................................................................................... 38
8.3 Touch Screen Network Variables ............................................................................................... 40
8.4 Selected LabVIEW Code on cRIO ............................................................................................. 41
8.5 cRIO IO Modules Layout and Schematic ................................................................................... 44
8.6 Dashboard Switch Panel Schematic (w/ cRIO IO Modules) ...................................................... 47

Page 5
8.7 cRIO and IO Board Mounting and Numbering ........................................................................... 48
8.8 I/O MODULE CONNECTOR LOCATIONS AND PIN ASSIGNMENTS .............................. 49
8.9 Soft Start Connector Control Board Schematic .......................................................................... 50
8.10 Car Wiring List ........................................................................................................................... 51
8.11 Data Log Excerpt ........................................................................................................................ 59
8.12 Selected Pictures of Electrical Enclosures .................................................................................. 61
8.13 Manufacturer Spec Sheets ........................................................................................................... 65

Page 6
1 Executive Summary
The goal of Cornell’s CU100+MPG Team was to design, build, and test a series hybrid vehicle capable of
achieving at least 100 miles per gallon equivalency while meeting Federal Motor Vehicle Safety
Standards (FMVSS) and Progressive Insurance Automotive X-Prize (PIAXP) competition requirements.
This was an extremely difficult undertaking as our car would have to not only be functional, but durable
enough to drive at high speeds through a rough simulated road course, drive a combined distance of
hundreds of miles without needing servicing, provide vehicle safety and crashworthiness equal to
production cars, while providing passenger comfort and amenities. We also had to design our car to be
marketable to today’s consumers.
Our electrical systems were monitored and controlled by custom software running on a National
Instruments cRIO microcontroller which handled nearly all vehicle functionality. I wrote software for
this device that monitors pedal position, commands torque from the drive motor, starts and stops the
genset, and monitors battery health and limiting driving when an error occurred. This software is tightly
integrated in order to ensure all major systems operate efficiently and safely. For example if the battery
management system senses a low state of charge it will automatically start the genset. Or, if the batteries
are overheating, the motor control software will limit motor power to a “limp home” mode in order to
protect the batteries, yet let the car get off the road or track and clear from any danger.
Most of our vehicle was custom build which meant I had to build two vehicle fuse/relay boxes, run
conduit through the car with over 100 distinct wires, design and build a custom instrument cluster, and
write custom control systems for the powertrain, batteries, charger and user interface controls. Designing
the electrical enclosures forced me to not only consider electrical needs, but component placement
requirements, or protection from road debris or engine heat. As the vehicle design matured and new
PIAXP requirements were given, these boxes and vehicle had to be re-located and redesigned a total of
three times between our first driving test and the second round of competition. Every iteration gave me
the opportunity to improve my designs by further implementing industry standard practices and
demonstrating production readiness.
Our vehicle has driven over two hundred miles as well as passed all PIAXP technical and safety
inspections. Video evidence of our vehicle performance and competition results can be found in the Data
and Results Section. We made it through the first round of competition passing all dynamic safety tests
and a placement within the top 10 in our class. We had some difficulty during the second round with our
batteries and had to withdraw from competition. For an unknown reason, possibly power supply
switching noise, or poor electrical connections, we had contactors internal to the battery packs open
sporadically. This resulted in significant damage to battery sensor boards and could be dangerous if the
vehicle was under significant load.
This report discusses the design and implementation of the major hardware and software components I
designed and built. It is meant to both describe the design process I went through when designing these
systems and as a service manual for the car which will hopefully continue to be improved.

Page 7
2 Design Specifications and System Requirements
PIAXP provided detailed requirements documents which unfortunately are confidential and cannot be
reproduced in this report. The last revision was over 70 pages long describing the safety, design, and
efficiency requirements for all aspects of the car, from charger isolation, to static stability factor, to tire
pressures. I will highlight some of the major requirements and those which gave us considerable
difficulty.
All high voltage electronics must be finger-proof, drop-proof, and have sufficient weatherproofing for its
location. This requirement forced us to do a full overhaul of all of our electrical enclosures where we
added sealed panel mount connectors and cable glands to every enclosure. We also had to run our high
voltage wiring underneath the car as no high voltage wiring or components were allowed to be within the
passenger compartment.
The high voltage system must be isolated from the vehicle chassis. It must also be equipped with a
ground fault detection system that would warn the driver if the resistance between the high voltage system
and vehicle chassis was less than 500Ω per volt. This system must be active both during driving and
charging. Nearly all of the commercially available GFD circuits had a limit to the leakage capacitance
(capacitance between the high voltage components and frame). Our GFD required less than 1µF. This
meant we could not use the EMI filter provided by the drive motor manufacturer UQM Technologies
(UQM).
Since we were using lithium iron phosphate batteries, we were required to have a battery management
system (BMS) that would monitor the health of the batteries to prevent damage or in the worst case
scenario, explosion. We had to monitor cell voltage, currents, temperatures, state of charge, and other
parameters and automatically shut down the vehicle or specific components if any of these parameters
went out of their safe range.
We were also required to have an intelligent and user friendly charging system that would automatically
shut off when the batteries were full or had any errors, as well as maintaining isolation between the high
voltage components and the chassis which must be tied to earth ground.
Page 8
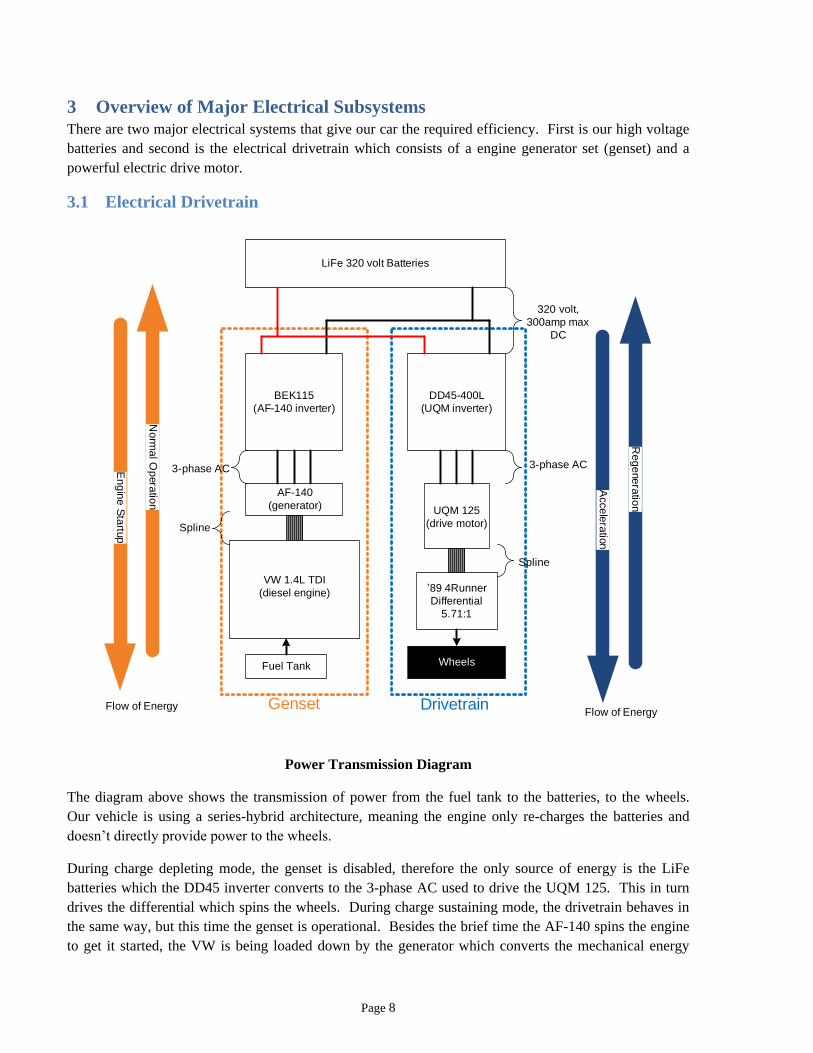
3 Overview of Major Electrical Subsystems
There are two major electrical systems that give our car the required efficiency. First is our high voltage
batteries and second is the electrical drivetrain which consists of a engine generator set (genset) and a
powerful electric drive motor.
3.1 Electrical Drivetrain
LiFe 320 volt Batteries
BEK115
(AF-140 inverter)
DD45-400L
(UQM inverter)
AF-140
UQM 125
VW 1.4L TDI ’89 4Runner
Differential
5.71:1
Fuel Tank
320 volt,
300amp max
DC
3-phase AC3-phase AC
Spline
Spline
Wheels
DrivetrainGenset
Acce
lera
tion
Re
ge
ne
ratio
n
Flow of Energy
En
gin
e S
tartu
p
No
rma
l Op
era
tion
Flow of Energy
AF-140
(generator) UQM 125
(drive motor)
VW 1.4L TDI
(diesel engine)
Power Transmission Diagram
The diagram above shows the transmission of power from the fuel tank to the batteries, to the wheels.
Our vehicle is using a series-hybrid architecture, meaning the engine only re-charges the batteries and
doesn’t directly provide power to the wheels.
During charge depleting mode, the genset is disabled, therefore the only source of energy is the LiFe
batteries which the DD45 inverter converts to the 3-phase AC used to drive the UQM 125. This in turn
drives the differential which spins the wheels. During charge sustaining mode, the drivetrain behaves in
the same way, but this time the genset is operational. Besides the brief time the AF-140 spins the engine
to get it started, the VW is being loaded down by the generator which converts the mechanical energy

Page 9
from the engine to electrical through the BEK115. The electrical energy is supplied to the drivetrain and
LiFe batter pack. The genset is always run at 1700rpm and 130Nm of torque regardless of driving
intensity as this is our diesel engine’s most efficient operating point. Currently, we plan to turn the genset
on when we reach 20% State of Charge (SOC) and turn it off at 85% SOC. As our vehicle nears
completion these numbers will likely change with testing, and we will implement different driving modes,
such as city, highway, etc which will optimize the duty cycle and SOC limits of the genset.
3.2 High Voltage Batteries and Provided BMS
Our Batteries were provided by Chang’s Ascending Enterprise CO., LTD and include various monitoring
boards that allow us to monitor the State of Charge, State of Health, and various parameters needed to
ensure the vehicle operates safely and efficiently. In order to use the data provided by the batteries I had
to understand the architecture and data communicated by each board. This was even more necessary as
we had many communication and other errors which we suspected wree spurious. Therefore I had to dig
into the functionality of the provided monitoring in order to better understand the source of these errors.
The Batteries are broken up into three different categories: controller’s internal to each pack, a “master”
controller, and BMS software on our NI cRIO which handles controls for all major systems including
batteries, traction motor, genset, and user interface controls.
3.2.1 Internal Pack Sensors / Control
Within each battery pack we have three different boards: one “slave” control board, one SOC board, and
two over-charge, over-discharge boards. In addition there are cell balancing controls that operate
independently of the BMS system. The diagram below shows a simplified schematic of the boards’
power and data lines. Note that dashed lines are opto-isolated communication busses.
Slave
SOC
Over/Under
charge
Over/Under
charge
Cell’s
9-16
Cell’s
1-8
RS
23
2
Aux +13v
RS
48
5
to “Master”
shunt
Diagram of Internal BMS sensor/control boards

Page 10
3.2.2 SOC Board
The SOC board is powered by the ~50 volt array of LiFe cells. It communicates three significant data:
State of Charge (0-100% in 0.1%)
Overall Pack Voltage ( in 0.1volts)
Instantaneous current (in 0.1amps)
This data is sent through an opto-isolated RS232 communication channel and is sent to the Slave board.
The data is refreshed on roughly 2 second intervals and does not need to be requested by the slave (data is
sent regardless of whether slave is working correctly, or powered on). SOC is calculated using an
integrator across the shunt resistor, which is also used for reporting current. Note that power to the SOC
board is disconnected when the internal Kilovac Contactor is open. This is used to verify that the
contactor is open, and reduce parasitic loads on the batteries.
3.2.3 Overcharge / Over-discharge Board
These boards monitor the voltage across each cell. Each board can read up to eight cells. If any of the
cells being monitored by the board is over 4 volts, or under 3 volts the corresponding signal is sent. The
interface between the Over/Under charge boards and the slave are two opto-isolated digital signals. They
operate as follows:
Overcharge (True = closed, False = open)
Over-discharge (True = closed, False = open)
The slave board does not know which of the eight cells are over or under voltage. These boards are
constantly powered by the LiFe cells and does not need a data request to update the slave. The outputs
are updated near-instantaneously.
3.2.4 Slave Board
The slave board is the brain of each battery pack. It receives all data from all sensors and is the only
board that communicates outside the battery pack. It is powered by our auxiliary 13 volt battery, and is
grounded in common with the vehicle chassis. In addition to receiving the signals from the SOC and
over/under charge boards, the Slave also gets temperature data from two digital thermistors placed on the
anode or cathode of selected cells. This board also operates the two battery pack fans as well as the
internal Kilovac contactor.
The slave board communicates to the master on an RS485 communication bus. The following
information is sent by each slave:
Pack Voltage (in 0.01 volts)
State of charge( in 0.01%)
Current (in 0.1A)
Temperature 1, Temperature 2 (in 0.01°C)
Overcharge / Over discharge (only 1 bit each, True / False)
Fan Status (on = True, off = False)
Contactor Status (closed = True, open = False)
SOC communication functional? (working = True, error = False)

Page 11
3.2.5 Master Controller
The master controller initiates all communication with the slave boards. It communicates via the RS485
bus. It periodically poles the slave boards refreshing the information. The master stores the last value of
all slave data. Therefore if a slave board loses power, the last valid data sent would be stored and that
would be the assumed state of that pack (although the master would detect a communication error). The
master board compiles the data from the slaves and sends it to the cRIO when requested. For details on
the messages sent see the appendix on Battery CAN messages.
A summary of the data sent to the cRIO is given below:
Total Voltage (0.1volt accuracy ex: 321.1v)
Maximum Current (0.1A accuracy ex: 45.4 amps)
Max, Min, Average Temperature (0.1°C accuracy ex: 20.4°C)
Fan status (on/off for each of the six packs)
Relay status (open/closed for each of the six packs)
Max, Min SOC (1% accuracy), Average SOC (0.1% accuracy)
Error conditions (over/under charge, communication error, etc. see CAN appendix)
Battery status (On/Off/Charging)
Additionally new messages were added that provide the following information:
Pack Voltage for each of the 6 battery packs (in 0.01V)
Pack Currents for each of the 6 battery packs (in 0.1A)
Pack Temperature (2 per pack) for each of the 6 battery packs (in 0.01 deg C)
Pack SOC in 0.01% for each of the 6 battery packs
These additional messages are used to diagnose battery problems while in operation. They were added
because we had significant difficulty with the electronics within the battery packs and had wanted to be
able to isolate which packs were sending erroneous data without having to remove the packs from the
vehicle and test them individually. You will notice that the original messages mostly reported, maximum,
minimum and average of the appropriate values. We experienced that at times none of these values
would be reliable as some boards would be stuck near the maximum, some at zero and giving an average
that would be heavily affected by the number of boards stuck at these extremes which was unknown. By
isolating the different packs we are able to find what data is reliable and what is not.
3.3 High Voltage Battery Charger
We use a 7kW external charger capable of fully charging our batteries within 3 hours. It is powered by a
240 volt, split phase 30 amp wall outlet and can provide DC power up to 392 volts and limited 18 amps.
The charger communicates with the car via CAN and we set the maximum current and voltage limits.
The charger reports applied voltage and current as well as errors such as over temperature, voltage etc.
Because of the CAN interface, our charger is controlled by the cRIO which also monitors the battery
health. We adopted a fairly simple charging strategy where we would charge at full power as long as all
packs remain below 100% and there are no over voltage errors. Once any of these conditions are met the
charger is shut down until the error is cleared. This may shut down the charger prematurely as not all
packs will be fully charged or properly balanced, but it does protect the cells from being over charged.
Once it reaches this state, if further charging is desired it can be performed using alternative software run
from a laptop (not built into the car).

Page 12
A high level circuit diagram of the charger and battery interface is shown below.
ChargerSee HV
Schematic
Start
ChargingAC +
AC -
Earth ground
CAN to cRIO
240 VAC
Plug frame
Amphenol
20-22
High Level Schematic of Charger Circuit
Per PIAXP requirements, earth ground must be passed through the same connector as the DC-power and
immediately grounded to the frame. In order to ensure vehicle cannot drive away with the charger
plugged in, there is a circuit of two zener diodes which is held at 8.6 volts when none of the two charger
plugs are inserted, if one plug is in, the voltage is dropped to 4.3 volts, and when both plugs are in, the
voltage is dropped to 0 volts. The cRIO reads this voltage and disables drive if one or more plugs are
inserted and enables the charger when both plugs are inserted. This way we cannot accidentally drive
away when the charger is plugged in, risking damage to the high voltage system. A full schematic of the
charger, vehicle interface is shown directly below with a logic diagram of what systems are enabled and
disabled under the charger switch and plug insertion status.
Charger Interface and Control Schematic
CAN GND ?
A
B
C
D
F
D
B
E
A
C
F
D
B
E
A
C
D
E
G
F
D
E
G
F
B
A
B
A
J
T
F
G
N
U B
A
C
120
+
A
B
C
D
J3
J2
F
G
BOXC
C C
C
H
J
H
J
J1
J2
120
CAN HI
CAN LO
GND
LED
SW
PLUGS
GR3
2
1
4
3
2
1
4
4.3 V1N4731A
4.3 V1N4731A
+12
2.2K
8.2K
2.2u9.1 V
1N4739
A-20-8
+12
2.2K
1K
2.2u5.1 V
1N5231
D-7-6
+12
+12
D-?-?
1K1/2 W
8.2K
8.2K
5.1V1N5231
FAN
FAN
J
T
N
U
CHARGERJUNCTION BOX
CHARGER
CABLE
17CHARGER
INTERFACE
2N7000
GR-BK
R-W
Y-BK
0-GR
TERMINAL STRIP
ON FRONT PLATE
2
7
CAN LO
CAN HI
COM
DB-9S
3
2
1
2
1
6
7
8
BK-BU
Y
GR
BK-BU
Y-BK
R-W
GR-BK
5
4
3
2
1
BK-BU
Y-BK
GR-BK
GR-BK
Y-BK
BK-BU
P-BK
W
W
R-W
0
GR-BK
+12+12
6/18/10
J3
SOFTSTART

Page 13
Charger
Plug 1
connected
disconnected
Charger
Plug 2
connected
disconnected
Driver
Switch
Drive
OF
F
Charge
Enable Drive
(all must be
True)
Enable Charge
(all must be
True)
UQM – enabled
Rear DC/DC – enabled
Genset – enabled
SoftStart +Relay – enabled
SoftStart – Relay – enabled
Battery State – VehicleON
XNOR
UQM – disabled
Rear DC/DC – enabled
Genset – disabled
SoftStart + Relay – enabled
SoftStart – Relay – disabled
UQM – disabled
Rear DC/DC – disabled
Genset – disabled
SoftStart +Relay – disabled
SoftStart – Relay – disabled
Note: XNOR output
Supersedes Others
Vehicle Operations Enabled Under Charger Status
3.4 High Voltage Schematic and Significant Components
25
oh
m 2
.5kJ
50 volt LiFe Battery
50 volt LiFe Battery
50 volt LiFe Battery
50 volt LiFe Battery
50 volt LiFe Battery
50 volt LiFe Battery
35
0A
fu
se
MIS
DC/DC2
DC/DC3
UQM
Inverter
AF-140
Inverter
+13.8 Vcc
Key Switch
+13.8 Vcc
Ca
r B
atte
ry
To Charger
EDS 1
EDS 2
Inertial
GFI
DC
/DC
1
RearFront

Page 14
Symbol Description / Parts List:
Manufacturer Part Number Symbol Description
Anderson Power
Products
SB350
Manual disconnect Switch
Kilovac EV250
Contactors used for Soft high voltage,
high power connections, including EDS
Anderson Power
Products
SB175 Connector used between Battery Packs
Amphenol 20-22
HV Charger Connector
Continued Parts List
Manufacturer Part Number Label Description
UQM DD45-400L UQM Inverter 125kW
EVO electric BEK 115 AF-140 Inverter 115amp, 3-phase inverter
Lambda TDK PAF600F280-12 DC/DC1,2,3 300volts to 12volt converter, 600watt
max
Bender IR155-2 GFI Ground fault detector, analog output
Bussmann FWH-350A 350A fuse High power fuse
Motor Inverters
Both inverters have significant capacitance between the +/- high voltage power lines. The UQM inverter
has 8,000uF while the exact AF-140 capacitance is unknown, it is between 5,000-10,000uF. There are
very minimal bleed resistors on the AF-140 and UQM inverters between 7-10kΩ.
High Voltage Contactors / EDS
The two contactors shaded in purple are the contactors used to meet the EDS specification. Both of these
are very close to the corresponding battery terminals, the negative contactor is within the battery
enclosure itself. Note that when the EDS button is hit, not only do the shaded contactors open but all high
voltage contactors including the contactors internal to the six battery packs. This adds added safety to
system as this changes the battery from one 300 volt packs, to six 50 volts batteries, at the voltage
boundary from high voltage to low voltage systems.
Notes on schematic
Note that the schematic ignores low voltage control boards. For example the contactors in the orange
shaded box are not all connected when low voltage is applied, instead the cRIO closes the negative and
soft start relay first, verifies the inverter capacitors are up to voltage, and then closes the main positive
contactor. Similar is true for the contactors in the battery enclosures. But the only power source to these
contactors passes through the EDS buttons and “key” switch, therefore if one of these switches is open,
regardless of the state of the control boards, the contactors must open.
We can also see that there are no high voltage components, or breaks in the high voltage wiring in the
middle, or passenger compartment of the car.

Page 15
4 Vehicle Software
Our vehicle is controlled by a National Instruments compact Reconfigurable Input/Output device (cRIO).
This microcontroller allows us to add various IO modules including a CAN module, 16-bit 32 channel
analog to digital converter, a 32 channel digital input / output module, and a 16-bit -10 to 10 volt analog
output module. These modules are controlled by the LabVIEW software written on the cRIO. This
software is very versatile and has allowed us to implement complex controls and difficult protocols very
quickly.
Although all software is contained on the cRIO I have selected to discuss the software that controls the
powertrain and user interface.
4.1 Drive Control Strategy
The diagram above shows the top level LabVIEW code that reads the brake, accelerator pedal positions,
and forward-neutral-reverse switch position as well as giving an option to limit generator current for any
future reason, such as additional temperatures monitored, or more advanced control strategies. The blue
[300] wired twice in to the “torque limiter” block sets the regenerative break current limit and
acceleration torque limit at 300 amps.
The “FNR” block converts the analog input from the FNR switch to a enum (special type of integer)
signifying the desired direction of travel. The “Read Bits:0-7” block gives the value of the first byte of
the cRIO digital inputs. The specific input selected corresponds to the switch enabling the UQM
regeneration. The remaining blocks are highlighted below.

Page 16
4.1.1 Pedal to torque conversion
LabVIEW Code for Pedal to Torque Conversion
The block above is responsible for reading the analog inputs from the brake and accelerator pedal and
converting them to a torque request. The voltage output characteristics of the pedal are shown below:
Accelerator Pedal Voltage Outputs
This pedal provides a high level of safety which is used to prevent erroneous propulsion. As the diagram
shows, there are two analog outputs which maintain a voltage ratio of 2 throughout the pedal range. They
also never reach either voltage extreme (staying within 7.5% and 91.8% of the supply voltage). Therefore
if either of the two voltages goes out of range, the UQM acceleration torque is zeroed. Also if the ratio
between the two voltages differs greatly from 2.0 the acceleration torque is also zeroed. This protects
against cables being disconnected as well as erroneous or noisy signals causing undesirable behavior.
There is a single string potentiometer for the brake pedal which requires inversion (when the pedal
voltage is 5 volts, the desired regenerative torque is zero). Therefore I simply subtract the pedal voltage

Page 17
from 5 to get a function linear with the desired torque. Note that the safety controls are not present for
braking as it is much safer to have the system over-break than over accelerate. Also because we had to
use an existing brake pedal that tied in with the brake master cylinder the potentiometer does not have
definite voltage bounds. During testing we experienced some undesired behavior from the UQM when
braking at very low speeds. This is likely a result of the rotor position sensor resolution. As the car
slowed near stopping the UQM would “jerk” applying braking torque then releasing, then re-applying
torque. In order to have deceleration to a stop smoother I added a function that reads the motor torque
and disables regen if the vehicle is moving slowly and the pedal is depressed far enough for the
mechanical brakes to be activated. This successfully eliminated the jerking behavior.
4.1.2 Current torque limiting
Torque Limiting LabVIEW Code
This software reduces the available drive torque in order to enforce the current limit for both acceleration
and breaking. It uses the formula:
2W Hz Nm
More appropriately for our needs:
609.55
2
V A V ANm
rpm rpm
In order to ensure we have a nonzero and defined current limit I set a minimum voltage of 100 and a
minimum speed of 200rpm.
4.2 Genset Startup / Automated Control Strategy
The chart below shows the torque limits on the EVO controller. The non-zero forward torque region is
for starting the engine, once it reaches above 500rpm no forward torque can be applied. Around the idle
region no forward or regen torque can be applied allowing the engine to idle without a load. The regen
torque will increase from 0-100% load from 1700-2100rpm respectively. It remains at its max torque
above 2000rpm.
As a safety feature, once the engine reaches 3700rpm, the engine is disabled by the cRIO by opening the
relay providing +12 to the engine harness. Simultaneously the EVO motor torque is zeroed to allow the
engine to coast down at a normal speed.

Page 18
1000500
1600
2000 2500F
orw
ard
To
rqu
e (
%)
Re
ge
n T
orq
ue
(%
)
100%
100%
Forward
Regen
Idle
Engine
Idle
(est)
Torque Limits for Generator
(note: the rpms have changed slightly from the diagram above, but the principle remains the same)
The complex software below controls the startup and regeneration of the generator. This code only runs
when the genset switch is enabled and the state of charge is low or the genset is forced on via the switch
panel in Section 4.5. The first code executed is a ten second delay. This is to allow sufficient time of the
dashboard “Engine Started” led to flash, notifying the driver before the engine is violently started (See
Section 4.42). Next the generator torque is increased by 4 Nm every 50 milliseconds up to a maximum of
160 Nm. During the loop can be exited before the full torque is reached if the engine rpm is above 750
rpm or the genset is disabled by the driver. The genset will apply forward torque for a maximum of 12.5
seconds to protect against a stalled engine (it may damage the inverter if high torque is applied to a stalled
rotor for a long period of time).
If the engine does start, the second loop monitors engine speed and applies torque following the formula:
0.375 1700Tq rpm
With torque held between 0 and 150Nm. Therefore if the engine speed is less than 1700 rpm the formula
results in a positive torque that is held to 0 Nm. Once the speed becomes greater than 1700 rpm the
torque becomes negative and is applied up to 2100 rpm when it is maintained at its maximum torque.
Genset Control Software
Page 19
This loop will exit under one of three conditions. First, if the engine rpm exceeds 3700 rpm. Second, if
the battery state of charge exceeds 90%, and third if the genset is disabled by the driver. Under all
conditions the generator torque is zeroed and the power to the relay powering the engine harness is
opened. This ensures the engine is able to coast down at normal speed.
We experienced intermittent behavior with the genset and did not have time to thoroughly test the system
under many situations. Therefore, care was taken to make sure that the genset could always be disabled
by the driver via the switch panel in case of engine runaway, excessive heating of electronics, or other
malfunctions.
4.3 High Level Battery Management System
The cRIO is responsible for making all battery control decisions all previously described systems are only
used for data collection, not processing (with the exception of automatic fan on if temperature >17°C).
This setup is ideal as the cRIO has control over the battery as well as the various high voltage loads. The
cRIO controls the traction motor (UQM 125) and charger through CAN and controls the generator (EVO
Electric AF-140) through analog signaling.
4.3.1 cRIO thermal management of ESS
Note that the chemistry of the batteries being used is such that there is no explosive, or thermal runaway
danger, but high temperatures will cause irreversible damage to the batteries and reduce their capacity and
lifetime. Temperature will stop rising if all loads are disconnected. Each battery contains two digital
thermistors that are placed on the anode and cathode of selected cells. These temperatures are read and
updated every 2-3 seconds.
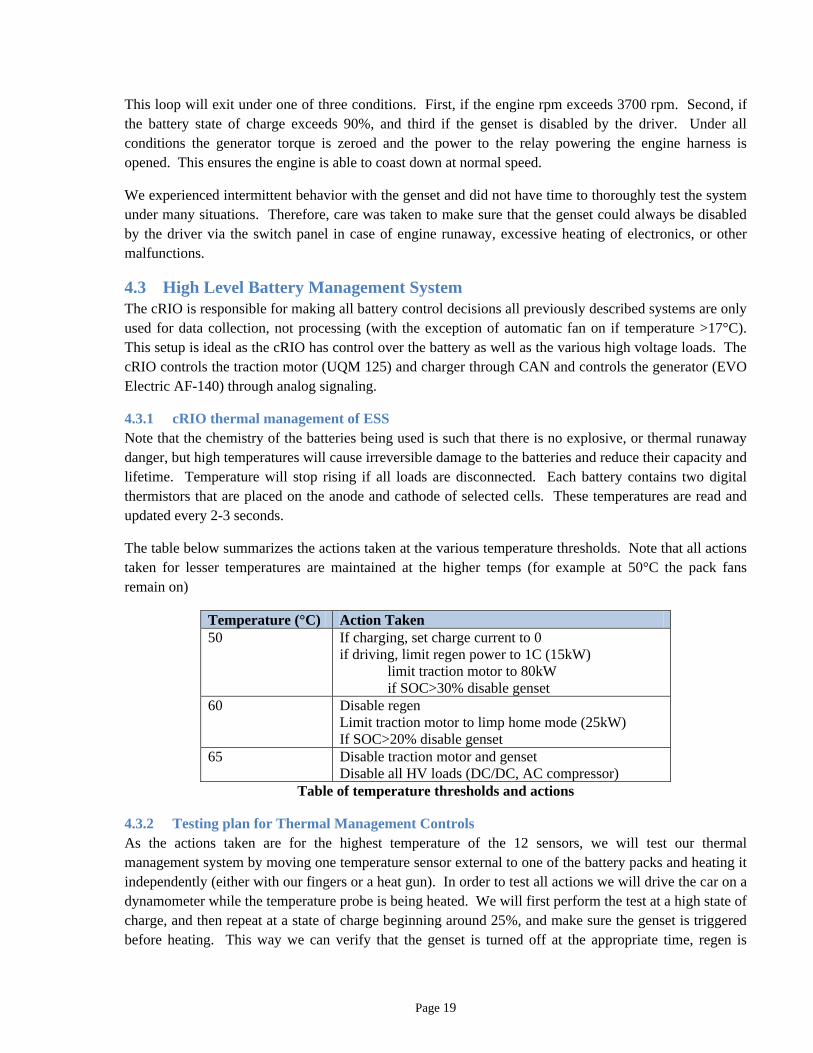
The table below summarizes the actions taken at the various temperature thresholds. Note that all actions
taken for lesser temperatures are maintained at the higher temps (for example at 50°C the pack fans
remain on)
Temperature (°C) Action Taken
50 If charging, set charge current to 0
if driving, limit regen power to 1C (15kW)
limit traction motor to 80kW
if SOC>30% disable genset
60 Disable regen
Limit traction motor to limp home mode (25kW)
If SOC>20% disable genset
65 Disable traction motor and genset
Disable all HV loads (DC/DC, AC compressor)
Table of temperature thresholds and actions
4.3.2 Testing plan for Thermal Management Controls
As the actions taken are for the highest temperature of the 12 sensors, we will test our thermal
management system by moving one temperature sensor external to one of the battery packs and heating it
independently (either with our fingers or a heat gun). In order to test all actions we will drive the car on a
dynamometer while the temperature probe is being heated. We will first perform the test at a high state of
charge, and then repeat at a state of charge beginning around 25%, and make sure the genset is triggered
before heating. This way we can verify that the genset is turned off at the appropriate time, regen is

Page 20
limited (we check by braking hard and reading the instantaneous regen power), and driving power is
limited. Of course we will also be watching and listening for the user visual and audio indicators.
4.3.3 Over / Under Voltage Control
The overall pack voltage is continually monitored, especially when the SOC is near the extremes. As
with most lithium battery cells, ours have a very flat voltage during most of the SOC range. A qualitative
graph of cell voltage vs SOC is shown below:
SOC100% 0%
Vo
lta
ge
Cell Voltage curve
Qualitative Lithium Ion
Therefore within the normal operating SOC range we should see very little voltage change. Before we
will allow the vehicle to be turned on (High Voltage contactors close) the SOC must be greater than 10%
and the voltage must be between 340 and 260 volts.
4.4 User Interface
All vehicle information is given to the driver through a NI TPC-2512 touchscreen computer. This screen
is mounted behind and above the steering wheel in roughly the standard position for an vehicles
instrument cluster. I designed and coded multiple screens two of which are for normal driving and four
for debugging or offering more detailed information but in a format too distracting for the driver to
understand while the vehicle is under way. The screens were designed to be selected before the vehicle is
underway and then not changed during the entirety of the event. Therefore the information displayed on
each tab was selected so the driver would not have to take his hands off the wheel to change screens in
order to get necessary information. The last four screens, with detailed information, were meant to be
used by the pit crew in the event a problem arises and quick debugging is needed.
Please note that the data displayed in the following screenshots are not necessarily valid data but are
given to show the layout and functionality of the different displays.

Page 21
4.4.1 Battery Summary Display
Each Tab has important battery information displayed at the top. We have had considerable difficulty
with monitoring battery health and performance throughout testing and competition. With the
implementation of the new battery messages, we are able to monitor each pack’s status. This bar gives
the two most important parameters for judging remaining capacity, SOC and Pack Voltage as well as the
list of battery errors. Instead of displaying all six SOC’s and Voltages I give the maximum, average and
minimum so that the driver can see if the packs are extremely unbalanced and drive accordingly.
4.4.2 Dashboard Tab: Generic or emissions sensitive driving
The “Dashboard” tab is designed to be used while the vehicle is under-way. It displays the speed in very
large font in order to allow the drive to read the speed with a quick glance. We decided to change from
an analog speedometer to digital after the first round of competition. We noticed that the LabVIEW dial’s
needle is very thin and harder to read. This difficulty is compounded by glare when the sun is shining
through the windshield. The driver and I found that the black on light grey text combined with a very

Page 22
large size is sufficiently easy to read even with glare. We also determined that giving a more accurate
speed to within a tenth of a mile per hour is too distracting as the decimal changes to quickly to be useful
and only acts to distract the driver.
I decided to leave the drivetrain power meter as a needle display as the driver only needs a ball-park idea
of the motor and gensets’ power (unlike speed which we must maintain very accurately during
competition). The driver can also ignore this information without risking damage to the vehicle or violate
any axp rules. Above the instantaneous power display, I give the average and instantaneous electric miles
per gallon for the current trip. For further information on how this data is generated see the section
Telemetry Data Parser.
Above the speed I give the expected trip distance and odometer which are useful for the driver to
understand how far he has driven as well as being required by FMVSS. The drivers’ selected direction of
travel is also displayed prominently in the middle of the screen.
Lastly I have a large LED labeled “Engine Started” near the bottom center. This led blinks for ten
seconds before the engine starting procedure is initiated. This blinking is meant to get the driver’s
attention and warn him of the significant noise that is about to begin. The engine pushed to the very rear
of the engine compartment and is quite noisy when operational especially compared to the electric
operation of the car. This could be very distracting if it is started while the driver is concentrating on a
difficult curve or focused on maintaining a specific speed. The led is on solid when the engine is started
and generating.
4.4.3 Speed Tab: Durability and Non-Emissions Sensitive Tests

Page 23
The “Speed” tab is designed to give the driver the minimal required information needed to drive the car
safely and ensure none of the power train elements are damaged. This screen is used in competition for
the endurance course where vehicle efficiency is not measured and the driver must maintain a high rate of
speed as well as navigate a complex road course. This screen is also used for dynamic safety tests such as
emergency lane change, 0-60mph and 60-0 tests. The need for this screen was identified after our first
round of emergency lane change tests where we ran into the glare and readability problems causing the
driver to enter the maneuver at a higher than necessary speed. This speed, like on the Dashboard, is
rounded to the nearest mph while taking up nearly 30% of the screen area. The battery summary display
remains on the top so the driver can check battery health during an appropriate time.
4.4.4 Charging Tab: Used only with Plug-in Charger
The “Charging” tab is used only used when the high voltage charger is being plugged in and started. This
tab has three large dials giving the charge current and voltage reported by the charger as well as the Hall
Effect current (HE Current). The Hall Effect current is reported for its significance as the batteries reach
near full SOC. There will be some high voltage load while charging mainly from the rear DC/DC
converter which could be as high as 1 amp. As the power being used to charge the batteries is decreased,
this load will play a more significant portion of the charger current. Therefore it is important to see the
current that is actually being delivered into the batteries.
There are various LEDs throughout the tab. Chg Error lights up if the charger itself reports an error
(either over current, voltage, temperature or CAN timeout). The Charging led is lit when high voltage is

Page 24
on, and the charger is plugged in, configured properly, and enabled. The four horizontal leds near the
middle of the tab give the status of the charger setup procedure. If the charger switch in the rear of the car
is on then “Chg Switch” led is lit. if both plugs are properly inserted then the “Plugs OK” led is lit. Once
communication between the charger and cRIO is established the “Comm. OK” led is lit and finally when
the driver turns on the high voltage and the pack relays are all properly closed, the “HV on” led is lit
meaning the vehicle is ready to begin charging.
The two lower leds “SOC limited” and “Over V limited” indicate whether charger power is being
throttled by the battery SOC or voltage limits this is currently not implemented in software but the display
is setup to accept the information)
The only touch screen to cRIO control is the “Quick Charge” button which forces the charger to charge at
full power (18 amps) regardless of SOC or error state. This was implemented in case we have erroneous
communication from the batteries that pre-maturely disable the charger.
4.4.5 Batt. Detail Tab: Shows Complete BMS data
The “Batt. Dtail” tab is used for debugging potential battery problems without requiring vehicle
shutdown. It displays nearly all information given by the new battery CAN messages, with the exception
of giving the maximum temperature per pack instead of each temperature sensor per pack (2).
Voltage, current, SOC, and max temperature are displayed for each pack using horizontal progress bars as
well as numeric displays much like the battery summary display bars at the top of the screen. The scroll

Page 25
bars are used to allow the reader to quickly identify a pack or data point that is inconsistent with the other
packs and may be an incorrect value, or the sign of some larger problem. The numeric displays for these
parameters are given in case the reader wants to take detailed data logs or perform calculations based on
the values.
The table of leds at the middle right of the screen give each of the 7 possible errors for each pack. These
values are ORed across each pack to generate the red leds on the battery summary display. The leds
below this table with labels “F#” and “R#” represent whether the fan (F) for pack # is on, and if the relay
(R” is closed for pack #).
Finally numeric displays for other relevant information is provided at the bottom of the screen such as the
sum of all the pack voltages (V_Sum), the charger voltage and current (Chger V), (Chger C), and the Hall
Effect current and estimated kWHr used.
4.4.6 Gen. Detail Tab: Detailed Genset Information
The “Gen. Detail” tab is used to give the limited information available for the genset. We get actual
engine speed which is given by the EVO generator and applied engine torque which the cRIO is
requesting from the generator. These values are given as needle displays in order to visually determine
the stability the feedback control algorithm. The Hall Effect current is also displayed which gives the net
current delivered to the battery. This is important to monitor when debugging the genset, especially when

Page 26
the vehicle is under way as the batteries could still be sourcing power if the uqm power is greater than
genset power.
Lastly, there are two leds which light if a genset error is displayed. The “Eng Cutout” signifies that the
engine rpm exceeded our rev limit causing the genset to be shut down. “Eng Timeout” signifies that the
EVO tried to start the engine but it did not turn over within the allotted time.
4.4.7 UQM Detail: detailed UQM information
The “UQM detail” has four temperature meters giving the four reported UQM temperatures, two from the
inverter, and two from the motor. The vehicle speed, UQM voltage and instantaneous UQM power
(along with EVO power) are given as dial indicators to be consistent with the displays on the Dashboard.

Page 27
4.5 Dashboard Switch Panel
Dash Switch Panel
The figure above shows the dashboard switch panel used to control the hybrid drivetrain. The leftmost
switch selects the direction of travel. The “LV” switch is used as the key turning on power to the cRIO,
BMS, touchscreen and other vehicle controls. The “HV” turns on the high voltage batteries by closing
the relays within the packs and cycling through the soft-start control. While the high voltage is in the
process of opening or closing the led will flash. This tells the driver when it is safe to either turn off the
car or begin driving. The “Reg” switch enables and disables the regenerative braking. This was a PIAXP
requirement in order to test the braking distance under mechanical brakes only.
The remaining two switches control the operation of the genset. The switch, when in the “Auto” position
allows the genset to automatically start when the state of charge drops below 35%, when in the “On”
position the genset will start immediately regardless of the SOC. The rightmost switch labeled “Enab”
enables the genset when up and disables / forces it off when disabled. This switch supersedes the
functionality selected by the “Auto/On” switch.
4.6 User Interface Data Sender
The cRIO performs the data conversion needed to generate, speed, odometer, UQM and EVO power
averaging and Electrical MPGe calculations. This is done on the cRIO instead of the touchscreen as the
data update speeds are much faster on this device and timing is much more accurate, as we do not have
transmission delay / packet errors to deal with.
Telemetry Conditioning and Sender LabVIEW Code

Page 28
Originally we directly send vehicle speed and power but found that the data is too noisy to be useful or
readable. Therefore the motor speed and power are averaged over six or five cycles respectively. This
gives more stable results while still maintaining a fast update speed as the code runs every 25ms meaning
the six data points for speed are refreshed every 150ms. Since our vehicle has direct drive, meaning the
gear ratio between the UQM driveshaft and wheels remain the same, vehicle speed can be determined by
simply dividing the driveshaft speed by the gear ratio and scaling to get mph. This speed is then
integrated (via sampling) to get the distance travelled.
To calculate our electrical MPGe we use the formula given in the PIAXP requirements document:
_ _ 116,09034.024
3.412
gallon of gasoline
WHrWHr mi
BTU mi miMPGe
BTU WHr kWHr
To get instantaneous MPGe we use vehicle speed (in miles per hour) and UQM power (in kW):
134.024inst
UQM
miMPGe
Hr kW
The average MPGe uses the original formula using our odometer reading to give us the miles travelled
and the integral of UQM power to give us our kWHr of energy consumed. Note that both of these values
are not exactly accurate as they do not take into account power consumed by the DC/DC converters, or
inefficiencies within the battery pack and generators. But these values are only used for the driver to
reference roughly as he drives around the track and are not intended to use for data collection purposes.
The driver merely needs to know if he is driving too aggressively and is well below target, or if he is
driving conservatively enough where we are likely meeting our MPGe requirements.
5 Selected Low Voltage Electrical Hardware
On top of the standard equipment and functionality available on cars today such as a radio, power
windows, lighting, and the instrument cluster mentioned above we also had to have a complex network of
various sensors and controls such as a ground fault detection system. These required numerous circuits to
be scattered throughout the car to interface with the microcontroller.
5.1 cRIO IO interface boards
As mentioned throughout this report, the cRIO is an integral part of vehicle control system. Appendix
8.9.5 shows a list of the analog and digital input and outputs used to interface the vehicle with the cRIO.
Nearly each one of these required an IO interface board to both condition the signals being sent, and
protect the cRIO from erroneous or dangerous behavior on one of the connecting wires. There are over
21 of these IO modules which are described in detail in Appendix sections 8.4 through 8.7.
Many of these circuits interface with sensors such as hall effect current instruments, analog pedals, and
the GFD. These sensors require accurate and speedy measurements of analog signals which are used to
ensure vehicle safety and driver control. Since the car contains high power switching power supplies, we
had to design our circuitry to be as noise immune as possible. One of the design tools we used to aid our
noise immunity was having the reference ground and power to these sensors be supplied by these

Page 29
interface boards. This meant that the sensors were floating relative to the frame and other electronics
around them. With the sensor and ground wires bundled together any noise would be common mode and
affect the reference ground and signal wire equally. Therefore the voltage difference between the two
would remain accurate even if the sensor wires had induced noise up to many volts. Of course we also
used R-C low pass filters to reduce any differential high frequency noise present on the wires.
We also designed these interface boards to protect the expensive cRIO modules from human error, such
as plugging in connectors incorrectly, and device failure. The analog and digital inputs on the cRIO are
high impedance devices and have their own built in voltage protection which will try to clamp the voltage
on one of the input pins to +/- 10 volts. Of course these modules can only absorb less than 100mA and
would be overwhelmed if someone inadvertently plugged the +12 volts from the battery directly into one
of these ports. Therefore all IO’s have a series resistor on the order of ~5kΩ. This limits the current
required to clamp the voltage to 10s of mA.
5.2 Ground Fault Detector Support Circuitry
Our Vehicle includes a ground fault detection (GFD) system provided by Bender which is capable of
detecting leakage resistances as high as 10MΩ. Having a GFD is not only a PIAXP requirement but also
a standard safety feature on most high voltage, high power electric vehicles. Our specific system is set to
warn the driver if the leakage resistance drops below 1KΩ/Volt or ~320KΩ for our vehicle. This is
double the PIAXP requirement. The output of the GFD is an opto-isolated PWM signal. In order to
simplify the software required to measure this PWM circuit we simply convert it to an analog signal
where a 0% duty cycle would be 0 volts and a 100% duty cycle would be 5 volts. This can be directly
read by the cRIO’s analog inputs and converted to a duty cycle by simply dividing the voltage by 5.
We use two rail to rail op-amps to convert the pulse to an analog signal. The first (labeled U2-B) is used
to give very sharp edges to the output pulse. This is then low pass filtered with a resistor and capacitor
which is then fed into a voltage follower (labeled U2-A) giving a powerful driver for the analog signal.
Finally this is again low pass filtered by the 8.2K resistor next to the GFI (on circuit 12) and the
capacitor on the cRIO side (circuit 13).
Schematic of GFD Support Circuitry
The GFD error can be seen in the Battery Summary Display (4.4.1) as the rightmost red warning LED.
1
+5
+5 = U2-8
GND = U2-4
COI
2
38.2 K
LP2950
2.2u
8.2K
2.2u
3
2
1
3
2
1
+127
8
3
5
4
6
E
GND
GND +5
U1
U2-AU2-B
2
1 3
+5
4.7K4.7K GND
+12
V
4.7K2.2u
6
57
2.2u
+12
A-8-7
12 13GFD SENSORBENDER END
GFD SENSORcRIO END
U2 = MCP6292
2
1
C
1
2
1
2
IR155-2
B+
B
BENDER

Page 30
6 Data and Results
Our vehicle drove hundreds of miles starting in mid November of 2009. These multiple tests demonstrate
the functionality of the vehicle and the success of my software and hardware designs and implementation.
During most of our driving tests we recorded data such as battery voltage, current, and various
temperatures and torques. We also documented our driving and lab tests on YouTube. These videos
were required as proof of a functional vehicle for the PIAXP competition.
6.1 Data Log
Since our first driving test we have logged data every ¼ second. This has resulted in hundreds of
thousands of lines of data. We had a modeling team dedicated to analyzing this data for accuracy,
consistency, and to suggest areas of improvement. They established during our most lengthy test that we
were able to achieve between 110 and 115 MPGe under electric drive. Of course the genset is a less
efficient source of electricity than the wall charger so this milage would be reduced under extended
driving but demonstrates that we are very near the required efficiencies.
An excerpt of this data log is shown in appendix 8.1.5. It is time stamped by time of day in ¼ of seconds
(for example 12:00 noon is 172800). The battery voltage in this excerpt is low, in fact during this except
we only had 1 battery reporting voltage. We can see that the UQM voltage is a more appropriate overall
voltage. The “BattErr” encodes the battery errors discussed in Section 3.2. Every two digits represent the
errors from a specific battery back. We can see that all packs had some error.
This data gives some verification to the vehicle performance and behavior. We can see the UQM current
is negative when the torque is negative and the voltage drop grows as current increases. Also the UQM
temperature rises as power is demanded.
6.2 Driving Videos
During all of our driving tests ,up to the first round of competition, I rode in the front passenger seat and
monitored vehicle parameters to ensure the vehicle remained safe and quickly diagnose any software or
hardware problems. The videos below are in chronological order and show the progression both of our
vehicle completeness and
Initial Driving Tests
Link: http://www.youtube.com/watch?v=EAc8JdjI3C4
This video was taken on our second day of testing in mid November. We drove with an electric only
drivetrain meaning the engine and EVO electric generator were not installed in the car. You can see most
of the internals as these tests took place before our body panels were made.
Vehicle 0-60 Test
Link: http://www.youtube.com/watch?v=a7yqwNK-3v4
This very brief video shows the power of our UQM drive motor by squealing the tires during one of our
acceleration runs.

Page 31
Vehicle 60-0 mph braking test
Link: http://www.youtube.com/watch?v=enwTPrC-b44&feature=related
This brief video shoes our car testing our braking distance. As you can hear and see the combination of
regen and mechanical brakes allows us to decelerate very rapidly meeting the minimum braking distance.
Although both in this video and our test during competition we locked up the tires, so having anti-lock
brakes would improve our braking distance and vehicle control.
Battery Thermal Management auto Shutdown video
Link: http://www.youtube.com/cornell100mpg#p/a/797335AC564DCDB1/1/daW6CtOcTSM
This video was taken as part of the PIAXP second technical deliverable. We had to demonstrate our
vehicle properly shut down under a battery thermal event. We heated one of the battery temperature
sensors with a small heat gun in order to slowly increase the sensors temperature. The vehicle limits
battery power by lowering the maximum allowable current going through the UQM (see section 4.1.2)
The current limit while the temperature rises is sudden (drops from 300 amps down to 0). As the
temperature sensor cools you can see the multiple steps described in section 4.3.1.
Genset Startup and Battery Charging
Link: http://www.youtube.com/watch?v=x4-nnMT2IrY
This video was taken during winter break before the Spring 2010 semester. It shows our first successful
operation of the geneset. You can hear the motor begin to turn the engine over and then roar to start. The
camera then shows the cRIO reading the engine speed through the EVO sensor. The green LED next to
the speed sensor labeled “Cutout” shows that the cRIO properly detected the engine has started and limits
forward torque to 0Nm so the generator does not over-rev the engine.
When I move the “EVO Fwd Tq” slider to negative values the generator begins resisting the engine and
passing current through the batteries. This is demonstrated both by the current meter reading and the
battery SOC rising.
Drive-by Road Test
Link: http://www.youtube.com/watch?v=GdQzZabLxp4
This video shows our car driving up game farm road at a high rate of speed after we passed NYS
inspection and became road legal.
Dynamic Avoidance Test with spinout
Link: http://www.youtube.com/watch?v=CDALpcKcMdM&feature=related
This dramatic video was taken during our first round of competition. It shoes our car going through the
dynamic avoidance test. The vehicle entered the maneuver at a higher than required speed and ended up
spinning out. What happens after the camera drops is the vehicle skidded sideways and began “hopping”.

Page 32
In the opinion of one of the safety judges, our car came very close to flipping over and said that hopping
just precedes vehicle rollover. This test resulted in the “Speed” tab for the touch screen described in
section 4.4.3 allowing the driver to clearly see the vehicle speed and increase his speed very slowly not
risking a repeat of this near catastrophe.
7 Vehicle Analysis and Conclusions
We encountered a few problems with our electronic system where I had to analyze possible sources of
errors and rule them out. We had concerns about noise transmitted through the high voltage cables from
the switching power inverters from the UQM as well as the switching supplies in the DC/DC converter. I
also discuss an analysis of the problem that caused us to withdraw from the competition.
7.1 Potential Switching Noise Interference on Battery Control Boards
Skin Effect is the tendency of an AC current to distribute itself near the surface of a conductor. This
results in an increased resistance as frequency increases, as the skin depth (depth of conductor used)
decreases. This increased resistance results in higher AC frequencies having a smaller and smaller effect
on battery voltage. In the case of the UQM’s switching frequency, this is 0.06% of the resistance of the
wire under a DC load.
Diagram of worst-case scenario:
The diagram shows a single cell with the negative terminal at a fixed ground. It is being excited by a
voltage source with a DC and AC component. (Note the cell voltage is reduced to 0 for simplicity)
Vdc
Vac
+ |
+ |
SO
C v
olta
ge
se
nso
r b
oa
rd
Ce
ll
<2
mΩ
SO
C c
urr
en
t
se
nso
r b
oa
rd
Sh
un
t
Re
sis
tor
Wire R
Switching Noise from UQM inverter
At the switching frequency of the UQM (16kHz). The wire resistance is ~6ohms. This resistance is
3,000 times the internal cell resistance. Therefore if the UQM was outputting a 300 volt AC swing the
cell voltage would raise and lower by 0.1volts

Page 33
A graph of the wire resistance frequency is:
Formulas of wire resistance for frequency
L L
R RD D
_Skin Depthf
frequencyf
conductor diameterD
1-way wire lengthL
Resistivity and Permeability of Copper: 81.72 10 m
7 14 10 HmCu
Skin Depth Calculation for inverters with 00awg wire 8
7 1
1.72 10 m_
16kHz 4 10 HmSkin Depth
8
2
1.72 10 m 3
1.113 10
mR
m
6.37R
Skin Depth Calculation for DC/DC converter with 6awg wire 8
7 1
1.72 10 m_
200kHz 4 10 HmSkin Depth
8
3
1.72 10 m 0.1m
4.1148 10 mR
6.10R
0 2000 4000 6000 8000 10000 12000 14000 16000 180000
1
2
3
4
5
6
7
8
frequency (Hz)
Resis
tance (
Ohm
s)
skin effect resistance for 00awg 3.5m

Page 34
AC
12 volts
16
mΩ O
utp
ut
Vo
ltag
e
6.10Ω
12 Volts
Skin Effect Resistance Circuit diagram for Low voltage AC side
At the switching frequency of the DC/DC converter (200kHz). The wire resistance is also ~6ohms. This
resistance is 750 times the internal resistance of the lead acid battery (specified at 8mΩ). I am doubling
this resistance just for a safety factor. The output ripple of the DC/DC converter is specified as 120mV
although even if the output ripple was 12 volts the Output Voltage node would only oscillate by 31mV,
meaning if the DC/DC converter was operating at its specified ripple, the experienced AC component
would only be 310µV.
We can see from the analysis of the motor inverters’ switching noise that any 200kHz noise will be
completely swamped by the skin effect resistance of the 00 wire it must pass through which is roughly 1
meter in length for the DC/DC converter closest to the battery.
7.2 Potential explanation for SOC Board Damage During Knockout Stage
In the document below I give a possible reasoning for why the SOC boards were damaged a few seconds
after a pack relay opened.
Loaded
DC/DC (front)
Inverter
Capacitors
Load V+
Load V-
Batt V+
Batt V-
Simplified Schematic of HV System
0 0.5 1 1.5 2 2.5
x 105
0
1
2
3
4
5
6
7
8
frequency (Hz)
Resis
tance (
Ohm
s)
skin effect resistance for 6awg 10cm
Page 35
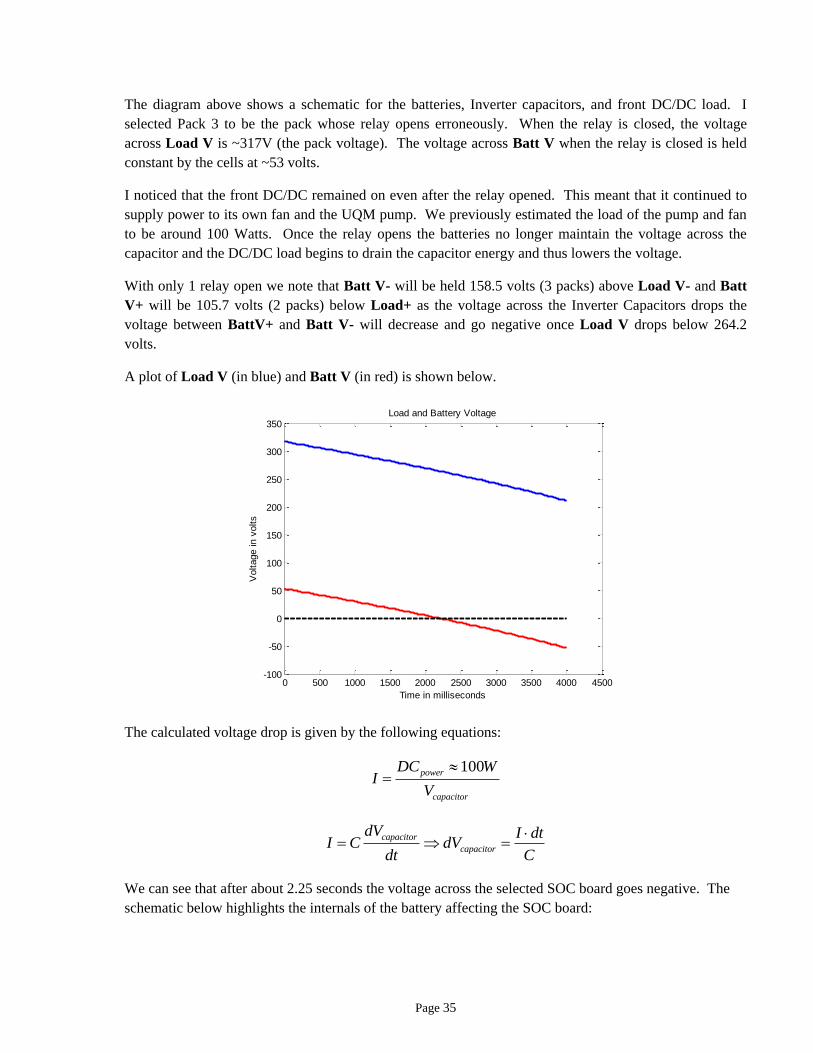
The diagram above shows a schematic for the batteries, Inverter capacitors, and front DC/DC load. I
selected Pack 3 to be the pack whose relay opens erroneously. When the relay is closed, the voltage
across Load V is ~317V (the pack voltage). The voltage across Batt V when the relay is closed is held
constant by the cells at ~53 volts.
I noticed that the front DC/DC remained on even after the relay opened. This meant that it continued to
supply power to its own fan and the UQM pump. We previously estimated the load of the pump and fan
to be around 100 Watts. Once the relay opens the batteries no longer maintain the voltage across the
capacitor and the DC/DC load begins to drain the capacitor energy and thus lowers the voltage.
With only 1 relay open we note that Batt V- will be held 158.5 volts (3 packs) above Load V- and Batt
V+ will be 105.7 volts (2 packs) below Load+ as the voltage across the Inverter Capacitors drops the
voltage between BattV+ and Batt V- will decrease and go negative once Load V drops below 264.2
volts.
A plot of Load V (in blue) and Batt V (in red) is shown below.
The calculated voltage drop is given by the following equations:
100power
capacitor
DC WI
V
capacitor
capacitor
dV I dtI C dV
dt C
We can see that after about 2.25 seconds the voltage across the selected SOC board goes negative. The
schematic below highlights the internals of the battery affecting the SOC board:
0 500 1000 1500 2000 2500 3000 3500 4000 4500-100
-50
0
50
100
150
200
250
300
350
Time in milliseconds
Voltage in v
olts
Load and Battery Voltage

Page 36
PT
C
Sh
un
t
Batt V-
Relay
SOC power +
SOC power -
SOC sense +
SOC sense -
Batt V+
Batt -
Battery Sensor Schematic
As shown in the graph the Batt V- potential is actually higher than BattV+ this means that the zener diode
is forward biased (acts as a short). Current will pass through the PTC causing it to raise its resistance
while the voltage across SOC power will be small (on the order of a couple of volts) due to the forward
bias of the diode. Therefore the voltage between SOC sense- and SOC power- will grow as voltage
drops and will be roughly equal to Batt V- - Batt V+. As the graph shows, this voltage grows to near 50
volts within 3.5 seconds and a reverse polarity to what the sensor boards are designed for.
It is likely that this voltage potential would cause damage to the circuitry within the integrator and could
cause the damage we experienced. It also has a similar time delay to what we experienced, where the
loud pop occurred a couple seconds after the relay opened.
During normal operation the soft-start relays opened first disconnecting the capacitors from the batteries
protecting against this behavior.
This of course does not answer the question of why the relay opened and I think we will have to test the
DC/DC as well as well as the signal quality on the RS485 data line to and possibly more to discover why
the problem occurred.
7.3 Conclusion
Overall our vehicle was a large success. Within one year we were able to bring the project from a few
scattered components and a rolling chassis to a fully functional series hybrid vehicle. We met all
competition and FMVSS requirements and had a road legal car that drove around campus with ease. It
could accelerate faster than a Toyota Camry, and drive over 40 silent miles on battery power alone. We
were rushed throughout the entire process and had very limited time for testing and optimization. In the
end our withdrawal may have been avoidable with a few months to fully test all subsystems both
independently and working in unison. This hopefully will be a task the team will tackle, and be able to
gather significant data that our series hybrid vehicle can easily achieve 100 miles to gallon equivalency
while offering a driving experience similar to marketable, production vehicles we are accustomed to.
Page 37
8 Appendices
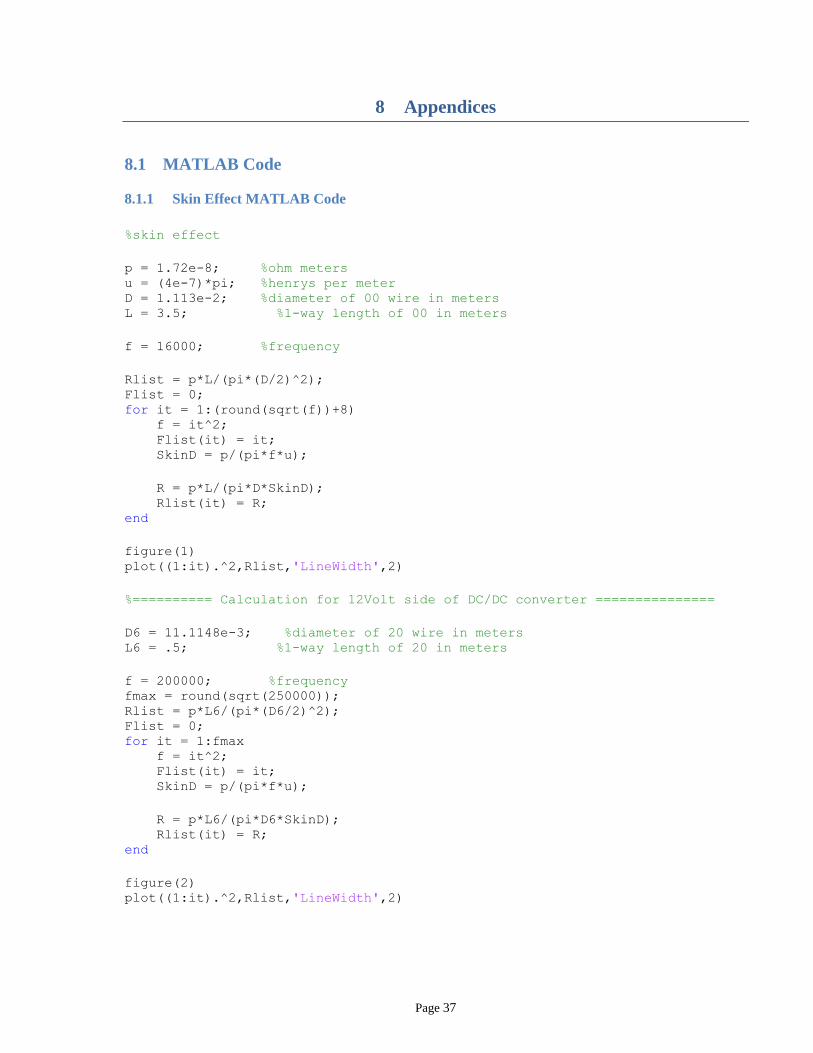
8.1 MATLAB Code
8.1.1 Skin Effect MATLAB Code
%skin effect
p = 1.72e-8; %ohm meters u = (4e-7)*pi; %henrys per meter D = 1.113e-2; %diameter of 00 wire in meters L = 3.5; %1-way length of 00 in meters
f = 16000; %frequency
Rlist = p*L/(pi*(D/2)^2); Flist = 0; for it = 1:(round(sqrt(f))+8) f = it^2; Flist(it) = it; SkinD = p/(pi*f*u);
R = p*L/(pi*D*SkinD); Rlist(it) = R; end
figure(1) plot((1:it).^2,Rlist,'LineWidth',2)
%========== Calculation for 12Volt side of DC/DC converter ===============
D6 = 11.1148e-3; %diameter of 20 wire in meters L6 = .5; %1-way length of 20 in meters
f = 200000; %frequency fmax = round(sqrt(250000)); Rlist = p*L6/(pi*(D6/2)^2); Flist = 0; for it = 1:fmax f = it^2; Flist(it) = it; SkinD = p/(pi*f*u);
R = p*L6/(pi*D6*SkinD); Rlist(it) = R; end
figure(2) plot((1:it).^2,Rlist,'LineWidth',2)

Page 38
8.1.2 SOC damage capacitor discharge MATLAB code
F = 2*7290e-6; %farads CapV(1)=317;
LVcurr=1.5+7; LVpwr=LVcurr*12;
for t=1:4000 I(t)=LVpwr/CapV(t); dv=I(t)/F*.001; CapV(t+1)=CapV(t)-dv; end figure(2) plot(CapV,'-b','LineWidth',2) hold on plot(CapV-317*5/6,'-r','LineWidth',2) hold on line([0,4000],[0,0],'Color','k','LineStyle','--','LineWidth',2) xlabel('Time in milliseconds') ylabel('Voltage in volts') title('Load and Battery Voltage')
8.2 Touch Screen LabVIEW code

Page 39

Page 40
8.3 Touch Screen Network Variables
Variable Name: Batt ErrTempRelFan Arr
Data Type: U8 (unsigned 8-bit integer)
Number of Elements: 14
Index 0-5 6-11 12 13
Data Pack 1-6 errors Pack 1-6 temps Pack Fans on Pack Relays Closed
Variable Name: Batt V-A-SOC Arr
Data Type: Single (32-bit floating point)
Number of Elements: 18
Index 0-5 6-11 12-17
Data Pack 1-6 Voltage Pack 1-6 Current Pack 1-6 SOC
Variable Name: Telemetry
Data Type: I16 (signed 16-bit integer)
Number of Elements: 7
Index 0 1 2 3 4 5 6
Data Odometer Speed UQM kW EVO kW Avg MPGe Inst MPGe Direction
Variable Name: PowerTrain
Data Type: I16 (signed 16-bit integer)
Number of Elements: 13
Index 0 1 2 3 4
Data Engine RPM Engine Torque Genset Status UQM Voltage Charger Voltage
Index 5 6 7 8 9-12
Data Charge Current Charge Temp Charge Plugs Charge Status UQM Temps
Variable Name: Hall Effect Array
Data Type: Single (32-bit floating point)
Number of Elements: 3
Index 0 1 2
Data Hall Effect Current GFI Voltage Hall Effect kWhr
Table of Touchscreen Network Variables

Page 41
8.4 Selected LabVIEW Code on cRIO
8.4.1 Charger Message Parser
8.4.2 New Battery Message Parser

Page 42
8.4.3 High Voltage On Sequencer
8.4.4 FPGA CAN Array Makers
8.4.5 FPGA Digital IO Array Maker

Page 43
8.4.6 FPGA CAN Message Sender
8.4.7 FPGA Analog Input Array Maker

Page 44
8.5 cRIO IO Modules Layout and Schematic
+1
2
GN
DS
IG
+5
SIG
2 13 2 134
8.2
K
0.2
2u
22
K
2.2u
2.2u
2950
2 13
SH
IEL
DL
OH
I
CAN
PEDAL (3)BATTERY CONNECTOR
CO
NF
SO
FT
HA
RD
GN
D
+1
2
SO
FT
HA
RD
CO
NF
1.8K
8.2K
1N5230
POWER IN
+1
2
2 13
+1
2 S
EN
SE
+1
2
20 GA
GN
D
20 GA
DC/DC ENABLE (X3)
12
K
OP
OK
2 13
EN
AB
GN
D5.6 K
OP
OK
EN
AB
1.8
K
+1
2
EVO CONTROL
2 13
ST
AT
US
IN
1 K
TO
RQ
OU
T
SP
EE
D I
N
TO
RQ
OU
T
SP
EE
D I
N
4.7 K
ST
AT
US
IN
1 K
2.2 u1 K
RELAY DRIVER
R1
2 13
R2
D2
D1
PULL-DOWN
10 K
1N5254
2N7000
1N5254
1.8K
10 K
2N7000
10 K
10 K3
.3K
3.3K
1 2 4
5 6 7
8
SE
NS
E
2N7000
82
0
1.5
K
2 134
GN
DG
S S
WR
EG
SW
FN
R S
W
1.5
K
1.5
K
1.5
K
1.5
K
1N5231
+1
2
1.5
K
1N5254
2 134
HV
LE
DS
+1
2+
12
HV
SW
1N52312N7000
HV
LE
DS
HV
SW
GS
EN
AB
FN
R S
W
RE
G S
W
GS
SW
GS
EN
AB
8.2K
8.2K 8.2
K
8.2
K
9 10
SWITCH PANEL A SWITCH PANEL B
7 2 3

Page 45
FWD/REV
+12
GN
D
2 13
FW
DR
EV
RE
V
FW
D
3.3K
3.3K
1N5231
1N5231
GFD SENSOR
E
2 13
C+12
A
2.2u
2.2u
2950
4.7
K
10 K
10 K
4.7
K
4.7
K
2 13
GN
D
EVO/UQM INVERTER POWER
GN
D
MCP 6292
2 134
SPEEDOMETER
GN
D
+1
2
CL
K
1.8K
+1
2 R
CLK
+12 W
ODOMETER DRIVER
2 13
GN
D
PU
LS
E
2N7000
10 K
10 K
PU
LS
E
GN
D
+1
2G
ND
GN
DG
ND
cRIO END
2 13
GN
D
GFD SENSOR
BENDER END
+12
AA
+1
2
2.2u
3 4 5 6 8 7BENDER >
DS
2
2 13
D2
D1
2N7000
LED DRIVER
10
K
D3
820
82
0
10
K
820
10
K
DS
1
DS
3
3
12 13
1415
+1
2/2
4 O
UT
16
+1
2/2
4
2 13
.22
u
4.7
KG
ND
HALL AMMETER
SE
NS
E+
24
+2
4
SE
NS
E
11
2 134
2N
70
00
LE
D
LE
D
SW
ITC
H
SW
ITC
H
+1
2
GN
D
PL
UG
S
2.2
u
10
K
10
K
1K
2.2
K
1K
1N
52
31
CHARGER INTERFACE
17
10
K2
.2K
1N
47
39
2N7000
PL
UG
S

Page 46
Selected cRIO IO Board Schematics
3
2
1
4
1
2
3
GND
+5 +12C
O I1
2
3
2.2u 2.2u
22K
8.2K
0.22u
1 PEDALS (X3)
LP2950
2 BATTERY CONNECTOR BOX
GND
+12
1.8K
1.8K
1N5230
D-30-26
D-31-25
D-4-3
8.2K4.7 V
1
2
3
4 CAN
COM
LO
HI
1
2
3
5 POWER IN
GND
+12
+12 SENSE A-7-6
+12
3.3K
3.3K
1
2
3
7 DC/DC CONVERTER CONTROL (X3)
GND
OP OK
5.6K
12K+12
1.8K
D-21-17 (1)D-22-18 (2)D-23-19 (3)
D-13-10 (1)D-14-11 (2)D-15-12 (3)
A-2-1 (ACCEL 1)A-3-2 (ACCEL 2)A-4-3 (BRAKE)
9 SWITCH PANEL A
3
2
1
4HV LEDS
GS ENAB
+12 +12
HV SWITCH
D-25-21 (GR-BK)
D-8-7 (Y-BK)
D-32-26 (O-GR)
10 SWITCH PANEL B
3
2
1
4
+12
GND
GS SWITCH
REGEN SWITCH
FNR SWITCH
A-12-17 (O-GR)
D-6-5 (Y-BK)
A-13-18 (GR-BK
1N52315.1 V
1.5KALL
ALL
PEDAL V
SOFT START
HARD CONNECT
CONF HARD CONN
ENABLE
2N7000
8.2K
8.2K
820
2N7000
8.2K
8.2K
1/2 W
1.5K
4.7 V
27 V
1N5254
1N5230
1
2
3
6 PULL-DOWN RELAY DRIVER
K1
K2
2N7000
2N7000
8.2K
8.2K
8.2K
8.2K
D-23-19
SPARE
1N5254
27 V
1
2
3
8 EVO CONTROL
TORQUE
STATUS OK
SPEED
1K
2.2u
4.7K
1K
1KA-11-16
A-1-0
D-17-14
27 V
1N5254
1
2
3
13 GFD SENSOR
GND
+12+12
SENSE V
2.2u
A-8-7
C-7
C-2
C-3
1
2
3
16 EV0/UQM INVERTER POWER
GND GND
+12/24+12/24

Page 47
8.6 Dashboard Switch Panel Schematic (w/ cRIO IO Modules)
The Main Switch Panel schematic is on the left. For completeness the associated cRIO Interface Module
schematics are shown on the right
+12
R
GR
+12
GY-BU
O-GR
BK-BU
A
0-GR
R-W
Y-BK
GY-BUB
A
B
A
1.5K
820R
GR
+12
820
GR
+12
1.5K
BL+12
LV
LV
B
B
A
A
B
A
B
GSE9 SWITCH PANEL A
3
2
1
4HV LEDS
GS ENAB
+12 +12 (R-W)
HV SWITCH
D-25-21 (GR-BK)
D-8-7 (Y-BK)
D-32-26 (O-GR)8.2K
8.2K
2N7000
8.2K
8.2K
1.5K
4.7 V
27 V
1N5254
1N5230
+12
GR820C
+12
GR
820A
B
Y-BK
3
2
1
4
2N7000820
1/2 W
10 SWITCH PANEL B
3
2
1
4
+12
GND
GS SWITCH
REGEN SWITCH
FNR SWITCH
A-12-17 (O-GR)
D-6-5 (Y-BK)
A-13-18 (GR-BK
1N52315.1 V
1.5KALL
ALL
3
2
1
4
S6ENAB
S3HV
S5AUTO
ON
S4REG
S1FNR
S2LV

Page 48
8.7 cRIO and IO Board Mounting and Numbering
The cRIO control unit is the central control for the entire car. It uses a National Instruments cRIO control
box, which has many analog inputs, many digital inputs and outputs, and a CAN interface. Also
contained in this cRIO control unit is a +12 VDC to +24 VDC up-converter to provide power to units
requiring +24 power. In order to connect the cRIO inputs and outputs to signals, that are incompatible for
direct connection to the cRIO, a multitude of independent I/O interface modules are incorporated. These
are independent small circuit boards with a connector that are mounted in a slotted panel. This panel can
accommodate up to 28 I/O interface modules.
1 2 3 4 5 6 7 8 9 10 11 12 13 14
15 16 2827262517 18 19 20 21 22 23 24
NATI O NAL I NSTRUM ENTS cRI O - 9074
cRI O I / O M O DULES AREA
12 TO 24 VDC CO NVERTO R
cRI O I / O M O DULE SLO T NUM BERS
M ASTER CO NTRO L UNI T LAYO UT
NI 9
205
ANAL
OG
MO
DULE
NI 9
403
DIG
ITAL
MO
DULE
NI 9
853
CAN
MO
DULE

Page 49
8.8 I/O MODULE CONNECTOR LOCATIONS AND PIN ASSIGNMENTS
n indicates module design number
[D-n-b] indicates connection to cRIO digital I/O module, terminal n, logical bit b.
[A-n-b] indicates connection to cRIO analog Input module, terminal n, logical bit b.
1 Master Power Input 5
1 Gnd in
2 +12 measured in (1/2) [A-7-6]
3 +12 power in
2 Accelerator Pedal 1 1
1 +5 out
2 Gnd out
3 Signal in [A-2-1]
3 Accelerator Pedal 2 1
1 +5 out
2 Gnd out
3 Signal in [A-3-2]
4 Brake Pedal 1
1 +5 out
2 Gnd out
3 Signal in [A-4-3]
5 Battery Connect box 2
1 Soft Start out [D-30-24]
2 Digital ground
3 Hard Connect out [D-31-25]
4 Confirmed in [D-4-3] not used
6 Forward/Reverse switch 3 not used
1 Gnd
2 Forward in [D-11-8]
3 Reverse in [D-12-9]
7 CAN UQM D-sub 4
1 Com [3] H 3
2 Lo [2] S 2
3 Hi [7] T 7
8 Switch Panel A 9
1 GenSet enable out [D-25-21]
2 +12 out
3 High voltage switch in [D-8-7]
4 High voltage LEDs out [D-32-26]
9 DC/DC converter enable 1 7
1 Enable out [D-20-16]
2 Gnd
3 Operating OK in [D-13-10]
10 DC/DC converter enable 2 7
1 Enable out [D-21-17]
2 Gnd
3 Operating OK in [D-14-11]
11 DC/DC converter enable 3 7
1 Enable out [D-22-18]
2 Gnd
3 Operating OK in [D-15-12]
12 2 Relay pull down 6
1 Fan out [D-23-19]
2 NC
3 Spare [D-?-?]
13 EVO Generator control 8
1 Speed in [A-11-16]
2 Status in [D-17-14]
3 Torque out [A-1-0]
14 EVO inverter power 16
1 +24 out (no fuse)
2 NC
3 Gnd
18 Switch Panel B 10
1 Gnd
2 GenSet switch position in [A-12-17]
3 Regen switch position in [D-6-5]
4 FWD/N/REV switch position in [A-13-18]
21 UQM inverter power 16
1 +12 out (no fuse) to Amphenol pin N
2 NC
3 Gnd out to Amphenol pin K
22 Speedometer 15 not used
1 Gnd
2 Clk out [D-26-22]
3 +12 W
4 +12 R
23 Odometer 14 not used
1 Gnd
2 NC
3 Clk out [D-27-23]
24 GFD Sensor 12
1 +12
2 Gnd
3 Sense V in [A-8-7]
27 Hall Effect Ammeter 11
1 Gnd
2 Sense in [A-6-5]
3 +24
26 Charger Interface 17
1 Plug(s) inserted in [A-20-8]
2 Switch in [D-7-6]
3 Gnd
4 LED out [D-?-?]

Page 50
8.9 Soft Start Connector Control Board Schematic
K1
6/18/10
A1 A2
25
A1A2
BKRBKR
K3
R4
SOFTSTART
HARDCONNECT
Q1 Q2
4.7 K
R1 U1
4
1
2
3
4
3
2
14.7 K
R2
U2
BENDER
4
3
2
1
P3
Y-BK
BK-BR
BU-BR
GR-BK
3
41
2
U3
4.7K
GR
-Y
R-B
K
BK
-GR
BK
-BR
CONF
SOFT
HARD
COM
R3
F1
30A
CHG
CHG+
CONTROL BOARD
RELAYS AND CHARGE RESISTOR
DC/DC+
A2
BKR
A1
K2
AUX DC/DC-
F26.3A
2
1
B
B
L
L
P1
5
6
R-W
BK-BU
+13
GND
2
1P2

Page 51
8.10 Car Wiring List
8.10.1 Car Wiring Harness Conduit Paths
cRIOSwitches
Front
Elec.
Rear Electronics
1
2
3
4
5
6
7
# Conduit Path Number
Conduit Junction
Above is a diagram of the designated conduit paths used to route wires throughout the car. This
diagram should be used with the wiring list to fix any damaged wire.

Page 52
8.10.2 Diagram of Low Voltage Relay Enclosures
Relay
1
Relay
2
Relay
3
Relay
4
Fuse
1
Fuse
2
Fuse
3
Fuse
4
Fuse
5
Fuse
6
Fuse
7
pin1
pin9
Co
nn
ecto
r 2
pin1
This diagram shows the connectors / fuses / and relays in the low voltage relay enclosures. This
diagram should be combined with the following tables to replace fuses and diagnose potential
problems.

Page 53
8.10.3 Enclosure Pinouts and Wiring List
Front Relay Enclosure
Relay Fuse Connector
#
Connector
Pin
Wire
Ref# Description
- 1 1 8 99 UQM Pump
1 2 1 7 85 Rear defrost power
1 3 2 1 86 PTC power
2 4 1 16 82 Fan power
4 5 1 11 - Engine off power
4 6 2 2 87 Engine power
4 7 1 9 100 EVO pump power
1 - 1 14 83 Heater on control
2 - 1 5 82 Fan on control
4 - 1 1 84 Engine power on control
Rear Relay Enclosure
Relay Fuse Connector
#
Connector
Pin
Wire
Ref# Description
1 1 1 8 67 TS
1 1 1 7 65 cRIO
1 2 1 6 101 DL1
1 2 1 5 101 Daq
1 2 1 4 102 DC/DC fan
1 3 - - - Master board
1 3 1 1 103 Soft start
1 4 - - - Batteries power
3 5 2 2 1 Aux power
- 6 1 12 68/63 Switch power 24/7
- 6 1 11 69 Radio power24/7
- 6 1 10 104 Daq 24/7
4 7 1 9 105 Rev lights
- - 2 1 70 Brake booster
4 - 1 14 66 Reverse light on control
3 - 1 15 64 Auxiliary power on control
1 - 1 16 63 Generic LV power on control
Soft Start Enclosure
Connector Pin Wire Color Wire Ref# Description
1 orange 57 Soft start power on (ground and + resistor)
2 black 56 Digital ground
3 yellow 58 Main Contactor power on (+ contactor)
4 green 59 Confirm main contactor closed
5 Pink 103 +12
6 blue - ground

Page 54
8.10.4 Wiring List
ID# Wire/Device Name Paths Min
Gage Wire Color
Start Point End Point
ACC Box, Rear
1 12V Supply -- 8 Battery Fuse Bus
2 AC Relay Gnd 3,4 22 white Switches 2x AC Relays 85
3 Signal Flasher out 3,4 16 black Flasher Column Control black/red
4 Hazard Flahser out 3,4 16 green Flasher Switches
5 Brake Relay Gnd 3,4 22 white Brake Switch Brake Relay 85
6 A/C Compressor Power 2 10 red A/C Relay 87 A/C Compressor In
7 A/C Blowers Power 2 10 red A/C Relay 87 A/C Blowers In
8 Brake Relay Power L 2,1 20 yellow Brake Relay 87 Left Brake Light
9 Brake Relay Power R 2 20 red Brake Relay 87 Right Brake Light, Center Brake Light
10 Backup Cam Power 2,1 20 pink Fuse Panel Backup Camera Power in
11 ACC Box, Front
12 12V Supply 3,4 10 red DC/DC Fuse Bus
13 Horn Relay Gnd 4 22 white Switches Horn Relay 85
14 Horn Power 4,5,6 16 green Horn Relay Horn x2
15 Defroster Relay Gnd 4 22 white Switches Defroster Relay 85
16 Defroster Power 4 14 white Defroster Relay 87 Defroster Power in
17 Hi Beam Relay Gnd 4 22 white Column Ctrl Red/Blue Hi Beam Relay 85
18 High Beam Power 4,5,6 14 red Hi Beam Relay 87 L,R Headlight
19 Low Beam Relay Gnd 4 22 white Column Ctl Blue/Red Lo Beam Relay 85
20 Low Beam Power 4,5,6 14 white Lo Beam Relay 87 L,R Headlight
21 Parking Light Relay Gnd 4 22 white Column Control Blue Parking Relay 85
22 Parking Light Power, Front
4,5,6 18 light green
Parking Relay 87 Front L,R Headlight
23 Parking Light Power, Rear
4,3, 2,1
18 light green
Parking Relay 87 Rear Running Lights, License Plate
24 Radio Power 4 20 pink Radio Fuse Radio Red or Yellow?
25 Window Power 4 14 red/ Window Fuse Left Window Green/White, Right Window Green/Black

Page 55
white
26 Wiper Power 3,4 16 green Wiper Fuse Wiper Harness Green/Black, Column Control Green/Black
27 Wiper Column Control
28 Wiper Power -- 16 green Green/Black Wiper Fuse,
29 Wiper Hi 4,5, 6,7
16 green Blue/Yellow Wiper Harness Blue/Yellow
30 Wiper Lo 4,5, 6,7
16 green Blue Wiper Harness Blue
31 Wiper Ground -- Black Chassis
32 Wiper Harness
33 Wiper Gnd -- Black Chassis
34 Wiper Power 4,5, 6,7
Green/Black Wiper Fuse
35 Wiper Hi 4,5, 6,7
Blue/Yellow Column Control Blue Yellow
36 Wiper Lo 4,5, 6,7
Blue Column Control Blue
37 Lighting Column Control
38 Left Signal Power Front 4,5,6 18 light green
Green/Red Left Front Signal, Left Indicator
39 Left Signal Power Rear 1,2, 3,4
18 light green
Green/Red Left Rear Signal Red
40 Right Signal Front 4,5 18 light green
Green/Yellow Right Front Signal, Right Indicator
41 Right Signal Power Rear 2,3,4 18 light green
Green/Yellow Right Rear Signal Red
42 Signal Power Input 3,4 16 green Black/Red Signal Flasher
43 Column Ground -- 16 Black Chassis
44 Hi Beam Ground -- Red/Blue Hi Beam Relay 85
45 Lo Beam Gnd -- Blue/Red Lo Beam Relay 85
46 Parking Gnd -- Blue Parking Relay 85
47 Rear DC/DC
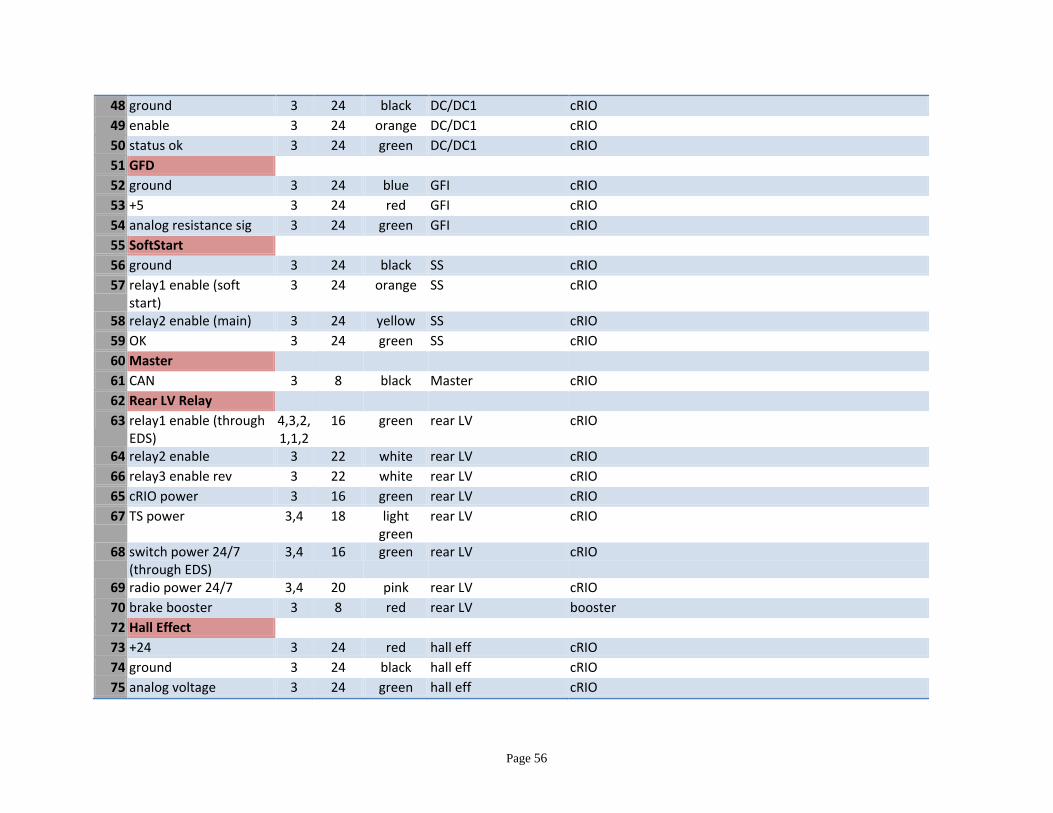
Page 56
48 ground 3 24 black DC/DC1 cRIO
49 enable 3 24 orange DC/DC1 cRIO
50 status ok 3 24 green DC/DC1 cRIO
51 GFD
52 ground 3 24 blue GFI cRIO
53 +5 3 24 red GFI cRIO
54 analog resistance sig 3 24 green GFI cRIO
55 SoftStart
56 ground 3 24 black SS cRIO
57 relay1 enable (soft start)
3 24 orange SS cRIO
58 relay2 enable (main) 3 24 yellow SS cRIO
59 OK 3 24 green SS cRIO
60 Master
61 CAN 3 8 black Master cRIO
62 Rear LV Relay
63 relay1 enable (through EDS)
4,3,2, 1,1,2
16 green rear LV cRIO
64 relay2 enable 3 22 white rear LV cRIO
66 relay3 enable rev 3 22 white rear LV cRIO
65 cRIO power 3 16 green rear LV cRIO
67 TS power 3,4 18 light green
rear LV cRIO
68 switch power 24/7 (through EDS)
3,4 16 green rear LV cRIO
69 radio power 24/7 3,4 20 pink rear LV cRIO
70 brake booster 3 8 red rear LV booster
72 Hall Effect
73 +24 3 24 red hall eff cRIO
74 ground 3 24 black hall eff cRIO
75 analog voltage 3 24 green hall eff cRIO

Page 57
76 Charger Interface Bx
77 wire1 3 24 red chg box cRIO
78 wire2 3 24 black chg box cRIO
79 wire3 3 24 green chg box cRIO
80 wire4 3 24 blue chg box cRIO
81 Front Relay Box
82 Relay ctrl (fan) 5 22 white front LV cRIO
83 Relay ctrl(PTC/ defrost) 5 22 white front LV switch panel
84 Relay ctrl(engine) 4,5 22 white front LV switch panel
85 rear defrost power 3,5 14 red front LV rear window
86 PTC power 4,5 14 white front LV front window
87 Engine power 5 14 white front LV eng harness
88 Front DC/DC
89 ground1 4,4 24 black DC/DC1 cRIO
90 enable1 4,4 24 orange DC/DC1 cRIO
91 status ok1 4,4 24 green DC/DC1 cRIO
92 ground2 4,4 24 black DC/DC1 cRIO
93 enable2 4,4 24 orange DC/DC1 cRIO
94 status ok2 4,4 24 green DC/DC1 cRIO
95 UQM
96 CAN cable 5,6 8 black cRIO UQM
97 power + 5,6 22 pink cRIO UQM
98 power - 5,6 22 blue cRIO UQM
Misc
99 UQM pump 5,6 16 front relay box uqm pump
100 EVO pump 5,6 16 front relay box evo pump
101 Daq power -- 20 rear relay box daq
102 DC/DC fan -- 22 white rear relay box DC/DC fan
103 Soft Start Power -- 20 rear relay box Soft Start box
104 daq 24/7 power -- 20
105 reverse light power 2,1 16 rear relay box reverse light
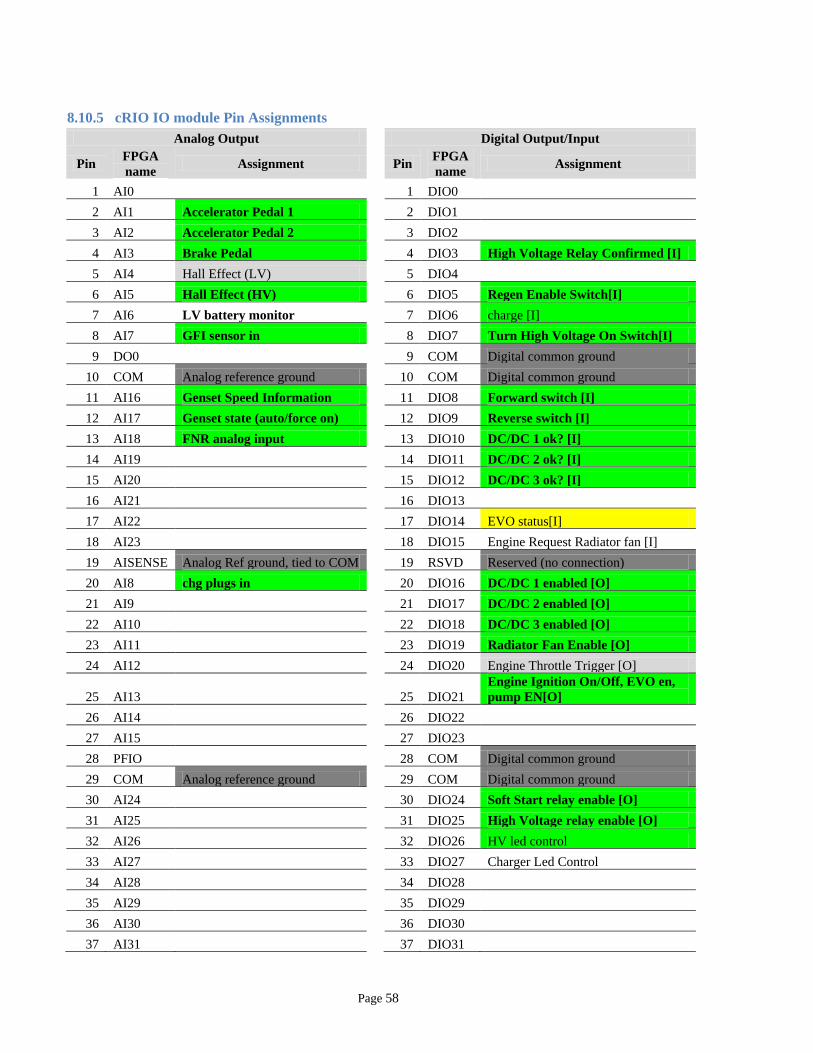
Page 58
8.10.5 cRIO IO module Pin Assignments
Analog Output
Digital Output/Input
Pin FPGA
name Assignment
Pin
FPGA
name Assignment
1 AI0
1 DIO0
2 AI1 Accelerator Pedal 1
2 DIO1
3 AI2 Accelerator Pedal 2
3 DIO2
4 AI3 Brake Pedal
4 DIO3 High Voltage Relay Confirmed [I]
5 AI4 Hall Effect (LV)
5 DIO4
6 AI5 Hall Effect (HV)
6 DIO5 Regen Enable Switch[I]
7 AI6 LV battery monitor
7 DIO6 charge [I]
8 AI7 GFI sensor in
8 DIO7 Turn High Voltage On Switch[I]
9 DO0
9 COM Digital common ground
10 COM Analog reference ground
10 COM Digital common ground
11 AI16 Genset Speed Information
11 DIO8 Forward switch [I]
12 AI17 Genset state (auto/force on)
12 DIO9 Reverse switch [I]
13 AI18 FNR analog input
13 DIO10 DC/DC 1 ok? [I]
14 AI19
14 DIO11 DC/DC 2 ok? [I]
15 AI20
15 DIO12 DC/DC 3 ok? [I]
16 AI21
16 DIO13
17 AI22
17 DIO14 EVO status[I]
18 AI23
18 DIO15 Engine Request Radiator fan [I]
19 AISENSE Analog Ref ground, tied to COM
19 RSVD Reserved (no connection)
20 AI8 chg plugs in
20 DIO16 DC/DC 1 enabled [O]
21 AI9
21 DIO17 DC/DC 2 enabled [O]
22 AI10
22 DIO18 DC/DC 3 enabled [O]
23 AI11
23 DIO19 Radiator Fan Enable [O]
24 AI12
24 DIO20 Engine Throttle Trigger [O]
25 AI13
25 DIO21
Engine Ignition On/Off, EVO en,
pump EN[O]
26 AI14
26 DIO22
27 AI15
27 DIO23
28 PFIO
28 COM Digital common ground
29 COM Analog reference ground
29 COM Digital common ground
30 AI24
30 DIO24 Soft Start relay enable [O]
31 AI25
31 DIO25 High Voltage relay enable [O]
32 AI26
32 DIO26 HV led control
33 AI27
33 DIO27 Charger Led Control
34 AI28
34 DIO28
35 AI29
35 DIO29
36 AI30
36 DIO30
37 AI31
37 DIO31

Page 59
8.11 Data Log Excerpt
(03-24-10) Time(s/4) BattV BattSOC BattTMax BattErr uqmSpeed uqmV uqmC uqmTq uqmTMax
289010 53.1 99 17.7 4448323232 1380.5 316.3 0 -0.7 39
289011 53.2 99 17.7 4448323232 1394 316.1 0 -1.1 39
289012 53.2 99 17.7 4448323232 1388 316.2 -0.4 -1.8 39
289013 53.2 99 17.7 4448323232 1377 316.3 -0.1 -1.1 39
289014 53.2 99 17.7 4448323232 1420 316.2 -0.2 -1.6 39
289015 53.2 99 17.7 4448323232 1386.5 316.2 -0.4 -1.6 39
289016 53.2 99 17.7 4448323232 1420.5 316.2 -0.4 -1.3 39
289017 53.2 99 17.7 4448323232 1463.5 316.3 2 1.7 39
289018 53.2 99 17.7 4448323232 1450 315.9 1.4 2.3 39
289019 53.2 99 17.7 4448323232 1450.5 315.8 3.9 5.7 39
289020 53.2 99 17.7 4448323232 1462.5 314.8 10.4 18.5 39
289021 53.2 99 17.7 4448323232 1473.5 314.4 11.1 21 39
289022 53.2 99 17.7 4448323232 1490.5 313.8 15.9 28.5 39
289023 53.2 99 17.7 4448323232 1502.5 313.9 12 22.3 39
289024 53.2 99 17.7 4448323232 1494 314.8 7.1 12.7 39
289025 53.2 99 17.7 4448323232 1447 316 -0.7 -1.7 39
289026 53.2 99 17.7 4448323232 1534 316 -0.1 -0.4 39
289027 52.8 99 17.7 4448323232 1542.5 313 21.7 38.6 39
289028 52.8 99 17.7 4448323232 1567 312.7 22.5 38.3 40
289029 52.8 99 17.7 4448323232 1573 311.8 28.2 48.6 40
289030 52.8 99 17.7 4448323232 1598 310.5 32.7 56.3 40
289031 53.2 99 17.7 4448323232 1618 310.3 34.6 58.2 40
289033 53.2 99 17.7 4448323232 1663.5 310.1 33.8 55.8 42
289034 53.2 99 17.7 4448323232 1692 309.9 34.1 55.5 42
289035 53.2 99 17.7 4448323232 1719 309.8 34.6 54.6 42

Page 60
289036 53.2 99 17.7 4448323232 1765 309.6 37.1 56.6 42
289037 53.2 99 17.7 4448323232 1777 309.7 35.2 54 41
289038 53.2 99 17.7 4448323232 1796 309.4 34 52.4 41
289039 53.2 99 17.7 4448323232 1833.5 309.7 31.3 47.3 41
289040 52.2 99 17.7 4448323232 1859.5 309.8 31.8 47.1 41
289041 52.2 99 17.7 4448323232 1883 309.7 32.2 46.4 41
289042 52.2 99 17.7 4448323232 1906 310 29.7 42.6 41
289043 52.2 99 17.7 4048323232 1918 309.6 30.8 43.6 41
289044 52.2 99 17.7 4048323232 1932 311.5 16.4 23.2 41
289045 52.2 99 17.7 4048323232 1930 311.9 12 18.4 40
289046 52.2 99 17.7 4048323232 1959.5 311.8 19.1 27.6 40
289047 52.2 99 17.7 4048323232 1961 311.2 21.1 30.4 40
289048 52.2 99 17.7 4048323232 1985 311.6 19.6 27.7 40
289049 52.2 99 17.7 4048323232 1985.5 311.4 17.1 23.4 40
289050 52.2 99 17.7 4048323232 1999.5 311.7 19.8 27.5 40
289051 52.2 99 17.7 4048323232 2013.5 312.2 13.5 19.5 40
289052 52.2 99 17.7 4048323232 2027.5 312.2 12.5 16.1 40
289053 52.2 99 17.7 4048323232 2020 312.9 10 14.1 40
289054 52.2 99 17.7 4048323232 2045 312.8 9.9 13 40
289055 52.2 99 17.7 4032323232 2045 313.3 9.3 13.2 40
289056 52.5 99 17.7 4032323232 2037 314.1 8.2 6.9 40
289057 52.5 99 17.7 4032323232 2041 313.5 6.4 9.6 41
289058 52.5 99 17.7 4032323232 2043.5 314.6 -0.8 -0.6 41

Page 61
8.12 Selected Pictures of Electrical Enclosures
8.12.1 Lit Switch Panel
8.12.2 Soft Start Enclosure Lid with GFD and Interface Board

Page 62
8.12.3 Soft Start Enclosure

Page 63
8.12.4 Rear Low Voltage Relay Lid with Master Board
8.12.5 cRIO Interface Board Mount

Page 64
8.12.6 Rear Electronics Bay

Page 65
8.13 Manufacturer Spec Sheets
(Relevant Specification Sheets are reproduced on the following pages in full)
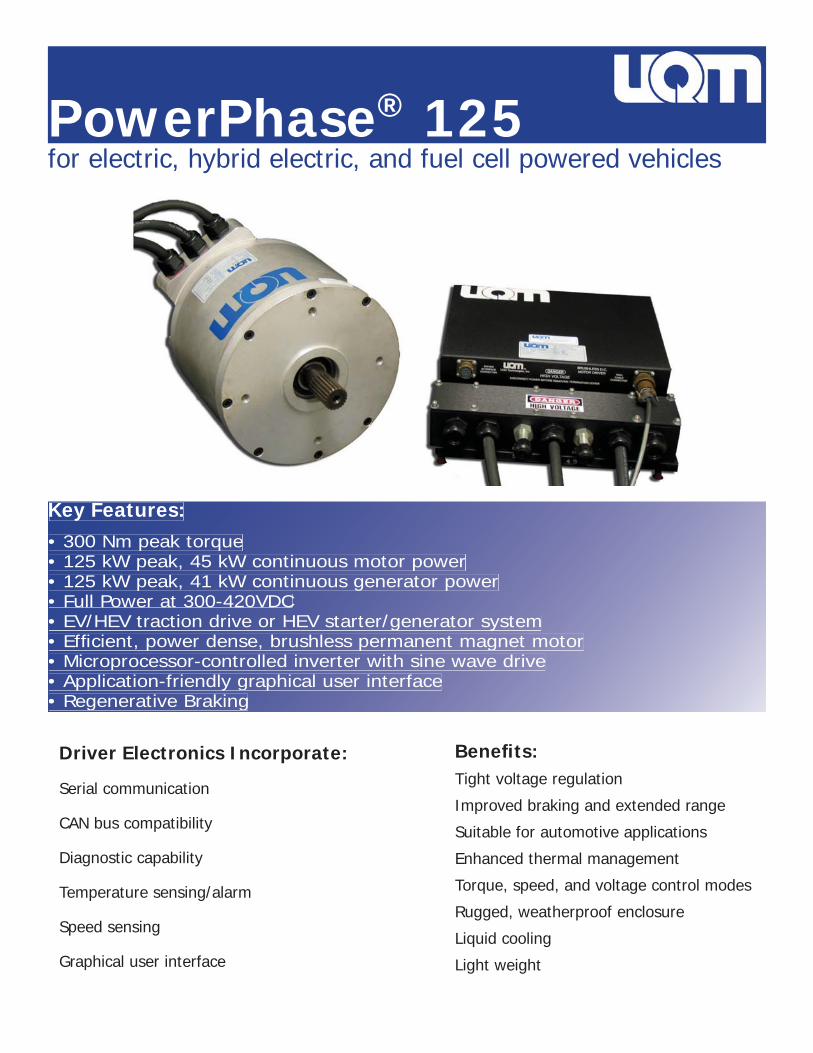
for electric, hybrid electric, and fuel cell powered vehiclesPowerPhase® 125
Key Features:• 300 Nm peak torque• 125 kW peak, 45 kW continuous motor power• 125 kW peak, 41 kW continuous generator power• Full Power at 300-420VDC• EV/HEV traction drive or HEV starter/generator system• Effi cient, power dense, brushless permanent magnet motor• Microprocessor-controlled inverter with sine wave drive• Application-friendly graphical user interface• Regenerative Braking
Benefi ts:Tight voltage regulation
Improved braking and extended range
Suitable for automotive applications
Enhanced thermal management
Torque, speed, and voltage control modes
Rugged, weatherproof enclosure
Liquid cooling
Light weight
Driver Electronics Incorporate:
Serial communication
CAN bus compatibility
Diagnostic capability
Temperature sensing/alarm
Speed sensing
Graphical user interface

HPM125 Motor/Generator
PowerPhase® 125
DimensionsLength 9.94 in 252 mm
Diameter 11.00 in 280 mm
Weight 90 lb 41 kg
PerformancePeak power 167 hp 125 kW
Continuous power at 3,000 rpms 60 hp 45 kW
Peak torque 221 lbf•ft 300 N•m
Continuous torque 110 lbf•ft 150 N•m
Maximum speed 8000 RPM
Maximum effi ciency 94%
Power density (based on 50 kW) 1.85 hp/lb 3.05 kW/kg
www.uqm.com [email protected] 303.278.2002 7501 miller dr., frederick CO 80530

DD45-500L Inverter/Controller
PowerPhase® 125
www.uqm.com [email protected] 303.278.2002 7501 miller dr., frederick CO 80530
Dimensions
Length 14.96 in 380 mm
Width 14.37 in 365 mm
Height 4.69 in 119 mm
Weight 35.0 lb 15.9 kg
Operating Voltage
Nominal input range 300 to 420 VDC
Operating voltage input range 240 to 420 VDC
Minimum voltage limit 240 VDC (with derated power output)
Input current limitation 500 A
Inverter Type
Control type PWM & phase advance,
3-Phase Brushless PM
Power device IGBT module half bridge × 3
Switching frequency 12.5 kHz
Standby power consumption 17 W (inverter and microprocessor)
Liquid Cooling System
Minimum coolant fl ow 8 l/min (50/50 water/glycol mix)
Max. inlet temp of controller 131° F 55° C
Inner diameter of hose 5/8 in 16 mm
Max. inlet pressure 10 psig 0.7 bar
TI2812 Digital Signal Processor (internally packaged)Nominal input voltage 12 VDC
Input supply voltage range 8 to 15 VDC
Input supply current range 0.3 to 0.5 A

The conte
rekeb_115 spec_int_evo.docx
EVO Electric Ltd.Unit 14 Woking Business Park
REKEB115EVO Electric Ltd
Document Summary
Date: 12/01/20
Issued Revision: Draft
Distribution: EVO Electric Ltd
The content of this document is proprietary and confidential.
© January 18, 2010 EVO Electric Ltd.Unit 14 Woking Business Park, Woking, Surrey, GU21 5JY
Tel: +44 (0) 1483 745010 Fax: +44 (0) 1483 770506
115 Specification SummaryEVO Electric Ltd
/2010
EVO Electric Ltd
Page 1 of 9
Specification Summary

The content of this document is proprietary and confidential
rekeb_115 spec_int_evo.docx Page 2 of 9
© January 18, 2010 EVO Electric Ltd.Unit 14 Woking Business Park, Woking, Surrey, GU21 5JY
Tel: +44 (0) 1483 745010 Fax: +44 (0) 1483 770506
Contents
1. Introduction and Scope ............................................................................................................. 2
2. I/O Connections ......................................................................................................................... 4
2.1 Control connector .................................................................................................. 4
2.2 Motor connector .................................................................................................... 6
1. Introduction and Scope
The REKEB115 is an inverter designed to control an Evo Axial Flux Permanent Magnet Synchronous Motor (PMSM). External views of these units are shown in Figure 1.
REKEB115-320 AF140 motor
Fig. 1. Example drive system offered by EVO Electric Ltd
A summary specification of the inverter is listed in Table 2.
Designation REKEB 115
Nominal voltage 320 VDC
Operational voltage range 290– 450 VDC
Rated output current 115 AAC
Peak output current (30sec) 172 AAC
Continuous Power 33 kW
Maximum Power 48 kW
Peak efficiency 98%
Control scheme Closed loop vector control

The content of this document is proprietary and confidential
rekeb_115 spec_int_evo.docx Page 3 of 9
© January 18, 2010 EVO Electric Ltd.Unit 14 Woking Business Park, Woking, Surrey, GU21 5JY
Tel: +44 (0) 1483 745010 Fax: +44 (0) 1483 770506
Motor position sensor Resolver
Coolant 50/50 water/glycol mix
Coolant flow rate 8.0 Litres/minute
Maximum coolant inlet temperature 55 °C
Coolant connections ½“ BSP
Operational ambient Temperature -10°C to +40°C
Weight 24 kg
Table 1 REKEB115 inverter specification
A drive system comprised of an AFM140-3 motor and a REKEB115 inverter typically achieves the following performance values.
Continuous Torque 145 Nm
Peak Torque 215 Nm
Base speed1 2400rpm
Maximum speed1 3200rpm
Nominal power 36kW
Peak Power 48kW
Table 2 Drive system summary specification Note 1: At a nominal DC bus voltage of 320V

!"#$%!&!'() *'+ ,-&.*($/$0$(1 2 3%+!%$'4 5'6-%&*($-' 2 7!(*$0!+ 8.!9$6$9*($-') 2 :$'-#();<%-'( :*'!0 ,-''!9($-')
!" #$%" &'(#')$ '(* *+&%($+!(') *"',+(-$. /+$+0 01% 2"!*#30 2'-% "%$!#"3%$ 0'4 !( (+53!&5
6'$0 7%/+$%*8 9:;:<:9<;= ;:8::8>95:
!"#$%&'() (*&+,-$&+. /01&+"1 23&4 '+$5673"+ !*&-!55+- $*. '+%!*83,9-$:5+ 4$1131
;( %'()6<=>?
= 5'(!4%*(!+ ,-&.*9( 53 )1)(!&) >$(? * %!9-'6$4#%*/0! <:@A 9?*))$) *'+ !&/!++!+
%!*0B($&! 9-'(%-00!%
= C->!%B9-)( )1)(!&) 6-% ?$4?BD-0#&! 3EF *..0$9*($-')
= G. (- HF 4*(! %!9-'6$4#%*/0! <:@A
= I )0-() 6-% , 8!%$!) 5;3 &-+#0!)
= G. (- JKK FLM %!*0B($&! .%-9!))-%
= G. (- NHI FO 7 AF &!&-%1P HQR FO -6 '-'D-0*($0! )(-%*4!
= G. (- (>- NK;NKKOA8EBST E(?!%'!( .-%() >$(? /#$0(B$' <S:;LSS: )!%D!%) *'+ C*/U5EV
%!&-(! .*'!0 V!/ )!%D!%
= 8HWH )!%$*0 .-%( 6-% .!%$.?!%*0 +!D$9!)
)@+-@3+2
X5 9 53BYKZ[ $'(!4%*(!+ )1)(!&) 9-&/$'! *' $'+#)(%$*0 %!*0B($&! 9-'(%-00!% *'+ %!9-'6$4#%*/0! 6$!0+B.%-4%*&&*/0! 4*(! *%%*1 \<:@A] 9?*))$) 6-% ?$4?BD-0#&! *'+ $'+#)(%$*0
&*9?$'! 9-'(%-0 *'+ &-'$(-%$'4 *..0$9*($-')^ S?! '!> X5 9 53BYKZH $'(!4%*(!+ )1)(!& 6!*(#%!) *' $'+#)(%$*0 HRR FLM %!*0B($&! .%-9!))-% *'+ *' !$4?(B)0-( 9?*))$) >$(? *'
!&/!++!+P %!9-'6$4#%*/0! NF 4*(! <:@A 9?$.^ S?! '!> X5 9 53BYKZJ $'(!4%*(!+ )1)(!& 9-'(*$') * JKK FLM %!*0B($&! .%-9!))-% *'+ *' !$4?(B)0-( 9?*))$) >$(? *' !&/!++!+P
%!9-'6$4#%*/0! HF 4*(! <:@A 9?$.^ O-(? )1)(!&) 6!*(#%! /#$0(B$' '-'D-0*($0! &!&-%1 *'+ * 6*#0( (-0!%*'( 6$0!^
O*9_ (- S-.
'+A93-+"+*&1 $*. !"#$&3:353&0
)/ (*8!-"$&3!*
= U[V-%_)
B-3@+- (*8!-"$&3!*
= X5B 53
/!8&2$-+ !"#$&3:353&0
= C*/U5EV
= C*/U5EV !*0BS$&! F-+#0!
= C*/U5EV :%-6!))$-'*0 7!D!0-.&!'( 81)(!&
= C*/U5EV <:@A F-+#0!
O*9_ (- S-.
!"#$-31!* 7$:5+1
C-!.9%& C-!%+11!-
/#++. DEFGH
ICJK /3G+
DJ$&+1H
E!.95+ /5!&1 B'KE DELH (*&+-*$5
;!*@!5$&35+
/&!-$,+ DELH
M=NM==LK/O67P
O&4+-*+& C!-&
'/QRQ /+-3$5
C!-&
C!2+- /9##50
(*#9& '$*,+
'+"!&+ C$*+5
S+: $*. I7C
/+-@+-
X5 9 53BYKZH HRR N F I RJ NHI 1!) 1!) NY (- WK U7, 1!)
X5 9 53BYKZW HRR H F I RJ NHI 1!) 1!) NY (- WK U7, 1!)
X5 9 53BYKZJ JKK H F I NHI HQR 1!) \7#*0] 1!) NY (- WK U7, 1!)
O*9_ (- S-.
!"#$%"&' (&'!)
*$%+!, (+&+!)
-.//0 1234/5.1
%$678$%9"7:
; ,,,5(+53!&

K##53%$&3!*$*.7+%4*!5!,0
/01&+" !*83,9-$&3!*
S?!)!X5,-&.*9( 53%!*0B($&!9-'(%-00!%)9-''!9((-*'16-#%B-%!$4?(B)0-(,-&.*9( 53%!9-'6$4#%*/0!9?*))$)^S?!#)!%B+!6$'!+<:@A9$%9#$(%1$'(?!9?*))$)9-'(%-0)!*9?5;3
&-+#0!*'+.*))!)+*(*(-(?!9-'(%-00!%(?%-#4?*0-9*0:,5/#)#)$'4/#$0(B$'9-&&#'$9*($-'6#'9($-')^
S?!)!)1)(!&)*0)-*99!.(#.(-!$4?(X5,8!%$!)5;3&-+#0!)^AD*%$!(1-65;3&-+#0!)*%!*D*$0*/0!$'90#+$'4D-0(*4!P9#%%!'(P(?!%&-9-#.0!P S7P*99!0!%-&!(!%P*'+)(%*$'
4*4!$'.#()`#.(-aRKU)$�(*'!-#))*&.0$'4*'*0-45;3`NHPHJP*'+JIU$'+#)(%$*0+$4$(*05;3`QU;SSC+$4$(*05;3`9-#'(!%;($&!%)`.#0)!4!'!%*($-'`*'+?$4?D-0(*4!;9#%%!'(
%!0*1)^
S?!NK;NKKF/$();)E(?!%'!(.-%(*00->)6-%.%-4%*&&*($99-&&#'$9*($-'-D!%(?!'!(>-%_*'+/#$0(B$'V!/\LSS:]*'+6$0!\<S:])!%D!%)^S?!9 53BYKZJ6!*(#%!)+#*0E(?!%'!(
.-%()P>?$9?*00->)6-%(?!#)!-6-'!.-%(6-%'!(>-%_9-&&#'$9*($-'(-*?-)(:,-%!'(!%.%$)!)1)(!&*'+(?!-(?!%.-%(6-%![.*')$-'5;3\!*)$019-''!9(*'-(?!%,-&.*9( 53
)1)(!&-%*'-(?!%E(?!%'!(B/*)!++!D$9!6-%*++$($-'*05;3]^
O":+..+./!8&2$-+
b-#9*')1'9?%-'$M!!&/!++!+9-+!![!9#($-'(-*'<:@AB4!'!%*(!+$'(!%%#.(%!"#!)(\5 c]-%*'$'(!%'*0&$00$)!9-'+%!*0B($&!90-9_)-#%9!^S?!C*/U5EV !*0BS$&!ES838
.%-D$+!)%!0$*/$0$(1*'+)$&.0$6$!)(?!+!D!0-.&!'(-69-&.0!(!!&/!++!+*..0$9*($-')(?*($'90#+!($&!B9%$($9*09-'(%-0*'+*9"#$)$($-'0--.)$'*++$($-'(-0->!%B.%$-%$(10--.)6-%
.-)(.%-9!))$'4P+*(*0-44$'4P*'+E(?!%'!(;)!%$*09-&&#'$9*($-'^O#$0(B$'!0!&!'(*05;36#'9($-'))#9?*)(?!<:@A !*+;V%$(!6#'9($-'.%-D$+!*9-&&#'$9*($-'$'(!%6*9!(-(?!
?$4?01-.($&$M!+%!9-'6$4#%*/0!<:@A9$%9#$(%1^7*(*D*0#!)*%!%!*+6%-&(?!<:@A$'$'(!4!%6-%&*(*'+*%!(?!'9-'D!%(!+(-)9*0!+!'4$'!!%$'4#'$()$'(?!9-'(%-00!%^
?!&2'307@A
B!C0,'"%D"31+0%30#"%
L935&6(*/+-@+-1
5'*++$($-'(-.%-4%*&&*($99-&&#'$9*($-'D$*S,:;5:PG7:PF-+/#);S,:P5%7AP*'+)!%$*0.%-(-9-0)P(?!,-&.*9( 539-'(%-00!%)$'90#+!/#$0(B$')!%D!%)6-%U$%(#*05')(%#&!'(
8-6(>*%!A%9?$(!9(#%!\U58A]PLSS:P*'+<S:^S?!U58A)!%D!%.%-D$+!)%!&-(!+->'0-*+*'+9-&&#'$9*($-'*99!))(-(?!%!9-'6$4#%*/0!5;3\ 53]<:@A-D!%E(?!%'!(^S?!
LSS:)!%D!%.%-D$+!)*V!//%->)!%#)!%$'(!%6*9!(-LSFC.*4!)P6$0!)P*'+(?!#)!%$'(!%6*9!-6!&/!++!+C*/U5EV*..0$9*($-')(?%-#4?*V!//%->)!%.0#4B$'^S?!<S:
)!%D!%.%-D$+!)*99!))(-0-44!++*(*-%9-'6$4#%*($-'6$0!)^
O*9_(-S-.
9,,,5(+53!&

B+&$35+./#+%383%$&3!*1
S?!6-00->$'4).!9$6$9*($-')*%!(1.$9*06-%(?!hHK(-QQi,-.!%*($'4(!&.!%*(#%!%*'4!#'0!))-(?!%>$)!'-(!+^
;+&2!-V
X!(>-%_$'(!%6*9!
NKO*)!S*'+NKKO*)!STE(?!%'!(
,-&.*($/$0$(1
5EEEIKH^W
,-&&#'$9*($-'%*(!)
NKF/.)PNKKF/.)P*#(-B'!4-($*(!+
F*[$&#&9*/0$'4+$)(*'9!
NKK&;)!4&!'(
'/6QRQ/+-3$5C!-&
F*[$&#&/*#+%*(!
NNQPHKK/.)
7*(*/$()
QPRPZPI
8(-./$()
NPH
:*%$(1
3++PED!'PF*%_P8.*9!
<0->9-'(%-0
S8;,S8PT3X;T3<<P7S ;78
/EL !**+%&!-D%'()6<=>X)*50H
)9	& 4$-$%&+-31&3%1
F$'$&#&?$4?B0!D!0-#(.#(D-0(*4!
V$(?hNKKjA-#(.#(9#%%!'(
H^YU
V$(?hNR&A-#(.#(9#%%!'(
H^JU
V$(?hHJ&A-#(.#(9#%%!'(
H^WU
F*[$&#&0->B0!D!0-#(.#(D-0(*4!
V$(?NKKjA-#(.#(9#%%!'(
K^NKU
V$(?NR&A-#(.#(9#%%!'(
K^JKU
V$(?HJ&A-#(.#(9#%%!'(
K^QQU
7%$D!%(1.!
,F38
F*[$&#&)$'_;)-#%9!9#%%!'(
aHJ&A
F*[$&#&WB)(*(!-#(.#(0!*_*4!9#%%!'(
aQjA
(*#9& 4$-$%&+-31&3%1
F$'$&#&$'.#(D-0(*4!
KU
F$'$&#&0->B0!D!0$'.#(D-0(*4!
K^YJU
F*[$&#&?$4?B0!D!0$'.#(D-0(*4!
H^JWU
F*[$&#&$'.#(D-0(*4!
Q^QU
S1.$9*0$'.#(9*.*9$(*'9!
H^Q.<
J,,,5(+53!&

S1.$9*0%!)$)($D!)(%*..$'4
N_k(-W^WU
E+"!-0
9 53BYKZHP9 53BYKZW
X-'D-0*($0!
NHIFO
81)(!&&!&-%1
RJFO
9 53BYKZJ
X-'D-0*($0!
HQRFO
81)(!&&!&-%1
NHIFO
'+%!*83,9-$:5+ICJK
9 53BYKZH
X#&/!%-60-4$99!00)
NZPHIK
AD*$0*/0!!&/!++!+ AF
JWH_/$()
9 53BYKZWP9 53BYKZJ
X#&/!%-60-4$99!00)
JRPKIK
AD*$0*/0!!&/!++!+ AF
ZHK_/$()
(*&+-*$5'+$5673"+ 5!%V
A99#%*91
HKK..&`WQ..&*(HQi,
C!2+-'+A93-+"+*&1
,*#($-'b-#&#)(#)!*X*($-'*0E0!9(%$9,-+!\XE,]GCC$)(!+,0*))H.->!%)#..01>$(?(?!9 53BYKZH;W;J^
!9-&&!'+!+.->!%)#..01
JIVPHJU7,
:->!%9-')#&.($-'
HKV&*[$&#&
:->!%)#..01$'.#(%*'4!
NY(-WKU
C4013%$5 4$-$%&+-31&3%1
561-#'!!+(-90!*'(?!9-'(%-00!%P>$.!$(>$(?*+%1(->!0^
89%!>B(!%&$'*0>$%$'4
K^Q(-H^Q&&H\HJ(-NHAV@]9-..!%9-'+#9(-%
>$%!>$(?NK&&\K^WY$'^]-6$')#0*($-')(%$..!+
6%-&(?!!'+
S-%"#!6-%)9%!>(!%&$'*0)
K^Q(-K^RXl&\J^J(-Q^W0/l$'^]
V!$4?(
YHY4\WH^Z-M]
/$8+&0[!5&$,+1
,-''!9(-'01D-0(*4!)(?*(*%!>$(?$'(?!)!0$&$()^
U(!%&$'*0(-,(!%&$'*0
WQU&*[PF!*)#%!&!'(,*(!4-%15
F!*)#%!&!'(,*(!4-%15$)6-%&!*)#%!&!'().!%6-%&!+-'9$%9#$()'-(+$%!9(019-''!9(!+(-(?!!0!9(%$9*0+$)(%$/#($-')1)(!&%!6!%%!+(-*)FA5X8
K,,,5(+53!&

CMP313 SeriesEV ON-BOARD
HIGH FREQUENCY Battery Chargers
CMP313 Series Data Sheet – Rev. 03, Issue 09/09 Page 1 of 4
EDN GROUP S.r.l. Via Mazzini, 10/12 – 20032 – CORMANO (MI) ITALY – TEL. +39 02 66305120 FAX +39 02 61540938
CONSULT TECHNICAL SALES FOR MORE DETAILED DATA SHEETS OR TECHNICAL MANUAL
e-mail: [email protected] web.site: www.edngroup.com
FEATURES
• HFPC (High Frequency Power Converter)topology.
• Fully CAN v2.0B controlled.
• High efficiency and high Input Power Factor
• AC/DC full off line isolation, this assures
maximum personal protection.
• IP54 protection degree
• Outputs are short-circuit protected.
• Output reverse polarity is protected by internalfuse.
• Remote alarm.
CMP313 Series 7KW Sealed, Single-Phase, ON-BOARD Chargers
for Lithium Battery Vehicles
APPLICATIONS
CMP313 charger series is a very Versatile,safe high-tech charger for high-end on-board electric vehicle applications.
CMP313 charger series can charge Lithiumbattery packs safely and powerfully.

CMP313 SeriesEV ON-BOARD
HIGH FREQUENCY Battery Chargers
CMP313 Series Data Sheet – Rev. 03, Issue 09/09 Page 2 of 4
EDN GROUP S.r.l. Via Mazzini, 10/12 – 20032 – CORMANO (MI) ITALY – TEL. +39 02 66305120 FAX +39 02 61540938
CONSULT TECHNICAL SALES FOR MORE DETAILED DATA SHEETS OR TECHNICAL MANUAL
e-mail: [email protected] web.site: www.edngroup.com
Input Data UnitsInput Voltage Range (Single Phase) 192...276 VacLine Frequency 47...63 HzMaximum Input current @ 192Vac 41 AacAbsorbed maximum Apparent Power 7900 VAPower Factor > 0.98
General Data UnitsProtections Output overvoltage
Output overcurrentOutput polarity reversal
Input overvoltageAmbient Temperature -20...+50 °CPower derating -5%/°C (from 40°C to 50°C)Heat Dissipation IP54 FAN coolingProtection Degree IP54Efficiency > 90 @ at max load %Control interface CAN v2.0B (500Kbit/s, standard frame, ID's adaptable)Remote alarm N.C. contact potential free (“OR” of thermal protection, overvoltage, etc.)Mains presence N.O. contact potential free (when the input mains is present the contact closes)
Ouputs Data CMP313-01 CMP313-02 UnitsV01 Output Voltage (max) 294 392 VdcV01 Output Current (max) 23 18 AdcV01 Rated Output Power 7000 WV01 Costant current control by CAN or by PWM (isolated)
V02 Output BMS Voltage 12 VdcV02 Output BMS Current 0,1 Adc
V03 Output FAN Voltage 24 VdcV03 Output FAN Current 1,0 Adc
Standard Applied UnitsGeneral Requirements EN 61851-1, EN 61851-21EMC – Emission EN61000-3-4, CISPR 14, 16 level AEMC – Immunity EN61000-4-1, EN61000-4-4, EN61000-4-5, EN61000-4-11, EN61000-4-3SAFETY EN 60950-1:2002 + A11:2004, ECE regulation 100Dielectric Withstand Voltage Input / PE:
Input / Output:Output / PE:
Input / SELV:
2000Vac @ 1min.2000Vac @ 1min.1000Vdc @ 1min.4000Vac @ 1min.
Insulation resistance Input, Output / PE: > 1MΩ @ 500VdcTouch current < 3.5 mA
Mechanical Data UnitsDimensions: Width x Depth x Height 616 x 304 x 176,5 mmWeight (ca.) 23 KgCase Material Aluminium / Steel (black cataphoresis painted)Case Type Box
I/O Connections Input (1L + N + PE + Pilot):Power Output (to battery packs):
Control signal and Interface:
IP67 MS Circular connectorsIP67 MS Circular connectorsIP67 MS Circular connectors

Note: See Installation Manual for full details, test methods of parameters and application notes.
MODEL PAF450F280-12 PAF450F280-24 PAF450F280-28 PAF450F280-48ITEMS PAF600F280-12 PAF600F280-24 PAF600F280-28 PAF600F280-48Nominal Output Voltage VDC 12 24 28 48Output Current (Max) 450W A 38 19 16.5 9.5
600W 50 25 21.5 12.5Max Output Power 450W W 456 456 462 456
600W 600 600 602 600Efficiency (Typ) % 89-90 91 91 91Input Voltage Range VDC 200-400VDCOutput Voltage Accuracy % ±1Output Voltage Adjustment VDC 7.2 - 14.4 14.4 - 28.8 16.8 - 33.6 28.8 - 57.6Max Ripple & Noise mV 120 240 280 480Max Line Regulation mV 48 56 56 96Max Load Regulation mV 48 56 56 96Temperature Coefficient °C 0.02%/°COvercurrent Protection % 105 - 140%Overvoltage Protection % 125 - 145%Signals & Control - Remote Sense, Remote On/Off, Parallel Pin, Inverter Good, 11-14V Auxiliary voltageBaseplate Temperature - -40°C to +100°C Baseplate: (See derating chart)Humidity (non condensing) - 5 - 95% RH Operating, 5 - 95% RH Non OperatingCooling - Conduction (See Installation Manual for heatsink selection)Isolation Voltage - Input to Baseplate: 2500VAC (20mA); Input to Output 3000VAC for 1 min.;
Output to Baseplate: 500VDC for 1 minShock - 196.1m/s2
Vibration - Non Operating, 10-55Hz (sweep for 1 min.)Amplitude 0.825mm constant (Max 49 m/s2) X,Y,Z 1 hour each
Safety Agency Approvals - UL60950-1, CSA60950-1, EN60950-1, CE LVDWeight (Typ) g 200Size (WxHxD) mm 2.4 x 0.5 x 4.6 (61 x 12.7 x 116.8) See outline drawingWarranty yr 2 years
PAF-F280 Series
3055 Del Sol Blvd • San Diego, CA 92154 • 1-800-LAMBDA-4
Wide Adjustment Range Reduces need for custom modulesParallel Pin Modules can be connected together for higher currentHigh Efficiency - up to 91% Reduced heat losses
Feature Benefit
Servers & Rail SystemsHigh End ComputersCustom Power Supplies
Output Voltages from 7.2V to 57V450W to 600W Output PowerCurrent ShareOperation to 100°C BaseplateWide Adjustable Output Range
Key Market Segments & Appl i cat ions
131
PAF Features and Benef i ts
Spec i f i cat ions
200V to 400VDC Input Full brick DC-DC Converters


