Embed Size (px)
Citation preview
1
Kevin M. DelGobbo, Chairman
Electric Rates in Connecticut
Connecticut Department of Public Utility Control
December 2010

2
Premise:
Provide detail on all Electric Rate components to establish a foundation
upon which energy policy choices are developed.
The Challenge:
High Rates
Multiple Policy Commitments
Operational Disadvantages
Context:
Some good news .... CT electric rates are declining.
CT has choices today that were not available
during most of the last decade.
STATUS OF 3 KEY COST DRIVERS
Sufficient Generating Capacity
Improved Transmission System
Commodity Price Stability
Highly recommend review of Integrated Resource Plan (IRP) document.
Developed by CEAB, CL&P, UI, DPUC

3
State Ranking for Electricity Residential Prices (August 2010)
DOE/ EIA: http://www.eia.doe.gov/state/state_energy_rankings.cfm?keyid=18&orderid=1
4
1
2
3
4
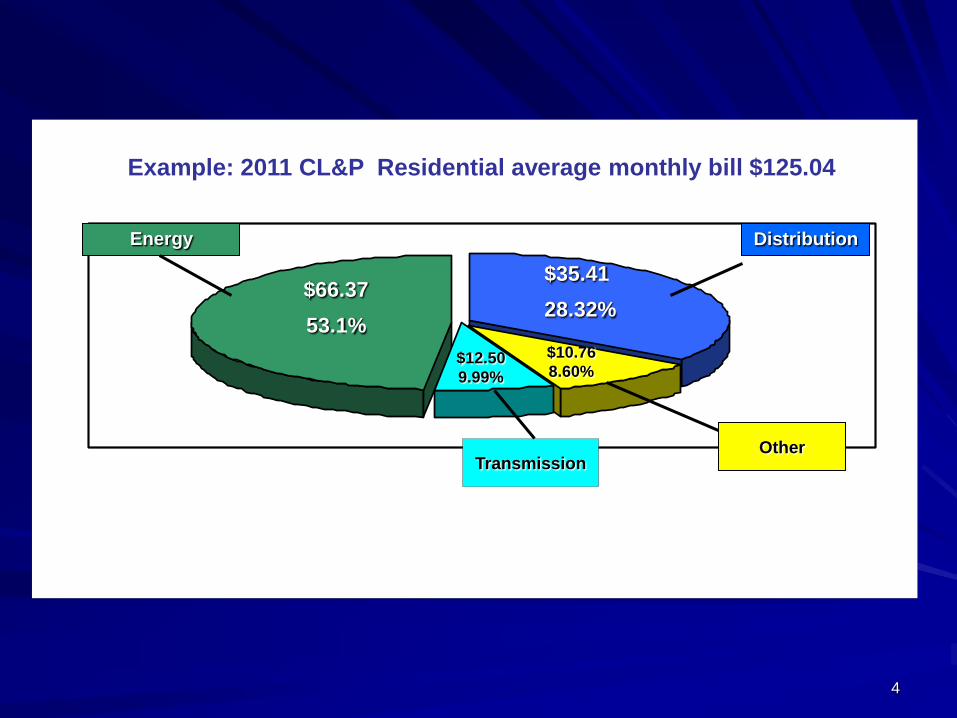
Energy Distribution
Other Transmission
$66.37
53.1%
$35.41
28.32%
$10.76
8.60% $12.50
9.99%
For 2010 Rates
Example: 2011 CL&P Residential average monthly bill $125.04

5
CL&P Residential Rate - 2011
2010 Bills 2011 Bills
Distribution $30.27 $35.41
2010 Rate
Transmission $12.50 $12.50 19.1 cents/kWh
SBC $2.04 $0.79
CTA $7.45 $1.83
Revenue Bonds $0.00 $2.42 2011 Rate
17.8 cents/kWh
GSC $77.36 $66.37
Conservation $2.10 $2.10
Renewables $0.70 $0.70
FMCC-Delivery $1.85 $2.92
Total Bill $134.27 $125.04
Estimated 2011 Electric Bills
CL&P Residential Rate 1
(assumes customer uses 700 kWh/month).
Rates should decline by approximately 6.9% in 2011.
This would be a decline of approximately 11.9% from 2009 when bills were $141.89/month
2010 Rate
19.1 cents/kWh
2011 Rate
17.8 cents/kWh

6
UI Residential Rate - 2011
2010 Bills 2011 Bills
Distribution $58.17 $55.45
2010 Rate
Transmission $13.41 $13.41 23.9 cents/kWh
SBC $2.36 $2.46
CTA $10.65 $10.65
Revenue Bonds $0.00 $0.00 2011 Rate
23.5 cents/kWh
GSC $80.98 $74.31
Conservation $2.10 $2.10
Renewables $0.70 $0.70
FMCC-Delivery -$0.95 $5.59
Total Bill $167.42 $164.67
Estimated 2011 Electric Bills
UI Residential Rate R
Rates should decline by approximately 1.6% in 2011.
This would be a decline of approximately 1.6% from 2009 when bills were $167.42/month
(assumes customer uses 700 kWh/month).
2010 Rate
23.9 cents/kWh
2011 Rate
23.5 cents/kWh

7
Migration to Competitive Suppliers
CL&P and UI Territories
1
2
CL&PSuppliers
417,878 Customers
35%
787,725 Customers
65%
1
2
SuppliersUI
196,947 Customers
60%
131,454 Customers
40%

8
Generation Comparison Standard Service vs. Alternate Supplier
Estimated Reduction from CL&P Generation Charge
approximately 10 % or $6.63 savings
Estimated Reduction from UI Generation Charge
approximately 16 % or $11.89 savings

9
Distribution Rate Components - 2011 C
en
ts/k
wh
Distribution
1 Includes payroll, gross receipt, income, property and municipal taxes.
0
5
10
15
20
Total Rate
Operation &
Maintenance
Expense 40%
Depreciation
Expense 13%
Debt costs &
return to
shareholder
investors 24% Taxes 23%
CL&P
$35.41 per month
UI
$55.45 per month
Operation &
Maintenance
Expense 50%
Debt costs & return
to shareholder
investors 16%
Depreciation
Expense 17%
Taxes 17%
Local delivery of electricity to homes and businesses, including the
costs of poles, wires, transformers, and customer service.
Distribution
Total Rate
$14.16
$8.14 $8.50 $4.61
$27.73
$9.43 $9.43 $8.86

10
1
Generation Service Charge—Standard Service
ExplanationUICL&PComponent
100%
3%
3%
3%
13%
78%
% of
Total
$74.31
$2.23
$2.23
$4.45
$9.66
$55.74
$
Administrative Costs3%$1.99Admin
Cost of compliance by suppliers of satisfying the resource
portfolio standards mandated by CT law.3%$1.99RPS
100%$66.36Total
Costs of electrical losses on the transmission and distribution
systems; and the cost of congestion created because of
insufficient transmission facilities.
6%$1.99Congestion
and losses
$8.63
$51.76
$
The cost of buying capacity in the market. Capacity market was
designed to assure that enough generation is always available
to meet load.
13%Capacity
The cost of buying energy in the market. 75%Energy
% of
Total
Estimated Cost for 2011 in $$Residential Standard Service
Bill Impact
CL&P $66.36
UI $74.31

11
2
Renewable Charge
$0.70
Annually
CL&P-$22 mil
UI-$5.4 mil
$$
Created by restructuring law, P.A. 98-28.
Provides funds for incentives to develop
renewable energy technologies.
100%Renewable
Charge
Explanation% of TotalComponent
• The Connecticut Clean Energy Fund (CCEF) was launched in 2000 to support
the growth and development of clean energy technologies.
• CCEF’s main goals are to:
• Create clean energy supply for Connecticut;
• Accelerate the development of clean energy technologies; and
• Educate Connecticut consumers about the benefits and availability of
clean energy.
• 1,740 clean, on-site energy systems have been installed or are underway
• 212 at institutions (188 solar, 21 fuel cell, 1 hydro, 2 wind)
• 1528 at residences/homes (all solar)
Bill Impact
CL&P $0.70
UI $0.70

12
3
Competitive Transition Assessment
Purchase power contracts and regulatory assets approved as
part of the initial restructuring of electric industry.26%$2.7499%$1.81Regulatory
Assets
ExplanationUICL&PComponent
100%
1%
0
% of
Total
$10.65
0
$7.91
$
100%$1.83Total
$0.02
0
$
The cost of buying of existing power contracts that were
incurred prior to restructuring.0%IPP
contracts
Recovery of the remaining investment in above market
nuclear generating facilities.74%Nuclear Plant
investment
% of
Total
Bill Impact
CL&P $1.83
UI $10.65

13
4
Conservation Charge
$2.10
Annually
CL&P-$67 mil
UI-$16 mil
$
Created by restructuring law, P.A. 98-28.
Provides funds for incentives to implement
energy efficiency and load management
100%Conservation
Charge
Explanation% of TotalComponent
• The Connecticut Energy Efficiency Fund (CEEF) was launched in 2000 to help
consumers to use energy more efficiently.
• CEEF’s objectives are to (1) lower bills, (2) promote economic development,
(3) enhance energy security and (4) mitigate environmental impacts.
• 300,000 residential customers served annually, $20 million annual savings.
• 3,000 business customers served annually, $25 million annual savings.
• Programs administered by CL&P and UI, with oversight by the Energy
Conservation Management Board and the DPUC.
Note—In 2010, CT enacted state budget law that diverts 35% of this charge beginning
in 2012 for 6 years to support Economic Recovery Revenue Bonds.
Bill Impact
CL&P $2.10
UI $2.10

14
5
System Benefits Charge - 2011
Biennial preparation of an integrated resource plan.3%$0.072%$0.05Biennial Energy Plan
ExplanationUICL&PComponent
2%
4%
85%
% of
Total
$0.03
$0.03
$1.99
$
Administrative and Consulting Costs1%$0.05CT Energy Advisory Board
$0.10
$2.01
$
The mandated payment to towns for loss of property tax
revenues from sales of generation during restructuring<1%Transition
property tax payments to towns
The cost of protecting limited income consumers, including
reserve for write-offs, special needs program, matching
payment program.
84%Hardship Customer Protection
% of
Total
Bill Impact
CL&P $2.36
UI $2.36

15
6
Federally Mandated Congestion Costs – 2011*
Costs to implement state mandated programs for contracts
with peaking and other (KLEEN) generation, self generation
incentives and costs, pursuant to P.A. 05-01. These costs
are non-bypassable, that is, customers must pay them
regardless of electricity supplier.
78%$8.3050%$3.72State
mandated
contracts
and
programs
ExplanationUICL&PComponent
100%
50%
% of
Total
$10.65
$2.35
$
100%$7.45Total
$3.73
$
Costs to administer the transmission grid and wholesale
power market, reliability must run units needed to maintain
system integrity, black start units. These costs are non-
bypassable, that is, customers must pay them regardless of
electricity supplier.
22%ISO-NE and
reliability
costs
% of
Total
"Federally mandated congestion charges" means any cost approved by the Federal Energy Regulatory Commission as part of New
England Standard Market Design including, but not limited to, locational marginal pricing, locational installed capacity payments, any
cost approved by the Department of Public Utility Control to reduce federally mandated congestion charges in accordance with
section 7-233y, this section, sections 16-19ss, 16-32f, 16-50i, 16-50k, 16-50x, 16-243i to 16-243q, inclusive, 16-244c, 16-244e, 16-245m,
16-245n and 16-245z, and section 21 of public act 05-1 of the June special session** and reliability must run contracts
*For Non-bypassable FMCCs
Bill Impact
CL&P $7.45
UI $10.65

16
1
2
3
4
Energy Distribution
Other Transmission
$66.37
53.1%
$35.41
28.32%
$10.76
8.60% $12.50
9.99%
For 2010 Rates
Example: 2011 CL&P Residential average monthly bill $125.04

17
Factors Contributing to Cost Differential
Generation
Commodity Impact – Prices based on cost of marginal generation source – gas Procurement Practices- 3 year laddering Fuel Mix – gas/oil vs. coal and hydro No indigenous fuel sources No legacy of large federal energy projects – e.g. TVA in South, Large dams in the Pacific Northwest.
Strict air quality standards Renewable Energy Requirements High cost for construction, land, labor and taxes
Distribution
Taxes Wages Upgrading old plant and equipment Underground facilities High Reliability
Transmission
New and Upgraded transmission lines Underground facilities
Other
C&LM - CT in top 5 states for spending Renewable Energy Charge- separate charge to promote renewable energy projects SBC - Low Income programs CTA - Stranded Cost
Economic Recovery Revenue Bonds

18
COMPARISON OF CL&P vs MIDWESTERN UTILITY (COLUMBUS-SOUTHERN POWER COMPANY)
Customer using 750 kWh/month
Columbus-Southern
Power Company CL&P
Schedule R-R (Jan 2010)
cents/kWh cents/kWh
Generation 2.73 10.50
Transmission and Distribution 3.00 4.74
Other 0.60 2.27
Total 6.33 17.51
Other for Columbus-Southern is $4.52 customer charge spread over 750 kWh/month
Factors causing higher rates in CT:
Ohio's generation is 65% from coal which was 25% the cost of natural gas in 2007 (Source:EIA State Electricity Profiles 2008; page 213)
RPS adds to CT bills; Ohio has no RPS standard
Requirement to build transmission underground (e.g. Middletown-Norwalk) adds cost to Transmission

19
rates
cents/kWh % Coal % hydro
1 Hawaii 28.59 7.4 1.0
2 New York 19.03 7.5 11.1
3 Connecticut 18.98 7.1 1.6
4 New Jersey 17.34 11.1 0.0
5 Alaska 17.17 36.9 20.0
6 Rhode Island 16.99 0.0 0.2
7 New Hampshire 16.51 12.6 12.0
8 Maine 15.81 2.0 17.2
9 California 15.73 0.6 15.8
10 Vermont 15.52 0.0 28.5
11 Massachusetts 15.45 12.3 1.9
12 Maryland 14.99 39.3 4.7
13 District of Columbia 14.38 0.0 0.0
14 Delaware 14.02 32.3 0.0
15 Michigan 13.45 39.2 0.8
16 Pennsylvania 13.28 41.0 1.7
17 Wisconsin 12.57 43.1 2.8
18 Nevada 12.19 25.8 9.3
United States 12.02 48.2 6.2
19 Texas 11.95 19.2 0.6
20 New Mexico 11.89 49.8 1.0
21 Illinois 11.86 36.2 0.1
22 Colorado 11.76 39.6 5.3
23 Florida 11.73 18.5 0.1
24 Ohio 11.71 65.1 0.3
25 Arizona 11.61 22.5 10.5
2008 26 Iowa 11.21 50.5 1.0
27 Alabama 11.16 36.9 10.5
28 Georgia 10.98 36.4 5.6
29 Minnesota 10.77 36.8 1.4
30 Virginia 10.76 24.6 2.9
31 Kansas 10.62 43.3 0.0
32 South Carolina 10.56 30.2 5.6
33 North Carolina 10.48 47.2 7.0
34 Missouri 10.35 54.3 2.7
35 Nebraska 10.26 45.6 4.0
36 Mississippi 10.24 16.0 0.0
37 Montana 9.82 43.5 47.4
38 South Dakota 9.58 16.0 42.3
38 Utah 9.58 68.3 3.6
39 Tennessee 9.57 42.3 12.6
40 Oklahoma 9.52 26.2 4.2
41 Wyoming 9.44 83.0 4.2
42 Indiana 9.39 72.8 0.2
43 North Dakota 9.34 75.1 8.9
44 Louisiana 9.32 13.3 0.7
45 West Virginia 9.17 89.9 1.6
46 Oregon 9.13 4.4 62.8
47 Kentucky 8.99 71.9 4.1
48 Arkansas 8.94 25.3 8.7
49 Idaho 8.49 0.8 69.5
50 Washington 8.32 4.7 71.9
Electricity Rates – August 2010
States with lowest rates tend to rely more on coal and hydro
Residential electric rates from EIA State Rankings, August 2010, dated 11/24/10.
Fuel mix data from EIA State Electricity Profiles 2008, dated March 2010.

20
2018 Fuel Mix
Refuse & Methane
2.7%
Gas/oil
31.8%Hydro
2.0%
Nuclear
30.7%
Oil/gas
24.5%
Coal
8.2%
Coal
Gas/oil
Hydro
Nuclear
Oil/gas
Refuse & Methane
2009 Fuel Mix
Hydro
1.9%Nuclear
29.6%
Oil/gas
38.1%
Refuse &
Methane
2.6%
Gas/oil
19.8%
Coal
8.0%
Coal
Gas/oil
Hydro
Nuclear
Oil/gas
Refuse & Methane
CT Generation Fuel Mix
Source: CT Siting Council Forecast of Loads & Resources 2008-2017

21
Capacity/Peaking Facilities
Net Costs to Ratepayers
Costs related to such resources as: GenConn Devon & Middletown, PSEG, Waterside, Waterbury Generation,
Ameresco, Kleen Energy
Source: Docket 10-08-01: CL&P EL-8 & 9; UI EL-16 & 20 and Application Exhibit 2
$0
$10
$20
$30
$40
$50
$60
1 2
1
2
CL&P Net Costs to Ratepayers $ millions
$0
$10
$20
$30
$40
$50
$60
1 2
1
2
UI Net Costs to Ratepayers $ millions
2010
$4.3 mil (partial year)
2011
$47.4 mil (est. annual)
2010
$1.4 mil (partial year)
2011
$11.8 mil (est. annual)

22
CT Renewable Portfolio Standards
Year Class I
Class II or
Class I (add'l)
Class III
Program Total Low High
2005 1.5% 3% 4.5% 13.6 30.7
2006 2% 3% 5% 16.1 37.8
2007 3.5% 3% 1% 7.5% 30.4 66.7
2008 5% 3% 2% 10% 44.5 99.4
2009 6% 3% 3% 12% 55.4 121.2
2010 7% 3% 4% 14% 66.3 143
2011 8% 3% 4% 15% 72.6 160.3
2012 9% 3% 4% 16% 79.1 178
2013 10% 3% 4% 17% 85.1 194.6
2014 11% 3% 4% 18% 91.3 211.8
2015 12.5% 3% 4% 19.5% 100.7 237.5
2016 14% 3% 4% 21% 110.6 264.6
2017 15.5% 3% 4% 22.5% 120.1 290.7
2018 17% 3% 4% 24% 130.8 319.8
2019 19.5% 3% 4% 26.5% 148.2 637.1
2020 20% 3% 4% 27% 152.9 379.7
Estimated Annual Costs
$ Millions

23
Costs of Renewable Technology
Technology Estimated Levelized Costs
Cents/kwh
Landfill Gas 5.6
Biomass 11.0
Hydro 11.0
Wind 11.2
Fuel Cells 17.4
Offshore Wind 19.9
Solar PV 52.0
Today’s power
supply costs
are in the range
of 7-8
cents/kWh.
Source: Integrated Resource Plan for CT (Jan. 1, 2010), prepared by The Brattle Group, Inc.; p. 3-30, Table 3.15

24
DG Capital Grants
2006 to 2011
Examples of Completed DG Projects:
Emergency Generation -Yarde Metals (Southington); Matabasset Treatment (Cromwell); Town of Westport (Westport);
Stafford High School (Stafford); Hartford Fire Insurance (Hartford); Stew Leonard’s (Newington); Newington Board of
Education (Newington)
CHP Generation - Fairfield University (Fairfield); Jerome Nursing Home (New Britain); Cellu Tissue (East Hartford); Norwalk
High School (Norwalk); Kimberly-Clark (New Milford); Northwestern CT YMCA (Torrington); United Technologies, Pratt &
Whitney (Middletown)
The DG Capital Grants program provided grants to encourage the development of emergency
generators and cogeneration (CHP) facilities to meet capacity needs and provide demand response
capability.
Year
# Projects
Approved
Amount
Awarded Total MWs
2006 1 $33,960 0.17
2007 40 $10,962,809 32.55
2008 44 $18,412,376 51.34
2009 25 $8,089,004 20.80
2010 11 $15,598,160 37.32
2011* (Total Outstanding
Liability To-Date)
39 $30,959,617 72.33
Total 160 $84,055,926 214.51
As of 11/16/2010

25
Slice # Q1 Q2 H2 H1 H2 H1 H2 H1 H2 H1 H2 H1 H2
12.367 10.334 11.522 11.311 14.001 10.581
12.272 10.280 11.469 11.147 13.981 10.509 10.951
12.212 10.794 11.540 11.285 11.627 12.889 12.610
12.142 10.754 11.737 11.135 11.222 14.110 13.672
12.067 10.694 11.647 10.803 11.208 14.070 13.632
14.571 10.406 11.454 12.032 11.609 12.231 11.916
14.446 10.331 11.108 12.742 11.919 11.878 11.578
14.252 11.160 12.198 12.169 11.417 11.783 11.126
14.590 10.966 11.979 12.772 11.570 12.336 11.135
14.445 10.932 11.636 12.501 11.442 11.936 11.115
BFMCC-> .8 .8 .8 .4 .55 .55 .55
Type 'B' Bids have been converted to Type 'A' by the above BFMCC amounts
Indicates full-year bid was received
Pricing may vary from prior versions due to change in loads
RFP Date Bid Due Dates # Slice-Years Term Lengths (Mo.)
8/2/06 Completed (9/12/06) 5.5 3, 3, 6, 12
8/2/06 Completed (10/30/06) 8.25 3, 3, 6, 12, 12
1/25/07 Completed (3/6/07) 4.25 3, 3, 6, 12
8/10/07 Completed (9/25/07) 5.5 6, 6, 12, 12 (New CT On/Off Peak definitions began)
8/10/07 Completed (11/05/07) 1.5 6, 6
3/14/08 Completed (4/23/08) 4 6, 12, 12
3/14/08 Completed (8/5/08) 2 12,12 (Added 7/29/08)
3/14/08 Completed (10/28/08) 4.5 6, 6, 12, 12
Spring 09 4.5 6, 12, 12 (Tent.)
Fall 09 5 6/12, 12, 12 (Tent.)
Spring 10 5 6, 12, 12 (Tent.)
Fall 10 5 6/12, 12, 12 (Tent.) not fully shown above
Spring 11 5 6, 12, 12 (Tent.) not fully shown above
Standard Service Bid Blocks - All RFP's
2007 2008 2009 2010
(cents/kwh)
2011 2012
10 F 11 S 12
F 11 S 129
11.513
11.526
8
5
F 11
7
6
312.731
4
213.176
111.904
.55 .55
11.383

26
Average Monthly Estimated Household Expenditures
Telecommunications Services - 2010
Bundled Rate
Voice/Video/Internet $90-$125
Wireless $90-$110
Monthly Total $180-$235
Assumptions:
Does not include any state or federal taxes or governmental fees.
Includes promotional rates. Internet download speeds of 8 – 20 mbps.
Wireless service purchased separately from voice/video/internet bundle.
Family Plan with 1400 monthly minutes, 3 telephone numbers, unlimited nights, weekends & text messages.
CT Energy Prices
2000 to 2008 % Increase in Prices
Source: U.S. Energy Information Administration, State Energy Data 2008
0%
20%
40%
60%
80%
100%
120%
140%
160%
180%
1 2 3 4
1
2
3
4
Natural Gas Heating Oil Gasoline Electricity
in Million Btu

27
Kevin M. DelGobbo, Chairman
Electric Rates in Connecticut
Connecticut Department of Public Utility Control
December 2010