Embed Size (px)
Citation preview

Many thanks to the Institute for Popular Democracy, especially Gladstone Cuarteros, Patrick Patiño and Joel Rocamora of the Political Reform team, Orville Tatco and Lambert Ramirez of the National Institute for Policy Studies, the staff at Liberal Party headquarters, Nina Lucia and Archie Reyes and Gov. Ed Panlilio of the office of Gov. Panlilio, Roy Loredo of Pepe, and Ginno Jaralve, Michael Rico and Lester John Lomeda for their assistance with the data.
Election Forensics – The Effect of Socioeconomic Characteristics on Voting
Behavior in the Philippines
Cecilia Pe Lero Institute for Popular Democracy
June 2008
III ... Literature Review ....................................................................................................2 AAA... Voting and SES Factors ..........................................................................................2 BBB... New Entrants ..........................................................................................................5
IIIIII... Causal Model and Model Specification....................................................................7 AAA... Total Population and Voting Age Population ..........................................................8 BBB... Gender ....................................................................................................................8 CCC... Urban/ Rural ...........................................................................................................9 DDD... Income Class ........................................................................................................10 EEE... Education ..............................................................................................................11 FFF... Age .......................................................................................................................12 GGG... Overseas Filipino Workers....................................................................................13 HHH... Religion................................................................................................................13 III... Marital Status.........................................................................................................14 JJJ... Household Size ......................................................................................................14
IIIIIIIII... Data Sources:.....................................................................................................15 AAA... The 2000 Census of Population and Housing ........................................................15 BBB... 2004 Number of Registered Voters and Voters Who Actually Voted.....................16 CCC... Election Returns as provided by the Liberal Party .................................................16 DDD... Election Returns as provided by PPCRV-NAMFREL in Pampanga ......................17
IIIVVV... Part A Results ....................................................................................................17 VVV... Part B Results ........................................................................................................20 VVVIII... Discussion .........................................................................................................21 Appendix.......................................................................................................................27 Works Cited ..................................................................................................................41
Generated by Foxit PDF Creator © Foxit Softwarehttp://www.foxitsoftware.com For evaluation only.

Many thanks to the Institute for Popular Democracy, especially Gladstone Cuarteros, Patrick Patiño and Joel Rocamora of the Political Reform team, Orville Tatco and Lambert Ramirez of the National Institute for Policy Studies, the staff at Liberal Party headquarters, Nina Lucia and Archie Reyes and Gov. Ed Panlilio of the office of Gov. Panlilio, Roy Loredo of Pepe, and Ginno Jaralve, Michael Rico and Lester John Lomeda for their assistance with the data.
III... Literature Review AAA... Voting and SES Factors
Elections in the Philippines are an event to behold. Philippine elections are like
hyper-fiestas: the joy of joining one’s friends, neighbors, and the entire country in an
exuberant show of national pride and support for your candidate, and the drama and
excitement of the violence, cunning and money that underlies it all.
Accordingly, elections in the Philippines are a widely-studied phenomenon.
While academics study Philippine elections in order to understand how the democratic
transition is moving along as power structures influence and are influenced by the
elections process, activists and democratic advocates also study elections in order to
understand how traditional power structures can be broken down and changed. As a
result, Philippine election studies tend to look at elections from the top down. Studies
mainly focus on the structure of the electoral system, candidates’ personalities, resources,
machinery and tactics, and of course, the “three g’s” of guns, goons and gold.
In the broader election literature, however, voting is perhaps the most widely
studied political act. The appeal of voting is its uniqueness. Voting is, “by far, the most
common act of citizenship in any democracy and because electoral returns are decisive in
determining who shall govern, political scientists appropriately devote a great deal of
attention to the vote.” (Verba 23) There are several widely accepted factors that influence
voting behavior. Chief among these variables is socioeconomic status (education, income
and occupation) with education as the primary influence. (Verba 5)
Generated by Foxit PDF Creator © Foxit Softwarehttp://www.foxitsoftware.com For evaluation only.

3
The literature on Philippine voting that utilizes the characteristics of voters is
sparse. Furthermore, studies that do look to compare voter characteristics with voter
behavior are mainly based on hypothesis, assumptions, and anecdotes, with little use of
quantifiable tools such as survey data. The National Statistics Coordination Board
(NSCB) regularly publishes statistics on elections. However, these statistics are limited to
registered voters and voter turnout, and only down to the provincial level. (Standards and
Classifications Divisions)
Not surprisingly, the most complete and systematic approaches to studying voting
come from outside the government sector. In 2004, the Institute for Political and
Electoral Reforms (IPER) conducted a psychographics study, which looks at
demographic factors as well as voter attitudes through surveys and mathematical
methods. As a psychographics study, it “attempts to place the electorate in psychological,
rather than purely demographic dimensions…it uses demographics to study and measure
attitudes, lifestyles and opinions of people.” The study uses factor analysis – a technique
which attempts to explain voter behavior in terms of other measurable factors.
However, the study looks at the population at large. It asked survey respondents
about the factors they took into consideration when voting and what their views were
about election issues. It did not investigate the relationships between specific
demographics and voting behavior, effectively looking at its sample of voters as a whole
versus analyzing the behavior of specific sections of the voting population.
The closest the IPER study came to looking at sections is in the section, “How the
Electorate Views Common Electorate Practices” when it states that age, region or origin,
gender and educational attainment had an effect on how voters viewed certain practices.
Generated by Foxit PDF Creator © Foxit Softwarehttp://www.foxitsoftware.com For evaluation only.
4
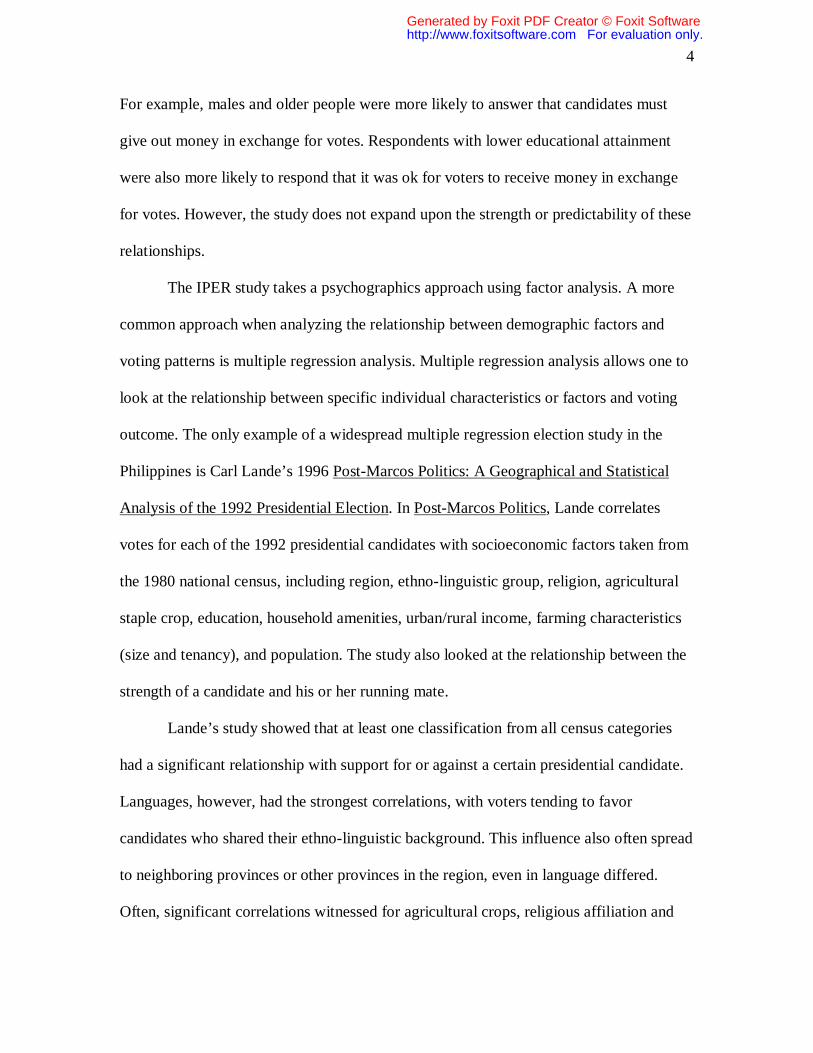
For example, males and older people were more likely to answer that candidates must
give out money in exchange for votes. Respondents with lower educational attainment
were also more likely to respond that it was ok for voters to receive money in exchange
for votes. However, the study does not expand upon the strength or predictability of these
relationships.
The IPER study takes a psychographics approach using factor analysis. A more
common approach when analyzing the relationship between demographic factors and
voting patterns is multiple regression analysis. Multiple regression analysis allows one to
look at the relationship between specific individual characteristics or factors and voting
outcome. The only example of a widespread multiple regression election study in the
Philippines is Carl Lande’s 1996 Post-Marcos Politics: A Geographical and Statistical
Analysis of the 1992 Presidential Election. In Post-Marcos Politics, Lande correlates
votes for each of the 1992 presidential candidates with socioeconomic factors taken from
the 1980 national census, including region, ethno-linguistic group, religion, agricultural
staple crop, education, household amenities, urban/rural income, farming characteristics
(size and tenancy), and population. The study also looked at the relationship between the
strength of a candidate and his or her running mate.
Lande’s study showed that at least one classification from all census categories
had a significant relationship with support for or against a certain presidential candidate.
Languages, however, had the strongest correlations, with voters tending to favor
candidates who shared their ethno-linguistic background. This influence also often spread
to neighboring provinces or other provinces in the region, even in language differed.
Often, significant correlations witnessed for agricultural crops, religious affiliation and
Generated by Foxit PDF Creator © Foxit Softwarehttp://www.foxitsoftware.com For evaluation only.

5
farm tenancy were explainable by regional support. Specific platforms and issues
espoused by the candidates did not seem to have a discernable relationship with voting
patterns.
BBB... New Entrants
As it is widely accepted that socioeconomic factors influence voting behavior,
statistical studies dating back to the 1930s confirm this and Lande’s 1996 and IPER’s
2004 studies testify that such relationships exist in the Philippine context on the national
level, it follows that such relationships should also exist for provincial electoral contests.
However, in the Philippines, local elections tend to be dominated by local elites and
political clans who utilize legal and extra-legal tactics in order to win elections and
perpetuate their hold on power. This makes it especially difficult for reform candidates to
win local elections, as reform candidates are usually new entrants into politics without
ties to entrenched political clans and the resources they dominate. However, that elections
even exist, even if they are far from “free and fair,” can constitute part of the “political
opportunity structure” which can open the way for further erosion of authoritarian
structures. (Franco 3)
In local Philippine elections, it is accepted that there is a connection between
voter demographics and voter behavior and current assumptions form parts of campaign
strategies in local contests. Common examples of election-related anecdotes and
hypotheses include that, like national contests, provincial candidates will be more
successful in the particular municipalities where they are from, rural and poor voters will
be more susceptible to patronage tactics and vote buying, and the endorsement of
particular religious groups, especially the Iglesia ni Kristo and Jesus is Lord movement,
Generated by Foxit PDF Creator © Foxit Softwarehttp://www.foxitsoftware.com For evaluation only.

6
will sway voters towards or away from particular candidates. However, these, again, are
anecdotes and their validity and strength has yet to be systematically tested. A better
understanding of these mechanisms can change the way local elections are run. Also,
understanding why people vote the way they do may enable new entrants with limited
resources to bypass traditional patronage-based election tactics.
This study identifies and analyzes three provincial gubernatorial races with
candidates identified as new entrants or progressive in May 2007. In Pampanga, Eddie
“Among Ed” Panlilio, Catholic priest with no relatives or experience holding public
office, defeated incumbent Mark Lapid and Board Member Lilia “Baby” Pineda. 1 Both
the Lapids and the Pinedas have several family members in government and are accused
of widespread illegal activities.2 In Pangasinan, Amado Espino, Jr. defeated Dr. Jamie
Eloise Agbayani. The Agbayanis are the longest-reigning political clan in Pangasinan;
they controlled the governor’s seat without interruption from 1971 to 2007. (Cardinoza)
The gubernatorial race in Iloilo was between incumbent governor Neil Tupas, Sr. and
vice-governor Roberto Armada. Tupas is the first of his family to hold a major
government position and has risen through Iloilo politics beginning in the 1960s. While
he may not be considered a new entrant in this election, the Arroyo administration backed
Armada and tapped local dynasties allied with her to campaign against Tupas. Many in
the province feel that Ilonggos’ disgust with the Arroyo administration’s tactics was a
major contributing factor to Tupas’ sizeable victory. (see Gumabong, Mendoza and
Robles) Finally, as a contrast, La Union has been included in this study. The
gubernatorial race in La Union was between two well-entrenched families: the Ortegas
1 The Sangguniang Panlalawigan, or Provincial Board, is the legislative arm of the provincial government. 2 For details about the Pampanga race, see Lero 2007.
Generated by Foxit PDF Creator © Foxit Softwarehttp://www.foxitsoftware.com For evaluation only.

7
and the Dumpits. The Ortegas are arguably the more dominant family, maintaining a
staggering presence in La Union politics since 1901. In 2004, however, incumbent Victor
Ortega lost the governorship to Thomas “Butch” Dumpit. In 2007, the Ortegas reclaimed
the governorship when Manuel Ortega defeated Butch Dumpit. While Manuel projected a
more friendly and approachable image than both Butch Dumpit and Victor Ortega,
progressive politics was certainly not a legitimate part of his appeal. (see Galvez and
Makabenta)
IIIIII... Causal Model and Model Specification This study comprises of two parts. Part A investigates the relationship between
voter turnout and socioeconomic factors. For Part A, investigation focuses on the
municipal level. A multiple regression test was performed on all municipalities of the
Philippines (as of 2000), with the exceptions of Manila City, Quezon City, Valenzuela
City, Kalookan City, Makati City and Parañaque City. These cities, due to their large
size, were subdivided into their legislative districts for the purpose of analysis. In the
regression model, percent voter turnout in the 2004 elections is the dependent variable
and total population, voting age population, gender, urban/rural classification, income
class, education, age, overseas Filipino worker status, religion, marital status, and
household size are the independent variables. First, tests were run for each socioeconomic
variable separately. Then, the test was run for all socioeconomic variables, allowing the
variables to control each other.
Generated by Foxit PDF Creator © Foxit Softwarehttp://www.foxitsoftware.com For evaluation only.

8
The author recognizes that a major limitation of this study is the chronological
gap between the data. Socioeconomic demographic data from 2000 is used to investigate
election behavior in 2004 and 2007.
AAA... Total Population and Voting Age Population
It may be hypothesized that ground-level political operators are more effective in
smaller municipalities as they are able to directly connect with more voters than in
heavily populated municipalities. Furthermore, given the “fiesta-like” atmosphere that
surrounds elections, the social component of elections may be stronger in smaller
municipalities. Part A of the study tests the hypothesis that municipalities with smaller
populations have higher voter turnouts.
Ground-level political operaters, however, tend to be a tactic of traditional
politicians. Total Population and Voting Age Population are taken from the 2000 Census.
BBB... Gender
Gender is widely recognized as a basic socioeconomic factor in international
voting literature. (see Cassel 405 and Blakely) It was also included as a standard
backgrounder in the 2001 ABS-CBN/SWS Day-of-Election survey. In IPER’s 2004
study, the Filipino electorate was found to be increasingly female and men and women
were found to have statistically significantly different attitudes regarding electoral fraud
tactics and election reforms. Specifically, men were more likely to deem it socially
Generated by Foxit PDF Creator © Foxit Softwarehttp://www.foxitsoftware.com For evaluation only.

9
acceptable to accept bribes in exchange for votes and women were more likely to have
hope for electoral reforms.
This study uses percent male population as a measure of gender. Part A tests the
hypothesis that municipalities with a higher percent male population will have higher
voter turnout rates. Percent male population was derived by dividing male population by
total population. Male population and total population come from the 2000 Census.
CCC... Urban/ Rural
It may be hypothesized that rural municipalities have higher voter turnout rates
because of, again, the effectiveness of political operators, and also, because of the slower
pace of life in rural communities, election day would be a somewhat exciting event to
break daily routine. However, it may also be hypothesized that polling precincts in rural
areas are more difficult to physically travel to, thus reducing voter turnout rates. Part A
tests the hypothesis that rural municipalities have higher voter turnout rates.
Lande (90) suggests that urban areas are likely to have more voters who are
educated and independent-thinkers. Urban/rural classification is a value ascribed by the
National Statistical Coordination Board. “A barangay is classified as urban if "(1) If a
barangay has a population size of 5,000 or more, then a barangay is considered urban,
or(2) If a barangay has at least one establishment with a minimum of 100 employees, a
barangay is considered urban, or (3) If a barangay has 5 or more establishments with a
minimum of 10 employees, and 5 or more facilities, then a barangay is considered urban.
Note that if the facility is not present in the barangay, presence of facilities within the two
kilometer radius from the barangay hall is considered." (NSCB Resolution No. 11)
Generated by Foxit PDF Creator © Foxit Softwarehttp://www.foxitsoftware.com For evaluation only.

10
Urban classification was ascribed a value of 3, Partially Urban ascribed 2, and
Rural ascribed 1.
DDD... Income Class
International voting literature has shown that those with higher incomes are more
likely to vote. However, in the context of Philippine elections, it may be hypothesized
that communities with lower incomes are more likely to vote because they are more
susceptible to political operators and electoral fraud mechanisms (especially vote buying,
Lande 109) and because, unlike those with higher incomes who may engage the political
process through personal connections or civic involvement, voting remains the major way
low-income people can be involved in the political process. IPER found that income level
affected the reasons why people accepted electoral fraud. Those with monthly incomes of
P5,000 or less were more likely to accept fraud based on “powerlessness” and less likely
to feel that “no authority can stop fraud.” Those with monthly incomes of P5,000 to
P10,000 were more likely to believe that “no authority can stop fraud” or respond that
they “do not care why” fraud is committed. Those with monthly incomes of P10,000 or
more were more likely to see fraud as “a fact of life” embedded in the system. (62-63)
Part A will test the hypothesis that municipalities of higher income classes will
have lower voter turnouts. Income class is ascribed by the Department of Finance based
on average annual municipal income. (Department of Finance Order No. 20-05)
Generated by Foxit PDF Creator © Foxit Softwarehttp://www.foxitsoftware.com For evaluation only.

11
Class Average Annual Income
First P 50 M or more
Second P 40 M or more but less than P 50 M
Third P 30 M or more but less than P 40 M
Fourth P 20 M or more but less than P 30 M
Fifth P 10 M or more but less than P 20 M
Sixth Below P 10 M
However, income class is an imperfect measurement of individual behavior as it
does not adjust for population – it measures income for the areas as a whole and not per
capita. Thus, an area with many low-income residents may be of the same income class
as an area with few high-income residents.
EEE... Education
In international voting literature, education is the primary influence which affects
voter turnout. (Verba et al 23) Specifically, higher education levels have consistently
been shown to be related to higher voter turnout. Lande suggests that educated voters are
more likely to be independent thinkers who focus on single issues instead of traditional
political gimmicks. (90) IPER found that those with lower educational attainment were
more likely to deem it acceptable to accept bribes in exchange for votes and were more
likely to have actually accepted a bribe in exchange for their vote in practice. Those with
higher educational attainment were found to be more likely to have hope for the electoral
reform process. (58, 70)
Part A will test the hypothesis that municipalities characterized by higher
education levels will be more likely to have higher voter turnout.
Generated by Foxit PDF Creator © Foxit Softwarehttp://www.foxitsoftware.com For evaluation only.

12
Education levels are taken from the 2000 Census, which reports how many people
completed no grade, elementary school, high school, at least 1 year of post secondary
school, at least 1 year of undergraduate college, an academic degree, post baccalaureate,
and those who did not report. A value was ascribed to each level; 1 = no grade, 2 =
elementary, 3 = high school, 4 = post secondary, 5 = undergraduate, 6 = academic degree,
7 = post baccalaureate. The weighted mean for each municipality and barangay was then
calculated, using the formula:
Where x = education level and w = weight = number of respondents. Non-reported
education levels were not included in determining the weighted mean.
FFF... Age
Age is another recognized factor. In international voting literature, “older people
have consistently been found to be more active politically, although there appears to be a
slight drop-off in activity among the very elderly.” (Ulhaner) IPER found that older
voters were more likely to state that candidates should give money to voters while
younger voters were more likely to have hope for electoral reforms.
Part A will test the hypothesis that municipalities with older populations will have
higher voter turnouts.
This study uses the weighted mean age for each municipality/barangay. Data on
age comes from the 2000 Census.
Generated by Foxit PDF Creator © Foxit Softwarehttp://www.foxitsoftware.com For evaluation only.
13
GGG... Overseas Filipino Workers
The political attitudes and behavior of Overseas Filipino Workers (OFWs) is an
exciting new topic in progressive Philippine discourse. Many hypothesize that OFWs and
their families may comprise a new support base for progressive politics. As these
Filipinos work abroad, they witness governments that are actually effective in providing
public services and rule of law. They return to the Philippines with a better understanding
of how effective government can work and spread such ideas to their friends and family.
Furthermore, they have the resources to potentially support progressive politicians and to
make them less susceptible to traditional political operations.
Part A will test the hypothesis that municipalities with a high percentage of OFWs
will have higher voter turnouts. The percentage of OFWs was calculated by dividing the
number of OFWs by total population. OFW data comes from the 2000 Census.
HHH... Religion
In a nation that is about 85% Catholic, religious minority groups play significant
roles in Philippine elections. Specifically, the Iglesia ni Kristo (INK) has a much-touted
reputation for block voting, although the impact of the Iglesia ni Kristo on voting is
disputed by Lande (93) and Cuarteros. IPER found that INK followers were more likely
to accept bribes for votes and tended to be more cynical about electoral reforms while
followers of Islam were the least likely of major religions to accept bribes. (58, 70)
The top seven religions in the nation according to the 2000 Census were chosen
for testing. These are: Roman Catholic, Islam, Iglesia ni Kristo, Aglipay, Seventh Day
Adventists, United Church of Christ, and the Jesus is Lord Movement. The percent
Generated by Foxit PDF Creator © Foxit Softwarehttp://www.foxitsoftware.com For evaluation only.

14
membership of each religious group was found by dividing the membership of each
group by total population.
III... Marital Status
Marital Status is also generally accepted as a basic socioeconomic factor. Part A
will test that more married people in a municipality will result in higher voter turnout.
Part B will test that married people will be more likely to support a reform candidate.
Marital status is taken from the 2000 Census, which reports how many people were
single, divorced, widowed, in common law/live-in relationships, legally married, and of
unknown marital status. A value was ascribed to each category; 1 = single, 2 = divorced,
3 = widowed, 4 = common law, 5 = legally married, 6 = unknown. This coding may
create a problem, as it is categorical and do not necessarily represent a quantifiable
continuum of marital status. The weighted mean for each municipality and barangay was
then calculated, using the formula:
where x = marital status value and w = weight = number of respondents. Unknown
marital status was not included in determining the weighted mean.
JJJ... Household Size
Household size (along with education levels) may be a more accurate level of
individual poverty than municipal or barangay income classification. It is conceivable
that those with low incomes cannot afford to live alone and so mush share housing.
Generated by Foxit PDF Creator © Foxit Softwarehttp://www.foxitsoftware.com For evaluation only.

15
Furthermore, empirical evidence shows that poverty incidence is higher among larger
family sizes. (Orbeta 8) Part A will test the hypothesis that larger mean household size is
related to higher voter turnout.
This study uses the weighted mean household size for each
municipality/barangay. Data on household size comes from the 2000 Census.
IIIIIIIII... Data Sources:
This study uses four data sources: The 2000 Census of Population and Housing, 2004
Number of Registered Voters and Voters Who Actually Voted as provided by the
Institute for Popular Democracy’s Political Mapping Department, 2007 Election Returns
as provided by the Liberal Party, and 2007 Election Return data as provided by
Pampanga NAMFREL-PPCRV.
AAA... The 2000 Census of Population and Housing
Census 2000 was designed to take an inventory and collect information about the
total population and housing units in the Philippines and their characteristics in order “to
provide government planners, policy makers and administrators with data on which to
base their social and economic development plans and programs.” (National Statistics
Office)
As the Census is used in determining revenue allotment to local government units,
the results are a politically sensitive issue. In order to make the process as objective as
possible, the Philippine National Statistics Office involved various stakeholders in
Generated by Foxit PDF Creator © Foxit Softwarehttp://www.foxitsoftware.com For evaluation only.

16
consultations and meetings when designing the census. Local government officials,
government agencies, universities and non-government organizations were involved in
the design process. (Statistics Division) On May 1, 2000, about 44,500 census
enumerators (mostly public school teachers trained by the NSO) began conducting 20-30
minute door to door interviews with a member of the household (the head, his or her
spouse, or an otherwise responsible person who could answer on behalf of the household
head). (“Census 2000 Starts Today”)
BBB... 2004 Number of Registered Voters and Voters Who Actually Voted
This information was provided by the Institute for Popular Democracy’s Political
Mapping Department (IPD PolMap). IPD PolMap obtained the data from “Registered
Voters and Voters Able to Vote for the May 2004 Elections,” an internal COMELEC
document dated June 9, 2004.
CCC... Election Returns as provided by the Liberal Party
As the dominant minority party, the Liberal Party of the Philippines received
2007 election returns for precincts where they ran candidates. However, these election
returns were limited as many failed to be delivered, many remained in the provinces
pending election challenges, and many only retained election returns for national
candidates.
At Liberal Party headquarters we were able to access election returns for local
candidates for the provinces of Sulu, Pangasinan, Iloilo and La Union. Using Cochran’s
Generated by Foxit PDF Creator © Foxit Softwarehttp://www.foxitsoftware.com For evaluation only.

17
sample size formula for categorical data, we took simple random samples of at least 384
observations per province. (Bartlett, 47) We manually encoded province, municipality,
barangay, registered voters in the precinct, voter turnout in the precinct, and votes for
each gubernatorial candidate from our samples of election returns.
DDD... Election Returns as provided by PPCRV-NAMFREL in Pampanga
IPD was able to obtain encoded election returns from PPCRV-NAMFREL in
Pampanga immediately after the 2007 elections. This data was encoded at the PPCRV-
NAMFREL quick count centers. It is complete for the province of Pampanga except for
the municipalities of Lubao and Bacolor.
IIIVVV... Part A Results
Regression tests were run with percent voter turnout (vis-à-vis the total municipal
population) as the dependent variable and each socioeconomic factor as the dependent
variables. Then, a multiple regression test was run with all socioeconomic factors
together, where the independent variables were able to control each other.
Tests showed that several socioeconomic factors, when taken in isolation, had a
significant relationship with voter turnout. (See Appendix for regression tables)
Generated by Foxit PDF Creator © Foxit Softwarehttp://www.foxitsoftware.com For evaluation only.

18
Summary of Results: Voter Turnout and Socioeconomic Variables Regressed Individually
Significant Positive
Relationship Significant Negative
Relationship No Significant
Relationship Determined Municipal Income Class
Mean Age
Percent OFW
Aglipay
United Church of Christ
Household Size
Total Municipal Population
Voting Age Population
Urban Classification
Iglesia Ni Kristo
Seventh Day Adventist
Mean Education Level
Gender
Islam
Roman Catholic
Jesus Is Lord Movement
Marital Status
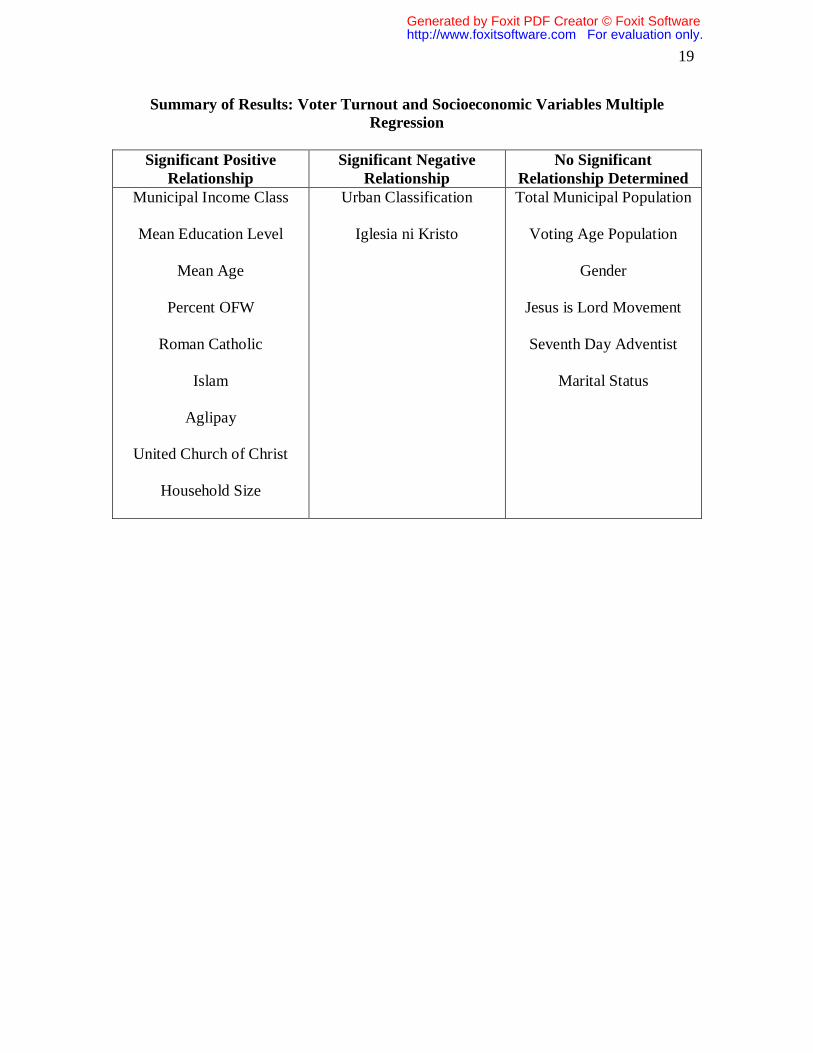
When a multiple regression is performed on all socioeconomic variables, Total
Municipal Population, Voting Age Population and Percent Seventh Day Adventist shift
from having significant, negative relationships with voter turnout to having no significant
relationship, while Mean Education Level, Percent Roman Catholic, and Percent Islam
move from having no significant relationships to having significant, positive
relationships.
Generated by Foxit PDF Creator © Foxit Softwarehttp://www.foxitsoftware.com For evaluation only.
19
Summary of Results: Voter Turnout and Socioeconomic Variables Multiple Regression
Significant Positive
Relationship Significant Negative
Relationship No Significant
Relationship Determined Municipal Income Class
Mean Education Level
Mean Age
Percent OFW
Roman Catholic
Islam
Aglipay
United Church of Christ
Household Size
Urban Classification
Iglesia ni Kristo
Total Municipal Population
Voting Age Population
Gender
Jesus is Lord Movement
Seventh Day Adventist
Marital Status
Generated by Foxit PDF Creator © Foxit Softwarehttp://www.foxitsoftware.com For evaluation only.

Many thanks to the Institute for Popular Democracy, especially Gladstone Cuarteros, Patrick Patiño and Joel Rocamora of the Political Reform team, Orville Tatco and Lambert Ramirez of the National Institute for Policy Studies, the staff at Liberal Party headquarters, Nina Lucia and Archie Reyes and Gov. Ed Panlilio of the office of Gov. Panlilio, Roy Loredo of Pepe, and Ginno Jaralve, Michael Rico and Lester John Lomeda for their assistance with the data.
VVV... Part B Results
The results for the individual regression tests for socioeconomic factors and
support for gubernatorial candidates were far less conclusive.
Governor Significant Positive Relationship
Significant Negative Relationship
Panlilio Mean Age
Espino Catholic Iglesia ni Kristo
Aglipay
Ortega Total Municipal Population
Voting Age Population
Mean Age
Iglesia ni Kristo
Tupas Urban Classification
Total Municipal Population
Voting Age Population
Mean Education Level
Aglipay
Mean Age
When a multiple regression is performed on all socioeconomic variables, the only
significant socioeconomic variable was Mean Age, which had a positive relationship with
support for Tupas.
Generated by Foxit PDF Creator © Foxit Softwarehttp://www.foxitsoftware.com For evaluation only.

21
VVVIII... Discussion
There are several serious restrictions to this study. The major limitations are a
direct result of the lack of reliable data. Because there are no surveys which connect
individual socioeconomic attributes and voting behavior, we were forced to use data from
municipalities and barangays, giving us a picture of relatively large communities, not
individuals. Furthermore, the lack of recent Census data could have a misleading effect;
socioeconomic data comes form 2000 while voting data comes from 2007 and
communities may have experienced significant changes during that time period.
Furthermore, barangay-level voting data was excruciatingly difficult to encounter.
Election returns were only available for a selection of municipalities in the provinces
selected, and it is possible that election returns unfavorable to local politicians did not
make it to Manila. We attempted to compensate for sample bias through compensatory
sampling methods to ensure that our samples would be reflective of the provincial
population.
Finally, although all the gubernatorial candidates mentioned in some way
represent a break from normal power structure, Panlilio in Pampanga is the only
gubernatorial candidate tested that can truly be called a new entrant/reform politician.
While Espino was able to end the Agbayani’s long term in power, he was also heavily
backed by the administration and comes from a family that is also powerful in
Pangasinan. Similarly, the Ortegas are also one of the oldest political dynasties in La
Union, although the defeat of Dumpit was still viewed as a victory for some local
progressives. Finally, while Neil Tupas could be considered a new entrant when he began
Generated by Foxit PDF Creator © Foxit Softwarehttp://www.foxitsoftware.com For evaluation only.

22
his career in politics, he has established himself in Iloilo politics since the 1960s, and so
his victory does not necessarily herald anything new for the province.
The most interesting and exciting output from the statistical tests is the
statistically significant, positive correlation between percent OFWs in a municipality and
percent voter turnout. Furthermore, percent OFWs is the independent variable with the
most impact (has the largest correlation coefficient). The political effect of the OFW
phenomenon is a topic Philippine political circles have been hypothesizing about and
wanting to investigate, but currently there are no definitive texts on the matter. Analysts
hypothesize that OFW communities are potentially a new source of political power,
especially for progressive forces mainly because 1) While abroad they experience states
that actually govern effectively, breaking the resignation and hopelessness which
characterize Philippine political culture; 2) The increase in material resources allows
OFWs and their families the leisure time to pay attention to and engage in political
thought; 3) Many OFWs originate from the lower middle and lower income classes.
Thus, they may tend to be pro-worker or –poor in mindset, but have access to middle
class level resources. Furthermore, upon examination of the raw data, OFWs tend to
make up very small populations within municipalities (the minimum was 0%, the
maximum 13.1% and the mean was 1.2%). The fact that small proportions of municipal
populations can have such a large impact suggests that the effects of the “OFW
experience” are not limited to OFWs themselves, but spill over to their communities.
This study validates that the presence of OFWs in a community encourages political
participation in that community and rationalizes the further investigation of causal
relationships and potential orientations of politically active OFWs.
Generated by Foxit PDF Creator © Foxit Softwarehttp://www.foxitsoftware.com For evaluation only.

23
Also interesting, although the 2004 IPER study found that young people and
females tend to be the most hopeful about electoral reform, this study found that the mean
age in a municipality actually had a significant, positive relationship with voter turnout,
and that percent male population of a municipality does not have a significant effect on
voter turnout. In other words, although young people and females are most hopeful about
the potential to remedy our political system, this attitude does not translate into increased
voter participation. Future attempts to build a progressive voter base should focus on
these two populations.
Also, when controlled by other variables, mean education level becomes
significant and positive. I would hypothesize that this is due to the inclusion of mean age
as a controlling variable. Municipal income level classification may be related to
education level, as it would be logical that a municipality with more educated people has
a higher overall income. Municipal income level is also significant and positive with
voter turnout. These data are consistent with international voter participation literature
which has found that educated and affluent individuals are more likely to engage in the
political process. Again, however, mean education level and municipal income
classification are not characteristics of individuals, but of communities. Lande suggests
that in the 1992 elections, urban, educated middle class opinion-makers were able to
project their values and provide serious competition to traditional political operators and
machinery for the votes of the rural and uneducated. These findings support Lande’s
assertion.
While it seems logical that larger household sizes would be related to higher
incidences of poverty, and thus, according to this model, should result in lower percent
Generated by Foxit PDF Creator © Foxit Softwarehttp://www.foxitsoftware.com For evaluation only.

24
voter turnout, this study finds that household size is significantly and positively related to
percent voter turnout. Indeed, when we regress municipal income classification and mean
household size, we find that the relationship is significant and positive.
Source SS df MS Number of obs 1445
Model 69.98964 1 69.98964 F( 1, 1443) 39.36
Residual 2565.716 1443 1.778043 Prob > F 0
Total 2635.705 1444 1.825281 R-squared 0.0266
Adj R-squared 0.0259
Root MSE 1.3334
Municipal Income Classification Coef. Std. Err. t P>t [95% Conf. Interval]
Mean Household Size 0.530044 0.084482 6.27 0** 0.364322 0.695765
_cons 0.653322 0.431603 1.51 0.13 -0.19332 1.499958
The key is in how household size is calculated. It is important to distinguish that family
size is positively related to poverty, not household size. In the Philippine context, it is
very conceivable that more affluent households would be marked by larger household
size as those households would be inflated by live-in domestic helpers. An interesting
question for investigation beyond the scope of this study is the registration and voting
behavior of domestic workers.
Finally, religious membership has significant effects. Most interestingly, the
effect of percent Iglesia ni Kristo population is significant and negative. This outcome
points to two possible causal mechanisms: either 1) Iglesia ni Kristo members vote at a
rate lower than other Filipinos or, 2) the presence of an Iglesia ni Kristo population deters
other members of the community from voting. The first possible explanation would
further support the theory that the Iglesia heirarchy’s claim of electoral deciding power in
elections is overstated. The second possible explanation would further strengthen the
Iglesia’s claim. Currently, existing literature (Lande and Cuarteros) supports the former
Generated by Foxit PDF Creator © Foxit Softwarehttp://www.foxitsoftware.com For evaluation only.

25
claim, although more in-depth studies should be undertaken to understand the effect of an
Iglesia ni Kristo presence on a community.
The most immediate observation when analyzing Part B is the lack of congruency
between the socioeconomic groups identified in Part A and the results of Part B. In other
words, while there is evidence that socioeconomic factors have a special relationship with
voting behavior, we are unable to make a conclusion about the nature of this voting
behavior beyond turnout.3 The obvious question is: if communities with certain
demographic characteristics tend to vote more, where do their votes go?
We know that certain communities, notably those with more OFWs and higher
education levels, have higher voter turnout rates. Yet, we are not able to make a reliable
conclusion about how these communities vote and what kind of candidates they support.
The aforementioned theories that purport that communities with high rates of OFWs and
education are more likely to participate in the political process because they exhibit
higher levels of political awareness and consciousness. They would also be less
susceptible to voter intimidation, bribery, fraud, and other methods associated with
traditional politicians. However, does it necessarily follow that increased political
awareness is linked to a desire for progressive politicians or a change from traditional
politics? Political thinkers from the kalye to the classroom tend to assume that urban,
educated voters are the natural base for new entrants to politics and reform politicians.
The results of this study suggest that such intuition may not translate to the polling place.
3 It is significant to note that an earlier multiple regression test run with voter preference and socioeconomic data solely for Pampanga resulted in a significant, negative relationship between total barangay population and support for Panlilio and a significant, positive relationship between urban classification and support for Panlilio. This previous study used more specific data only available to the author for Pampanga. For the purposes of consistency in this study, Pampanga was subjected to the same data restraints as the other provinces. (see Lero “The 2007 Gubernatorial Election”)
Generated by Foxit PDF Creator © Foxit Softwarehttp://www.foxitsoftware.com For evaluation only.

26
This disconnect between socioeconomic factors’ effects on voter turnout and
voter preference may be a function of the way political campaigns continue to be run in
the Philippines. While there is an inclination for communities with certain demographic
characteristics to be more involved in the political process, candidates do not appeal to
these groups based on demographics. Instead, they continue the practices of working
through relatives and personal machinery. This study shows that those practices continue
to be effective. However, it also suggests that running campaigns in a way that targets
voters based on demographic characteristics could work. A useful follow-up to this study
would be a mapping voting behavior (responses to different campaign tactics and
messages) across demographic factors, not just geographic factors as is the norm. Those
seeking political change must look not only for new entrants, but for new ways of
conducting political exercises.
Generated by Foxit PDF Creator © Foxit Softwarehttp://www.foxitsoftware.com For evaluation only.

27
Appendix
Table 1: Percent Voter Turnout and Total Population4
Source SS df MS Number of obs 1602
Model 0.872621 1 0.872621 F( 1, 1600) 231.59
Residual 6.028697 1600 0.003768 Prob > F 0
Total 6.901317 1601 0.004311 R-squared 0.1264
Adj R-squared 0.1259
Root MSE 0.06138
Percent Voter Turnout Coef. Std. Err. t P>t [95% Conf. Interval]
Total Population -3.13E-07 2.06E-08 -15.22 0** -3.53E-07 -2.73E-07
_cons 0.827017 0.001817 455.17 0 0.823454 0.830581
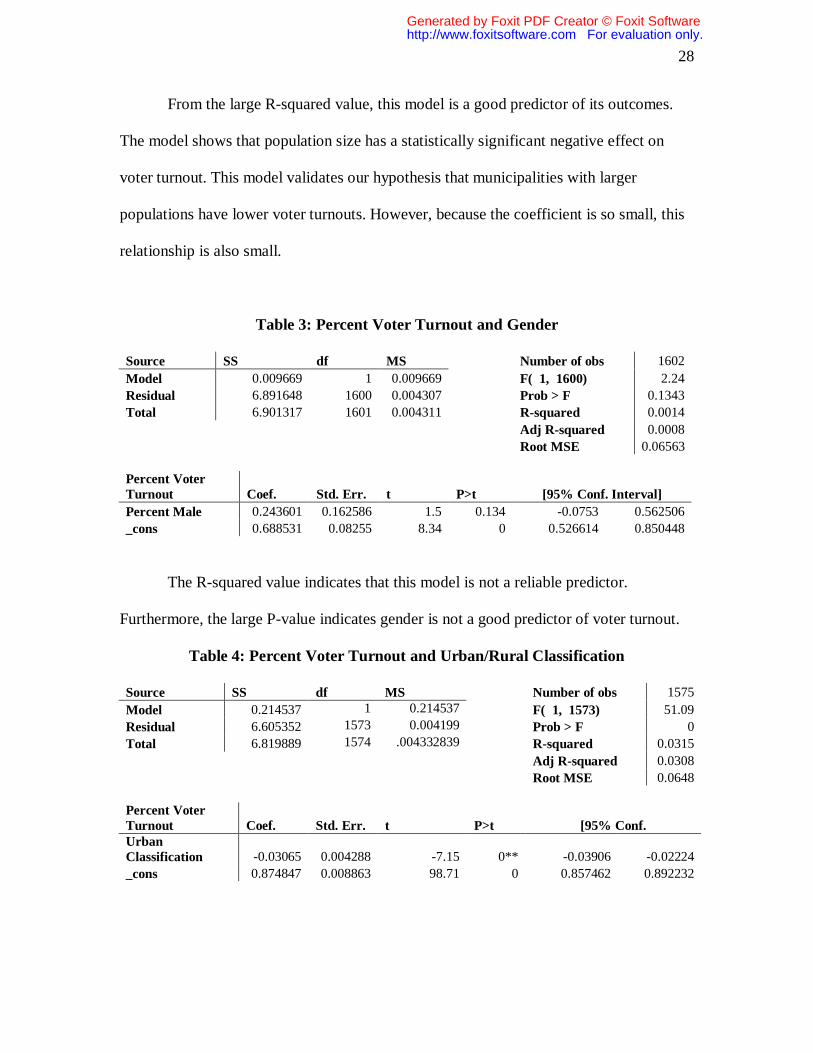
From the large R-squared value, this model is a good predictor of its outcomes.
The model shows that population size has a statistically significant negative effect on
voter turnout. This model validates our hypothesis that municipalities with larger
populations have lower voter turnouts. However, because the coefficient is so small, this
relationship is also small.
Table 2: Percent Voter Turnout and Voting Age Population
Source SS df MS Number of obs 1602
Model 0.852057 1 0.852057 F( 1, 1600) 225.36
Residual 6.04926 1600 0.003781 Prob > F 0
Total 6.901317 1601 0.004311 R-squared 0.1235
Adj R-squared 0.1229
Root MSE 0.06149
Percent Voter Turnout Coef. Std. Err. t P>t [95% Conf. Interval] Total Voting Age Population -5.07E-07 3.38E-08 -15.01 0** -5.73E-07 -4.41E-07
_cons 0.825701 0.001781 463.76 0 0.822208 0.829193
4 For all tables: * indicates significant at .05 level
** indicates significant at .01 level
Generated by Foxit PDF Creator © Foxit Softwarehttp://www.foxitsoftware.com For evaluation only.
28
From the large R-squared value, this model is a good predictor of its outcomes.
The model shows that population size has a statistically significant negative effect on
voter turnout. This model validates our hypothesis that municipalities with larger
populations have lower voter turnouts. However, because the coefficient is so small, this
relationship is also small.
Table 3: Percent Voter Turnout and Gender
Source SS df MS Number of obs 1602
Model 0.009669 1 0.009669 F( 1, 1600) 2.24
Residual 6.891648 1600 0.004307 Prob > F 0.1343
Total 6.901317 1601 0.004311 R-squared 0.0014
Adj R-squared 0.0008
Root MSE 0.06563
Percent Voter Turnout Coef. Std. Err. t P>t [95% Conf. Interval]
Percent Male 0.243601 0.162586 1.5 0.134 -0.0753 0.562506
_cons 0.688531 0.08255 8.34 0 0.526614 0.850448
The R-squared value indicates that this model is not a reliable predictor.
Furthermore, the large P-value indicates gender is not a good predictor of voter turnout.
Table 4: Percent Voter Turnout and Urban/Rural Classification
Source SS df MS Number of obs 1575
Model 0.214537 1 0.214537 F( 1, 1573) 51.09
Residual 6.605352 1573 0.004199 Prob > F 0
Total 6.819889 1574 .004332839 R-squared 0.0315
Adj R-squared 0.0308
Root MSE 0.0648
Percent Voter Turnout Coef. Std. Err. t P>t [95% Conf. Urban Classification -0.03065 0.004288 -7.15 0** -0.03906 -0.02224
_cons 0.874847 0.008863 98.71 0 0.857462 0.892232
Generated by Foxit PDF Creator © Foxit Softwarehttp://www.foxitsoftware.com For evaluation only.

29
The R-squared value indicates that this model is a questionable predictor of its
outcomes. The small P-value and negative coefficient indicate urban classification has a
statistically significant, negative relationship with voter turnout, confirming our
hypothesis that urban municipalities tend to have lower voter turnout.
Table 5: Percent Voter Turnout and Municipal Income Class
Source SS df MS Number of obs 1440
Model 0.831859 1 0.831859 F( 1, 1438) 240.53
Residual 4.97333 1438 0.003459 Prob > F 0
Total 5.805189 1439 0.004034 R-squared 0.1433
Adj R-squared 0.1427
Root MSE 0.05881
Percent Voter Turnout Coef. Std. Err. t P>t [95% Conf. Interval] Municipal Income Class 0.017804 0.001148 15.51 0** 0.015552 0.020056
_cons 0.752808 0.004148 181.49 0 0.744672 0.760944
The R-squared value indicates that this model is an acceptable predictor of its
outcomes. The small P-value and positive coefficient indicate municipal income class has
a statistically significant, positive relationship with voter turnout. This outcome indicates
municipalities of higher income classes also have higher voter turnout rates and rejects
our hypothesis that municipalities of higher income classes have lower voter turnouts.
Table 6: Percent Voter Turnout and Education
Source SS df MS Number of obs 1602
Model 0.000328 1 0.000328 F( 1, 1600) 0.08
Residual 6.900989 1600 0.004313 Prob > F 0.7827
Total 6.901317 1601 0.004311 R-squared 0
Adj R-squared -0.0006
Root MSE 0.06567
Percent Voter Turnout Coef. Std. Err. t P>t [95% Conf. Interval] Mean Education Level Completed 0.00126 0.004567 0.28 0.783 -0.0077 0.010218
_cons 0.807839 0.015858 50.94 0 0.776735 0.838944
Generated by Foxit PDF Creator © Foxit Softwarehttp://www.foxitsoftware.com For evaluation only.

30
The small R-squared value indicates that this model is not a good predictor of its
outcomes. Furthermore, the large P-value indicates the relationship between education
level completed and voter turnout is not statistically significant.
Table 7: Percent Voter Turnout and Age
Source SS df MS Number of obs 1602
Model 0.415491 1 0.415491 F( 1, 1600) 102.5
Residual 6.485826 1600 0.004054 Prob > F 0
Total 6.901317 1601 0.004311 R-squared 0.0602
Adj R-squared 0.0596
Root MSE 0.06367
Percent Voter Turnout Coef. Std. Err. t P>t [95% Conf. Interval]
Mean Age 0.008266 0.000817 10.12 0** 0.006665 0.009868
_cons 0.607102 0.02032 29.88 0 0.567246 0.646958
The R-squared value indicates that this model is a questionable predictor of its
outcomes. The small P-value and positive coefficient indicate that age has a statistically
significant, positive relationship with voter turnout, confirming our hypothesis that
municipalities with higher mean ages will also have higher voter turnout rates.
Table 8: Percent Voter Turnout and Overseas Filipino Workers
Source SS df MS Number of obs 1602
Model 0.130495 1 0.130495 F( 1, 1600) 30.84
Residual 6.770822 1600 0.004232 Prob > F 0
Total 6.901317 1601 0.004311 R-squared 0.0189
Adj R-squared 0.0183
Root MSE 0.06505
Percent Voter Turnout Coef. Std. Err. t P>t [95% Conf. Interval]
Percent OFW 0.910386 0.163942 5.55 0** 0.588823 1.231949
_cons 0.800939 0.002597 308.36 0 0.795844 0.806033
The R-squared value indicates that this model is a questionable predictor of its
outcomes. The small P-value and positive coefficient indicate that percent overseas
Generated by Foxit PDF Creator © Foxit Softwarehttp://www.foxitsoftware.com For evaluation only.
31
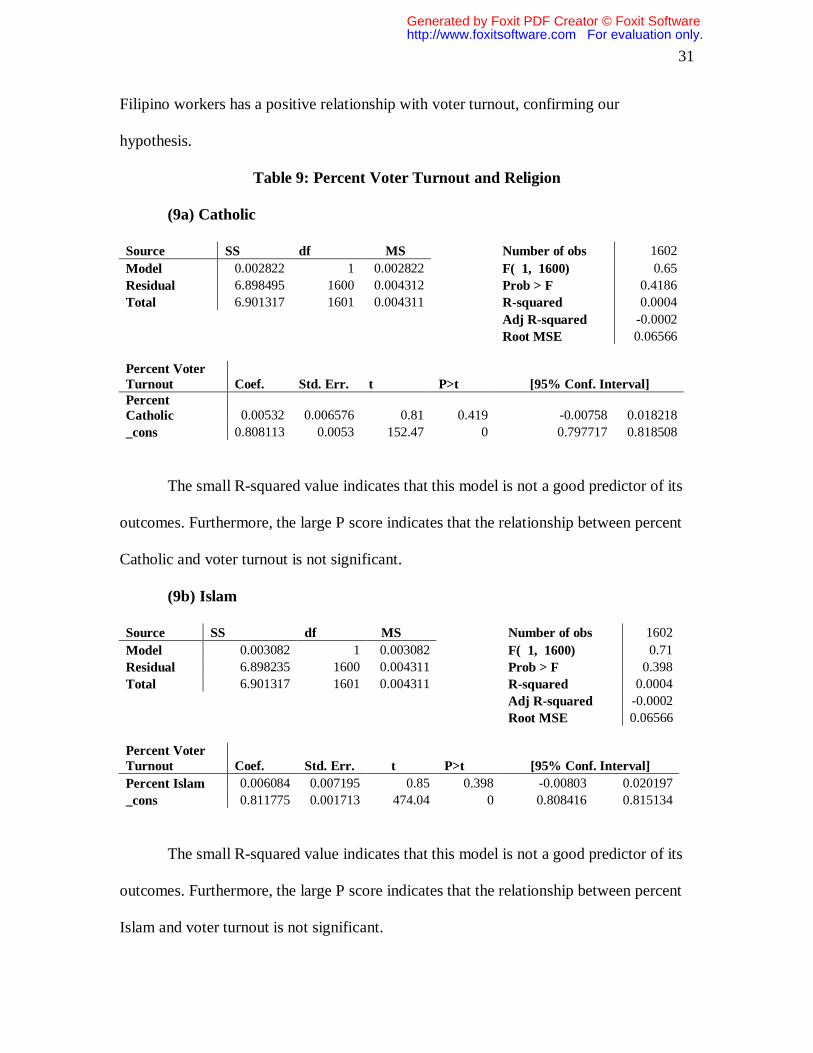
Filipino workers has a positive relationship with voter turnout, confirming our
hypothesis.
Table 9: Percent Voter Turnout and Religion
(9a) Catholic
Source SS df MS Number of obs 1602
Model 0.002822 1 0.002822 F( 1, 1600) 0.65
Residual 6.898495 1600 0.004312 Prob > F 0.4186
Total 6.901317 1601 0.004311 R-squared 0.0004
Adj R-squared -0.0002
Root MSE 0.06566
Percent Voter Turnout Coef. Std. Err. t P>t [95% Conf. Interval] Percent Catholic 0.00532 0.006576 0.81 0.419 -0.00758 0.018218
_cons 0.808113 0.0053 152.47 0 0.797717 0.818508
The small R-squared value indicates that this model is not a good predictor of its
outcomes. Furthermore, the large P score indicates that the relationship between percent
Catholic and voter turnout is not significant.
(9b) Islam
Source SS df MS Number of obs 1602
Model 0.003082 1 0.003082 F( 1, 1600) 0.71
Residual 6.898235 1600 0.004311 Prob > F 0.398
Total 6.901317 1601 0.004311 R-squared 0.0004
Adj R-squared -0.0002
Root MSE 0.06566
Percent Voter Turnout Coef. Std. Err. t P>t [95% Conf. Interval]
Percent Islam 0.006084 0.007195 0.85 0.398 -0.00803 0.020197
_cons 0.811775 0.001713 474.04 0 0.808416 0.815134
The small R-squared value indicates that this model is not a good predictor of its
outcomes. Furthermore, the large P score indicates that the relationship between percent
Islam and voter turnout is not significant.
Generated by Foxit PDF Creator © Foxit Softwarehttp://www.foxitsoftware.com For evaluation only.

32
(9c) Iglesia ni Kristo
Source SS df MS Number of obs 1602
Model 0.148619 1 0.148619 F( 1, 1600) 35.21
Residual 6.752698 1600 0.00422 Prob > F 0
Total 6.901317 1601 0.004311 R-squared 0.0215
Adj R-squared 0.0209
Root MSE 0.06496
Percent Voter Turnout Coef. Std. Err. t P>t [95% Conf. Interval]
Percent INK -0.46481 .0783286 -5.93 0** -0.61845 -0.31118
_cons 0.82147 .0022539 364.47 0 0.817049 0.825891
The small R-squared value indicates that this model is not a good predictor of its
outcomes. The small P-score and negative coefficient indicate that the relationship
between percent Iglesia ni Kristo and voter turnout is significant and negative. In other
words, municipalities with a high percentage of Iglesia ni Kristo members are likely to
have lower voter turnouts.
(9d) Jesus is Lord Movement
Source SS df MS Number of obs 1602
Model 0.011341 1 0.011341 F( 1, 1600) 2.63
Residual 6.889976 1600 0.004306 Prob > F 0.1048
Total 6.901317 1601 0.004311 R-squared 0.0016
Adj R-squared 0.001
Root MSE 0.06562
Percent Voter Turnout Coef. Std. Err. t P>t [95% Conf. Interval]
Percent JIL -0.91351 0.562908 -1.62 0.105 -2.01763 0.190602
_cons 0.813208 0.001756 463.24 0 0.809765 0.816651
Generated by Foxit PDF Creator © Foxit Softwarehttp://www.foxitsoftware.com For evaluation only.
33
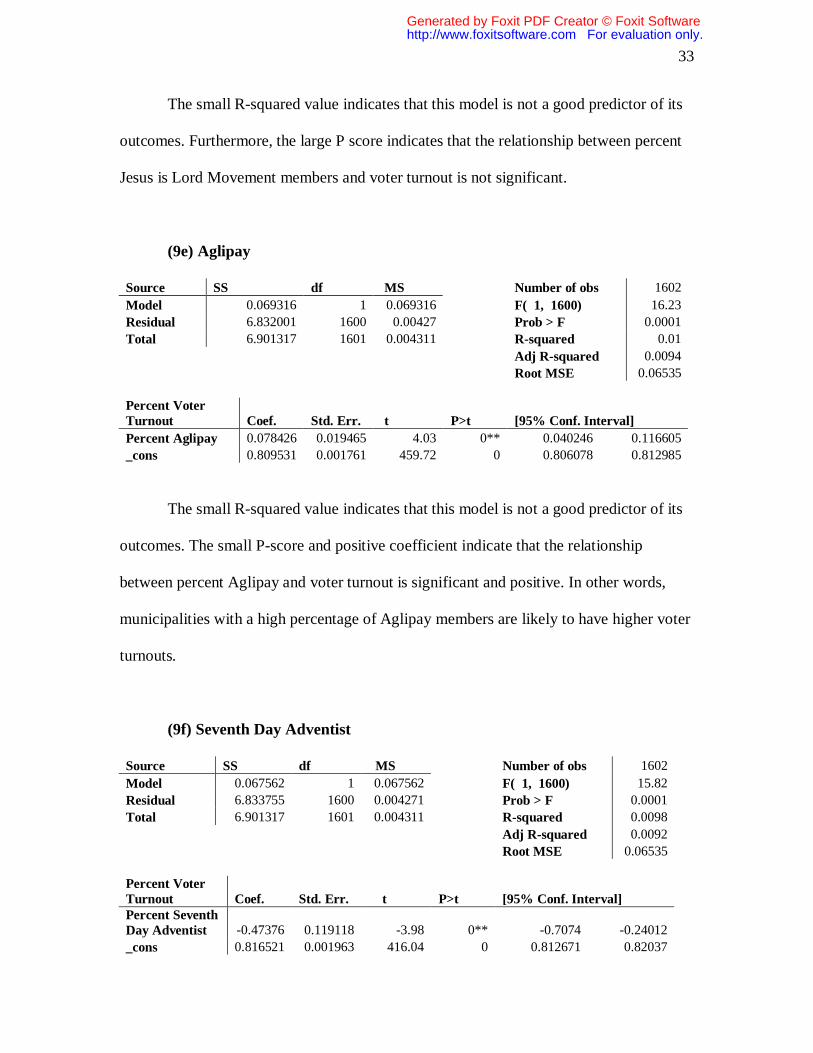
The small R-squared value indicates that this model is not a good predictor of its
outcomes. Furthermore, the large P score indicates that the relationship between percent
Jesus is Lord Movement members and voter turnout is not significant.
(9e) Aglipay
Source SS df MS Number of obs 1602
Model 0.069316 1 0.069316 F( 1, 1600) 16.23
Residual 6.832001 1600 0.00427 Prob > F 0.0001
Total 6.901317 1601 0.004311 R-squared 0.01
Adj R-squared 0.0094
Root MSE 0.06535
Percent Voter Turnout Coef. Std. Err. t P>t [95% Conf. Interval]
Percent Aglipay 0.078426 0.019465 4.03 0** 0.040246 0.116605
_cons 0.809531 0.001761 459.72 0 0.806078 0.812985
The small R-squared value indicates that this model is not a good predictor of its
outcomes. The small P-score and positive coefficient indicate that the relationship
between percent Aglipay and voter turnout is significant and positive. In other words,
municipalities with a high percentage of Aglipay members are likely to have higher voter
turnouts.
(9f) Seventh Day Adventist
Source SS df MS Number of obs 1602
Model 0.067562 1 0.067562 F( 1, 1600) 15.82
Residual 6.833755 1600 0.004271 Prob > F 0.0001
Total 6.901317 1601 0.004311 R-squared 0.0098
Adj R-squared 0.0092
Root MSE 0.06535
Percent Voter Turnout Coef. Std. Err. t P>t [95% Conf. Interval] Percent Seventh Day Adventist -0.47376 0.119118 -3.98 0** -0.7074 -0.24012
_cons 0.816521 0.001963 416.04 0 0.812671 0.82037
Generated by Foxit PDF Creator © Foxit Softwarehttp://www.foxitsoftware.com For evaluation only.

34
The small R-squared value indicates that this model is not a good predictor of its
outcomes. The small P-score and negative coefficient indicate that the relationship
between percent Seventh Day Adventist and voter turnout is significant and negative. In
other words, municipalities with a high percentage of Seventh Day Adventist members
are likely to have lower voter turnouts.
(9g) United Church of Christ
Source SS df MS Number of obs 1602
Model 0.02359 1 0.02359 F( 1, 1600) 5.49
Residual 6.877727 1600 0.004299 Prob > F 0.0193
Total 6.901317 1601 0.004311 R-squared 0.0034
Adj R-squared 0.0028
Root MSE 0.06556
Percent Voter Turnout Coef. Std. Err. t P>t [95% Conf. Interval] Percent United Church 0.129842 0.055425 2.34 0.019* 0.021128 0.238556
_cons 0.810958 0.00172 471.39 0 0.807584 0.814333
The small R-squared value indicates that this model is not a good predictor of its
outcomes. The small P-score and positive coefficient indicate that the relationship
between percent United Church of Christ and voter turnout is significant and positive. In
other words, municipalities with a high percentage of United Church of Christ members
are likely to have higher voter turnouts.
Table 10: Percent Voter Turnout and Marital Status
Source SS df MS Number of obs 1602
Model 0.000257 1 0.000257 F( 1, 1600) 0.06
Residual 6.901061 1600 0.004313 Prob > F 0.8073
Total 6.901317 1601 0.004311 R-squared 0
Adj R-squared -0.0006
Root MSE 0.06567
Percent Voter Coef. Std. Err. t P>t [95% Conf. Interval]
Generated by Foxit PDF Creator © Foxit Softwarehttp://www.foxitsoftware.com For evaluation only.

35
Turnout
Marital Status 0.00229 .0093883 0.24 0.807 -0.01612 0.020705
_cons 0.80646 .0235474 34.25 0 0.760273 0.852647
The small R-squared value indicates that this model is not a good predictor of its
outcomes. Furthermore, the large P-value indicates the relationship between education
level completed and voter turnout is not statistically significant.
Table 11: Percent Voter Turnout and Household Size
Source SS df MS Number of obs 1601
Model 0.10804 1 0.10804 F( 1, 1599) 25.45
Residual 6.78722 1599 0.004245 Prob > F 0
Total 6.895259 1600 0.00431 R-squared 0.0157
Adj R-squared 0.0151
Root MSE 0.06515
Percent Voter Turnout Coef. Std. Err. t P>t [95% Conf. Interval] Mean Household Size 0.019261 0.003818 5.05 0** 0.011772 0.026749
_cons 0.713781 0.019564 36.48 0 0.675406 0.752155
The R-squared value indicates this model is not a good predictor of its outcomes.
The small P-value and positive coefficient indicate that there is a statistically significant,
positive correlation between mean household size and voter turnout, supporting our
hypothesis that higher mean household size is related to higher voter turnout.
Table 12: Percent Voter Turnout and Socioeconomic Variables
Source SS df MS Number of obs 1422
Model 1.738727 17 0.102278 F( 17, 1404) 35.62
Residual 4.030833 1404 0.002871 Prob > F 0
Total 5.76956 1421 0.00406 R-squared 0.3014
Adj R-squared 0.2929
Root MSE 0.05358
Percent Voter Turnout Coef. Std. Err. t P>t [95% Conf. Interval]
Total Population 6.59E-08 1.42E-07 0.47 0.642 -2.12E-07 3.44E-07
Generated by Foxit PDF Creator © Foxit Softwarehttp://www.foxitsoftware.com For evaluation only.

36
Total Voting Age Population -4.43E-07 2.31E-07 -1.92 0.055 -8.96E-07 9.39E-09
Percent Male 0.350057 0.199224 1.76 0.079 -0.04075 0.740867 Urban Classification -0.01112 0.004581 -2.43 0.015* -0.02011 -0.00214 Municipal Income Classification 0.007876 0.001311 6.01 0** 0.005305 0.010447 Mean Education Level Completed 0.014749 0.006904 2.14 0.033* 0.001206 0.028291
Mean Age 0.006713 0.001287 5.22 0** 0.004188 0.009238
Percent OFW 0.51331 0.181031 2.84 0.005** 0.158189 0.868431
Percent Catholic 0.074564 0.014853 5.02 0** 0.045427 0.103701
Percent Islam 0.057276 0.018492 3.10 0.002** 0.021002 0.09355
Percent INK -0.27034 0.079807 -3.39 0.001** -0.4269 -0.11379
Percent JIL 0.627753 0.493531 1.27 0.204 -0.34039 1.595891
Percent Aglipay 0.101627 0.023324 4.36 0** 0.055872 0.147381 Percent Seventh Day Adventist -0.09241 0.119123 -0.78 0.438 -0.32609 0.141264 Percent United Church of Christ 0.159271 0.053171 3.00 0.003** 0.054968 0.263573 Mean Marital Status 0.00244 0.009147 0.27 0.79 -0.0155 0.020384 Mean Household Size 0.024239 0.005305 4.57 0** 0.013834 0.034645
_cons 0.224442 0.121953 1.84 0.066 -0.01479 0.463671
The large R-squared value indicates that this model is a good predictor of its
outcomes. When all the identified socioeconomic variables are run together and allowed
to control each other, population is no longer statistically significant, percent male
remains statistically insignificant, urban classification remains significant and negative,
municipal income classification remains positive and significant, education goes from
insignificant to significant and positive, mean age remains significant and positive,
percent OFW remains significant and positive, percent Catholic goes from insignificant
to significant and positive, percent Islam goes from insignificant to significant and
positive, percent Iglesia ni Kristo remains significant and negative, percent Jesus is Lord
remains insignificant, percent Aglipay remains significant and positive, Seventh Day
Adventist goes from significant and positive to insignificant, percent United Church of
Generated by Foxit PDF Creator © Foxit Softwarehttp://www.foxitsoftware.com For evaluation only.

37
Christ remains significant and positive, marital status remains insignificant, and mean
household size remains significant and positive.
Table 13: Percent Support for Panlilio and Socioeconomic Variables Source SS df MS Number of obs 438
Model 4351.402 16 271.962643 F( 16, 421) 0.75
Residual 153304.9 421 364.144705 Prob > F 0.7455
Total 157656.3 437 360.769618 R-squared 0.0276
Adj R-squared -0.0094
Root MSE 19.083
Percent Support for Panlilio Coef. Std. Err. t P>t [95% Conf. Interval]
Total Population -0.00224 0.0056736 -0.4 0.693 -0.01339 0.00891 Total Voting Age Population 0.00366 .0095959 0.38 0.703 -0.0152 0.022521
Percent Male -53.2481 68.42421 -0.78 0.437 -187.744 81.24752 Urban Classification 0.918993 1.105402 0.83 0.406 -1.2538 3.091787 Municipal Income Classification -2.92679 4.470219 -0.65 0.513 -11.7135 5.859936 Mean Education Level Completed 1.427836 .9531601 1.50 0.135 -0.44571 3.301382
Mean Age -88.5935 79.07871 -1.12 0.263 -244.032 66.84475
Percent OFW 10.21281 15.98083 0.64 0.523 -21.1993 41.62497
Percent Catholic -48.188 430.7284 -0.11 0.911 -894.834 798.4581
Percent Islam 4.677616 23.44089 0.20 0.842 -41.3982 50.75338
Percent INK -5.28017 117.4863 -0.04 0.964 -236.213 225.6527
Percent JIL 5.332836 21.03325 0.25 0.8 -36.0104 46.6761
Percent Aglipay 7.519252 40.86433 0.18 0.854 -72.8043 87.84278 Percent Seventh Day Adventist 9.562064 52.74041 0.18 0.856 -94.1053 113.2294 Percent United Church of Christ 1.555719 11.08953 0.14 0.889 -20.242 23.35347 Mean Marital Status 4.944337 2.577719 1.92 0.056 -0.12247 10.01114 Mean Household Size -38.496 53.92028 -0.71 0.476 -144.483 67.49051
Generated by Foxit PDF Creator © Foxit Softwarehttp://www.foxitsoftware.com For evaluation only.

Many thanks to the Institute for Popular Democracy, especially Gladstone Cuarteros, Patrick Patiño and Joel Rocamora of the Political Reform team, Orville Tatco and Lambert Ramirez of the National Institute for Policy Studies, the staff at Liberal Party headquarters, Nina Lucia and Archie Reyes and Gov. Ed Panlilio of the office of Gov. Panlilio, Roy Loredo of Pepe, and Ginno Jaralve, Michael Rico and Lester John Lomeda for their assistance with the data.
Table 14: Percent Support for Espino and Socioeconomic Variables
Source SS df MS Number of obs 90
Model 1.430469 16 0.08940433 F( 16, 73) 0.89
Residual 7.371537 73 0.100979958 Prob > F 0.5878
Total 8.802006 89 0.098898946 R-squared 0.1625
Adj R-squared -0.021
Root MSE 0.31777
Percent Support for Espino Coef. Std. Err. t P>t [95% Conf. Interval]
Total Population -0.00066 .0007507 -0.87 0.386 -0.00215 0.000841 Total Voting Age Population 0.001255 .0013411 0.94 0.353 -0.00142 0.003928
Percent Male 1.782025 1.764286 1.01 0.316 -1.73419 5.298242 Urban Classification -0.00743 .0409905 -0.18 0.857 -0.08913 0.07426 Municipal Income Classification 0.103338 .1479594 0.70 0.487 -0.19155 0.39822 Mean Education Level Completed -0.06246 .0478561 -1.31 0.196 -0.15783 0.03292
Mean Age -3.32994 4.233373 -0.79 0.434 -11.767 5.107166
Percent OFW 0.489207 1.030644 0.47 0.636 -1.56486 2.543279
Percent Catholic 7.68571 5.580699 1.38 0.173 -3.43661 18.80803
Percent Islam -1.56341 1.659615 -0.94 0.349 -4.87102 1.744197
Percent INK 11.69197 6.749315 1.73 0.087 -1.7594 25.14334
Percent JIL -0.07509 1.083447 -0.07 0.945 -2.2344 2.084218
Percent Aglipay 2.56431 3.94896 0.65 0.518 -5.30596 10.43458 Percent Seventh Day Adventist -2.2272 20.61702 -0.11 0.914 -43.3169 38.86247 Percent United Church of Christ 0.279938 .3409673 0.82 0.414 -0.39961 0.959485 Mean Marital Status 0.005231 .1088158 0.05 0.962 -0.21164 0.222101 Mean Household Size 6.405349 6.247776 1.03 0.309 -6.04645 18.85715
Generated by Foxit PDF Creator © Foxit Softwarehttp://www.foxitsoftware.com For evaluation only.

Many thanks to the Institute for Popular Democracy, especially Gladstone Cuarteros, Patrick Patiño and Joel Rocamora of the Political Reform team, Orville Tatco and Lambert Ramirez of the National Institute for Policy Studies, the staff at Liberal Party headquarters, Nina Lucia and Archie Reyes and Gov. Ed Panlilio of the office of Gov. Panlilio, Roy Loredo of Pepe, and Ginno Jaralve, Michael Rico and Lester John Lomeda for their assistance with the data.
Table 15: Percent Support for Ortega and Socioeconomic Variables Source SS df MS Number of obs 152
Model 1.416722 16 .088545126 F( 16, 135) 1.36
Residual 8.789739 135 .065109179 Prob > F 0.1711
Total 10.20646 151 .067592458 R-squared 0.1388
Adj R-squared 0.0367
Root MSE 0.25517
Percent Support for Ortega Coef. Std. Err. t P>t [95% Conf. Interval]
Total Population -0.0002 .0005646 -0.36 0.718 -0.00132 0.000913 Total Voting Age Population 0.00011 .0009586 0.11 0.909 -0.00179 0.002006
Percent Male -1.0481 1.375745 -0.76 0.447 -3.7689 1.6727 Urban Classification -0.03016 .0793005 -0.38 0.704 -0.18699 0.126672 Municipal Income Classification 0.037663 .0951778 0.40 0.693 -0.15057 0.225896 Mean Education Level Completed 0.013517 .025587 0.53 0.598 -0.03709 0.06412
Mean Age 0.240655 2.183249 0.11 0.912 -4.07714 4.558449
Percent OFW -0.12024 .1836855 -0.65 0.514 -0.48352 0.243031
Percent Catholic 4.300177 6.611998 0.65 0.517 -8.77632 17.37667
Percent Islam -1.30689 1.009996 -1.29 0.198 -3.30436 0.690568
Percent INK -4.10618 3.718055 -1.10 0.271 -11.4594 3.246987
Percent JIL 20.71293 48.20737 0.43 0.668 -74.6264 116.0523
Percent Aglipay -3.47252 5.848193 -0.59 0.554 -15.0385 8.093403 Percent Seventh Day Adventist -0.21659 .7355662 -0.29 0.769 -1.67131 1.238136 Percent United Church of Christ -0.02524 .2998857 -0.08 0.933 -0.61832 0.567842 Mean Marital Status 0.092505 .0693821 1.33 0.185 -0.04471 0.229721 Mean Household Size 0.744435 1.366535 0.54 0.587 -1.95815 3.447021
Generated by Foxit PDF Creator © Foxit Softwarehttp://www.foxitsoftware.com For evaluation only.

Many thanks to the Institute for Popular Democracy, especially Gladstone Cuarteros, Patrick Patiño and Joel Rocamora of the Political Reform team, Orville Tatco and Lambert Ramirez of the National Institute for Policy Studies, the staff at Liberal Party headquarters, Nina Lucia and Archie Reyes and Gov. Ed Panlilio of the office of Gov. Panlilio, Roy Loredo of Pepe, and Ginno Jaralve, Michael Rico and Lester John Lomeda for their assistance with the data.
Table 16: Percent Support for Tupas and Socioeconoic variables Source SS df MS Number of obs 104
Model 0.783612 16 .048975729 F( 16, 87) 2.1
Residual 2.026293 87 .02329072 Prob > F 0.015
Total 2.809904 103 .027280625 R-squared 0.2789
Adj R-squared 0.1463
Root MSE 0.15261
PercTupas Coef. Std. Err. t P>t [95% Conf. Interval]
Total Population 7.61E-05 .0005181 0.15 0.884 -0.00095 0.001106 Total Voting Age Population -0.0001 .000875 -0.12 0.907 -0.00184 0.001636
Percent Male -0.13153 .5796233 -0.23 0.821 -1.2836 1.020533 Urban Classification 0.061667 .0345452 1.79 0.078 -0.00699 0.13033 Municipal Income Classification 0.090221 .0856308 1.05 0.295 -0.07998 0.260422 Mean Education Level Completed -0.02501 .0108488 -2.31 0.024* -0.04658 -0.00345
Mean Age 0.35462 1.753145 0.20 0.84 -3.12995 3.839185
Percent OFW -0.02362 .0746581 -0.32 0.752 -0.17201 0.124771
Percent Catholic -19.3049 60.81887 -0.32 0.752 -140.189 101.5792
Percent Islam -8.11208 4.417967 -1.84 0.07 -16.8933 0.669104
Percent INK 30.01595 46.13773 0.65 0.517 -61.6878 121.7197
Percent JIL 5.257923 9.413481 0.56 0.578 -13.4524 23.96824
Percent Aglipay -4.91536 5.011579 -0.98 0.329 -14.8764 5.045698 Percent Seventh Day Adventist 0.346984 .1884078 1.84 0.069 -0.0275 0.721465 Percent United Church of Christ 0.118566 .1603102 0.74 0.462 -0.20007 0.4372 Mean Marital Status -0.01835 .0405784 -0.45 0.652 -0.099 0.062305 Mean Household Size 0.847917 .8015891 1.06 0.293 -0.74533 2.441162
Generated by Foxit PDF Creator © Foxit Softwarehttp://www.foxitsoftware.com For evaluation only.

41
Works Cited ABS-CBN/SWS. “Day of Election Survey.” 22 May 2001. Social Weather Stations. 14 May 2008 <http://www.sws.org.ph/exit01/ex01rpts.htm>. Bartlett, James, Joe W. Kotrlik and Chadwick Higgins. “Organizational Research: Determining Appropriate Sample Size in Survey Research.” Information Technology, Learning, and Performance Journal 19.1 (2001). Blakely, Tony A., Bruce P. Kennedy and Ichiro Kawachi. “Socioeconomic Inequality in Voting Participation and Self-Rated Health.” American Journal of Public Health. 91.1 (2001) Cardinoza, Gabriel. “Agbayani Magic Fades in Pangasinan.” Inquirer. 23 May 2007. Available at <http://newsinfo.inquirer.net/inquirerheadlines/regions/ view_article.php?article_id=67438>. Cassel, Carol A. “Hispanic Turnout: Estimated from Validated Voting Data.” Political Research Quarterly. 55.2 (2002): 405. “Census 2000 Starts Today.” Philippine Star. 1 May 2000. Available on census website: <http://www.census.gov.ph/census2000/prtoday.html>. Cervantes, Ding. “P3 B in lahar sand quarry income lost under Lapids?” Philippine Star. July 7, 2007. Cuarteros, Gladstone. “Gubernatorial Candidates 2007 and Winners: Clan Profile and Classification.” Institute for Popular Democracy internal document. October 2007. Department of Finance Order No. 20-05. “Income Classification for Provinces, Cities and Municipalities.” 29 July 2005. National Statistical Coordination Board website. 21 February 2008. <http://www.nscb.gov.ph/activestats/psgc/articles /con_income.asp>. Franco, Jennifer C. Campaigning For Democracy: Grassroots Citizenship Movements, Less- than-Democratic Elections, and Regime Transition in the Philippines. Quezon City: Institute for Popular Democracy, 2000. Galvez, Manny. “Joson’s reign in NE ends.” Philippine Star. 19 May 2007. Available at <http://www.abs-cbnnews.com/storypage.aspx?StoryId=77727>. Gumabong, Rodolfo P. “Battle of Titans in Iloilo.” News Today. 16 April 2007. Available at <http://www.thenewstoday.info/2007/04/16/battle.of.titans.in.iloilo.html>
Generated by Foxit PDF Creator © Foxit Softwarehttp://www.foxitsoftware.com For evaluation only.

42
Lande, Carl. Post-Marcos Politics: A Geographical and Statistical Analysis of the 1992 Presidential Election. New York: St. Martin’s Press.1991. Lero, Cecilia. “The 2007 Gubernatorial Election in Pampanga – Election Forensics.” Paper presented at the Institute for Popular Democracy, Quezon City, Philippines. 17 October 2007. Also as “Breaking Monopolies of Local Power – Election Forensics in Pampanga.” Paper presented at the 2008 International Conference of the Philippine Political Science Association, Dumaguete City, Philippines. 11-12 April 2008. Lero, Cecilia. “Report of the Pampanga Team of the COMPACT International Observer Mission.” Internal COMPACT Report. May 2007. Available at <http://cecidasupastar.files.wordpress.com/2007/06/report-of-the-pampanga-team.pdf>. Makabenta, Leah P. “12 Ortegas Running in May.” Inquirer. 23 April 2004. Available at <http://asianfanatics.net/forum/lofiversion/index.php/t11950.html> Mendoza, Oliver. “The Last of the Old School Politicians.”Weblog entry. Iloilo City Boy. 29 January 2007. 16 May 2008. <http://iloilocityboy.blogspot.com/2007/01/last-of-old-school-politicians.html>. Orbeta, Ancieto C. “Population, Poverty and Development: Review and Research Gaps.” 11 May 2003. Philippine Institute for Development Studies. 21 February 2008. <dirp3.pids.gov.ph/population/documents/Population%20Poverty%20and%20Development.ppt>. NSCB Resolution No. 11. “Approving and Adopting the Official Concepts and Definitions for Statistical Purposes of the Selected Sectors: Prices, Population, Housing and Tourism.” Available at < http://www.nscb.gov.ph/resolutions/2003/11Annex.asp>. National Statistics Office. “Technical Notes on the 2000 Census of Population and Housing.” 6 January 2005. National Statistics Office. 15 January 2008. <http://www.census.gov.ph/data/technotes/notecph00.html>. Robles, Nelson C. “The Persecution of Gov. Neil D. Tupas.” News Today. 17 January 2007. Available at <http://www.thenewstoday.info/2007/01/17/ the.persecution.of.gov.niel.d.tupas.html>. The Standards and Classification Division Programs, Policies and Standards Office. “A Statistical Analysis of Voters’ Registration and Participation” 8 May 2004. National Statistics Coordination Board. 5 February 2008. <http://www.nscb.gov.ph/ statseries/04/SS-200405-PP2-01.asp>. Statistics Division, Department of Economic and Social Affairs, United Nations Secretariat. “The Philippines Census 2000.” Symposium on Global Review of 2000 Round of Population and Housing Censuses. New York, 1-10 August 2001. Available at
Generated by Foxit PDF Creator © Foxit Softwarehttp://www.foxitsoftware.com For evaluation only.

43
<http://unstats.un.org/unsd/demographic/meetings/egm/Symposium2001/docs/symposium_16.htm>. Ulhaner, Carole J., Bruce E. Cain and D. Roderick Kiewiet. “Political Participation of Ethnic Minorities in the 1980s.” Political Behavior. (1989) 11:195-232 Verba, Sidney, Kay Lehman Schlozman and Henry E. Brady. Voice and Equality: Civil Voluntarism in American Politics. Cambridge, Massachusetts: Harvard University Press. 1995.
Generated by Foxit PDF Creator © Foxit Softwarehttp://www.foxitsoftware.com For evaluation only.