Embed Size (px)
Citation preview
DOI 10.1140/epje/i2013-13068-1
Regular Article
Eur. Phys. J. E (2013) 36: 68 THE EUROPEANPHYSICAL JOURNAL E
Elasticity of DNA and the effect of dendrimer binding
Santosh Mogurampelly1,a, Bidisha Nandy1, Roland R. Netz2, and Prabal K. Maiti1
1 Centre for Condensed Matter Theory, Department of Physics, Indian Institute of Science, Bangalore 560012, India2 Fachbereich Physik, Freie Universitat Berlin, 14195 Berlin, Germany
Received 4 September 2012 and Received in final form 15 April 2013Published online: 28 June 2013 – c© EDP Sciences / Societa Italiana di Fisica / Springer-Verlag 2013
Abstract. Negatively charged DNA can be compacted by positively charged dendrimers and the degreeof compaction is a delicate balance between the strength of the electrostatic interaction and the elasticityof DNA. We report various elastic properties of short double-stranded DNA (dsDNA) and the effect ofdendrimer binding using fully atomistic molecular dynamics and numerical simulations. In equilibrium atroom temperature, the contour length distribution P (L) and the end-to-end distance distribution P (R)are nearly Gaussian, the former gives an estimate of the stretch modulus γ1 of dsDNA in quantitativeagreement with the literature value. The bend angle distribution P (θ) of the dsDNA also has a Gaussianform and allows to extract a persistence length, Lp of 43 nm. When the dsDNA is compacted by positivelycharged dendrimer, the stretch modulus stays invariant but the effective bending rigidity estimated from theend-to-end distance distribution decreases dramatically due to backbone charge neutralization of dsDNAby dendrimer. We support our observations with numerical solutions of the worm-like-chain (WLC) modelas well as using non-equilibrium dsDNA stretching simulations. These results are helpful in understandingthe dsDNA elasticity at short length scales as well as how the elasticity is modulated when dsDNA bindsto a charged object such as a dendrimer or protein.
1 Introduction
Many fundamental biological processes of life such as DNAreplication, translation and transcription involve interac-tion of DNA with proteins where the elasticity of DNAis crucial as a short segment of DNA is tightly woundaround proteins. The length scales involved in such biolog-ical processes are less than the persistence length (50 nm)of dsDNA and are of interest to study. The advancementof micromanipulation techniques in the last decades al-lows to perform manipulation experiments with single-molecule DNA to understand its mechanical properties.Elastic properties of short DNA of few tens of base-pairsplay a significant role in many cellular processes [1–3].Extensive experimental work has been done on DNA elas-ticity in the decade [4–8], but most studies involve longDNA of more than few hundreds of base-pairs in length.Many cellular processes involve unzipping of local DNAbase-pairs when proteins bind to DNA with specific inter-actions [9, 10]. Poly amido amine (PAMAM) dendrimersare hyperbranched polymers and can be considered asmodel proteins with many protein-like structural similari-ties [11–13]. PAMAM dendrimers are positively charged atneutral and low pH [14] and can bind negatively chargedDNA. Earlier we have studied the interaction of DNA with
a e-mail: [email protected]
a dendrimer [15,16] at varying pH conditions and showedthat the binding energy of the DNA-dendrimer complexincreases with the size of the dendrimer [16]. In this paperwe try to understand how the elasticity of DNA is alteredwhile complexed with a dendrimer, which can be viewedas a model protein. The length scale of the binding areaat the DNA binding site covered by typical proteins spansfew base-pairs, which is similar to the size of dendrimers.
The end-to-end distance (R) distributions (P (R)) ofsemi-flexible polymers in the context of their elasticityhave been studied in the past decade extensively [17–25].Recently both experiments and simulations have focusedon the short length scales to study the elasticity of shortdsDNA [26–29]. Mazur [30–33] has studied the elasticproperties of dsDNA using atomistic simulations based onthe probability distributions of end-to-end distance, bend-ing angle, etc. To study the effect of dendrimer binding,recent studies [34, 35] using small-angle X-ray scatteringrevealed that dsDNA has different bending modes depend-ing on the dendrimer charge density. The case of a semi-flexible polymer interacting with an oppositely chargedsphere was treated as a simple model case of DNA wrap-ping around histones, forming nucleosome core particles(NCP). This study revealed how the wrapping propensityis influenced by the ionic strength of the solution [9, 10]and how structures very similar to chromatin appear [36].Understanding short-length-scale elastic behavior of ds-
Page 2 of 9 Eur. Phys. J. E (2013) 36: 68
DNA is important since the local bending and unzippingof dsDNA can occur when it binds to proteins. The lengthscales over which protein binds to dsDNA in a DNA-protein complex are in the nano meter scale, which is lessthan the persistence length of dsDNA. However, modelsbased on worm-like-chain (WLC) largely fails to explainelastic behavior of dsDNA on such short length scales.
With the advance of single-molecule experimentaltechniques like optical tweezers, magnetic tweezers andatomic force microscopy (AFM), it has become possibleto study the structural details of single DNA (both ds-DNA and ssDNA) under external force at varying phys-iological conditions. Several experimental and theoreticalgroups have studied [5,8,37–42] structural transformationsof DNA by external force pulling at one end and fixingthe other end of the dsDNA. Single-molecule experimentalstudies of DNA elasticity are explained well by worm-like-chain model [8,43] which assumes inextensibility, isotropicbending rigidity of polymer in the thermodynamic limit(L/Lp → ∞; where Lp is the persistence length) [5, 8].WLC theory gives the average end-to-end distance of thepolymer when stretched with a force that involves the ini-tial contour length and the persistence length as fittingparameters. However, the WLC model fails to explain theforce-extension behavior in the large force limit and alsofor short length of polymers. For example, for short DNAmolecules the WLC model is inadequate to explain theelastic behavior and gives incorrect estimate of persistencelength [26, 44], an intrinsic property of the polymer thatis expected to be independent of the contour length. In arecent study [27], it has been shown that shorter DNA issofter than measured by single-molecule experiments. Itwas also shown that the variance in end-to-end distancehas a quadratic dependence on the number of base-pairsrather than a linear dependence, a result of linear elas-tic rod model [44]. These failures of the WLC are mainlydue to finite length effects, boundary conditions and rota-tional fluctuations at the force attachment. Some of thesecorrections have been incorporated into the WLC modeland led to a more general model called FWLC (FiniteWLC) in ref. [45]. The finite WLC model is able to pre-dict force-extension for a wide range of forces for polymerswith lengths ranging from less than the persistence lengthto infinite chain limit [45]. It can also include the effect offormation of a single permanent kink in the polymer. Sev-eral researchers have studied the force-extension behaviorof polymers, single and double-stranded DNA with im-provements to the standard WLC model [26,45–50] but acomplete understanding of the elastic behavior at variouslength scales is not yet well established.
In this paper, we use numerical simulations to solve theWLC model and obtain the end-to-end distance distribu-tion as done earlier [19]. Supported by the WLC numericalsolution, we demonstrate that the full atomic descriptionof dsDNA can give more insight into the elasticity at shortlength scales and how the elastic properties of short ds-DNA change when binding to a dendrimer. From the equi-librium contour length and bending angle distributions of38 base-pair dsDNA, we calculate the stretch modulus andbending persistence length of dsDNA. The variance of the
end-to-end distance has a nearly quartic dependence onthe number of base-pairs of dsDNA which has its origin inbending fluctuations. By stretching the bare dsDNA in sol-vent, we calculate the force-extension curves. The stretchmodulus calculated from zero and finite-force methods isin good agreement with experiments.
2 Methods
All atom molecular dynamics simulations of DNA in saltsolution were carried out in equilibrium as well as in non-equilibrium. The sequence of 12 base-pair DNA used inour simulation is d(CGC GAA TTC GCG)2, and thatfor 38 base-pair DNA is d(GCC GCG AGG TGT CAGGGA TTG CAG CCA GCA TCT CGT CG)2 and wastaken from our earlier works [41, 42, 51, 52]. To study theeffect of dendrimer binding on the elasticity of DNA, wehave used the G3 PAMAM dendrimer and 38 base-pairdsDNA complex at neutral pH as reported earlier [16]. Inequilibrium, 38 base-pairs dsDNA and dendrimer-bound38 base-pairs dsDNA were simulated separately in ex-plicit solvent. We use ff03 force field parameters of Duanet al. [53] to describe the bonded and non-bonded inter-actions for DNA and the TIP3P model [54] for water.We have used the DREIDING force field [55] to describethe intermolecular interaction of the dendrimer. The boxdimensions were chosen in order to ensure a minimumof 10 A solvation shell around the DNA structure dur-ing all simulations. The bare DNA system is neutral-ized with Na+ counterions and dendrimer-bound DNA isneutralized with Na+ as well as Cl− counterions to ac-count for the negative charge on DNA and positive chargeon dendrimer. Total system size for equilibrium simula-tions is 34783 atoms for bare DNA and 179234 atoms fordendrimer-bound DNA including water and counterions.For non-equilibrium stretching of 12 base-pair DNA and38 base-pair DNA, both strands of one end of dsDNA werepulled with an external force which increased linearly withtime. The other end of the dsDNA was held fixed. Dur-ing pulling, we measure the extension of the dsDNA asa function of the applied force. For the stretching simu-lations, we have added extra water along the pulling di-rection to ensure solvation of DNA even in fully stretchedcondition. With this, the system size of 38 base-pair bareDNA increases to 97326 atoms. The total number of atomsincluding water and counterions for the stretching simula-tion of 12 base-pair DNA is 27858. The system energy wasminimized by 1000 steps of steepest descent minimizationfollowed by 2000 steps of conjugate gradient minimization.Translational center-of-mass motions were removed afterevery 1000 steps. NPT-MD was used to get the correct sol-vent density corresponding to experimental condition. Thelong-range electrostatic interactions were calculated withthe Particle Mesh Ewald (PME) method [56]. A real spacecut off of 9 A was used both for the long-range electrostaticand short-range van der Waals interactions. We have usedperiodic boundary conditions in all three directions dur-ing the simulation. During the simulation, bond lengthsinvolving bonds to hydrogen atoms were constrained using
Eur. Phys. J. E (2013) 36: 68 Page 3 of 9
SHAKE algorithm [57]. For the equilibrium simulation wehave simulated the bare dsDNA for 85 ns and dendrimer-bound dsDNA was simulated for 70 ns. For the stretch-ing of dsDNA, we continue the simulation until we get afully stretched dsDNA. The time scale of the simulationat which we get fully stretched DNA depends on the rateof pulling. For 12 base-pair DNA we use a pulling rate of10−5 pN/fs which requires about 40 ns and for 38 base-pairDNA stretching we use 10−4 pN/fs which requires 10 ns toget the DNA in the fully stretched form.
From the MD trajectories of both the bare DNA anddendrimer-bound DNA simulation, we have calculated thehelix axis, end-to-end distance and contour length usingCurves algorithm developed by Skelnar and Lavery [58].All of these parameters are calculated as a function ofeach base-pair step n. Using these parameters we haveanalyzed the contour length distribution P (L), end-to-end distance distribution P (R), bending angle distribu-tion P (θ), variance of end-to-end distance σ2
n and com-pared them with those obtained from WLC model. TheWLC model is solved numerically to get P (R) and force-extension curves for polymers of any length ranging fromhighly flexible (L � Lp) to highly stiff (L � Lp) poly-mers. Force-extension curves were also obtained from MDsimulations with external force.
3 Results and discussion
3.1 Equilibrium properties of dsDNA
3.1.1 Contour length distribution P (L)
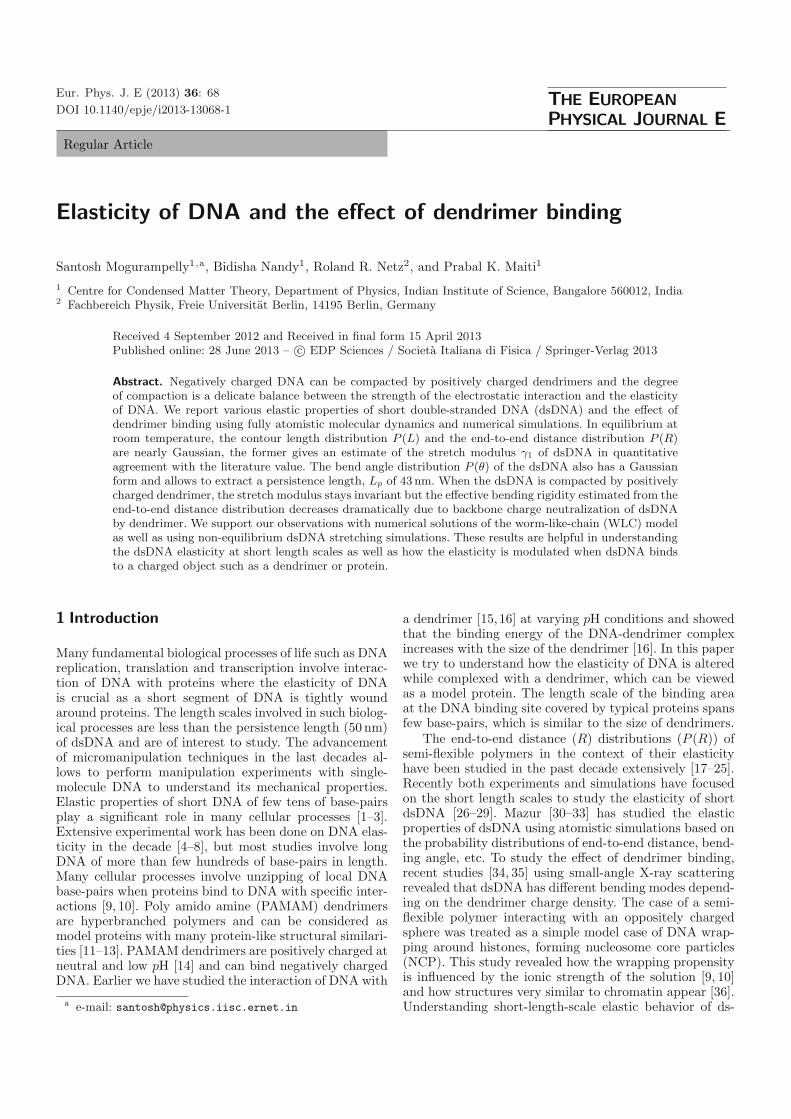
In equilibrium at room temperature, the instantaneouscontour length (L) of dsDNA has thermal fluctuationsaround its mean contour length L0. The instantaneouscontour length, L is defined as the sum of all n base-pairrises, L =
∑ni=0 hi, where hi is i-th base-pair rise as shown
in fig. 1(a). A small instantaneous fluctuation (L − L0)in contour length around its mean value L0 generates arestoring force F in the dsDNA that is proportional toL − L0, such that F = −γ1(L − L0)/L0, where γ1 is thestretch modulus of dsDNA. The free energy due to thisrestoring force can be obtained by integrating the forceF with respect to contour length, E(L) = γ1
2L0(L − L0)2.
Plugging E(L) into the Boltzmann factor e−βE(L), for ob-taining the probability of having a length L with energyE(L) and normalizing gives
P (L) =√
γ1L0
2πkBTe− γ1L0
2kBT (L/L0−1)2, (1)
=⇒ ln P (L) = − γ1L0
2kBT(L/L0 − 1)2 + C. (2)
We have analyzed equilibrium simulation trajectories forstudying fluctuations in the contour length of the dsDNA.Contour length distributions P (L) are shown in fig. 1(b)for bare and dendrimer-bound DNA. The contour lengthdistribution for bare and dendrimer-bound DNA is very
sharp with a small width. It means that DNA is stiff withsmall variance in contour length. By fitting P (L) to aGaussian, we obtain the stretch modulus γ1 to be 955 pNfor bare DNA and 959 pN for dendrimer-bound DNA. Thecalculated value of the stretch modulus for bare dsDNAis in good agreement with experimental reports [4–6] andsimulations [41,42]. We can see that the dendrimer-boundDNA is significantly bent around dendrimer compared tobare DNA which is almost straight. But the bending ofDNA around dendrimer does not alter the stretch modu-lus since the contour length is almost independent of thedegree of DNA bending. We have also calculated the end-to-end distance distribution, P (R) to estimate the degreeof bending of DNA around dendrimer. P (R) and snap-shots of bare DNA and dendrimer-bound DNA are shownin figs. 1(c), (d) and (e), respectively. Note that due to thebending of dsDNA, the width of the end-to-end distribu-tion of dendrimer-bound DNA is very large compared tothe width of the distribution for the bare DNA.
To calculate the bending persistence length Lp as wellas the bending modulus κ, we calculate the distribution ofbending angle P (θ). The bending angle θ is defined as theangle between tangents t(s) and t(s′). Similar to the con-tour length fluctuations, small fluctuation in θ can be ap-proximated to be of Gaussian nature and can be written as
P (θ) =√
κ
2π |s1 − sn|av kBTe− κ
2|s1−sn|avkBT
θ2
(3)
=⇒ ln P (θ) = − Lp
|s1 − sn|av(1 − cos θ) + C, (4)
where |s1 − sn|av is the average contour length (L0),κ
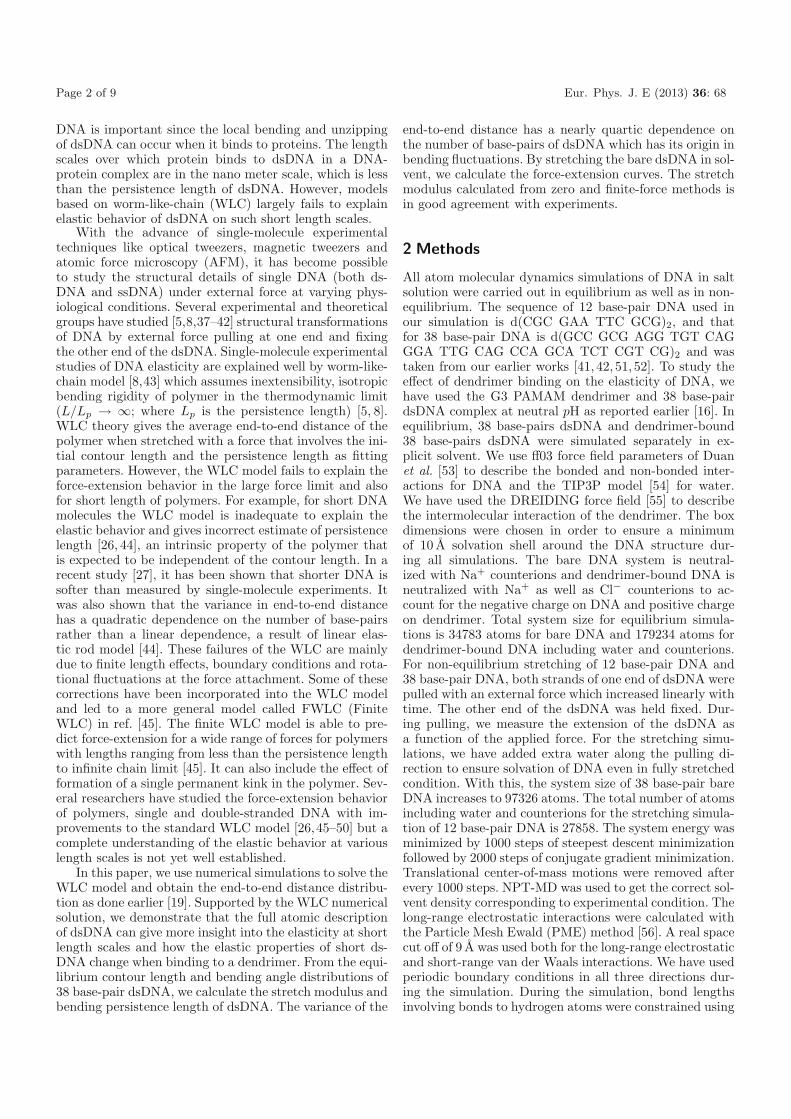
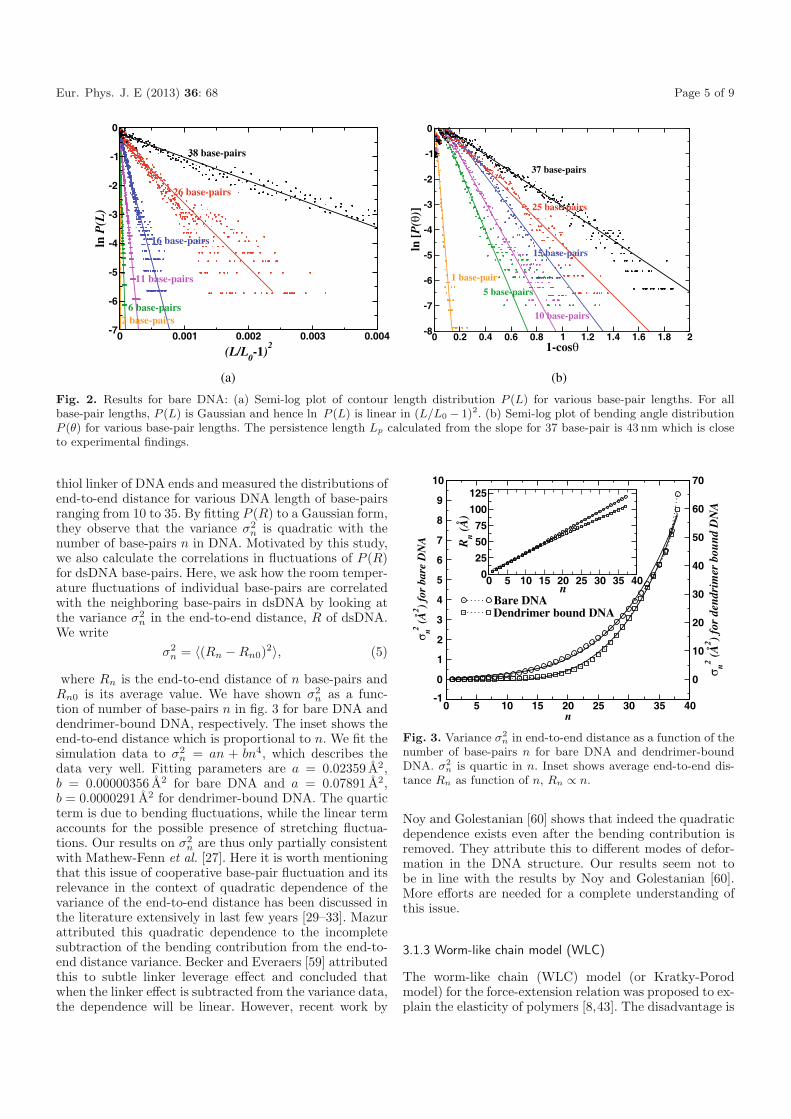
kBT = Lp and κ is the bending modulus of DNA. Fromthe simulation trajectories of 38 base-pair DNA, we haveanalyzed P (L) and P (θ) for different base-pair lengths nbetween 1 to 38 base-pairs as shown in figs. 2(a) and (b),respectively. P (L) for all base-pair lengths is Gaussian(fig. 2(a)). lnP (θ) versus (1− cos θ) is plotted in fig. 2(b).ln P (θ) is linear in (1 − cos θ) and from the fit, we obtainthe persistence length, Lp to be 43 nm which is closecompared to the standard experimental value of 50 nm.The bending modulus κ of bare DNA obtained from oursimulation is 1.76 × 10⁴ pN A2.
Do the stretch modulus and persistence length cal-culated from our atomistic MD simulation conform tothe idea that DNA can be treated as an isotropic elasticrod? To probe this, we note that for the isotropic elasticrod model, the stretch modulus γ1 is related to thepersistence length as follows: Lp = γ1r
2/4kBT , where r isthe radius of DNA. Using r = 1nm and Lp = 43nm, weestimate γ1 for bare DNA to be 705 pN as compared to γ1
= 955 pN from contour length distribution. Conversely,for an effective radius of r = 0.86 nm, the isotropic elasticrod model works perfectly. For dendrimer-bound DNA,we find an effective persistence length of Lp = 6.3 nmfrom our analysis of end-to-end distance distribution,and again using elastic rod formula we estimate γ1 ofdendrimer-bound DNA to be 103 pN. This is very smallcompared to the value of 959 pN obtained from contour
Page 4 of 9 Eur. Phys. J. E (2013) 36: 68
Fig. 1. Equilibrium MD simulations: (a) Schematic showing the base-pair rise h and contour length L. (b) Contour length and(c) end-to-end distance distribution for 38 base-pair bare DNA and dendrimer-bound DNA. Fitting P (L) to a Gaussian gives astretch modulus γ1 of 955 pN for bare DNA and 959 pN for dendrimer-bound DNA. Representative snapshots of 38 base-pair (d)bare DNA and (e) dendrimer-bound DNA. We can see from plot of P (R) and snapshots that the bare DNA is almost straightwith less bending fluctuations, whereas dendrimer-bound DNA has large bending fluctuations. Color code (online): adenine -cyan, guanine - pink, thymine - white, cytosine - green, helix axis - red and dendrimer - orange.
length distribution. This implies that dendrimer-boundDNA is more flexible than bare DNA. Dendrimer is aflexible molecule with positive charges on the primaryamine groups on the periphery. The branches are mobilemaking the positive charges moving along the negativecharges. When positively charged dendrimer binds tonegatively charged DNA, charge neutralization happensreducing the phosphate-phosphate repulsion in the DNAbackbone and the stiffness of DNA is much reduced. Thisalso causes DNA to bend around dendrimer. We expect
similar situations to arise when proteins bind to DNAwhich will be the subject of future study.
3.1.2 Correlations in fluctuations of dsDNA base-pairs
Mathew-Fenn et al. [27] have studied DNA flexibility atshort length scales using the variance in the end-to-enddistance obtained using small angle X-ray scattering tech-niques. They have tethered clusters of gold atoms to 3′
Eur. Phys. J. E (2013) 36: 68 Page 5 of 9
0 0.001 0.002 0.003 0.004
(L/L0-1)2
-7
-6
-5
-4
-3
-2
-1
0
ln P
(L)
38 base-pairs
26 base-pairs
16 base-pairs
11 base-pairs
6 base-pairs2 base-pairs
0 0.2 0.4 0.6 0.8 1 1.2 1.4 1.6 1.8 21-cosθ
-8
-7
-6
-5
-4
-3
-2
-1
0
ln [
P(θ
)]
37 base-pairs
25 base-pairs
15 base-pairs
10 base-pairs
5 base-pairs
1 base-pair
(a) (b)
Fig. 2. Results for bare DNA: (a) Semi-log plot of contour length distribution P (L) for various base-pair lengths. For allbase-pair lengths, P (L) is Gaussian and hence ln P (L) is linear in (L/L0 − 1)2. (b) Semi-log plot of bending angle distributionP (θ) for various base-pair lengths. The persistence length Lp calculated from the slope for 37 base-pair is 43 nm which is closeto experimental findings.
thiol linker of DNA ends and measured the distributions ofend-to-end distance for various DNA length of base-pairsranging from 10 to 35. By fitting P (R) to a Gaussian form,they observe that the variance σ2
n is quadratic with thenumber of base-pairs n in DNA. Motivated by this study,we also calculate the correlations in fluctuations of P (R)for dsDNA base-pairs. Here, we ask how the room temper-ature fluctuations of individual base-pairs are correlatedwith the neighboring base-pairs in dsDNA by looking atthe variance σ2
n in the end-to-end distance, R of dsDNA.We write
σ2n = 〈(Rn − Rn0)2〉, (5)
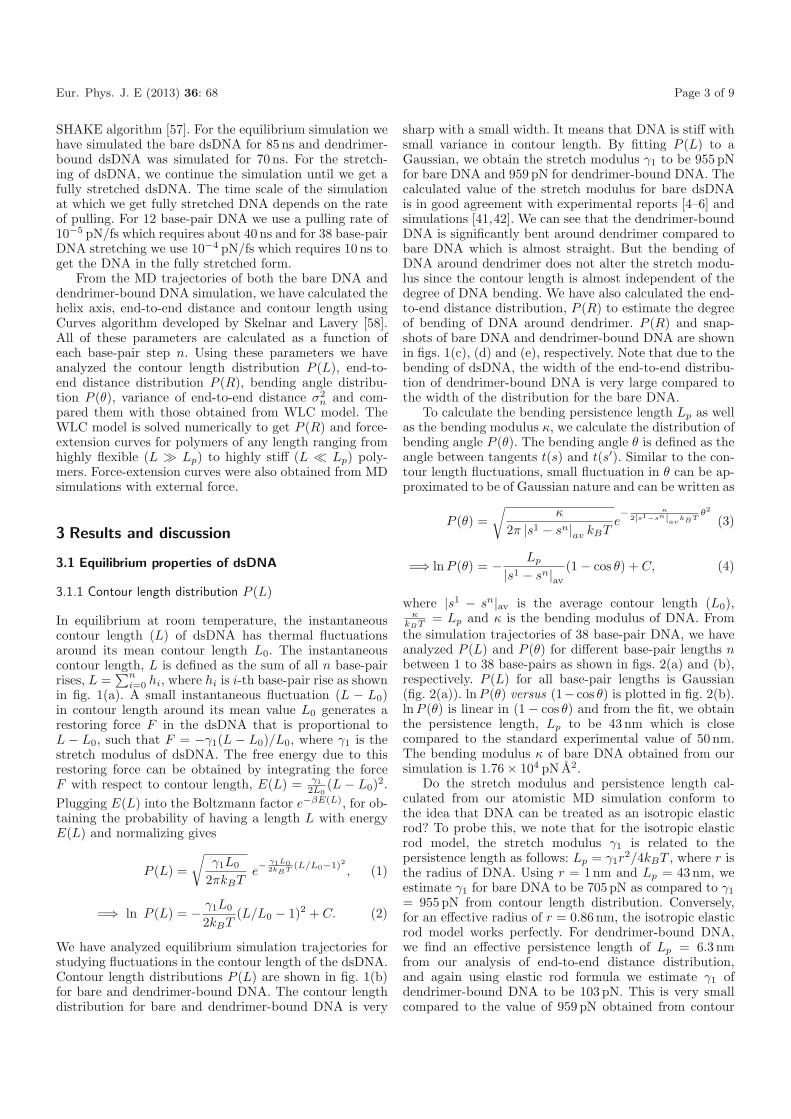
where Rn is the end-to-end distance of n base-pairs andRn0 is its average value. We have shown σ2
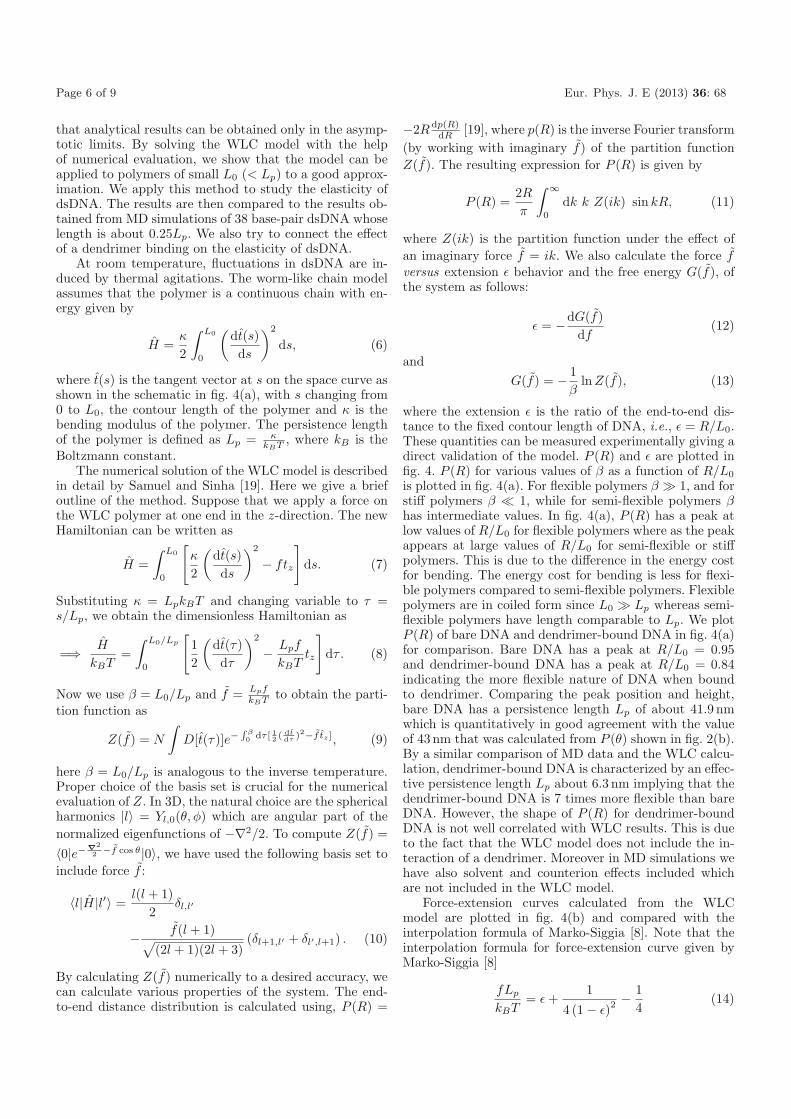
n as a func-tion of number of base-pairs n in fig. 3 for bare DNA anddendrimer-bound DNA, respectively. The inset shows theend-to-end distance which is proportional to n. We fit thesimulation data to σ2
n = an + bn4, which describes thedata very well. Fitting parameters are a = 0.02359 A2,b = 0.00000356 A2 for bare DNA and a = 0.07891 A2,b = 0.0000291 A2 for dendrimer-bound DNA. The quarticterm is due to bending fluctuations, while the linear termaccounts for the possible presence of stretching fluctua-tions. Our results on σ2
n are thus only partially consistentwith Mathew-Fenn et al. [27]. Here it is worth mentioningthat this issue of cooperative base-pair fluctuation and itsrelevance in the context of quadratic dependence of thevariance of the end-to-end distance has been discussed inthe literature extensively in last few years [29–33]. Mazurattributed this quadratic dependence to the incompletesubtraction of the bending contribution from the end-to-end distance variance. Becker and Everaers [59] attributedthis to subtle linker leverage effect and concluded thatwhen the linker effect is subtracted from the variance data,the dependence will be linear. However, recent work by
0 5 10 15 20 25 30 35 40n
-1
0
1
2
3
4
5
6
7
8
9
10
σ n2 (Å
2 ) fo
r ba
re D
NA
Bare DNA
0 5 10 15 20 25 30 35 40n
0
25
50
75
100
125
Rn (
Å)
0
10
20
30
40
50
60
70
σ n2 (Å
2 ) fo
r de
ndri
mer
bou
nd D
NA
Dendrimer bound DNA
Fig. 3. Variance σ2n in end-to-end distance as a function of the
number of base-pairs n for bare DNA and dendrimer-boundDNA. σ2
n is quartic in n. Inset shows average end-to-end dis-tance Rn as function of n, Rn ∝ n.
Noy and Golestanian [60] shows that indeed the quadraticdependence exists even after the bending contribution isremoved. They attribute this to different modes of defor-mation in the DNA structure. Our results seem not tobe in line with the results by Noy and Golestanian [60].More efforts are needed for a complete understanding ofthis issue.
3.1.3 Worm-like chain model (WLC)
The worm-like chain (WLC) model (or Kratky-Porodmodel) for the force-extension relation was proposed to ex-plain the elasticity of polymers [8,43]. The disadvantage is
Page 6 of 9 Eur. Phys. J. E (2013) 36: 68
that analytical results can be obtained only in the asymp-totic limits. By solving the WLC model with the helpof numerical evaluation, we show that the model can beapplied to polymers of small L0 (< Lp) to a good approx-imation. We apply this method to study the elasticity ofdsDNA. The results are then compared to the results ob-tained from MD simulations of 38 base-pair dsDNA whoselength is about 0.25Lp. We also try to connect the effectof a dendrimer binding on the elasticity of dsDNA.
At room temperature, fluctuations in dsDNA are in-duced by thermal agitations. The worm-like chain modelassumes that the polymer is a continuous chain with en-ergy given by
H =κ
2
∫ L0
0
(dt(s)ds
)2
ds, (6)
where t(s) is the tangent vector at s on the space curve asshown in the schematic in fig. 4(a), with s changing from0 to L0, the contour length of the polymer and κ is thebending modulus of the polymer. The persistence lengthof the polymer is defined as Lp = κ
kBT , where kB is theBoltzmann constant.
The numerical solution of the WLC model is describedin detail by Samuel and Sinha [19]. Here we give a briefoutline of the method. Suppose that we apply a force onthe WLC polymer at one end in the z-direction. The newHamiltonian can be written as
H =∫ L0
0
[κ
2
(dt(s)ds
)2
− ftz
]
ds. (7)
Substituting κ = LpkBT and changing variable to τ =s/Lp, we obtain the dimensionless Hamiltonian as
=⇒ H
kBT=
∫ L0/Lp
0
[12
(dt(τ)dτ
)2
− Lpf
kBTtz
]
dτ . (8)
Now we use β = L0/Lp and f = LpfkBT to obtain the parti-
tion function as
Z(f) = N
∫
D[t(τ)]e−R β0 dτ [ 12 ( dt
dτ )2−f tz ], (9)
here β = L0/Lp is analogous to the inverse temperature.Proper choice of the basis set is crucial for the numericalevaluation of Z. In 3D, the natural choice are the sphericalharmonics |l〉 = Yl,0(θ, φ) which are angular part of thenormalized eigenfunctions of −∇2/2. To compute Z(f) =〈0|e−∇2
2 −f cos θ|0〉, we have used the following basis set toinclude force f :
〈l|H|l′〉 =l(l + 1)
2δl,l′
− f(l + 1)√
(2l + 1)(2l + 3)(δl+1,l′ + δl′,l+1) . (10)
By calculating Z(f) numerically to a desired accuracy, wecan calculate various properties of the system. The end-to-end distance distribution is calculated using, P (R) =
−2Rdp(R)dR [19], where p(R) is the inverse Fourier transform
(by working with imaginary f) of the partition functionZ(f). The resulting expression for P (R) is given by
P (R) =2R
π
∫ ∞
0
dk k Z(ik) sin kR, (11)
where Z(ik) is the partition function under the effect ofan imaginary force f = ik. We also calculate the force fversus extension ε behavior and the free energy G(f), ofthe system as follows:
ε = −dG(f)df
(12)
andG(f) = − 1
βln Z(f), (13)
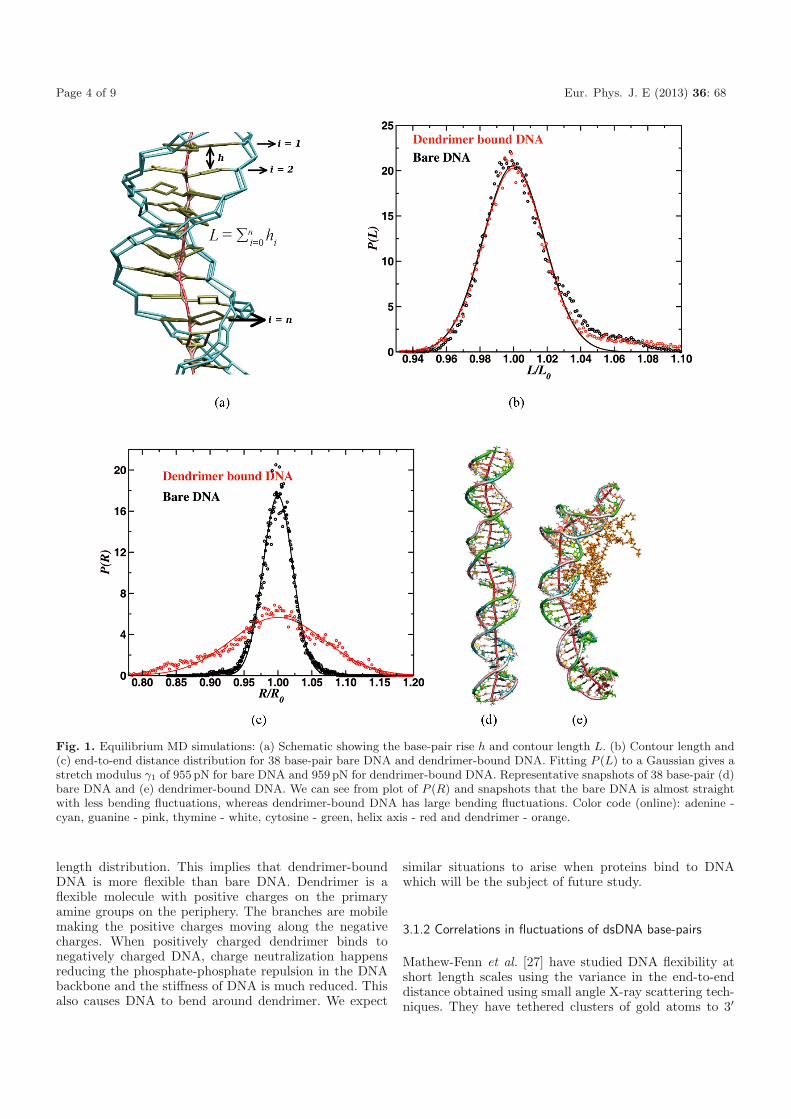
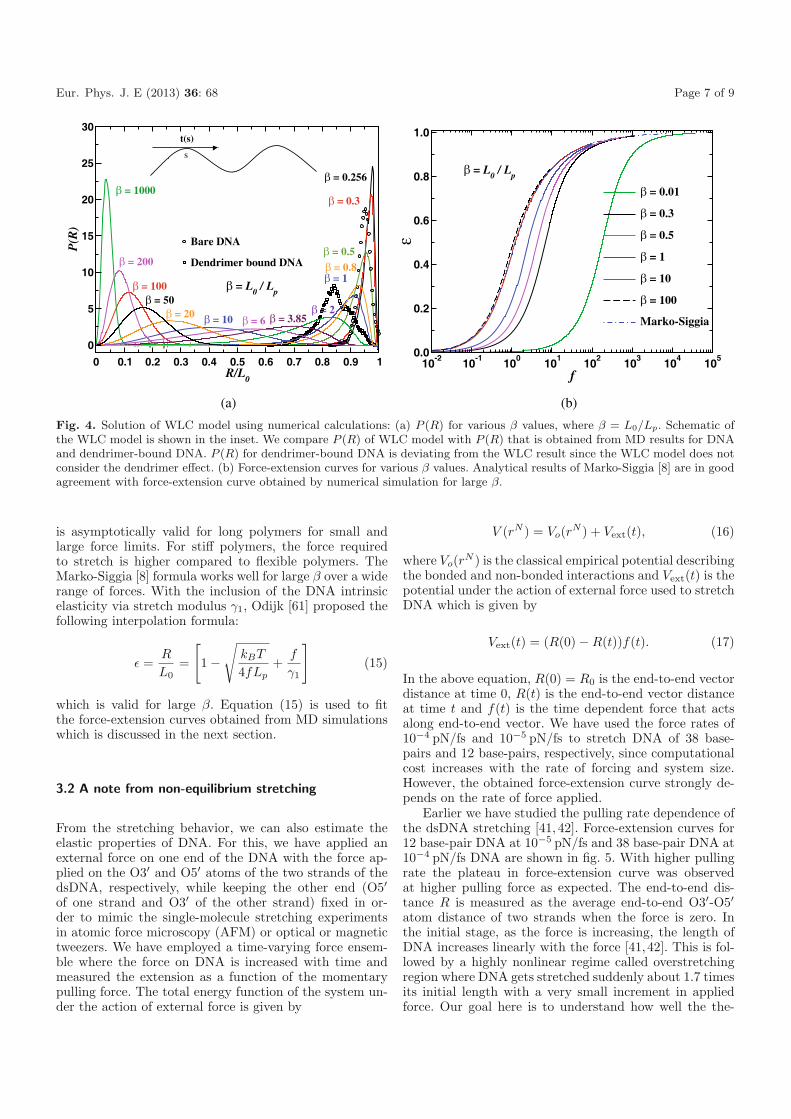
where the extension ε is the ratio of the end-to-end dis-tance to the fixed contour length of DNA, i.e., ε = R/L0.These quantities can be measured experimentally giving adirect validation of the model. P (R) and ε are plotted infig. 4. P (R) for various values of β as a function of R/L0
is plotted in fig. 4(a). For flexible polymers β � 1, and forstiff polymers β � 1, while for semi-flexible polymers βhas intermediate values. In fig. 4(a), P (R) has a peak atlow values of R/L0 for flexible polymers where as the peakappears at large values of R/L0 for semi-flexible or stiffpolymers. This is due to the difference in the energy costfor bending. The energy cost for bending is less for flexi-ble polymers compared to semi-flexible polymers. Flexiblepolymers are in coiled form since L0 � Lp whereas semi-flexible polymers have length comparable to Lp. We plotP (R) of bare DNA and dendrimer-bound DNA in fig. 4(a)for comparison. Bare DNA has a peak at R/L0 = 0.95and dendrimer-bound DNA has a peak at R/L0 = 0.84indicating the more flexible nature of DNA when boundto dendrimer. Comparing the peak position and height,bare DNA has a persistence length Lp of about 41.9 nmwhich is quantitatively in good agreement with the valueof 43 nm that was calculated from P (θ) shown in fig. 2(b).By a similar comparison of MD data and the WLC calcu-lation, dendrimer-bound DNA is characterized by an effec-tive persistence length Lp about 6.3 nm implying that thedendrimer-bound DNA is 7 times more flexible than bareDNA. However, the shape of P (R) for dendrimer-boundDNA is not well correlated with WLC results. This is dueto the fact that the WLC model does not include the in-teraction of a dendrimer. Moreover in MD simulations wehave also solvent and counterion effects included whichare not included in the WLC model.
Force-extension curves calculated from the WLCmodel are plotted in fig. 4(b) and compared with theinterpolation formula of Marko-Siggia [8]. Note that theinterpolation formula for force-extension curve given byMarko-Siggia [8]
fLp
kBT= ε +
14 (1 − ε)2
− 14
(14)
Eur. Phys. J. E (2013) 36: 68 Page 7 of 9
0 0.1 0.2 0.3 0.4 0.5 0.6 0.7 0.8 0.9 1R/L0
0
5
10
15
20
25
30
P(R
)
β = 1000
β = 200
β = 100β = 50
β = 20 β = 10 β = 6 β = 3.85β = 2
β = 1
β = 0.5
β = 0.3
β = 0.256
β = L0 / Lp
Bare DNA
Dendrimer bound DNA β = 0.8
10-2
10-1
100
101
102
103
104
105
f
0.0
0.2
0.4
0.6
0.8
1.0
ε
β = 0.01
β = 0.3
β = 0.5
β = 1
β = 10
β = 100
Marko-Siggia
β = L0 / Lp
(a) (b)
t(s)
s
Fig. 4. Solution of WLC model using numerical calculations: (a) P (R) for various β values, where β = L0/Lp. Schematic ofthe WLC model is shown in the inset. We compare P (R) of WLC model with P (R) that is obtained from MD results for DNAand dendrimer-bound DNA. P (R) for dendrimer-bound DNA is deviating from the WLC result since the WLC model does notconsider the dendrimer effect. (b) Force-extension curves for various β values. Analytical results of Marko-Siggia [8] are in goodagreement with force-extension curve obtained by numerical simulation for large β.
is asymptotically valid for long polymers for small andlarge force limits. For stiff polymers, the force requiredto stretch is higher compared to flexible polymers. TheMarko-Siggia [8] formula works well for large β over a widerange of forces. With the inclusion of the DNA intrinsicelasticity via stretch modulus γ1, Odijk [61] proposed thefollowing interpolation formula:
ε =R
L0=
[
1 −√
kBT
4fLp+
f
γ1
]
(15)
which is valid for large β. Equation (15) is used to fitthe force-extension curves obtained from MD simulationswhich is discussed in the next section.
3.2 A note from non-equilibrium stretching
From the stretching behavior, we can also estimate theelastic properties of DNA. For this, we have applied anexternal force on one end of the DNA with the force ap-plied on the O3′ and O5′ atoms of the two strands of thedsDNA, respectively, while keeping the other end (O5′of one strand and O3′ of the other strand) fixed in or-der to mimic the single-molecule stretching experimentsin atomic force microscopy (AFM) or optical or magnetictweezers. We have employed a time-varying force ensem-ble where the force on DNA is increased with time andmeasured the extension as a function of the momentarypulling force. The total energy function of the system un-der the action of external force is given by
V (rN ) = Vo(rN ) + Vext(t), (16)
where Vo(rN ) is the classical empirical potential describingthe bonded and non-bonded interactions and Vext(t) is thepotential under the action of external force used to stretchDNA which is given by
Vext(t) = (R(0) − R(t))f(t). (17)
In the above equation, R(0) = R0 is the end-to-end vectordistance at time 0, R(t) is the end-to-end vector distanceat time t and f(t) is the time dependent force that actsalong end-to-end vector. We have used the force rates of10−4 pN/fs and 10−5 pN/fs to stretch DNA of 38 base-pairs and 12 base-pairs, respectively, since computationalcost increases with the rate of forcing and system size.However, the obtained force-extension curve strongly de-pends on the rate of force applied.
Earlier we have studied the pulling rate dependence ofthe dsDNA stretching [41, 42]. Force-extension curves for12 base-pair DNA at 10−5 pN/fs and 38 base-pair DNA at10−4 pN/fs DNA are shown in fig. 5. With higher pullingrate the plateau in force-extension curve was observedat higher pulling force as expected. The end-to-end dis-tance R is measured as the average end-to-end O3′-O5′atom distance of two strands when the force is zero. Inthe initial stage, as the force is increasing, the length ofDNA increases linearly with the force [41,42]. This is fol-lowed by a highly nonlinear regime called overstretchingregion where DNA gets stretched suddenly about 1.7 timesits initial length with a very small increment in appliedforce. Our goal here is to understand how well the the-
Page 8 of 9 Eur. Phys. J. E (2013) 36: 68
1.0 1.2 1.4 1.6 1.8ε
0
50
100
150
200
250
300
f (p
N)
12 base-pair
with 10
-5 pN/fs
38 base-pair w
ith 10
-4 pN/fs
Fit
to
Eqn
. 14
Fit t
o E
qn. 1
5
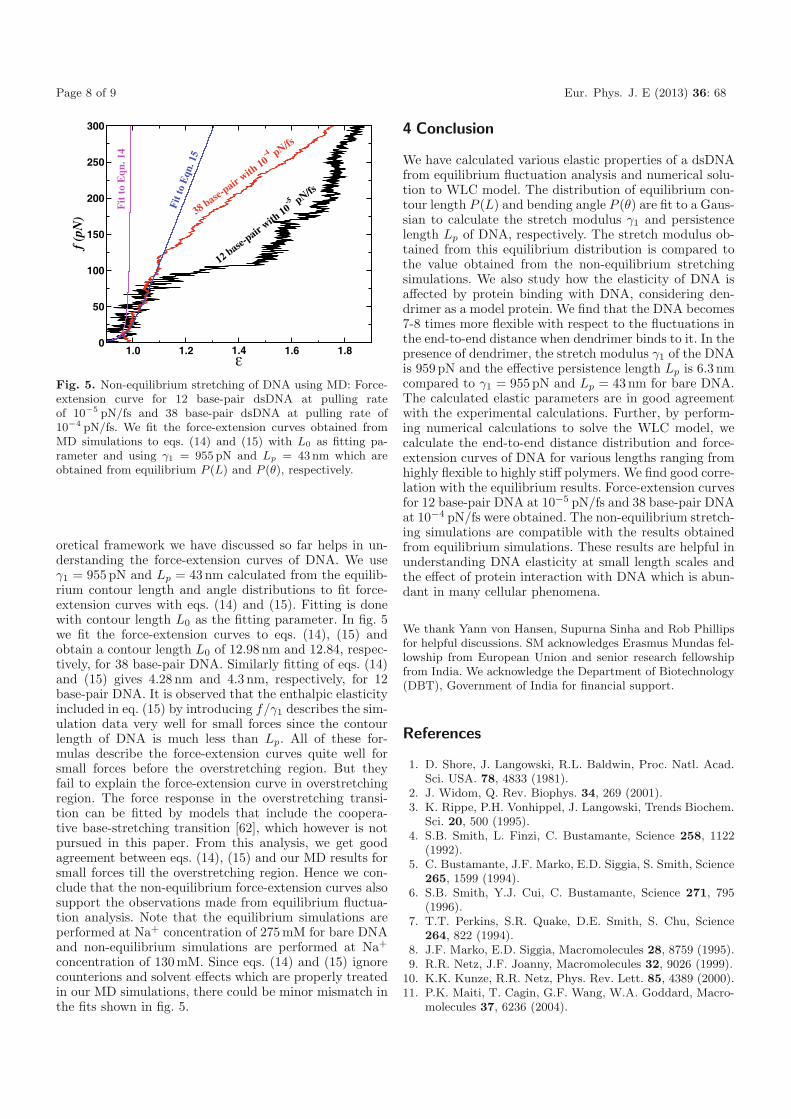
Fig. 5. Non-equilibrium stretching of DNA using MD: Force-extension curve for 12 base-pair dsDNA at pulling rateof 10−5 pN/fs and 38 base-pair dsDNA at pulling rate of10−4 pN/fs. We fit the force-extension curves obtained fromMD simulations to eqs. (14) and (15) with L0 as fitting pa-rameter and using γ1 = 955 pN and Lp = 43 nm which areobtained from equilibrium P (L) and P (θ), respectively.
oretical framework we have discussed so far helps in un-derstanding the force-extension curves of DNA. We useγ1 = 955 pN and Lp = 43nm calculated from the equilib-rium contour length and angle distributions to fit force-extension curves with eqs. (14) and (15). Fitting is donewith contour length L0 as the fitting parameter. In fig. 5we fit the force-extension curves to eqs. (14), (15) andobtain a contour length L0 of 12.98 nm and 12.84, respec-tively, for 38 base-pair DNA. Similarly fitting of eqs. (14)and (15) gives 4.28 nm and 4.3 nm, respectively, for 12base-pair DNA. It is observed that the enthalpic elasticityincluded in eq. (15) by introducing f/γ1 describes the sim-ulation data very well for small forces since the contourlength of DNA is much less than Lp. All of these for-mulas describe the force-extension curves quite well forsmall forces before the overstretching region. But theyfail to explain the force-extension curve in overstretchingregion. The force response in the overstretching transi-tion can be fitted by models that include the coopera-tive base-stretching transition [62], which however is notpursued in this paper. From this analysis, we get goodagreement between eqs. (14), (15) and our MD results forsmall forces till the overstretching region. Hence we con-clude that the non-equilibrium force-extension curves alsosupport the observations made from equilibrium fluctua-tion analysis. Note that the equilibrium simulations areperformed at Na+ concentration of 275mM for bare DNAand non-equilibrium simulations are performed at Na+
concentration of 130mM. Since eqs. (14) and (15) ignorecounterions and solvent effects which are properly treatedin our MD simulations, there could be minor mismatch inthe fits shown in fig. 5.
4 Conclusion
We have calculated various elastic properties of a dsDNAfrom equilibrium fluctuation analysis and numerical solu-tion to WLC model. The distribution of equilibrium con-tour length P (L) and bending angle P (θ) are fit to a Gaus-sian to calculate the stretch modulus γ1 and persistencelength Lp of DNA, respectively. The stretch modulus ob-tained from this equilibrium distribution is compared tothe value obtained from the non-equilibrium stretchingsimulations. We also study how the elasticity of DNA isaffected by protein binding with DNA, considering den-drimer as a model protein. We find that the DNA becomes7-8 times more flexible with respect to the fluctuations inthe end-to-end distance when dendrimer binds to it. In thepresence of dendrimer, the stretch modulus γ1 of the DNAis 959 pN and the effective persistence length Lp is 6.3 nmcompared to γ1 = 955 pN and Lp = 43nm for bare DNA.The calculated elastic parameters are in good agreementwith the experimental calculations. Further, by perform-ing numerical calculations to solve the WLC model, wecalculate the end-to-end distance distribution and force-extension curves of DNA for various lengths ranging fromhighly flexible to highly stiff polymers. We find good corre-lation with the equilibrium results. Force-extension curvesfor 12 base-pair DNA at 10−5 pN/fs and 38 base-pair DNAat 10−4 pN/fs were obtained. The non-equilibrium stretch-ing simulations are compatible with the results obtainedfrom equilibrium simulations. These results are helpful inunderstanding DNA elasticity at small length scales andthe effect of protein interaction with DNA which is abun-dant in many cellular phenomena.
We thank Yann von Hansen, Supurna Sinha and Rob Phillipsfor helpful discussions. SM acknowledges Erasmus Mundas fel-lowship from European Union and senior research fellowshipfrom India. We acknowledge the Department of Biotechnology(DBT), Government of India for financial support.
References
1. D. Shore, J. Langowski, R.L. Baldwin, Proc. Natl. Acad.Sci. USA. 78, 4833 (1981).
2. J. Widom, Q. Rev. Biophys. 34, 269 (2001).3. K. Rippe, P.H. Vonhippel, J. Langowski, Trends Biochem.
Sci. 20, 500 (1995).4. S.B. Smith, L. Finzi, C. Bustamante, Science 258, 1122
(1992).5. C. Bustamante, J.F. Marko, E.D. Siggia, S. Smith, Science
265, 1599 (1994).6. S.B. Smith, Y.J. Cui, C. Bustamante, Science 271, 795
(1996).7. T.T. Perkins, S.R. Quake, D.E. Smith, S. Chu, Science
264, 822 (1994).8. J.F. Marko, E.D. Siggia, Macromolecules 28, 8759 (1995).9. R.R. Netz, J.F. Joanny, Macromolecules 32, 9026 (1999).
10. K.K. Kunze, R.R. Netz, Phys. Rev. Lett. 85, 4389 (2000).11. P.K. Maiti, T. Cagin, G.F. Wang, W.A. Goddard, Macro-
molecules 37, 6236 (2004).
Eur. Phys. J. E (2013) 36: 68 Page 9 of 9
12. P.K. Maiti, T. Cagin, S.T. Lin, W.A. Goddard, Macro-molecules 38, 979 (2005).
13. S. Svenson, D.A. Tomalia, Adv. Drug Deliver. Rev. 57,2106 (2005).
14. P.K. Maiti, R. Messina, Macromolecules 41, 5002 (2008).15. P.K. Maiti, B. Bagchi, Nano Lett. 6, 2478 (2006).16. B. Nandy, P.K. Maiti, J. Phys. Chem. B 115, 217 (2011).17. B.Y. Ha, D. Thirumalai, J. Chem. Phys. 103, 9408 (1995).18. J. Wilhelm, E. Frey, Phys. Rev. Lett. 77, 2581 (1996).19. J. Samuel, S. Sinha, Phys. Rev. E 66, 050801 (2002).20. A. Dhar, D. Chaudhuri, Phys. Rev. Lett. 89, 065502
(2002).21. S. Stepanow, G.M. Schutz, Europhys. Lett. 60, 546 (2002).22. R.G. Winkler, J. Chem. Phys. 118, 2919 (2003).23. F. Valle, M. Favre, P. De Los Rios, A. Rosa, G. Dietler,
Phys. Rev. Lett. 95, 158105 (2005).24. P. Ranjith, P.B.S. Kumar, G.I. Menon, Phys. Rev. Lett.
94, 138102 (2005).25. C. Hyeon, R.I. Dima, D. Thirumalai, J. Chem. Phys. 125,
194905 (2006).26. Y. Seol, J. Li, P.C. Nelson, T.T. Perkins, M.D. Betterton,
Biophys. J. 93, 4360 (2007).27. R.S. Mathew-Fenn, R. Das, P.A.B. Harbury, Science 322,
446 (2008).28. C. Yuan, H. Chen, X.W. Lou, L.A. Archer, Phys. Rev.
Lett. 100, 018102 (2008).29. R. Padinhateeri, G.I. Menon, Biophys. J. 104, 463 (2013).30. A.K. Mazur, Biophys. J. 91, 4507 (2006).31. A.K. Mazur, Phys. Rev. Lett. 98, 218102 (2007).32. A.K. Mazur, J. Phys. Chem. B 113, 2077 (2009).33. A.K. Mazur, Phys. Rev. E 80, 010901 (2009).34. C.-Y. Chen, C.-J. Su, S.-F. Peng, H.-L. Chen, H.-W. Sung,
Soft Matter 7, 61 (2011).35. R. Dootz, A.C. Toma, T. Pfohl, Soft Matter 7, 8343 (2011).36. H. Boroudjerdi, A. Naji, R.R. Netz, Eur. Phys. J. E. 34,
72 (2011).37. C. Bustamante, J.C. Macosko, G.J.L. Wuite, Nat. Rev.
Mol. Cell Biol. 1, 130 (2000).38. C. Gosse, V. Croquette, Biophys. J. 82, 3314 (2002).39. A. Lebrun, R. Lavery, Nucleic Acids Res. 24, 2260 (1996).40. P. Cluzel, A. Lebrun, C. Heller, R. Lavery, J.L. Viovy, D.
Chatenay, F. Caron, Science 271, 792 (1996).
41. M. Santosh, P.K. Maiti, J. Phys.: Condens. Matter 21,034113 (2009).
42. M. Santosh, P.K. Maiti, Biophys. J. 101, 1393 (2011).43. O. Kratky, G. Porod, Recl. Trav. Chim. Pays-Bas-J. Roy.
Neth. Chem. Soc. 68, 1106 (1949).44. P.A. Wiggins, T. Van der Heijden, F. Moreno-Herrero, A.
Spakowitz, R. Phillips, J. Widom, C. Dekker, P.C. Nelson,Nat. Nanotech. 1, 137 (2006).
45. J. Li, P.C. Nelson, M.D. Betterton, Macromolecules 39,8816 (2006).
46. C. Bouchiat, M.D. Wang, J.F. Allemand, T. Strick, S.M.Block, V. Croquette, Biophys. J. 76, 409 (1999).
47. L. Livadaru, R.R. Netz, H.J. Kreuzer, Macromolecules 36,3732 (2003).
48. C. Storm, P.C. Nelson, Phys. Rev. E 67, 051906 (2003).49. A. Rosa, T. Hoang, D. Marenduzzo, A. Maritan, Biophys.
Chem. 115, 251 (2005).50. Ngo Minh Toan, D. Thirumalai, Macromolecules 43, 4394
(2010).51. P.K. Maiti, T.A. Pascal, N. Vaidehi, W.A. Goddard, Nucl.
Acids Res. 32, 6047 (2004).52. P.K. Maiti, T.A. Pascal, N. Vaidehi, J. Heo, W.A. God-
dard, Biophys. J. 90, 1463 (2006).53. Y. Duan, C. Wu, S. Chowdhury, M.C. Lee, G.M. Xiong,
W. Zhang, R. Yang, P. Cieplak, R. Luo, T. Lee, J. Cald-well, J.M. Wang, P. Kollman, J. Comput. Chem. 24, 1999(2003).
54. W.L. Jorgensen, J. Chandrasekhar, J.D. Madura, R.W.Impey, M.L. Klein, J. Chem. Phys. 79, 926 (1983).
55. S.L. Mayo, B.D. Olafson, W.A. Goddard, J. Phys. Chem.94, 8897 (1990).
56. T. Darden, D. York, L. Pedersen, J. Chem. Phys. 98, 10089(1993).
57. J.P. Ryckaert, G. Ciccotti, H.J.C. Berendsen, J. Comput.Phys. 23, 327 (1977).
58. R. Lavery, H. Skelnar, J. Biomol. Struct. Dyn. 6, 63 (1988).59. N.B. Becker, R. Everaers, Science 325, 538 (2009).60. A. Noy, R. Golestanian, Phys. Rev. Lett. 109, 228101
(2012).61. T. Odijk, Macromolecules 28, 7016 (1995).62. T.R. Einert, D.B. Staple, H.-J. Kreuzer, R.R. Netz, Bio-
phys. J. 99, 578 (2010).