Embed Size (px)
Citation preview

AEDC-TR-65 -257
DESIGN -AND PERFORMANCEOF STAGED STEAM EJECTORS
WITH INTERSTAGE CONDENSERS
_____F. H. Smith, Jr.
_______ARO, Inc,
__C CLEARINGHOU' '
-CA - INFOR MA~'7O,
___ 6'C ~6~D ~'March 1966
* 1s~i~i~l~fisd~d eti unlimited
ENGINEERING SUPPORT FACILITY
ARNOLD ENGINEERING DEVELOPMENT CENTER
AIR FORCE SYSTEMS COMMAND
ARNOLD AIR FOR CE S TA TION, TENNESSEE

AEDC-TR--65.1257
DESIGN AND~ PERFORMANCE
WITH INTERSTAGE CONDENSERS
F. H. Smnith, Jr.,
ARO, Ihc.
IDistribution of Ahs-dcument is unlimited.
Ar;d API ?.
Ai A"?-

AEDC-TR-65-257
II
FOREWORD
The work reported herein was done at the request ofArnold Engineering Development Center (AEDC), Air ForceSystems Command (AFSCO), under System 921E/1461, ProjectSUPER, Project 9514, and Task 951411. The results wereobtained by ARO, Inc. (a subsidiary of Sverdrup and Parcel,Inc.), contract operator of AEDC, Arnold Air Force Station,
Tennessee, under Contract AF40(600)-1200. The report wasprepared under ARO Project No. TW4355, and the manuscriptwas submitted for publication on November 10, 1965.
This technical report has been reviewed and is approved.
M. V. Vasilik Donald D. Carlsonl/Lt, USAF Colonel, USAF-Technology Division DS/Plans arJ TechnologyDCS/Plans and Technology
-i
!} ii
A E DC-TR-65-257
ti
ABSTRACT
One-dimensional-analysis was used to design a staged,steam ejector system. The system gives experimental re-suits that are within the predicted performance envelope.The differences between the experimental results and theo-retical predictions are critically examined. It was con-cluded -(l) that the design of spray condensers between theejector stages has an important influence on the overallperformance of the system, (2) that the best system per-formance was obtained when the ejectors were operated atequal primary flow rates, and (3) that the effect of theMach number of the secondary flow, in the region of theejector steam jet can have a great influence on ejector-performance.
iii
7 77
,.t3 7,--
AEDC-TR-65-257
CONTENTS
Page
ABSTRACT .... ............. . . . . . . iiiNOMENCLATURE.................... . . .... vii
I. INTRODUCTION ............... . 1II. DESIGN CONSIDERATIONS
2.1 General ................ 12.2 Determination of Number of Cmpression
Stages . . . . . . . . . . . . . . . . 22.3 Selection of Cooling Water Temperature . 22.4 Steam Pressure, Temperature, and Quality 32.5 Computer Specified Design . . . . . . . . 3
2.6 Design of Ejectors . . . . . . . . . . . 42.7 Design of the Spray Condensers ..... 52.8 Design of the Rocket Simulation Nozzle
and Cell .. ........ ........ . . . 62.9 Design of the Atmospheric Flow Orifices . 7
III. INSTALLATION .................. *. 7IV. I NSTRUMENTATI ON
4.1 Pressure ......... . . . . . . . . . 84.2 Transients ........ . . . . . . . . . 9
4.3 Temperature.......... . . . . . 9V. PROCEDURES . . . . ............. . . . . 9
VI. RESULTS6.1 Zero Flow Performance . . ....... 10
6.2 Secondary Flow Performance of the HoldingEjector........... . . . . . . 11
6.3 Secondary Flow Performance of Jet Pump-ing Ejectors. . . . . . 12
VII. DISCUSSION .................... 12VIII. CONCLUSIONS . . . . . . . . . . . . ..... 14
REFERENCES . ........... . . .... 15
ILLUSTRATIONS
Figure
1. Steam Nozzle Detail ............. 17
2. Ejector Assembly ... . . . . . .. . . 18
3. Condenser Assembly.. ...... 19
4. Steam Ejector Test Installation . ...... 20
5. Zero Flow Performance of First Ejector o 21
6. Zero Flow Performance of Second Ejector . . . 22
V
AEDC*TR.65-257
Figure Page
7. AP Rise at Zero Flowa. First Ejector . . . . . . . . . . . . . . 23b. Second Ejector ....... . .. ... 24
8. First Ejector Performance with Secondary Flowa. 0.05 lbm/sec .. .. . . . . . . .. . 25b. 0',10 lb,/sec . . . . . . . . *. . . . .. . 26
c. 0.15 lb /sec . . . . . . . . . . . . . . . 27d. 0.20 lbm/sec . . . ... . . ... . . . 28e. 0.25 lbm/sec * .. . . . . . 29
9. Second, Third, and Fourth Ejector Performancewith Secondary Flowa. 0.05 lbm/sec . . . . . . . . . . . . . . . 30b. 0.10 ibm/sec . . . . . . . . . . . . . . . 31c. 0.15 ibm/sec . . . . . . . . . . . . . . 32d. 0.20 Ibm/sec . . . . . . . .. . .. ... 33e. 0.25 ibm/sec ............... 34
10. Effect of Cooler on Pressure Rise of SecondEjector . . . . . . . . . . . . . . . . . . . 35
11. Effect of Cooler-on Pressure Rise Ratio ofSecond Ejector ................ 36
12. Actual and Predicted Secondary Flow Velocitythrough Condensers. . ....... ..... .. 37
vi
AEDC-TR-65-257
NOMENCLATI'RE
AD/A* Area ratio - diffuser to nozzle throat
ANE/A* Area ratio - nozzle exit to nozzle throat
D* Diameter of nozzle throat
.MP Molecular weight, primary steam
Molecular weight, secondary air
p Total pressure of primary steamP
P. Total pressure at exit of exhauster stage
P.e Total pressure -at inlet of exhauster stagein
Pex PinPRR Pressure rise ratio, P x/P in
Tp Absolute temperature: primary steam
TS Absolute temperature, 'secondary air
Wp PFlow rate of primary steam
WS Secondary airflow rate
AP Pressure rise across- the ejector, P - Pin
APRR Change in pressure rise ratio
t
_vii i
AEDC-TR-65-257
SECTION IINTRODUCTION -
In the ground testing of rocket engines under simulatedaltitude conditions, the requirement for maintaining a con-stant altitude pressure poses a problem, especially during
rocket ignition and tailoff. A supersonic diffuser can beused to maintain a constant altitude pressure as long as therocket chamber pressure is constant. However, during theignition period when the rocket chamber pressure is risingand the diffuser has not started, there is a large increasein the cell pressure. This also occurs during rocket tail-off when the diffuser flow breaks down and there is backflowinto the cell.
Auxiliary ejectors are used to evacuate test cells tothe desired pressure altitude before rocket engines areignited and to maintain this altitude after ignition. Sinceoptimum design of auxiliary ejectors --and proper control ofthem during the firing and tailoff sequence - should con-tribute to greatly attenuating if not eliminating thesepressure fluctuations, a study was made. For the experimentalphase, development of an exhauster capability was required.Staged steam ejectors were considered for the exhauster systemsince the primary interest of the study was ejector perform-ance. Practical experience in the design and performance ofthese ejectors -was desirable because staged ejector systems.have not been adequately discussed in the literature. Thisis especially, true of- nonisoenergetic systems employinginterstage condensing.
A computer program, developed during a previous study(Ref. 1), was used in the design of the exhauster system.The actual performance -of the system was compared with thattheoretically predicted, and the differences noted werecritically examined.
SECTION ilDESIGN CONSIDERATIONS
2.1 GENERAL
The staged ejector system was designed by using theone-dimensional, adiabatic, and frictionless ejector designprogram developed for another study. To allow for errorsthat might be introduced through the use of these assump-tions, the program was "overdriven" by approximately eight
1 H

AEDC-TR.65-257
percent. This was accomplished by exhausting to a pressure.of 16 ,psia ,rather than to atmospheric pressure. "Condensingspray coolers were located between ejector stages to removeas much of the steam from the preceding stages as possible.Cooler efficiency was assumed to be 50 percent.
The input to the exhauster system was programmed as theoutput from the simulated rocket engine - that is, a cold-flow nozzle operating at 500-psia air pressure. The weightflow rate was 0.5 inb/sec at 500 psia and 530°R total tem-perature. The additional parameters to be considered inthe design were the temperature of the condensing spraywater, the temperature of the steam, the quality of thesteam, and the number of stages of compression.
2.2 DETERMINATION OF NUMBER OF COMPRESSION STAGES
The altitude of the test cell was arbitrarily fixed atabout 110,000 to ll5,'000 ft so that distinctive pressuretransients could be obtained at simulated ignition and tail-off. The pressure rise of the cold-flow simulation nozzlewas determined to be approximately 6 psia, assuming a 0.9normal shock pressure recovery.. The overall pressure risewas therefore a proximately 9.5 psia. By using the relation-ship PRR JPex/Pin as developed in Ref. 1, the number of.stages, N, could be determined.
There is no optimum number of ejector stages for agiven pumping job. The designer applies the law of diminish-ing returns in making a selection compatible with his costfactors. Figure 9 of Ref. 2 shows, for example, that steamsavings of approximately 30 percent can be realized by i -creasing the number of pumping stages from two to three. Afurther increase from three to four, however, results in asteam reduction of 15 percent. In this study, the number ofstages was limited to iour. This gave the stage pressurerise ratio of *-2.67 or 1.278, which was used to compute theinterstage pressures. Consequently, -the first interstagepressure was 7.67 psia, the second 9=.79 psia, and the third12.52 psia..
2.3 SELECTION OF COOLING WATER TEMPERATURE
The temperature of the spray water used for steam con-densation has a two-foid effect upon the system. When-theinitial temperature difference between the steam ard thewater is large, the initial heat transfer and potential heatcontent of the water is greater than for a smaller tempera-ture difference. Thus less water is required as is indicatedin Ref. 1. However, a more important effect is the vapor
2
+ , t 'i-,+ ,+. ' + _ _ , - -- - . . -+-'._,,+, . . . .> . .,.+. ++..

AEDC.TR-65-257
pressure of the water. Water at 50°F has a vapor pressureof 0.178 psia, whereas water at 8OF has a vapor pre:ssure of0.507 psia. These pressures directly affect the water con-tent of the gas stream being pumped and therefore tie amountof pumping that is required in the succeeding stage. Sincethe cooling water temperature at AEDC varies seasonally fromapproximately 45 to 800 F, the higher figure was selected.This gives the exhauster system an all-season capability atdesign performance with a potential performance bonus to berealized during periods of cooler water temperatures. Thesize of the system did not pose any problem in the quantityof water required at the higher temperature.
2.4 STEAM PRESSURE, TEMPERATURE, AND QUALITY
The Central Steam Plant generates steam at 200 psia andsaturation. Conditions of the steam at the user's site varygreatly, however, depending upon the load, the season of theyear, and the distance from the plant. Because of the favor-able location of the exhauster system in relation to thesteam plant, a steam pressure of 150 psia at saturated con-ditions was selected for the design. This allowed a pressuredrop of 50 psi in line losses and lower -initial pressureswhich might be caused by large steam demands. No provisionswere made for the determination of steam quality.
2.5 COMPUTER SPECIFIED DESIGN
The previously determined values were put. in the program,and a computer run was made to obtain design values for theejector units. The program was written to solve the one-dimensional equations of flow under adiabatic conditions.The assumptions made in their solution are listed below:
1. The Mach number of the secondary or pumped flow is0.3 at the plane of the steam nozzle.
2. All steam from the ejectors is condensed in thesucceeding cooler.
3. The secondary flow leaves the coolers in a saturatedcondition at a temperature 20°F higher than theinlet temperature of the cooling water.
The following design values were obtained from the com-puter program:
First Jet Pumping Stage (holding ejector)
Steam flow rate, 0.21 ibm/secMixing duct diameter, 0.309 ft
3

AEDC-TR-65-257
First Interstage Condenser
Water flow rate, 182.1 gal/minCondenser diameter, 3.870 ft
Second Jet Pumping Stage
Steam flow rate, 0.18 lbm/secMixing duct diameter, 0.246 ft
Second Interstage Condenser
Water flow rate, 154.7 gal/minCondenser diameter, 3.665 ft
Third- Jet Pumping Stage
Steam flow rate, 0.18 lbm/secMixing duct diameter, 0.216 f-t
Third Interstage Condenser
Water flow rate, 155.0 gal/minCondenser diameter, 3.667 ft
Fourth Jet Pumping Stage
Steam flow rate, 0.18 lbm/secylixing duct diameter, 0.190 ft
The steam flow rate- of the first ejector was greaterthan that of the succeeding ejectors because of the greaterspecific volume of the secondary airflow, because of itstemperature. It was considered that the air from the simu-lated rocket would be heated to keep it above its lique-faction temperature during the expansion process. The tem-perature of: the air after recovery through the diffusionprocess -was therefore greater than the air temperatureentering the succeeding ejectors. The computer program wasrun for this higher temperature at the first ejector. Theassumption that the flow leaving the coolers is saturatedhad the effect of making the water content of the flow afunction of pressure only.
2.6 DESIGN OF EJECTORS
The flow rates specified by the computer were arbitrarilyincreased to be conservative. The first, 3r holding, ejectorflow rate was increased to 0.25 Ibm/sec, and the remainingejector flow rates were increased to 0.20 lbm/sec. Theseflow rates and the properties of the assumed supply steam
4

A EDC-TR-65-257
were used to determine the nozzle throat areas. The dif-fusers for all of the ejectors were made from 3-in. Sch 40pipe. This gave the first unit a 31-percent-undersizeddiffuser, the second unit was eight-percent oversized, thethird 40-percent oversized, and the fourth 81-percent over-sized. A better sizing could have been obtained by usingdifferent sizes and strengths of pipe. However, becauseof the many other unknowns involved in this design, theejectors were standardized at the 3.068-in. diffuser diameter.
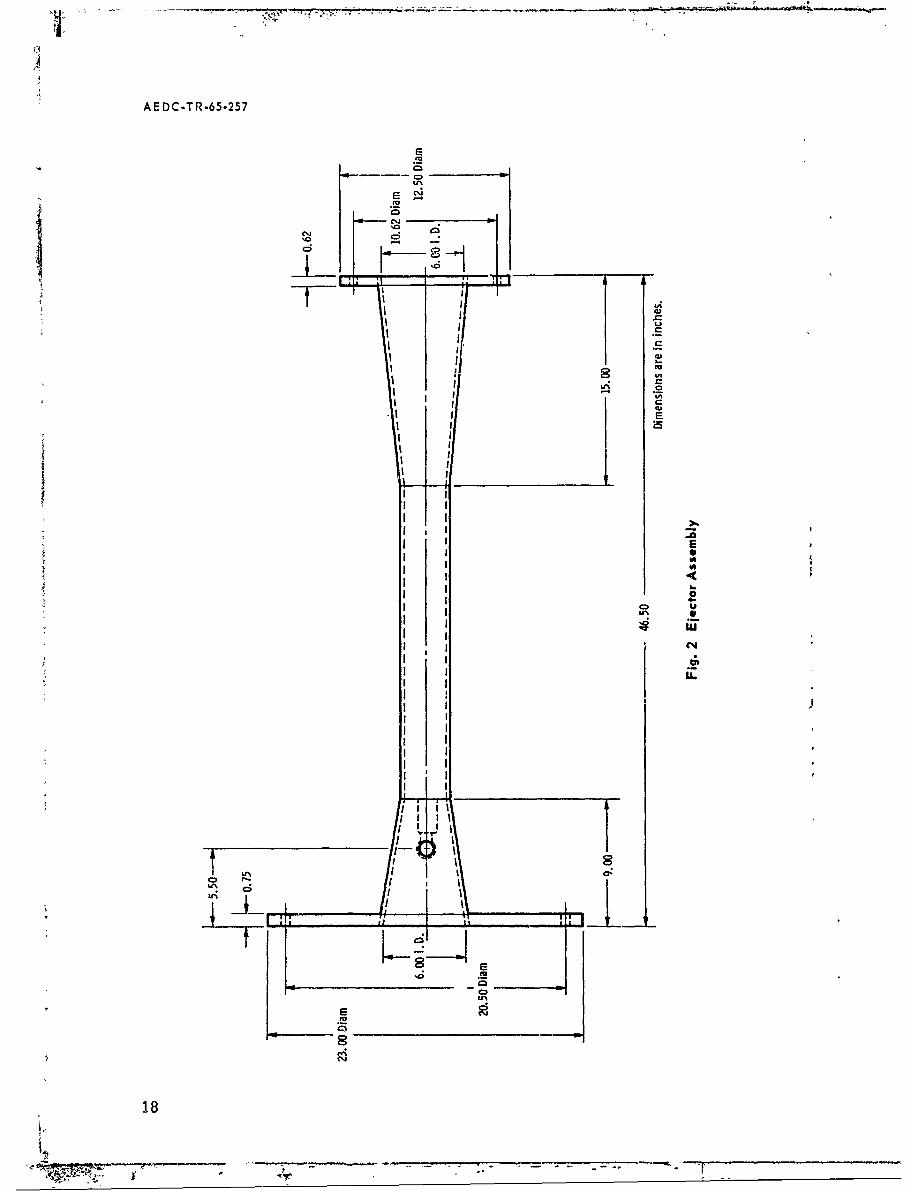
A length-to-diameter ratio of 7.5 was selected for alldiffusers. An inlet nozzle and subsonic aiffuser were in-stalled on each cylindrical supersonic diffuser. The sub-sonic diffusers had an. entrance diameter equal to the insidediameter of the supersonic diffuser. The exit diameter was6 in. with a total divergence angle of 11025'. The subsonicnozzles had an inlet diameter of 6 in. and an exit diameterequal to the diameter of the supersonic diffuser. The nozzletotal convergence angle was 24 deg.
The AD/A* value for the holding ejector was 63.51, andthe remaining three had an AD/A* value of 79.07. The steam.nozzles were designed with an exit diameter of 1.34 in. Thisgave an ANE/A* ratio of 12.15 for the holding ejector and15.12 for the remaining three. The nozzles were machined from17-4-PH stainless steel. -They all had a faired inlet bell-mouth and an 18-,deg half angle of divergence. A ;typi.calnozzle detail is shown in Fig. 1.
The steam nozzles were axially located in the subsonicnozzles with the exit plane of the nozzles located in theinlet plane of the supersonic diffuser. The nozzles weresupported by the 3/4-in, steam supply line which was Weldedinto the side of the inlet section. Figure 2 shows the con-figuration of the ejector assembly.
2.7 DESIGN OF THE SPRAY CONDENSERS-
The design of the condensers from the computer datapresented a difficult problem. The computer program solvesfor the condensers through an assumed process. Little in-formation is available, however, to substantiate the validityof this process. The assumptions made for the computer designprogra represent ideal conditions. A spray density of 40gpm/ft' of cross-sectional area, which may or may not be avalid figure, was assumed.
The greatest deviation from the specified design wasmade in the condenser design. Diameters were specifiedthat were between 3 and 4 ft. Fabrication costs andmaterial availability dictated a diameter of 2 ft. The
5
7

AEDC.-TR-65-257
length was increased .to 4 ft in an attempt to compensate forthe reduced diameter. The 2--ft diameter resulted in a con-denser with a cross-sectional area 73 percent less thanspecified for the maximum case. The water was sprayed intothe condenser with a Spraying Systems Co. 1-7G25 nozzle ob-tained from the Rocket Test Facility (RTF), AEDC.. Thisnozzle has a flow rate of 52.5 gpm at 90-psi water pressure.This gave a spray density of 16.7 gpm/ft2 in the condensers,or approximately 40 percent of the specified spray density.
A The spray nozzle was axially located in the cooler 4 in. fromthe entrance flangei spraying in a downstream direction.The nozzle was supported by a 1-in. supply line welded in thecondenser wall. A 3-in. drain line was provided to carry offthe spray water nnd steam condensate.
Since the pressure level in the condensers was at alltimes less than atmospheric, a barometric leg had to be pro-vided to allow gravity draining. A vertical drop of 24.5 ftwas obtained by utilizing an existing valve vault, whichallowed a first cooler pressure level of 4 psia. A separatedrain line from each condenser had to be run to the wellbecause of the difference in pressure levels at each condenser.All drain lines were terminated in a 55-gal drum to providethe water seal and the volume of water required to fill thedrain line to the level corresponding to the condenser pres-sure. Figure 3 shows the configuration of the condenser
assembly.
2.8 DESIGN OF THE ROCKET SIMULATION NOZZLE AND CELL
A simulated rocket was desired that could pump the celldown to a pressure corresponding to an altitude of 110,000to 115,000 ft. A supersonic diffuser was required with thesimulated rocket so that the flow could diffuse back up tothe desired pressure level of 6 psia at the inlet to theejector exhauster system. High pressure air to drive thesimulated rocket is available from the von Karman Facility(VKF), AEDC, high pressure supply. The desired flow rate of0.5 lbm/sec at a supply pressure around 500 psia is wellwithin the capability of the air supply system. Designparameters of an AD/A* ratio of 145 and a supersonic diffuserlength-to-diameter ratio of 7.5 were selected after theavailable literature on this particular design (Refs. 3 and
44) had been consulted.
As no condensing was needed between the exit of thesimulated rocket diffuser and tie first ejector, they couldbe directly connected, and it was convenient to make them ofthe same size pipe. Consequently, the nozzle throat areawas fixed, and only the selection of a driving pressure re-mained to be made. Calculations indicated that approximately
E;
1!A
AEDC.TR-65-257
,600 ,psia driving pressure would -satisfy both the altitude andthe pressure recovery requirements. Since this pressure ex-ceeded the maximum specified flow rate, the throat area wasreduced, resulting in an AD/A* value of 176.1. The simulatedrocket nozzle was made with a conical contour at a half angleof divergence of 18 deg. The nozzle expansion ratio of ANE/A*was 56.1. The AD/ANE ratio was 3.14.wNs
Calculations have indicated that the rate of the pressurefluctuations are a function of the volume of the test cell.The cell was therefore made small enough so that it would-have no large damping effect upon the pressure changes. Itwas fabricated from 14-in. pipe with a volume of approximately1 ft3 .
2.9 DESIGN OF THE ATMOSPHERIC FLOW ORIFICES
Since it was desirable to determine the performance ofthe exhauster system before operating the simulated rocketnozzle, an alternate method of loading the system was devised.A set of three ASME nozzles were fabricated from aluminum andinstalled in the front plate of the test cell. Two nozzleswere made to pass 0.10 lbm/sec and one to pass 0.05 lbm/secat standard atmospheric pressure and temperature. The flowcould be varied from 0.05 lbm/sed to 0.25 lbm/sec by holdinga critical pressure ratio across the desired nozzles.
The nozzles were designed according to the recommenda-tions of the ASME for long radius flow nozzles with low P*values (see Chapter 4, Part 5 of Supplement to Power Test Code,the American Society of Mechanical Engineers, Second Idition1959, and ASME Paper No.-63-WA-25, "Flow Nozzles with ZeroBeta Ratio.")
SECTION IIIINSTALLATION
The ejector exhauster system was installed witt therocket simulation cell inside the Propulsion Wind TnitelFacility (PWT), AEDC, transonic tunnel area. This Locationwas selected for the following reasons:
1. The area was already the site of an ESF p:coject, andmanpower, the control room, and instrumentationcould be shared.
*Diameter of the nozzle/diameter of the plenum upstream
of the nozzle.
7

-U AEDC-TR-65-257
2. The .area is adjacent to the YKF thigh pressure airline.
3. It is adjacent to high pressure steam.
4. It has adequate water supply and drainage provisions.
The cell was ]ocated on a concrete valve vault horizontalto and at a centerline distance of 5 ft from the ground. Thecooler and ejector units were supported by pipe stands. Thecell was supported by a fabricated brace which was designed
.9to cancel out any thrust from the system. The steam linewas extended from the PWT steam heater supply line to theexhauster system. The line was insulated along its fulllength to minimize heat loss. The high pressure air line wasextended along the transonic tunnel to the site of the ex-hauster system. It was then branched to supply buth thesupersonic compressor test stand and the steam ejector test.A high pressure regulator was installed at the initial pointof the line extension and set to deliver a 1500-psia pressure.The 1500-psia air was regulated to the desired pressure throughseparate regulators at each of the test installations.
When the installation was completed, the last ejectorand the drain lines were flanged off, and all water and steamsupply lines were valved off. The system was then evacuatedby using a 5-hp Kinney vacuum pump, and all the leaks thatcould be found were'sealed. The system leak rate was checkedperiodically during the Sealing period. The system was con-sidered to be adequately sealed for this type of testing whena leak rate -of less than 0.001 lbm/sec was obtained. Thecompleted installation is shown in Fig. 4.
SECTION IVINSTRUMENTATION
For instrumentation purposes the ejector system wastreated as four individual ejectors because the computerprogram analyzed each ejector separately. Each ejector wastherefore instrumented separately and identically to theothers.
) 4.1 PRESSURE
The following pressures were required for comparing theactual ejector performance with the predicted performances:(1) steam pressure at the ejector nozzle, (2) total pressureof the secondary flow upstream of the ejector, and (3) totalpressure downstream of the ejector. In addition to this
8

AEDC-TR-65-257 I
instrumentation required for the ejectors, it was also nec-essary to have the pressure of the cooling water supplied tothe condensers. The aerodynamic pressures were measured on0- to 100-in.-Hg Kollman gages with the exception of the cellpressure, which was measured on a 0- to 15-psia Heiss gage.The steam and cooling water pressures were measured on auto-matic synchronizer gages to avoid high pressure fluids beingintroduced into the control room. When the high pressureair system is made operational, the air pressure will alsobe measured on an automatic synchronizer gage.
4.2 TRANSIENTS
Pr-ovisions were made for the recording of pressuretransients when the ignition and tailoff cell pressure fluctu-ation investigation is made. A Consolidated ElectrodynamicsCorporation 18-channel oscillograph recorder was installedfor this purpose. Transient pressures to be recorded include:(1) cell pressure, (2) air pressure to the simulated rocketnozzle, and (3) steam pressure to the holding ejector.These pressures will be converted to a recorder signal bymeans of strain-gage transducers.
4.3 TEMPERATURE
The following tempcratures were required for the ejectorperformance analysis: (1) steam temperature and (2) atmos-pheric temperature. Additional temperature instrumentationwas installed, however, to give a better understanding ofthe condenser performance. These temperatures were: (1) cool-ing water in, (2) drain water out, (3) secondary flow intothe condenser, (4) and secondary flow out of the cooler. Alltemperatures were measured with iron-constantan (type J)thermocouples and read out on Sym-pli-trol indicators. Thetype J thermocouple was used because of its higher millivoltoutput than other standard thermocouples at low temperatures.
SECTION VPROCEDURES
The ejector system was started from rear to front andwas shut down from front to rear. This means that the fourth,or last, ejector was brought on the line, then the thirdcondenser, the third ejector, and on up to the first ejector.The shutdown was just the reverse, beginning with the firstejector. In all cases the condenser was turned on before itsassociated ejector was turned on, and the ejector was turnedoff before the condenser was turned off. This preventedfilling the system with steam, which condensed out in the
L
__ I 9

AEDC-TR-65.257
,pressure lines. The zero flow runs were made by varying thesteam pressure uniformly on all ejectors from 30 psi to maxi-mum. The condensers were initially run at 80-psi water pres-sure. A comparison made at 40-psi water pressure, however,showed no reduction in performance; therefore 40 psi was seton all subsequent runs. The runs with secondary flow wereset up in the same way as the zero flow runs, and then thesecondary flow rate was set by removing nozzle plugs. Theflow was increased until 0.25 Ibm/sec was reached or untilthe flow measuring nozzle did not have a critical pressureratio across it. When either happened, the steam pressurewas increased, and the secondary flows were again variedfrom 0 to 0.25 lb .sec. The steam pressure could be varied
4 between the level necessary to maintain a critical pressureratio across the orifice and the maximum available.
On each run the temperature and pressure data for eachejector stage were recorded. The atmospheric pressure andtemperature were recorded for each group of runs.
SECTION VIRESULTS
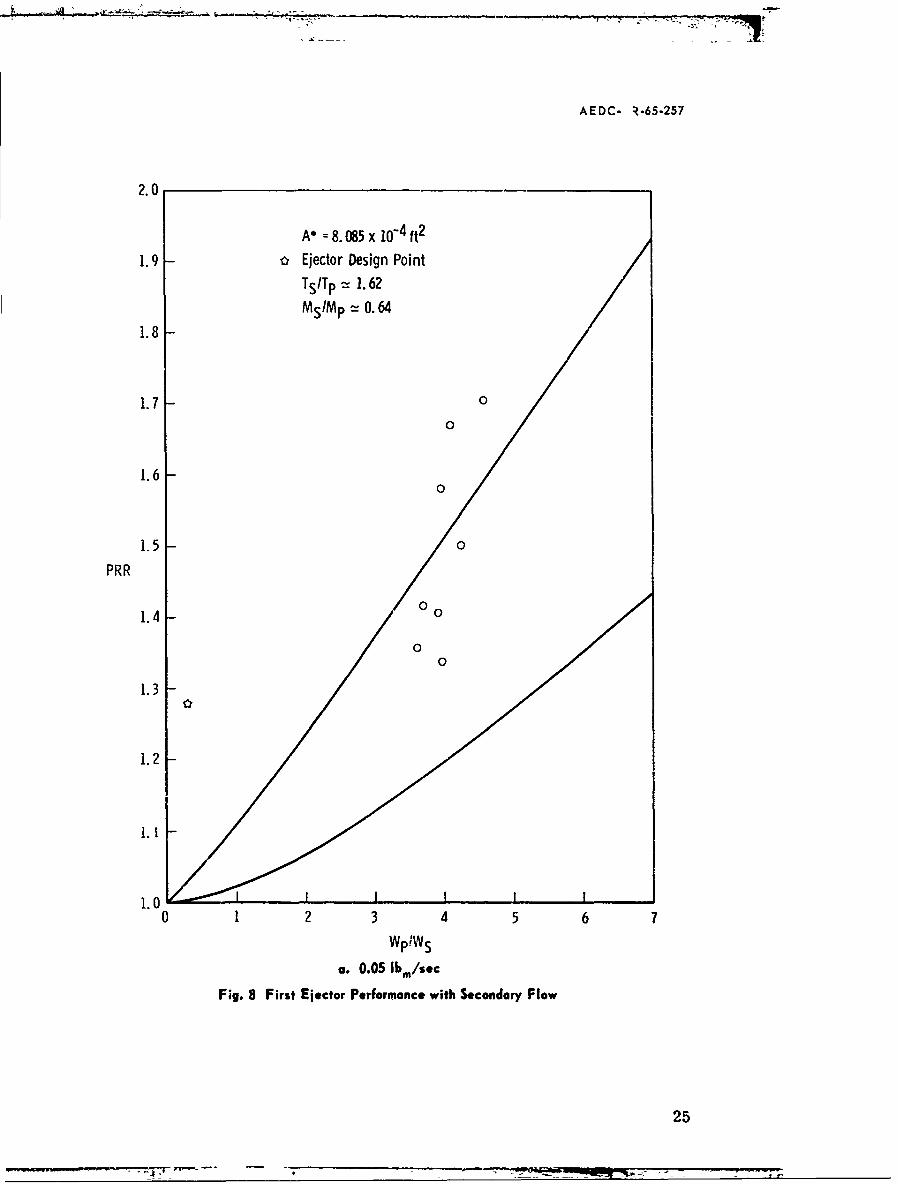
The performance data for the ejector system using theatmospheric flow orifices are presented in three ways. Theperformance with zero secondary flow is presented in the man-ner of Barton and Taylor (Ref. 3), and the pressure differenceacross the ejector is presented as a function of steam flow.The data on secondary flow performance were treated in a dif-ferent manner. The pressure rise ratio of the ejector wasshown as a function of primary-to-secondary weight flow ratio.The holding ejector was considered separately because of itslarger throat diameter, and the performance of the remainingthree ejectors was presented together because they are iden-tical. The secondary flow data are presented for weight flowsof 0.05, 0.10, 0.15, 0.20, and 0.25 lbm/sec. All the experi-mental data are presented along with two computer predictedperformance lines which show the maximum and mimimum perform-ance, depending upon the inlet pressure level of the secon-dary flow. More detailed information about this, as well asthe zero flow case, is presented in Ref. 5.
6.1 ZERO FLOW PERFORMANCE
Figure 5 shows the performance of the holding ejectoron the Barton-Taylor plot of reciprocal nozzle pressureratio as a function of the reciprocal driving pressure ratio.No attempt was made to "start" the ejector, and the resultsare presented in this plot for comparison with previous data.
10

AEL)C.TR.65.2SI
Figure 6 shows the performance of the first of the threepumping ejectors presented on the same plot. The holding I
ejector pumped to a pressure rise ratio slightly greaterthan 2.5 at its best point. The geometry of this ejector issuch that it would have to reach a pressure rise ratio of 18before it would start. The second ejector reached a pressurerise ratio of about 2 at its best point. A pressure riseratio of about 20 would be necessary to start this ejector,These plots are presented for purposes of comparison only
since these ejectors were not designed for this type ofoperation.
Figures 7a and b show the performance of the holdingejector and the pumping ejectors as a function of steam flow.The experimental data for the holding ejector are almost allabove the upper perfcrmance line. The data on the remainingejectors have some points above the upper performance line,but most o± the points fall between the lines. Data on, orclose to the lower line, are in almost all cases for thefourth ejector. This is as expected" because of the higherinlet total pressure of the secondary flow to this ejector.
4
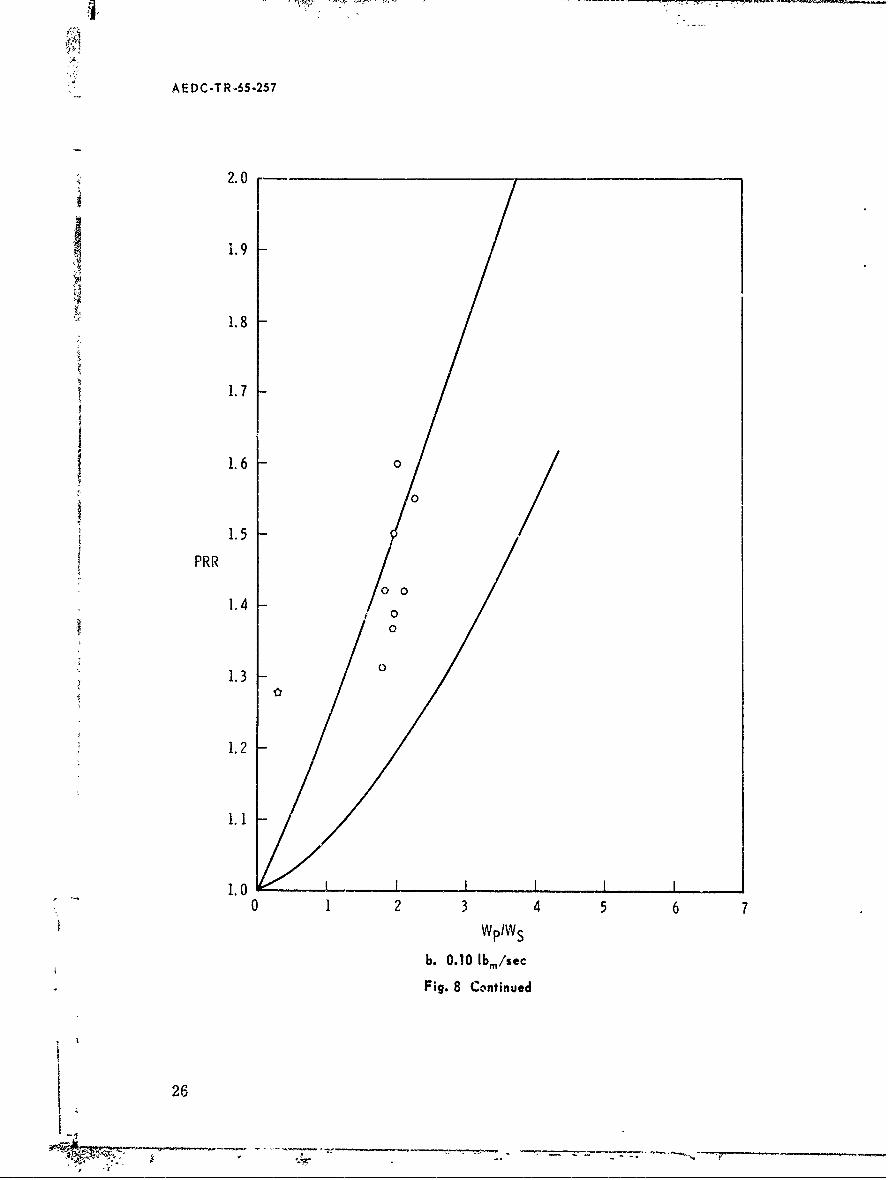
6.2 SECONDARY FLOW PERFORMANCE OF THE HOLDING EJECTOR
The secondary flow data on the ejectors are again dtreated separately because of the differences in throatdiameters. Figure 8a shows the performance of the holding iejector for a secondary flow rate of 0.05 lbm/sec. The per-formance is better than predicted for three points and withinthe prediction for the remaining five. One would expect thedata to lie near the upper curve because the secondary flowinlet total pressure on the holding ejector is the lowest inthe system. Figure 8b shows the holding ejector performancefor 0.10 lbm/sec. The performance is not as good as with0.05 lbm/sec, with only one point falling above the upperperformance line. The data are generally closest to theperformance line for low secondary inlet pressure. Holdingejector performance for 0.15 lbm/sec is shown in Fig. 8c.All of the data now fall within the performance curves. Thedata are obviously becoming more vertical in alignment. Fora constant secondary flow rate, relatively large increasesin pressure rise ratio can be obtained with a small increasein primary steam flow. Figure 8d is for a flow rate of 0.20lbm/sec. All data are within the predicted performance, butthey are more centered between the curves rather than beingclose to either one. It should be noted also that the per-formance lines come closer together and more nearly verticalas the secondary flow rate increases. Figure 8e shows per-formance for 0.25 lbm/sec. The performance is within predic-tions but is less efficient than for previous cases based on I'
the relative location of the points to the performance lines.
11

AEDC-TR-65-257
6.3 SECONDARY FLOW PERFORMANCE OF JET PUMPING EJECTORS
All the jet pumping data are presented in the curves ofconstant secondary flow rate. Figure 9a shows the performancefor 0.05 lbr/sec. Approximately 20 percent of the data fallbelow the lower line of predicted performance. The remainderof the points are in the lower half of the performance enve-lope. Examination of the data shows three separate linesmoving generally parallel to the performance lines. Theupper line is for the second ejector, the middle line is forthe third ejector, and the lower line is for the fourth and
last ejector. The relative positioning of the data is asexpected because of the inlet total pressure effect. Figure9b shows performance for the 0.10-lb /sec secondary flow rate.The fourth ejector has about the same percentage of pointsoutside of the performance envelope as the 0.05-lbm/sec curve.TiThe data from-the second and third ejectors are grouped closertogether, however, and cannot be as readily distinguished.Figures 9c, d, and e show the ejector performance for second-ary flow rates of 0.15, 0.20, and 0425 lbm/sec, respectively.The performance shown here follows the same trend as previ-ously indicated, with the data approaching the lower per-formance line more closely with increasing flow. In Figure9e the data are clustered around the lower line. In Figure9e, also, the Wp/WS ratio is less than one for all cases.The measured pressure rise ratio of all points is also less
than the design pressure rise ratio of 1.278, which is shownon Figs. 8 and 9 by a star symbol.
SECTION VIIDISCUSSION
The results obtained were much as expected. The zeroflow performance for both the holding ejector and the jetpumping ejectors correlates well with the one-dimensionalisentropic calculation. The performance for secondary flowrates of 0.05 and 0.10 lbm/sec (1/10 and 1/5 design) isgenerally better than predicted. The holding ejector datafor flow rates of 0.15, 0.20, and 0.25 lb /sec fall withinthe predicted performance envelope. The Wata on the jetpumping ejectors, however, show that performance was lessthan predicted from the very low flow rate of 0.05 ibm/secup through 0.25 lbm/sec.
An explanation was sought because these three physicallyidentical ejectors have identical predicted performance.Also the distinctive alignment of the individual ejectordata in Fig. 9a was puzzling. Although the effect of
12

AEDC-TR-65-257
secondary inlet total pressure might account for the dis-tinctive alignment, this effect should not hal:e been greatenough to move the data below the performance envelope.
There were two likely causes for this performance:the design deviations of the ejectors and the spray coolers.The ejectors are felt to exert primary influence because oftheir controlling function on the operational performance.Referring to Section 2.7, the last two ejectors were 40 and81-percent oversized, respectively. A check made on thissystem using an off-design ejector program (Ref. 5) that wasnot available at the time the ejectors were designed iidicatesthat there is not sufficient steam pressure available toraise the performance of these oversized units up to the de-sign point. This fact is considered to be the prime reasonfor the degenerate performance with each additional stage.
The spray condensers were also checked for any contri-bution they might be making to the substandard performance.Since the holding ejector does not have an upstream condenser,its performance would be comparable to that of the otherejectors if the condensers were performing as it was assumedthat they would. The effect of the condensers upon the per-formance was evaluated by operating the last three ejectorsboth with and without he first cooler. The results of thischeck are shown in Fig. 10 in which AP attributable to thecooler is a function of secondary flow rate only. The effecton the first ejector is negligible at 0.05 ibm/sec but in-creases from a two-percent variation at 0.10 lbm/sec to sixpercent at 0.20 lbm/sec. Figure 10 was replotted in termsof APR in Fig. 11 so that the results could be directly ap-plied to the performance plots. Figbre 11 shows performance(AP) falling off directly with increasing secondary flow.
This effect can be the result of two conditions that mayhave been present. If the efficiency of the condensers issuch that all of the steam from the preceding stage is notcondensed out, the steam carry-over would cause a greaterload requirement on the succeeding ejector. This would bea cumulative effect; and the last ejector would be operatingunder the worst conditions, as the data indicate.
Also since the condensers were not sized to the diameterrecommended by the computer program, the velocity of the flowthrough them is larger than optimum. This could result inspray water being carried through the condenser and into thenext ejector stage, where it would have a detrimental effect.These results indicate that no correction should be made tothe 0.05 lbm/sec data. However, these data apply to one con-denser and one ejector only, whereas the performance of thelast ejector may be affected by three condensers if their
113
AEDC-TR-65-257
effects are cumulative. Consequently, there could be acorrection for the third and fourth ejectors that would notshow up in this check of one condenser and ejector unit.
The flow velocity through the condensers is calculatedfor the different flow rates at the design pressure and exittemperature. The results of these calculations are shown inFig. 12 and indicate that the effect of spray water carryovershould be greatest in the first condenser. If the observedchanges in pressure rise ratio are related to velocity throughthe condenser and the resulting corrections then applied tothe data, the effect would be to increase the spread amongthe individual ejector data rather than to reduce it. Thecooler effects must therefore be in some manner additive.The effects of the first cooler are not only felt in thesecond ejector but also in the third and fourth ejectors.This would also be true with the effects of the second con-denser being felt in the third and fourth ejectors. The
performance of the second ejector would thei'efore be besteven though it apparently has the worst velocity conditionin its preceding cooler.
SECTION VIIICONCLUSIONS
One-dimensional analysis was used to design a ztagedsteam ejector system. The system gives experimental resultsthat are generally within the predicted performance envelope.In the design of jet pumps the design data should be adheredto as closely as possible. If deviations must be made, indi-cations are such that the deviation should be toward under-sizing rather than oversizing the unit, The spray condensersused between the steam ejector stages may also have an impor-tant influence upon the overall performance of the system andshould be designed for low gas velocities. The best systemperformance is obtained when the ejectors are operated atequal primary flow rates.
The design of spray condensers may be a critical factorin the performance of staged steam ejectors, and investiga-tions should be made in this area. The condensers were ap-parently operating at a greater efficiency than predicted,but they may have a performance influence which is feltdownstream throughout the system.
The effect of the Mach number of the secondary flow inthe region c£ the ejector steam jet is potentially of greatinfluence upon ejector performance and should be evaluated.
I. 14.I2______________________
AEDC-TR-65-257
REFERENCES
1. Smith, F. H., Jr. "Capability and Cost Study for Com-ponent and Model Test Facility, Phase I, Supplement 1,Analytical Methods for Design of Multistage Gas-DrivenEjector Systems with Interstage Cooling." AEDC-TR-65-139 (AD 467444), July 1965.
2. Carter, P. B., Jr. "Capability and Cost Study for Com-ponent and Model Test Facility, Phase II, Supplement 3,Optimization of Certain Ejector Design Parameters."AEDC-TR-65-141 (AD 466563), July 1965.
3. Barton, D. L. and Taylor, D. "An Investigation ofEjectors without Induced Flow - Phase I." AEDC-TN-59-145 (AD 229860), December 1959.
4. German, R. C. and Bauer, R. C. "Effects of DiffuserLength on the Performance of Ejectors without InducedFlow." AEDC-TN-61-89 (AD 262888), August 1961.
5. Carter, P. B., Jr. and Moger, W. C. "Capability and CostStudy for Component and Model Test Facility, Phase III,Supplement 4, Analytical Methods and Computer Programfor Off-Design Performance Evaluation of MultistageGas-Driven Ejector Systems with Interstage Cooling."AEDC-TR-65-142 (AD 467043), July 1965.
6. Carter, P. B., Jr. "Capability and Cost Study for Com-ponent and Model Test Facility, Phase III, Supplement5, Off Design Performance of the Component and ModelTest Facility Exhauster System." AEDC-TR-65-143 (AD467445), August 1965.
15

AEDC-TR-65-257
00
LroNM) Lcn
z)40- i= po
LrL.
(C5
17
AE DC-TR-65-257
.],.40
A_~
U'm
4%,*
ic
I C
I C
I * uci
m3
18 -' E

!
AEDC-TR*65-257
rci
0
c,
UlU'
C3C
E
E
'a
MC
1EE L
NN0
@ =
ir(%C,.
8T
A°l

___________ - - .
AEDC-TR.65257
"- C
i1
.4
4 1
I _I ~jciIi
1
I-
US
w1~L I~*
~
-~ :1
A --
I20
,j. ~ C - - ------ =--.--~--. - - - .-

AEDC-TR-65-257
0.10
0.08-
0.06 o Ejector Design Point
ANEIA - 15.123
0.4 AD/A = 79.069 o
0.04-
0.02 0
0
PinPP0.010
0.008
0.006
0.004
0.002
0.0010.01 0.02 0.04 0.06 0.08 -0.10
PexlPp
Fig. 5 Zero Flow Performance of First Ejector
21

AEDC-TR-65-257
1.0~0.8-
0.6 - o Ejector Design Point
_ ANEIA ° - 12. 148
0.4 - ADIA* , 63.514
0.0 - 0 , ,'0.2 - "
00COo
00
p O.' 0-o ). ,
P~irlp 0.08-o
0.06 o,,
080.04- o
0.02 -
0.01 U
.01 0.02 0.03 0.05 0.10 0.2 0.3 0.5 1.0
Pex 1Pp
Fig. 6 Zero Flow Performance of Second Ejector
22

AEDC-TR-65-257
6
C;
0
C'j0 0 CDJ
0o0 00
0\
0 0 0
0
0 %C0'00
42
) -- E
r- Ii EL_4 .0 0
00
0 d
ou00 C~ iZ
E
0
02m
0 00
0 cs
000 0
m m ~j c -4 5 C5 c; a
!sd adV sW aJflSSaJd
23

AEDC-TR-65-257
06
0 ) C:5
06
00
060
0Qjc) 00
0060
0 00
0
0wus
0U 0
0 cc
0
006
C)
S C'.j C: 00 %0 IT M\ 0 0 0 CT el%s ) m0 'o Wr '. CD %
m v C-ji -., CQ i vJ .!-4 - ~~6 6
Isd dV'asi8 ainSSaJc
24
AEDC- R-65-257
2.0
A*8. 085 x 10-4 ft2
1.9 - o Ejector Design PointTSITp =1. 62MSIMp 0. 64
1.8
1.7 -00
1.60
1.5 -0
PRR
1.4 0
00
1.3
1.2
1. 1
1.00 1 2 3 4 5 6 7
Wp'WS
a. 0.05 Ibm/sOC
Fig. 8 First Ejector Performance with Secondary Flow
25
~ - 7w-7
AEDC-TR-65-257
2.0
1.9
1.8
1.7I1.6 0
1.5
PRR
00
1.40
; 0
1.3
0
1.2
1. 1
1.0 I I I I I0 1 2 3 4 5 6 7
WP/WS
b. 0.10 Ibm/secFig. 8 Continued
26
*F "'. r

AEDC-TR-65.257
2.0
1.9
1.8
1.7
1.6 -
1.5PRR 0
01.4 -
0
1.3 - 0
1.2
1. 1
1.0 I I I I0 1 2 3 4 5 6 7
wpIws
C. 0.15 Ibm/ec
Fig. 8 Continted
27
AEDC-TR-65-257
2.0
1.9
1.8
1.7
1.6
1.5
PRR
1.4 - 0
00
1.3 - 0
0
1.2
1.1
1.0 I I I I0 1 2 3 4 5 6 7
Wp/W S
d. 0.20 Ibm/Sec
Fig. 8 Continued
28
AEDC-TR-65-257
2.0
1.9
1. ,
1.7
1.6
1.5PRR
1.4
0
1.3 0
000
1.2
1.1
0 1 2 3 4 5 6 7WpIWS
e. 0.25 Ibm/ ec
Fig. 8 Concluded
29
7T,

AIEDC-TR-I5.257
2.0
1.9 A* 6.49 x 10-4 ft2
o Ejector Design Point
TsITp = 1.62
1.8 MsIMp 0. 64
L7
1.6
1.5
PRR
1.4 6
00
i1.3-0~ 8 0
00 0
0
1.2 o0 0
0
1.1
1.0 10 1 2 3 4 5 6
WPlWs
a. 0.05 Ibm/sec
Fig. 9 Second, Third, onZ Fourth Ejector Performance with Secondary Flow
30
A E DC-1 R-65-257
2.0
1.9
1.8
1.7
1.6
1.5PRR
1.400
1.3- o
1.2 a0
1.1
1.0 I I I I I I
0 1 2 3 4 5 6 7
WP/Ws
b. 0.10 Ibm/sec
Fig. 9 Continued
t311

AEDC-TR-65-257
2.0
Ai 1.9
1.8
1.7I1II
1.6
1.5PRR
1.4
81.3 8
1.2
1.1
1.0 I I i I
0 1 2 3 4 5 6 7wP/ws,
c. 0.15 Ibm/sec
Fig. 9 Continued
32

AEDC-TR-65-257
2.0
1.9
1.8
1.7 i
1.6 -
1.5
PRR
1.4
1.3
1.2
1. 1
0 2 3 4 5 6 7
wPIWSd. 0.20 Ibm/sec
Fig. 9 Continued
33

AEDC-TR-65-257
2.0
1.9
1.8
1 1.7
1.6
1.5PRR
1.4
1.3
1.2
1.1
1.0 I I I ! I0 1 2 3 4 5 6 7
WPIWS
. 0.25 Ibm/SOC
Fig. 9 Concluded
34

AEDC-TR-65-257
Ci1
00
w
CD 0
CD 0u
0~ 00a
- S
C)L CD L
CL:
77775: l -
AEDC-TR-65-257
-0.04
4!
-0.03
IJ
Ii
APRR -0. 02
-0.01
0I
0 0.05 0.10 0.15 0.20 0.25
Secondary Flow Rate, W S, Ibmlsec
Fig. II Effect of Cooler on Pressure Rise Ratio of Second Ejector
36
;:. S " •-r .- . . . -

AEDC-TR-65-257
5-
4
3
icqz
22
0
0 0.1I 0.2 0.3 0.4 0.5 0.6
Secondary Flow Rate, WS, Ibmlsec
Fig. 12 Actual and Predicted Secondary Flow Velocity through Condensers
37

Security Ctassificition,_,_'__ "_ _
DOCUMENT CONTROL DATA- R&D(Security classification of title, body of abstract and i6dexing annotatior; must be entered when tho overall report is classified)
I. ORIGINATIN G ACTIVITY (Corporate author) 2a. REPORT SECURITY C LASSIFICATION
Arnold Er neering Development Center UNCLASSIFIEDARO, Inc Operating Contractor 2b. ROUP N/AArnold Air Force Station, Tennessee
3. REPORT TITLE
DESIGN AND PERFORMANCE OF STAGED STEAM EJECTORS WITHINTERSTAGE CONDENSERS
4. DESCRIPTIVE NOTES (Type of report and Inclusive dates)
N/AS. AUTHOR(S) (Last name, first name, initial)
F. H. Smith, Jr., ARO, Inc.
6. REPORT DATE 7a. TOTAL NO. OF PAGES 7b. NO. OF REFS
March 1966 44 6 &ea. CONTRACT OR GRANT NO. 98. ORIGINATOR'S REPORT NUMBER(S)
AF40(600)-1200b. PROJECT NO. 9514 AEDC-TR-65-257
.. System 921E/1461 9b. OTHER REPORT NO(S) (Any other numbr thatmay b, asignedthis report)
d. Task 951411 N/A10. A VA IL ABILITY/LIMITATION NOTICES
Qualified users may obtain copies of this report from DDC. Thedistribution of this document is unlimited.
11. SUPPL EMENTAPY NOTES 12. SPONSORING MILITARY ACTIVITY
N/A Hq, Arnold Engineering DevelopmentCenter, Air Force Systems Command,
_____________ _ Arnold Air Force Station. Tenn.13. ABSTRACT
One-dimensional. analysis was used to design a staged steamejector system. The system gives experimental results that arewithin the predicted performance envelope. The differences betweenthe experimental results and theoretical predictions are criticallyexamined. It was concluded (1) that the design of spray condensersbetween the ejector stages has an important influence on the overallperformance of the system, (2) that the best system performance wasobtained when the ejectors were operated at equal primary flow rates,and (3) that the effect of the Mach number of the seiondary flow in
ejector performance.
i
DD I'4
DSecurity Classification
DD 1JA84 147

Security Classification
14 LINK A "INK B LINK CKEY WORDS ROLE WT ROLE WT ROLE WT
Project SUPER
Ejectors
Staged Steam Ejectors
Design
Performance
INSTRUCTIONS
1. ORIGINATING ACTIVITY: Enter the name and address imposed by security classification, using standard statementsof the contractor, subcontractor, grantee, Department of De- such as:fense activity or othur organization (corporate author) issuing (1) "Qualified requesters may obtain copies of thisthe report. report from DDC."
2a. REPORT SECUFITY CLASSIFICATION: Enter the over- (2) "Foreign announcement and dissemination of thisall security classification of the report. Indicate whether report by DDC is not authorized.""Restricted Data" is includectd, Marking is to be in accord-
ance with appropriate security reg.ulations. (3) "U. S. Government agencies may obtain copies ofthis report directly from DDC. Other qualified DDC
2b. GROUP: Automatic downgr,1. ing is specified in DoD Di- users shall request throughrective 5200. 10 and Armed Forc .s Industrial Manual. Enterthe group number. Also, when Gppdcable, show that optionalmarkings have been used for Group 3 and Group 4 as author- (4) "U. S. military agencies may obtain copies of thisized. report directly from DDC. Other qualified users
3. REPORT TITLE: Enter the complete report title in all shall request throughcapital letters. Titles in all cases should be unclassified. ,,If a meaningful title cannot be selected without classifica-tion, show title classification in all capitals in parenthesis (5) "All distribution of this report is controlled, Qual-imrm.ediately following the title, ified DDC users shall request through
4. DESCRIPTIVE NOTES: If appropriate, enter the type of *"
report, e.g., interim, progress, summary, annual, or final. If the report has been furnished to the Office of TechnicalGive the inclusive dates when a specific reporting period is Services, Department of Commerce, for sale to the public, indi-covered. cate this fact and enter the price, if known.
5. AUTHOR(S): Enter the name(s) of author(s) as shown on 11. SUPPLEAIENTARY NOTES: Use for additional explana-or in the report. Entei last name, first name, middle initial, tory notes.If military, show rank and branch of service. The name ofthe principal -,thcr is an absolute minimum requirement. 12. SPONSORING MILITARY ACTIVITY: Enter the name of
the departmental project offi-e or laboratory sponsoring (pay-6. REPORT DATZ Enter the date of the report as day, ina for) the research and development. Include address.month, ybar; or month, year. If more than one date appearson the report, use date of publication. 13. ABSTRACT* Enter an abstract giving a brief and factual
summary of the document indicative of the report, even though7a. TOTAL NUMBER OF PAGES: The total page count it :nay also appear elsewhere in the body of the technical re-should follow normal pagination procedures, i.e., enter the port. If additional space is require,. continuation sheet shallnumber of pages containing information be attached.
7b. NUMBER OF REFERENCES: Enter the total number of It is highly desrable that the abstract of classified reportsreferences cited in the report. be unclassified. Each paragraph of the abstract shall end with8a. CONTRACT OR GRANT NUMBER: If appropriate, enter an indication of the military security classification of the in-the applicable number of the contraLt or grant under which formation in the paragraph, represented as (TS). (S), (C), or (U). .4the report was written. There is no limitation on the length of the abstract. How- :Ai
8b, 8c, & 8d. PROJECT NUMBER: Enter the appropriate ever, the suggested length is from 150 to 225 words.military department identification, such as project number,subproject number, system ntmbers, task number, etc. 14. KEY WORDS: Key words are technically meaningful terms
or short phrases that characterize a report and may be used as t"-9a. ORIGINATOR'S REPORT NUMBER(S): Enter the offl- index entries for cataloging the report. Key words must becial report number by which the document will be identified selected so that no security classification is required. Identi-and contrclled by the originating activity. This nurn' "er must fiers, such 'as equipment model designation, trade name, militarybe unique to this report. project code na.me, geographic location, may.be used as key
9b. OTHER REPORT NLMB~ER(S): If the report has been words but will be followed by an indication of technical con-assigned -tny oth*-t report numbers (either "j the orianator text. The assignment of links, rules, and weights is optional.or by the sponsor), also enter this number(s).
10. AVAULAB LITY/LIMITATION NOTICES: Enter any lim-itations on further dissemination of the report, other than those
4_ _ _Security Classification