Embed Size (px)
Citation preview
Eindhoven University of Technology
MASTER
Implementation of optical amplification in a national-scale SDH network
Steinberg, J.
Award date:2006
Link to publication
DisclaimerThis document contains a student thesis (bachelor's or master's), as authored by a student at Eindhoven University of Technology. Studenttheses are made available in the TU/e repository upon obtaining the required degree. The grade received is not published on the documentas presented in the repository. The required complexity or quality of research of student theses may vary by program, and the requiredminimum study period may vary in duration.
General rightsCopyright and moral rights for the publications made accessible in the public portal are retained by the authors and/or other copyright ownersand it is a condition of accessing publications that users recognise and abide by the legal requirements associated with these rights.
• Users may download and print one copy of any publication from the public portal for the purpose of private study or research. • You may not further distribute the material or use it for any profit-making activity or commercial gain

Implementation of OpticalAmplification in a National-Scale
SDHNetwork
by Joris Steinberg
MSc graduation thesisMay 2005 - February 2006
Location:
Training Coordinator (COMSAT):Training Coordinator (ITBA):
Supervising Professor:Training Coordinator (TU/e):Department:
COMSAT International &ITBA (Instituto Tecnol6gico de Buenos Aires),Buenos Aires, ArgentinaIng. L. A. ZandanelDr. D. F. Grosz
Prof. ir. A. M. J. KoonenDr. I. Tafur MonroyEindhoven University of Technology,Faculty of Electrical Engineering, TTE-ECO

Implementation ofOptical Amplification in a National-Scale SDH Network
Preface
This report describes the ten months of work done at COMSAT Argentina and the InstitutoTecnol6gico de Buenos Aires (ITBA) as part of my MSc graduation thesis and concludes myfive and a half years of study at Eindhoven University of Technology (TU/e). Furthermore thereport serves as a recommendation for network changes in COMSAT's national SOH ringnetwork.
I greatly enjoyed working at COMSAT and this project added a most valuable practicalexperience to my educational trajectory. My special thanks go out to Dr. Diego F. Grosz fromthe Instituto Tecnol6gico de Buenos Aires who guided me with everlasting enthusiasm duringthese ten months of work.
From COMSAT I wish to thank the employees who welcomed me with great enthusiasm andin special I would like to name my direct guide ing. Leonardo A Zandanel and the ProgramManagement Engineers Gabriel A Vaschchuk and Gustavo E. Pifieyro for providing me withall the SOH network related details, teaching me 'Lunfardo' (slang spoken in Buenos Aires)and for taking me along on field work in downtown Buenos Aires with the climax being thedeployment of a fiber network connection in the 'Casa Rosada' (The Argentinean President'sworking residence).
I would like to acknowledge the TUE International Relations Office and the KIVI NIRIA forproviding me with a scholarship.
2
Finally, I wish to thank Prof. ir. AM.J. Koonen and Dr. I. Tafur Monroy who closely observedmy progress from within TU/e.
Buenos Aires, February 28,2006
loris Steinberg
J. Steinberg

Implementation ojOptical Amplification in a National-Scale SDH Network
Contents
3
Assignment 5Abstract 6Resumen en Castellano 7List of Symbols and Abbreviations 81 Introduction to SONET/SDH 11
1.1 Background 111.2 T-Carrier 121. 3 Architecture 131.4 Multiplexing 141.5 Frame Structures 151.6 Overhead 171.7 Network Components 191.8 Protection and Rings 201.9 Clocking 211.10 Advantages 22
2 SDH network operated by COMSAT 232.1 POPs and Distances 232.2 Fiber types and Losses 242.3 Optical Power Levels 252.4 WaveStar™ADM 1611 272.5 Tributary Interfaces - Clients 29
3 Attenuation and Dispersion Calculations 333.1 Distances 333.2 Attenuation 333.3 BER versus OSNR 363.4 Dispersion 36
4 General Solutions 394.1 In-line EDFA Amplification 394.2 Booster EDFA Amplification 404.3 Raman Amplification 414.4 Financial Aspects 42
5 Vendor Solutions 445.1 Lucent Technologies 445.2 Padtec 455.3 Meriton Networks 49
6 Implementation 506.1 Implemented Solution 506.2 Schematic Measurement Setup - Preparations 516.3 Measurements 52
7 Future Capacity Upgrades 597.1 WDM o.ffour 2,5-Gbls wavelength channels 597.2 Single 10-Gbls wavelength channel.. 59
8 Conclusions 609 Conclusiones en Castellano 62
J. Steinberg

Implementation ofOptical Amplification in a National-Scale SDH Network 4
List of Figures and Tables 64Appendix A: Matlab Scripts 66
A.l BER vs. OSNR for various transmitter extinction-ratios 66A.2 BER vs. OSNRfor NZDSF and SSMF with Chirp and z = 180 km 70
Appendix B: Initial Communication with Vendors 74Appendix C: SDH STM-l BERT Results 76Appendix D: Padtec Management Tool Screens 79Appendix E: Software & Equipment 80References 81Suggestions for Further Reading 82
J. Steinberg
Implementation ofOptical Amplification in a National-Scale SDH Network
Assignment
5
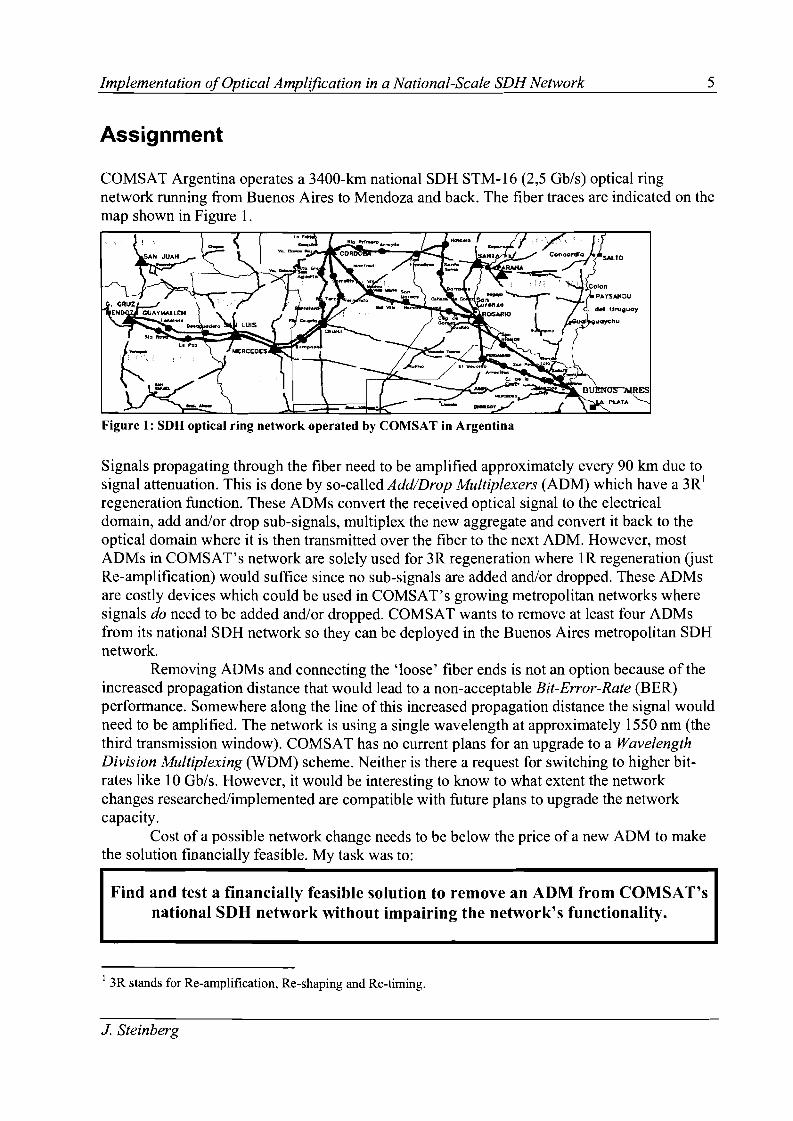
COMSAT Argentina operates a 3400-km national SOH STM-16 (2,5 Gb/s) optical ringnetwork running from Buenos Aires to Mendoza and back. The fiber traces are indicated on themap shown in Figure 1.
Figure 1: SOH optical ring network operated by COMSAT in Argentina
Signals propagating through the fiber need to be amplified approximately every 90 km due tosignal attenuation. This is done by so-called Add/Drop Multiplexers (ADM) which have a 3R1
regeneration function. These ADMs convert the received optical signal to the electricaldomain, add and/or drop sub-signals, multiplex the new aggregate and convert it back to theoptical domain where it is then transmitted over the fiber to the next ADM. However, mostAOMs in COMSAT's network are solely used for 3R regeneration where lR regeneration (justRe-amplification) would suffice since no sub-signals are added and/or dropped. These ADMsare costly devices which could be used in COMSAT' s growing metropolitan networks wheresignals do need to be added and/or dropped. COMSAT wants to remove at least four AOMsfrom its national SDH network so they can be deployed in the Buenos Aires metropolitan SDHnetwork.
Removing AOMs and connecting the 'loose' fiber ends is not an option because of theincreased propagation distance that would lead to a non-acceptable Bit-Error-Rate (BER)performance. Somewhere along the line of this increased propagation distance the signal wouldneed to be amplified. The network is using a single wavelength at approximately 1550 nm (thethird transmission window). COMSAT has no current plans for an upgrade to a WavelengthDivision Multiplexing (WDM) scheme. Neither is there a request for switching to higher bitrates like 10 Gb/s. However, it would be interesting to know to what extent the networkchanges researched/implemented are compatible with future plans to upgrade the networkcapacity.
Cost of a possible network change needs to be below the price of a new ADM to makethe solution financially feasible. My task was to:
Find and test a financially feasible solution to remove an ADM from COMSAT'snational SnH network without impairing the network's functionality.
I 3R stands for Re-amplification, Re-shaping and Re-timing.
J. Steinberg
Implementation ofOptical Amplification in a National-Scale SDH Network
Abstract
The report is divided as follows:
6
• Chapter One serves as an introduction to the Synchronous Optical NETwork (SONET)and the Synchronous Digital Hierarchy (SDH). SDH is the transport standard that isused in the optical ring network that COMSAT deploys. History and the background ofSONET/SDH are presented. Technical aspects such as architecture, multiplexing, framestructures, overhead, network components, protection & rings and clocking are alsodiscussed.
• Chapter Two describes the SDH network operated by COMSAT. The followingfeatures are presented: geographical details and distances, fiber types and losses, opticalpower levels, details on the Lucent WaveStar™ ADM 16/1 that is used and the clientsthat are connected with their corresponding line-speeds. With this latter feature theoccupation percentage of the network is calculated.
• Chapter Three presents attenuation and dispersion calculations for the situation wherean ADM is removed and the neighboring sites are connected. The distance that wouldneed to be bridged is calculated for any ADM removed and the fact if any traffic isadded and/or dropped at that site is indicated with that. A couple of attenuationcalculation examples are given for both worst-case and real-case scenarios. The BERvs. Optical Signal-to-Noise Ratio (OSNR) for system metrics perfonnance is thenintroduced followed by dispersion calculations for a 2,5-Gb/s Non Return-to-Zero(NRZ) bit sequence with a non-ideal extinction-ratio.
• Chapter Four elaborates on various general solutions making use of both ErbiumDoped Fiber Amplifiers (EDFA) and Raman Amplifiers. Technical aspects withadvantages and disadvantages are discussed for each general solution followed by ashort financial analysis.
• Chapter Five presents various solutions proposed by optical equipment vendors. Astandard solution offered by Lucent Technologies is derived from WaveSta?M ADM16/1 technical documentation. Detailed solutions offered by Padtec and MeritonNetworks are presented.
• Chapter Six deals with the implementation of a solution chosen by COMSAT forremoving an ADM from their SDH network. Schematic setups and measurement resultsare shown and discussed.
• Chapter Seven includes recommendations and elaborates on future network capacityupgrades.
• Chapter Eight (in English) and Nine (in Spanish) present the conclusions of this report.
J. Steinberg
Implementation ofOptical Amplification in a National-Scale SDH Network
Resumen en Castellano
El infonne esta dividido de la siguiente fonna:
7
• El Capitulo Uno sirve como introducci6n al Synchronous Optical NETwork (SONET) yel Synchronous Digital Hierarchy (SDH). SDH es el estandar de transporte usado en lared de anillo 6ptica de COMSAT. Se presentan las caracteristicas mas relevantes deSONET/SDH. Se discuten, tambien, aspectos tecnicos como arquitectura,multiplexaci6n, estructuras de trama, overhead, componentes de red, protecci6n &anillos y sincronizaci6n.
• El Capitulo Dos describe la red SDH operada por COMSAT. Se presentan lossiguientes aspectos: detalles geograficos y distancias, tipos de fibra y perdidas 6pticas,niveles de potencia 6ptica, detalles del sistema Lucent WaveStar™ ADM 16/1 y losclientes que estan conectados con sus correspondientes velocidades de linea. Porultimo, se calcula el porcentaje de la ocupaci6n de la red.
• El Capitulo Tres presenta los calculos de atenuaci6n y dispersi6n que resultan deeliminar un ADM y conectar los sitios adyacentes. Se discuten casos de maximaatenuaci6n y de atenuaci6n real. Se calcula la tasa de error de bits en funci6n de larelaci6n sefial-ruido 6ptica necesaria para el correcto funcionamiento del sistema. Secalcula, tambien, el efecto de la dispersi6n cromcitica para una secuencia NRZ de2,5 Gb/s y para el caso de un transmisor con grado de extinci6n real.
• El Capitulo Cuatro se presentan soluciones 6pticas generales utilizando amplificadoresde fibra dopada con Erbio (EDFA) Yamplificadores Raman. Aspectos tecnicos,incluyendo ventajas y desventajas relativas, son discutidos para cada soluci6n general,seguido por un breve analisis financiero.
• El Capitulo Cinco presenta las soluciones propuestas por diferentes vendedores deequipos 6pticos. Se obtiene una soluci6n estandar a partir de los manuales tecnicos delWaveStar™ ADM 16/1. Se presentan en fonna detallada, tambien, solucionespropuestas por Padtec y Meriton Networks.
• El Capitulo Seis detalla la implementaci6n escogida por COMSAT para la eliminaci6nde un ADM de la red SDH. Se presentan y discuten diagramas esquematicos yresultados de mediciones.
• El Capitulo Siete incluye recomendaciones para futuras ampliaciones de la red.
• El Capitulo Ocho (en Ingles) y Nueve (en Castellano) presentan las conclusiones deeste infonne.
J. Steinberg

Implementation ofOptical Amplification in a National-Scale SDH Network
List of Symbols and Abbreviations
Constants
Physical Constants
8
ch
speed of light in vacuumPlanck's constant
3 0-108 m·s- I,6 6256-10-34 J-s,
Variables
Symbol Description Sf Unit
up fiber attenuation at Raman pump wavelength [dB-km- l]
Us fiber attenuation at signal wavelength [dB-km-l]
~2 GVD-parameter [rad-s-m- I]
B bit-rate [bits-s- I]
C linear frequency chirpcr standard deviationD dispersion parameter [ -Ikm- I ]ps-nm
Cr extinction-ratio [dB]G optical amplifier gainGR Raman gainI field intensityA wavelength [nm]Lo dispersion length [m]Lspan span loss [dB]Namp number of amplifier spansNF noise figure [dB]NFcq equivalent noise figure [dB]nsp spontaneous emission factorp average optical power level [mW] or [dBm]Q Q-factorT lie-intensity half width [s]v optical frequency [Hz]Vm vibrational frequency [Hz]z propagation distance [km]
J Steinberg

Implementation ofOptical Amplification in a National-Scale SDH Network
Subscripts
9
Subscript
o1ASENoutSth
Abbreviations
ADMAPDASEATMBERBERTCCCSAOCMDCNDCSOFBDLCDPSOSD+REDFAETSIGVDlSIITULANMNNOCNENRZNSAPNZDSFOCODFOSNR
J. Steinberg
Refers to ...
zero-bitone-bitamplified spontaneous emissionnOIseoutputsignalthreshold
Add/Drop MultiplexerAvalanche PhotodiodeAmplified Spontaneous EmissionAsynchronous Transfer ModeBit-Error-RateBit-Error-Rate TesterCross-ConnectCarrier Serving AreaDispersion Compensation ModuleData Communication NetworkDigital Cross ConnectDistributed Feedback LaserDigital Loop CarrierData Packet SwitchDigital SignalDrop and Repeat NodeErbium Doped Fiber AmplifierEuropean Telecommunication Standards UnionGroup Velocity DispersionInter-Symbol-InterferenceInternational Telecommunications UnionLocal Area NetworkMatched NodeNetwork Control CenterNetwork ElementNon Return-to-ZeroNetwork Service Access PointNon-Zero Dispersion-Shifted FiberOptical CarrierOptical Distribution FrameOptical Signal-to-Noise Ratio

Implementation ofOptical Amplification in a National-Scale SDH Network 10
OTDRPOPPPSPTUSCSDHSECSLMSONETSPESRSSSMFSTMSTSTDMTMTOHVCWANWDM
J. Steinberg
Optical Time-Domain ReflectometerPoint of PresencePath Protection SwitchingPower and Timing UnitSystem ControllerSynchronous Digital HierarchySDH Equipment ClockSingle Longitudinal ModeSynchronous Optical NetworkSynchronous Payload EnvelopeStimulated Raman ScatteringStandard Single Mode FiberSynchronous Transfer ModuleSynchronous Transport SignalTime Division MultiplexingTerminal MultiplexerTransport OverheadVirtual ContainerWide Area NetworkWavelength Division Multiplexing

Implementation ofOptical Amplification in a National-Scale SDH Network
1 Introduction to SONET/SOH
11
Telecommunication networks based on optical fiber technology have become a majorinformation-transmission system, with high-capacity optical fiber links encircling the globe inboth terrestrial and undersea installations. In the early days of optical fiber communications,the applications involved basically only the optical fiber, a light source and a photodetector.Now, there are numerous passive and active optical devices within a light-wave link thatperform complex networking functions in the optical domain, such as signal restoration,routing and switching [1].
Due to the ever increasing need of sending more and more information, from and tobusinesses and residential users alike, higher bandwidth is required. Until now, several newertechnologies have helped to remedy this situation in a Local-Area Network (LAN)environment. LAN-implementation today is faced with a wide range of choices for linkingdesktops. Technologies such as 100 Mb/s Ethernet, Fiber Channel, switched Ethernets, GigabitEthernet, and the much anticipated 10 Gigabit Ethernet have started to appear or be planned inmany organizations needing faster connectivity between end systems.
Although faster LANs have addressed the need for desktop bandwidth within a buildingor campus environment, LANs do nothing to increase the bandwidth available for networkingdispersed buildings or campuses over distances of more than a few miles. For this situation, aWide-Area Network (WAN) is needed. Until relatively recently, there was no easy way to linkeven 10 Mb/s Ethernet LANs with so much as a fraction of the bandwidth that the LANrepresented.
Fortunately, SONET/SDH provides welcome relief from this growing bandwidthproblem in the WAN environment. SONET/SDH is capable of linking LANs at separate sitesnot at a mere fraction of 10 Mb/s, or even a full 10 Mb/s. Rather, SONET/SDH can link several10 Mb/s Ethernets at a single site to other Ethernet LANs across the country. SONET/SDHlinks usually operate at speeds of 155 Mb/s or higher, and into the multi-Gb/s range.
This Chapter is about SONET/SDH, it explains where SONET/SDH came from, what itis used for, and how it is used. Most of it is based on the book SONET/SDH, 3rd ed. fromGoralski [2].
1.1 Background
SONET is a North American standard for networking developed in the mid-1980s primarily byBellcore and standardized by ANSI. It defines the interface between two SONET NetworkElements (NEs). More specifically, it defines a digital hierarchy of synchronous signals,including their formats, and defines the electrical and optical characteristics of the interface.SDH is a closely related standard developed by the International Telecommunications Union(lTV).
SONET/SDH is a high-bit-rate-fiber-optic-based transport method that provides thefoundation for linking high-speed Asynchronous Transfer Mode (ATM) switches andmultiplexers and providing users with Broadband ISDN-compliant services.
As time went by, SDH became more important and SONET turned into more avariation ofSDH. The differences between SONET and SDH are more a matter of terminologytoday and less in substance. So almost anything that applies to SONET also applies to SDH.
J. Steinberg

Implementation ofOptical Amplification in a National-Scale SDH Network
1.2 T-Carrier
12
Digital transmission systems are characterized by the fact that these communication links onlycarry information in the form of binary digits (universally known as bits). Binary digits canonly represent a "0" or a "1". Strings of 0' sand l' s can be constructed to represent almostanything from computer-based data to digitized voice to stereo audio on a music CD to thesoundtrack of a movie, even potentially to the movie itself.
In the early 1960s a digital multiplexing trunk network was designed by engineers atBell Telephone Laboratories called T-carrier. T-carrier was the basis of a whole family ofdigital trunking methods. The basic unit was the digitized voice channel, which produces astream of bits at the constant rate of 64.000 bits per second, or 64 Kb/s. The 64 Kb/s digitizedvoice channel was designated Digital Signal-O (DS-O) in the T-carrier system. The "0"indicated the lowest level of what was to become the T-carrier hierarchy.
Twenty-four DS-O signals were multiplexed to yield a DS-l. The" 1" indicated the firstlevel of the T-carrier hierarchy. The DS-O produced 64 Kb/s by generating 8 bits (1 byte) 8.000times per second (= 125 Jls per byte). The combined output of24 DS-Os would require a wayof sending at least 24 x 8 bits = 192 bits every 125 Jls. To accomplish this, a DS-l wasorganized into frames. Each frame was sent and received 8.000 times per second. An additionalbit was added to help the receivers distinguish the beginning of one DS-l frame from the endof the previous DS-l frame. So the aggregate bit-rate of a DS-l was 193 bits/frame x 8.000frame/second = 1.544.000 bits per second or 1,544 Mb/s. The structure of a DS-l frame isshown in Figure 1-1.
~ 193 bits (125 microseconds) •
~ Time Slot #1 I Time Slot #2 1 Time Slot #3 [ ========] Time Slot #24 1
Figure 1-1: The D8-1 frame structure
Within the DS-l frame, a DS-O input channel always occupied the same position in the frame.For instance, a particular DS-O channel may be the first 8 bits after the framing bit, or the next8 bits after that, and so on. Because the DS-l frame was thus divided by time and not byfrequency, this method was referred to as Time Division Multiplexing (TDM).
A good deal of the initial work done that led to the development of SONET was done toaddress issues of DS-l to DS-3 multiplexing. An M 13 multiplexer combined 28 DS-l s (eachwith 24 DS-Os in most cases) to a single DS-3. This multiplexing was done in 2 stages; first 4DS-ls (each 1,544 Mb/s) were combined to form a single DS-2 (6,312 Mb/s). In this process136 Kb/s of overhead is added to the DS-l signals to produce the DS-2 signa1. Part of thatoverhead is added for DS-2 framing purposes. The second stage of the M13 multiplexinginvolved the combination of seven DS-2 signals to form a single DS-3 (44,736 Mb/s). Of the552 Kb/s of overhead that is added to the DS-2 signals to produce the DS-3 aggregate, much ofit consists of stuff bits which ensure rate and phase alignment of the incoming DS-2s.
J. Steinberg
Implementation ofOptical Amplification in a National-Scale SDH Network
1.3 Architecture
13
T-carrier, as mentioned in the foregoing section, does not conform to any standards. Mostmanufactures used proprietary transmission rates and protocols, making it impossible forequipment from different manufacturers to work together. With the deregulation oftelecommunications in the u.s. and the increasing importance of internationalcommunications, this lack of standardization became a mayor problem. It was no longer certainthat a transmitter in one city would be compatible with a receiver in another city operated by adifferent service provider.
To address this problem, the international telecommunications industry adopted twofundamental standards for fiber-optic systems, SONET and SDH, aimed at assuring the socalled mid-span meet of equipment from different manufacturers.
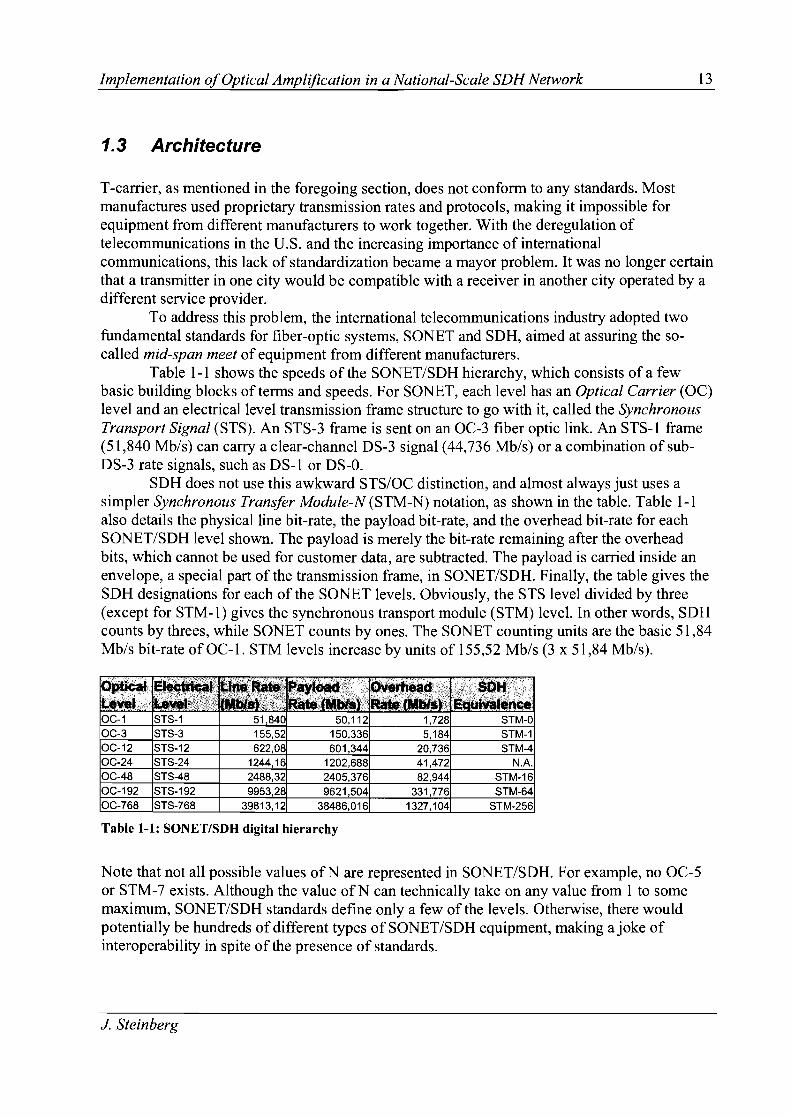
Table 1-1 shows the speeds of the SONET/SDH hierarchy, which consists of a fewbasic building blocks of terms and speeds. For SONET, each level has an Optical Carrier (OC)level and an electrical level transmission frame structure to go with it, called the SynchronousTransport Signal (STS). An STS-3 frame is sent on an OC-3 fiber optic link. An STS-l frame(51,840 Mb/s) can carry a clear-channel DS-3 signal (44,736 Mb/s) or a combination of subDS-3 rate signals, such as DS-l or DS-O.
SDH does not use this awkward STS/OC distinction, and almost always just uses asimpler Synchronous Transfer Module-N(STM-N) notation, as shown in the table. Table 1-1also details the physical line bit-rate, the payload bit-rate, and the overhead bit-rate for eachSONET/SDH level shown. The payload is merely the bit-rate remaining after the overheadbits, which cannot be used for customer data, are subtracted. The payload is carried inside anenvelope, a special part of the transmission frame, in SONET/SDH. Finally, the table gives theSDH designations for each of the SONET levels. Obviously, the STS level divided by three(except for STM-l) gives the synchronous transport module (STM) level. In other words, SDHcounts by threes, while SONET counts by ones. The SONET counting units are the basic 51,84Mb/s bit-rate of OC-l. STM levels increase by units of 155,52 Mb/s (3 x 51,84 Mb/s).
STS-1STS-3STS-12STS-24STS-48STS-192STS-768
51,840155,52622,08
1244,162488,329953,28
39813,12
50,112150,336601,344
1202,6882405,3769621,504
38486,016
1,7285,184
20,73641,47282,944
331,7761327,104
STM-OSTM-1STM-4
NASTM-16STM-64
STM-256
Table 1-1: SONET/SDH digital hierarchy
Note that not all possible values ofN are represented in SONET/SDH. For example, no OC-5or STM-7 exists. Although the value ofN can technically take on any value from 1 to somemaximum, SONET/SDH standards define only a few of the levels. Otherwise, there wouldpotentially be hundreds of different types of SONET/SDH equipment, making a joke ofinteroperability in spite of the presence of standards.
J. Steinberg

Implementation ofOptical Amplification in a National-Scale SDH Network 14
Sometimes there is a technical reason behind this preference for some levels and not others.For instance, early equipment vendors found that it was actually more cost effective to buildSONET gear operating at the OC-12 level than at the OC-9level because oflaser chip costsand economies of scale. Little OC-9 SONET equipment was ever built, while the OC-12equipment market has flourished.
It is absolutely crucial to remember that unless other arrangements are made inequipment configurations, SONETISDH will remain as canalized as a T-carrier. That is, anSTS-3 contains three STS-l s. An STS-12 contains twelve STS-l s, and so on. By default, all ofthe STS-l s inside an STS-48 on an OC-48 fiber optic link run at 51,84 Mb/s, the STS-l rate. Inthe same fashion, in T-carrier, a OS-3 frame contains 28 T-1 s, all operating at 1,544 Mb/s.Ironically, SONET/SDH, despite the incredible speeds available at the higher ends of thehierarchy, would seem to limit networking to channels operating at 51,84 Mb/s or 155,52 Mb/sfrom any individual user.
However, just as DS-3 (or OS-l for that matter) is available as an uncanalized transportwithout a structure, so is SONET (SHO has its own channel structure). An uncanalized DS-3merely offers a raw bit-rate (no more 28 OS-Is) at 45 Mb/s. In the same way, an uncanalizedSTS-12 would offer the user a raw bit-rate (no more 12 STS-l s) at approximately 622 Mb/s.The same applies to SDH canalizations. The terms used in Table 1-1 are of great importancethroughout the rest of this chapter. Because these form the basis of the SONET/SDHarchitecture, a review of these terms will aid in the understanding of the architecture.
OC-N This notation refers to the SONET transmission characteristics of an Nth leveltransmission link. Within SONET, an OC-3 transmission link is assumed to have an STS-3frame structure.
STS-N In this notation, STS refers to the SONET frame structure of an Nth leveltransmission link. This notation is analogous to the OS-l notation in today' s transmissionnetwork. Although most SONET links should properly be referred to as STS-N, it is muchmore common to speak of OC-N.
Payload The term used to indicate user data within a SONET/SDH frame.Envelope The portion of the STS-l frame used to carry payload and end system
overhead. SDH sometimes calls this an Administrative Unit.Overhead The portion of the STS-N/STM-N frame used to carry management data.Concatenation A term that refers to the linking together of multiple STS-l/STM-l
frames to form an envelope capable of carrying higher bit-rate payloads, such as when SONETor SDH is used to carry ATM cells or IP packets. A concatenated SONET links is referred to asan STS-3c or an OC-3c, or whatever the SONET level happens to be. SDH has its ownterminology for concatenation in the form of STM-Nc.
1.4 Multiplexing
It has already been pointed out that unless other configuration steps are taken, the basic, defaultstructure for an STS-N link is as N STS-l s (the same is true in principle for SDH). So a basicSTS-3 has 3 STS-ls, an STS-12 has 12 STS-ls, and so on.
But there is an order implied in the sequencing ofSTS-ls inside an STS-N. STS-ls willbe loaded inside an STS-N in certain positions. The positions must well be known and fixed sothat other multiplexing equipment can easily find them.
J. Steinberg

Implementation ofOptical Amplification in a National-Scale SDH Network 15
The positions of the three STS-I s inside an STS-3 are easy to understand. The bytes from thethree STS-I s are just multiplexed together in the sequence 1-2-3-1-2-3-1-2-3 .... and so on.This is called byte-interleaved multiplexing. However, in an STS-12, the twelve STS-I s mustbe ordered as if they were first made into an STS-3, and then four STS-3s were byteinterleaved multiplexed into an STS-12. The resulting STS-12 structure in terms of STS-Is istherefore 1-4-7-10-2-5-8-11-3-6-9-12....
In the same way, an STS-48 with forty-eight STS-Is must look like it came from 16STS-3 multiplexers all running at the same time. Figure 1-2 shows the multiplexing of 12 STSIs to form a single STS-12.
STS·1
inputs
Figure 1-2: Multiplexing 12 STS-ls to form a single STS-12
1.5 Frame Structures
The basic building block of the SONET digital transmission hierarchy is called the STS levelone, or STS-I frame. In SDH, the SONET STS-I frame is called the STM-O frame. Thissounds odd, but there is a good reason for the STM-O designation. SDH originally contained noSTS-I equivalent frame. But since an STM-l frame is quite complex, it was common even inSDH environments to speak of a "conceptual STM-O" frame identical to an STS-I purely foreducational purposes.
This basic, STS-I SONET and STM-O SDH frame consists of810 bytes, transmitted8.000 times per second (or once every 125 I!s) to form a 51,840 Mb/s signal rate. This basicrate, the fundamental building block of SONET (but not SDH), is derived as follows:
810 bytes/frame x 8.000 frames/sec x 8 bits/byte = 51,840 Mb/s line rate.
J. Steinberg

Implementation ofOptical Amplification in a National-Scale SDH Network 16
In other words, the 810 bytes of the basic SONET frame structure are sent 8.000 times persecond, and because each byte consists of 8 bits, the signaling rate on the link is 51,840 Mb/s.
Figure 1-3 shows the basic structure of the STS-l SONET (and STM-O) frame in visualformat. The STS-l frame is 9 rows of 90 columns; it is always shown in this format, so that theoverhead bytes wi11line up properly at the beginning of the frame. The STS-l frame istransmitted one row at a time, from top to bottom, and from left to right within each row.Therefore, the byte in row 1, column 1 is sent first, and the byte in row 9, column 90 is sentlast. After the 90th byte is sent at the end of row 1, the next byte sent is the first byte in row 2,the byte in column 1.
Columns:
2345678 88 89 90
o 5
1
2
3
R 4
w
s6
7
8
9
1 2 3 4 5 6 7 8
91 92 93 94 ...88 89 90
... 810
Transport
Overhead (TOH)
Payload (columns 4 -90)
Figure 1-3: The SONET STS-l (and STM-O) frame structure
An STS frame is composed of two main sections, each with their own structures. The firstthree columns of the STS-l frame form the Transport Overhead (TOH) for the entire frame.All of the SONET overhead information that is used to manage defined parts of the SONETnetwork and transported data (called a payload), is in the first three columns of the frame. Thisoverhead section, therefore, consists of 27 bytes (9 rows x 3 bytes/row) sent as part of each andevery SONET frame. This overhead cannot be eliminated or converted for user data.
The SONET payload is carried in the Synchronous Payload Envelope (SPE). Thecapacity of the SPE is 9 rows of87 columns. This adds to 783 bytes of payload in each frame,giving a total user data rate of:
783 bytes/frame x 8.000 frames/sec x 8 bits/byte = 50,112 Mb/s payload rate.
It is easy to construct the overall structure of a frame at any level of the SONET hierarchy oncethe basic STS-l format is understood. All SONET frames are sent 8.000 times per second. AllSONET frames have exactly nine rows. The only variable is the number of columns.For example, an STS-3 frame consists of 9 rows and is sent 8.000 times per second; however,an STS-3 frame is not 90 columns wide. The STS-3 frame is three times wider (N=3).Therefore, the STS-3 frame is 270 columns wide. The STS-3 overhead columns are multipliedby three as well, as are the SPE capacity columns. An STS-3 frame then is 270 columns wide,
J Steinberg
Implementation ofOptical Amplification in a National-Scale SDH Network 17
of which the first 9 columns are TOH and the remaining 261 are payload capacity. The wholeSTS-3 frame is 2.430 bytes. The line rate for an OC-3, therefore, must be:
2.430 bytes/frame x 8000 frames/sec x 8 bits/byte = 155,52 Mb/s line rate.
Figure 1-4 shows some basic structures of other common SONET/SDH frame types.The basic building block of the SDH digital transmission hierarchy is not the STM-O frame.The STM-O frame was used for years as an educational tool, mainly because jumping right into the STM-l frame was quite confusing for people new to SDH. Now STM-O is an officiallydefined SDH frame.
The basic building block of the SDH digital transmission hierarch is the STM-l frameand has 9 rows and 270 columns, the same as the SONET STS-3. The overhead is not reallythree times larger than the STM-O, since the STM-O was more or less invented as a SONETSTS-l equivalent. The nine columns of overhead leading off the STM-l frame technicallystand on their own. The only real difference between SONET and SDH is in a part of theoverhead called path overhead. It is beyond the scope of this chapter to explain this in moredetail. The important fact to remember is that the basic building block of SDH digitaltransmission hierarchy is the STM-l frame which runs at 155,52 Mb/s line rate.
1.6 Overhead
SONET/SDH adds no additional overhead at all at higher levels of the multiplexing hierarchy.All the overhead needed for synchronous, byte-interleaved multiplexing is present even at thelowest level of the hierarchy, at the STS-l level. Of course, the trade-off is higher levels ofoverhead at the lower levels for no additional overhead at the higher levels. But this is not aninsignificant advantage, especially when the need for higher and higher rate transports isconsidered, and this 'unused' overhead at higher levels of the hierarchy can be used.
The overhead percentage in SONET/SDH is fixed, while the overhead percentagecontinually rises in other, asynchronous multiplexing schemes. In SONET/SDH, the ratio ofoverhead to payload (1,728 Mb/s to 50,112 Mb/s) remains constant at 3,45 %, regardless of thevalue ofN.
When several SONET/SDH data stream are multiplexing into one higher rate datastreams (such as from three STS-ls to a single STS-3), the resulting SONET/SDH framestructure is called a composite. Every frame except a basic STS-l frame (or STM-l frame inSDH) is a composite frame of one form or another. Composites frames still retain all of theoverhead bytes from each signal source. Obviously, an STS-3 frame that has nine columns oftransport overhead, instead ofjust three from each of the STS-l s, still forms a unit and not justthree frames traveling together. Thus, many of the "repeated" overhead bytes are essentiallyignored ("undefined" in SONET/SDH talk) in composite frames. The full set of27 transportoverhead bytes is retained only in the first STS-l or STM-O of any composite. In the otherlevels of SONET/SDH, all of the transport overhead bytes may be present, but many of themare neither examined nor processed. These excessive overhead bytes can be used for otherfunctions.
J. Steinberg

Implementation ofOptical Amplification in a National-Scale SDH Network 18
9columns
9 Overrows head
261columns payload
5T5-3 and5TM-1
270 columns total
36columns
9 Overrows head
1.044columns payload
5T5-12 and5TM-4
1.080 columns total
9rows
144columns
Overhead
4.176columns payload
5T5-48 and
5TM-16
9rows
4.320 columns total
576columns
Overhead
17.280 columns total
16.704columns payload
5T5-192 and5TM-64
Figure 1-4: Structure of SONET/SDH frames (not to scale)
J. Steinberg

Implementation ofOptical Amplification in a National-Scale SDH Network
1.7 Network Components
19
SONET/SDH networks can be quite complex. This section introduces the overall componentsof a typical SONET/SDH network. Figure 1-5 shows the major components of a multiple-linkSONET/SDH network, such as may be deployed by a major carrier in a metropolitan areatoday. Note that some of the SONET/SDH components form rings in the diagram.SONET/SDH rings have become a distinguishing feature ofSONET/SDH, and they will bemore extensively discussed in the next section.
As shown in Figure 1-5, there are six main network elements that can be used inSONET/SDH networks. These are labeled in the figure as follows:
1. Terminal multiplexer (TM): An "end point" device on the SONET/SDH network.This device gathers bytes to be sent on the SONET/SDH network link and deliversbytes on the other end of the network.
2. Add/drop multiplexer (ADM): Really just a "full-featured" TM. However it is moreaccurate to refer to the TM as an ADM operating in what is known as "terminal mode".This device usually connects to several TMs and aggregates or splits SONET/SOHtraffic at various speeds.
3. Digital loop carrier (DLC): This SONET/SOH device is used to link serving officeswith ordinary analog copper-twisted-pair local loops in order to support large numbersof residential users in what is know as a carrier serving area (CSA).
4. Digital cross-connect (DCS): This SONET device can add or drop individualSONET/SOH channels at a given location. It is basically an even more sophisticatedversion of the SONET/SOH ADM.
5. Matched nodes (MN): These SONET/SOH devices interconnect SONET/SOH rings.They provide an alternate path for the SONET/SOH signals in case of equipmentfailure.
6. Drop and repeat nodes (D+R): These devices are capable of "splitting" theSONET/SOH signals and sending copy bytes onto two or more output links. Thedevices will be used to connect DLC devices for residential video (or even voice)devices.
The equipment found in this network is separated into central office terminal equipment andoutside plant equipment.
The central office equipment consists of a SONET/SOH-compatible switch (i.e., digitalcross-connect switch) and digital loop carrier equipment. This equipment forms the networkterminating point for SONET/SOH transport services.
The outside plant equipment consists of a fiber ring topology for survivability, andaccess multiplexers to this ring. The multiplexers are functionally separated into twocategories, TMs and AOMs. TMs provide conversion from the non-SONET transmissionmedia to the SONET format. Add/drop multiplexers are an integral component of theSONET/SOH architecture; they allow access to the SONET/SOH transmission networkwithout fully demultiplexing the SONET/SOH signal. Non-SONET/SOH signals may be addedto or taken from the SONET/SOH transmission signal via this equipment. The differencebetween SONET/SOH TMs and AOMs is often only a difference in network location and infunction, rather than a fundamental or intrinsic difference.
J. Steinberg

Implementation ofOptical Amplification in a National-Scale SDH Network 20
4. Digital Cross Connect
TM +-- 1. Terminal MuxTM
L
3. Digital Loop Carrier
5. Matched Nodes
Figure 1-5: Major SONET/SDH components
Physically, the SONET/SDH equipment described is of quite modest size. The solid-stateelectronics that characterize SONET/SDH result in components that are typically rackmounted in standard communications cabinets. The power requirements are correspondinglymodest as well.
1.8 Protection and Rings
A distinguishing characteristic of SONET/SDH links is their capability to be deployed in a ringtopology and configuration. Fiber optic links are inherently unidirectional and not full duplex.All SONET/SOH fiber links consist of a transmit fiber and a receive fiber. SONET/SDHAOMs have a minimum of four fiber interfaces: one for upstream and downstreamtransmission in each direction. When the loose "ends" of the last ADM in a chain of ADMs arelooped around, a closed loop or ring results.
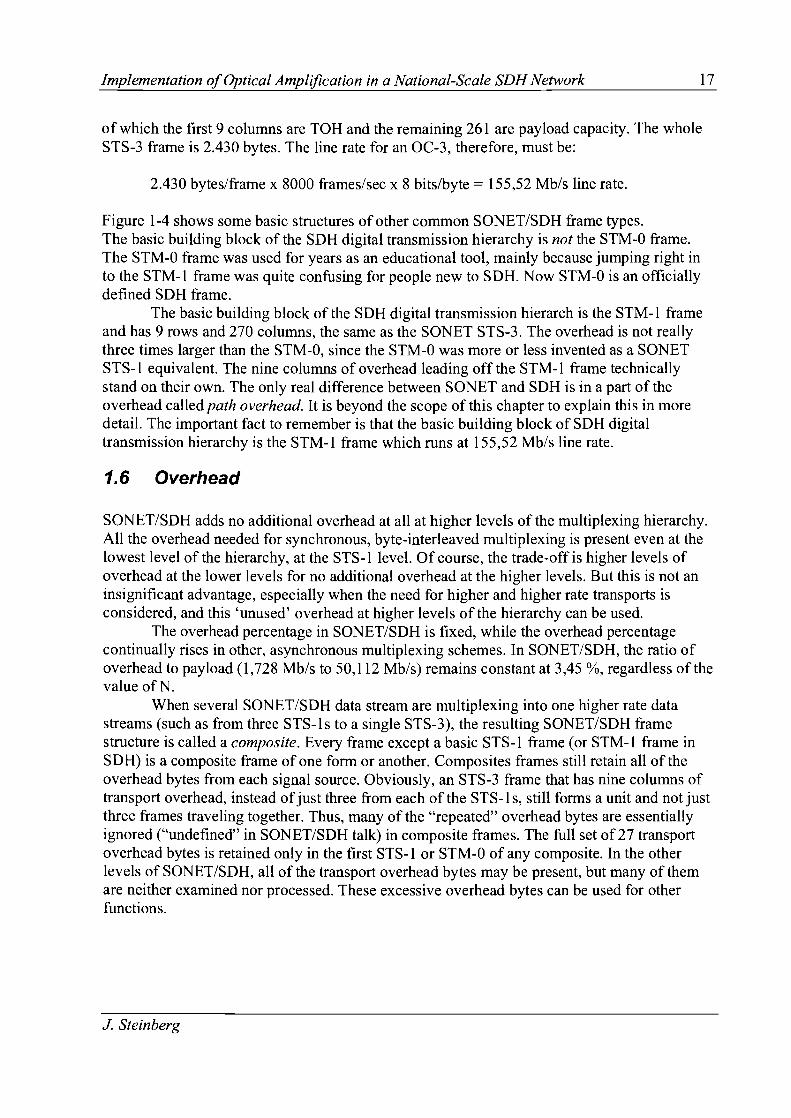
In Figure 1-6, the simple SONET/SDH ring consists of several ADMs linked by theirupstream and downstream fibers. The ring may span only a few miles, or stretch to literallythousands of miles, depending on its purpose. Note that there are still SONET/SDH TMs, withusers attached to feed the ring with traffic. Naturally, the aggregate traffic from the TMs cannotexceed the capacity of the SONET/SDH ring.
What is the advantage of deploying SONET/SDH in a ring configuration? Quitesimply, rings provide greater reliability by furnishing two separate paths for digital signalsbetween ADMs. Even this simple SONET/SDH ring provides what is known as pathprotection switching (PPS), or just path switching, between the SONET/SOH ADM nodes.
J. Steinberg
Implementation ofOptical Amplification in a National-Scale SDH Network
~ SONET' ~ SONET' ---- SONET' r---SOH
I+--SOH
+--SOH
AOM#1 AOM#2 AOM#3
SONET' SONET' SONET'SOH SOH SOH
TM(s) TM(s) TM(s)
Figure 1-6: A simple SONET/SDH ring
21
Typically, the two fibers are deployed in the same cable sheath and are laid in the sameconduit. Consider what would happen if the fibers between SONET/SDH ADM #2 and ADM#3 in the figure were severely damaged by some environmental disaster or even a construction"incident". Signals can still travel between ADM #2 and ADM #3 through ADM #1. There isstill a fiber path between ADM #2 and ADM #3.
SONET/SDH rings allow for repairs to be made without disrupting customer service.This is a valuable capability that justifies the added expense of the extra fiber needed to "closethe ring" ofSONET/SDH ADMs. Today, it is rare to see a SONET/SDH deployment of anysize without rings.
1.9 Clocking
A key feature, ifnot the key feature, ofSONET/SDH is its synchronous operation. Whendetecting a bit stream it is very important for the receiver to know when to sample theincoming bit stream. This sampling is done by means of a clock which indicates the receiverwhen to sample. A clock running too fast will oversample the incoming bit stream and within astring of bits a certain bit will be sampled twice. A clock running slow will undersample theincoming bit streams and cause bits to be dropped or missed.
Usually in SONET/SDH systems the primary reference clock is known as Stratum 1clock for the whole service provider's network. A Stratum 1 clock is the most accurate in theentire network.
The network Stratum 1 clock uses regular leased lines to distribute these clock pulsesdirectly to other devices in the network. These are Stratum 2 clocks, and they are directlyconnected to the Stratum 1 clock. It would be too expensive too hook everything up directly tothe Stratum 1 clock, so yet another set of network devices gets clock not from the Stratum Iclock, but from a Stratum 2 clock. These are, not surprisingly, Stratum 3 clocks. Yet otherdevices, the Stratum 4 clocks, get their timing from the Stratum 3 clocks. Stratum 1 clocks arethe most accurate of all, better than 0.00001 parts per million. This corresponds to losing asecond every 300.000 years.
J. Steinberg

Implementation ofOptical Amplification in a National-Scale SDH Network 22
The Stratum 2 clocks are "only" accurate to 0.016 parts per million. The important thing aboutStratum 2 is that if the reference link were lost to the Stratum I clock, the Stratum 2 clockwould not wander off of the mark far before the link would be restored. Stratum 3 and 4clocks on their tum are less accurate than a Stratum 2 clock.
1.10 Advantages
SONET/SDH is more than just a lot of bandwidth and to conclude this chapter a list ofnumerous advantages in a number of areas is listed below:
• Technology• Economics
• Flexibility
• Compatibility
J Steinberg
Unprecedented speeds available on fiber-optic networksBest interface for fiber-optic networksEconomical adding and dropping of channelsModular equipment designAdequate overhead for network managementStandardization of managementWorks well with existing network hierarchiesAllows multiple vendors' equipment to interoperateWorldwide standard
Implementation ofOptical Amplification in a National-Scale SDH Network
2 SOH network operated by COMSAT
2.1 POPs and Distances
23
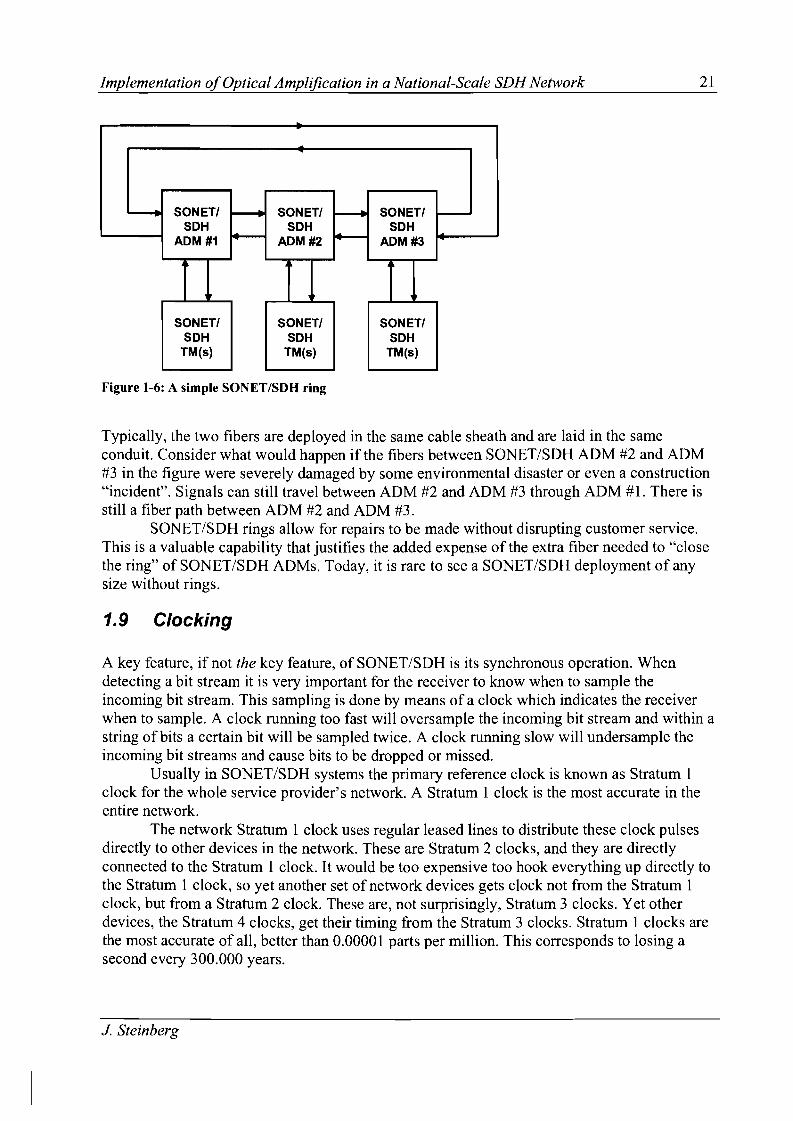
The SDH optical ring network is schematically shown in Figure 2-1. The ring consists of twofiber traces leased from Silica Networks and Global Crossing. A circle indicates the Point ofPresence (POP) of an ADM. Overlapping Global Crossing and Silica Networks POPs are notinterconnected and located in different buildings. At the end-points of both fiber traces(Buenos Aires and Mendoza) the situation is different. The ADMs in either one of these citiesare interconnected although they are not located in the same building.
~ End-terminal
• POP Silica Networks
• POP Global Crossing
Berrotan\n
Silica Networks Fiber Global Crossing Fiber
EI Socorro
San Nicolas
Buenos Aires
Figure 2-1: Schematic view orSOH network operated by COMSAT in Argentina
The network started out with just the leased fiber trace from Silica Networks. It is along thistrace that signals are added and/or dropped. The Global Crossing fiber trace was later leased tocreate a ring network as means of protection to failures in the network. No signals are addedand/or dropped along the Global Crossing fiber trace.
J Steinberg

Implementation o/Optical Amplification in a National-Scale SDH Network
The length of the fiber trace between two POPs is listed in Table 2-1.
Buenos Aires Marcos Paz 95,5 Mendoza Lencinas 88,8Marcos Paz Exaltaci6n de la Cruz 87,7 Lencinas Desa uadero 90,5Exaltaci6n de la Cruz Arrecifes 92,7 Desa uadero San Luis 93,5Arrecifes EI Socorro 86,3 San Luis Villa Mercedes 97,3EI Socorro Rosario 102,4 Villa Mercedes Sam acho 81,9Rosario Canada de Gomez 96,2 Sam acho Rio Cuarto 48,3Canada de Gomez San Marcos Sud 94,4 Rio Cuarto Berrotaran 84,6San Marcos Sud Villa Nueva 88,8 Berrotaran San Austin 69,2Villa Nueva Manfredi 92,6 San Austin Cordoba 80,5Manfredi Cordoba 100,2 Cordoba Rio Primero 78,2Cordoba Corral ito 97,0 Rio Primero Arro ito 60,2Corralito Hernando 92,6 Arro ito San Francisco 96,9Hernando Rio Cuarto 91,5 San Francisco Rafaela 96,1Rio Cuarto Sam acho 88,2 Rafaela Santo Tome 95,7Sam acho Villa Mercedes 90,8 Santo Tome Barrancas 72,1Villa Mercedes San Luis 86,3 Barrancas Rosario 85,9San Luis La Paz 86,4 Rosario San Nicolas 75,6La Paz Santa Rosa 90,2 San Nicolas Rio Tala 82,6Santa Rosa Mendoza 89,9 Rio Tala Escalada 81,7
Escalada Buenos Aires 97,1Total 1749,5 Total 1656,6
Table 2-1: The length of a fiber trace between two consecutive POPs
2.2 Fiber types and Losses
24
Both Silica Networks and Global Crossing deployed fiber manufactured by Furukawa Electric.Silica Network uses Standard Single Mode Fiber (SSMF) compliant with the G.652 standard ofthe ITU whereas Global Crossing uses Non-Zero Dispersion-Shifted Fiber (NZDSF) compliantwith the 0.655 standard. A table of specifications for both fibers is shown in Table 2-2.
S 0';)",/", i'c. i"e.) F "'I!', i ·i.....iii,ii.,'.",,'./i, .' '.i· .• ii,;
Fiber attenuation at 1550 nm [dBlkml $ 0,25 $ 0,22Dispersion parameter D rpslnm'kml $18 $5Aeffective rum'l .. 80 .. 55
Table 2-2: G.652 and G.655 lTV compliant fiber specifications
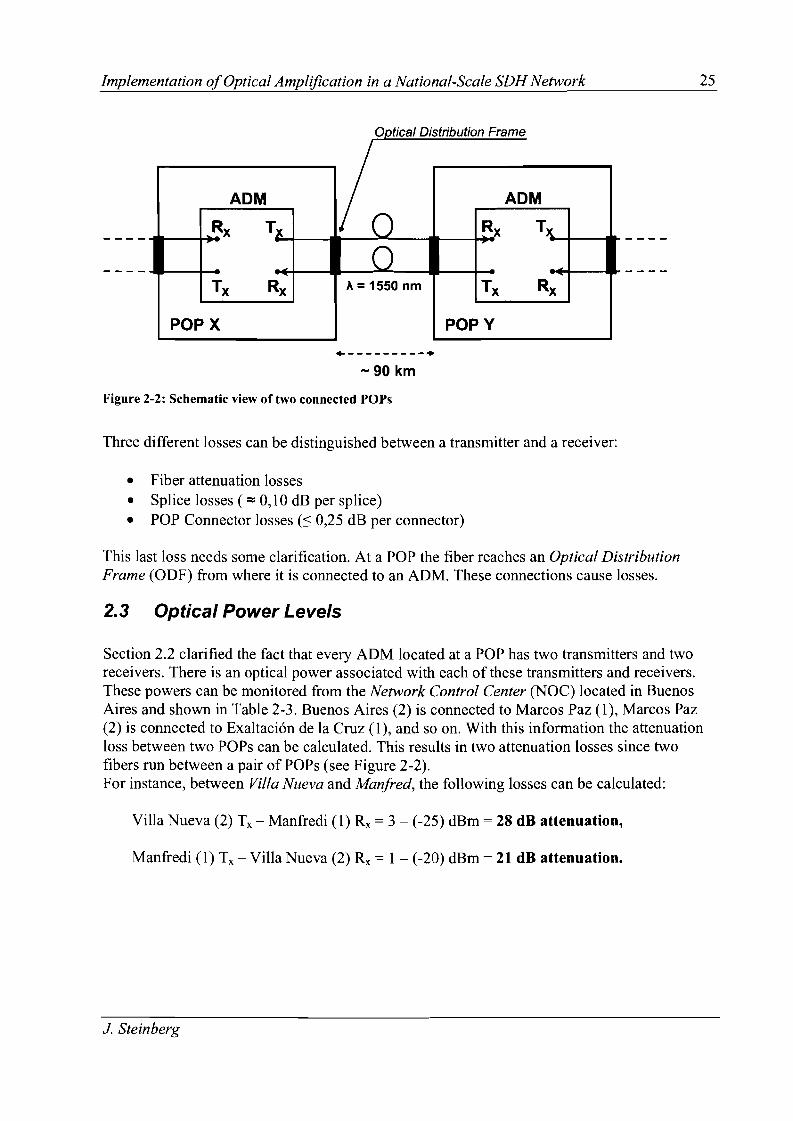
The transmission wavelength used between POPs contained within the network lies at the thirdtransmission window (around 1550 nm). An ADM located at a POP is connected with twofibers to each of its neighboring ADMs located at another POP. This way the traffic betweenPOP X and POP Y is bi-directional. This is schematically shown in Figure 2-2.
J Steinberg
Implementation ofOptical Amplification in a National-Scale SDH Network 25
a flO' t 'b f ~J/Jl/ca IS rt U IOn rame
ADM ADM
Rx Tx 0 Rx Tx.
II II 0 II IITx Rx A =1550 nm Tx Rx
pop X POpy
+---------+-90 km
Figure 2-2: Schematic view of two connected POPs
Three different losses can be distinguished between a transmitter and a receiver:
• Fiber attenuation losses• Splice losses ( == 0,10 dB per splice)• POP Connector losses (:'S 0,25 dB per connector)
This last loss needs some clarification. At a POP the fiber reaches an Optical DistributionFrame (ODF) from where it is connected to an ADM. These connections cause losses.
2.3 Optical Power Levels
Section 2.2 clarified the fact that every ADM located at a POP has two transmitters and tworeceivers. There is an optical power associated with each of these transmitters and receivers.These powers can be monitored from the Network Control Center (NOC) located in BuenosAires and shown in Table 2-3. Buenos Aires (2) is connected to Marcos Paz (1), Marcos Paz(2) is connected to Exaltaci6n de Ia Cruz (1), and so on. With this information the attenuationloss between two POPs can be calculated. This results in two attenuation losses since twofibers run between a pair of POPs (see Figure 2-2).For instance, between Villa Nueva and Manfred, the following losses can be calculated:
Villa Nueva (2) Tx - Manfredi (1) Rx = 3 - (-25) dBm = 28 dB attenuation,
Manfredi (1) Tx - Villa Nueva (2) Rx = 1 - (-20) dBm = 21 dB attenuation.
J Steinberg

Implementation ofOptical Amplification in a National-Scale SDH Network
Buenos Aires (2) -20 +1 Mendoza (2) -22 +1
Marcos Paz (1) -22 +3 Lencinas (1 ) -22 +1
Marcos Paz (2) -23 +3 Lencinas (2) -19 +1
Exaltaci6n de la Cruz 11 \ -21 +3 Desaauardero (1) -19 +1
Exaltaci6n de la Cruz (2) -18 +3 Desaauardero 12\ -19 +3Arrecifes (1 -20 +3 San Luis (1) -24 +3Arrecifes (2 -16 +3 San Luis (2 -17 +3
EI Socorro (1) -17 +3 Villa Mercedes (1) -17 +3EI Socorro (2\ -16 +3 Villa Mercedes (2) -18 +1
Rosario (1 -15 +3 Sampacho (1\ -19 +1
Rosario (2) -21 +3 Sampacho (2) -10 +1
Canada de Gomes (1) -21 +3 Rio Cuarto 1 -10 +1
Canada de Gomes (2) -21 +3 Rio Cuarto 2 -19 +1San Marcos Sud (1 \ -19 +3 Berrotaran 1 -19 +1
San Marcos Sud (2) -18 +3 Berrotaran (2\ -16 +1
Villa Nueva (1) -19 +3 San AQostin (1) -14 +1Villa Nueva (2) -20 +3 San AQostin (2) -19 +1
Manfredi (1) -25 +1 Cordoba 11 -17 +1
Manfredi 12\ -21 +3 Cordoba (2 -17 +1
Cordoba (1 -21 +3 Rio Primero (1) -16 +1
Cordoba (2 -26 +3 Rio Primero (2) -12 +1
Carrol ito 1 -22 +3 Arrovito (1 ) -12 +1
Carrolilo 2 -17 +3 Arrovito (2) -17 +3
Hermando 1\ -17 +3 San Francisco (1) -19 +3Hermando (2) -17 +3 San Francisco (2\ -19 +3Rio Cuarto (1 ) -18 +3 Rafaela (1 -18 +3Rio Cuarto (2) -15 +3 Rafaela (2 -21 +1Sampacho (1) -15 +3 Santo Tome (1) -20 +1Sampacho (2) -16 +3 Santo Tome (2) -15 +1Villa Mercedes (1) -19 +3 Barrancas 1\ -18 +1Villa Mercedes (2) -23 +3 Barrancas 2) -18 +1
San Luis 1 -18 +3 Rosario (1) -17 +1
San Luis 2 -19 +3 Rosario (2) -17 +1La Paz 11 -20 +3 San Nicolas (1) -17 +1
La Paz 12\ -21 +3 San Nicolas 12\ -17 +1Santa Rosa (1) -18 +3 Rio Tala (1) -17 +1Santa Rosa (2) -18 +3 Rio Tala (2) -17 +1Mendoza (1) -18 +3 Escalada (1) -17 +1
Escalada 12\ -26 +3Buenos Aires (1) -22 +1
Table 2-3: ADM receiver and transmitter power levels
J. Steinberg
26

Implementation ofOptical Amplification in a National-Scale SDH Network
2.4 WaveStar™ ADM 16/1
27
Every POP contains a Lucent WaveStar™ ADM 16/1 subrack which is housed in a EuropeanTelecommunication Standards Institute (ETSI) compliant rack. In these subracks there is roomfor:
• Two STM-16 line port units (Line Interface Units)• Two Power and Timing Units (PTU)• Two Cross-Connect (CC) Units• One System Controller (SC)• 9 additional slots for tributary interface units
Figure 2-3 shows the frontview ofa WaveStar™ ADM 16/1 subrack. The elements listedabove are indicated in the figure and will be explained individually below. Observe that twotributary slots are empty and can be used for future insertion of tributary interface units.
• t ~ I II • '. ·II(i)
Figure 2-3: Frontview of a WaveStar™ ADM 16/1 subrack
Line Interface Units
Cross-Connect Units
Power and Timin Units
Interface Units 1 - 9
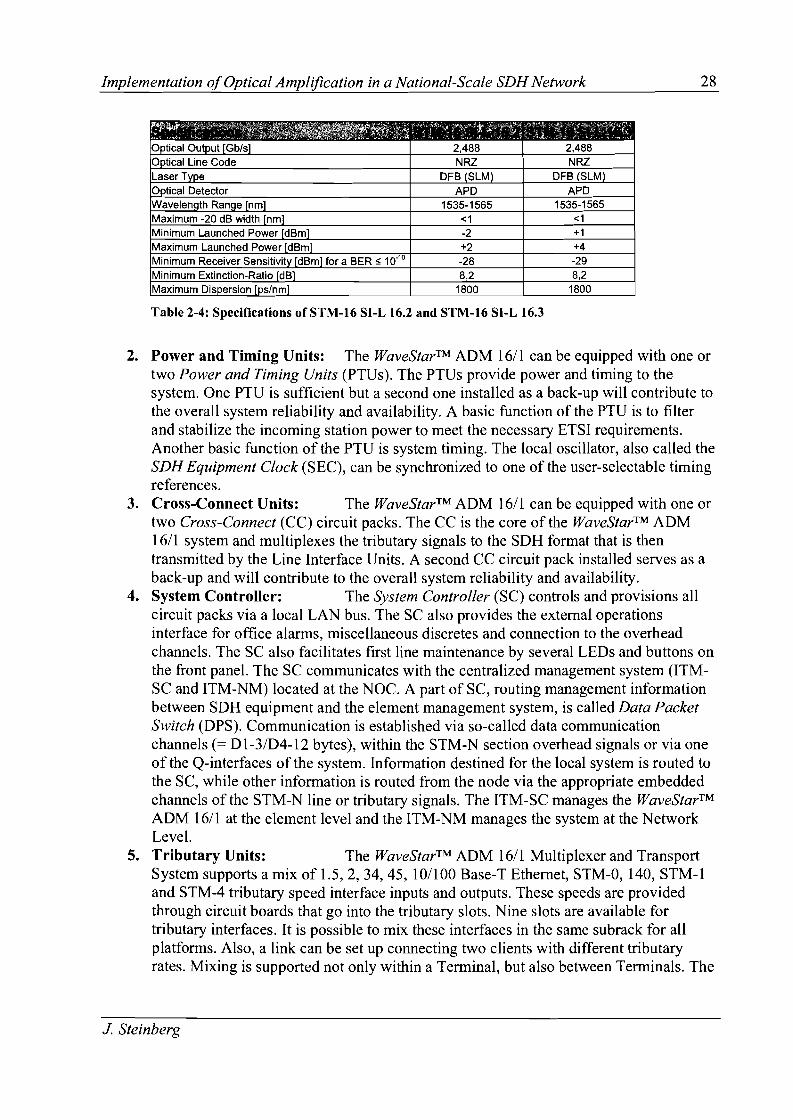
1. Line Interface Units: The WaveStar™ ADM 16/1 can be equipped with STM-16, STM-4, STM-l and STM-O optical interface circuit packs, which are available inseveral types [3]. COMSAT uses two types: STM-16 SI-L 16.2 and STM-16 SI-L 16.3.These circuit packs are equipped with a universal build-out optical connector type, andtransmit the multiplexed SDH signal over the fiber. Table 2-4 lists some specificationsof these two line interface units.
1. Steinberg
Implementation ofOptical Amplification in a National-Scale SDH Network 28
2,488NRZ
DFB SLMAPD
1535-1565<1-2+2-288,2
1800
Table 2-4: Specifications of STM-16 Sl-L 16.2 and STM-16 Sl-L 16.3
2,488NRZ
DFB SLMAPD
1535-1565<1+1+4-298,2
1800
2. Power and Timing Units: The WaveStar™ ADM 16/1 can be equipped with one ortwo Power and Timing Units (PTUs). The PTUs provide power and timing to thesystem. One PTU is sufficient but a second one installed as a back-up will contribute tothe overall system reliability and availability. A basic function of the PTU is to filterand stabilize the incoming station power to meet the necessary ETSI requirements.Another basic function of the PTU is system timing. The local oscillator, also called theSDH Equipment Clock (SEC), can be synchronized to one of the user-selectable timingreferences.
3. Cross-Connect Units: The WaveStar™ ADM 16/1 can be equipped with one ortwo Cross-Connect (CC) circuit packs. The CC is the core of the WaveStar™ ADM16/1 system and multiplexes the tributary signals to the SDH format that is thentransmitted by the Line Interface Units. A second CC circuit pack installed serves as aback-up and will contribute to the overall system reliability and availability.
4. System Controller: The System Controller (SC) controls and provisions allcircuit packs via a local LAN bus. The SC also provides the external operationsinterface for office alarms, miscellaneous discretes and connection to the overheadchannels. The SC also facilitates first line maintenance by several LEOs and buttons onthe front panel. The SC communicates with the centralized management system (ITMSC and ITM-NM) located at the NOC. A part of SC, routing management informationbetween SOH equipment and the element management system, is called Data PacketSwitch (OPS). Communication is established via so-called data communicationchannels (= 01-3/04-12 bytes), within the STM-N section overhead signals or via oneof the Q-interfaces of the system. Information destined for the local system is routed tothe SC, while other information is routed from the node via the appropriate embeddedchannels of the STM-N line or tributary signals. The ITM-SC manages the WaveStar™ADM 16/1 at the element level and the ITM-NM manages the system at the NetworkLevel.
5. Tributary Units: The WaveStar™ ADM 16/1 Multiplexer and TransportSystem supports a mix of 1.5,2,34,45, 10/100 Base-T Ethernet, STM-O, 140, STM-Iand STM-4 tributary speed interface inputs and outputs. These speeds are providedthrough circuit boards that go into the tributary slots. Nine slots are available fortributary interfaces. It is possible to mix these interfaces in the same subrack for allplatforms. Also, a link can be set up connecting two clients with different tributaryrates. Mixing is supported not only within a Terminal, but also between Terminals. The
J. Steinberg

Implementation ofOptical Amplification in a National-Scale SDH Network 29
PDH interface (140 Mb/s) at one end ofa circuit within a WaveStar™ ADM 16/1network can be upgraded to SDH interfaces (STM-1) without any changes at the otherend.
Figure 2-4 shows a more schematically view of the WaveStar™ ADM 16/1 with its possiblecircuit boards. As can be observed from the figure the CC serves as the heart of theWaveStar™ ADM 16/1 system.
10/100Base-T
Figure 2-4: A schematical view of the WaveStar™ ADM 16/1
2.5 Tributary Interfaces - Clients
A SDH STM-16 frame can be divided in Virtual Containers (VC) with each VC having itsown bit-rate. Figure 2-5 shows a schematically view of how the STM-16 can be split up inVCs. Table 2-5 lists the proportion of each VC to a smaller VC and the bit-rate associated withthat. COMSAT uses three different tributary interfaces:
• LJB439 STM-1e/o Interface:• LJB427 34/45 Mb/s PDH Interface:• LJB41 1 2 Mb/s PDH Interface:
J. Steinberg
Consists of4 x STM-lsConsists of 6 x E3 and 6 x T3Consists of 63 x E1

Implementation ojOptical Amplification in a National-Scale SDH Network
STM-16
VC·3 VC-4
30
STM·1 STM-4
Figure 2-5: A schematical view of a STM-16 frame split up in several VCs
VC-1.2 2,47 Mb/s21 xVC-1.2
3 x VC-3VC-4
4 x STM-14 x STM-4
VC-3 51,84 Mb/sVC-4 155,52 Mb/s
STM-1 155,52 Mb/sSTM-4 622,08 Mb/sSTM-16 2488,32 Mb/s = 2,5 Gb/s
Table 2-5: Proportion between various VCs
The exact line speed of E1 is 2,048 Mb/s, that of E3 is 34,368 Mb/s and T3 is 44,736 Mb/s. Allsignals (STM-l, E3, T3, and E1) can be located in a yc. Bit-slots not occupied within the YCshould be considered lost because they cannot be used for other traffic. Table 2-6 lists whichYC is used for which signal and the efficiency.
li"2lijl••l~Aii2·;"IC.DacitYEfflc:"ncvSTM-1 VC-4 2488,32/2488,32 100%
13 VC-3 44,736/51,84 86,3%E3 VC-3 34,368/51,84 66,3%E1 VC-1.2 2,048/2,47 82,9%
Table 2-6: Assignment of a VC to the various signals
To get an idea of what percentage of the capacity of the national SDH network is used, the bitrates of all the tributary interfaces should be summed up. Every tributary interface adds to thecapacity used over the whole ring network. This is valid because traffic is send from POP X toPOP Z in two directions, for protection purposes, and the signal therefore propagates over thewhole ring network. There are a couple of difficulties involved in calculating what part of thecapacity is used:
• Clients can be connected to the national SDH network with several bit-rates as listed inTable 2-6. The bit-rates of the YCs (see Table 2-6) should be added instead of the clientbit-rates.
• A couple of ADMs contain STM-l tributary interfaces. These interfaces are used to setup a small ring with the ADM at that POP and another POP located outside the mainring network (this smaller ring network then handles a bit-rate of 155,52 Mb/s). TwoSTM-l tributary interfaces are used to create that small ring network and are located inthe tributary slots of the ADM that handles STM-16. Just one of these STM-I tributary
J. Steinberg
Implementation ojOptical Amplification in a National-Scale SDH Network 31
interfaces should be taken into account as to calculate its part in the total capacity of thenational SDH network used.
• The STM-1 tributary interfaces just mentioned consist of VC-3s and VC-l.2s. VCs thatdon't carry traffic remain available for use. For every STM-l tributary interface used tocreate a smaller ring network the bit-rate ofall used VCs should be counted instead ofthe total STM-l tributary interface bit-rate of 155,52 Mb/s.
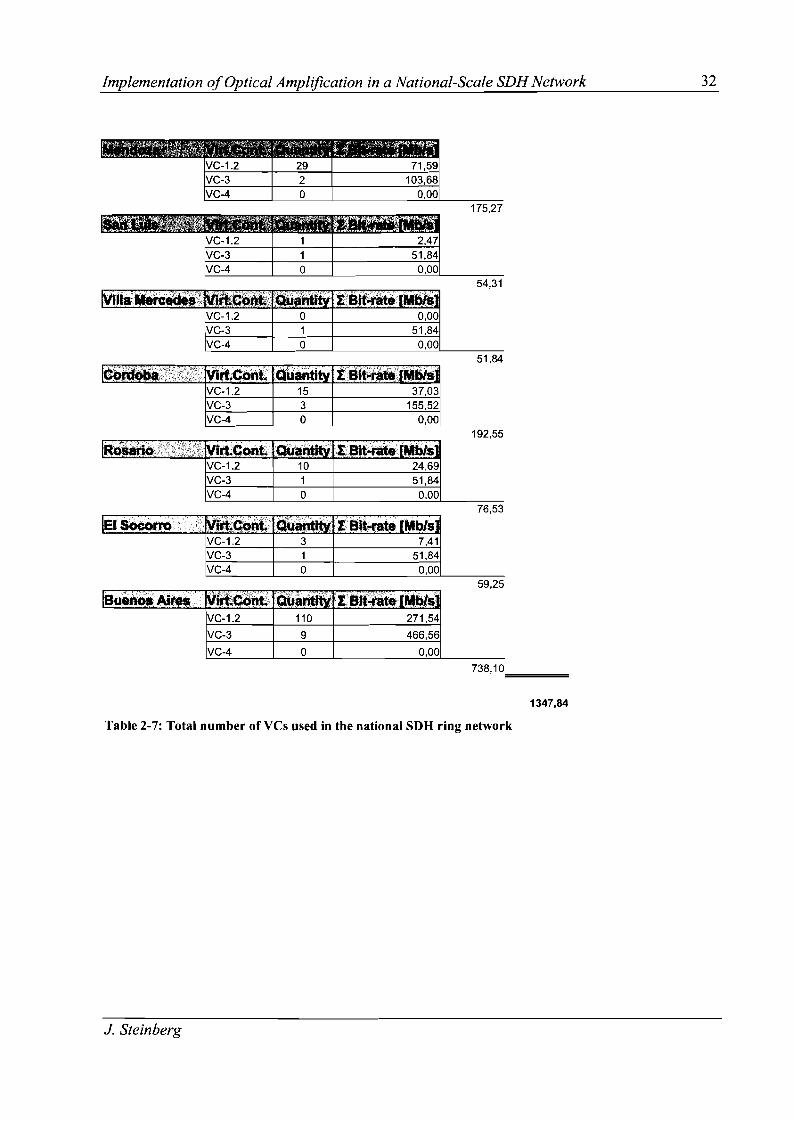
No clients are connected to the Global Crossing part ofthe ring network and therefore nosignals are added or dropped at these POPs. Regarding the Silica Networks part of the ringnetwork just the following POPs are used to add/drop signals: Mendoza, San Luis, VillaMercedes, Cordoba, Rosario, El Socorro and Buenos Aires. Table 2-7 on the next pagesummarizes the VCs used by each of these ADMs.
As can be seen from this table the total bit-rate used is 1347,84 Mb/s. This numberhowever, should be divided by two since each pair ofVC produced by a tributary slot accountsfor one VC traveling over the ring network. This results in 673,92 Mb/s used of a total capacityof2488,32 Mb/s, which stands for a network occupation of over 27 %.1
1 Based on the configuration of the national SDH ring network for October 2005.
J Steinberg
Implementation ofOptical Amplification in a National-Scale SDH Network 32
VC-1.2VC-3VC-4
292o
71,59103,68
0,00175,27
~'-------
VC-1.2 15VC-3 3VC-4 0
54,31
51,84
192,55
VC-1.2 10 24,69VC-3 1 51,84VC-4 0 0,00
76,53
IEfsOCOtro';,. •..·.;f;;Wft:i~~lfl.l1tJii ;t'Sit~. [MbJslVC-1,2 3 7,41VC-3 1 51,84VC-4 0 0,00
59,25
ISuenoS'Aite$" virtcontauantlfv '! Bit-rate (Mbls)VC-1.2 110 271,54
VC-3 9 466,56
VC-4 0 0,00
738,10====
1347,84
Table 2-7: Total number ofVCs used in the national SDH ring network
1. Steinberg
Implementation ofOptical Amplification in a National-Scale SDH Network 33
3 Attenuation and Dispersion Calculations
mtlca Istn utlon rame
,l£A"ADM Removed
/
ADM I ADM
Rx Txr-·······__···_..·-i
I.Or\. . Rx TxII I i I... II \...1 II i : .. \...1 II II
Tx Rx " I" !: I" Tx Rx
IIII;,_.__..._--J
POPX POpy POPZ
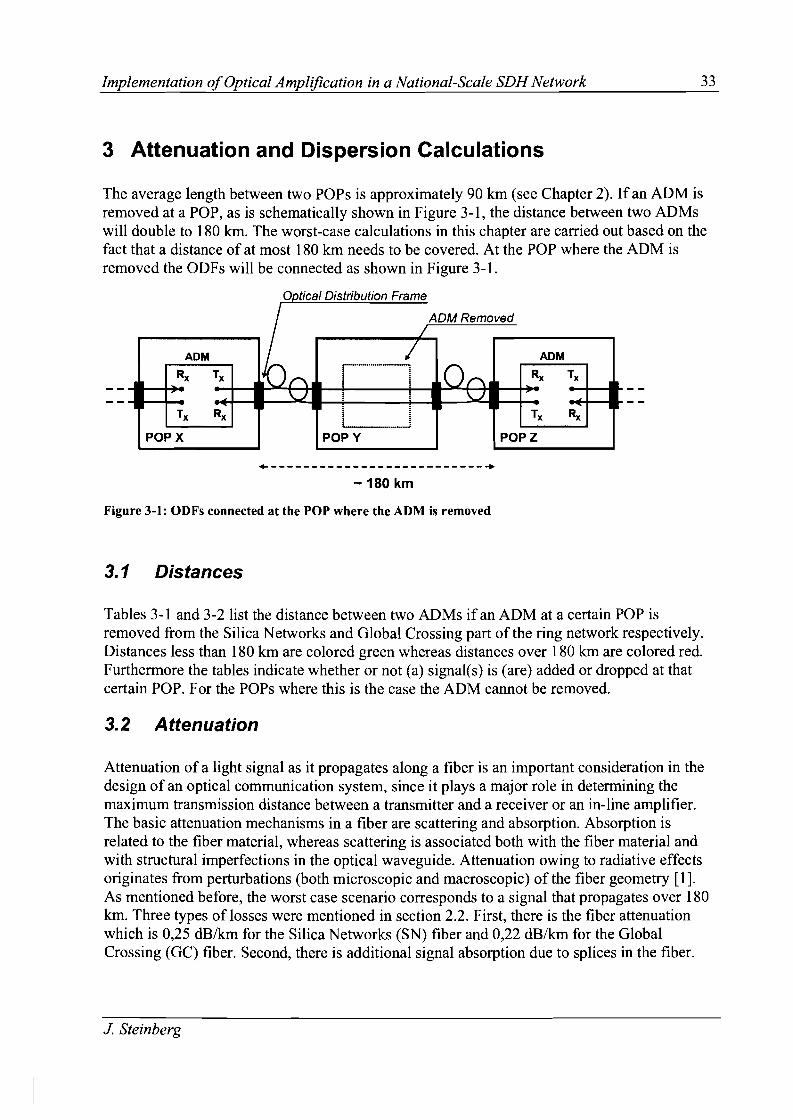
The average length between two POPs is approximately 90 Ian (see Chapter 2). If an ADM isremoved at a POP, as is schematically shown in Figure 3-1, the distance between two ADMswill double to 180 Ian. The worst-case calculations in this chapter are carried out based on thefact that a distance of at most 180 km needs to be covered. At the POP where the ADM isremoved the ODFs will be connected as shown in Figure 3-1.
a ' I D' 'b ' F
+--------------------------.-180 km
Figure 3-1: ODFs connected at the POP where the ADM is removed
3.1 Distances
Tables 3-1 and 3-2 list the distance between two ADMs if an ADM at a certain POP isremoved from the Silica Networks and Global Crossing part of the ring network respectively.Distances less than 180 Ian are colored green whereas distances over 180 km are colored red.Furthermore the tables indicate whether or not (a) signal(s) is (are) added or dropped at thatcertain POP. For the POPs where this is the case the ADM cannot be removed.
3.2 Attenuation
Attenuation of a light signal as it propagates along a fiber is an important consideration in thedesign of an optical communication system, since it plays a major role in determining themaximum transmission distance between a transmitter and a receiver or an in-line amplifier.The basic attenuation mechanisms in a fiber are scattering and absorption. Absorption isrelated to the fiber material, whereas scattering is associated both with the fiber material andwith structural imperfections in the optical waveguide. Attenuation owing to radiative effectsoriginates from perturbations (both microscopic and macroscopic) of the fiber geometry [1].As mentioned before, the worst case scenario corresponds to a signal that propagates over 180Ian. Three types of losses were mentioned in section 2.2. First, there is the fiber attenuationwhich is 0,25 dB/Ian for the Silica Networks (SN) fiber and 0,22 dB/km for the GlobalCrossing (GC) fiber. Second, there is additional signal absorption due to splices in the fiber.
J. Steinberg

Implementation ofOptical Amplification in a National-Scale SDH Network
Buenos Aires Exaltaci6n de la Cruz Marcos Paz no 183,2
Marcos Paz Arrecifes Exa/taci6n de la Cruz no 180,4Exaltaci6n de la Cruz EISocorro Arrecifes no 178,9Arrecifes Rosario E/ Socorro es 188,7EI Socorro Canada de Gomez Rosario es 198,6Rosario San Marcos Sud Canada de Gomez no 190,6Canada de Gomez Villa Nueva San Marcos Sud no 183,2
San Marcos Sud Manfredi Villa Nueva no 181,4
Villa Nueva Cordoba Manfredi no 192,8Manfredi Corralito Cordoba es 197,2
Cordoba Hernando Corralito 189,6Corralito Rio Cuarto Hernando 184,0Hernando Sam acho Rio Cuarto 179,7Rio Cuarto Villa Mercedes Sam acho 179,0Sam acho San Luis Villa Mercedes es 177,1Villa Mercedes La Paz San Luis 172,7San Luis Santa Rosa La Paz 176,6La Paz Mendoza Santa Rosa no 180,1
Table 3-1: Distances and add/drop ofsignal(s) for the Silica Networks POPs
I~ri~~.i;,;,',A0f>i.» ,iB'; ~.>,gA ..;
, > i"T~' '{,J ,
'<". ~,iL,: ,,' ; >__ "ii' S','j
Mendoza DesaQuadero Lencinas no 179,3Lencinas San Luis Desaauadero no 183,9DesaQuadero Villa Mercedes San Luis no 190,8San Luis Sampacho Villa Mercedes no 179,3Villa Mercedes Rio Cuarto Sampacho no 130,3Sampacho Berrotaran Rio Cuarto no 132,9Rio Cuarto San AQustin Berrotaran no 153,8Berrotaran Cordoba San Agustin no 149,7San Agustin Rio Primero Cordoba no 158,7Cordoba Arroyito Rio Primero no 138,4Rio Primero San Francisco Arrovito no 157,1Arroyito Rafaela San Francisco no 193,0San Francisco Santo Tome Rafae/a no 191,7Rafaela Barrancas Santo Tome no 167,8Santo Tome Rosario Barrancas no 158,0Barrancas San Nicolas Rosario no 161,4Rosario Rio Tala San Nico/as no 158,2San Nicolas Escalada Rio Tala no 164,3Rio Tala Buenos Aires Esca/ada no 178,8
Table 3-2: Distances and add/drop of signal(s) for the Global Crossing POPs
34
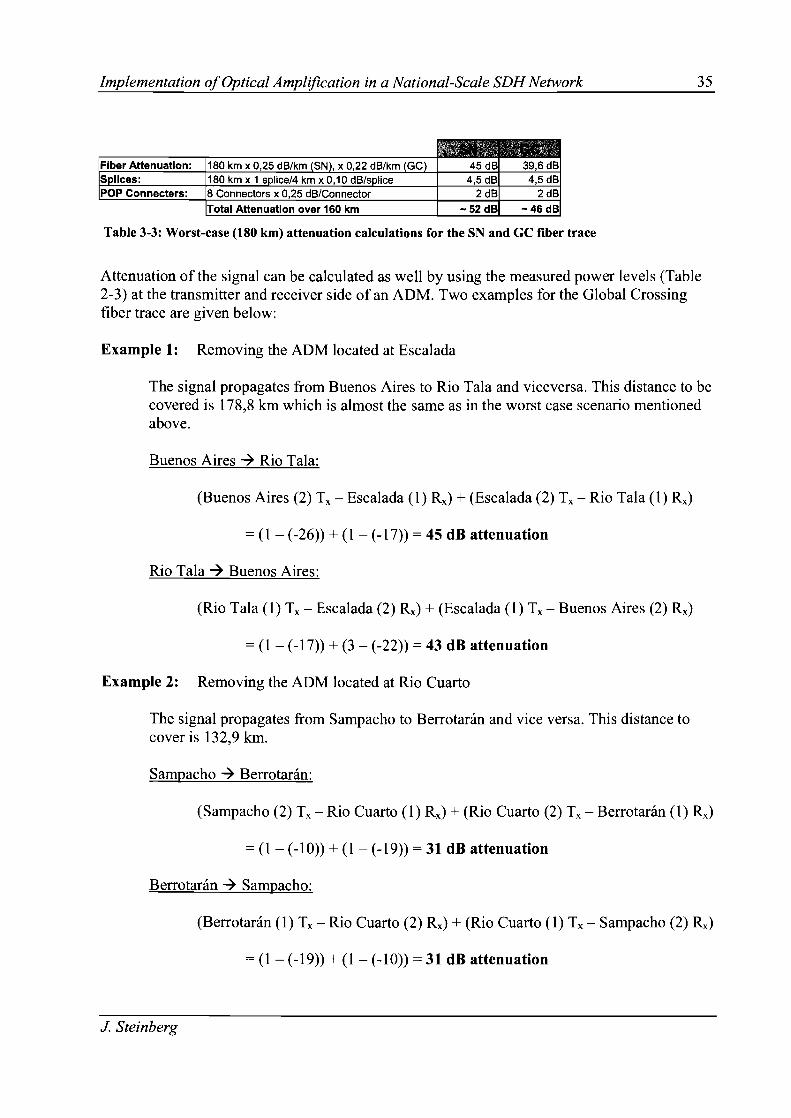
On average there is one splice every 4 kIn of fiber with a 0,10 dB loss per splice. Finally, thereare also POP connector losses. The configuration shown in Figure 3-1 has eight POPconnections along the 180 kIn link. The total attenuation can be calculated as shown in Table3-3 for Silica Networks (SN) and Global Crossing (GC):
J. Steinberg
Implementation ofOptical Amplification in a National-Scale SDH Network 35
Fiber Attenuation:Slices:POP Connecters:
Table 3-3: Worst-case (180 km) attenuation calculations for the SN and GC fiber trace
Attenuation of the signal can be calculated as well by using the measured power levels (Table2-3) at the transmitter and receiver side of an ADM. Two examples for the Global Crossingfiber trace are given below:
Example 1: Removing the ADM located at Escalada
The signal propagates from Buenos Aires to Rio Tala and viceversa. This distance to becovered is 178,8 kIn which is almost the same as in the worst case scenario mentionedabove.
Buenos Aires ~ Rio Tala:
(Buenos Aires (2) Tx - Escalada (1) Rx) + (Escalada (2) Tx - Rio Tala (1) Rx)
= (1- (-26)) + (1- (-17)) = 45 dB attenuation
Rio Tala ~ Buenos Aires:
(Rio Tala (1) Tx - Escalada (2) Rx) + (Escalada (1) Tx - Buenos Aires (2) Rx)
= (1- (-17)) + (3 - (-22)) = 43 dB attenuation
Example 2: Removing the ADM located at Rio Cuarto
The signal propagates from Sampacho to Berrotanin and vice versa. This distance tocover is 132,9 kIn.
Sampacho ~ Berrotanin:
(Sampacho (2) Tx - Rio Cuarto (1) Rx) + (Rio Cuarto (2) Tx - Berrotanin (1) Rx)
= (1- (-10)) + (1 - (-19)) = 31 dB attenuation
Berrotanin ~ Sampacho:
(Berrotanin (1) Tx - Rio Cuarto (2) Rx) + (Rio Cuarto (1) Tx - Sampacho (2) Rx)
= (1- (-19)) + (1- (-10)) = 31 dB attenuation
J. Steinberg

Implementation ofOptical Amplification in a National-Scale SDH Network
3.3 BER versus OSNR
36
A measure of the signal degradation after transmission can be obtained by calculating the BER,given by the following equation [4]:
(3.1 )
where erfc stands for the complementary error function and Q is given by
(3.2)
The OSNR is a measure of the signal degradation due to optical noise accumulation and can becalculated by using the following equation:
OSNR = 10 10 log(~ I PN
), (3.3)
where Ps and PN are the average received optical signal and noise powers respectively.Every transmitter suffers from the phenomenon of non-extinction for 'zero' bits. This
means a non-zero average optical signal power level of a 'zero' bit. The extinction-ratio Cr of atransmitter can be defined with
Cr = 10 10 log(~,ll ~,o), (3.4)
where PS,1 and Ps,o are the average transmitted optical signal power values of a 'one' bit and'zero' bit respectively. Figure 3-2 (Script: Appendix A.l) shows the BER versus the OSNR fordifferent transmitter extinction-ratios. The green trace (cr = 8,2 dB) is chosen explicitly becausethis corresponds to the extinction-ratio of the line interface units used in COMSAT' s SOHnetwork as can be observed from Table 2-4.
3.4 Dispersion
Single mode fibers suffer from Group- Velocity Dispersion (GVD), or simply referred to asfiber dispersion, originating from the frequency dependence of the fiber's core refractiveindex. In the presence of dispersion different spectral components of a transmitted pulse travelat different speeds, leading to pulse broadening and limiting system performance. Uponpropagation pulses within a pulse sequence will lose peak power and flatten out. At a certaindistance these pulses will start to spread across their allocated bit-slot. These pulses theninterfere in adjacent bit-slots which is known as Inter-Symbol-Interference (lSI). A graphicalview of a pulse shape broadening upon propagation in an optical fiber is shown in Figure 3-3.
J. Steinberg

Implementation ofOptical Amplification in a National-Scale SDH Network 37
----;.
· . ,--- -,_ ~....... ~
· , ,....... \ / ' .· . ,
7 8 9 10 11 12 13 14 15
OSNR [dB]
1E-7
1E-4 .,...---,.....---,--~-.------r--------,
1E-5
1E-6
1E-8l:t::w 1E-9co
1E-10
1E-11
1E-12
1E-136
Figure 3-2: BER vs OSNR for varying gr. B = 2,5 Gb/s
timepropagation distance
Figure 3-3: Broadening of a pulse upon dispersive propagation in an optical fiber
The dispersion length, L D, provides a good estimation of the propagated distance at which toexpect dispersion-induced impairments, and is given by [4]:
(3.5)
where To is the half-width of the lie-intensity point of the initial pulse shape contained in thepulse sequence and ~2 represents the GVD-parameter which equates to the dispersionparameter D with:
J. Steinberg

Implementation ofOptical Amplification in a National-Scale SDH Network 38
D =_ 27tc ~').} 2'
(3.6)
The assumption of initially unchirped pulses is made [4]. However, Lucent's WaveStar™ADM 16/1 transmitters are directly modulated producing initially chirped pulses. In this caseapplying straightforward Eq. (3.5) will overestimate the propagation length at which to expectdispersive problems.
The receiver part of the Lucent's WaveStar™ ADM 16/1 line interface units allows amaximum dispersion of 1800 ps/nm (see Table 2-4). Combined with a D of at maximum 5 and18 ps/nm'kIn for G.655 (NZDSF) and G.652 (SSMF) compliant fiber respectively (see Table2-2) this results in a maximum propagation distance (dispersion-wise) of 360 and 100 kInrespectively. This means that for propagation upon 180 kIn no dispersion compensationmeasures have to be taken in the case of G.655 compliant fiber, but Dispersion CompensationModules (DCM) are needed for the G.652 compliant fiber.These conclusions are supported with the results of a simulation that takes into account theinitially chirped pulses. Figure 3-4 shows the HER vs OSNR graphs for both the NZDSF andSSMF upon 180 kIn propagation. (Script: Appendix A.2)
1E-6-,---~---,,---~-~--~--,
1E-7
1E-8
0::: 1E-9WIn
1E-10
1E-11
--Back-ta-Back--z = 180 km, NZDSF--z =180 km, SSMF
1716151413121E-12 +----j----;r---....j-1---;---~--l
11
OSNR [dB]
Figure 3-4: BER vs OSNR. B = 2,5 Cb/s, C = -6 and &r = 8,2 dB.
J. Steinberg
Implementation ofOptical Amplification in a National-Scale SDH Network 39
4 General Solutions
This chapter deals with the general solutions for removing an ADM at a POP. As discussedbefore, due to attenuation effects, it is not possible to remove an ADM and connect the 'loose'fiber ends. The signal needs to be amplified along the increased fiber length. Sections 4.1 - 4.3discuss the technical aspects of three different general solutions. Aspects to be taken intoaccount are:
• Increased attenuation due to increased propagation distance• OSNR level to reach satisfactory BER at the receiver side• Monitoring the performance of the new equipment to be installed
Section 4.4 then introduces some financial aspects that have to be taken into account.
4. 1 In-line EDFA Amplification
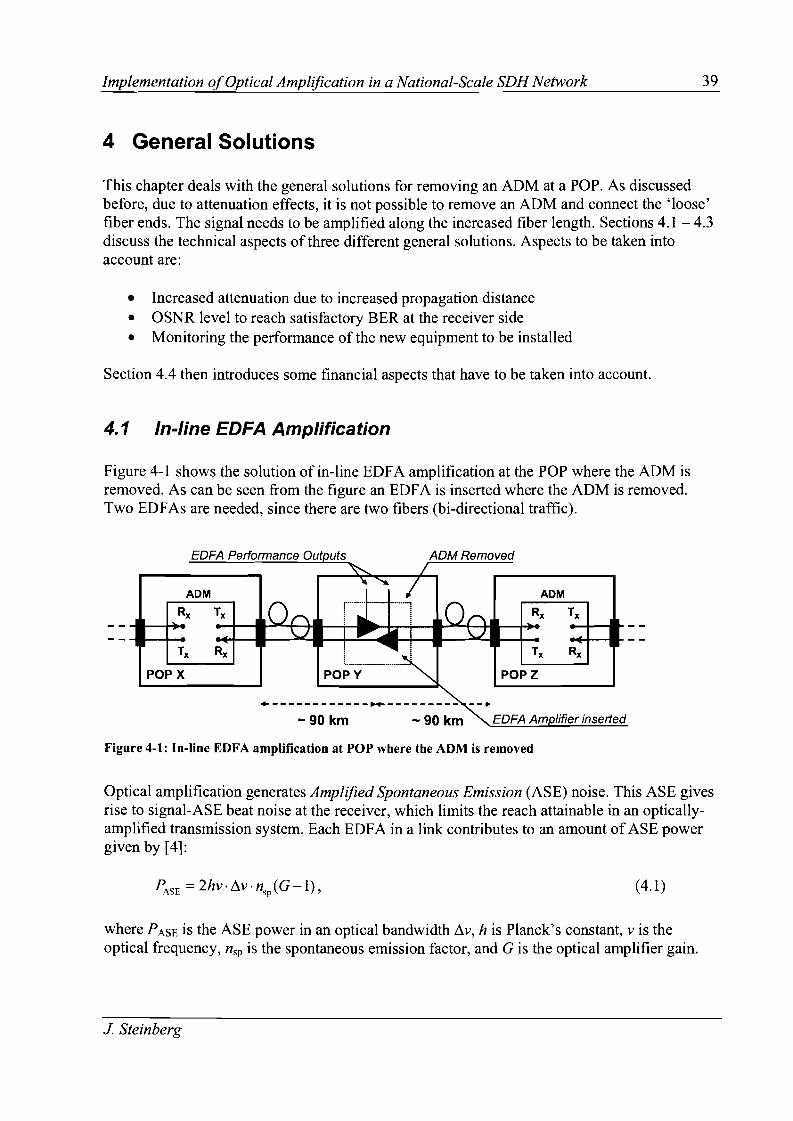
Figure 4-1 shows the solution of in-line EDFA amplification at the POP where the ADM isremoved. As can be seen from the figure an EDFA is inserted where the ADM is removed.Two EDFAs are needed, since there are two fibers (bi-directional traffic).
EDFA Performance Outouts ADM Removed~ /
ADM
Rx Tx •II
Tx Rx •••~! II1II i • I .~
PO~-y··_····_········~ pOP'--z----'
II \...111 ! ...... 11 i II VII
'll-""" I.IOr'\.. 1"""'-; ····_···········1 .IOr'\ .•
ADM
POPX
••II
+------------~-----------~
-90 km -90 km EDFA Amolifier inserted
Figure 4-1: In-line EDFA amplification at POP where the ADM is removed
Optical amplification generates Amplified Spontaneous Emission (ASE) noise. This ASE givesrise to signal-ASE beat noise at the receiver, which limits the reach attainable in an opticallyamplified transmission system. Each EDFA in a link contributes to an amount ofASE powergiven by [4]:
PASE =2hv·Llv.nsp (G-l), (4.1)
where PASE is the ASE power in an optical bandwidth Llv, h is Planck's constant, v is theoptical frequency, nsp is the spontaneous emission factor, and G is the optical amplifier gain.
J Steinberg

Implementation ofOptical Amplification in a National-Scale SDH Network 40
The spontaneous emission factor, nsp , is determined by the inversion of the amplifier's ErbiumIons.
The signal-spontaneous noise impairment can be characterized in terms of the OSNR.This OSNR target must be sufficient to achieve the required system performance. The BERcorresponding to a certain OSNR can be observed from Figure 3-2. For a system consisting ofN amp fiber spans, each of loss Lspan (in dB) followed by an optical amplifier with output Pout (indBm) per channel launched into the span and noise figure (NF) (in dB), the OSNR (in dB) of asignal channel at the end of the system is approximately [5]:
OSNR(dB) =58 + ~ut - Lspan - NF -10 10 10g(Namp )' (4.2)
The receiver part of the Lucent line interface units used requires either -28 or -29 dBm inputpower to reach a BER::::: 10-10 (see Table 2-4). As mentioned before, the extinction-ratio ofthese line interface units is 8,2 dB, combining both leads to an OSNR requirement of at least13,5 dB (see Figure 3-2). The solution given in Figure 4-1 with L span = 90 km x 0,25 dB/km =22,5 dB and Namp = 1 results in the following requirement for the EDFA noise performance:
NF-~ut ~22dB. (4.3)
According to Eq. (4.3) and assuming an EDFA output power Pout as low as 0 dBm, NF can beas high as 22 dB and still achieve the required BER. This result is expected since the link usesa single EDFA. When the whole ADM is removed, monitoring of the installed EDFAs fromthe NOC requires either routing the monitor signal to one of the neighboring POPs orestablishing separate connections from the EDFAs to the NOC (i.e. through TCP/IP). Thisrequires extra infrastructure adding to complexity and cost.
4.2 Booster EDFA Amplification
ADM
ADM Removed
-180 km
1L _ .1
POpy
+--------------------------
ADM
Rx Tx
POPX
Figure 4-2 shows the solution of Booster EDFA amplification at the POPs neighboring to thePOP where the ADM is removed. Two Boosters are needed, since traffic is sent in twoopposite directions. The 'loose' fiber ends at the POP where the ADM is removed areconnected as can be seen from the figure.
EDFA Performance Out ut
Figure 4-2: Booster EDFA amplification at neighboring POPs
J. Steinberg
Implementation ofOptical Amplification in a National-Scale SDH Network 41
The same conclusions from the preceding section regarding the OSNR level at the receiver sidestill apply. The amount of ASE added to the signal due to the Booster EDFA remains low andyields an acceptable OSNR level.
Management of the Boosters at the NOe is done by connecting their managementchannel to the Lucent WaveStar™ ADM 16/1 present at the POP. (Both pieces of equipment,ADM and Booster, are located at the same POP.) This solution requires no extra infrastructureto manage the Boosters.
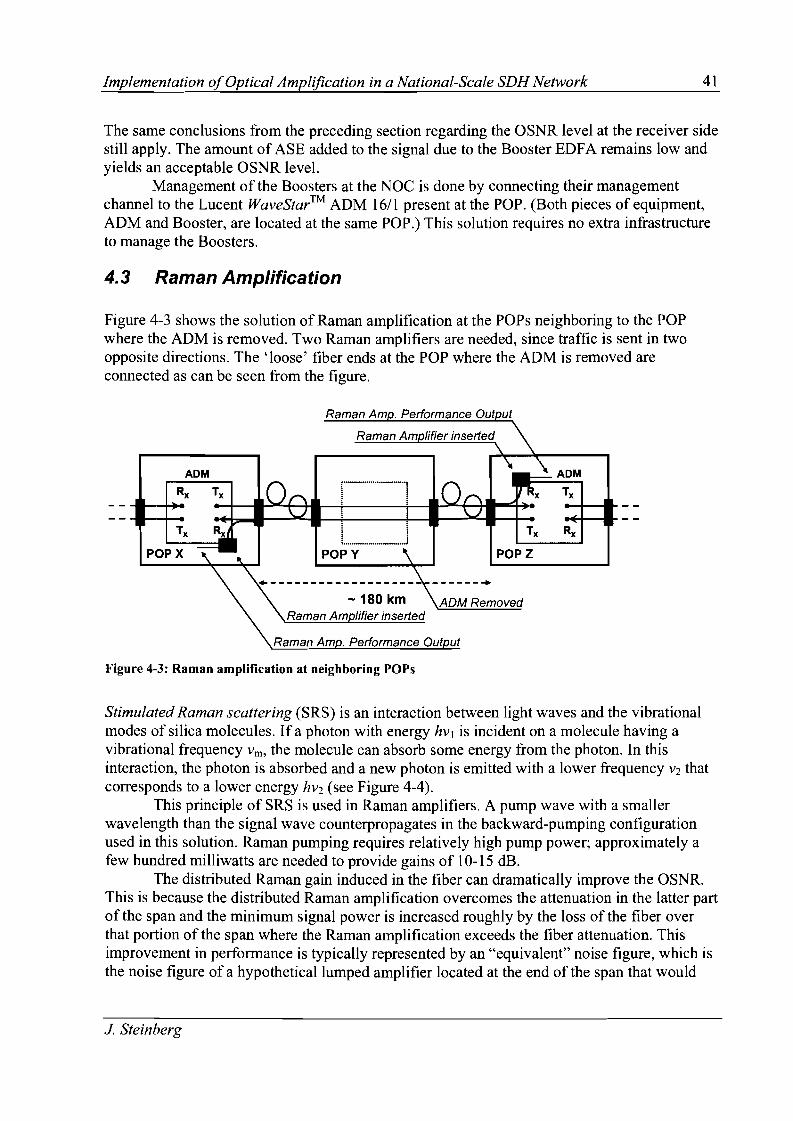
4.3 Raman Amplification
Figure 4-3 shows the solution of Raman amplification at the POPs neighboring to the POPwhere the ADM is removed. Two Raman amplifiers are needed, since traffic is sent in twoopposite directions. The 'loose' fiber ends at the POP where the ADM is removed areconnected as can be seen from the figure.
ADM
POPZ
ADM Removed
Raman Am Imer inserted
l _ ;
r····················..·········l~ i
ADM
POPX
Figure 4-3: Raman amplification at neighboring POPs
Stimulated Raman scattering (SRS) is an interaction between light waves and the vibrationalmodes of silica molecules. If a photon with energy hVl is incident on a molecule having avibrational frequency Vrn , the molecule can absorb some energy from the photon. In thisinteraction, the photon is absorbed and a new photon is emitted with a lower frequency V2 thatcorresponds to a lower energy hV2 (see Figure 4-4).
This principle of SRS is used in Raman amplifiers. A pump wave with a smallerwavelength than the signal wave counterpropagates in the backward-pumping configurationused in this solution. Raman pumping requires relatively high pump power; approximately afew hundred milliwatts are needed to provide gains of 10-15 dB.
The distributed Raman gain induced in the fiber can dramatically improve the OSNR.This is because the distributed Raman amplification overcomes the attenuation in the latter partof the span and the minimum signal power is increased roughly by the loss of the fiber overthat portion of the span where the Raman amplification exceeds the fiber attenuation. Thisimprovement in performance is typically represented by an "equivalent" noise figure, which isthe noise figure of a hypothetical lumped amplifier located at the end of the span that would
J. Steinberg

Implementation ofOptical Amplification in a National-Scale SDH Network 42
Input signals ofequal powers
SRS effect in asilica fiber
Relativepower ofoutputsignals
Figure 4-4: SRS transfers optical power from a shorter to a longer wavelength
produce the same gain and the same contribution to the accumulated ASE. The equivalentnoise figure for a counter-pumped distributed Raman pump is [6]:
(4.4)
where NFeq is the equivalent noise figure in linear units, GR is the Raman gain in linear units atthe signal wavelength, as is the fiber attenuation at the signal wavelength and a p is theattenuation at the Raman pump wavelength. The approximation for NFeq holds for large gainG » 1 and in the approximation that as ;::::: a p. In general, the noise figure of a Raman amplifieris better than that of an EDFA and therefore the expected OSNR at the receiver will produce asatisfactory BER.
Management of the Raman amplifiers can be implemented in the way described insection 4.2. This solution requires no extra infrastructure to monitor the Raman amplifiers.
4.4 Financial Aspects
Among financial aspects to be taken into account are:
• Economical value of the equipment removed• Cost of the new equipment• Leasing costs of the POPs• One-time installment/testing cost• Maintenance expenses of the equipment at the POPs
The cost of the new equipment to be installed depends on the solution and vendor chosen.Chapter 5 discusses the solutions given by a couple of vendors.
A solution with no equipment installed at the POP where the ADM is removedeliminates the necessity ofleasing that particular POP. (Solutions in sections 4.2 and 4.3)
J. Steinberg

Implementation o/Optical Amplification in a National-Scale SDH Network 43
Installment and test costs are a result of changing the network configuration. Removing anADM and applying one of the solutions given in sections 4.1 - 4.3 results in as many as fouremployees working on this task for a day. Three of these employees would go to the POPs andthe fourth would stay at the NOe to apply software configuration changes. Transportation andwage costs should be taken into account. These costs however, are small compared to the valueof the equipment.
A solution with no equipment installed at the POP (Figures 4.2 and 4.3) where theADM is removed results in lower maintenance expenses. The engineer performing themaintenance has now less POPs to visit. The time saved, however, is negligible since it fallswithin the standard deviation of the total maintenance-time needed for the whole network.Maintenance savings are therefore ignored.
J. Steinberg
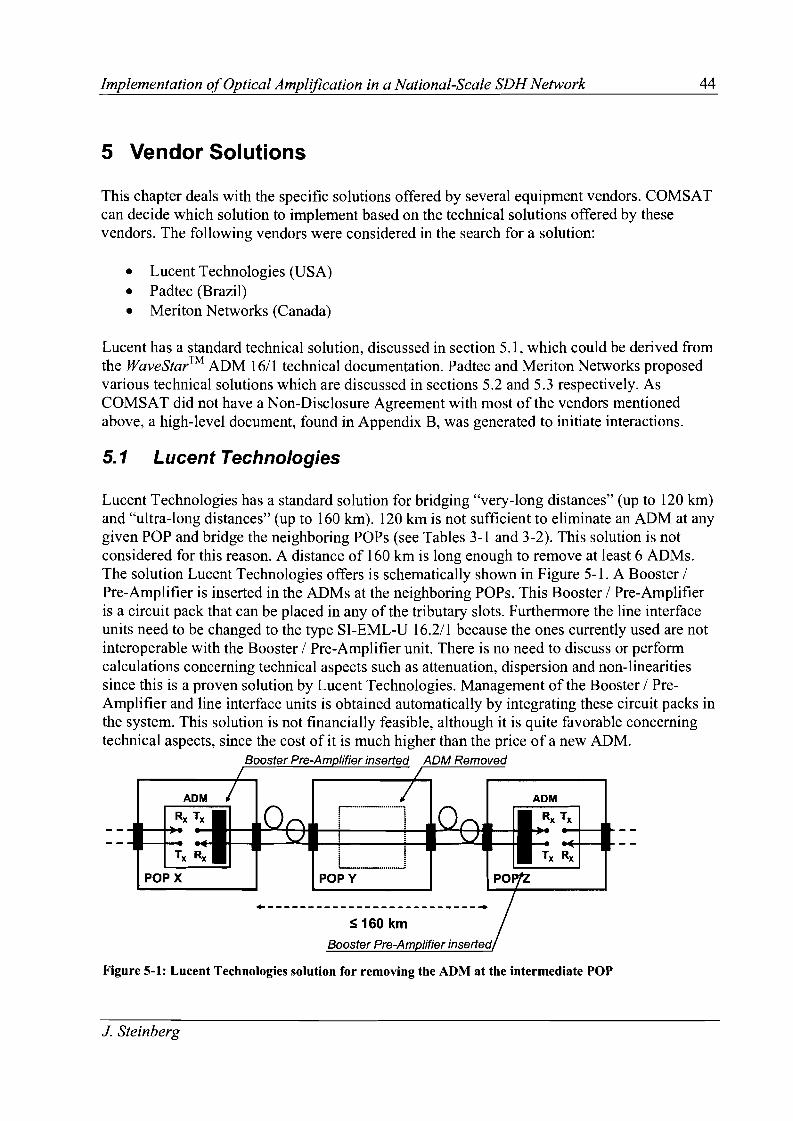
Implementation ojOptical Ampl!fication in a National-Scale SDH Network 44
5 Vendor Solutions
This chapter deals with the specific solutions offered by several equipment vendors. COMSATcan decide which solution to implement based on the technical solutions offered by thesevendors. The following vendors were considered in the search for a solution:
• Lucent Technologies (USA)• Padtec (Brazil)• Meriton Networks (Canada)
Lucent has a standard technical solution, discussed in section 5.1, which could be derived fromthe WaveStar™ ADM 16/1 technical documentation. Padtec and Meriton Networks proposedvarious technical solutions which are discussed in sections 5.2 and 5.3 respectively. AsCOMSAT did not have a Non-Disclosure Agreement with most of the vendors mentionedabove, a high-level document, found in Appendix B, was generated to initiate interactions.
5.1 Lucent Technologies
ADM
S 160 km
~l _ j
POpy
+--------------------------~
ADM
POPX
Lucent Technologies has a standard solution for bridging "very-long distances" (up to 120 km)and "ultra-long distances" (up to 160 km). 120 km is not sufficient to eliminate an ADM at anygiven POP and bridge the neighboring POPs (see Tables 3-1 and 3-2). This solution is notconsidered for this reason. A distance of 160 km is long enough to remove at least 6 ADMs.The solution Lucent Technologies offers is schematically shown in Figure 5-1. A Booster /Pre-Amplifier is inserted in the ADMs at the neighboring POPs. This Booster / Pre-Amplifieris a circuit pack that can be placed in any of the tributary slots. Furthermore the line interfaceunits need to be changed to the type Sl-EML-U 16.2/1 because the ones currently used are notinteroperable with the Booster / Pre-Amplifier unit. There is no need to discuss or performcalculations concerning technical aspects such as attenuation, dispersion and non-linearitiessince this is a proven solution by Lucent Technologies. Management of the Booster / PreAmplifier and line interface units is obtained automatically by integrating these circuit packs inthe system. This solution is not financially feasible, although it is quite favorable concerningtechnical aspects, since the cost of it is much higher than the price of a new ADM.
Booster Pre-Am Imer inserted ADM Removed
Figure 5-1: Lucent Technologies solution for removing the ADM at the intermediate POP
J. Steinberg
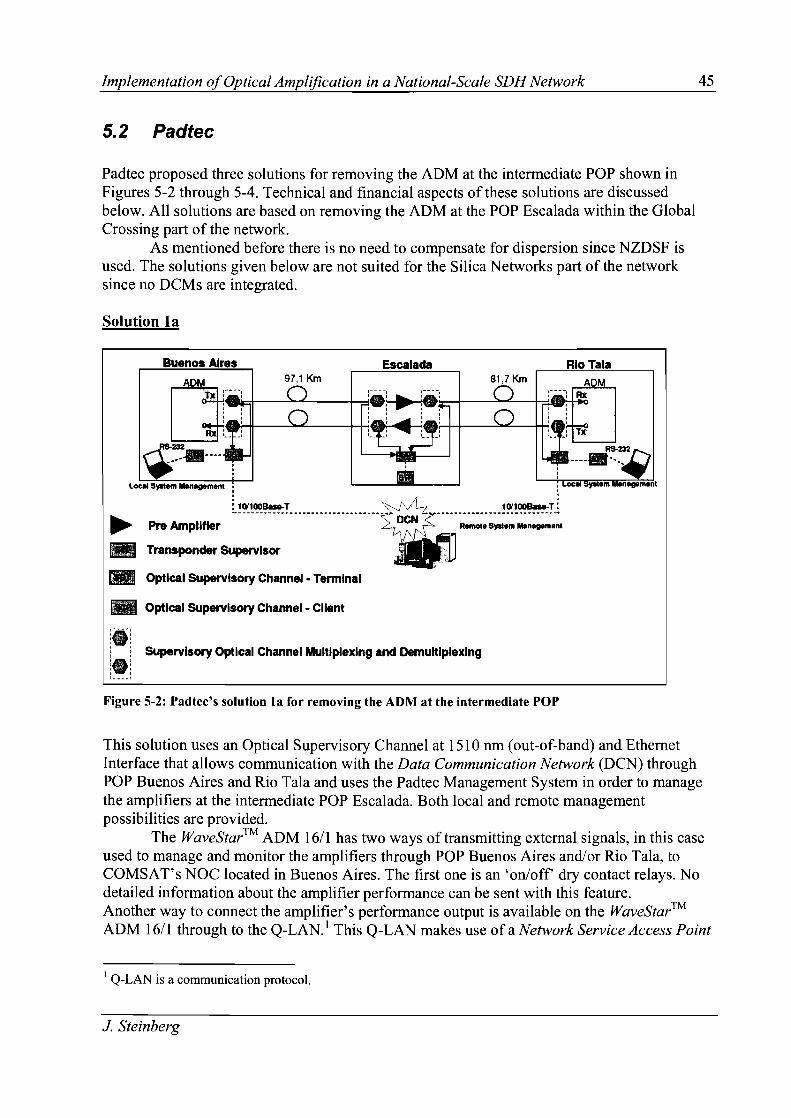
Implementation ofOptical Amplification in a National-Scale SDH Network
5.2 Padtec
Padtec proposed three solutions for removing the ADM at the intermediate POP shown inFigures 5-2 through 5-4. Technical and financial aspects of these solutions are discussedbelow. All solutions are based on removing the ADM at the POP Escalada within the GlobalCrossing part of the network.
As mentioned before there is no need to compensate for dispersion since NZDSF isused. The solutions given below are not suited for the Silica Networks part of the networksince no DCMs are integrated.
Solution la
45
Buenos Aires Escalacla Rio Tala97,1 Km
,
II
81,7Km ADM
_,-+-t---~--++~:-I-.--~:_--~
RS-232
----•....ystem ""ll"ment
:.----:, ,, ,:.:, ,1 1
Supervisory Optical Channel Multiplexing and Demultlplexlng
Figure 5-2: Padtec's solution la for removing the ADM at the intermediate POP
This solution uses an Optical Supervisory Channel at 1510 nm (out-of-band) and EthernetInterface that allows communication with the Data Communication Network (DCN) throughPOP Buenos Aires and Rio Tala and uses the Padtec Management System in order to managethe amplifiers at the intermediate POP Escalada. Both local and remote managementpossibilities are provided.
The WaveStar™ ADM 16/1 has two ways of transmitting external signals, in this caseused to manage and monitor the amplifiers through POP Buenos Aires and/or Rio Tala, toCOMSAT's NOC located in Buenos Aires. The first one is an 'on/off dry contact relays. Nodetailed information about the amplifier performance can be sent with this feature.Another way to connect the amplifier's performance output is available on the WaveStar™ADM 16/1 through to the Q-LAN. 1 This Q-LAN makes use ofa Network Service Access Point
1 Q-LAN is a communication protocol.
J. Steinberg

Implementation ofOptical Amplification in a National-Scale SDH Network 46
(NSAP) address. With this feature it is possible to both manage and monitor the amplifiers indetail from the NOC. The Padtec Management System, however, uses a fast Ethernetconnection with a TCP/IP protocol. Conversion between these two protocols is required, thusadding to cost and complexity. Padtec proposed to manage and monitor the amplifiers by usingan El connection at the ending POPs (Buenos Aires and Rio Tala). This implies using part ofthe SOH network payload for management of the amplifiers. Unfortunately there are no E1connections available within the Global Crossing part of the network since no tributary unitsare installed.
The power budget of this solution is shown in Table 5-1. Attenuation losses are basedon the information given in Table 2-3.
Distance km 97,1
+1 +1 +1 +5
27 18 18 251,5 1,5 1,5 1,5
-27,5 -14,5 -18,5 -21,5
-35 -28 -35 -28
7,5 13,5 16,5 6,5
Table 5-1: Power budget calculations for Padtec's solution La
Solution Ib
Buenos Aires
ADMTx
~ Pre Amplifier
Escalaeta97,1 Km 81,7 Km
Rio Tala
M
Tx
• SUpervisory Amplifier Channel
Figure 5-3: Padtec's solution Ib for removing the ADM at the intermediate POP
Solution Ib shown in Figure 5-3 is derived from solution la. Management of the amplifiers isnot done through the ending POPs Buenos Aires and Rio Tala since no out-of-band OpticalSupervisory Channel is implemented. A management link to the NOC is only possible through
J. Steinberg

Implementation ofOptical Amplification in a National-Scale SDH Network
the intermediate site Escalada but there are no means left to do this from within the existingSDH network since the ADM is removed. Local management is still possible.
Margins within the power budget calculations improve with 1,5 dB compared tosolution 1a (Table 5-1) since there are no mux/demux losses.
Solution 2
47
Buenos Aires
~ Pre Amplifier
~ Booster Amplifier 17 dBm
.. Amplifier SUpervisor
178,8 KmRio Tala
Figure 5-4: Padtec's solution 2 for removing the ADM at the intermediate POP
Solution 2 (Figure 5-4) features a set-up were no equipment is installed at the intermediate POPEscalada. The amplifiers are managed through the dry contact relays available on both the amplifiersand the WaveStar™ ADM 16/1. No remote management is possible with this configuration.
The power budget of this solution is shown in Table 5-2. Attenuation losses are basedon the information given in Table 2-3.
Distance [km]
SuenosAlres.. RioTala'Rio,'Tala " BtI.nos Aires
178,8 178,8
Transmission Power [dBm]Attenuation on Fiber [dB]Connection losses Escalada [dB]Power on reception [dBm]Sensitivitv [dBm]Margin [dB]
+17
452
-30-355
+17
432
-28-357
Table 5-2: Power budget calculation for Padtec's solution 2.
Launching +17 dBm into the fiber as can be seen from the power budget in Table 5-2 raises thequestion whether non-linear effects will impair transmission. A possible upgrade to WDM in thefuture makes this question even more relevant. Non-linearities have a small negative effect onthe eye-pattern as can be seen from the graphs in Figure 5-5. WDM adds to the total powerlaunched into the fiber and transmission impairment due to non-linearities will increase rapidly.
J. Steinberg
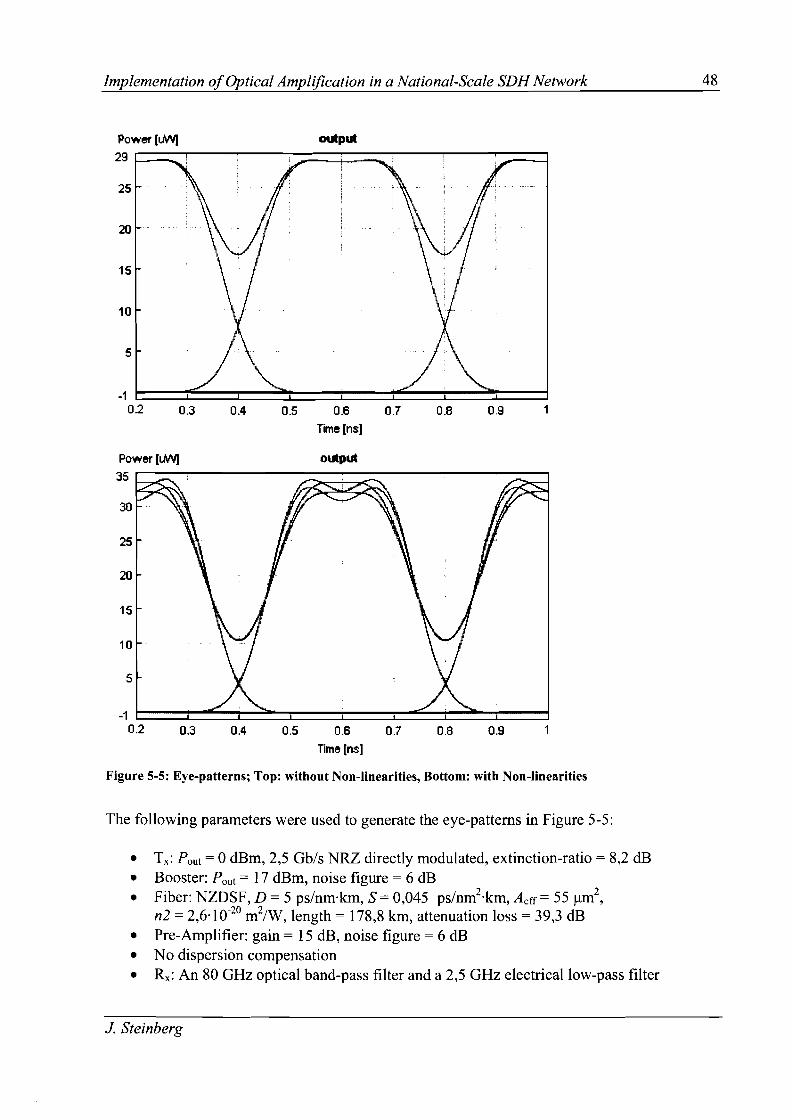
Implementation ofOptical Amplification in a National-Scale SDH Network 48
0.90.8
output
0.5 0.6 0.7
Time Ins]
0.40.3
5
20
-1 t:===:t::::::==:::I:::=~===t::==~=::::t==:::=t==::::J0.2
15
10
25
Power [u\AIJ29 1----_
Power [u\AIJ35
30
25
20
15
10
5
-10.2 0.3 0.4
output
0.5 0.6 0.7
Time [ns]
0.8 0.9
Figure 5-5: Eye-patterns; Top: without Non-linearities, Bottom: with Non-linearities
The following parameters were used to generate the eye-patterns in Figure 5-5:
• Tx: Pout = 0 dBm, 2,5 Gb/s NRZ directly modulated, extinction-ratio = 8,2 dB• Booster: Pout = 17 dBm, noise figure = 6 dB• Fiber: NZOSF, D = 5 ps/nmokm, S = 0,045 ps/nm2'km, Acff = 55 j.lm2
,
n2 = 2,6 0 10-20 m2/W, length = 178,8 km, attenuation loss = 39,3 dB• Pre-Amplifier: gain = 15 dB, noise figure = 6 dB• No dispersion compensation• Rx : An 80 GHz optical band-pass filter and a 2,5 GHz electrical low-pass filter
J. Steinberg

Implementation ojOptical Amplification in a National-Scale SDH Network
5.3 Meriton Networks
Meriton Networks proposed a solution based on the use ofNZOSF and SSMF shown inFi ures 5-6 and 5-7 res ectivel .
49
R"",an Anplifier
EOFA BoosterPmplilier
90 km22 dB
r······················~
L~ _~
IaI SMF·28 OCM 100
[§J EOFA Une Pmplmer
_I.
90 km22 dB
<J EOFA Pre·AnplWier
<J....
Figure 5-6: Meriton Networks' solution based on NZDSF
The solution for NZOSF uses both a Raman and an EOFA Pre-Amplifier at the ending POPs Xand Z. No power budget is provided but employing two amplifiers suffices to reach therequired amplification of 20 dBs (see calculations Appendix B). No equipment is installed atPOP Y and the 'loose' fiber ends at this POP are connected. No specific information on how tomanage and monitor the amplifiers is provided by Meriton Networks but the same conclusionshold as for Padtec's solution 2 in section 5.2.
The solution for SSMF shown in Figure 5-7 is identical to the NZOSF solution with theaddition of OCMs. This is in accordance with the conclusion drawn in section 3.4 that OCMsare needed when applying a solution for SSMF. Furthermore the same conclusions for thissolution hold as for the NZOSF solution in Figure 5-6.
Costs of both solutions are way over the allocated budget to make the projectfinancially feasible. In the end Meriton Networks was not able to propose a less costlyalternative.
Raman AnplWier
EOFA BoosterPmpl~ier
UIGJ_ Existing ADM
IaI SMF·28 0 CM 100
[§J EOFA une Pmplmer
<J EOFA Pre·AnplWier
<J....
POPX
~
~======:::::+=f""..··=········-~--··---)======~~lu·lIlII90km i [ 90km ~ ..
22 dB 22 dB
Figure 5-7: Meriton Networks' solution based on SSMF
J. Steinberg

Implementation 0/Optical Amplification in a National-Scale SDH Network
6 Implementation
50
ADM
Rx Txii\
!-Jo. - "~.~._. _.. ~. ······1 I···Tx Rx
POPX
This chapter deals with the implementation of a solution for removing an ADM fromCOMSAT's SDH network. The chapter is divided in three sections. First, the chosen solutionis discussed. Then, the schematic measurement setup is shown and preparations for the actualmeasurement are discussed. The last section presents measurement results.
6. 1 Implemented Solution
After evaluating the possible solutions for the removal of an ADM from the SOH network(Chapter 5) COMSAT chose to implement Padtec's solution Ib (see Figure 5-3). At thismoment, the cost of this solution is less than the price of a new ADM so this makes thereplacement of an ADM with these amplifiers financially feasible.
As explained before, this solution is only valid for NZDSF due to dispersion effects. TheEDFA supplied by Padtec is a single-stage amplifier but is also available in a dual-stageconfiguration capable of carrying a DCM, making the solution suitable for SSMF. The use of adual-stage amplifier equipped with a DCM makes it possible to remove two or more consecutiveADMs. Note that all ADMs between Buenos Aires and Mendoza could be removed as long asdispersion is properly compensated for and the required OSNR is delivered.For the rest of this chapter we will only consider the case of a single-stage amplifier and NZDSF.
As seen before, no remote management of the amplifiers is implemented. It is howeverhighly recommended to be able to distinguish between a cable cut and an amplifier failure.Figure 6-1 and 6-2 show the case of a cable cut and EDFA failure respectively.
_, ...._... , ~EM..L~"" I-".L~.,._ .. L..·~.,.' :} ;'x ~ .. _._.....:..../ ······!·········~··+····1 t···· ., K.._ -. .,... _ ..j! Tx Rxt._ _ __ J
POpy pOPz
Figure 6-1: Errors reported by the ADMs in case of a cable cut
EDFA Failure
\"-Lf.~~~........:..•::.
ADM
1=:Rx Tx
IIf-i'••······11-- ~.
Tx Rx
POPX POpy
ADM
t--Rx Tx.~ -"':11• ..... .4 _ .._,,»
Tx Rx
POPZ
Figure 6-2: Errors reported by the ADMs in case of an EDFA failure
Note that a cable cut affects (breaks or damages) all fibers within a cable and not just a singlefiber. Observe the difference between a cable cut and an EDFA failure. In case of an EDFAfailure the receiving ADM (in this case at POP X) reports errors, while in the case of a cablecut, the receivers on both ADMs (POP X and POP Z) report errors.
J. Steinberg

Implementation ~fOptical Amplification in a National-Scale SDH Network
6.2 Schematic Measurement Setup - Preparations
51
Figure 6-3 shows the schematic measurement setup. Both ADMs are installed at COMSAT'sBuenos Aires POP. (It speaks for itself that, from a logistic viewpoint, this setup is preferableover a setup in which both ADMs are located far apart.) The length of the fiber between theADMs and the Padtec amplifiers will have to be approximately 90 km to simulate the realCOMSAT network configuration. The amplifiers are managed by means of a notebookcomputer. Both ADMs are equipped with a STM-l tributary interface which has a 155,52 Mb/ssignal bit-rate. The Cross Connect multiplexes this STM-l signal to the STM-16 signal with abit-rate of 2,5 Gb/s. Both STM-l tributaries are connected to a STM-l Bit-Error-Rate Tester(BERT). Note that two redundancies can be observed. The first one involves the use of twoADMs instead of one in order to rule out any advantages that could be obtained concerningclock recovery. With the setup shown in Figure 6-3 clock recovery is done by two separateADMs which is the case in the real SDH network as well.The second redundancy involves the use of two loops where both ADMs transmit and receivesignals at the same time, thus closely simulating conditions encountered in the real network.
Iiiiii ··..·····1...~::::: .Rx
STM-1 Tributaries
Padtec EDFAs
Buenos Aires
+------------.-90 km
Figure 6-3: Schematic Measurement Setup with the Padtec EDFAs
1. Steinberg

Implementation ofOptical Amplification in a National-Scale SDH Network
6.3 Measurements
52
It is not possible to use the existing network (which is in operation 24/7) to do themeasurements. Although the network is protected from link failures (by means of a ringconfiguration) COMSAT cannot risk a link failure in the main network link while theprotection path is out of service due to measurements. I A stand-alone measurement setup, thatresembles (part) of the real network, needs to be built.
Configuration 1
COMSAT borrowed four dark fibers running from Buenos Aires to Escalada from GlobalCrossing. The corresponding measurement setup is shown in Figure 6-4. The distance betweenBuenos Aires and Escalada is approximately 123 km. Note that this value differs from thevalue given in Table 2-1. This is due to the fact that Global Crossing's node in Buenos Aires,named Chacarita, is not the same node as COMSAT's Buenos Aires POP, named Wilde. Thedistance to cover between these two nodes is approximately 26 km so that two loops can be setup going from ADM #1 to ADM #2 via Escalada and viceversa.
•' "-'::::::. ·..······1..........Rx
Buenos Aires
STM·1 Tributaries
~..
Escalada
..------------~-123 km
Padtec EDFAs
Figure 6-4: Measurement setup with the Wilde - Chacarita - Escalada link
The longest distance between two POPs for the Global Crossing part of the network is shorterthan 100 km. (see Table 2-1). The 123-km link between the ADMs and the amplifiers, with itscorresponding high attenuation, may lead to an unacceptable BER performance.
I Service Level Agreements require COMSAT to have their clients up and running> 99,98% of the time.
J. Steinberg

Implementation ofOptical Amplification in a National-Scale SDH Network 53
Figure 6-5 shows the Optical Time-Domain R~flectometer(OTDR) trace measurement for oneof the four fibers running from Buenos Aires to Escalada. The first peak occurring at 0 km isdue to connector reflections. At approximately 9 km a small drop can be observed and is due toa bad fusion splice. At a distance of26 km a small peak is also observed on account ofODFconnections made at the POP Chacarita. The high peak at 123 km indicates the end of the trace.The small ripple before this peak is due to insufficient OTDR power.
Attenuation losses account for a 32 dB drop in signal power, way over the 27 dB lossassumed in the power budget of Table 5-1. However, since Lucent ADMs launch +1 dBmsignal power, the amplifier input power is approximately -31 dBm, which is within thesensitivity of -35 dBm specified by the vendor.
~
""'" ..,J
........~~
~, I...... ....... I
~-o 10 20 30 40 50 60 70 80 90 100110120130140150
Distance [km]
Figure 6-5: OTDR trace for the Wilde - Chacarita - Escalada link
Implementing this setup resulted in a frame loss reported by the STM-l BERTs. Even boostingthe amplifiers to a +8 dBm power output, and with that a power input to the receiving ADMsof -24 dBm, did not result in an acceptable BER performance. Since both the amplifier inputpower (-31 dBm) and the ADM receiver power (-24 dBm) were well above the specifiedminimum input value of -35 dBm and -28 dBm respectively, attenuation losses are not thecause of the link failure. Figure 6-6 shows the measured spectrum of the optical signal at theADM receiver input. An OSNR of over 20 dB is measured. We observed that by increasing theOSNR to 22 dB the link operated successfully. This measurement was performed byconnecting the ADMs to the amplifiers with patchcords and variable optical attenuators. This22 dB OSNR limit can only be reached with an input power to the amplifiers of at least-28 dBm. Below this power level the noise performance of these amplifiers deterioratesrapidly. Solving Eq. 4.2 for the noise figure NF gives
(6-1)
Using POUI = 6 dBm, OSNR = 22 dB, Lspan = 32 dB and Namp = 1 results in a noise figureNF = 10 dB for the Padtec amplifiers at -28 dBm input power. Note that this 22 dB OSNRlimit lies well above the value found in literature and calculated in section 3.3 (Figure 3-2).The reason for this is that the Lucent line interface units are not equipped with an optical filterat the receiver input.
J. Steinberg
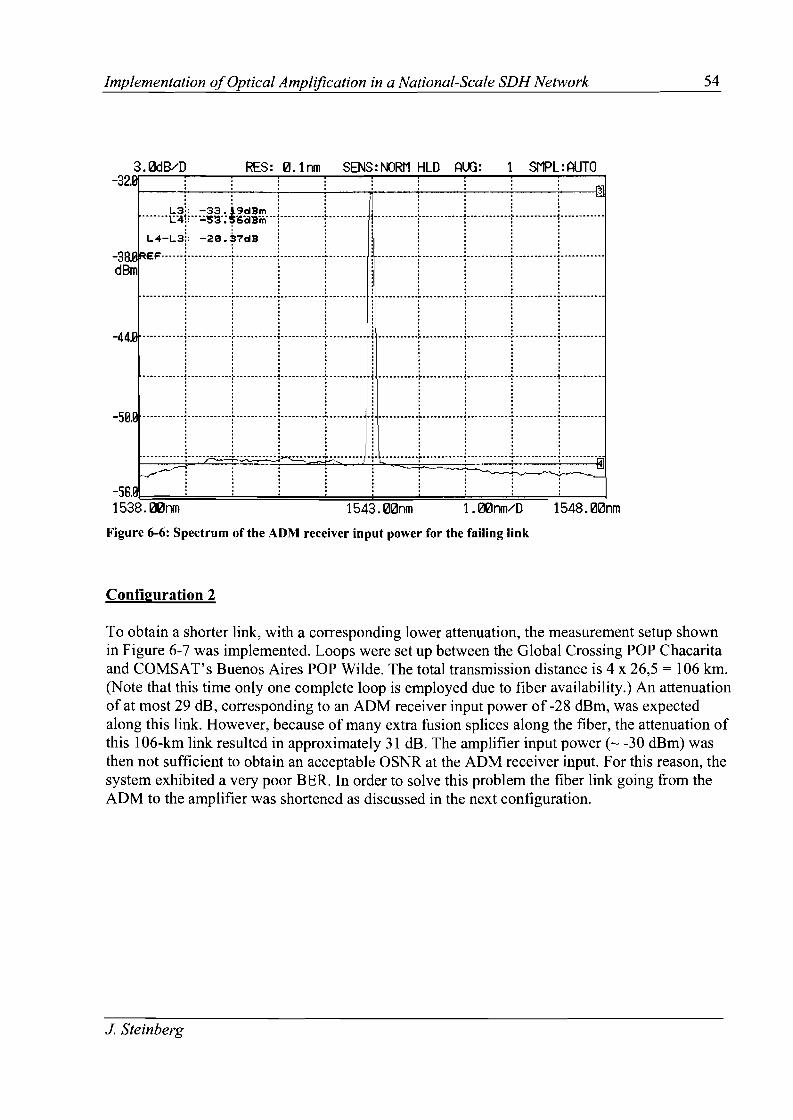
Implementation ofOptical Amplification in a National-Scale SDH Network
: : : : ~ : : : : ~
.......t~1~··:~§·;~~~~~···1············r··········Jj··········+·········+········+··········1············L4-L3~: -ce.r7dB! ! ~ ! ! ! !
-38.Q ~EF······:············~···········:·······.···-:-······· t···········~···········:············~···········:···· .
d~ ' f ! 1 i t j r ! .-44.Q ···········!···········r·········!··········--:-········· ··········"[···········1··········--:-··········1········· .
-59R ···:::·:··r··:·::::r:.:·.···r··:::.I::...:··,.i 1:::·:::..[·::····1"·······:]::::···:r:::..::::: : : : I: : : : :
........~j ,~~~::.::.:-::~~~~~ ..::;;f:v~_·····~·:·l··.::;;~~-==:=······ ..: : Bj~" . . . . . . .~-_ '-~~ .~~---
-56.~ ! i ~ ~ ! ! ! !- i1538. 00nm 1543. 00nm 1.00nm/D 1548. 00nm
Figure 6-6: Spectrum of the ADM receiver input power for the failing link
Configuration 2
54
To obtain a shorter link, with a corresponding lower attenuation, the measurement setup shownin Figure 6-7 was implemented. Loops were set up between the Global Crossing POP Chacaritaand COMSAT's Buenos Aires POP Wilde. The total transmission distance is 4 x 26,5 = 106 km.(Note that this time only one complete loop is employed due to fiber availability.) An attenuationof at most 29 dB, corresponding to an ADM receiver input power of -28 dBm, was expectedalong this link. However, because of many extra fusion splices along the fiber, the attenuation ofthis 106-km link resulted in approximately 31 dB. The amplifier input power (~ -30 dBm) wasthen not sufficient to obtain an acceptable OSNR at the ADM receiver input. For this reason, thesystem exhibited a very poor BER. In order to solve this problem the fiber link going from theADM to the amplifier was shortened as discussed in the next configuration.
J. Steinberg

Implementation ofOptical Amplification in a National-Scale SDH Network 55
SOH BER Test STM·1 PadtecEOFA
Buenos Aires
+-----------.-26km
Chacarita
Figure 6-7: Measurement setup with the Wilde - Chacarita 4 x -26 km loops
Configuration 3
Figure 6-8 shows the measurement setup used in configuration 3. One of the fibers runningfrom COMSAT's Buenos Aires POP Wilde to Global Crossing's POP Chacarita is looped backbefore reaching the POP Chacarita. This way a transmission distance of 2 x 20,5 + 2 x 26,5 =
94 km is achieved. Fiber loops going from the amplifier to the ADM are not changed.
SOH BER Test STM-1 PadtecEOFA Loo at Rivadavia
ADM #1
·····IT...-r--X
~••• • I r--••••• R
........ x" ~....
,, "" "1M~:...... :J-~~~~
Rx
Buenos Aires .-----------.-26km
Chacarita
Figure 6-8: Measurement setup with the 2 x 20 + 2 x 26 and the 4 x 26 km loops
J. Steinberg
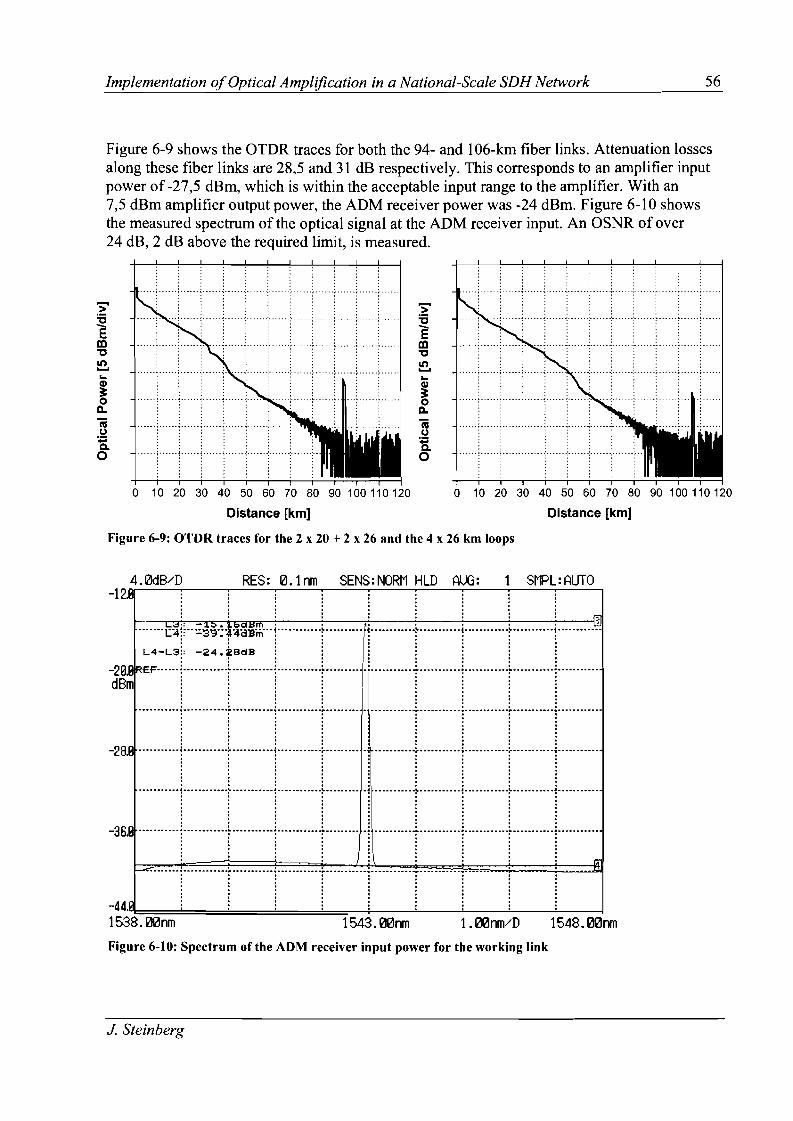
Implementation ofOptical Amplification in a National-Scale SDH Network 56
Figure 6-9 shows the OTDR traces for both the 94- and 106-km fiber links. Attenuation lossesalong these fiber links are 28,5 and 31 dB respectively. This corresponds to an amplifier inputpower of -27,5 dBm, which is within the acceptable input range to the amplifier. With an7,5 dBm amplifier output power, the ADM receiver power was -24 dBm. Figure 6-10 showsthe measured spectrum of the optical signal at the ADM receiver input. An OSNR of over24 dB, 2 dB above the required limit, is measured.
, . .··-··r··-···r·-····.-··-··, . ., . .
-----;._-_ ;--_._--; ;-
... .; ; : .
, . .••••• J •••••• ~ •••••• ,' •• _., . .
.. -.-.i i ~ ~ : : ; : ... ... ... .
· .· .· . .· ' ... -. - -: :' ~. ... ~ ;' ;". " .-';"' ";- "; ': . - ':· .. .· ., .· . ,. . .: ::::: : :. ; j -.~ "1" "; ~ ~ ';" r r r .
· ., .., .. "... ..,.. .._. -_. ~- _.. _. ~ -;- _ ; ----;-- -.. -.~- ---._~ .. - -~ - ... .. ,· .., ..· .· .· .-. --. ~ -- ~ : :. .-.., , .
o 10 20 30 40 50 60 70 80 90 100 110 120
Distance [km]
'>:cEa:I1JIn........~D-
iUCJ:s.a
_ -- -. ~- ~ '; ,,:. -- --.: ; ~ ~ ~ _. _. _.:: :.. .:: :
o 10 20 30 40 50 60 70 80 90 100 110 120
Distance [km]
-j- .. ; : ,"' ;......•.......:.......•.................... : .; : :· .· .· .· .· ,-f"'"'' , ; ;.", : : :. -- : : , ; .
: ' : : ' : ... ... ... .., .· .
Figure 6-9: OTDR traces for the 2 x 20 + 2 x 26 and the 4 x 26 km loops
4.0dB/D RES: 0.1nm SENS:NORM HLD AUG: 1 SMPL:AUTO-12.1l . . . . . . . . .
·······t~i~··~§~·:~~~{;~··+-········+·········f~············~···········i············~···········i··········~·
-20.~~~;.~~~L~~~.~!~~~ L L ..I.L. L L L L .d~··········'·····T·..······T·· l........ . ..L..... .L. '... .
-2~·······j·········f·····r·····t······ r·····)···········l········:·····,·······
-36] :·::::.:J ..:.:::r::·:::::I:.:.:::::r:::Jr::·····:I.:...:.I:·::::·-r·······::r:·:·::··:.--: ._ : I :1, : : : : m
-44' ~········:······[··········"]""·······T········T····T······"]""····1 ~
1538. OOnm 1543. OOrvn 1. OOnm/D 1548. OOrvnFigure 6-10: Spectrum of the ADM receiver input power for the working link
J Steinberg
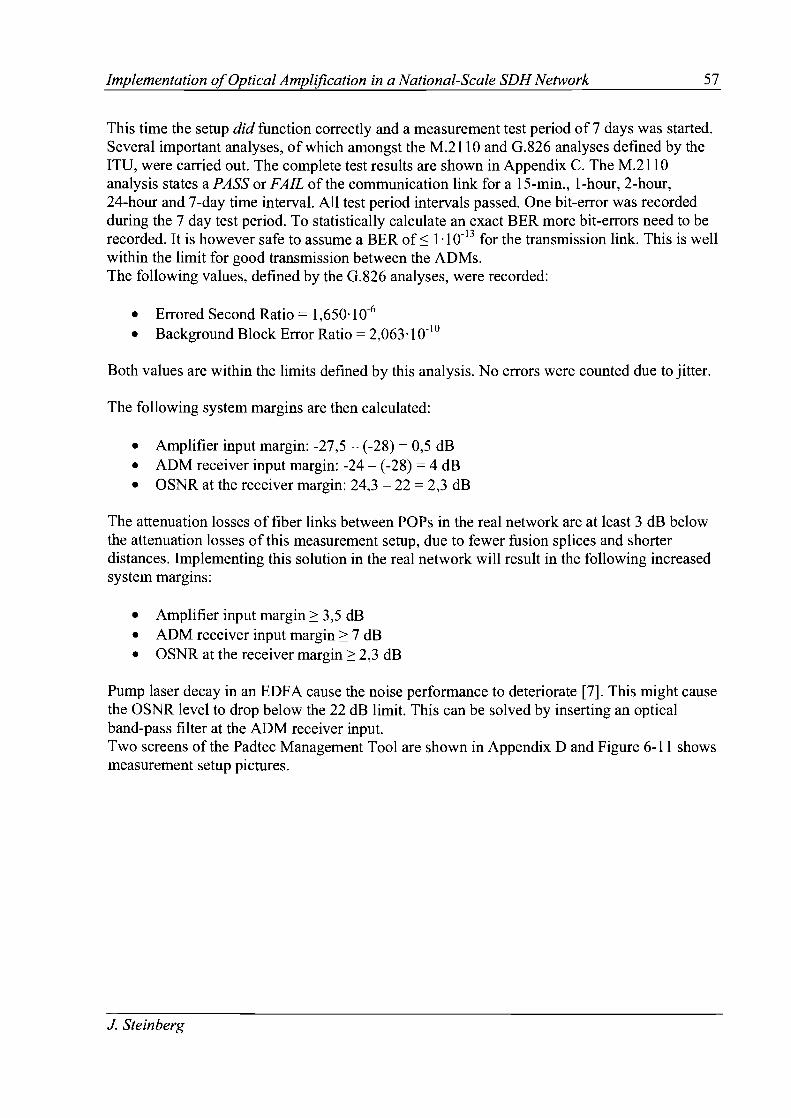
Implementation ofOptical Amplification in a National-Scale SDH Network 57
This time the setup did function correctly and a measurement test period of 7 days was started.Several important analyses, of which amongst the M.2110 and G.826 analyses defined by thelTV, were carried out. The complete test results are shown in Appendix C. The M.211 0analysis states a PASS or FAIL of the communication link for a IS-min., l-hour, 2-hour,24-hour and 7-day time interval. All test period intervals passed. One bit-error was recordedduring the 7 day test period. To statistically calculate an exact BER more bit-errors need to berecorded. It is however safe to assume a BER of::; 1.10- 13 for the transmission link. This is wellwithin the limit for good transmission between the ADMs.The following values, defined by the G.826 analyses, were recorded:
• Errored Second Ratio = 1,650'10-6
• Background Block Error Ratio = 2,063'10-10
Both values are within the limits defined by this analysis. No errors were counted due to jitter.
The following system margins are then calculated:
• Amplifier input margin: -27,5 - (-28) = 0,5 dB• ADM receiver input margin: -24 - (-28) = 4 dB• OSNR at the receiver margin: 24,3 - 22 = 2,3 dB
The attenuation losses of fiber links between POPs in the real network are at least 3 dB belowthe attenuation losses of this measurement setup, due to fewer fusion splices and shorterdistances. Implementing this solution in the real network will result in the following increasedsystem margins:
• Amplifier input margin 2: 3,5 dB• ADM receiver input margin 2: 7 dB• OSNR at the receiver margin 2: 2,3 dB
Pump laser decay in an EDFA cause the noise performance to deteriorate [7]. This might causethe OSNR level to drop below the 22 dB limit. This can be solved by inserting an opticalband-pass filter at the ADM receiver input.Two screens of the Padtec Management Tool are shown in Appendix D and Figure 6-11 showsmeasurement setup pictures.
J. Steinberg

Implementation ofOptical Amplification in a National-Scale SDH Network 58
Figure 6-11: Measurement setup
J. Steinberg

Implementation ofOptical Amplification in a National-Scale SDH Network
7 Future Capacity Upgrades
59
COMSAT SDH network, after the construction in 2000, reached an occupation ofapproximately 27 % by the end of2005. Lots of clients can still be added to the network beforeit starts to saturate. At this moment there is no need to start thinking about capacity upgrades.However, it is of importance to know to what extent the amplifiers, as being used in themeasurement setup of chapter 6, are compliant with eventual future capacity upgrades. Thischapter discusses two possible future capacity upgrades. The first one involves upgrading toWDM of four 2,5-0b/s wavelength channels. The second one involves changing the network toone single 10-Ob/s wavelength channel.
7.1 WDM of four 2,5-Gb/s wavelength channels
WDM involves adding more wavelength channels to the already existing single channelnetwork. Changing from one to four channels involves a + 6 dB power output requirement forthe amplifiers. A power output of the amplifiers of at most +3 dBm for each wavelengthchannel is sufficient to obtain an acceptable BER since this is equal to the highest line interfacepower output of the network at present (see Table 2-3). For this reason the amplifier needs tobe capable of a total power output of +9 dBm. This is no problem for the amplifiers but itshould be noted that care has to be taken since the maximum power output of the amplifiersdepends on the input power. Calculations and simulations should be done to provefunctionality.
A network upgrade to a single 10-Ob/s wavelength channel is cheaper than the upgradeto a four channeI2,5-0b/s WDM system because oflower equipment cost. Moreover,equipment for the 2,5-0b/s WDM variant may not be available anymore in the future.
7.2 Single 10-Gb/s wavelength channel
All the calculations in this report are based on a single wavelength channel at 2,5 Obis.Upgrading to a 10-Ob/s single wavelength system requires new dispersion calculations sincedispersion goes with the square of the bit-rate. Also, new simulations for non-linear effects haveto be made. There is no need to perform new calculations for the attenuation since they are notbit-rate depended. Moreover, the amplifiers are compliant to a 10 Obis bit-rate. Increasing thebit-rate from 2,5 Obis to 10 Obis causes the maximum propagation distance, dispersion-wise, todrop to 111 6th of its original value. A new calculation for the maximum propagation distancelength based on the maximum allowed dispersion by the 10 Obis line interface units can be done.It is expected that this maximum propagation distance will not be long enough for the COMSATSDH network. The use of DCMs is then required. The amplifiers, as mentioned in section 6.1,are available in a single- and a dual-stage version. The dual-stage version can be equipped with aDCM and is recommended, although it has a higher cost, if future plans to upgrade to a 10-Ob/ssingle wavelength channel are within the possibilities. Calculations and simulations should bedone to prove functionality.
J. Steinberg
Implementation ofOptical Amplification in a National-Scale SDH Network
8 Conclusions
60
In this report we came up with a solution for the network changes that COMSAT wanted toimplement. Most ADMs in COMSAT's national-scale SOH network are not used to their fullextent. They do not add and/or drop traffic and only have a 3R regeneration function while lRregeneration would suffice. These ADMs are costly devices which could be used inCOMSAT' s metropolitan networks were signals do need to be added and/or dropped. Theassignment was to find a solution for removing an ADM from the national-scale SOH networkand keep the network operative. The removed ADMs can then be deployed in the metropolitanSOH networks.
We proved the functionality and financial feasibility of inserting two Padtec EDFAs atthe POP where the ADM is removed. This solution was measured with a test setup usingNZDSF. Note that DCMs need to be inserted in the link if the solution is used for SSMF. Thesolution has no infrastructure for remote management implemented to cut cost, but a firstdistinction between a cable cut and an amplifier failure is still possible. Cost of the solution isthe most important factor. Any given solution needs to be cheaper than buying a new ADM tomake it financially feasible. Cost calculations have to be made every time the implementationof the solution is considered.While testing the measurement setup based on Padtec's solution the following limits weremeasured:
• Amplifier input power 2: -28 dBm• ADM input power 2: -28 dBm• OSNR at the ADM receiver 2: 22 dB
The difference in OSNR requirement at the ADM receiver with the value of 13,5 dB calculatedin Chapter four is explained by the lack of an optical filter at the ADM receiver input.The following parameters of the operational measurement setup were recorded:
• ADM output power = +1 dBm• ADM -7 Amplifier attenuation (over 94 km) = 28,5 dB• Amplifier input power = -27,5 dBm• Amplifier output power = +7,6 dBm• Amplifier -7 ADM attenuation (over 106 km) = 31 dB• ADM input power = -24 dBm• OSNR at the ADM receiver = 24,3 dB
The ITU M.211 0 analysis resulted in a link PASS for a IS-min, I-hour, 2-hour, 24-hour and7-day test time interval. One single bit-error was recorded during this 7-day test. It is then safeto assume a BER of < 1'10-13
• The ITU G.826 analysis gave the following results:
• Errored Second Ratio = 1,650'10-6
• Background Block Error Ratio = 2,063'10- 10
J. Steinberg

Implementation ofOptical Amplification in a National-Scale SDH Network 61
Both values are within the limits defined by this analysis. No errors were counted due to jitter.The following system margins for the test setup were calculated:
• Amplifier input margin: -27,5 - (-28) = 0,5 dB• ADM receiver input margin: -24 - (-28) = 4 dB• OSNR at the receiver margin: 24,3 - 22 = 2,3 dB
Due to lower attenuation levels these margins will increase when the solution is implementedin the real SDH network. The OSNR at the ADM receiver will decrease in time due to EDFApump laser decay. If it drops below the limit of 22 dB the insertion of an optical filter rightbefore the ADM receiver will resolve this problem.
The amplifiers used in the proposed solution are compatible to eventual future networkcapacity upgrades to WDM of four 2,5-Gb/s wavelength channels or a single 10-Gb/swavelength channel. Solution adjustments however, like the insertion of DCMs, are required.Calculations for attenuation, dispersion and non-linear effects need to be done to provefunctionality.
J. Steinberg

Implementation ofOptical Amplification in a National-Scale SDH Network
9 Conclusiones en Castellano
62
En este infonne presentamos una soluci6n para los cambios de red que COMSAT quiso poneren pnictica. La mayoria de los ADMs de la red SDH a escala nacional de COMSAT no se usaen su totalidad. Estos ADMs no suben y/o bajan tnifico y solamente tiene una funci6n deregeneraci6n 3R, cuando bastaria utilizar regeneraci6n lR. Los ADMs son equipos caros quepodrian ser usados en las redes metropolitanas de COMSAT donde la demanda de subir y bajarsenales es mayor. El trabajo consisti6 en encontrar una soluci6n para sacar un ADM de la redescala nacional y mantenerla operativa. Estos ADMs pueden ser luego empleados en las redesSDH metropolitanas.
Demostramos la funcionalidad y factibilidad financiera de insertar dos EDFAs Padtecen el POP donde se reemplazaba un ADM. Esta soluci6n fue evaluada con un sistema deprueba que usa NZDSF. N6tese que hay que insertar DCMs en la red si la soluci6n esimplementada en SSMF. Para bajar el precio de la soluci6n, la misma no ofrece la posibilidadde gesti6n remota. Una primera distinci6n entre un corte de cable y un problema delamplificador todavia es posible. El costa de la soluci6n es el factor mas importante. Cualquiersoluci6n tiene que ser mas barata que la compra de un nuevo ADM para hacerloecon6micamente factible. Hay que hacer calculos de costa cada vez que se considereimplementar una soluci6n 6ptica. Como resultado de las medidas utilizando la soluci6n dePadtec se encontraron las siguientes reglas de ingenieria:
• Potencia de entrada al amplificador ~ -28 dBm• Potencia de entrada al ADM ~ -28 dBm• Relaci6n senal/ruido en la entrada del ADM ~ 22 dB
La diferencia en el requerimiento de la relaci6n sefial/ruido a la entrada del ADM y el valor de13,5 dB, calculado en el Capitulo Cuatro, se explica por la falta de un filtro 6ptico en elreceptor del ADM. Se obtuvieron los siguientes parametros del sistema de medida:
• Potencia de salida del ADM = +1 dBm• Atenuaci6n entre el ADM y el amplificador (> 94 KIn) = 28,5 dB• Potencia de entrada al amplificador = -27,5 dBm• Potencia de salida del amplificador = +7,6 dBm• Atenuaci6n entre el amplificador y el ADM (> 106 Km) = 31 dB• Potencia de entrada al ADM = -24 dBm• Relaci6n senal/ruido en el receptor del ADM = 24,3 dB
El ancilisis de M.2ll 0 de la ITU result6 exitoso en un intervalo de tiempo de 15 minutos,1 hora, 2 horas, 24 horas y de 7 dias de prueba. S6lo se registr6 un error durante la prueba de 7dias. De esta fonna, la tasa de error de bits es menor a 1.10-13
• El analisis de G.826 de la ITUprodujo los siguientes resultados:
• Errored Second Ratio = 1,650'10-6
• Background Block Error Ratio = 2,063'10- 10
J Steinberg

Implementation ofOptical Amplification in a National-Scale SDH Network 63
Ambos valores estan dentro de los limites definidos por este analisis. Ningun error fue debidoal 'jitter'.Se calcularon los siguientes margenes para el sistema:
• EI margen de potencia a la entrada del amplificador: -27,5 - (-28) = 0,5 dB• EI margen de potencia a la entrada del ADM: -24 - (-28) = 4 dB• El margen de relaci6n seiiallruido en el receptor: 24,3 - 22 = 2,3 dB
Se espera que estos margenes aumenten cuando la soluci6n sea utilizada en la red de SOH"real" debido a los niveles de atenuaci6n mas bajos. La relaci6n seiiallruido en el receptor delADM empeorara con el tiempo debido al decaimiento del laser de bombeo del EDFA. Si larelaci6n seiiallruido cae debajo del limite de 22 dB hay que insertar un filtro 6ptico justa antesel receptor del ADM para resolver este problema.
Los amplificadores usados en la soluci6n propuesta son compatibles con futurasexpansiones de la capacidad de la red a WDM de 4 x 2,5-Gb/s canales 0 a I x 10-Gb/s canal.Sin embargo, en este ultimo caso, la soluci6n requiere ajustes, como la inserci6n de DCMs.Calculos de atenuaci6n, dispersi6n y efectos no lineales deberan ser llevados a cabo parademostrar la funcionalidad.
J. Steinberg

Implementation ofOptical Ampl!fication in a National-Scale SDH Network
List of Figures and Tables
64
Figure 1: SDH optical ring network operated by COMSAT in Argentina 5Figure 1-1: The DS-l frame structure 12Figure 1-2: Multiplexing 12 STS-ls to form a single STS-12 15Figure 1-3: The SONET STS-l (and STM-O) frame structure 16Figure 1-4: Structure ofSONET/SDH frames (not to scale) 18Figure 1-5: Major SONET/SDH components 20Figure 1-6: A simple SONET/SDH ring 21Figure 2-1: Schematic view of SDH network operated by COMSAT in Argentina 23Figure 2-2: Schematic view of two connected POPs 25Figure 2-3: Frontview ofa WaveStar™ ADM 16/1 subrack 27Figure 2-4: A schematical view of the WaveStar™ ADM 16/1 29Figure 2-5: A schematical view ofa STM-16 frame split up in several VCs 30Figure 3-1: ODFs connected at the POP where the ADM is removed 33Figure 3-2: BER vs OSNR for varying Er • B = 2,5 Gb/s 37Figure 3-3: Broadening of a pulse upon dispersive propagation in an optical fiber.. 37Figure 3-4: BER vs OSNR. B = 2,5 Gb/s, C = -6 and Er = 8,2 dB. 38Figure 4-1: In-line EDFA amplification at POP where the ADM is removed 39Figure 4-2: Booster EDFA amplification at neighboring POPs 40Figure 4-3: Raman amplification at neighboring POPs 41Figure 4-4: SRS transfers optical power from a shorter to a longer wavelength 42Figure 5-1: Lucent Technologies solution for removing the ADM at the intermediate POP 44Figure 5-2: Padtec's solution la for removing the ADM at the intermediate POP 45Figure 5-3: Padtec' s solution 1b for removing the ADM at the intermediate POP 46Figure 5-4: Padtec's solution 2 for removing the ADM at the intermediate POP 47Figure 5-5: Eye-patterns; Top: without Non-linearities, Bottom: with Non-linearities 48Figure 5-6: Meriton Networks' solution based on NZDSF 49Figure 5-7: Meriton Networks' solution based on SSMF 49Figure 6-1: Errors reported by the ADMs in case of a cable cut.. 50Figure 6-2: Errors reported by the ADMs in case of an EDFA failure 50Figure 6-3: Schematic Measurement Setup with the Padtec EDFAs 51Figure 6-4: Measurement setup with the Wilde - Chacarita - Escalada link 52Figure 6-5: OTDR trace for the Wilde - Chacarita - Escalada link 53Figure 6-6: Spectrum of the ADM receiver input power for the failing link 54Figure 6-7: Measurement setup with the Wilde - Chacarita 4 x ~26 km loops 55Figure 6-8: Measurement setup with the 2 x 20 + 2 x 26 and the 4 x 26 km loops 55Figure 6-9: OTDR traces for the 2 x 20 + 2 x 26 and the 4 x 26 km loops 56Figure 6-10: Spectrum of the ADM receiver input power for the working link 56Figure 6-11: Measurement setup 58Figure 1: An In-line Optical Amplifier inserted where the ADM is taken out. 74Figure 2: Booster 1Pre-Amplifier inserted just before the ADMs of neighboring POPs 75
J. Steinberg

Implementation ofOptical Amplification in a National-Scale SDH Network 65
Table 1-1: SONET/SDH digital hierarchy 13Table 2-1: The length of a fiber trace between two consecutive POPs 24Table 2-2: G.652 and G.655 lTV compliant fiber specifications 24Table 2-3: ADM receiver and transmitter power levels 26Table 2-4: Specifications ofSTM-16 SI-L 16.2 and STM-16 SI-L 16.3 28Table 2-5: Proportion between various VCs 30Table 2-6: Assignment of a VC to the various signals 30Table 2-7: Total number of VCs used in the national SDH ring network 32Table 3-1: Distances and add/drop of signal(s) for the Silica Networks POPs 34Table 3-2: Distances and add/drop of signal(s) for the Global Crossing pOPs 34Table 3-3: Worst-case (180 km) attenuation calculations for the SN and GC fiber trace 35Table 5-1: Power budget calculations for Padtec's solution 1a 46Table 5-2: Power budget calculation for Padtec's solution 2 47
J. Steinberg
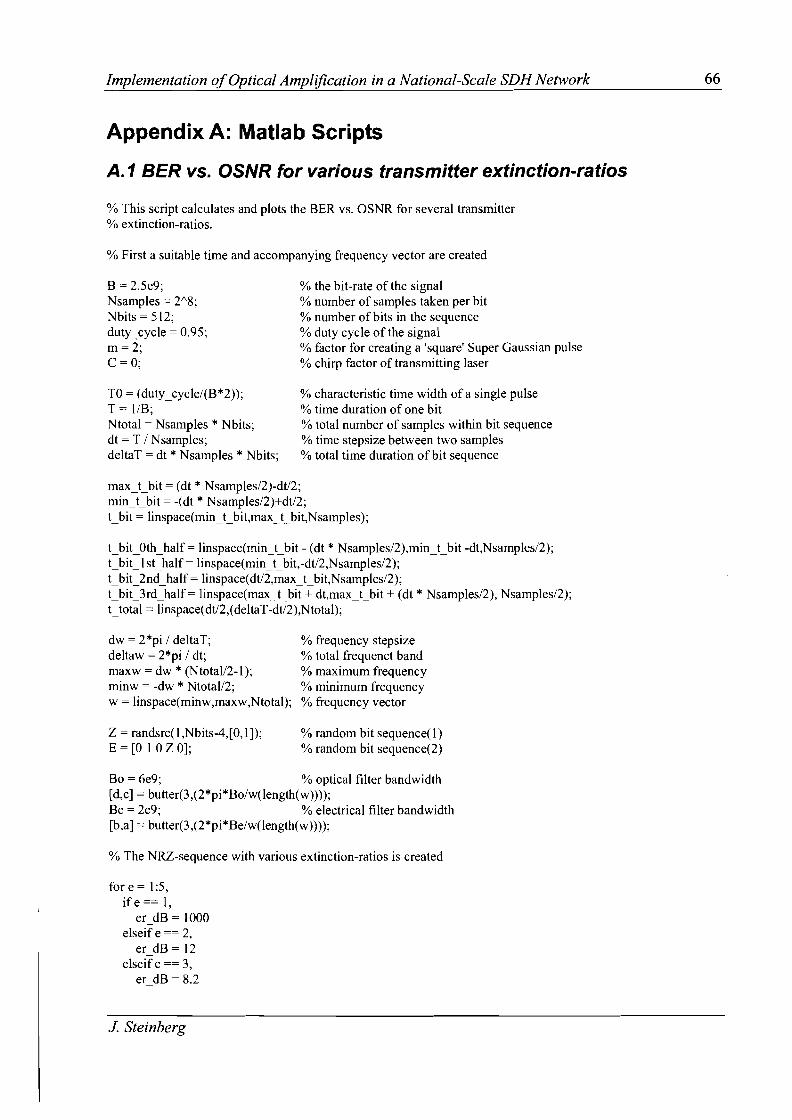
Implementation ofOptical Amplification in a National-Scale SDH Network
Appendix A: Matlab Scripts
A.1 BER vs. OSNR for various transmitter extinction-ratios
% This script calculates and plots the BER vs. OSNR for several transmitter% extinction-ratios.
% First a suitable time and accompanying frequency vector are created
66
B = 2.5e9;Nsamples = 21\8;Nbits = 512;duty_cycle = 0.95;m=2;C=O;
TO = (duty_cycle/(B*2));T = I/B;Ntotal = Nsamples * Nbits;dt = T / Nsamples;deltaT = dt * Nsamples * Nbits;
% the bit-rate of the signal% number of samples taken per bit% number of bits in the sequence% duty cycle of the signal% factor for creating a 'square' Super Gaussian pulse% chirp factor of transmitting laser
% characteristic time width of a single pulse% time duration of one bit% total number of samples within bit sequence% time stepsize between two samples% total time duration of bit sequence
max_t_bit = (dt * Nsamples/2)-dt/2;min_t_bit = -edt * Nsamples/2)+dt/2;t_bit = linspace(min_t_bit,max_t_bit,Nsamples);
t_bit_Oth_half= linspace(min_t_bit - (dt * Nsamples/2),min_t_bit -dt,Nsamples/2);t_bit_1 st_half = linspace(min_t_bit,-dt/2,Nsamples/2);t_bit_2nd_half= linspace(dt/2,max_t_bit,Nsamples/2);t_bit_3rd_half= linspace(max_t_bit + dt,max_t_bit + (dt * Nsamples/2), Nsamples/2);t_total = linspace(dt/2,(deltaT-dt/2),Ntotal);
dw = 2*pi / deltaT;deltaw = 2*pi / dt;maxw = dw * (NtotaI/2-1);minw = -dw * Ntotal/2;w = linspace(minw,maxw,Ntota1);
Z = randsrc(l ,Nbits-4,[0, I]);E = [0 I 0 Z 0];
% frequency stepsize% total frequenct band% maximum frequency% minimum frequency% frequency vector
% random bit sequence( I)% random bit sequence(2)
Bo = 6e9; % optical filter bandwidth[d,c] = butter(3,(2*pi*Bo/w(1ength(w))));Be = 2e9; % electrical filter bandwidth[b,a] = butter(3,(2*pi*Be/w(1ength(w))));
% The NRZ-sequence with various extinction-ratios is created
for e = 1:5,if e == I,
er dB = 1000elseif e == 2,
er dB = 12elseif e == 3,
er dB = 8.2
J. Steinberg

Implementation ofOptical Amplffication in a National-Scale SDH Network
end
67
eUin = lW'(er_dB/lO)eUin_h = sqrt(eUin)
% extinction-ratio transmitter linear% h-field multiplication factor due to extinction-ratio
h_low = lIer_lin_h;h_high = lIer_lin_h + (l-lIerJin_h).*exp(-«(l+i*C)/2).*«-dt/2.1TO)."(2*m»);hJise = lIer_lin_h + (l-lierJin_h).*exp(-«(l+i*C)/2). *«t_bit_Ist_half./TO)."(2*m)));hjall = lIer_lin_h + (l-l/er_lin_h).*exp(-«(l +i*C)/2).*«t_bit_2nd_half./TO)."(2*m)));h_low_afterjall = lIer_lin_h + (l-l/er_lin_h). *exp(-« 1+i*C)/2).*«t_bit_3rd_half./TO)."(2*m)));hJise_after_low = lIeUin_h + (l-lIeUin_h).*exp(-((l +i*C)/2).*«t_bit_Oth_half./TO)."(2*m)));
for f= 1:Nbits,if E(f) == 0,
q = [(f-l)*Nsamples + l:l:Nsamples*fJ;h(q) = hJow;
elseif E(f) == 1,CLl st_half = [(f-l)*Nsamples+ 1: 1:(f-l)*Nsamples+Nsamples/2];iff> 1,
CLOth_half = CLIst_half - Nsamples/2;h(CLOth_half) = h_rise_after_low;
endh(CLlst_half) = hJise;break
endend
for p=f:(Nbits-l),CLminus_half = [p*Nsamples-(Nsamples/2-1): 1:p*Nsamples];CLPlus_half= CLminus_half + Nsamples/2;if E(p) == 0 && E(p+ 1) == 0,
h(CLPlus_half) = h_low;h(CLminus_half) = h_low;
elseif E(p) == 0 && E(p+ 1) == 1,h(CLPlus_half) = hJise;h(CLminus_half) = hJise_afterJow;
elseif E(p) == 1 && E(p+ 1) == 0,h(CLPlus_half) = hJow_afterjall;h(CLminus_half) = h_fall;
elseif E(p) == 1 && E(p+ 1) == 1,h(CLPlus_half) = h_high;h(CLminus_half) = h_high;
endend
einde = [Nsamples*Nbits-(Nsamples/2 -1): 1:Nsamples*Nbits];ifE(Nbits) == 0,
h(einde) = hJow;elseif E(Nbi ts) == 1,
h(einde) = hjall;end
figure(e);plot(Uotal,h);hold on;plot(t_total,(h."2), 'r');
J Steinberg
Implementation ofOptical Amplification in a National-Scale SDH Network
axis([O lOe-9 0 1.2]);
% Noise is added and the minimum BER is calculated
hyower = (abs(h)).1\2;signa1yower = sum(hyower);
for k = 1:50,
SNR = 9.0 + k*0.2;SignaUo_noise_ratio(k,e) = SNR-3;Res_bandwidthj= 12.5e9;Res_bandwidth_w = 2*pi*Res_bandwidthj;Pn = signa1yower/(lOI\(SNR/lO));delta]n = PniRes_bandwidth_w;Pn_tota1 = delta_Pn * deltaw;
SNR_new = 10 * loglO(signa1yower/Pn_tota1);
h_noise = awgn(h,SNR_new,'measured');
h_noise_filtered = filter(d,c,h_noise);h_noiseyower = (abs(h_noise_filtered)).1\2;
h_noiseyower_filtered = filter(b,a,h_noiseyower);
H_noise'-power = fftshift(fft(h_noiseyower));H_noiseyower_filtered = fftshift(fft(h_noiseyower_filtered));
T= 1;while h_noiseyower_filtered(T) < 0.1,
T = T + 1;endwhile h_noiseyower_filtered(T) < h_noiseyower_filtered(T+1),
T = T + 1;end
gemidde1de = mean(h_noiseyower_filtered);U=O;
for q = 1:100,tresho1d = gemidde1de * (0.5+(q)/100);i_one = 0;i_zero = 0;
for u = 1:(Nbits-2),r = T + (u-1)*Nsamp1es;if h_noiseyower_filtered(r) > tresho1d,
i_one = i_one + 1;for 1= (r + cei1(-Nsamp1es*0.01)):(r+floor(Nsamp1es*0.01)),
U = U + h_noiseyower_filtered(l);endh_one(i_one) = U/«r+floor(Nsamp1es*0.01))-(r +cei1(-Nsamp1es*0.01))+1);U=O;
J. Steinberg
68

Implementation ofOptical Amplification in a National-Scale SDH Network
elseif h_noise---'power_filtered(r) < treshold,i_zero = i_zero + I;for 1= (r + ceil(-Nsamples*O.O 1»:(r+floor(Nsamples*O.OI»,
U = U + h_noise---'power_filtered(l);endh_zero(i_zero) = U/((r+floor(Nsamples*O.OI»-(r + ceil(-Nsamples*O.OI»+I);U=O;
endend
total bits = i_zero + i_one;
hi = mean(h_one);hO = mean(h_zero);sigma1 = std(h_one)/sqrt(2);sigmaO = std(h_zero)/sqrt(2);
Q(q) = (hl-hO)/((sigmal+sigmaO));Ber(q) = (1/2)*erfc(Q(q)/sqrt(2));clear h_one;clear h_zero;
end
[B W] = min(Ber);
BER(k,e) = B;Treshold(k,e) = gemiddelde * (0.5+(W)/lOO);
endend
Matrix = transpose([SignaUo_noise_ratio(:,I) BER]);
fid = fopen('BER_vs_OSNR_NRZ_with_extinctionJatio','w');fprintf(fid,'%6.5e\t %6.5e\t %6.5e\t %6.5e\n',Matrix);fclose(fid);
J. Steinberg
69

Implementation ofOptical Amplification in a National-Scale SDH Network
A.2 BER vs. OSNR for NZDSF and SSMF with Chirp and z = 180 km
% This script calculates and plots the BER vs. OSNR for NZDSF and SSMF with% Chirp and propagation upon 180 lan.
% First a suitable time and accompanying frequency vector are created
70
B = 2.5e9;Nsamples = 2""8;Nbits=512;duty-cycle = 0.95;m=2;C = -6;er_dB= 8.2;erJin = 1000\(er_dB/l0)er_lin_h = sqrt(erJin)
TO = (duty_cycle/(B*2»;T = liB;Ntotal = Nsamples * Nbits;dt = T I Nsamples;deltaT = dt * Nsamples * Nbits;
% the bit-rate of the signal% number of samples taken per bit% number of bits in the sequence% duty cycle of the signal% factor for creating a 'square' Super Gaussian pulse% chirp factor of transmitting laser% extinction-ratio ofthe transmitting laser% extinction-ratio transmitter linear% h-field multiplication factor due to extinction-ratio
% characteristic time width of a single pulse% time duration of one bit% total number of samples within bit sequence% time stepsize between two samples% total time duration ofbit sequence
max_t_bit = (dt * Nsamples/2)-dt/2;min_t_bit = -(dt * Nsamples/2)+dt/2;t_bit = linspace(min_t_bit,max_t_bit,Nsamples);
t_bit_Oth_half = linspace(min_t_bit - (dt * Nsamples/2),min_t_bit -dt,Nsamples/2);t_bit_l st_half = linspace(min_t_bit,-dt/2,Nsamples/2);t_bit_2nd_half = linspace(dt/2,max_t_bit,Nsamples/2);t_bit_3rd_half= linspace(max_t_bit + dt,max_t_bit + (dt * Nsamples/2), Nsamples/2);t_total = linspace(dt/2,(deltaT-dt/2),Ntotal);
dw = 2*pi I deltaT;deltaw = 2*pi I dt;maxw = dw * (NtotaI/2-1);minw = -dw * Ntotal/2;w = linspace(minw,maxw,Ntotal);
Z = randsrc(1,Nbits-4,[0,1]);E = [0 10 Z 0];
% frequency stepsize% total frequenct band% maximum frequency% minimum frequency% frequency vector
% random bit sequence( 1)% random bit sequence(2)
Bo = 6e9; % optical filter bandwidth[d,c] = butter(3,(2*pi*Bo/w(length(w»»;Be = 2e9; % electrical filter bandwidth[b,a] = butter(3,(2*pi*Be/w(length(w»)));
% The NRZ-sequence with various extinction-ratios is created
h_Iow = l/er_lin_h;h_high = lIer_Iin_h + (l-lIerJin_h).*exp(-((I+i*C)/2).*((-dt/2./TO)."\(2*m)));hJise = l/er_lin_h + (l-lIerJin_h). *exp(-((1+i*C)/2).*((t_bit_lst_half./TO)."\(2*m»);hjaIl = lIer_lin_h + (I-I/er_lin_h). *exp(-((I+i*C)/2).*((t_bit_2nd_half./TO)."\(2*m»);h_low_afterJaIl = lIerJin_h + (I-lier_lin_h).*exp(-(( 1+i*C)/2).*((t_bit_3rd_half./TO)."\(2*m»);
J. Steinberg
Implementation ofOptical Amplification in a National-Scale SDH Network
for f= 1:Nbits,ifE(f) == 0,
q = [(f-l )*Nsamples + I: I :Nsamples*fJ;h(q) = h_Iow;
else if E(f) == I,~ Ist_half= [(f-I)*Nsamples+ I: I :(f-I)*Nsamples+Nsamplesl2];iff> I,~Oth_half= ~Ist_half - Nsamples/2;h(~Oth_half) = hJise_after_low;
endh(~ I st_half) = h_rise;
breakend
end
for p=f:(Nbits-I),~minus_half= [p*Nsamples-(Nsamples/2-1): I :p*Nsamples];vlus_half= ~minus_half+ Nsamples/2;ifE(p) == 0 && E(p+l) == 0,
h(vlus_half) = hJow;h(~minus_half)= hJow;
elseif E(p) == 0 && E(p+ I) == I,h(vlus_half) = hJise;h(~minus_half)= hJise_afterJow;
elseif E(p) == I && E(p+ I) == 0,h(vlus_half) = h_Iow_after_fall;h(~minus_half) = hjall;
elseif E(p) == 1 && E(p+ I) == I,h(vlus_half) = h_high;h(~minus_half) = h_high;
endend
einde = [Nsamples*Nbits-(Nsamples/2 -I): I :Nsamples*Nbits];
if E(Nbits) == 0,h(einde) = h_low;
elseif E(Nbits) == I,h(einde) = hjall;
end
H = fftshift(fft(h));H-.rower = (abs(H))/'2;
for e = 1:3,if e == I,
z=O;0=5;beta = - «(l550)/'2)/(2*pi*3e5)) * 0 * le-24;
elseif e == 2,z = 180;0=5;beta = - «(1550)/'2)/(2*pi*3e5)) * D * le-24;
elseif e == 3,
J. Steinberg
71
Implementation ofOptical Amp/(fication in a National-Scale SDH Network
z = 180;0=18;beta = - (((l550).1\2)/(2*pi*3e5)) * 0 * le-24;
end
J = H.* exp((j/2) .* beta.* (w.1\2).* z);J---.power = (abs(J)).1\2;h = abs(ifft(J));h---'power = (abs(h)).1\2;signal---.power = sum(h---'power);
% Noise is added and the minimum BER is calculated
for k = 1:50,
SNR = 9.0 + k*0.2;SignaUo_noiseJatio(k,e) = SNR-3;Res_bandwidthj= 12.5e9;Res_bandwidth_w = 2*pi*Res_bandwidthj;Pn = signal---'power/(l OI\(SNR/ I0));delta]n = Pn/Res_bandwidth_w;Pn_total = delta_Pn * deltaw;
SNR_new = 10 * logIO(signal---'power/Pn_total);
h_noise = awgn(h,SNR_new,'measured');
h_noise_filtered = filter(d,c,h_noise);h_noise---'power = (abs(h_noise_filtered)).1\2;
h_noise---'power_filtered = filter(b,a,h_noise---'power);
H_noise---'power = fftshift(fft(h_noise---'power));H_noise---'power_filtered = fftshift(fft(h_noise---'power_filtered));
T = I;while h_noise---'power_filtered(T) < 0.1,
T = T + I;endwhile h_noise---'power_filtered(T) < h_noise---'power_filtered(T+ I),
T = T + I;end
P = h_noise---'power_filtered(T);
gemiddelde = mean(h_noise---'power_filtered);U=O;
for q = 1:100,treshold = gemiddelde * (0.5+(q)/ I00);i_one = 0;i_zero = 0;
for u = I :(Nbits-2),r = T + (u-I)*Nsamples;if h_noise---'power_ filtered(r) > treshold,
J. Steinberg
72
Implementation qfOptical Amplification in a National-Scale SDH Network
i_one = i_one + 1;for 1= (r + cei1(-Nsamples*0.01»:(r+floor(Nsamples*0.01»,
U = U + h_noise-power_filtered(l);endh_one(i_one) = U/«r+floor(Nsamp1es*0.01»-(r + cei1(-Nsamp1es*0.0 1»+1);U=O;
e1seif h_noise-power_filtered(r) < tresho1d,i_zero = i_zero + 1;for 1= (r + ceil(-Nsamp1es*0.0 1»:(r+floor(Nsamp1es*0.01),
U = U + h_noise_power_fi1tered(I);endh_zero«(zero) = U/«r+floor(Nsamples*O.O 1»-(r + ceil(-Nsamp1es*0.0 1»+1);U=O;
endend
hl= mean(h_one);hO = mean(h_zero);sigma 1 = std(h_one)/sqrt(2);sigmaO = std(h_zero)/sqrt(2);
Q(q) = (hl-hO)/«sigmal+sigmaO»;Ber(q) == (1I2)*erfc(Q(q)/sqrt(2»;clear h_one;clear h_zero;
end
[B W] = min(Ber);
BER(k,e) = B;Tresho1d(k,e) = gemidde1de * (0.5+(W)/l00);
endend
Matrix == transpose([SignaUo_noise_ratio(:,I) BER]);
fid = fopen('BER_vs_OSNR_NRZ_er_82_C','w');fprintf(fid,'%6.5e\t %6.5e\t %6.5e\t %6.5e\n',Matrix);fclose(fid);
J. Steinberg
73

implementation ofOptical Amplification in a National-Scale SDH Network
Appendix B: Initial Communication with Vendors
COMSAT SDH Network Changes
74
COMSAT operates a SDH STM-16 network (2,5 Gb/s) between Buenos Aires and Mendoza.The following specs apply:
• Single wavelength @ 1550 nm. (so no WDM)• G.652 or G.655 ITU compliant fiber (~ 0,22 and 0,25 dB/km attenuation)• Distance between POPs ~ 90 km.
Approximately every 90 km the signal is regenerated by means of an ADM. These ADMs arelocated at the so-called POPs (Point of Presence). At most POPs no signal is added or droppedand the ADM at these POPs therefore solely perform the function of regeneration. We wouldlike to remove the ADMs at those POPs where no signals are added or dropped. Because ofattenuation considerations (and possibly dispersion considerations as well) it is not possible tojust remove the ADM and connect the 'loose' ends. At some place in the link regeneration ofthe signal needs to take place. This is made visual in Figure 1 and 2, which show a possiblesolution. Figure 1 shows the solution of inserting an In-line Optical Amplifier at the placewhere the ADM is taken out. Figure 2 shows the solution of inserting a Booster / Pre-Amplifierjust after the ADM of the two neighboring POPs.
ADM
POPX
..-----------90 km
In-line Am lifier inserted
ADM Removed
ADM
Rx Tx
POPZ
-90 km
Figure 1: An In-line Optical Amplifier inserted where the ADM is taken out.
J. Steinberg

Implementation ofOptical Amplification in a National-Scale SDH Network 75
POPX
ADM
Booster Pre-Am Imer inserted
o tical Distribution Frame ADM Removed
r····..··..·····..n_ .,
~ ~
!
~••••••06 jPOpy
+--------------------------~
-180 kmBooster Pre-Am lifier inserted
ADM
Figure 2: Booster / Pre-Amplifier inserted just before the ADMs of neighboring POPs
It is not necessary to stick with the solutions given in Figure 1 and 2. Any othersuggestions are more than welcome.
For you to have a general idea what the total attenuation (fiber attenuation and connectorlosses) between two POPs would be I can share some averages. Over a 90 km trace there isapproximately 22 dB total attenuation. The ADMs used are of the type Lucent WaveStar™ADM 1611. They operate with a transmission power of+1 dBm and the receiver side workswell until -28 dBm. The amplifier(s) inserted would therefore need to have the following gain:
-28 -1 + (2·22) +7(margin) = 20dB
It would be nice to have some information on expected dispersion effects and non-linearities.(if either one of them can cause problems, etc.). Furthermore information on how to monitorand manage the amplifiers is requested as well.
I hope that you are able to give me a general solution for bridging a 180 km gap between twoADMs with the information that I have provided you with above. The idea is to implement achosen solution for one POP first and run some tests on this. lfthis then is satisfactory we canstart removing more ADMs.
J Steinberg

Implementation ofOptical Amplification in a National-Scale SDH Network
Appendix C: SOH STM-1 BERT Results
76
1==============================================================================1I 12:23:29 PRINT DEMANDED- RESULTS SNAPSHOT Elapsed Time 07d OOh 20m 09s1==============================================================================
Cumulative Results
Error Results
Error CountError Ratio
Error CountError Ratio
Error CountError Ratio
A1A2 FRAMEoo
HP-REIoo
TU BIPN/AN/A
B1 BIPoo
TC-IECN/AN/A
LP-REIN/AN/A
B2 BIP MS-REI B3 BIP0 0 10 0 1.098E-14
TC-ERR OEI TC-REIN/A N/A N/AN/A N/A N/A
Error CountError Ratio
Hit CountHit SecondsHit Free SecondsPositive PeakNegative PeakPeak-to-PeakRMS
Analysis Results
Errored BlocksErrored SecondsSeverely Errored SecondsUnavailable SecondsPath Unavailable SecondsBackground Block ErrorsErrored Second RatioSeverely Errored Sec RatioBackground Block Err Ratio
Errored BlocksErrored SecondsSeverely Errored SecondsUnavailable SecondsPath Unavailable SecondsBackground Block ErrorsErrored Second Ratio
J Steinberg
BIT1
1.185E-14
G.826 ANALYSISB1 BIP
oooo
N/Aoooo
HP-REIooooooo
CODEN/AN/A
B2 BIPooooooooo
TC-IECN/AN/AN/AN/AN/AN/AN/A
CRCN/AN/A
MS-REIooooooooo
TC-ERRN/AN/AN/AN/AN/AN/AN/A
REBEN/AN/A
JITTERoo
6060090.0850.0550.1400.016
B3 BIP11ooo1
1.650E-06o
2.063E-10
OEIN/AN/AN/AN/AN/AN/AN/A

Implementation ofOptical Amplification in a National-Scale SDH Network
Severely Errored Sec Ratio 0 N/A N/ABackground Block Err Ratio 0 N/A N/A
TC-REI TU-BIP LP-REIErrored Blocks N/A N/A N/AErrored Seconds N/A N/A N/ASeverely Errored Seconds N/A N/A N/AUnavailable Seconds N/A N/A N/APath Unavailable Seconds N/A N/A N/ABackground Block Errors N/A N/A N/AErrored Second Ratio N/A N/A N/ASeverely Errored Sec Ratio N/A N/A N/ABackground Block Err Ratio N/A N/A N/A
77
N/AN/A
Errored SecondsSeverely Errored SecondsUnavailable Seconds
M.2l01 ANALYSISSection
Rx Txo 0o 0o 0
High Order PathRx Tx
1 0o 0o 0
Errored Sec%Errored Sec%ES (Annex D)Error Free Sec%Error Free SecSeverely Err Sec%Severely Err SecDegraded Minutes%Degraded MinutesUnavailable Sec%Unavailable Sec
BIT1
0.000170.00000
60600899.99983
o0.00000
o0.00000
o0.00000
G.821 ANALYSISFAS 140M FAS
N/AN/AN/AN/AN/AN/AN/AN/AN/AN/AN/A
34MN/AN/AN/AN/AN/AN/AN/AN/AN/AN/AN/A
FAS 8MN/AN/AN/AN/AN/AN/AN/AN/AN/AN/AN/A
FAS 2MN/AN/AN/AN/AN/AN/AN/AN/AN/AN/AN/A
Errored SecondsSeverely Errored SecondsUnavailable SecondsErrored Second RatioSeverely Errored Sec Ratio
Errored BlocksErrored SecondsSeverely Errored SecondsUnavailable SecondsBackground Block ErrorsErrored Second RatioSeverely Errored Sec RatioBackground Block Err Ratio
J Steinberg
G.826 ANALYSISNear 140Mb/s
ooooo
BIT Errors11oo1
1.650E-06o
2.063E-10
FarN/AN/AN/AN/AN/A
Near 34Mb/sN/AN/AN/AN/AN/A
FarN/AN/AN/AN/AN/A

Implementation ofOptical Amplification in a National-Scale SDH Network 78
M.2100 ANALYSISRx 140Mb/s Tx Rx 34Mb/s Tx
Errored Seconds 1 N/A N/A N/ASeverely Errored Seconds 0 N/A N/A N/AUnavailable Seconds 0 N/A N/A N/A
M.2110 ANALYSIS15-min 1-hr 2-hr 24-hr 7-day
BIS Results PASS PASS PASS PASS PASS
Frequency :Power Level
155520079 Hz-11.4 dBm
Offset: +79 HzSTM-10 OPTICAL
Offset +0.5ppm
POINTERSeconds
N/AN/AN/AN/A
TUCount
Pointer Results AU POINTERCount Seconds
NDF 0Missing NDF 0+ve Pointer Adjustments 0 0 N/A-ve Pointer Adjustments 0 0 N/AImplied VC Offset 0.0 N/A
I Pointer Value 659 N/A1==============================================================================
J Steinberg

Implementation ofOptical Amplification in a National-Scale SDH Network
Appendix D: Padtec Management Tool Screens
Q Amplifier Setup III~ElQptions amplifier Help
/·nata
79
Information AlarmsUnknown(838)
LOSQ
FailQ
Input Power: -27.56 dBm
Output Power: 7.52 dBm
Voltage +5VDC: 5.015 V
MCS Temperature: 559.49·C
Qlnput
Q+5VDC
Q Temperature
LaserOffQ
Padtl}.2COM1 Ready.
status
Q Eye Protection
Q Laser Enable
Q Main Laser
Q Backup Laser
Backplane: ---1JQ)Ampliher Setup IIIIil El
Polarization Current: 242.9 mA
Power Set-Point: 150 mW
Nominal Power: 180 rWN
Information
Laser Power:
Temperature:
COM1 Ready.
J. Steinberg
149.81 mW
25.33 ·C
__1_5011 StJt~pl
Alarms
Q Laser Fail
Q Current Alarm
Q Temperature Alarm
Backplane: ---1J

Implementation ofOptical Amplification in a National-Scale SDH Network
Appendix E: Software & Equipment
Software
• Adobe Photoshop• Agilent OTDR Traceview III version 2.02• Lucent ITM-CIT System Software 12.0• Matlab 6.5• Microca1 Origin 6.0• Microsoft Office Word 2002• Microsoft Office Excel 2002• Microsoft Office PowerPoint 2002• Microsoft Paint 5.1• Microsoft Windows XP• Padtec Amplifier Setup version 2.3
Equipment
• Agilent Omniber 718• ECE Rectificador 220AC - 480C converter• GENERAC Rectificador 220AC - 48DC converter• Lucent EFA4 Subrack 9TAD (D700) B• Lucent LJB436 STM-16 L 16.2 1.51lm ITU, Ruby• Lucent LJB439 STM-le/o• Lucent LMB401 Pwr Filter&Timing str3• Lucent LJB434 Cross-Connect 64/32, Ruby• Lucent Rack 2200mm ETSI Assembled• OTOR Wavetek MTS 5100• OTDR Agi1ent E6000 Series• OSA ANDO AQ6317• WWG OLS-6 Optical Laser Source• WWG OLP-6 Optical Power Meter
J Steinberg
80
Implementation ofOptical Amplification in a National-Scale SDH Network
References
[1] Keiser, GOPTICAL FIBER COMMUNICATIONS.Singapore: McGraw-Hill, 2000.
[2] Goralski, W.SONET/SDH, 3rd ed.Berkeley: McGraw-Hill/Osborne, 2002.
[3] WAVESTARTM ADM 16/1United States: Lucent Technologies, May 2001.Application and Planning Guide, 8TR730-APG, Version 3.1.
[4] Agrawal, G. P.FIBER-OPTIC COMMUNICATION SYSTEMS.New York: Wiley-Interscience, 2002.
81
[5] Zyskind, J. L. and 1. Nagel, H. D. KidorfERBIUM-DOPED FIBER AMPLIFIERS FOR OPTICAL COMMUCIAnONS.,in Optical Fiber Communications IIIB, I. P. Kaminvow and T. L. Koch, eds., pp. 13-68.San Diego: Academic Press, 1997.
[6] Kaminow, I. and L. TingyeOPTICAL FIBER TELECOMMUNICATIONS IVB, Systems and Impairments.San Diego: Academic Press, 2002.
[7] Rapp, L.QUALITY SURVEILLANCE ALGORITHM FOR ERBIUM-DOPED FIBERAMPLIFIERS.In: 5th International Workshop on Design of Reliable Communication Networks 2005,Naples, 16 - 11 October 2005.Munich: Siemens AG, 2005.
J. Steinberg

Implementation ofOptical Amplification in a National-Scale SDH Network
Suggestions for Further Reading
Goralski, W.SONET/SDH, 3rd ed.Berkeley: McGraw-Hill/Osborne, 2002.
82
Steinberg, J.LINEAR PROPAGATION EFFECTS IN OPTICAL FIBERS.Telecommunications, Faculty of Electrical Engineering, Eindhoven University of Technology, 2004.
J. Steinberg


![Steinberg 96[1]](https://img.dokumen.tips/doc/110x75/577cd28b1a28ab9e78959dd2/steinberg-961.jpg)