Embed Size (px)
Citation preview

EighteenthAnnualNot-for-ProfitHealthCareInvestorConference
JimSkogsberghPresidentandChiefExecutiveOfficer
LeeB.Sacks,M.D.ExecutiveVicePresidentandChiefMedicalOfficer
DominicJ.NakisChiefFinancialOfficerandTreasurer
NewYork,NewYorkMay24,2017

The following material and presentation contains information which isforward looking within the meaning of federal securities law. Theseforward-looking statements are based on the current plans andexpectations of Advocate Health Care Network (“Advocate”) that,although believed to be reasonable, are subject to a number ofknown and unknown uncertainties and risks inherent in the operationof health care facilities, many of which are beyond Advocate’s control,that could significantly affect current plans and expectations andAdvocate’s future financial position and results of operations. Theseforward-looking statements speak only as of the date made. Investorsare cautioned not to unduly rely on such forward-looking statements.This presentation should be reviewed in conjunction with Advocate’sDecember 31, 2016 and March 31, 2017 continuing disclosurereports.

Overview&StrategicFocus
JimSkogsberghPresidentandChiefExecutiveOfficer

MissionDriven
MISSION --- To serve the health needs of individuals, families and communitiesthrough a wholistic philosophy rooted in our fundamental understanding of humanbeings as created in the image of God.
VALUES --- Compassion, equality, excellence, partnership and stewardship guide ouractions as we work together to provide health services to others in our communities.
PHILOSOPHY --- Is grounded in the principles of human ecology, faith and community-based health care. These principles arise from an understanding of human beings as awhole person in light of their relationship to God, themselves, their families and thesociety in which the live.

AdvocateHealthCare
Illinois-BasedChicago/CentralIL
1,350Employed4,970PhysicianPartners
6,300MedicalStaff
11AcuteCare4Teaching/1Children’s5Level1TraumaCenters
HomeHealth/HospicePalliativeCare/LTACH
SNFPartnerships
Physicians Hospitals Post-Acute
37,000Associates
Associates
$5.6B.TotalRevenue$660+M.CommunityBenefits
Financials Location

Morethan$783Mcommunity
NationallyRecognized
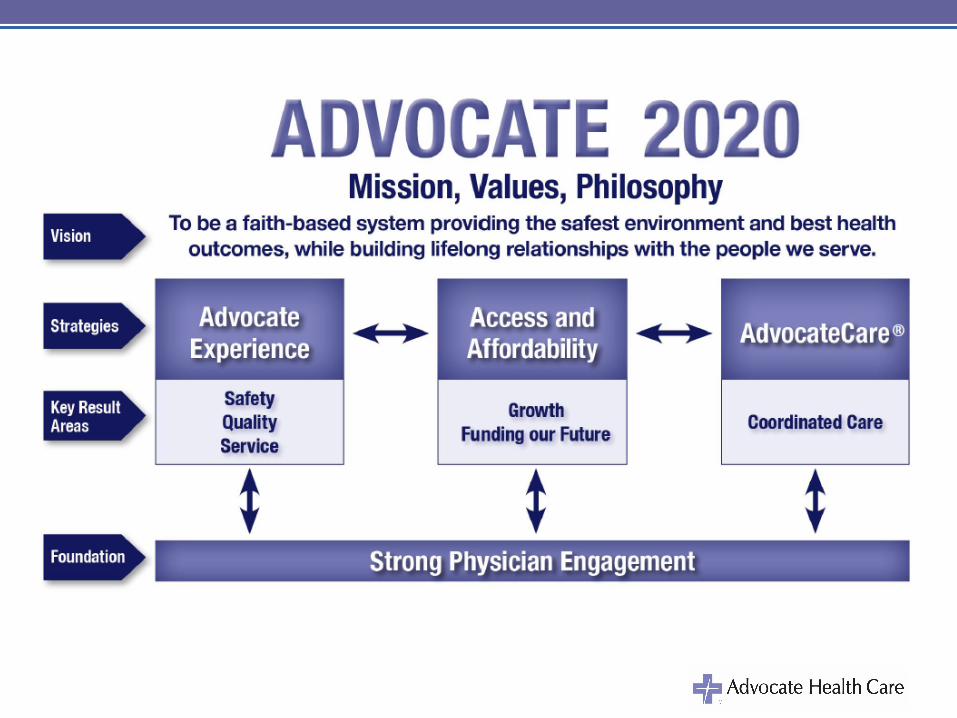
HealthCareLandscape/MarketDynamics• Providerconsolidation• Intensephysicianacquisitionactivity• Decreasingutilization• Shiftingpayor mix/decliningpaymentrates• DominantBlueplans• Unstablepublicexchange• Increasingbaddebt&charitycare• Tightlabormarket
HealthCareTransformation
• Reinventourdeliverymodel(who,what,where,when&how)• Addresscoststructure

Advocate WellPositioned
• Nationalleaderinsafetyandhealthoutcomes• Topdecileworkforceengagement• Strongphysicianpartnerships• #1inbrandrecognition• Financialstrength
FocusedAreasLeeB.Sacks,M.D.ExecutiveVicePresidentandChiefMedicalOfficer

CurrentValue-BasedAgreements
Contract Lives TotalSpendCommercialHMO 286,000 $0.8BMedicareAdvantage 45,000 $0.3 BAdvocateEmployee 32,000 $0.1BCommercialShared Savings 370,000 $1.6BMedicareShared Savings 147,000 $1.6BMedicaidACO 93,000 $0.1BTotal 973,000 $4.5B
12

CommercialBasedInsuranceChallenges
• Attribution• Infrastructure• Leakage• SharedSavings• DominantBluesPlan
Opportunities• BenefitDesign• HMOProducts• TotalCost<marketmedian• ClinicallyIntegratedNetwork• GlobalCapitation

PublicExchangeChallenges
• IndividualMandate• CostSharingReduction• RiskTransferPayment• Complexity• Uncertainty• BadDebt
Opportunities• 110,000Lives• InNetworkUtilization• SupplementalInsurance• PremiumIncreases

MedicareChallenges
• Reimbursementincreaseslessthaninflation• BenefitDesign• MACRAImpactonPhysicians
Opportunities• MedicareAdvantage• MedicareSharedSavingsPlan• MACRASupportforphysicians• SNFUtilization
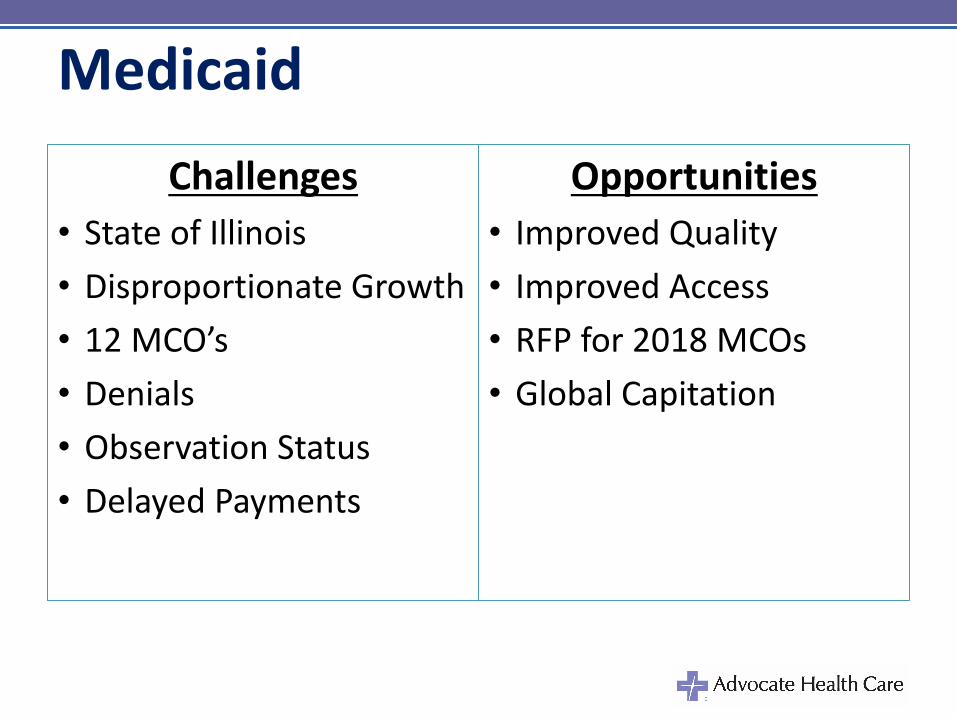
MedicaidChallenges
• StateofIllinois• DisproportionateGrowth• 12MCO’s• Denials• ObservationStatus• DelayedPayments
Opportunities• ImprovedQuality• ImprovedAccess• RFPfor2018MCOs• GlobalCapitation

ReducingClinicalVariation• ContinuedRedesignofJointReplacementSurgery• RoboticSurgery• EnhancedRecoveryAfterSurgery• AdultICUcare- eICU®• Glucosegeltoreduceneonatalhypoglycemia• Summary– betteroutcomesandlowercosts

BHAG:ZEROSeriousSafetyEventsby2020
• Currentdeclineat45%
• 2017declinetarget65%
• Cultureofsafety
SeriousSafetyEventVolumeHRU’sand
PhysicianChampionsincreaseevent
reporting
Safetyinitiativestodecrease
harm
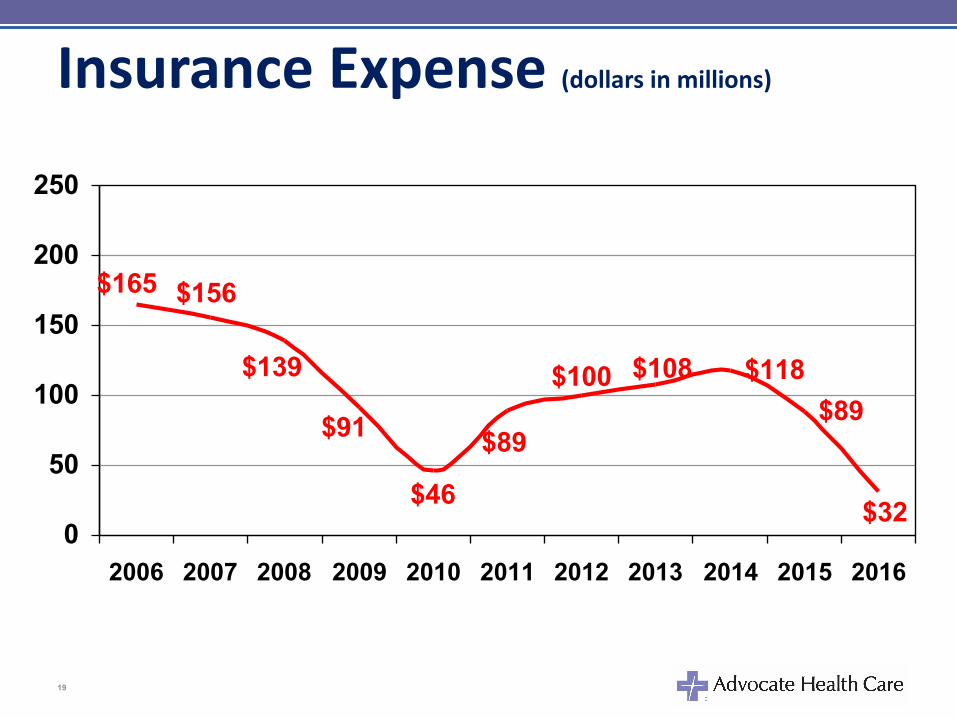
$118$89
$32
$108$100
$89
$139
$156$165
$91
$460
50
100
150
200
250
2006 2007 2008 2009 2010 2011 2012 2013 2014 2015 2016
InsuranceExpense(dollarsinmillions)
19

FinancialProfileDominicJ.NakisChiefFinancialOfficerandTreasurer

RiskBasedRevenuesGrowing
390 414 412 4881,275
4,548 4,816 4,981 5,100
5,164
$0
$500
$1,000
$1,500
$2,000
$2,500
$3,000
$3,500
$4,000
$4,500
$5,000
$5,500
$6,000
$6,500
$7,000
2013 2014 2015 2016 2017Projected
Revenu
esinm
illion
s
RiskBasedRevenues NetPatientService&OtherRevenuesincludingSharedSavings
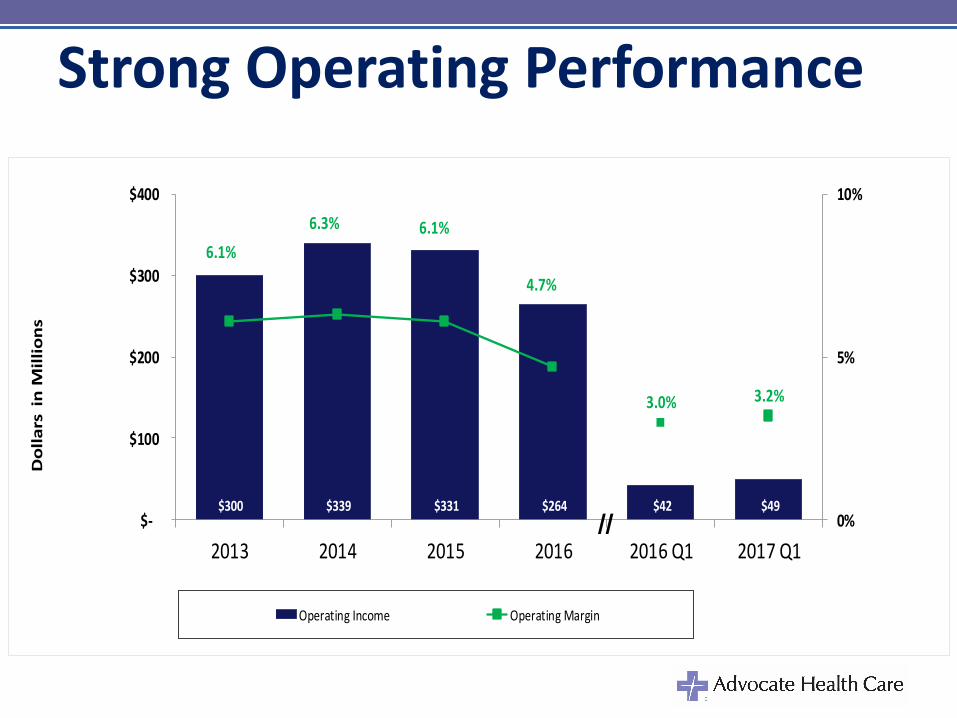
$300 $339 $331 $264 $42 $49
6.1%6.3% 6.1%
4.7%
3.0% 3.2%
0%
5%
10%
$-
$100
$200
$300
$400
2013 2014 2015 2016 2016Q1 2017Q1
DollarsinM
illions
OperatingIncome OperatingMargin
StrongOperatingPerformance
24
//

OperatingCashFlowisSolid
25
$567 $636 $633 $587 $121 $136
11.5% 12.0% 11.7% 10.5%
8.8% 8.7%
0%
5%
10%
15%
$-$100$200$300$400$500$600$700
2013 2014 2015 2016 2016Q1 2017Q1
DollarsinM
illions
OperatingCashFlow OperatingCashFlowMargin
//
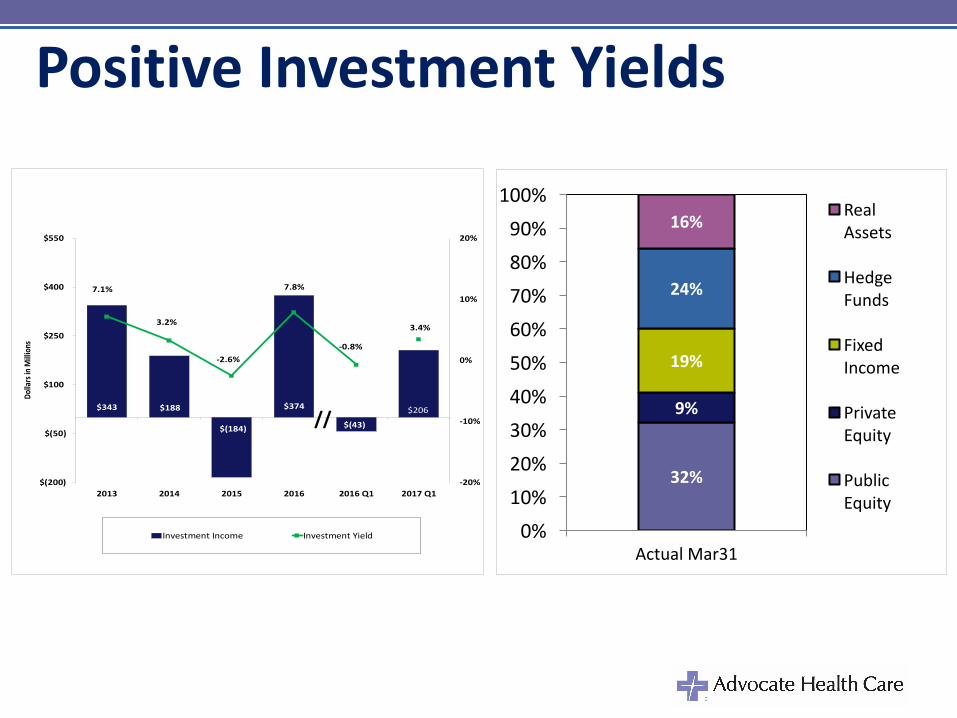
PositiveInvestmentYields
$343 $188
$(184)
$374
$(43)
$206
7.1%
3.2%
-2.6%
7.8%
-0.8%
3.4%
-20%
-10%
0%
10%
20%
$(200)
$(50)
$100
$250
$400
$550
2013 2014 2015 2016 2016Q1 2017Q1
DollarsinM
illion
s
InvestmentIncome InvestmentYield
27
32%
9%
19%
24%
16%
0%10%20%30%40%50%60%70%80%90%
100%
ActualMar31
RealAssets
HedgeFunds
FixedIncome
PrivateEquity
PublicEquity
//

$386 $508 $504 $402 $102 $87
182%
212%196%
149% 151%
121%
0%
50%
100%
150%
200%
250%
$0
$150
$300
$450
$600
$750
$900
2013 2014 2015 2016 2016 Q1 2017 Q1
Dol
lars
in M
illio
ns
Cash Spending Capital Spend Ratio
35//
CapitalSpendModerating

$0.0
$20.0
$40.0
$60.0
$80.0
$100.0
$120.0
2017 2019 2021 2023 2025 2027 2029 2031 2033 2035 2037 2039 2041 2043 2045 2047 2049 2051
DebtSe
rvice
(in$m
illion
s)
Tax-exemptdebtof$1.6billion,annualdebtserviceislevelandaveragelifeis18years
DebtProfile– low,level&long

DebtProfile– WellDiversifiedUnderlyingDebtMix NetInterestRateMix
RenewalRisk CreditProviderMix
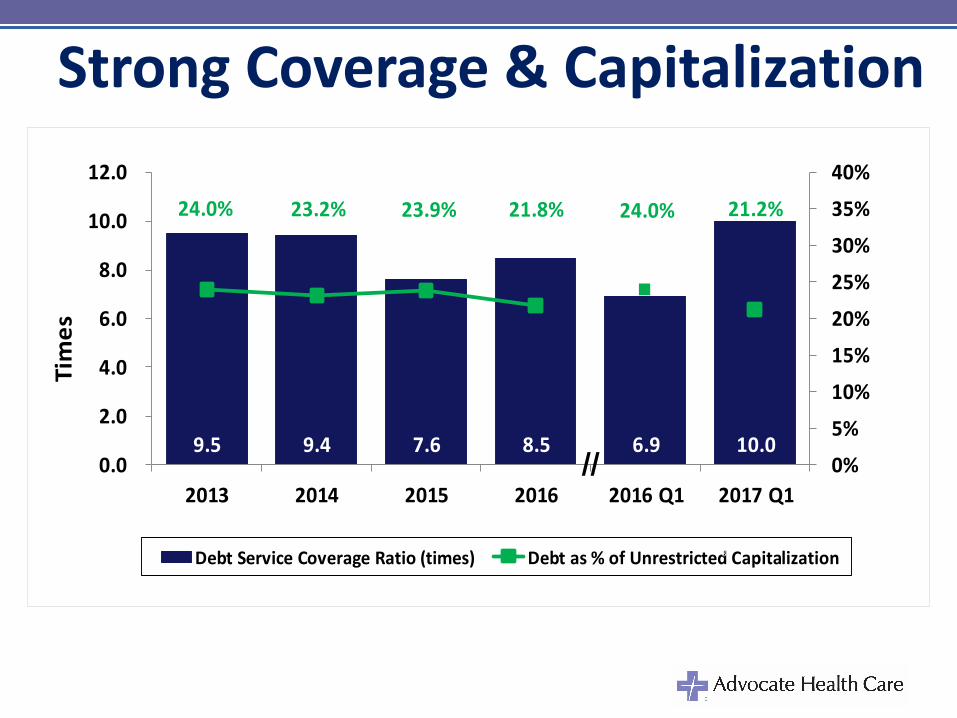
9.5 9.4 7.6 8.5 6.9 10.0
24.0% 23.2% 23.9% 21.8% 24.0% 21.2%
0%5%10%15%20%25%30%35%40%
0.0
2.0
4.0
6.0
8.0
10.0
12.0
2013 2014 2015 2016 2016Q1 2017Q1
Times
DebtServiceCoverageRatio(times) Debtas%ofUnrestrictedCapitalization31
//
StrongCoverage&Capitalization
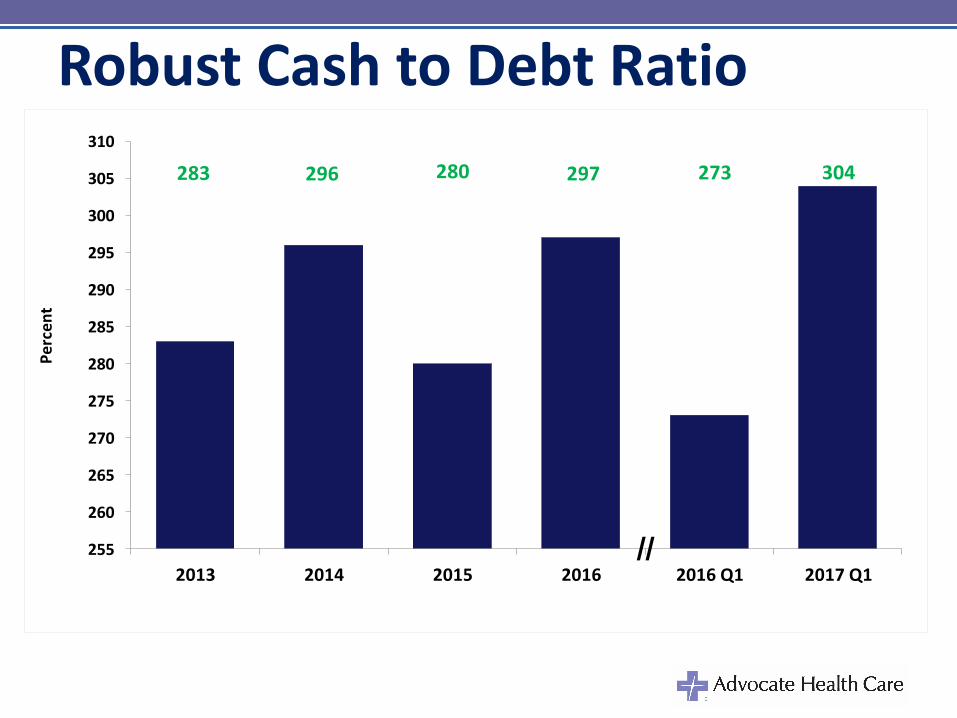
283 296 280 297 273 304
255
260
265
270
275
280
285
290
295
300
305
310
2013 2014 2015 2016 2016Q1 2017Q1
Percen
t
//
RobustCashtoDebtRatio
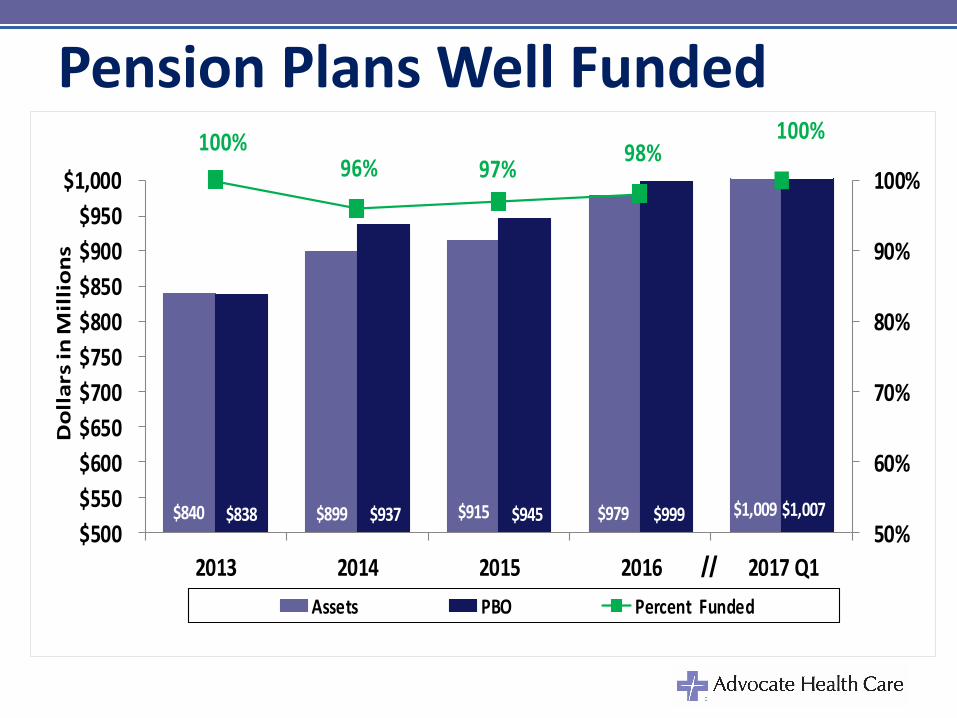
$840 $899 $915 $979 $1,009$838 $937 $945 $999 $1,007
100%96% 97% 98%
100%
50%
60%
70%
80%
90%
100%
$500$550$600$650$700$750$800$850$900$950
$1,000
2013 2014 2015 2016 2017Q1
DollarsinM
illions
Assets PBO PercentFunded
33//
PensionPlansWellFunded
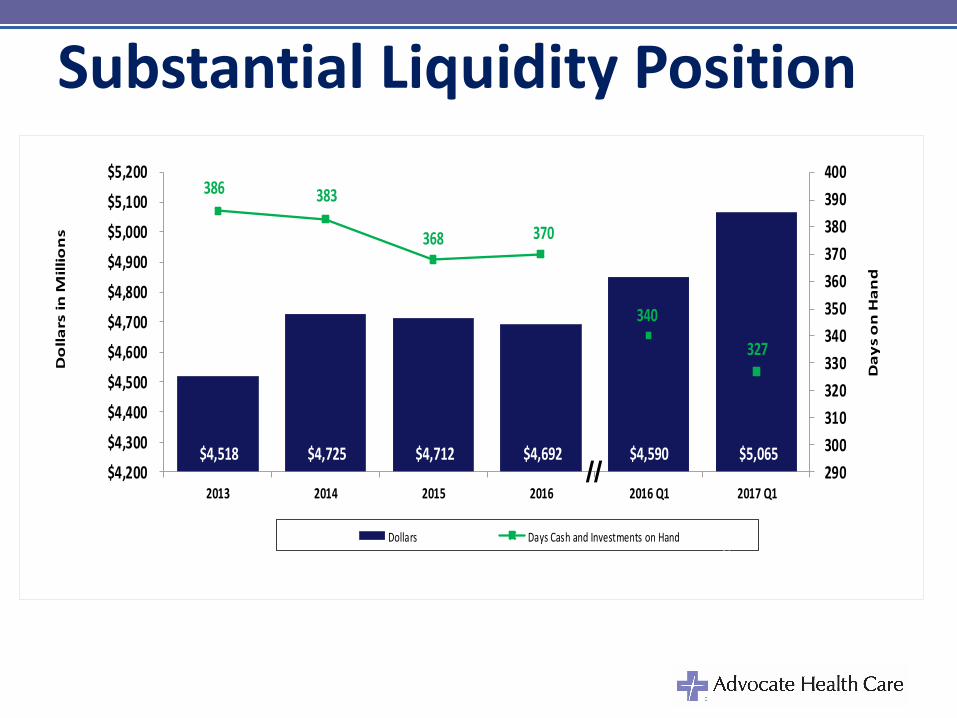
$4,518 $4,725 $4,712 $4,692 $4,590 $5,065
386 383
368 370
340
327
290300310320330340350360370380390400
$4,200$4,300$4,400$4,500$4,600$4,700$4,800$4,900$5,000$5,100$5,200
2013 2014 2015 2016 2016Q1 2017Q1
DaysonHand
DollarsinM
illions
Dollars DaysCashandInvestmentsonHand34
//
SubstantialLiquidityPosition

AdvocateWellPositioned• Nationalleaderinsafetyandhealthoutcomes• Strongbrand• Physician&associateengagement• Balancesheetstrengthandsolidoperatingperformance• AA+(S&P),Aa2(M)AA(F)bondratingswithstableoutlooks 42