Embed Size (px)
Citation preview
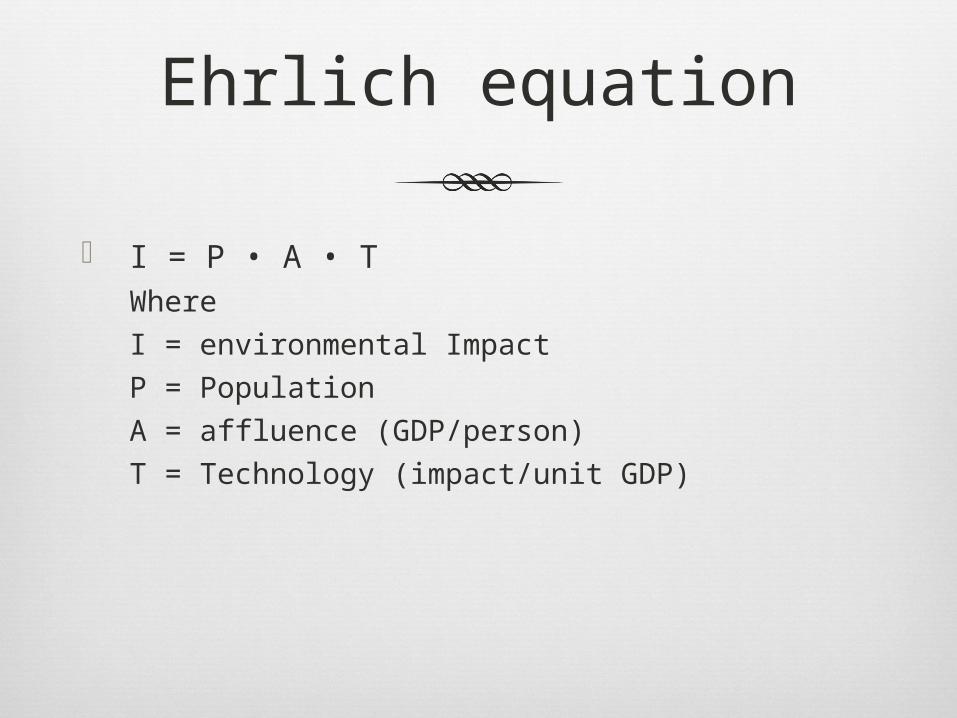
Ehrlich equation
I = P • A • TWhere
I = environmental Impact
P = Population
A = affluence (GDP/person)
T = Technology (impact/unit GDP)

Problems with Ehrlich Eq.
This model, which drove many developments in sustainability, has limitations. Few consider reduction in population as a desirable
approach to sustainability Assumes technology is of the refining type –
wherein resources are converted to energy. New technologies can increase efficiency and
reduce resource impact, but this contradicts the Ehrlich equation.
There is a need to re-write the Ehrlich equation and provide a richer model of human impact on earth’s resources.
Population
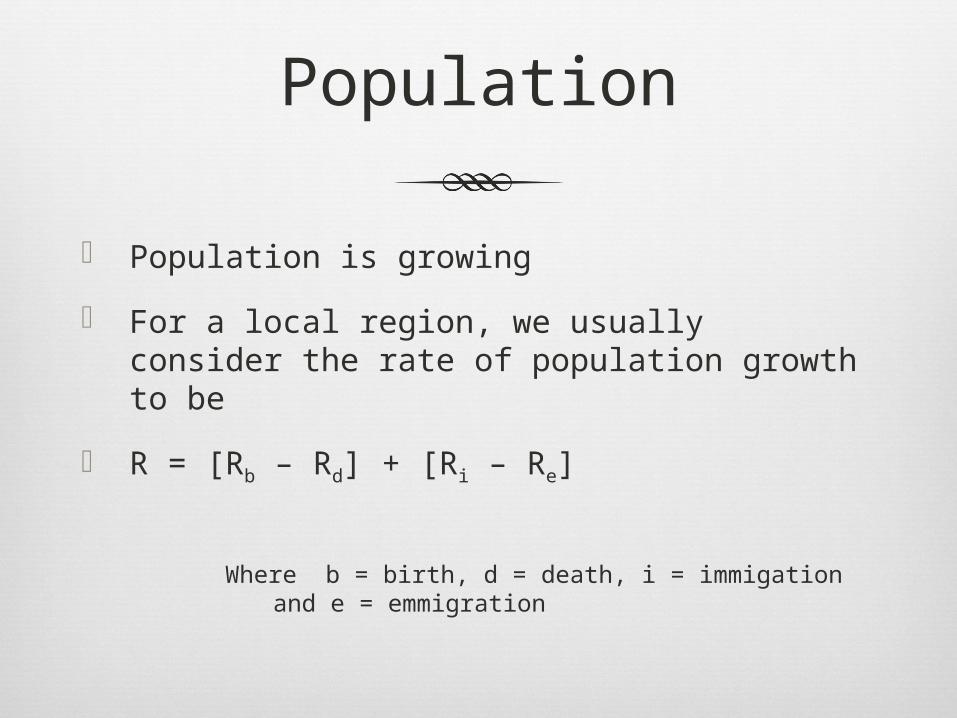
Population is growing
For a local region, we usually consider the rate of population growth to be
R = [Rb – Rd] + [Ri – Re]
Where b = birth, d = death, i = immigation and e = emmigration
Population
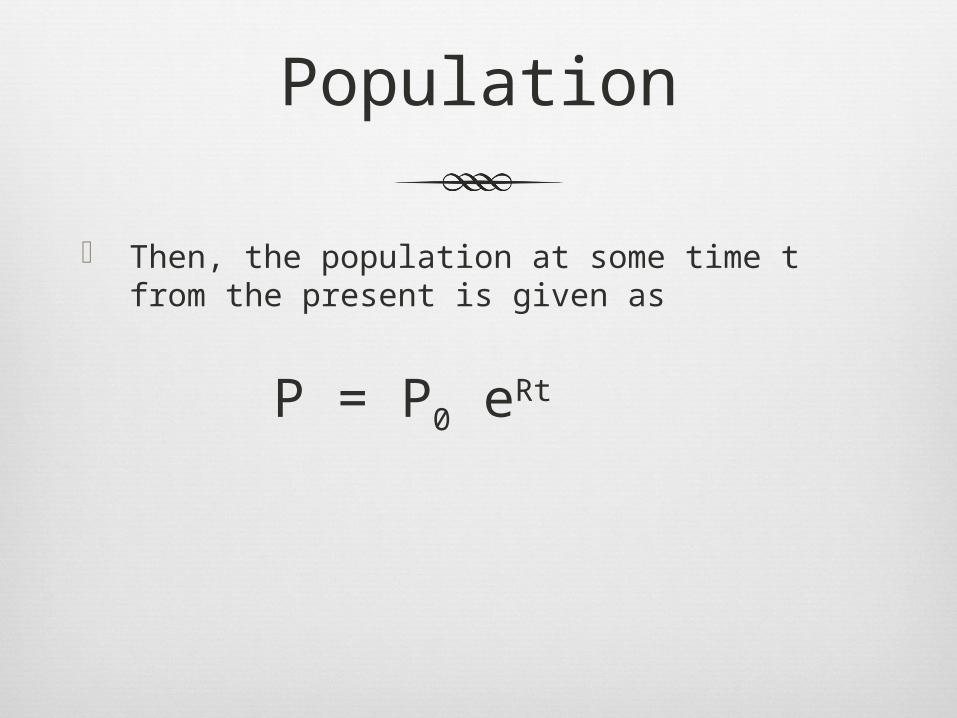
Then, the population at some time t from the present is given as
P = P0 eRt
Rewriting the Ehrlich Equation
Sustainability requires participation from the world population as a whole.
This challenge is addressed in terms of average population response
The goal is to shift resource consumption behavior.

Shift in Resource Consumption
0
0.05
0.1
0.15
0.2
0.25
0.3
1 2 3 4 5 6 7 8Level of Consumption
Frequency
CurrentSustainable

Total Consumption To measure the total consumption of the
population, the average (expected) value of the discrete distribution can be computed as:
€
c = iPi
i=1
8
∑
Total Consumption
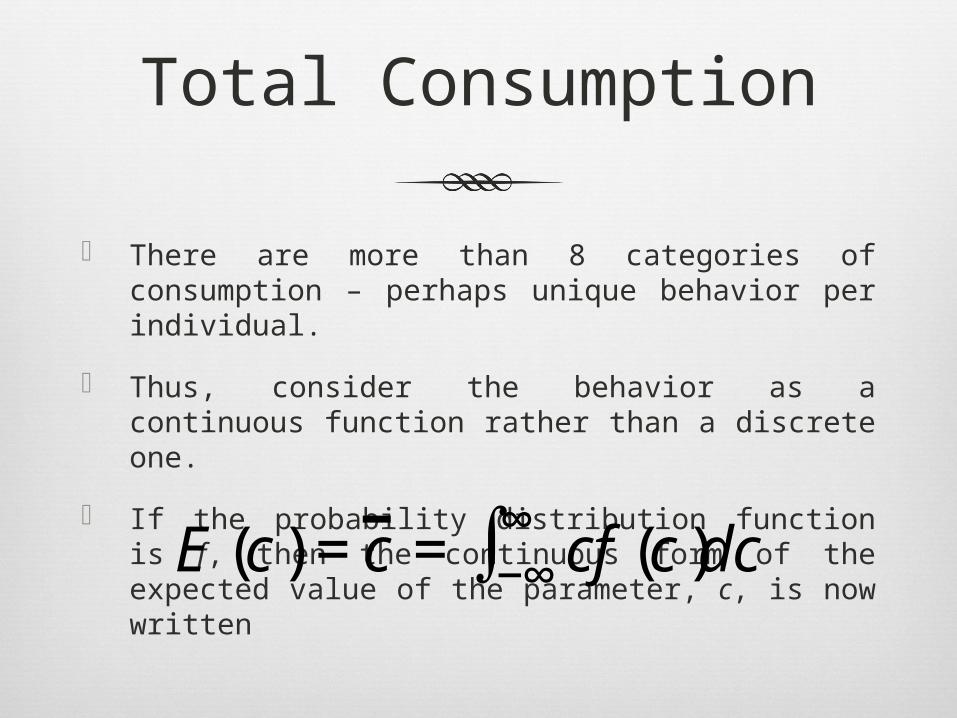
There are more than 8 categories of consumption – perhaps unique behavior per individual.
Thus, consider the behavior as a continuous function rather than a discrete one.
If the probability distribution function is f, then the continuous form of the expected value of the parameter, c, is now written
€
E (c) =c = cf (c)dc−∞∞∫
Modelling Sustainability
Sustainability can be viewed as the intent to make the expected value, E(c), as small as possible.
With no outside constraints, f(c) may be chosen as an impulse function at the origin - no consumption at all!
However this is not a realistic situation and we will introduce restrictions on the function, f(c).
Sustainability Distribution Function
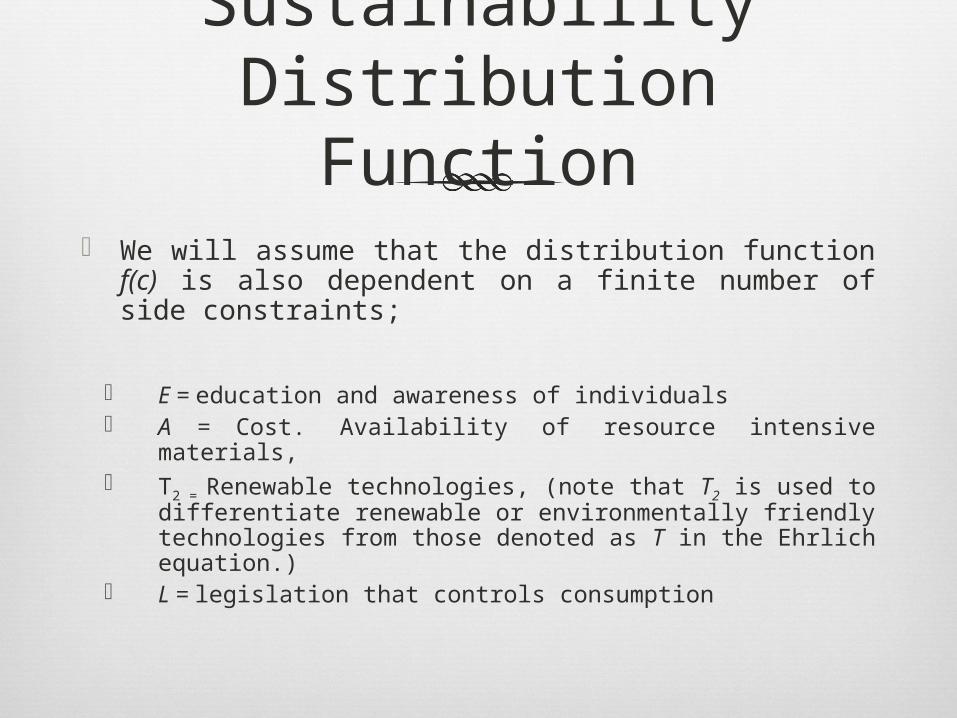
We will assume that the distribution function f(c) is also dependent on a finite number of side constraints;
E = education and awareness of individuals A = Cost. Availability of resource intensive materials, T2 = Renewable technologies, (note that T2 is used to
differentiate renewable or environmentally friendly technologies from those denoted as T in the Ehrlich equation.)
L = legislation that controls consumption
Differential Sustainability
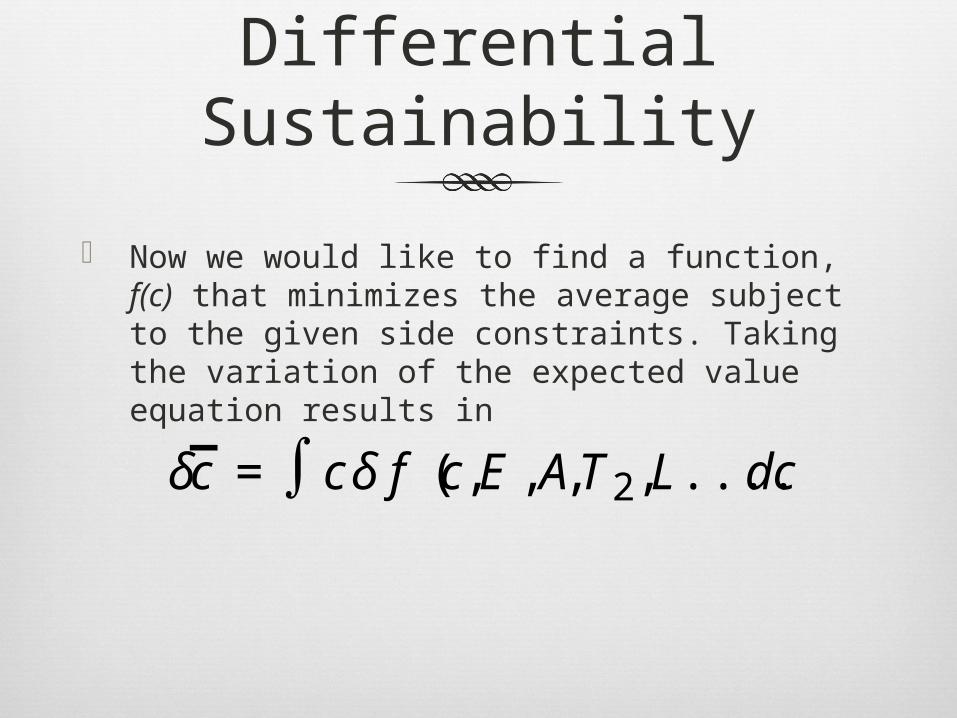
Now we would like to find a function, f(c) that minimizes the average subject to the given side constraints. Taking the variation of the expected value equation results in
€
δc = cδ f (c,E ,A,T2,L....)dc∫
Variation of Distribution Function
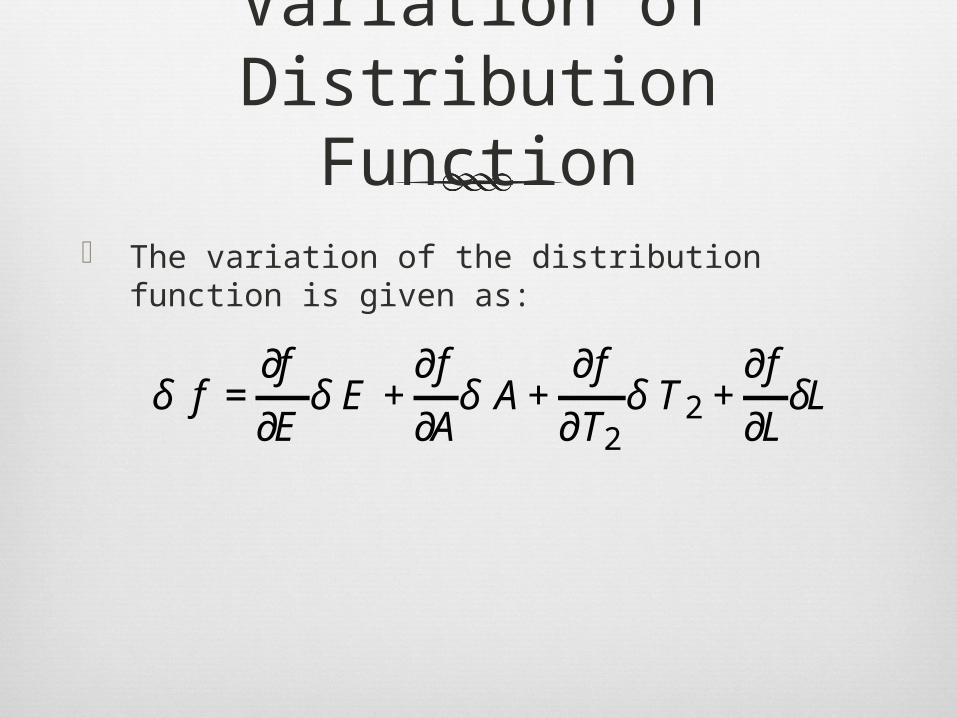
The variation of the distribution function is given as:
€
δ f =∂f
∂Eδ E +
∂f
∂Aδ A+
∂f
∂T2δ T2 +
∂f
∂LδL

Sensitivity of Distribution Function
The variations on the right side of the equation indicate changes in the constraints, E, A, T2, and L and
the partial derivatives represent the sensitivity of f(c), the number of individuals at a given level of consumption, to the changes in the respective constraints.
For example, it is believed that ∂f/∂E is negative – as more people are educated and aware of sustainability issues, the function will be minimized.
Only ∂f/∂A is considered positive in this research – increased availability of resources likely results in reduced sustainability.

Implications
Thus the following actions should result in a lowering of mean expected consumption: increase E (educate and raise awareness) decrease A (increase cost, reduce availability of
resource intensive materials)
increase T2 (increase renewable technologies)
increase L (create legislation to penalize consumption).

Grand Objectives
W1: Maintaining the existence of the human species
W2: Maintaining the capacity for sustainable development and the stability of human systems
W3: Maintaining the diversity of life
W4: Maintaining the aesthetic richness of the planet
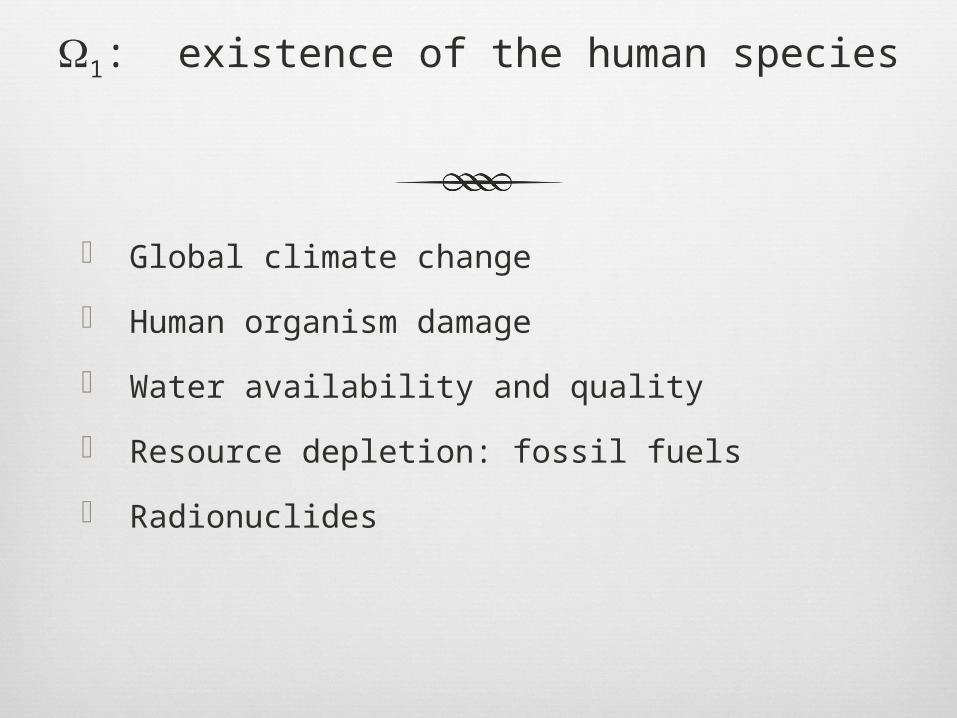
W1: existence of the human species
Global climate change
Human organism damage
Water availability and quality
Resource depletion: fossil fuels
Radionuclides
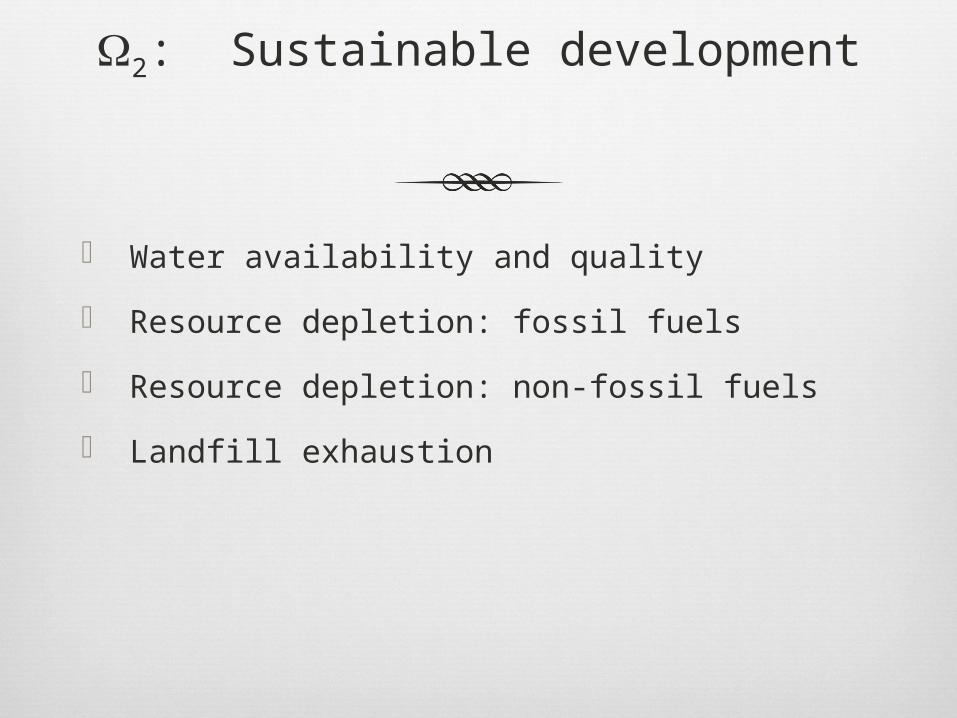
W2: Sustainable development
Water availability and quality
Resource depletion: fossil fuels
Resource depletion: non-fossil fuels
Landfill exhaustion
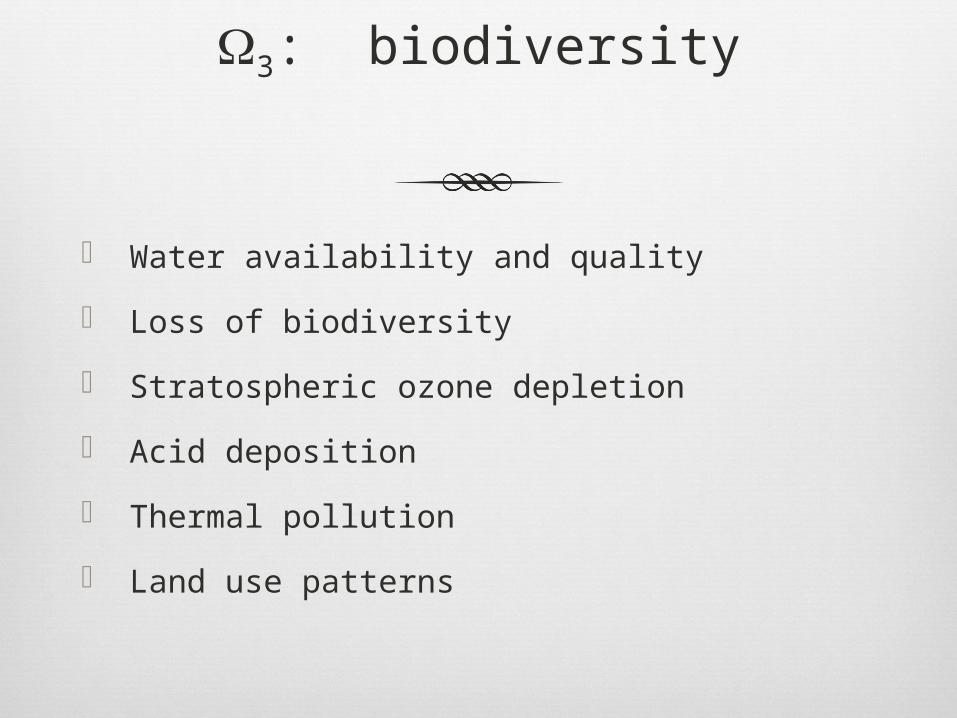
W3: biodiversity
Water availability and quality
Loss of biodiversity
Stratospheric ozone depletion
Acid deposition
Thermal pollution
Land use patterns
W4: Aesthetic richness
Smog
Aesthetic degradation
Oil spills
Odor
e.g. Climate Change
Climate change ties into W1 and W3.
Human activities that contribute to climate change include (not limited to) greenhouse gas emissions
Greenhouse gas emissions come from (not exclusive): Energy use, ruminants, refrigeration, farming,
transportation

Climate Change
Targeted activity for examination: Fossil fuel
combustion Cement
manufacture Rice cultivation Coal mining Ruminant
population Waste treatment Biomass burning Emissions of CFC,
HFC, N2O
Loss of Biodiversity
Targeted activity for examination: Loss of habitat Fragmentation of
habitat Herbicide, pesticide
use Discharge of toxins
to surface waters
Reduction of dissolved oxygen in surface waters
Oil spills Depletion of water
resources Industrial
development in fragile ecosystems
Stratospheric Ozone Depletion
Targeted activity for examination: Emission of CFCs Emissions of HFCs Emissions of halons Emissions of nitrous
oxides
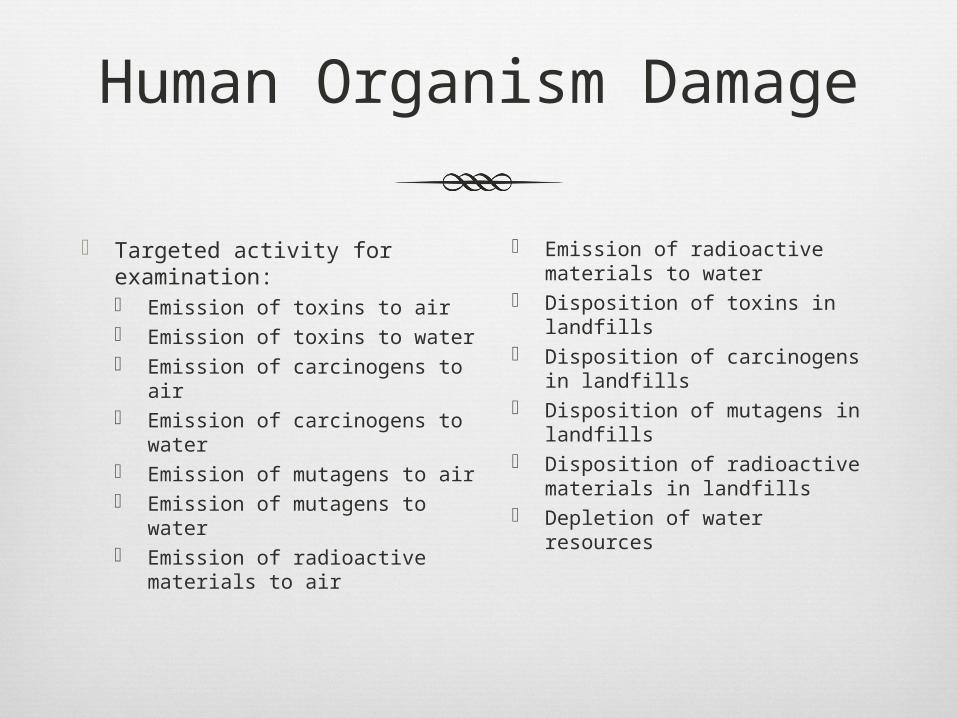
Human Organism Damage
Targeted activity for examination: Emission of toxins to air Emission of toxins to water Emission of carcinogens to
air Emission of carcinogens to
water Emission of mutagens to air Emission of mutagens to
water Emission of radioactive
materials to air Emission of radioactive
materials to water Disposition of toxins in
landfills Disposition of carcinogens
in landfills Disposition of mutagens in
landfills Disposition of radioactive
materials in landfills Depletion of water
resources
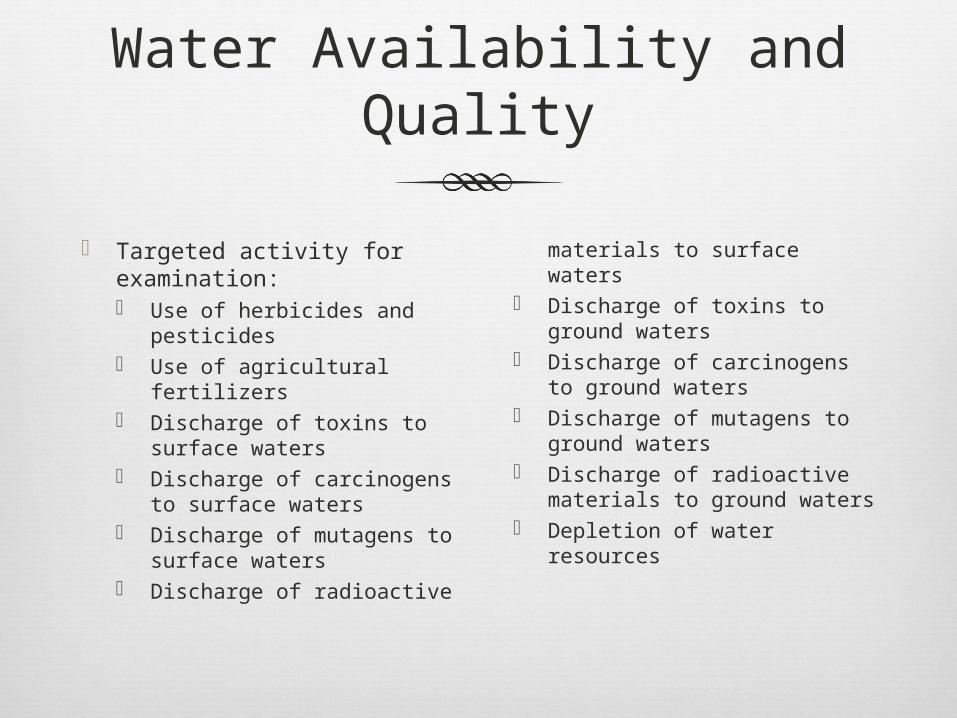
Water Availability and Quality
Targeted activity for examination: Use of herbicides and
pesticides Use of agricultural
fertilizers Discharge of toxins to
surface waters Discharge of carcinogens
to surface waters Discharge of mutagens to
surface waters
Discharge of radioactive materials to surface waters
Discharge of toxins to ground waters
Discharge of carcinogens to ground waters
Discharge of mutagens to ground waters
Discharge of radioactive materials to ground waters
Depletion of water resources

Resource Depletion: Fossil Fuels
Targeted activity for examination: Use of fossil fuels for energy Use of fossil fuels as feedstock

Land Use Patterns
Targeted activity for examination: Development of undisturbed land Emissions influencing sensitive ecosystems Restoration of disturbed land
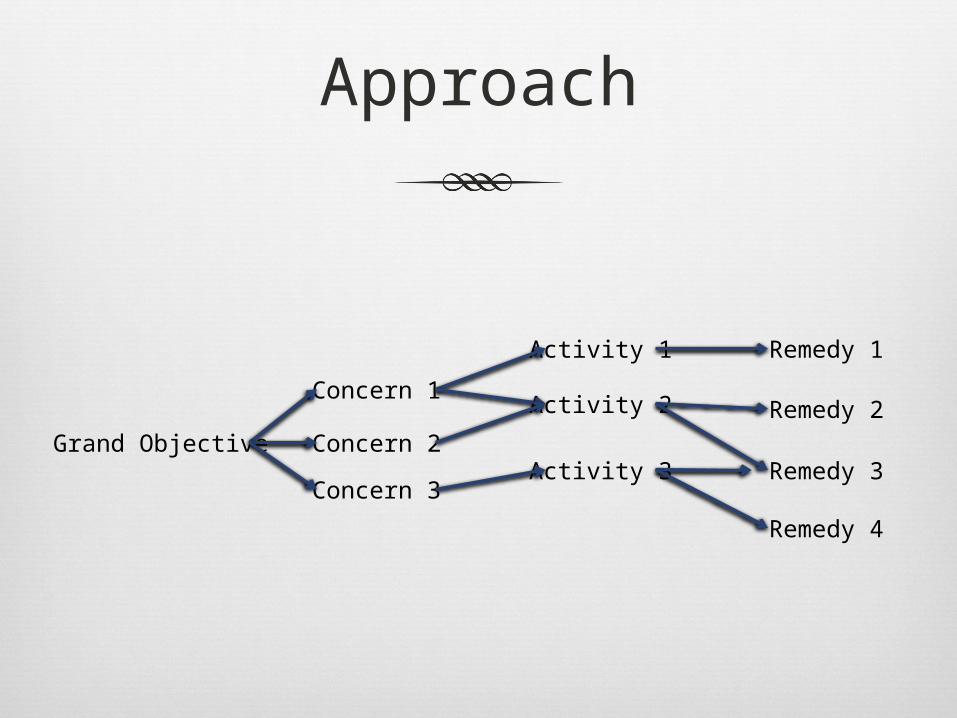
Approach
Grand Objective
Concern 1
Concern 2
Concern 3
Activity 1
Activity 2
Activity 3
Remedy 1
Remedy 2
Remedy 3
Remedy 4
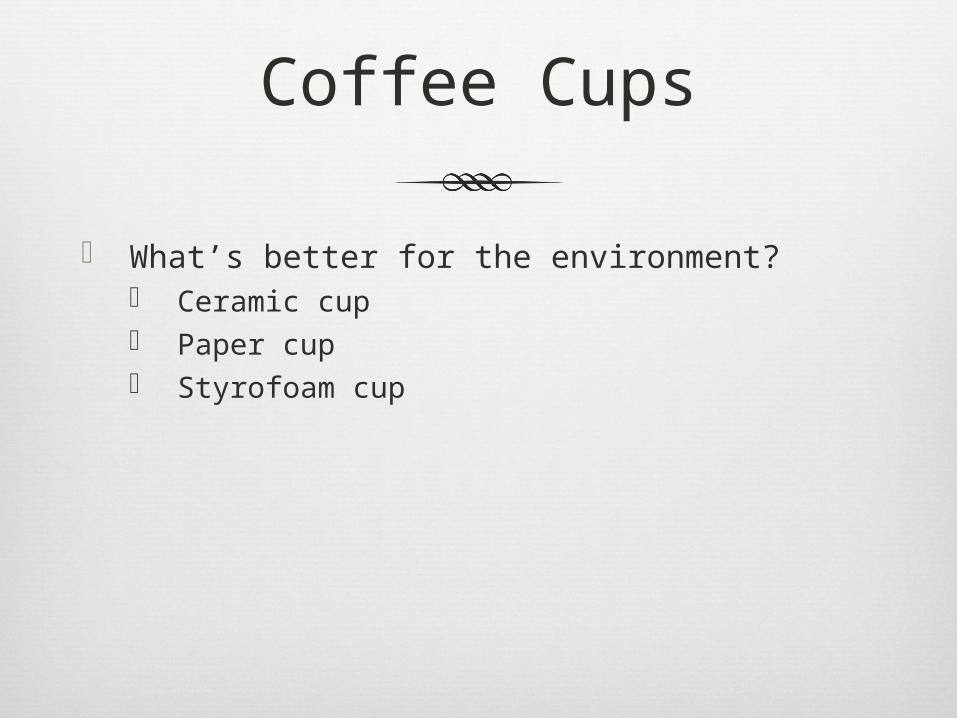
Coffee Cups
What’s better for the environment? Ceramic cup Paper cup Styrofoam cup

Let’s simplify…
Fossil fuel depletion Energy required to make the cup Energy required to reuse the cup -> Energy per usage

Energy to make
Material Mass of Cup(g/cup)
Embodied energy of material(MJ/kg)
Embodied energy per
cup(MJ)
Ceramic 290 48 14
Paper 8.3 66 0.55
Styrofoam 1.9 104 0.20
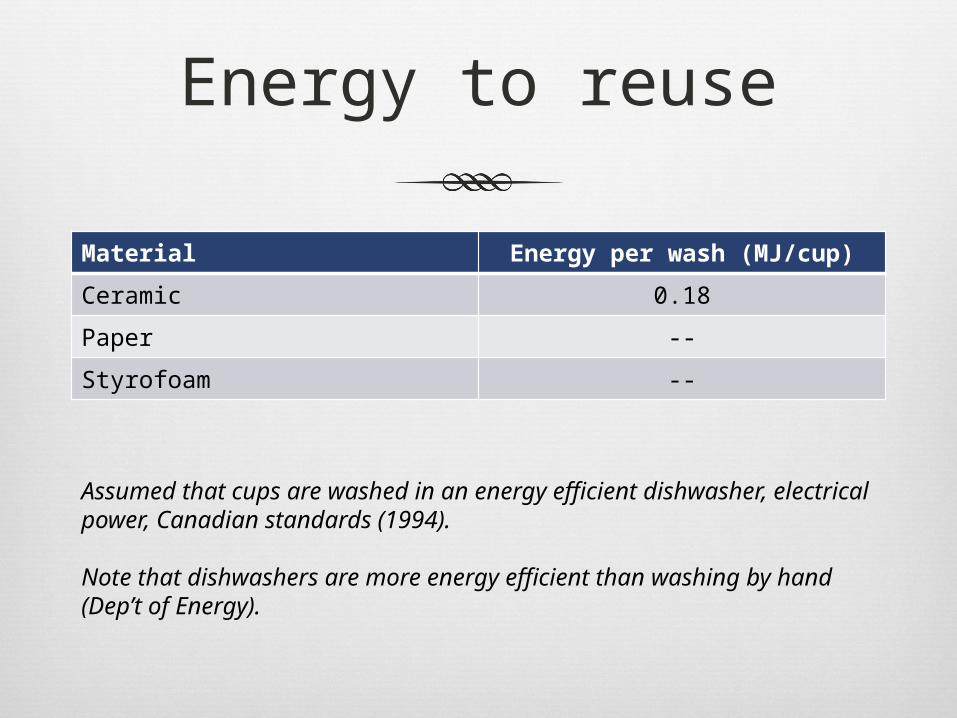
Energy to reuse
Material Energy per wash (MJ/cup)
Ceramic 0.18
Paper --
Styrofoam --
Assumed that cups are washed in an energy efficient dishwasher, electrical power, Canadian standards (1994).
Note that dishwashers are more energy efficient than washing by hand (Dep’t of Energy).
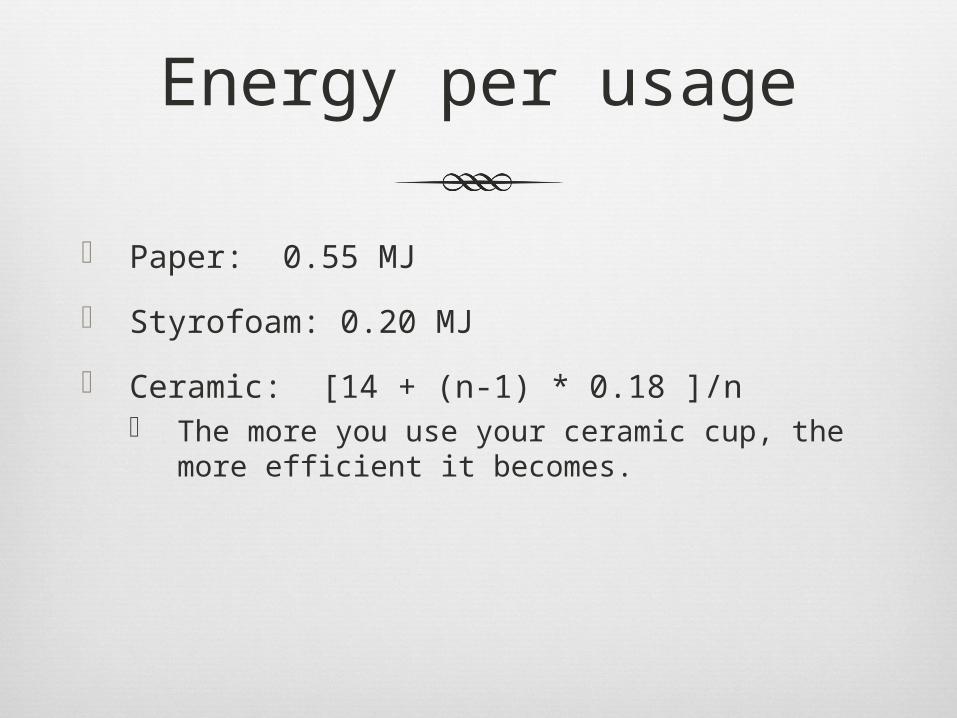
Energy per usage
Paper: 0.55 MJ
Styrofoam: 0.20 MJ
Ceramic: [14 + (n-1) * 0.18 ]/n The more you use your ceramic cup, the more
efficient it becomes.

Energy per Use
0 5 10 15 20 25 30 35 400
2
4
6
8
10
12
14
Paper
Styrofoam
Ceramic
Number of uses
En
erg
y p
er
use (
MJ)
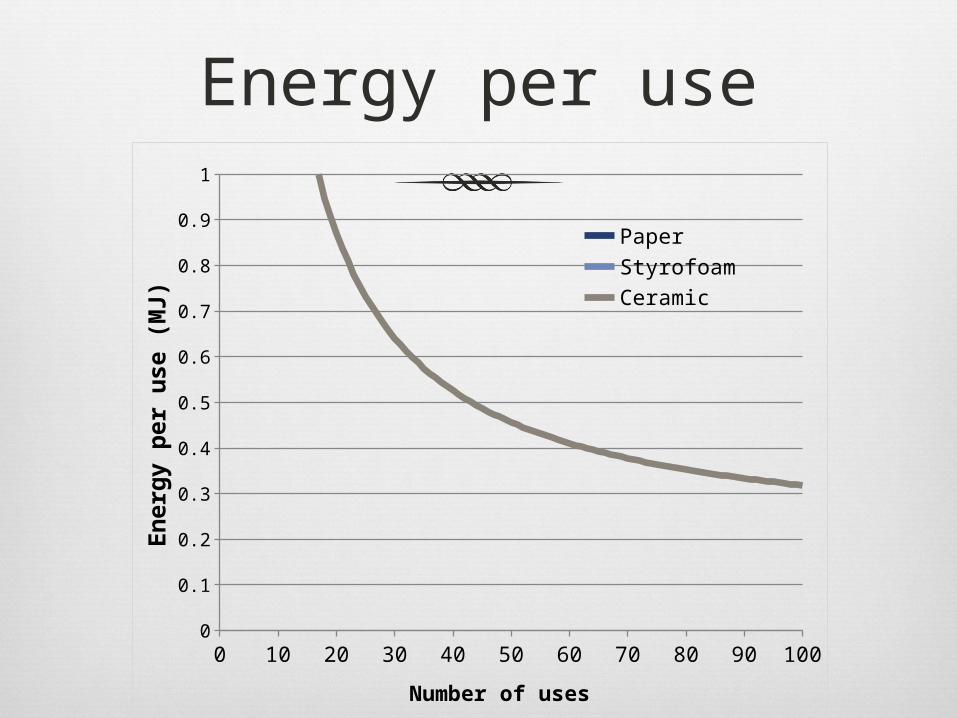
Energy per use
0 10 20 30 40 50 60 70 80 90 1000
0.1
0.2
0.3
0.4
0.5
0.6
0.7
0.8
0.9
1
PaperStyrofoamCeramic
Number of uses
En
erg
y p
er
use (
MJ)

Comparison
To be more efficient than a paper cup, you must use your ceramic cup at least 39 times
To be more efficient than a Styrofoam cup, you must use your ceramic cup at least 1,006 times.

What’s missing
???