Embed Size (px)
Citation preview

Egr2/Egr3 are Essential
Tumour Suppressor Genes
for Lymphomagenesis
A thesis submitted for the degree of Doctor of Philosophy by
Punamdip Kaur Bhullar
September 2013
Division of Biosciences
School of Health Sciences and Social Care

II
Declaration
I hereby declare that the research presented in this thesis is
my own work, except where otherwise specified, and has not
been submitted for any other degree.
Punamdip Kaur Bhullar

III
Abstract
Non-Hodgkin’s lymphoma is the fifth most common cancer in the UK,
accounting for 4% of all new cases. The control of lymphomagenesis still remains a
challenge. Early growth response gene (Egr) 2 and 3 are zinc finger transcription
factors. Egr2 plays an important role in the development of both central nervous
system and lymphocytes. However the mechanism of action in lymphocytes is still
unknown.
In order to fully understand the function of Egr2, in lymphocytes, we
developed Egr2 and 3 double knockout mice (Egr2-/-Egr3-/-) by crossbreeding
lymphocyte specific Egr2 knockout mice (CD2-Egr2-/-) with Egr3 knockout mice
(Egr3-/-), as previous reports suggested that Egr3 compensates for the role of Egr2.
In the absence of Egr2 and 3, the homeostasis of T cells is dysregulated with hyper-
homeostatic proliferation of effector like phenotype cells. More importantly the
development of spontaneous B and T cell lymphoma was found in more than 70%
of Egr2-/-Egr3-/- mice. The lymphoma cells from Egr2-/-Egr3-/- mice were highly
proliferative and metastatically spread into other non-lymphoid organs, such as
lung, liver and kidney. In additional to this lymphoma development the Egr2-/-Egr3-/-
mice showed signs of chronic inflammatory disorder. This inflammatory disorder
was characterised by glomerulonephritis and an increase in serum cytokines, which
may provide the microenvironment for the lymphoma development.
To explore the molecular mechanism of tumour development in
Egr2-/-Egr3-/- mice, the transcriptional profile of Egr2 was studied by microarray and
ChIP-on-chip. We found firstly that Egr2 directly binds to the promoter regions of

IV
Ikaros and FOXO3. The deletion of Egr2 and 3 in lymphocytes led to the
downregulation of Ikaros, Aiolos and FOXO3 expression. The impaired expression
was found to be associated with proliferative disorder and the development of T
and B cell lymphoma. Secondly Egr2 strongly inhibits STAT3 transcriptional activity
by regulating SOCS3, which is a known inhibitor of STAT3. The breakdown of this
regulation could be an important mechanism in lymphomagenesis.
A model is proposed which defines Egr2 and Egr3 as the backbone of
important tumour suppressor genes that control cell fate decision and regulates
homeostasis in the lymphoid system. Thus, our results suggest that Egr2 and 3 are
important regulators of lymphocyte function by their involvement in multiple cell
signalling pathways, which could potentially be key genes for future cancer therapy.

V
Acknowledgments
Foremost, I would like to express my deep and sincere gratitude to my
supervisor, Dr Su-Ling Li for giving me the opportunity to work on such an
interesting research project. Her immense knowledge, motivation and support have
been of great value to me. I would also like to extend my deepest gratitude towards
Professor Ping Wang for his valuable contributions and not to mention his advice
and unsurpassed knowledge of immunology. I would like to thank Dr Tizong Miao,
Dr Alistair Symonds and Meera for all their help, support and guidance during my
time at Queen Mary and after. Thank you for always responding to my crazy emails
filled with questions. Additionally, a big “thank you” to my team at Brunel, Mengya
Liu, Emma Ghaffari, Ane Ogbe, Becky Omodho and Randeep Singh, you have
provided me with great support and a friendly working environment. I would also
like to thank Dr Predraq Slijepcevic for providing us with the telomere PNA probe.
It would not have been possible to write this doctoral thesis without the
help and support of the kind people around me, to only some of whom it is possible
to give particular mention here.
I cannot find words to express my gratitude to Sheba. This journey we have
travelled together, just like a roller-coaster ride. Every high and low we have
experienced together and without your support, motivation and true friendship, I
cannot image what it would have been like. “Thank you Sheba”, for always being
there when needed, especially during the write up of my thesis. I would also
specially like to thank Dr Sahar Al-Mahdawi and Dr Chiranjeevi Sandi for their

VI
support and advice during my PhD. Thank you Chiru for all your guidance for
putting together this thesis.
I take this opportunity to record my sincere thanks to my friends, whom I
have made during my PhD. Dr Maryam Ojani, Sheba, Ane, Becky, Dr Gonul, Hiba,
Dr Vahid Ezzatizadeh, Dr Terry Roberts, Madhavi, Azedeh, Savneet, Alpa, Julie, Jess,
Emma and Naj for creating such a lively and always supportive atmosphere.
I consider myself very fortunate for having an amazing family. I would like to
thank a group of special people in my life who have always supported and
encouraged me. Vipandip and Kulbir, Rupinder and Rajbir, Tejinder and Sandeep,
Jasbir and Dalwinder. You have all been very supportive and I cannot find words
enough to thank you.
Finally, and most importantly, I would like to thank my parents. My father
Surinder Singh and mother, Sukhwinder Kaur for raising me and making me the
person I am today. Thank you for never having anything but confidence in me and
always supporting my dreams. I consider myself very lucky as I have gained great
parents after marriage, Gurpartap Singh and Surinder Kaur. Thank you for letting
me proceed with my dreams and for the guidance and support since I have joined
your family. Specially thank you to Mummy Ji for taking care of the kids and the
house. Without your help I would not have been able to fulfil this dream.
If I have missed anybody out, please forgive me and know that it was not
intentional.

VII
Dedication
This thesis is dedicated to my husband, Jagdeep and children, Har-Simran and
Rehmath. I give my deepest expression of love and appreciation for the
encouragement that you gave me and the sacrifices you made during this PhD. I
hope this work can be an inspiration for my children to achieve high in their lives.

VIII
Table of Contents
DECLARATION ................................................................................................. II
ABSTRACT ...................................................................................................... III
ACKNOWLEDGMENTS ..................................................................................... V
DEDICATION ................................................................................................. VII
LIST OF FIGURES........................................................................................... XIV
LIST OF TABLES ........................................................................................... XVII
LIST OF ABBREVIATIONS ............................................................................ XVIII
- INTRODUCTION .......................................................................... 1 CHAPTER 1
1.1 HALLMARKS OF CANCER .................................................................................. 2
1.2 THE CELL CYCLE AND CANCER DEVELOPMENT ........................................................ 5
1.2.1 Cell Cycle Regulation ......................................................................... 5
1.2.2 Inhibitors of CDK ............................................................................... 7
1.2.3 Self-Sufficiency in Growth Signals ...................................................... 8
1.2.4 Evading Growth Suppressors ............................................................. 9
1.2.5 Evasion of Apoptosis ....................................................................... 10
1.2.6 Telomere Length – Limitless Replication .......................................... 14
1.2.6.1 Telomerease .................................... Error! Bookmark not defined.
1.2.7 Inflammation and Cancer ................................................................ 18
1.3 LYMPHOMA ............................................................................................... 23
1.3.1 Non-Hodgkin’s Lymphoma (NHL) ..................................................... 23

IX
1.4 IMMUNE SYSTEM ........................................................................................ 25
1.4.1 Generation of Antigen Receptor Diversity ........................................ 26
1.4.2 Lymphoid Haematopoiesis .............................................................. 28
1.5 B LYMPHOCYTE DEVELOPMENT ....................................................................... 29
1.5.1 B cell maturation and subset development ...................................... 33
1.5.2 B cell Tolerance ............................................................................... 35
1.5.2.1 Clonal Deletion ........................................................................ 35
1.5.2.2 Clonal Anergy .......................................................................... 36
1.5.2.3 Receptor Editing ...................................................................... 36
1.5.3 Homeostatic proliferation of B cells ................................................. 37
1.6 T CELL DEVELOPMENT .................................................................................. 38
1.6.1 Positive Selection and Negative Selection ........................................ 40
1.6.2 T cells Maturation and T Cell Tolerance ........................................... 42
1.6.3 T cell activation ............................................................................... 44
1.6.4 T Cell Homeostasis .......................................................................... 47
1.6.5 Peripheral T cell Tolerance............................................................... 49
1.6.5.1 T cell Anergy ............................................................................ 50
1.7 AUTOIMMUNE DISEASES ............................................................................... 52
1.8 EARLY GROWTH RESPONSE TRANSCRIPTION FACTORS ........................................... 54
1.8.1 Egr protein DNA binding .................................................................. 55
1.8.2 Egr family function outside the immune system ............................... 56
1.8.3 Egr family proteins in B cells ............................................................ 60
1.8.4 Egr Family proteins in T cells ............................................................ 61
1.8.4.1 Egr proteins in thymocytes and mature T cell Function ............. 62

X
1.8.4.2 Egr family in Egr2 expression, T cell tolerance and anergy ........ 63
1.8.5 Egr family and apoptosis ................................................................. 65
1.9 AIMS OF THE STUDY ..................................................................................... 67
- MATERIALS AND METHODS ...................................................... 68 CHAPTER 2
2.1 EXPERIMENTAL TOOLS AND CONDITIONS ........................................................... 69
2.1.1 Egr2 Conditional Knockout mice ...................................................... 69
2.1.2 Egr3 Knockout Mice ........................................................................ 69
2.1.3 CD2-specific Egr2-/- and Egr3-/- Mice ................................................. 70
2.1.4 Genotyping ..................................................................................... 70
2.2 CELL CULTURE AND STIMULATION .................................................................... 72
2.2.1 Mouse CD4+ and CD19+ Cells ............................................................ 72
2.3 ISOLATION OF PRIMARY CELLS FROM MOUSE LYMPHOID ORGANS .............................. 72
2.3.1 Cell Viability .................................................................................... 73
2.4 PROLIFERATION ASSAY .................................................................................. 74
2.5 ADOPTIVE TRANSFER .................................................................................... 75
2.6 RNA EXTRACTION OF CELLS ........................................................................... 75
2.7 RNA EXTRACTION FOR TUMOUR SAMPLES ........................................................ 76
2.8 FIRST-STRAND CDNA SYNTHESIS .................................................................... 77
2.9 PRIMER DESIGN .......................................................................................... 78
2.10 REAL TIME RT-PCR ..................................................................................... 84
2.10.1 Real Time RT-PCR Data Analysis ...................................................... 85
2.11 WESTERN BLOT .......................................................................................... 86
2.11.1 Protein Extraction ........................................................................... 86
2.11.2 Protein Quantification ..................................................................... 86

XI
2.11.3 SDS PAGE Electrophoresis and Western Blotting .............................. 87
2.11.4 Protein Detection with Chemiluminescence ..................................... 90
2.12 FLOW CYTOMETRY ....................................................................................... 90
2.13 APOPTOSIS ASSAY ....................................................................................... 91
2.14 IDENTIFICATION AND CHARACTERISATION OF TUMOURS ......................................... 92
2.14.1 Tissue Preparations ......................................................................... 92
2.14.2 Haematoxylin and Eosin Staining .................................................... 94
2.14.3 Immunohistochemistry Staining ...................................................... 95
2.14.3.1 Immunohistochemistry Staining on cells .................................. 95
2.14.3.2 Immunohistochemistry staining on paraffin-embedded tissues. 96
2.14.3.3 Detection of Immunoglobulin deposition in Kidney .................. 97
2.15 MICROARRAY ............................................................................................. 98
2.16 CHROMATIN IMMUNOPRECIPITATION. .............................................................. 99
2.17 CHROMATIN IMMUNOPRECIPITATION MICROARRAY CHIP .................................... 101
2.18 ENZYME-LINKED IMMUNE SORBENT ASSAY (ELISA) ........................................... 102
2.19 TELOMERE LENGTH .................................................................................... 103
2.19.1 Metaphase Preparation ................................................................ 103
2.19.2 Quantitative Fluorescent in situ hybridization (QFISH) ................... 104
2.20 STATISTICAL ANALYSIS ................................................................................ 105
RESULTS .................................................................................... 106 CHAPTER 3
3.1 GENOTYPING OF EGR2 AND EGR3 KNOCKOUT MICE MODEL ................................ 106
3.1.1 The CD2-specific Egr-2 knockout mice. ........................................... 107
3.1.2 Egr2 and Egr3 knockout mice......................................................... 108
3.1.3 Protein Expression of Egr2 and Egr3 in Egr2-/- Egr3-/- mice .............. 109

XII
3.2 SPONTANEOUS LYMPHOMA DEVELOPMENT IN EGR2 AND EGR3 DOUBLE KNOCKOUT
MICE.. ........................................................................................................... 112
3.2.1 Characterisation of lymphomas from Egr2 and Egr3 defective
mice.…….. ................................................................................................. 113
3.2.2 Lymphoma in Egr2-/-Egr3-/- mice show malignant features ............. 116
3.2.3 Genetic Dose effect of Egr2 and Egr3 in lymphomagenesis ............. 119
3.3 HYPER-HOMEOSTATIC PROLIFERATION IN EGR2 AND EGR3 DEFECTIVE MICE ............ 121
3.3.1 Increased lymphocytes in Egr2-/-Egr3-/- in lymphoid organs ............ 122
3.3.2 Survival of Egr2 and Egr3 deficient T and B cells ............................. 124
3.3.3 Survival of Egr2 and Egr3 deficient B and T cells in vivo. ................. 128
3.3.4 Apoptosis not affected in lymphocytes from Egr2-/-Egr3-/- mice ...... 134
3.3.5 Shorter Telomere Length in Egr2-/-Egr3-/- mice ................................ 136
3.4 MOLECULAR MECHANISM OF EGR2 AND EGR3 IN PREVENTING TUMOUR
DEVELOPMENT…… ............................................................................................ 141
3.4.1 Possible effect of inflammatory microenvironment supports the
tumour development in Egr2-/-Egr3-/- mice. ............................................... 142
3.4.2 Constitutive activation of STAT3 oncogene expression detected in
Egr2-/-Egr3-/- mice. .................................................................................... 148
3.4.3 Transcriptional profile of Egr2 in the control of tumourgenesis. ..... 153
3.4.3.1 Egr2 regulates the gene expression of cell cycle genes ............ 156
3.4.4 Identification of Target genes for Egr2 by ChIP-on-chip .................. 167
3.4.4.1 Egr2 regulates the expression of Ikaros and Aiolos in
lymphocytes ......................................................................................... 169
3.4.4.2 Egr2 regulates the expression of FOXO3 in lymphocytes ......... 175

XIII
DISCUSSION .............................................................................. 180 CHAPTER 4
4.1 DEFECTIVE EGR2 AND EGR3 LYMPHOCYTES LEAD TO RAPID DEVELOPMENT OF
LYMPHOMA….. ................................................................................................ 182
4.1.1 Ikaros family in haematological malignancies ............................... 184
4.1.2 FOXO3 in haematological malignancies ......................................... 188
4.1.3 Egr2 and Egr3 essential for the control of homeostatic
proliferation……. ..................................................................................... .190
4.1.4 Egr2 and Egr3 essential for the control inflammation and cytokine
microenvironment .................................................................................... 191
4.2 CONCLUSION ............................................................................................ 194
4.3 FUTURE WORK ......................................................................................... 196
LIST OF REFERENCES ................................................................................... 198
CONFERENCE PRESENTATION ..................................................................... 240
PUBLICATIONS ............................................................................................ 241
APPENDIX ................................................................................................... 242

XIV
List of Figures
Figure 1.1: Hallmarks of Cancer, adapted from (Hanahan and Weinberg 2000). .... 3
Figure 1.2: Cell Cycle Control. ............................................................................... 5
Figure 1.3: Apoptotic extrinsic and intrinsic pathways (Tait and Green 2010). ..... 12
Figure 1.4: Telomeres located at the ends of all eukaryotic chromosomes. ......... 15
Figure 1.5: Role of inflammation in tumour promotion (Grivennikov, Greten et al.
2010). ................................................................................................................ 20
Figure 1.6: The role of STAT proteins in regulation of cancer adaptive immunity
(Yu, Pardoll et al. 2009) ...................................................................................... 21
Figure 1.7: The role of T and B lymphocytes in Adaptive Immunity, adapted from
(Parkin and Cohen 2001). ................................................................................... 26
Figure 1.8: B cell development stages (Meffre, Casellas et al. 2000). ................... 30
Figure 1.9: Characteristics of the three peripheral B cell subsets (Pillai, Cariappa et
al. 2004). ........................................................................................................... 34
Figure 1.10: Overall summary of T cell development in the Thymus (Germain
2002). ................................................................................................................ 39
Figure 1.11: Positive selection process, negative selection process and death by
neglect (Takahama 2006) ................................................................................... 41
Figure 1.12: Pathways to tolerance (Walker and Abbas 2002). ............................ 44
Figure 1.13: T cell Activation (Pietropaolo, Surhigh et al. 2008) ........................... 45
Figure 1.14: Induction of EGR2 or EGR3 by activated NFAT (Fathman and Lineberry
2007). ................................................................................................................ 51
Figure 1.15: The four members of the Egr family (Poirier, Cheval et al. 2008). ..... 56
Figure 1.16: Egr2 mediated cell death pathway (Unoki and Nakamura 2003). ..... 59
Figure 1.17: Kinetic Expression of Egr in wild type bone marrow B lymphoid
lineage (Li, Symonds et al. 2011). ....................................................................... 61
Figure 1.18: Kinetic Expression of Egr genes in wild type T lymphoid lineage (Li,
Symonds et al. 2011). ........................................................................................ 62
Figure 1.19: Model for the regulation of T cell function by Egr1, Egr2, Egr3 and
NAB2 (Collins, Lutz et al. 2008)........................................................................... 64
XV
Figure 3.1: Generation of CD2-Egr2-/- mice........................................................ 107
Figure 3.2: Generation of Egr2-/-Egr3-/- mice. .................................................... 108
Figure 3.3: Defective Egr2 and Egr3 protein expression in lymphocytes from Egr2-/-
Egr3-/- mice. ..................................................................................................... 109
Figure 3.4: Enlarged spleen and lymph nodes in mice lacking Egr2 and Egr3 genes.
........................................................................................................................ 110
Figure 3.5: Survival Rate of Egr2-/-Egr3-/- and wild type mice. ............................ 111
Figure 3.6: Tumour formation in Egr2 and Egr3 defective mice. ........................ 114
Figure 3.7: B and T Lymphoma Development in Egr2-/-Egr3-/- mice models. ....... 115
Figure 3.8: Histology of B and T cell Lymphoma Developed in Egr2-/-Egr3-/- mice
models. Black arrows indicate mitotic cells (x40). ............................................. 116
Figure 3.9: Lymphoma in Egr2-/-Egr3-/- deficient mice is highly malignant. ......... 118
Figure 3.10: Genetic Dose effect of Egr2 and Egr3 in lymphomagenesis. ........... 120
Figure 3.11: Absolute number of B and T cells in Egr2-/-Egr3-/- and wild type mice
........................................................................................................................ 123
Figure 3.12: Cell Viability of CD4+ and CD19+ cells in Egr2-/-Egr3-/- and wild type
mice. ............................................................................................................... 125
Figure 3.13: Cell Survival of CD4+ and CD19+ cells in Egr2-/-Egr3-/- and wild type
mice. ............................................................................................................... 127
Figure 3.14: Egr2 and Egr3 regulate the homeostasis of lymphocytes. .............. 129
Figure 3.15: Enhanced proliferation of lymphocytes in Egr2-/-Egr3-/- mice. ......... 130
Figure 3.16: Enhanced proliferation in both T and B cell lymphomas in
Egr2-/-Egr3-/- mice. ............................................................................................ 132
Figure 3.17: Apoptosis of activated T cells. ....................................................... 135
Figure 3.18: Q-FISH image of interphase and metaphase CD4+ T cells from wild
type and CD2-Egr2-/- mice ................................................................................ 137
Figure 3.19: Telomere Length of Lymphocytes. ................................................. 138
Figure 3.20: Telomerase Enzyme Expression. .................................................... 140
Figure 3.21: Mice lacking Egr2 and Egr3 develop chronic inflammation disease. 143
Figure 3.22: Functional analysis of peripheral lymphocytes. ............................. 145
Figure 3.23: Egr2 and Egr3 control the homeostasis of inflammatory cytokines. 147

XVI
Figure 3.24: Hyper activated STAT3 in Egr2 and Egr3 deficient B and T
lymphocytes. ................................................................................................... 149
Figure 3.25: Hyper activated STAT3 in B and T lymphoma from Egr2-/-Egr3-/- mice.
........................................................................................................................ 151
Figure 3.26: Egr2 regulated the mRNA expression of SOCS3 .............................. 152
Figure 3.27: Gene expression profile. ............................................................... 155
Figure 3.28: Brca1, Ccna2 and SFN mRNA expression in CD2-Egr2-/- CD4+ T cells. 158
Figure 3.29: Cell cycle genes mRNA expression upregulated in CD2-Egr2-/- CD4+ T
cells. ................................................................................................................ 160
Figure 3.30: Cell cycle genes mRNA expression downregulated in CD2-Egr2-/- CD4+
T cells. ............................................................................................................. 163
Figure 3.31: Cell cycle genes mRNA expression upregulated in CD2-Egr2-/- CD19+ B
cells. ................................................................................................................ 165
Figure 3.32: Cell cycle genes mRNA expression downregulated in CD2-Egr2-/- CD19+
B cells. ............................................................................................................. 166
Figure 3.33: ChIP-chip Vs. Expression comparison. ........................................... 168
Figure 3.34: mRNA expression of IKZF1 and IKZF3 in CD2-Egr2-/- CD4+ T cells. .... 170
Figure 3.35: Graph of MAT scores and enriched regions for the IKZF1 locus. ..... 172
Figure 3.36: Lack of Egr2 Reduced the Protein Expression of Ikaros. ................. 173
Figure 3.37: Aiolos Protein Expression. ............................................................. 174
Figure 3.38: mRNA expression of FOXO3 in CD2-Egr2-/- CD4+ T cells. ................. 176
Figure 3.39: Graph of MAT scores and enriched regions for the FOXO3 locus. ... 178
Figure 3.40: Lack of Egr2 Reduced the Protein Expression of FOXO3. ................ 179
Figure 4.1: Proposed role of Egr2 and/Egr3 in preventing lymphoma development.
........................................................................................................................ 195

XVII
List of Tables
Table 1.1: CDK/cyclin complexes at different phases of the cell cycle Adapted from
(Sandal 2002). ...................................................................................................... 7
Table 1.2: Oncogenes activated in lymphoma Adapted from Hachem, A and
Gartenhaus, R.B 2005 (Hachem and Gartenhaus 2005). ........................................ 8
Table 1.3: Tumour Suppressor Gene deactivated in lymphoma Adapted from
Skibola, C.F., et al 2007 (Skibola, Curry et al. 2007). ............................................ 10
Table 1.4: World Health Organisation Classification of Lymphoid Neoplasms
(Armitage 2005) ................................................................................................. 24
Table 1.5: T cell effector subsets and function adapted from (Zhu and Paul 2008)
.......................................................................................................................... 46
Table 2.1: Primer Sequences for genotyping ....................................................... 71
Table 2.2: Real Time PCR primer sequences........................................................ 79
Table 2.3: List of primary and secondary antibodies used for western blot with
relevant dilutions. ............................................................................................. 89
Table 2.4: Tissue processing program. Tissues were dehydrated with alcohol,
cleared with xylene and infiltrated with paraffin wax. ........................................ 93
Table 2.5: List of primary and secondary antibodies used in IHC on cells. ............ 96
Table 2.6: List of primary and secondary antibodies used in IHC on paraffin tissue
sections. ............................................................................................................ 97
Table 2.7: ChIP primer sequences. .................................................................... 101
Table 3.1: Validation of Microarray Expression Profile with Real-Time PCR. ...... 157
Table A.1 Summary of tumour development in Egr2-/-Egr3-/- mice models ........ 242

XVIII
List of Abbreviations
β Beta
µl microliter
APAF-1 Apoptotic protease activating factor-1
BAFF B-cell-activating factor
BAFFR BAFF receptor
BCR B cell receptor
CDK Cyclin-dependent kinases
ChIP Chromatin immune-precipitation
CKI CDK Inhibitors
CLP Common lymphoid progenitor
CMP Common Myeloid progenitor
CSA Cyclosporine A
dH2O Distilled Water
DMEM Dulbecco’s Modified Eagle Medium
DN Double negative
DNA Deoxyribonucleic acid
DP Double positive
DSB Double strand breaks
Egr2 Early growth response gene
ELISA Enzyme-linked immunosorbent assay
F(ab’)2 Fragments of goat anti-mouse IgM
FACS Fluorescence activate cell sorting

XIX
FADD Fas-associated death domain
FASL Fas ligand
FBS Foetal Bovine Serum
FLT3 Tyrosine kinase
FO Mature follicular B cells
G1 Gap phase 1
G2 Gap phase 2
HC Heavy chain
HEL Hen-egg lysozyme
HL Hodgkin’s Lymphoma
HSC Hematopoietic stem cells
IFN Interferon
Ig Immunoglobulin
IL Interleukin
INO Ionomycin
LC Light chain
LHβ Lutenizing hormone
LIP Lymphopenia induced proliferation
LN Lymph node
LPS Lipopolysaccharide-stimulation
M Mitotic phase
MACS Magnetic Activated Cell Sorter
MOMP Mitochondrial outer membrane permeabilisation
MPP Multipotent progenitors

XX
MZ Marginal zone B cells
NFAT Nuclear factors of activated T cells
NHEJ Non-homologous end joining
NHL Non-Hodgkin’s Lymphoma
NK Natural killer cells
PBS Phosphate-buffered saline
PCR polymerase chain reaction
PMA Phorbol myristate acetate
PMSF Phenylmethylsulfonyl fluoride
RAG Recombination activating genes
RNA ribonucleic acid
RPMI1640 Roswell Park Memorial Institute 1640
RSS Recombination signal sequence
S Synthesis phase
SLE Systemic lupus erythematosus
TCR T cell receptor
TGF-β Transforming growth factor- β
TH T Helper Cell
TNF Tumour necrosis factor
TRAIL TNF-related apoptosis-inducing ligand
WHO World Health Organisation

Chapter 1 - Introduction
1
- Introduction Chapter 1

Chapter 1 – Introduction
2
Cancer is one of the most common diseases in the world. In the UK around
424,128 new cases of cancer were diagnosed in year 2010, and more than 1 in 3
people will develop some form of cancer during their lifetime (CancerResearch
2011). The incidence rate for cancer in Great Britain, alone, has increased by 26%
between 1979 and 2008. There are many types of cancers, around 200 different
types, but five of them – breast, lung, colorectal, prostate and non-Hodgkin’s
lymphoma account for over half (58%) of all new cases (CancerResearch 2011).
1.1 Hallmarks of Cancer
In the past 20 years an enormous progress has been seen in our
understanding of cancer at molecular level; resulting in a large number of exciting
new targets for the development of efficient therapies for treatment. Every cancer
has different features, which depend on the origin of the cancer cell. However the
end result is the same. In 2000, Hanahan and Weinberg defined six hallmarks of
most if not all cancers, which established the logical framework for understanding
the astonishing diversity of cancer development (Hanahan and Weinberg 2000). A
decade later, Hanahan and Weinberg proposed further four emerging hallmarks
(Hanahan and Weinberg 2011), that further explained other factors contributing
towards cancer growth (Figure 1.1).

Chapter 1 – Introduction
3
Figure 1.1: Hallmarks of Cancer, adapted from (Hanahan and Weinberg 2000).
The six hallmarks of cancer are illustrated here in conjunction with two enabling
characteristics. Activation of oncogene, suppression of tumour suppressor genes,
destruction of apoptosis, limitless replication, metastasis and angiogenesis were proposed
by Hanahan and Weignberg in 2000. In 2010 they added a further two hallmarks,
destruction of cell metabolism and the evading of the immune destruction. The two
enabling characteristics are indicated as tumour promoting inflammation and genome
instability.
Cancer has long been known as a genetic disease. In 1951, Muller suggested
that a cell must comprise more than one mutation in order to transform into a
neoplasm (Muller 1951). Since then a number of findings have described that
cancer is a step-wise process, where the cell acquires different qualities at each
step, initiating the neoplasm. This has also supported the clonal expansion theory
of tumour development by Nowell in 1970s, stating that a normal cell which
acquires a somatic mutation will achieve a growth advantage over adjacent normal

Chapter 1 – Introduction
4
cells which eventually leads to clonal expansion (Nowell 1976; Nowell 2002; Sarasin
2003).
The normal process by which normal cells become progressively transformed to
malignancy is known to require the sequential mutations, which arise as a
consequence of damage to the genome (Bertram 2000). Mutations in the context of
carcinogenesis can occur in a number of different ways, but using the extensive
classification these include:
Point mutations, resulting in an amino acid substitutions; frame-shift
mutations or mutations to stop codons which either truncate the protein
product or ascent its sequence.
Chromosomal instability or imbalance, resulting in amplification, over-
expression or inappropriate expression of a particular gene.
Loss of a gene or its fusion with another gene as a result of chromosomal
breakage and rearrangement resulting in a chimeric protein with altered
functions.
Epigenetic modifications to DNA of which the most important is the
methylation of cytosine in CpG islands leading to gene silencing.
Mutations within developing cancer cells have two basic functions: mutations
which increase the activity of the protein that encourage proliferation, these are
called oncogenes; or mutations which inactivate genes that suppress cell
proliferation and growth, hence referred to as tumour suppressor genes.

Chapter 1 – Introduction
5
1.2 The Cell Cycle and Cancer development
1.2.1 Cell Cycle Regulation
During the life of a cell, it will undergo cell proliferation, which involves the
reproduction of a cell to form two identical daughter cells. The daughter cells will
further reproduce themselves into two more daughter cells, and so on. This cyclic
process is a sequence of stages through which a cell passes between one cell
division and the next is called the cell cycle (Figure 1.2). The phases of the cell
growth are the same whether in a tumour cell or in a normal cell.
Figure 1.2: Cell Cycle Control.
There are four stages to the cell cycle; gap phase (G1) before the DNA replication (S phase),
followed by another gap phase (G2) and the mitotic phase (M phase). The cell cycle process
is regulated by cyclin dependent kinases (CDK) and cyclin genes. (Taken from: National
Institute of Health, Appendix A: Early Development. In Stem Cell Information)
Chapter 1 – Introduction
6
The cell cycle for the eukaryotic cells is composed of four stages; the gap
phase before the DNA replication (G1), the DNA synthesis phase (S Phase), the gap
phase after DNA replication (G2), and the mitotic phase, which leads the cell to
divide (M phase) (Hartwell and Weinert 1989). In addition to the four phases, there
is a G0 phase, which is an inactive phase outside of the cell cycle. During this phase
the cells are known to be quiescent, which plays a major part of non-growing, non-
proliferating cells (Vermeulen, Van Bockstaele et al. 2003). Most of the cells in an
adult are not in the process of cell division but can enter the cell cycle at G1 due to
mitogens or growth factors. At G2 checkpoint, preceding mitosis, there is also a
quality control of the cell material, checking the newly synthesised DNA is identical
to the original DNA and that division occurs equally between the daughter cells
(Hickman, Moroni et al. 2002).
The cell cycle is a complex process, which requires a coordination of a
variety of macromolecular synthesis, assemblies and movement. This shift from one
cell cycle phase to another is carefully regulated before replication the quality of
the DNA is checked (G1 phase) (Sandal 2002).
The cell cycle is mainly regulated by cyclin-dependent kinases (CDK). There
are a number of regulation mechanisms for the CDKs which ensures that the correct
timing of kinase activity occurs during the cell cycle. CDKs alone cannot regulate the
cell cycle but are only active once they have formed a complex with their
associates, cyclin (Table 1.1). Cyclins were so named due to their expression levels
oscillating throughout the cell cycle. As the CDKs function at different phases of the

Chapter 1 – Introduction
7
cell, they are both negatively and positively regulated during the cell cycle and
hence provide the driving force for the cell cycle progressions (Sandal 2002).
CDK Cyclin Cell Cycle Phase
CDK1 (cdc2) Cyclin A G2/M phase transition
CDK1 (cdc2) Cyclin B Mitosis
CDK2 Cyclin E G1/S phase transition
CDK2 Cyclin A S phase
CDK4 Cyclin D1, D2, D3 G1 phase
CDK6 Cyclin D1, D2, D3 G1 phase
Table 1.1: CDK/cyclin complexes at different phases of the cell cycle Adapted from
(Sandal 2002).
1.2.2 Inhibitors of CDK
The regulation of the CDK/cyclin complexes is highly monitored due to the
proteins expressed at different stages of the cell cycle. The CDKs and the cyclins are
regulated by many different proteins, such as CDK inhibitors (CKI), some of which
are p21CIP/KIP, p27cip/kip and p16INK4a. The CKI mediate cell cycle arrest in
response to several anti-proliferative signals (Kaldis, Pitluk et al. 1998).
The cell cycle control is also maintained by other genes known as the proto-
oncogenes and tumour suppressor genes. The activation of one and the evasion of
the other, respectively are key hallmarks of cancer development.

Chapter 1 – Introduction
8
1.2.3 Self-Sufficiency in Growth Signals
The most fundamental trait of cancer cells involves their ability to sustain
chronic proliferation. Normal tissues maintain homeostasis of cell number by the
careful production and release of growth promoting signals that instruct entry into
and progression through the cell growth and division cycle. Proto-oncogenes are
involved in the process of regulating proliferation, cell cycle progression and
apoptosis. The proto-oncogenes become activated (oncogenes) by one of the
means of mutations described earlier, which leads to the deregulation of cell
growth. Distinct oncogenes have been specifically associated with the different
subtypes of non-Hodgkin’s lymphoma (Anderson, Reynolds et al. 1992). Table 1.2,
summarises the oncogenes activated in some of the non-Hodgkin’s lymphoma.
Oncogene/Pathway NHL subtype.
Bcl-2 Follicle Lymphoma, Diffuse large B-cell
lymphoma
Cyclin D1 Mantle cell lymphoma
c-Myc Burkitt lymphoma
NF-kB MALT lymphoma, diffuse large B-cell
lymphoma
Bcl-6 Diffuse large B cell lymphoma, follicular
lymphoma
Table 1.2: Oncogenes which are activated in different types of lymphoma
Adapted from Hachem, A and Gartenhaus, R.B 2005 (Hachem and Gartenhaus
2005).

Chapter 1 – Introduction
9
1.2.4 Evading Growth Suppressors
In addition to the cell capability of inducing and sustaining positively acting
growth stimulatory signals, cancer cells must also evade powerful programs that
negatively regulate cell proliferation, which depend on tumour suppressor genes.
Tumour suppressor genes are normal genes that negatively regulate the cell
division, repair DNA damage or direct the cells to undergo apoptosis. The
inactivation of tumour suppressor genes deregulated the cell cycle control and
leads to cancer. The first tumour suppressor gene discovered was the human
Retinoblastoma protein (pRb) by Alfred Knudson (Knudson 1971; Knudson,
Meadows et al. 1976). Over the years many such tumour suppressor genes have
been identified. The most famous is the p53 gene, known as the “Guardian of the
Genome” (Lane 1992), where the inactivation of the gene is an almost common
step in the development of over 50% of human cancers (Hollstein, Sidransky et al.
1991). The tumour suppressor genes are usually defected when the gene is
inactivated on both alleles, “two-hit” theory (Knudson 1971). Table 1.3 shows a
number of tumour suppressor genes affected in lymphoma.

Chapter 1 – Introduction
10
Tumour Suppressor Gene NHL subtype.
BRCA1 Diffuse large B cell lymphoma
BRCA2 T-cell Non-Hodgkin’s lymphoma
TP53 Burkitt’s lymphoma, Chronic
myelogenous leukemia, B cell lymphoma
IKZF1 T Cell lymphoma, Acute lymphoblastic
leukemia, T Cell leukemia
IKZF3 B Cell lymphoma, Chronic lymphocytic
leukemia
Table 1.3: Tumour Suppressor Gene which are deactivated in different types of
lymphoma Adapted from Skibola, C.F., et al 2007 (Skibola, Curry et al. 2007).
1.2.5 Evasion of Apoptosis
Tissue homeostasis is characterised by the balance between proliferation
and cell growth versus the cell death. In response to stressful stimuli, the cell
usually supports a cellular stress response to ensure survival (Kultz 2005; Lockshin
and Zakeri 2007). Apoptosis, also known as programmed cell death is the cell’s
intrinsic death program that regulates various physiological as well as pathological
processes. Apoptosis was initially described by its morphological characteristics,
including cell shrinkage, membrane blebbing, chromosome condensation and
nuclear fragmentation (Wyllie, Kerr et al. 1980; Kerr, Winterford et al. 1994; Lowe
and Lin 2000). There are two major apoptosis signalling pathways, that is, the death
receptor (extrinsic) pathway and the mitochondrial (intrinsic) pathway (Figure 1.3)
(Hengartner 2000).
Chapter 1 – Introduction
11
The extrinsic pathway is initiated by the binding of an apoptotic-inducing to
the cell surface death receptors associated with Fas-associated death domain
(FADD) or tumour necrosis factor (TNF) receptor, respectively (Debatin and
Krammer 2004). The well-studied death ligands are Fas ligands and TNF ligands,
which binds to the transmembrane death receptors such as Fas receptor or TNF
receptor, respectively. Upon ligand binding the FADD become activated and
interact with initiator enzymes of the caspase cascade, mostly caspase 8 and 10,
resulting in downstream activation of caspase 3 and 7 (effector caspases) and
ultimately programmed cellular destruction through proteolytic cleavage of caspase
substrates (McKenzie and Kyprianou 2006).

Chapter 1 – Introduction
12
Figure 1.3: Apoptotic extrinsic and intrinsic pathways (Tait and Green 2010).
There are two apoptotic pathways; extrinsic pathway, which is initiated by the activation of
death receptors. The intrinsic pathway is mitochondrial mediated. The permeabilisation of
the mitochondria releases the cytochrome C into the cytoplasm, activating the caspases.

Chapter 1 – Introduction
13
The intrinsic pathway is initiated by internal stress, such as DNA damage,
lack of growth factors (Okada and Mak 2004). The internal stress signals
subsequently targets the mitochondrial membrane, leading to mitochondrial outer
membrane permeabilisation (MOMP). This causes the release of cytochrome c
(Newmeyer and Ferguson-Miller 2003). The release of cytochrome c into the
cytosol results in the activation of apoptotic protease activating factor-1 (APAF-1)
and caspase 9, which form a functional apoptosome that activates the effector
caspase cascade, resulting in programmed cellular destruction (McKenzie and
Kyprianou 2006) (Figure 1.3).
As Hananah and Weinberg defined the characteristics of cancer
development, they proposed the evasion of the apoptosis as one of the key
hallmarks and this has been observed in many human cancers. In principle, the
apoptosis pathways can be blocked at different levels of the signalling cascade by
upregulation of anti-apoptotic proteins and/or downregulation or dysfunction of
pro-apoptotic proteins (Fulda 2009). Examples of altered apoptosis signalling
pathways that contribute to stress resistance in human cancers are:
Impairment of death receptors is via downregulation of receptor surface
expression as part of the adaptive stress response. For example, in chemotherapy
resistance leukaemia, the CD95 expression was downregulated (Friesen, Fulda et al.
1997). TRAIL is a death receptor which binds to CD95 ligand to induce apoptosis.
Deletions or mutations, resulting in loss of both copies of TRAIL-R1 or TRAIL-R2
were detected in small percentage of NHL (Fulda 2009).

Chapter 1 – Introduction
14
Caspase 8 has been shown to be transcriptionally regulated by splicing in
leukaemia and neuroblastoma. The alternative splicing of intron 8 of the caspase 8
gene results in the generation of caspase-8L, which lacks the catalytic site (Miller,
Karacay et al. 2006).
An increase in the ratio of anti- to pro-apoptotic Bcl-2 proteins has been
detected in a number of cancers and has been related to tumour cell survival and
apoptosis resistance. For example, overexpression of BCL-2 is a key feature of
human follicular lymphoma and is caused by the chromosomal transclocation of the
BCL-2 oncogene into the immunoglobulin heavy chain gene locus (Tsujimoto, Finger
et al. 1984).
1.2.6 Telomere Length – Limitless Replication
Telomeres are long stretches of noncoding DNA located at the end of all
eukaryotic chromosomes (Figure 1.4). In vertebrates the telomeres are composed
of simple, repetitive non-coding DNA sequences. In human and mouse the
telomeres contain a six base pair sequence TTAGGG, repeated many thousands of
times. However, the length of the telomere varies from one chromosome to
another. The telomere length also varies greatly between species, from
approximately 300 to 600 bp in yeast (Shampay, Szostak et al. 1984) to kilo bases in
humans.
The discovery of chromosomal integrity was proposed by Barbara
McClintock in 1941. She studies the telomeres in chromosomes from the maize
plants. She proposed that if the chromosomes ends were broken by various means,

Chapter 1 – Introduction
15
then it resulted in adhesion and fusion of their ends, with the consequent
formation of dicentric chromosomes (McClintock 1941).
Figure 1.4: Telomeres located at the ends of all eukaryotic chromosomes.
The telomere repeats (TTAGGG)n are present at the ends of all eukaryotic chromosomes.
These telomeres shorten after each cell division.
Two years previous to this finding a young American geneticist Hermann J.
Muller noticed that the ends of the irradiated chromosomes were different to other
genome and could not recover terminal deletions from the Drosophila chromosome
ends. He suggested that the chromosome ends are specialised structures and
TTAGGG TTAGGG TTAGGG TTAGGG TTAGGG (TTAGGG) n
AATCCC AATCCC AATCCC
Telomere
Telomere
Centromere
Telomere DNA repeats

Chapter 1 – Introduction
16
named them Telomeres from a Greek term “telos” (End) “meros” (Part)(Greider
1996).
A number of scientists have used molecular techniques to confirm the initial
finding by McClintock, that telomeres are essential for chromosome stability. In
addition to this finding it has also been shown that telomeres have many other
critical functions such as:
Telomeres also participate in nuclear processes such as chromosome
positioning in the nucleus (Ferguson and Fangman 1992; Brewer and
Fangman 1993; Luderus, van Steensel et al. 1996).
Regulation of gene expression and transcriptional repression (Sandell and
Zakian 1993).
Cellular senescence (Holt, Wright et al. 1996; Shay and Wright 2005).
The inability of the conventional DNA polymerase to replicate to the end of the
chromosome during lagging strand synthesis results in 50-200 base pairs to be lost
from the end of the linear chromosome, during each cell division (Hastie, Dempster
et al. 1990; Lindsey, McGill et al. 1991). This telomere shortening occurs because
during DNA replication, the DNA polymerase synthesis DNA in the 5’ to 3’ direction
with the aid of RNA primers. The leading strand is synthesised continuously and the
lagging strand to be synthesised discontinuously. The RNA primers are degraded by
RNase H and the Okazaki fragments are ligated with DNA ligase. However this
process leaves the 3’ end of the chromosome as a single stranded DNA, called “end
replication problem” (Olovnikov 1973). If the 3’ end is incompletely replicated, the

Chapter 1 – Introduction
17
single-strand DNA is unstable, and this leads to the loss of telomere repeats after
each replication (Weng, Palmer et al. 1997).
Therefore telomeres have an important role to play to protect the
chromosomes from erosion. A study by Olovnikov in 1972 showed that erosion of
the chromosome ends lead to the loss of essential genes and an exit from the cell
cycle (Olovnikov 1973). In 1990 it was demonstrated by Harley, C.B, et al , that
telomere shortening accounts for the process of a ‘cellular ageing’ (Harley, Futcher
et al. 1990).
The telomere shortening happens with age or with cell division. It also occurs in
other types of somatic cells including hematopoietic stem cells, leukocytes,
endothelial cells (Harley, Futcher et al. 1990; Hastie, Dempster et al. 1990; Lindsey,
McGill et al. 1991; Chang and Harley 1995). However in contrast, the germ line and
malignant cells do not appear to undergo telomere shortening with cell division
(Allsopp, Vaziri et al. 1992). Earlier studies also demonstrated that a significantly
shorter telomere length in most cancers compared with noncancerous tissue from
the same patient (Hastie, Dempster et al. 1990). This suggests that human cancers
and germ line cells have developed a mechanism to overcome the telomere loss
during cell division.
1.2.6.1 Telomerase
The telomere stabilisation is achieved by reactivation or upregulation of the
ribonucleoprotein enzyme telomerase (Greider and Blackburn 1989). Telomerase is
an RNA-dependent DNA polymerase, which utilises its RNA as a template for the

Chapter 1 – Introduction
18
addition of TTAGGG repeats to the 3’ ends of the chromosomes, therefore
compensating for losses due to the end-replication problems. It was first discovered
in Tetrahymena by Elizabeth Blackburn and Carol Greider (Greider and Blackburn
1985).
Initially it has been proposed that telomerase is expressed in germ-line and
malignant cells but not in most somatic cells (Wright, Piatyszek et al. 1996), based
on the immortality of the germ-line and of malignant cells (de Lange 1994).
However a number of studies then indicated that telomerase activity is also
detected in normal somatic cells that have the potential to self-renew themselves,
such as hematopoietic stem cells (Morrison, Prowse et al. 1996), lymphocytes
(Weng, Levine et al. 1996; Weng, Granger et al. 1997; Hathcock, Weng et al. 1998;
Weng 2002) and skin epithelial cells (Harle-Bachor and Boukamp 1996).
One of the hallmarks proposed by Hanahan and Weinberg in 2000 was the
limitless replication potential of a cancer cells. Studies have found that cancer cells
have shorter telomere length due to their capability of intense cell proliferation,
however this short telomere lengths is maintained with the activation of
telomerase enzyme. This was supported by Shay and Bacchetti, who observed an
increase in telomerase activity in majority of human cancers (Shay and Bacchetti
1997).
1.2.7 Inflammation and Cancer
A decade after the proposal of hallmarks of cancer by Hanahan and
Weinberg, they proposed to include two more hallmarks of cancer, with enabling

Chapter 1 – Introduction
19
characteristics of tumour promoting inflammation and genome instability and
mutation (Hanahan and Weinberg 2011).
Inflammation is a physiological process in response to tissue damage
resulting from microbial pathogen infection, chemical irritation, and/or wounding
(Philip, Rowley et al. 2004). In the initial stages of inflammation the neutrophils are
the first to migrate to the inflammatory site under the regulation of the molecules
produced rapidly responding macrophages and mast cells in tissues (Nathan 2002).
As inflammation progresses, various types of leukocytes, lymphocytes and other
inflammatory cells are activated and attracted to the inflamed site by a signalling
network involving a great number of growth factors, cytokines, and chemokines
(Nathan 2002).
There are also control mechanism in place that prevent inflammation, a
number of molecules in the body play dual roles of both promoting and suppressing
inflammation, such as transforming growth factor-β (Lu, Ouyang et al. 2006). The
balance between promoting and suppressing inflammation is strictly regulated, if
however the inflammation process is dysregulated and becomes favoured towards
promoting inflammation, then the cellular response changes to the pattern of
chronic inflammation.
However the link between inflammation and cancer was observed as early
as 1863 by Virchow, who indicated that cancers tended to occur at sites of chronic
inflammation (Balkwill and Mantovani 2001). Epidemiologic studies have also
supported that chronic inflammatory diseases are frequently associated with
increased risk of cancers (Lu, Ouyang et al. 2006). The development of cancers from
Chapter 1 – Introduction
20
inflammation might be a process driven by inflammatory cells as well as a variety of
mediators, including cytokines, chemokines, and enzymes, which altogether
established an inflammatory microenvironment (Coussens and Werb 2002).
Cytokines, including interleukins (IL), TNF-α, growth factors, and
differentiation factors (co-stimulating factors), are secreted molecules or
membrane-bound molecules that play a regulatory role in the growth,
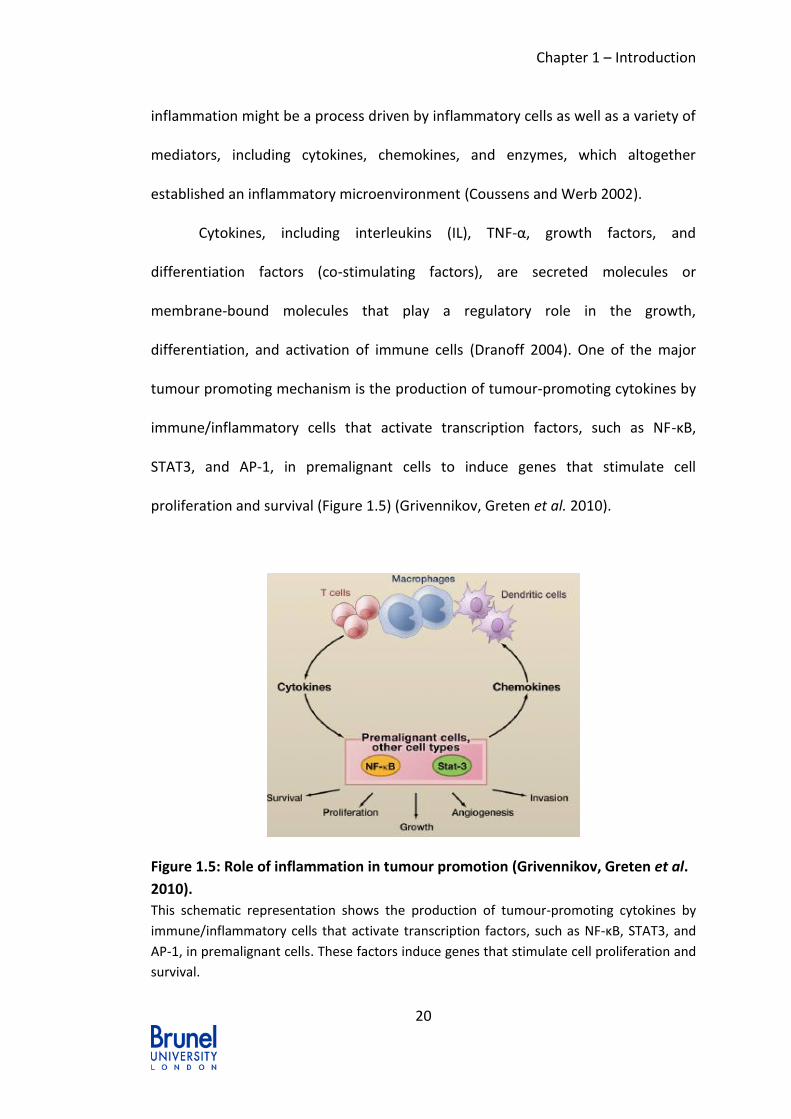
differentiation, and activation of immune cells (Dranoff 2004). One of the major
tumour promoting mechanism is the production of tumour-promoting cytokines by
immune/inflammatory cells that activate transcription factors, such as NF-κB,
STAT3, and AP-1, in premalignant cells to induce genes that stimulate cell
proliferation and survival (Figure 1.5) (Grivennikov, Greten et al. 2010).
Figure 1.5: Role of inflammation in tumour promotion (Grivennikov, Greten et al.
2010).
This schematic representation shows the production of tumour-promoting cytokines by
immune/inflammatory cells that activate transcription factors, such as NF-κB, STAT3, and
AP-1, in premalignant cells. These factors induce genes that stimulate cell proliferation and
survival.

Chapter 1 – Introduction
21
Among these transcription factors, NF-κB and STAT3 are activated in the
majority of cancers and act as oncogenes, whose activation in malignant cells is
rarely the result of direct mutations and instead depend on signals produced by
neighbouring cells, such as IL-6, IL-10 and IL-23 (Yu, Pardoll et al. 2009).
Proteins from the STAT family can both inhibit and promote cancer. Anti-
tumour responses are increased by the activation of STAT1, which induces IL-12
production leading to the activation of STAT4 by IL-12 receptor engagement,
promoting Th1 responses to produce IFN-γ. IFN-γ stimulate macrophages, natural
killer cells and CD8+ T cells, mediating cytolytic activity (Darnell 1998; Takeda and
Akira 2000; Chang, Han et al. 2009) (Figure 1.6).
Figure 1.6: The role of STAT proteins in regulation of cancer adaptive immunity
(Yu, Pardoll et al. 2009)
The STAT family can both inhibit and promote cancer. The activation of STAT1 in T cells
produces IFN-γ, which stimulate macrophages, natural killer cells and CD8+ T cells,
mediating cytolytic activity. However, STAT3 has the ability to inhibit STAT1 and promote
tumour progression.

Chapter 1 – Introduction
22
However, STAT3 has the ability to antagonise STAT1 (Kortylewski, Kujawski
et al. 2005). Both STAT3 and STAT5 are involved in the expansion of T regulatory
cells, which promote tumour progression by inhibiting anti-tumour immune
responses that are mediated by Th1 type CD4+ T cells and CD8+ T cells (Figure 1.6)
(Kubo, Hanada et al. 2003).
A number of literature publications have associated chronic inflammatory
conditions with lymphoid malignancies, one example is provided by mucosa-
associated lymphoid tissue (MALT) lymphomas. MALT lymphoma occurs in the
context of chronic inflammation caused by infectious agents such as Helicobacter
pylori, Borrelia burgdorferi (Ferreri, Ernberg et al. 2009). Other studies have also
shown an increase risk of cancer development in patients with systemic lupus
erythematosus, a systemic autoimmune disease with chronic inflammation and
tissue damage (Pettersson, Pukkala et al. 1992). Association is also been recorded
in other autoimmune disease and Non-Hodgkin’s lymphoma, such as Burkit
lymphoma occurs in only X-linked lymphproliferation, T-cell tumours occur in
ataxia-telangiectasia and Diffuse large B-cell lymphomas occur in rheumatoid
arthritis (Baecklund, Iliadou et al. 2006; Grulich, Vajdic et al. 2007).

Chapter 1 – Introduction
23
1.3 Lymphoma
Lymphoma is defined as a cancer in the lymphatic system. Lymphoma is a
solid tumour of the lymphoid cells. It represents about 4% of the new cases of
malignant disorders diagnosed in the UK and US each year, making it the fifth most
common cancer diagnosed and is the cause of malignant disorder death (Jemal,
Tiwari et al. 2004; Illes, Varoczy et al. 2009; CancerResearch 2011). The incidence of
most malignant disorders is decreasing, whereas the lymphomas are increasing in
frequency; the cause of this is unknown as the classification of lymphoma is difficult
due to its diverse group of malignant diseases that vary in immunophenotype,
genotype, clinical presentation, treatment and prognosis (Illes, Varoczy et al. 2009).
The World Health Organisation (WHO) have classified lymphoma on the
basis of morphology, immunophenotype, genetic features, clinical features, and a
normal counterpart cell is hypothesised for each cancer (Jaffe 2009; Ishida and
Ueda 2011)
There are two types of lymphoma; Hodgkin’s lymphoma (HL) and non-
Hodgkin’s lymphoma (NHL). There are more than 35 types of lymphoma, of which,
30 are classified as non-Hodgkin’s lymphoma.
1.3.1 Non-Hodgkin’s Lymphoma (NHL)
Over the years the understanding of genetic abnormalities has improved.
The classification of NHL has steadily evolved as the understanding of the biology of
the immune system has advanced (Harris, Jaffe et al. 1994; Armitage 2005; Vose

Chapter 1 – Introduction
24
2008; Jaffe 2009). This has led to the development of the WHO classification of
lymphoma. The WHO classification is presented in Table 1.4. It subdivides tumours
into B cells and T/NK- cell origin and those with an immature or blastic appearance
compared to those that are developing from more mature stages of lymphoid
development (Armitage 2005).
Table 1.4: World Health Organisation Classification of Lymphoid Neoplasms
(Armitage 2005)

Chapter 1 – Introduction
25
1.4 Immune System
The immune system is the body’s defence system against infections caused
by pathogenic microorganisms and viruses. The immune system is a critical system
within the body and this is demonstrated by the severity of the
immunodeficiencies, hence the complex array of protective mechanisms to control
and eliminate the foreign bodies. The immune system defence is provided in two
ways; innate and adaptive system. The innate immune system provides a generic
and an immediate defence against a toxin or a pathogen, whereas the adaptive
immune system manifests exquisite specificity for its target antigens. Even though
the innate and adaptive immune systems are described as contrasting separate
arms, they generally act together (Chaplin 2010).
The adaptive immunity also plays an important role in immunologic memory
and the capacity for the rapid response in the event of re-exposure. The vital cells
of the adaptive immune system include the effectors of cellular immune responses,
the T lymphocytes and B lymphocytes (will be referred to as T cell or B cell), which
are highly mobile. The characteristic of the adaptive immunity is the use of antigen
specific receptors on T and B cell to initiate targeted effector responses in two
stages. Firstly the antigen is presented to and recognised by the antigen specific T
or B lymphocyte leading to cell priming, activation, and differentiation, all of which
is carried out within the lymphoid tissues. This is followed by the second effector
response, which takes place either due to the activated T cell or due to the release
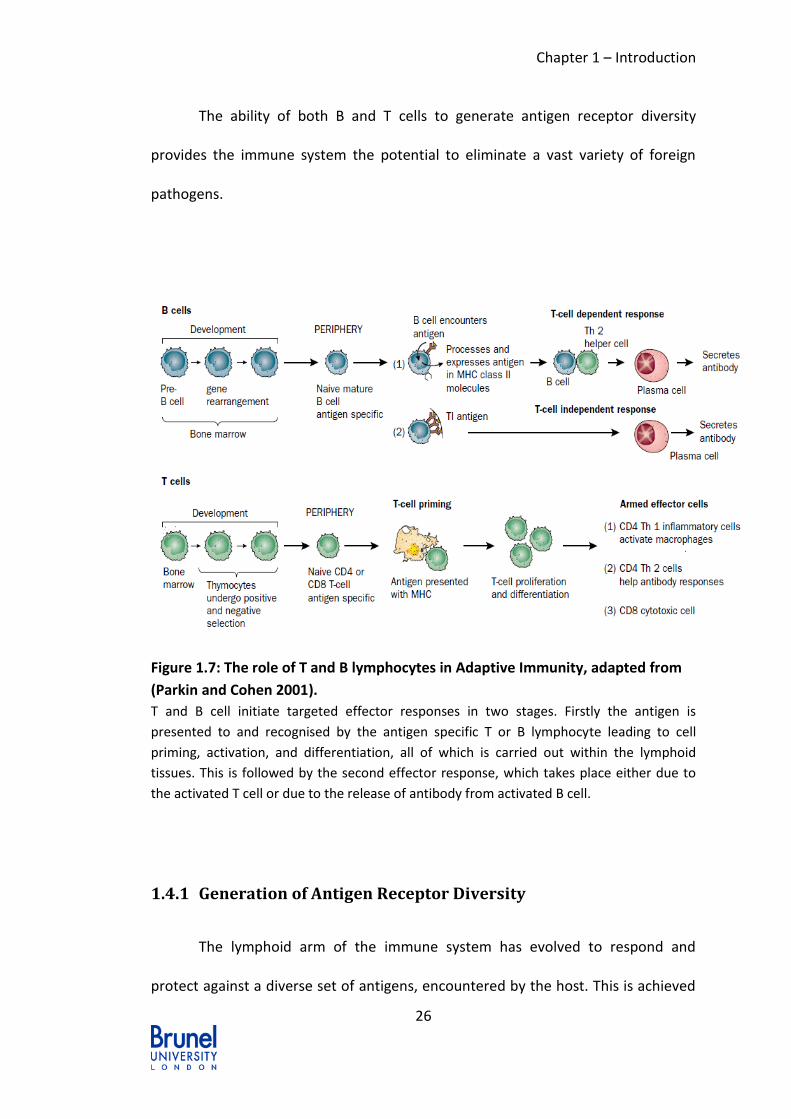
of antibody from activated B cell (Figure 1.7) (Parkin and Cohen 2001).
Chapter 1 – Introduction
26
The ability of both B and T cells to generate antigen receptor diversity
provides the immune system the potential to eliminate a vast variety of foreign
pathogens.
Figure 1.7: The role of T and B lymphocytes in Adaptive Immunity, adapted from
(Parkin and Cohen 2001).
T and B cell initiate targeted effector responses in two stages. Firstly the antigen is
presented to and recognised by the antigen specific T or B lymphocyte leading to cell
priming, activation, and differentiation, all of which is carried out within the lymphoid
tissues. This is followed by the second effector response, which takes place either due to
the activated T cell or due to the release of antibody from activated B cell.
1.4.1 Generation of Antigen Receptor Diversity
The lymphoid arm of the immune system has evolved to respond and
protect against a diverse set of antigens, encountered by the host. This is achieved

Chapter 1 – Introduction
27
by the limitless diversity of antigen receptors. The generation of unique receptor
type for each cell occurs during the development process of both B and T cells. The
DNA sequences that present antigen specificity to these B cell receptors (BCRs) and
T cell receptors (TCRs) are assembled at seven different loci (three for the BCR; one
immunoglobulin heavy chain plus a κ or λ light chain; four for the TCR [α, β, γ and
δ]) (Cedar and Bergman 1999). The generation of the antigen-binding diversity is
assembled at the variable domain exons of the antigen receptors expressed on B
and T cells, which are generated via somatic assembly of component variable (V),
diversity (D), and joining (J) gene segments in a process called V(D)J recombination
(Lieber 1991).
V(D)J recombination is a site-specific recombination process, which is
directed by recombination signal sequences (RSS). Each RSS consists of a conserved
heptmer and nonamer sequences, with respective consensus sequences of
CACAGTG and ACAAAAACC, separated by intervening spacer sequence that is either
12bp or 23bp in length (van Gent, Ramsden et al. 1996). The V(D)J recombination
process is initiated by the recombination activating genes 1 and 2 (RAGs) proteins,
which induces double-strand breaks (DSB) between the RSS and variable region
gene-coding segment (Jung and Alt 2004). The DSB are repaired by ubiquitously
expressed nonhomologous end joining (NHEJ) proteins, forming precise signal and
joints and imprecise coding end joints (Bassing, Swat et al. 2002).

Chapter 1 – Introduction
28
1.4.2 Lymphoid Haematopoiesis
Both T and B cells, which are like all leukocytes, are derived from pluripotent
hematopoietic stem cells (HSC), within the bone marrow. HSCs are defined as
primitive cells which are capable of both self-renewal and differentiation into any of
the hematopoietic cell lineages (Oguro and Iwama 2007). Once the HSCs receive a
signal to undergo differentiation, the first biological change in the HSCs is the
gradual loss of self-renewal; hence onwards the developmental sequence begins. It
is the specialised microenvironment of the bone marrow that provides the signals
both for the development of the lymphocytes progenitors from hematopoietic stem
cells and for the further differentiation of the B cells. These signals regulate the
expression of key genes that direct the control the development program.
The HSCs first differentiate into multipotent progenitors cells (MPPs), which
have the ability to produce both myeloid and lymphoid cells. These cells express a
cell surface receptor tryrosine kinase (also known as FLT3), which is required for the
cells to differentiate to the next stage as either common lymphoid progenitors
(CLP) or Common Myeloid progenitors (CMP). The stromal cells provide the FLT3
ligand to the FLT3 receptor to signal the MMP cells to differentiate into CLP. The
progenitor cells can differentiation into any leukocyte, which can be separated into
two major lineages: the lymphoid lineage, which includes the T, B, and natural killer
(NK) cells. The second myeloid lineage is comprised of erythrocytes,
megakaryocytes, granulocytes, and monocytes/macrophages (Lai and Kondo 2008;
Slavov, Gimenes Teixeira et al. 2010).

Chapter 1 – Introduction
29
The process by which lymphocytes are developed is named lymphopoiesis
or otherwise formally called lymphoid haematopoiesis.
1.5 B Lymphocyte Development
In mouse, B cells are generated from pluripotent HSCs in the liver during
mid-to-late foetal development and in the bone marrow after birth (hence the
name B cells) (Hardy and Hayakawa 2001). In the mid- 1960s B cells, were
discovered and characterised with the aid of experimental animal models, clinical
evaluation of patients with immunodeficiency diseases and the characterization of
cell surface molecule (Good and Zak 1956). During lymphocyte development, cells
first become committed to the lymphoid, opposed to the myeloid, lineage and then
to either B or T cell lineages. In mice the development of B cells initiates with the
stromal cells secreting the cytokine IL-7, which is essential for the growth and
survival of developing B-lineage cells (Ray, Stoddart et al. 1998).
The B cell development rise from the common lymphoid progenitor, and
differentiate during a number of different stages, the earliest being pro-B cells,
followed by late pro-B cells, large pre-B cell, small pre-B cell, and eventually the
mature B cells (Figure 1.8). As mentioned previously the generation of unique and
diverse antigen receptors (in B cells known as the immunoglobulin) for each B cell
occurs during these developmental stages by DNA recombination. The VH, DH, and
JH, rearrangement of the heavy chain (H-chain) together with VL-JL rearrangement
Chapter 1 – Introduction
30
of the light chain (L-chain) gene segments generate a B cell repertoire expressing
antibodies.
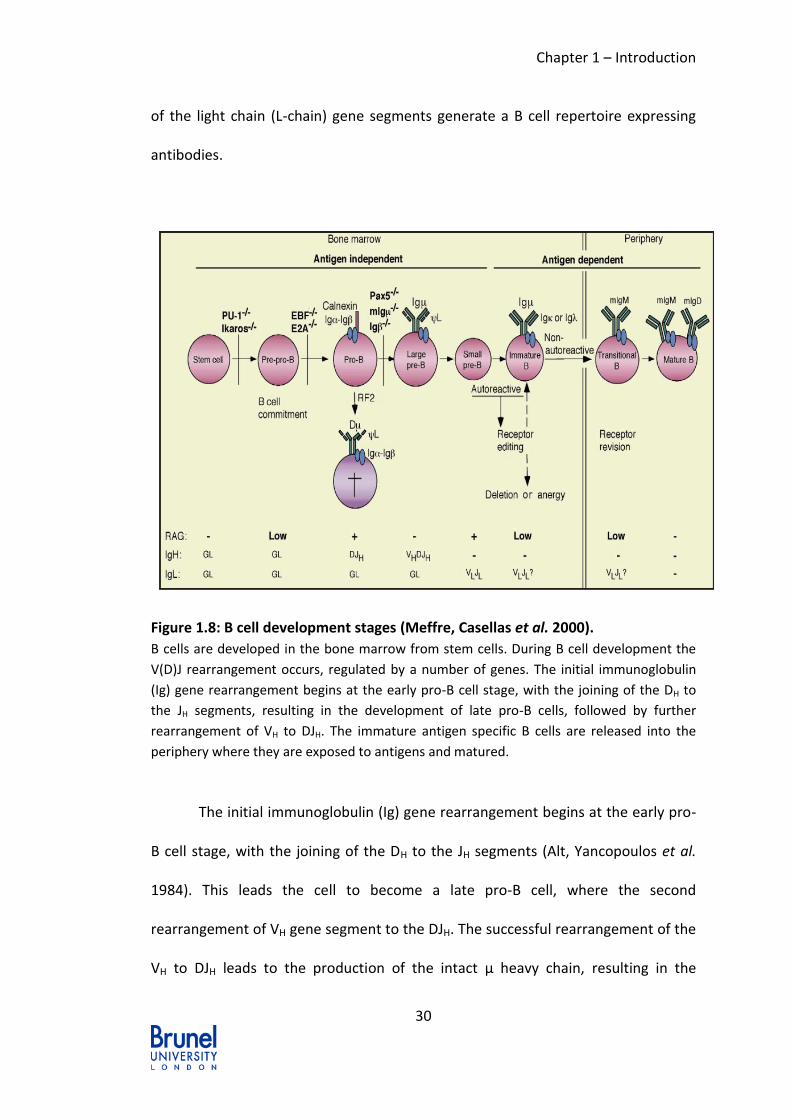
Figure 1.8: B cell development stages (Meffre, Casellas et al. 2000).
B cells are developed in the bone marrow from stem cells. During B cell development the
V(D)J rearrangement occurs, regulated by a number of genes. The initial immunoglobulin
(Ig) gene rearrangement begins at the early pro-B cell stage, with the joining of the DH to
the JH segments, resulting in the development of late pro-B cells, followed by further
rearrangement of VH to DJH. The immature antigen specific B cells are released into the
periphery where they are exposed to antigens and matured.
The initial immunoglobulin (Ig) gene rearrangement begins at the early pro-
B cell stage, with the joining of the DH to the JH segments (Alt, Yancopoulos et al.
1984). This leads the cell to become a late pro-B cell, where the second
rearrangement of VH gene segment to the DJH. The successful rearrangement of the
VH to DJH leads to the production of the intact µ heavy chain, resulting in the

Chapter 1 – Introduction
31
expression of Igµ chain in complex with the surrogate light chain (consisting of λ5
and VpreB chains). The Igµ chain is also associated with two other proteins chains,
Ig-α (CD79α) and Ig-β (CD79β). The immunoglobulin-like complex is known as the
pre-BCR cell receptor (pre-BCR) (Melchers 2005).
The pre-BCR plays a critical role in B cell development as suggested in a
number of studies where deficient mice were created for the components of the
pre-BCR, either the µ heavy chain or the λ5 protein (Kitamura, Roes et al. 1991;
Kitamura, Kudo et al. 1992). In both of the studies B cell development was found to
be severely impaired at the transition from the pro-B cell stage to the large pre-B
cell stage, which resulted in no or poor generation of mature B cells.
The assembly of the pre-BCR mediates a number of signals so that the following
process can be performed (Martensson, Almqvist et al. 2010).
The cellular transition from the large pre-B cell stage to the small pre-B cell
stage.
The Igµ heavy chain allelic exclusion and the down-regulation of the
recombination by deactivating the recombination-activating genes (RAG).
Allelic exclusion is a process that ensures when one of the two µ heavy chain
alleles has achieved a functional rearrangement at the pro-B cell stage and
produced the Igµ heavy chain the V(D)J rearrangement at the other allele is
inhibited to avoid the generation of B cells with double specificity and a B cell
expressing a unique B cell receptor with monospecificity (Karasuyama, Nakamura et
Chapter 1 – Introduction
32
al. 1997). It has been demonstrated that the expression of RAG-1 and RAG-2 genes
was down-regulated in the large pre-B cells (Grawunder, Leu et al. 1995). In
contrast, the expression of RAG-1 and RAG-2 were highly expressed in pro-B cells
and small pre-B cells, where the rearrangement of the heavy chain and the light
chain occurs, respectively.
As cells transit from large pre-B cell stage to small pre-B cell stage, the pre-BCR
induces signals for proliferation expansion of large pre-B cells, which undergo two
to five rounds of cell division (Rolink, Winkler et al. 2000).
As the cells transit into small pre-B cells the expression of RAG1 and RAG2 genes
is induced, resulting in the rearrangement of the light chain locus, expanding the
population of the cells with a successful IgH chain, ultimately resulting in a more
diverse antibody repertoire, which later in development will recombine with and
express a unique light chain.
In line with the monospecificity of the heavy chain, the light chains are also
enforced with allelic exclusion. The rearrangement at the light chain does not
include the D segment, only joining the V to J segment. Like the heavy chain the
rearrangement is initiated on only one allele, of which if the VJ rearrangement fails
to produce a functional light chain, then the rearrangement is repeated on the
other allele. As well as allelic exclusion, light chains also undergo isotypic exclusion,
meaning that they express either κ or λ Light chain. However, the expression of κ or
λ is not represented equally on the B cells or in the serum Ig (Chen, Trounstine et al.
1993).
Chapter 1 – Introduction
33
The successfully rearranged light chain goes on to pair with the Igµ chain, which
transforms the cells from small pre-B cells to immature B cells. Immature B cells are
the first B lineage cells that express BCRs, they display surface IgM (Meffre, Casellas
et al. 2000). The immature B cells are positively and negatively selected based on
their antigen specificity and migrate from the bone marrow to the secondary
lymphoid organ, spleen and lymph nodes.
1.5.1 B cell maturation and subset development
Loder, et al (1999) was first to refer Immature B cells as “transitional” (T1
and T2) based on their phenotype and ontogeny and were characterised primarily
in the mouse (Chung, Silverman et al. 2003) and since then a number of groups
have confirmed and further characterised the distinct subsets. The early transitional
B cells exit the bone marrow and enter the peripheral circulation. On arriving in the
spleen, the cells pass through a series of transitional stages prior to developing into
mature follicular(FO), marginal zone (MZ) or B-1 B cells (Allman and Pillai 2008)
(Figure 1.9).

Chapter 1 – Introduction
34
Figure 1.9: Characteristics of the three peripheral B cell subsets (Pillai, Cariappa et
al. 2004).
Mature FO B cells are always found adjacent to T cell zones. This
arrangement allows activated FO B cells and activated T helper cells to migrate
towards each other and interact. Therefore FO B cells participate in T cell-
dependent germinal centre-based immune responses to protein antigens. FO B cells
also occupy a second niche; they also recirculate through the bone marrow and are
known to respond to T cell-independent manner to blood borne pathogens (Pillai
and Cariappa 2009).
In contrast to FO B cells, MZ and B-1 B cells respond in a T cell-independent
manner and can develop into antibody producing plasma cells upon antigen-
stimulation (MacLennan, Toellner et al. 2003). MZ B cells are considered to be like
innate-like cells that can be induced to differentiate into short lived plasma cells in
the absence of BCR ligation (Allman and Pillai 2008). B-1 B cells are the majority B
cell subpopulation in pleural and peritoneal cavities (Baumgarth 2011).

Chapter 1 – Introduction
35
1.5.2 B cell Tolerance
The development and the maturation process of B cells are tightly regulated
by testing the antigen receptor for tolerance to a self-antigen. There are two
processes of B cell tolerance; central tolerance, where the antigen receptor of the
immature B cell is tested in the bone marrow. The second process is peripheral
tolerance, where self-reactive B cells have escaped the central tolerance and
become mature B cells; hence the name peripheral tolerance as the process occurs
in the secondary lymph node organs.
Understanding the tolerance mechanisms and the identification of the
developmental stages of B cell tolerance has been difficult. But the recent
availability of transgenic mice in which majority of lymphocytes express an immune
receptor against a given antigen has enabled the identification of several
mechanisms.
1.5.2.1 Clonal Deletion
During the B cell development, the immune system generates potentially
harmful self-reactive B cells that must be distinguished from useful lymphocytes.
These self-reactive B cells are eliminated from functional repertoire during the
transition from the pre-B to mature B-cell stage in the bone marrow, even low-
affinity interactions can lead to central deletion (Nemazee and Burki 1989; Chen,
Nagy et al. 1995), by the process of BCR ligation.

Chapter 1 – Introduction
36
1.5.2.2 Clonal Anergy
Clonal anergy was first proposed in the 1980s by Pike and Nossal, when they
found that B-cell precursors cultures with high levels of antibody against surface
IgM impeded any B-cell development (Pike, Boyd et al. 1982). Anergic lymphocytes
persist in tolerant animals, but are functionally inactivated. Goodnow group
demonstrated clonal anergy in vivo using transgenic B-cell receptor (BCR) against
hen-egg lysozyme (HEL). They found that when these mice were crossed with mice
expressing a soluble form of HEL, the transgenic B cells became Anergic (Goodnow,
Crosbie et al. 1988).
1.5.2.3 Receptor Editing
Although many self-specific B cells undergo clonal deletion, some of them
can undergo further somatic recombination to make new VH and VL combination
that are not specific, which is known as receptor editing. The ability of receptor
editing to rescue some self-specific B cells by changing their specificity was
demonstrated by the Nemazee and Weigert groups, with the aid of mice carrying Ig
transgenes encoding self-MHC-specific BCR. They found that total B cell numbers
were greatly reduced in the periphery, but of these few B cells that were produced
in the mice were not self-specific because they have been able to make new
recombination of both heavy and light chains in the V region (Gay, Saunders et al.
1993; Tiegs, Russell et al. 1993).

Chapter 1 – Introduction
37
1.5.3 Homeostatic proliferation of B cells
When B cells emerge from bone marrow into the periphery, they are still
functionally immature. Due to the high expression levels of surface IgM and low
levels of IgD, not many immature B cells survive to develop into mature B cells,
however majority of peripheral B cells are long-lived (Gaudin, Rosado et al. 2004).
The failure of most of the newly formed B cells to survive for more than a few days
is due to the access of follicles in the secondary lymphoid organs. The follicles
cannot accommodate all the B cells that are generated, hence if the new immature
B cells do not enter the follicles, and then they cannot survive due to the
competition for entry. Hence the follicles provide signals necessary for B cell
survival, one particular signal is from B-cell-activating factor (BAFF, also known as
BLyS) belonging to the TNF family (Schneider, MacKay et al. 1999).
BAFF and a proliferating-inducing ligand (APRIL) are related members of the
TNF family. BAFF binds to the BAFF receptor (BAFFR, also known as BR3) with high
affinity. In the absence of BAFF, B cell maturation proceeds normally in the bone
marrow, however splenic B cell are reduced, especially transitional T2, mature and
MZ B cells (Schiemann, Gommerman et al. 2001; Bossen, Tardivel et al. 2011).
Hence BAFF, upon binding to the receptor BR3 enhances survival of semi-mature
and mature B cells and it has been reported that this occurs by promoting
expression of BCL-2 family members (Harless, Lentz et al. 2001). BAFF also mediates
longevity of mature B cells. This was observed when treatment with soluble BAFF
receptors resulted in the rapid loss of most of the mature peripheral B cells (Gross,
Dillon et al. 2001).

Chapter 1 – Introduction
38
Fitness of survival of naïve B cells does not only rely on competitive
processes but are also dictated by BCR specificity. Continuous signalling through B
cell receptor also has a positive role in the maturation and continued recirculation
of peripheral B cells. This is supported by the existence of more restricted
immunoglobulin (Ig) variable region gene repertoire in mature B cells than that
seen in their immature precursors (Levine, Haberman et al. 2000).
1.6 T Cell Development
T cells arise from hematopoietic stem cells that migrate to the thymus
(Starr, Jameson et al. 2003). The thymus is an organ that supports the
differentiation and selection of T cells (Takahama 2006). Figure 1.10 shows the
overall scheme of the T cell development within the thymus.

Chapter 1 – Introduction
39
Figure 1.10: Overall summary of T cell development in the Thymus (Germain
2002).
T cells development occurs in the thymus. The hematopoietic stems cells migrate to the
thymus were they differentiate and mature into specialised T cell.
Lymphoid Progenitors arise in the bone marrow and migrate to the thymus.
In the thymus these cells lose the potential for B cell and natural killer cell
development (Michie, Carlyle et al. 2000). During T cell development in the thymus
the T cell precursors, called thymocytes, lack expression of CD4 and CD8 and are
called double negative (DN). DN thymocytes can be subdivided further into four
sequential stages of differentiation, which are known by their surface expression of

Chapter 1 – Introduction
40
CD44 and CD25: DN1, CD44+CD25-; DN2, CD44+CD25+; DN3, CD44-CD25+; and
DN4;CD44-CD25- (Godfrey, Kennedy et al. 1993). As the cells progress from DN2 to
DN4 stages, they express the pre-T cell receptors (pre-TCR), which is composed of
the non-rearranged surrogate pre-Tα Chain and a rearranged TCR β-chain, forming
a pre-TCR complex (von Boehmer and Fehling 1997). Both TCRα and β genes have
variable (V) and joining (J) segments, while β genes also have diversity (D)
segments. The rearrangement of these genes follows the same mechanism as B cell
developments, with the aid of RAG 1 and RAG 2. Only the cells that succeed in a
functional in-frame rearrangement of the gene encoding the TCR β-chain are
selected for further differentiation beyond this DN3 stage. The selection events are
required to select only those cells that are able to weakly recognise self-MHC
molecules loaded with self-peptide (Michie and Zuniga-Pflucker 2002). The cells
that have a functional β chain and recognise self-peptide/MHC molecules are
termed as β-selection.
1.6.1 Positive Selection and Negative Selection
In the thymus cortex, the successful expression of the pre-TCR complex on
the cell surface, along with Delta-Notch interaction, initiates the signals to progress
the development to double positive (DP) thymocytes that express the TCRαβ
antigen receptors (Takahama 2006). During the transition of DN4 to DP the RAG
proteins expression is switched off and the pre-TCR expression leads to substantial
cell proliferation.

Chapter 1 – Introduction
41
At the DP stage of the thymocyte differentiation, the RAG genes are once
again expressed and the cells will undergo the rearrangement of TCR Vα and Jα,
producing a new rearranged TCRα chain that can pair with the existing rearranged
TCRβ chain, which allows the surface expression of TCRαβ-CD3 complex (Goldrath
and Bevan 1999).
From the large number of DP thymocytes, the ones that are best suited to
function in the host environment are permitted to mature and migrate to
peripheral lymphoid tissues. This selection is characterised by four processes; death
by neglect, Negative selection, positive selection and lineage-specific development
(Figure 1.11) (Germain 2002).
Figure 1.11: Positive selection process, negative selection process and death by
neglect (Takahama 2006)
The double positive (DP) thymocytes undergo both positive and negative selection to
delete any auto-reactive lymphocytes. Those thymocytes that have receptors that bind
strongly to self-antigens are removed by the induction of apoptosis of the auto-reactive
cells.

Chapter 1 – Introduction
42
Death by neglect is initiated when there is too little signalling between the
TCR and the self-peptide-MHC ligands, which result in delayed apoptosis. Too much
signalling can promote acute apoptosis, which is caused in negative selection.
Positive selection occurs when the signalling is at an intermediate level, where TCR
signalling initiates effective maturation (Germain 2002).
Positively selected DP thymocytes are induced to differentiate into single
positive (SP) thymocytes, which are CD4-CD8+ (MHC class I reactive) or CD4+CD8-
(MHC class II reactive) (Hollander and Peterson 2009). These thymocytes spend
approximately 12 days in the medulla before travelling to the thymus. During this
period the SP thymocytes go through a maturation process. This is accompanied by
further deletion of self-reactive thymocytes that have escaped negative selection in
the cortex. This process is particularly important in central tolerance to tissue
specific antigens (Kyewski and Derbinski 2004).
As well as the deletion mechanism that ensures self-tolerance, it is also
thought that the medulla is the place for the production of regulatory T cells (Treg)
(Takahama 2006). Treg cells have emerged to play a critical role in suppressing the
response of the immune system to self-antigen (Kuhn, Beissert et al. 2009).
1.6.2 T cell Maturation and T Cell Tolerance
After completing their maturation in the thymus, the T cells migrate to the
periphery. Although these T cells are mature, they are termed immunologically
naïve T cells, as they have not been activated in the periphery. Naïve T cells express
molecules such as CD62L (Gallatin, Weissman et al. 1983; Resino, Navarro et al.

Chapter 1 – Introduction
43
2001) that enables their circulation through the blood and secondary lymphoid
organs such as lymph nodes and the white pulp area of the spleen. During the
circulation it enables them to come in contact with thousands of antigen presenting
cells (APC) in the lymphoid tissues and interact with peptides on MHC-molecule.
APC are cells that present antigen peptide associated MHC molecule to inactivate T
cells and activate them for the first time, such as macrophages, dendritic cells and B
cells.
The level of stimulation that the T cell receives upon contact with the APC
presenting peptide-MHC molecules governs the response of that T cell. Only those
T cells that bind and receive a strong signal upon interaction with an APCbecome
activated and induce an immune response.
The outcome of a T cell response to antigen stimulation is regulated by the
interplay and complex interaction of positive (stimulatory) and negative (inhibitory)
pathways (Zhu, Symonds et al. 2008). It is important that there is some mechanism
to prevent auto reactivity of the T cells after they have emigrated from the thymus.
This is achieved through the T cell tolerance process (Figure 1.12). Although most of
the self-reactive T cells are eliminated in the thymus, negative selection has
limitations and additional mechanisms of tolerance are required to limit
autoimmunity (Bandyopadhyay, Soto-Nieves et al. 2007).

Chapter 1 – Introduction
44
Figure 1.12: Pathways to tolerance (Walker and Abbas 2002).
T cells undergo both central tolerance and periphery tolerance. A few self-reactive T cells
escape the central tolerance and leave the thymus, in the periphery they go through
further selection and auto-reactive T cells are removed.
1.6.3 T cell activation
T cell activation is initiated by the interaction of the TCR-CD3 complex with
an antigenic peptide bound to either MHC class I or class II molecules on the
surface of APC. However this interaction alone does not activate the T cells. A
further two signal are required for the T cells to be activated once they come in
contact with the APC, a co-stimulatory molecule, such as CD28 and cytokines that
trigger the rapid growth and proliferation of effector T cells and are thought to
increase the cytotoxic effects of the CD8+ T cells (Figure 1.13).
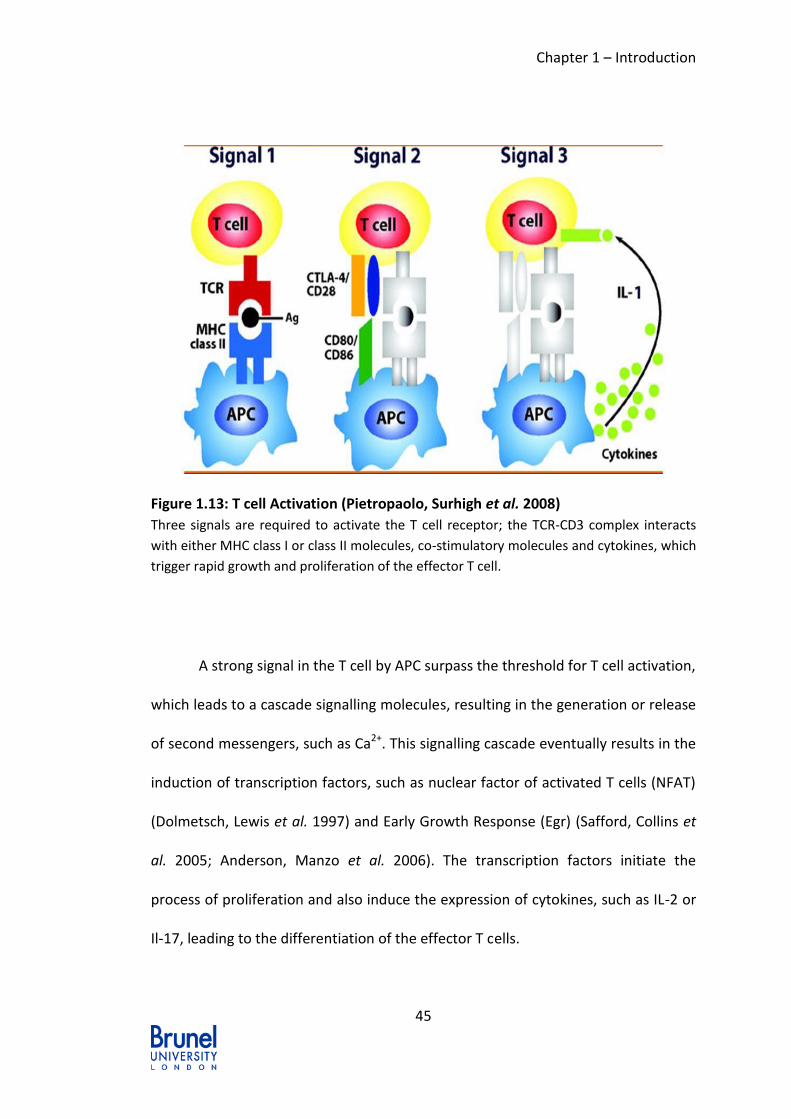
Chapter 1 – Introduction
45
Figure 1.13: T cell Activation (Pietropaolo, Surhigh et al. 2008)
Three signals are required to activate the T cell receptor; the TCR-CD3 complex interacts
with either MHC class I or class II molecules, co-stimulatory molecules and cytokines, which
trigger rapid growth and proliferation of the effector T cell.
A strong signal in the T cell by APC surpass the threshold for T cell activation,
which leads to a cascade signalling molecules, resulting in the generation or release
of second messengers, such as Ca2+. This signalling cascade eventually results in the
induction of transcription factors, such as nuclear factor of activated T cells (NFAT)
(Dolmetsch, Lewis et al. 1997) and Early Growth Response (Egr) (Safford, Collins et
al. 2005; Anderson, Manzo et al. 2006). The transcription factors initiate the
process of proliferation and also induce the expression of cytokines, such as IL-2 or
Il-17, leading to the differentiation of the effector T cells.

Chapter 1 – Introduction
46
On antigen recognition, naïve T cells differentiation from naive T cells into effector
T cells with enhanced functional (Wan and Flavell 2009). Based on the cytokines
produced these effector cells can be classified into different groups with specialised
functions (Table 1.5).
Cytokine Produced T cell Type Function
IFN-γ and IL-2 TH1 Macrophages activating effector
cell. Cell-mediated immunity
IL-4 and IL-5 TH2 Activation of B cells.
IL-17 and IL-6 TH17 Promote acute inflammation by
neutrophil recruitment
TGF-β and IL-10 Treg Produce inhibitory cytokines.
Involved in tolerance.
Table 1.5: T cell effector subsets and function adapted from (Zhu and Paul 2008)
After the effector cells have cleared the infection the majority of the
responding effector T cells die, but a small cohort of cells remains for long-term
protection. These cells, are termed memory cells, and can respond more rapidly
than naïve T cells upon re-exposure to the same antigen in vivo (Sallusto, Lenig et
al. 1999; Veiga-Fernandes, Walter et al. 2000).
Chapter 1 – Introduction
47
1.6.4 T Cell Homeostasis
T cell production and survival are tightly constrained by competition for
cytokines and self-peptide MHC ligands. Such competition allows the size of T cell
population to increase gradually during young life and then declines progressively
with age (Sprent, Cho et al. 2008). Throughout this period the cellularity of the
spleen and lymph nodes remains relatively constant (Surh and Sprent 2008), T cell
homeostasis is the mechanism that exists to serve the maintenance of T cell
number and cell survival. Homeostatic processes are vitally involved in T cell
development, survival, and maintenance, as well as following antigen-driven
responses (Boyman, Letourneau et al. 2009). The homeostasis of naïve and memory
T cells is maintained differently. In the case of naïve T cells, prolonged survival of
these cells in interphase is dependent on a combination of transform TCR signalling
from interaction with self-peptide MHC ligands plus interaction with IL-7 and to a
lesser degree with IL-15. In contrast, most of the memory T cells are MHC
independent but rely heavily on contact with a mixture of IL-7 for cell survival and
IL-15 for cell proliferation (Surh and Sprent 2008).
As mentioned post-thymic naïve T cells depend on contact with IL-7 and
self-peptide MHC molecules for their homeostatic survival. Homeostatic
proliferation caused by the combination of IL-7 and Self-peptide MHC molecule
continues at a slow rate and is readily detected for naïve CD4+ and CD8+ T cells
upon adoptive transfer into syngeneic normal hosted that have been made acutely
lymphopenic by irradiation, known as lymphopenia-induced proliferation (LIP) (Tan,

Chapter 1 – Introduction
48
Dudl et al. 2001). In addition to LIP, naïve T cells can also proliferate in non-
lymphopenic animals by increasing the intensity of IL-7 signals, using IL-7/anti-IL7
mAb complexes. These complexes induce slow proliferation of the naïve T cells,
particularly CD8+ cells (Boyman, Ramsey et al. 2008). Interestingly when naïve T
cells are stimulated with other members from γc cytokines, such as IL-2 and IL-15,
they undergo rapid proliferation. A Group performed adaptive transfer of naïve
CD8+ T cells to IL-2Rβ-deficient hosts (they contain elevated levels of IL-2 and
possibly IL-15). This led to rapid proliferation and differentiation of the donor T cells
into effector T cells followed by the production of memory cells (Cho, Boyman et al.
2007). The cytokines and the self-peptide MHC molecules are not the only factors
involved in the homeostasis of naïve T cells, as evidence has shown TCR signals are
also necessary. The initial prospect used to be that naïve T cells did not recognise
self-peptide-MHC ligands in the periphery. However, recently several groups have
shown that MHC molecules are important in maintaining peripheral pool of T cells.
Individual experiments have demonstrated the importance of MHC class I and class
II for the maintenance of naïve CD8+ and CD4+ T cells, respectively. In two
individual experiments, TCR transgenic CD8+ T cells were transferred into
MHC class I-deficient hosts. In both experiments it was shown that the naïve CD8+ T
cells were significantly reduced in the periphery (Tanchot, Lemonnier et al. 1997;
Murali-Krishna, Lau et al. 1999).
Memory T cells often divide in the periphery long after antigen stimulation.
The homeostasis of memory T cells is controlled differently. Memory cells are
generally recognised by their CD44 marker, which is expressed much lower in naïve

Chapter 1 – Introduction
49
T cells. Studies using antigen specific memory cells establish that cells still continue
to proliferate in the absence of MHC molecules (Murali-Krishna, Lau et al. 1999).
Hence indicating that peptide-MHC ligands are not required for the survival of
CD44high cells instead they require the presence of IL-7 and IL-15 cytokines
(Boyman, Purton et al. 2007; Surh and Sprent 2008).
1.6.5 Peripheral T cell Tolerance
Throughout T cell development T cells maintain self-tolerance, which is
divided into central and peripheral tolerance. As discussed previously central
tolerance plays a key role in the early life of T cells, it is fostered by apoptosis
through elimination of auto reactive lymphocytes in the thymus. Potentially self-
reactive T cells do escape central tolerance due to relatively low-avidity for the self-
peptide MHC complex molecule (Liu, Fairchild et al. 1995). These self-reactive T
cells migrate to the periphery where they can lead on to cause autoimmune
disease. Therefore the self-reactive T cells that escape the negative selection must
be kept under control in the periphery. To simplify the tolerance process the
peripheral tolerance can be divided into those that act directly on the responding T
cell (T-cell intrinsic) and those that evoke additional subsets of cells, including
dendritic cells (DCs) and regulatory cells (T cell extrinsic) (Walker and Abbas 2002).
Here, the cell intrinsic, T cell clonal anergy is discussed further.

Chapter 1 – Introduction
50
1.6.5.1 T cell Anergy
The term anergy was first coined by Von Pirquet in 1908 to describe the loss
of delayed-type hypersensitivity to tuberculin in individuals infected with measles
virus (Schwartz 2003). Following a series of experiments describing antigen-specific
B cell tolerance in vivo, Nossal and Pike employed the terminology clonal anergy to
describe the antigen-specific nature of the unresponsiveness they observed (Nossal
1993). However with respect to T cell tolerance, it is a tolerance mechanism in
which the lymphocyte is intrinsically functionally inactivated following an antigen
encounter, but remains alive for an extended period of time in the hypo-responsive
state (Schwartz 2003). In earlier experiments, it was found that T cell clones that
were initially stimulated with formaldehyde fixed APCs failed to proliferate or
produce IL-2 upon re-challenge with live APC+peptide (Jenkins and Schwartz 1987).
The idea of T cell anergy occurred when T cells were stimulated through the T cell
receptor in the absence of co stimulation came when it was found that fixation of
APCs inhibited the B7-CD28 interaction (Jenkins and Johnson 1993).
Calcium signalling is critical for the first step of anergy induction (Macian,
Garcia-Cozar et al. 2002). Calcium- induced anergy is mediated primarily by NFAT, a
transcription factor regulated by the protein phosphatase calcineurin, and both
NFAT activation and anergy induction are blocked by the calcineurin inhibitors
cyclosporine A (CSA) and FK506 (Jenkins, Chen et al. 1990; Macian, Im et al. 2004;
Podojil and Miller 2009). This model was formally proven by Rao’s group using cells
from NFAT knockout mice and over expressing mutants of NFAT that could not
cooperate with AP-1 (Macian, Garcia-Cozar et al. 2002).

Chapter 1 – Introduction
51
Activated NFAT travels to the nucleus and up regulates the transcription of
several genes, including the genes encoding the transcription factors early growth
response 2 (EGR2) and early growth response 3 (EGR3) (Figure 1.14) (Fathman and
Lineberry 2007).
Figure 1.14: Induction of EGR2 or EGR3 by activated NFAT (Fathman and Lineberry
2007).
The initial steps of anergy require calcium signalling, which is mediated primarily by NFAT.
Egr2 and Egr3 transcription factor genes are activated by NFAT.
When self-reactive lymphocytes escape from tolerance and become
activated, then the immune system will react to itself, leading to autoimmune
diseases. It is still not clear how autoimmune diseases occur, however,
autoimmunity is thought to result from a combination of genetic variants, acquired
environmental triggers such as infections, and stochastic events (Rioux and Abbas

Chapter 1 – Introduction
52
2005). By focusing on how our understanding of cellular and molecular mechanisms
of self-tolerance and immunity, it will guide rational solutions to autoimmune
disease (Goodnow, Sprent et al. 2005).
A number of studies have been carried out to identify the exact process of
how self-tolerance is initiated, managed and balanced along with immune
response. Each of the mechanisms are essential for maintaining self-tolerance, as
loss of one pathway can result in a limited set of autoimmune reactions (Abbas,
Lohr et al. 2004).
The complexity of the immune system has led to a lot of research in
understanding the genetic model for the T cells differentiation into memory cells or
the route of achieving self-tolerance. One study by Zhu et al has shown that Egr2
controls the self-tolerance of T cells and prevent the development of autoimmune
diseases, such as lupus like syndrome (Zhu, Symonds et al. 2008).
1.7 Autoimmune Diseases
Autoimmune diseases are still one of the top five diseases that are major
causes of morbidity and mortality throughout the world. They are difficult to treat
due to the focus on the immune response and self-antigens cannot be eliminated
from the immune system. Self-reactive B and T cells are a normal component of the
immune system for which many self-tolerance mechanisms are in place.
Autoimmune diseases develop when self-reactive lymphocytes escape from
tolerance and become activated (Rioux and Abbas 2005). Traditionally autoimmune

Chapter 1 – Introduction
53
diseases were classified as T cell mediated or autoantibody mediated. However
with the improved understanding of the immune system , the role of B cells in
autoimmune diseases is more understood (Hampe 2012).
The major autoimmune diseases include rheumatoid arthritis, multiple
sclerosis, type 1 diabetes mellitus, inflammatory bowel disease and systemic lupus
erythematosus (Cho and Gregersen 2011).
Systemic lupus erythematosus (SLE) is an autoimmune disease characterised
by the production of antibodies to components of the cell nucleus in association
with a diverse clinical manifestations. The key features of SLE patients are
inflammation, vacuities, immune complex depositions, and vasculopathy. Most
cases of SLE are sporadic but the observation of concordance of SLE in identical
twins, and the increase frequency of SLE in first degree relatives, reflect a polygenic
inheritance of the disease (Mok and Lau 2003).
The common and basic pathology feature of SLE patients is that of
inflammation and blood vessel abnormalities, which includes immune complex
depositions. A key diagnoses performed by clinicians in diagnosing SLE is organ
pathology, of which the main organ being the kidney (Weening, D'Agati et al. 2004).
By light and immunofluorescence microscopy, renal biopsy in patients with SLE
display mesangial cell proliferation, inflammation, basement membrane
abnormalities, and immune complex depositions.(Mok and Lau 2003).
Autoantibody production is the central immunological disturbance in SLE
patients. These autoantibodies are directed at several self-molecules found in the
Chapter 1 – Introduction
54
nucleus, cytoplasm, and cell surface, in addition to soluble molecules such as IgG
(Arbuckle, McClain et al. 2003; Mok and Lau 2003).
In both human patients and mouse models genetic predisposition plays a
critical role in the susceptibility of SLE; in human SLE, a number of genes have been
identified. Our group identified Egr2 to be a key gene involved in controlling self-
tolerance. We produced Egr2 conditional knockout mice, where Egr2 was
specifically deleted in cells expressing CD2 promoter, i.e. lymphocytes. These mice
exhibited features of SLE disease. The mice displayed hair loss, skin lesions and
accumulations of inflammatory monoclear cells in various tissues, of which majority
of them were T cells, with a small population of B cells. Kidney histology also
revealed deposition of immune complexes in the glomeruli, as SLE patients also
manifest glomerulonephritis (Zhu, Symonds et al. 2008).
1.8 Early Growth Response Transcription Factors
The Egr family consist of four members; Egr1 (also known NGFI-A, Zif268 or
Krox-24), Egr2 (also known as Krox-20), Egr3 (also known as PILOT) and Egr4 (also
known as NGFI-C). Three of the Egr genes (Egr1, Egr2 and Egr3) are growth factor
inducible, whereas Egr4 is not. (Sukhatme 1990). All four Egr proteins share
extensive 90% homology throughout the zinc finger DNA-binding domains and
recognise the same consensus DNA-binding motifs (Beckmann and Wilce 1997). All
the Egr proteins contain closely related Cys2-His2-type of the zinc finger proteins
(Sukhatme 1990). However they do have unique functions as revealed by specific

Chapter 1 – Introduction
55
phenotypes in the knockout mice. Egr1-/- mice are characterised by female
infertility, Egr2-/- mice have a defective peripheral nerve myelination and hindbrain
abnormalities, Egr3-/- mice have motor neuron disorders, such as ataxia, and Egr4-/-
mice have male infertility (O'Donovan, Tourtellotte et al. 1999). Recent studies have
also revealed that the Egr family performing opposing functions. Collins and
colleagues demonstrated that Egr family play a critical role in directing the
consequences of antigen recognition. Egr1 and NAB2 promote a TCR-induced
activation program while Egr2 and Egr3 are responsible negatively regulating T cell
function by suppressing Egr1 and NAB2 expression (Collins, Lutz et al. 2008)
As well as their DNA binding domains, Egr protein also contain both
transactivation and repressor domains, thus they function both as transcriptional
activators and repressors (Thiel and Cibelli 2002).
1.8.1 Egr protein DNA binding
The Egr2 gene transcribes early growth response 2 transcription factors and
is located at 10q21.3 near the MBS3 critical region (Van Der Zwaag, Verzijl et al.
2002; Bult, Eppig et al. 2008). The Egr family members are characterised by a DNA-
binding domain consisting of three zinc finger motifs which bind to 9-bp GC-rich
DNA sequences (Dillon, Brown et al. 2007). Figure 1.15 provides a schematic
representation of the four members of the Egr family.

Chapter 1 – Introduction
56
Figure 1.15: The four members of the Egr family (Poirier, Cheval et al. 2008).
This schematic representation shows the conserved regions of the different members of
the Egr family. The most closely related members are Egr2 and Egr3, followed by Egr1.
The first DNA sequence identified as the Egr1 binding site was GCGGGGGCG,
which was discovered within its own promoter in 1989 (Christy and Nathans 1989).
Later experiments demonstrated that all four members of the Egr could activate
transcription from this sequence; hence this sequence was referred to the
consensus binding site for Egr family of transcription factors, even though later
GCGTGGGCG was identified as the optimal binding site for Egr2 (Swirnoff and
Milbrandt 1995).
1.8.2 Egr family function outside the immune system
The Egr family has found to play a critical role in the formation and
maintenance of myelin (Topilko, Schneider-Maunoury et al. 1994). Egr2 has been
extensively studied in the nervous system. Mutations in Egr2 were identified to
correlate with severity of human myelinopathies (Warner, Svaren et al. 1999) and
Charcot-Marie-Tooth disease (Chung, Sunwoo et al. 2005). Studies have shown that

Chapter 1 – Introduction
57
Egr2 transcription factor is tightly regulated during embryogenesis, mainly in the
segmented hindbrain and immature myelinating Schwann cells. Egr2 knockout
models display disrupted hindbrain segmentation and development, due to
rhombomeres r3 and 5 missing in the developing hindbrain (Voiculescu, Charnay et
al. 2000).
Egr1 deficient animals have provided insight of fertilisation problems in
these animals, leading to the discovery that they are deficient in luteinizing
hormone β (LHβ), which contains an Egr response element in its promoter. These
findings suggested that Egr1 mediates the phasic rise in luteinizing hormone (LH)
indicted by luteinizing-hormone releasing hormone (O'Donovan, Tourtellotte et al.
1999). Egr1 has also recently indicated that it plays a crucial role in angiogenesis,
the formation of new blood vessels from the pre-exiting vasculature (Fahmy and
Khachigian 2004; Khachigian 2004).
Egr3 is highly expressed in developing muscle spindles, specialised muscles
cells that are used to monitor muscle length and tension (Tourtellotte and
Milbrandt 1998). Tourtellotte and Milbrandt, generated Egr3 deficient mice by
targeting mutagenesis in embryonic stem cells and found that they displayed severe
motor abnormalities, due to the absence of muscle spindles (Tourtellotte and
Milbrandt 1998). Recently Egr3 has also been shown to be involved in the
sympathetic nervous system, by regulating sympathetic neuron dendrite
morphology and terminal axon branching (Eldredge, Gao et al. 2008; Quach,
Oliveira-Fernandes et al. 2013).

Chapter 1 – Introduction
58
Studies have shown that the Egr family have important roles in multiple
pathways including development of prostate cancer, hematopoietic cell fate
determination and thymic T cell development (Collins, Lutz et al. 2008).
Two individual groups in Japan have demonstrated that Egr2 is associated
with the apoptosis pathway. One group revealed that Egr2 plays a key role in the
PTEN-induced apoptotic pathway. They suggested Egr2 may serve as a tumour
suppressor mediator in the PTEN signalling pathway. They found that the
exogenous expression of Egr2, with AdCAEGR2 induced apoptosis significantly in
various cancer cell lines, such as colorectal cancer and prostate cancer (Unoki and
Nakamura 2003). They proposed that Egr2 induces apoptosis in various cancer cell
lines by direct transactivation of BNIP3L and BAK (Figure 1.16). However they did
not investigate Egr2 in lymphoma or leukaemia cell lines.

Chapter 1 – Introduction
59
Figure 1.16: Egr2 mediated cell death pathway (Unoki and Nakamura 2003).
This schematic model shows PTEN that activates Egr2 gene. This then initiates the
apoptotic pathway.
The other group supporting the findings that overexpression of Egr2 induces
apoptosis, Tokini and colleagues, reported that Egr2 expression was up-regulated
by DNA damage-induced p53 activity. They also identified a responsive element of
p53, Tap63 and Tap73 within Egr2 gene (Yokota, Sasaki et al. 2010).

Chapter 1 – Introduction
60
1.8.3 Egr family proteins in B cells
In 1989, it was reported by Seyfert and colleagues, that Egr1 is rapidly
induced in mature B cells, upon stimulation by B cell antigen receptor (BCR)
crosslinking (Seyfert, Sukhatme et al. 1989). Later it was reported that Egr1
expression can be detected already in pre-B cells isolated from bone marrow and in
fetal liver-derived pre-B cell cultures (Dinkel, Warnatz et al. 1998).
Recently our group demonstrated that together with Egr1, Egr2 is also
expressed in selected stages of B cell development and is repressed at pro-B cells
(see Figure 1.17). The studies were carried out on Egr2 conditional knockout models
(cKO), where Egr2 was specifically knocked out of CD2 positive cells, lymphocytes,
and in Egr2 transgenic mice. Very little is known by the mechanism of how Egr2
regulates B cell development but our group was able to demonstrate that the
involvement of Her-2 in B cells was supported by the impaired expression of Pax5 in
pro-B cells, demonstrated by Egr2 Transgenic mice. Pax5 is exclusively expressed in
the B cells from the committed pro-B cells to mature B cell stage and control the
commitment of lymphoid progenitors to the B cell pathway (Li, Symonds et al.
2011).

Chapter 1 – Introduction
61
Figure 1.17: Kinetic Expression of Egr in wild type bone marrow B lymphoid
lineage (Li, Symonds et al. 2011).
Egr2 is shown to be highly expressed at the early stages of B cell development (CLP and
Pre-pro stages).
1.8.4 Egr Family proteins in T cells
Earlier studies demonstrated that during the engagement of the T cell
receptor (TCR), Egr1, Egr2 and Egr3 are induced. Egr1, Egr2 and Egr3 are all
expressed in DN thymocytes after the β-selection checkpoint correlating with pre-
TCR signals (Carleton, Haks et al. 2002). Egr4 is thought to remain constantly
expressed in T cells (Skerka, Decker et al. 1997). Li and colleagues performed kinetic
expression of Egr1, Egr2 and Egr3 mRNA in the T cell lineage stages (Figure 1.18)
and found Egr2 and Egr3 were expressed at significant levels while Egr1 was
induced at lower levels.

Chapter 1 – Introduction
62
Figure 1.18: Kinetic Expression of Egr genes in wild type T lymphoid lineage (Li,
Symonds et al. 2011).
Egr2 and Egr3 genes are expressed throughout the development of T cells, especially during
DN3 and DN4 stage.
Recent studies have revealed opposing functions among the Egr in
regulating T cell activation. Egr1 through the up-regulation of IL-2, TNF, CD154 and
IL-2r, is associated with enhancing function. Whereas, Egr2 and Egr3 are emerging
as negative regulators of T cell activation (Collins, Lutz et al. 2008). The role of Egr2
in the immune compartment is not extensively described, although it has been
shown that Egr2 transactivation is dependent on members of the NFAT family in T
cells (Harris, Bishop et al. 2004).
1.8.4.1 Egr proteins in thymocytes and mature T cell Function
Studies have shown that the activity of the Egr proteins is essential for
development of immature DN thymocytes to the DP stage (Carleton, Haks et al.

Chapter 1 – Introduction
63
2002). Carleton and his group were able to produce the first report, which
demonstrated that the Egr family members are required to enable the pre-TCR
complex to promote the differentiation of immature DN thymocytes beyond the
β-selection checkpoint (Carleton, Haks et al. 2002). Two individual groups also
demonstrated that both transgenic over-expression of Egr1 and Egr3 proteins in
Rag2-/- and Rag1-/- thymocytes, respectively, enable the T cells to pass through the
β-selection checkpoint to the DN4 and in SP stages, due to the lack of pre-TCR
signalling (Miyazaki 1997; Xi and Kersh 2004). Hence, demonstrating the
involvement of Egr proteins in thymocytes β-selection.
As well as in the thymocytes, Egr proteins are also shown to be expressed in
mature T cells. Egr1 has been demonstrated to be involved in the expression of IL-2
(Decker, Skerka et al. 1998).
Mouse natural killer T (NKT) cells function in the first line of defence against
infectious agents. Recently Lazarevic V., et al (2009) demonstrated that a
calcineurin-NFAT-Egr2 pathway is essential for the productive selection, survival
and maturation of NKT cells (Lazarevic, Zullo et al. 2009) (Seiler, Mathew et al.
2012).
1.8.4.2 Egr family, T cell tolerance and anergy
Egr2 and Egr3 are important mediators of the negative regulatory program
downstream of isolated NFAT signalling (Figure 1.19). Collins and colleagues have
also shown that Egr2 is up-regulated by Egr3. Both Egr2 and Egr3 inhibit T cell
function by promoting the up-regulation of negative regulators such as Cbl-b and by

Chapter 1 – Introduction
64
inhibiting the expression of the T cell activators Egr1 and NAB2 (Safford, Collins et
al. 2005; Collins, Lutz et al. 2008). Cbl-b has shown to have a major tolerogenic
factor.
Figure 1.19: Model for the regulation of T cell function by Egr1, Egr2, Egr3 and
NAB2 (Collins, Lutz et al. 2008).
This schematic representation shows possible routes of TCR activation leading to
upregulation of either Cbl-b or IL-2.
Including our group, three individual groups have published their initial
findings on the role of Egr2 in tolerance and anergy. Initially in 2004 Dr. Michael P.
Czech from University of Massachusetts, USA, silenced the Egr2 expression, by RNAi
technology, in an established A.E7 T cell line. They reported that depletion of Egr2
through siRNA-mediated gene silencing disrupts anergy, suggesting that Egr2

Chapter 1 – Introduction
65
expression is required for the full induction of anergy in T cells (Harris, Bishop et al.
2004).
Around the same time similar studies were also carried out by another
group at John Hopkins School of Medicine, USA. Jonathan, D. Powell’s group,
carried out microarray analysis to identify Egr2 and Egr3 as negative regulators of T
cell activation (Safford, Collins et al. 2005). They took an alternative approach to
the Czech’s group by using lentiviral system to over-express Egr2 , resulting in the
reduced expression of IL-2 after T cell activation (Safford, Collins et al. 2005).
Both groups performed their studies in vitro and had not tested it in vivo
since Egr2 knockout mice die perinatally due to the defects in the hindbrain
development (Schneider-Maunoury, Topilko et al. 1993). To assess the function of
Egr2 in lymphocytes in vivo, our group established Egr2 conditional knockout (CD2-
specific Egr2-/-) model, in which the Egr2 gene was deleted specifically in CD2+
lymphocytes using the Cre/LoxP system. Our group reported that T cells from CD2-
specific Egr2-/- mice were hyper proliferative in response to prolonged stimulation
and IFN-γ and IL-17 was highly induced, resulting in infiltration of T cells in multiple
organs. Hence, the results demonstrated that Egr2 is important for controlling self-
tolerance of T cells and preventing autoimmunity (Zhu, Symonds et al. 2008).
1.8.5 Egr family and apoptosis
Fas ligand (FasL) is a crucial ligand for the apoptotic pathway. Fas ligand
(FasL) is the membrane associated cytokines of the TNF family and is also induced
after TCR stimulation and can bind to the Fas receptor. The FasL-triggered

Chapter 1 – Introduction
66
apoptotic death pathway is crucial for T cell homeostasis. A group demonstrated
that Egr2, along with previously identified Egr3, is a direct regulator of fasL
transcription in activated T cells. Ectopically expressed Egr2, like Egr3, was sufficient
to induce fasL specific transcription (Mittelstadt and Ashwell 1999).

Chapter 1 – Introduction
67
1.9 Aims of the study
Intensive research has been associated with the Egr family in the hindbrain
development and myelination but their association with the immune system is still
in the early stages. The involvement of Egr2 and Egr3 in T cell tolerance was first
suggested less than a decade ago. Our group was the first group to produce Egr2
conditional knockout mice, which had deleted Egr2 expression in CD2+ cells,
lymphocytes. Previously, it was found that a defect in Egr2 in T cells results in
accumulation of IFN-γ and IL-17 in CD44highCD4 T cells leading to lupus-like
autoimmune disease. Here we have bred CD2-specific Egr2-/- (CD2-Egr2-/-) mice
with Egr3-/- mice to produce Egr2 and 3 double knockout (Egr2-/-Egr3-/-) mice to
study the role of Egr2 as previously we proposed that Egr3 compensated the role of
Egr2. Therefore, the aim of the project was as follow:
1. To distinguish the phenotype of the CD2-Egr2-/-Egr3-/-mice model, as in the
CD2-Egr2-/- mice.
2. To characterise the lymphoma developed in CD2-Egr2-/- and Egr2-/-Egr3-/-
mice by histology and immunophenotype.
3. To identify the mechanism by which Egr2 and/or Egr3 control the
development of lymphoma development.
The hypothesis of my research is that Egr2 and Egr3 act as tumour suppressor
genes and are important for the control of tumourgenesis.

Chapter 2 – Materials and Methods
68
- Materials and Methods Chapter 2

Chapter 2 – Materials and Methods
69
2.1 Experimental Tools and Conditions
All mice used in this study were maintained in the Biological Services Unit,
Brunel University, and used according to established institutional guidelines under
the authority of the UK Home Office project licence (guidance on the Operation of
Animals, Scientific Procedures Act 1986).
2.1.1 Egr2 Conditional Knockout mice
Egr2 conditional knockout (CD2-Egr2-/-) mice have a deletion of Egr2 in CD2+
lymphocytes. CD2-Egr2-/- were generated by crossing Egr2LoxP/LoxP mice (obtained
from P.Charnay, Institute National de la Santé et de la Recherche Médicale, Paris,
France) and hCD2-Cre transgenic mice (obtained from Dr D. Kioussis, National
institute for Medical Research, London) (Taillebourg, Buart et al. 2002; de Boer,
Williams et al. 2003). The hCD2-Cre transgenic mice induce Cre recombination only
in T and B cells (de Boer, Williams et al. 2003). Henceforth Egr2 deficient mice will
be referred as CD2-Egr2-/- mice.
2.1.2 Egr3 Knockout Mice
Egr3 knockout mice were obtained from Tourtellotte group (Washington
University School of Medicine, St Louis, USA), which were generated by targeting
mutagenesis in embryonic stem cells by homologous recombination. Tourtellotte,
W.G and Milbrandt, J. cloned the entire Egr3 gene into pBluescript vector. They
disrupted the Egr3, using a 1.5kb fragment containing a neomycin resistance

Chapter 2 – Materials and Methods
70
selection cassette pMC1NeopA , which deleted a 0.9kb fragment of the gene that
encoded the entire zinc finger DNA binding domain and the remaining carboxyl
terminus of the protein (Tourtellotte and Milbrandt 1998). From this point forward,
these will be referred as Egr3-/- mice.
2.1.3 CD2-specific Egr2-/- and Egr3-/- Mice
Egr2 and Egr3 double knockout mice were generated by interbreeding
CD2-Egr2-/- and Egr3-/- mice on the C57BL/6 background. From this point forward
these will be referred as Egr2-/-Egr3-/- mice.
2.1.4 Genotyping
All the mice were genotyped prior to any studies carried out. The mice tails
were collected and the genomic DNA was extracted using the REDExtract-N-Amp
Tissue PCR Kit (Sigma) according to the manufacturer’s instructions. Briefly, the
DNA was extracted by adding extraction buffer and tissue preparation solution to
the tails. For the protease enzyme to react with tissue sample, the samples were
heated at 55˚C for 30mins. Both solutions contain protease enzyme, which break
down the proteins. The protease enzyme was broken down by heating the samples
at 95˚C for 3mins. The samples were neutralised by adding neutralisation buffer
and then used for genotyping.
The CD2-Egr2-/-, Egr3-/- and Egr2-/-Egr3-/- mice were identified by polymerase
chain reaction (PCR). PCR is a technique that was developed by Kary Mullis in the

Chapter 2 – Materials and Methods
71
1980s. It allows the amplification of nucleic acid sequences, with the aid of an in
vitro enzyme (Mullis, Faloona et al. 1986; Mullis and Faloona 1987). The
thermostable DNA polymerase from Thermus aquaticus (also referred to as taq), is
not denatured at the same temperature as the DNA and can withstand the high
temperatures required during PCR. PCR amplifies a specific region of the DNA with
the aid of primers, which are designed specifically to a particular gene sequence.
The Taq enzyme extends the primers with the aid of dNTPs complementary to the
pre-existing strand, therefore producing a copy of the DNA. The primers used for
genotyping are shown in Table 2.1 with the PCR product size. The wild type PCR
product is referred to as WT.
Primer Sequence (5’-3’) Annealing
Temperature Product Size
Egr2
LoxP
Sense GTG TCG CGC GTC AGC ATG CGT
65°C
LoxP allele:
210bp
WT allele:
150bp Antisense GGG AGC GAA GCT ACT CGG ATA CGG
hCD2-
iCre
Sense CCA ACA ACT ACC TGT TCT GCC G 56°C 150bp
Antisense TCA TCC TTG GCA CCA TAG ATC AGG
Egr3-/-
Sense CTA TTC CCC CCA GGA TTA CC
57°C
Neo Allele:
800bp
WT Allele:
400bp
Antisense TCT GAG CGC TGA AAC G
Neo GAT TGT CTG TTG TGC CCA GTC
Table 2.1: Primer Sequences for genotyping

Chapter 2 – Materials and Methods
72
2.2 Cell Culture and Stimulation
2.2.1 Mouse CD4+ and CD19+ Cells
CD4+ T cells and CD19+ B cells were cultured in Roswell Park Memorial
Institute (RPMI) 1640 medium supplemented with 300mg/L L-glutamine, 10% foetal
bovine serum (FBS), 50µM β-mercaptoethanol (2-ME), and 50µg/ml gentamicin (all
from Invitrogen). They were maintained in a humidified incubator at 37°C in 5%
CO2. CD4+ T cells were stimulated with 200ng/ml PMA/INO or with plate-bound
anti-CD3 at 5µg/ml or anti-CD28 (2µg/ml) antibodies. CD19+ B cells were activated
with 5µg/ml of soluble anti-F(ab’)2 fragments of goat anti-mouse IgM (anti-TgM
F(ab’)2, (Jackson ImmunoResearch Laboratories, Inc.) or Lipopolysaccharide (LPS)
(Sigma-Aldrich) at 5µg/ml.
2.3 Isolation of primary cells from mouse lymphoid organs
The secondary lymphoid organs were extracted and single cell suspensions
were prepared by homogenising the organs. The cells were pelleted by
centrifugation at 1300rpm for 5 minutes at room temperature. The erythrocytes
were lysed from the cell pellet using 0.8% ammonium chloride lysis buffer at 37°C
for 5 minutes. The lysis buffer uses a hypotonic solution to lyse the erythrocytes
while maintaining the viability of the lymphocytes. The lysis was stopped by diluting
the lysis buffer with phosphate buffered saline (PBS) and centrifugation at 1300rpm
for 5 minutes at room temperature.

Chapter 2 – Materials and Methods
73
The naïve CD4+ cells were then isolated by Magnetic Activated Cell Sorting
(MACS) using positive selection kit (Miltenyi Biotec) according to the
manufacturer’s instructions. Briefly, the cells were incubated with anti-CD4
antibodies (L3T4) attached to magnetic beads (Miltenyi Biotec) at 4°C for 20
minutes in beads buffer, composed of PBS containing 0.5% FBS. This labels any CD4+
cells with magnetic beads. The unlabelled anti-CD4 antibody was washed with
beads buffer and centrifuged at 1300ropm for 5 minutes at room temperature. The
cell pellet was resuspended in beads buffer and run through a magnetic column.
CD4+ cells are retained on the column due to the magnetic beads while the
unlabelled cells pass through the column into a collecting tube. The column was
washed three times with beads buffer to remove any non-specifically bound cells
and then the CD4+ cells were eluted by removing the column from the magnetic
field and washing with RPMI 1640 medium containing 10% FBS. The naïve CD19+
cells were also isolated by MACS using positive selection kit following the same
procedure using the remaining unlabelled cells from the previous step. These were
then labelled with anti-CD19 antibodies attached to magnetic beads (Miltenyi
Biotec) followed by the same as CD4+ Cells.
2.3.1 Cell Viability
The cell viability assays measures the percentage of a cell suspension that is
viable. The cell viability was examined by trypan blue exclusion assay using the
CountessTM Automated Cell Counter (Invitrogen). The trypan blue dye is traversed

Chapter 2 – Materials and Methods
74
into cells without an intact membrane (dead cells), whereas cells with an intact cell
membrane (live cells) are not coloured by the dye.
The CD4+ and CD19+ cells were isolated from Egr2-/-Egr3-/- and wild type
secondary lymphoid organs as described in section 2.3. 2 x 10⁶ cells were cultured
in RPMI 1640 medium. The initial basal cell viability was examined at day 0 by
preparing a 1:1 dilution of the cell suspension using a 0.4% trypan blue solution
(Invitrogen, T10282). This was then loaded into the chamber port on the
CountessTM cell counting chamber slide (Invitrogen, C10228). The cell viability was
analysed on the CountessTM Automated Cell Counter. The cells were cultured for 12
days at 37°C, and cell viability was measured on days 3, 5, 7, 10 and 12.
2.4 Proliferation assay
To analyse proliferation of T and B cells, tritiated thymidine (3[H]-TdR)
incorporation was measured. This technique uses the nucleotide thymidine (TdR)
that is radioactively labelled with radioactive isotope of hydrogen called tritium
(3H). As the cell proliferates and replicates its DNA, the tritium is incorporated in
proportional to DNA synthesis, alternatively the proliferation.
The proliferation assay was performed by isolating purified CD4+ T and
CD19+ B cells (as described in section 2.3) and 2 x 10⁶/ml cells were seeded into 96-
well plates. The cells were first incubated for 72 hours in RPMI-1640 medium. The
cells were then stimulated with 200ng PMA/INO for 48 hours. 1µCi of 3[H]-TdR was
added to each well and cultured for 8 hours at 37˚C, then the DNA was harvested
onto glass fibre filters and unincorporated 3[H]-TdR was washed away. Tritium

Chapter 2 – Materials and Methods
75
incorporation was measured by scintillation counting, as tritium emits β radiation
which excites scintillation fluid causing it to emit light which can be detected.
Proliferation was measured at days 3, 5 and 10. The scintillation counting
was carried out at Barts and London School of Medicine and Dentistry, Queen Mary
University of London, by Professor Ping Wang.
2.5 Adoptive Transfer
The adoptive transfer was carried out by Dr Su-Ling Li and Professor Ping
Wang at Brunel University. Briefly a total of 106 resting B or Naïve CD4+ T cells were
isolated from a 4 week old wild type or Egr2-/-Egr3-/- mice and suspended in 100µl of
physiological saline and injected into the dorsal tail vein of a 12 week old Rag2-/-
female. The phenotype was assessed at two and six weeks after transfer through
isolation of the B and T cells from the spleen. The wild type mice were positive for
CD45.1+ marker and the Egr2-/-Egr3-/- were positive for CD45.2+ marker.
2.6 RNA Extraction of Cells
Total RNA was extracted using Trizol reagent (Invitrogen). The Trizol reagent
is a monophasic solution of phenol, guanidine isothiocyanate, which allows the
sequential precipitation of RNA, DNA, and proteins from a single sample
(Chomczynski and Sacchi 1987; Chomczynski 1993). RNA extraction was carried out
according to the manufactures instructions. Briefly, cells were pelleted and then
lysed in 1ml Trizol per 107 cells and then incubated at room temperature for 10

Chapter 2 – Materials and Methods
76
minutes. 200µl of chloroform was added to the sample for homogenization and the
sample was mixed vigorously, incubated at room temperature for 15 minutes and
then centrifuged at 12000rpm for 15minutes at 4°C. The chloroform increases the
efficiency of nucleic acid extractions by reducing loss of RNA due to its ability to
denature proteins and aid in the removal of lipids, therefore improving separation
of nucleic acid into the aqueous phase (Chomczynski and Sacchi 2006).
After centrifugation, the sample was separated into a lower red organic
phase, interphase and a colourless aqueous upper phase. The RNA is separated into
the aqueous phase while the protein and DNA is located in the organic and
interphase. The aqueous phase was transferred into a new eppendorf tube and the
RNA was precipitated with 500µl isopropanol, incubated at room temperature for
10 minutes. The sample was then centrifuged at 12000rpm for 10minutes at 4°C.
The supernatant was removed and the pellet was washed with 75% RNA free
ethanol at 7500rpm for 5 minutes at 4°C. The waste was discarded and the RNA was
air dried and then resuspended in RNase-free DEPC water.
2.7 RNA Extraction for Tumour Samples
Total RNA was extracted from the tumour tissue samples using the RNeasy
mini kit (Qiagen, UK). Prior to RNA extraction, fresh 1ml RLT buffer (guanidine
thiocyanate buffer) was prepared by adding 10µl of 2-ME. Briefly the tumour
samples (no more than 30mg) were sectioned into small pieces no less than 0.5cm
and homogenised in 600μl of prepared RLT buffer.

Chapter 2 – Materials and Methods
77
The cell and the tissue sample were homogenised using a syringe and a
needle. The lysate was passed through a 20-gauge (0.9mm) needle attached to the
sterile plastic syringe until a homogeneous lysate was achieved. 600μl of 70%
ethanol was added to homogenised lysate; the sample was mixed well by pipetting.
700μl of the sample was transferred into an RNeasy spin column placed in a 2ml
collection tube and centrifuged at 10000rpm for 15 seconds. The waste was
discarded and the step was repeated for the remaining 500μl sample. 700μl of RW1
wash buffer was added to the column and centrifuged at 10000rpm for 15 seconds.
Flow through waste was discarded and the column was washed with 500μl of RPE
buffer (to which ethanol was added) by centrifugation at 10000rpm for 15 seconds.
The column was washed again with RPE buffer by centrifugation at 10000rpm for 2
minutes. The RNA was eluted in 50ul of RNase-free water into a new eppendorf
tube by centrifugation at 10000rpm for 1 minute.
The RNA quantity was measured using the spectrophotometer NanoDrop
2000C (Thermo Fisher Scientific) and the RNA quality was assessed by both the
NanoDrop 2000C and confirmed by electrophoresis.
2.8 First-Strand cDNA Synthesis
RNA was converted to first strand cDNA using SuperScriptTM III (Invitrogen).
The SuperScriptTMIII Reverse Transcriptase is a version of Murine Moloney
Leukaemia Virus (MML V-RT). The enzyme catalyses the formation of the
complementary cDNA strand using the RNA template. cDNA synthesis was
performed in the first step using total RNA with random primers, they act as

Chapter 2 – Materials and Methods
78
primers for reverse transcriptase. Volumes of solutions were chosen to give 1µg
RNA per reaction, 50ng of random primers and 500µM each of dATP, dTTP, dCTP
and dGTP were added to each tube. These were then heated to 65°C for 5 minutes
to denature any secondary structures present in the RNA, facilitating the binding of
the oligo (dT) or random primers. The samples were then placed on ice. Reagents
were added to give a final concentration of 0.01M DDT (Dithiothreitol), 2 Unit/µl of
RNase Inhibitor and 10 Units/µl of SuperScriptTM Reverse Transcriptase in 1x First
Strand Buffer (all Invitrogen). The reaction was mixed and heated to 25°C for 5
minutes and then to 50°C for 1 hour. The reaction was then inactivated by heating
to 70°C for 15 minutes. The samples were stored at -20°C.
2.9 Primer Design
PerlPrimer was used to design the primers for the Real Time PCR, using the
following criteria (Marshall 2004). Primers were designed to have approximately 20
to 23 nucleotides with around 50% G/C content. The sense and antisense primers
were designed so that they anneal to different exons of the sequence of interest.
Hence allowing the identification of genomic DNA contaminants as these will
contain the intervening introns in addition to the exons so will be larger and
therefore detectable via electrophoresis. The melting temperature (Tm) of each
primer was estimated using the Wallace rule (Tm = 4 x [G + C] +2 x [A + T]) and the
annealing temperature was initially set at Tm - 2°C and altered as necessary. All
primers were then checked using NCBI primer blast software. For the endogenous
gene, mouse β-actin was used (Table 2.2).
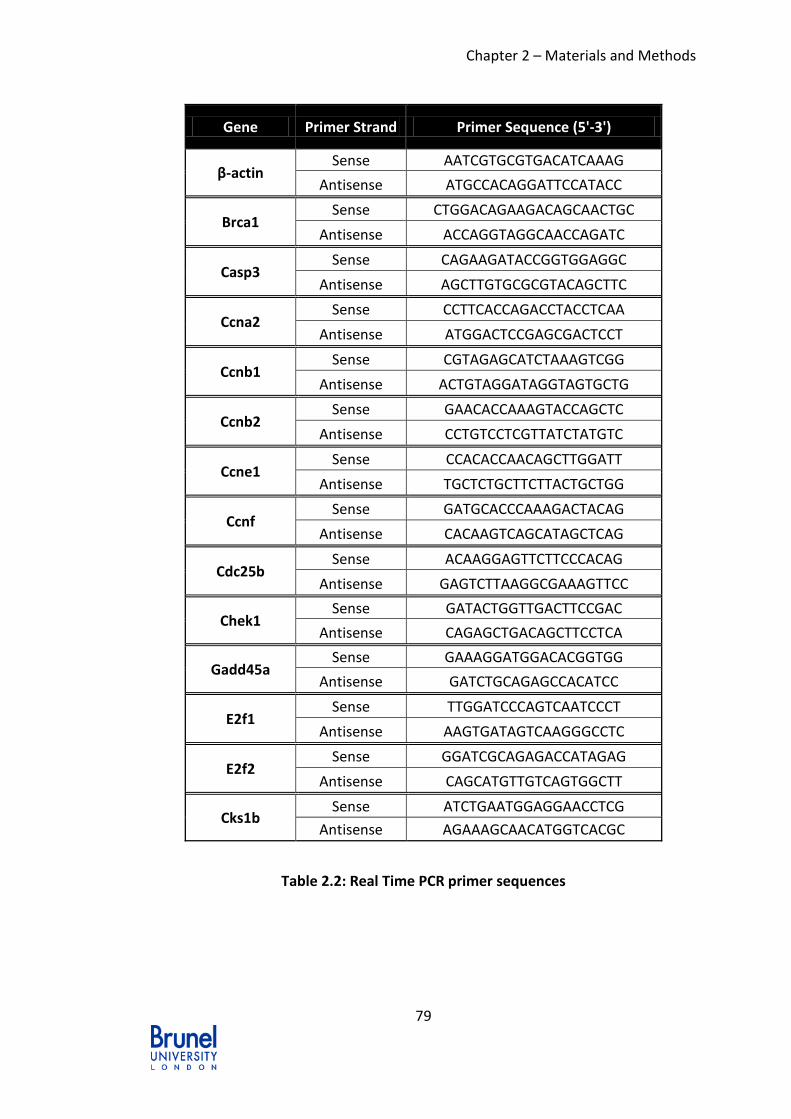
Chapter 2 – Materials and Methods
79
Gene Primer Strand Primer Sequence (5'-3')
β-actin Sense AATCGTGCGTGACATCAAAG
Antisense ATGCCACAGGATTCCATACC
Brca1 Sense CTGGACAGAAGACAGCAACTGC
Antisense ACCAGGTAGGCAACCAGATC
Casp3 Sense CAGAAGATACCGGTGGAGGC
Antisense AGCTTGTGCGCGTACAGCTTC
Ccna2 Sense CCTTCACCAGACCTACCTCAA
Antisense ATGGACTCCGAGCGACTCCT
Ccnb1 Sense CGTAGAGCATCTAAAGTCGG
Antisense ACTGTAGGATAGGTAGTGCTG
Ccnb2 Sense GAACACCAAAGTACCAGCTC
Antisense CCTGTCCTCGTTATCTATGTC
Ccne1 Sense CCACACCAACAGCTTGGATT
Antisense TGCTCTGCTTCTTACTGCTGG
Ccnf Sense GATGCACCCAAAGACTACAG
Antisense CACAAGTCAGCATAGCTCAG
Cdc25b Sense ACAAGGAGTTCTTCCCACAG
Antisense GAGTCTTAAGGCGAAAGTTCC
Chek1 Sense GATACTGGTTGACTTCCGAC
Antisense CAGAGCTGACAGCTTCCTCA
Gadd45a Sense GAAAGGATGGACACGGTGG
Antisense GATCTGCAGAGCCACATCC
E2f1 Sense TTGGATCCCAGTCAATCCCT
Antisense AAGTGATAGTCAAGGGCCTC
E2f2 Sense GGATCGCAGAGACCATAGAG
Antisense CAGCATGTTGTCAGTGGCTT
Cks1b Sense ATCTGAATGGAGGAACCTCG
Antisense AGAAAGCAACATGGTCACGC
Table 2.2: Real Time PCR primer sequences
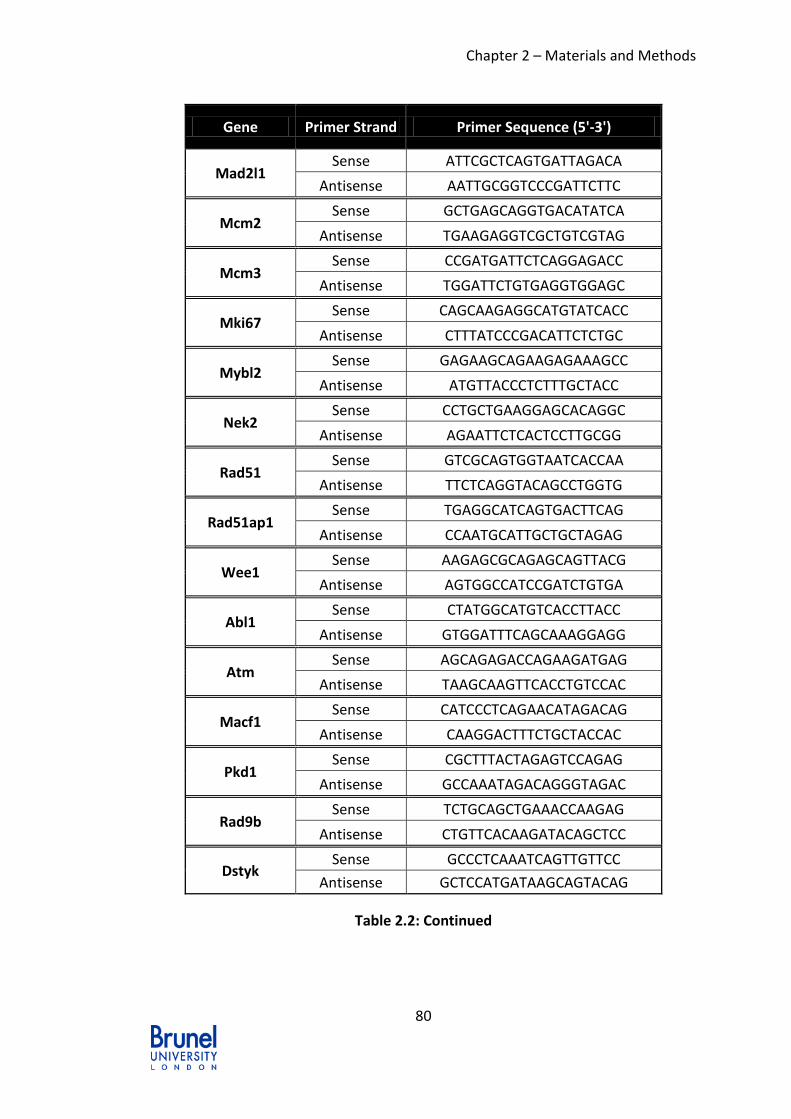
Chapter 2 – Materials and Methods
80
Gene Primer Strand Primer Sequence (5'-3')
Mad2l1 Sense ATTCGCTCAGTGATTAGACA
Antisense AATTGCGGTCCCGATTCTTC
Mcm2 Sense GCTGAGCAGGTGACATATCA
Antisense TGAAGAGGTCGCTGTCGTAG
Mcm3 Sense CCGATGATTCTCAGGAGACC
Antisense TGGATTCTGTGAGGTGGAGC
Mki67 Sense CAGCAAGAGGCATGTATCACC
Antisense CTTTATCCCGACATTCTCTGC
Mybl2 Sense GAGAAGCAGAAGAGAAAGCC
Antisense ATGTTACCCTCTTTGCTACC
Nek2 Sense CCTGCTGAAGGAGCACAGGC
Antisense AGAATTCTCACTCCTTGCGG
Rad51 Sense GTCGCAGTGGTAATCACCAA
Antisense TTCTCAGGTACAGCCTGGTG
Rad51ap1 Sense TGAGGCATCAGTGACTTCAG
Antisense CCAATGCATTGCTGCTAGAG
Wee1 Sense AAGAGCGCAGAGCAGTTACG
Antisense AGTGGCCATCCGATCTGTGA
Abl1 Sense CTATGGCATGTCACCTTACC
Antisense GTGGATTTCAGCAAAGGAGG
Atm Sense AGCAGAGACCAGAAGATGAG
Antisense TAAGCAAGTTCACCTGTCCAC
Macf1 Sense CATCCCTCAGAACATAGACAG
Antisense CAAGGACTTTCTGCTACCAC
Pkd1 Sense CGCTTTACTAGAGTCCAGAG
Antisense GCCAAATAGACAGGGTAGAC
Rad9b Sense TCTGCAGCTGAAACCAAGAG
Antisense CTGTTCACAAGATACAGCTCC
Dstyk Sense GCCCTCAAATCAGTTGTTCC
Antisense GCTCCATGATAAGCAGTACAG
Table 2.2: Continued

Chapter 2 – Materials and Methods
81
Gene Primer Strand Primer Sequence (5'-3')
Rad9b Sense TCTGCAGCTGAAACCAAGAG
Antisense CTGTTCACAAGATACAGCTCC
Sfn Sense TTTCAGTCTTCCACTACGAG
Antisense TCCTTGTAGGAGTCCTCAC
sp100 Sense CCAAACCAAAGCAAAGGAAAGAG
Antisense CTGTGGTTGTGAAAGATGAGG
Siglech Sense TTCTTCCTCAGCAAGAGATCC
Antisense ACCATCATCCATGACTTTCTTGAC
Rbm38 Sense CTTACAGACGGGCTTTGCTG
Antisense CTGGCTGGTGTATACTCAAGG
Prkcq Sense TTGTCTACAGGGACCTGAAGC
Antisense GGAATGGTTGTACTTCTGACCC
Prdm9 Sense CACAGCAGGAAGAGAACTAAGG
Antisense GATTTCAGTGCGATGATTCCA
Prdm1 Sense AACCTGAAGGTCCACCTGAG
Antisense TGCTAAATCTCTTGTGGCAGAC
Irgm1 Sense CCCTTTACTATATGACTTCCCGA
Antisense GTTGGCTATTCTCTGCTTCC
Irf4 Sense CAGCTCATGTGGAACCTCTG
Antisense GTATTTCTTCTCACTCTTGGATGG
Ipcef1 Sense GCATTTAAGATCAATCACCCAC
Antisense CTCTCACTGTAACATTCTTCATCC
Il9r Sense CATCCTTGTAGTTGTGCCCA
Antisense CCTGTCCAACTCTGGAAGTC
Ikzf1 Sense AATTTCTTGGAGACAAGTGCCT
Antisense CTGGTACATGGAGCTGATGAC
Ikzf3 Sense CAGATTAGCAAGCAATGTGG
Antisense CATCATCTCGTTCTCCTTCTC
Ifng2 Sense AATCGAAGAGTATCTAAAGGACCC
Antisense CTGGAGAAGAAATAATTGACACGG
Table 2.2: Continued

Chapter 2 – Materials and Methods
82
Gene Primer Strand Primer Sequence (5'-3')
Ikzf3 Sense CAGATTAGCAAGCAATGTGG
Antisense CATCATCTCGTTCTCCTTCTC
Ifng2 Sense AATCGAAGAGTATCTAAAGGACCC
Antisense CTGGAGAAGAAATAATTGACACGG
Hjurp Sense GGAATACACTCAGGTGATTGAC
Antisense CAAGATGGCCAGTTCTCCTC
Hivep3 Sense CGAAGAAGGAACCAGTGATGAC
Antisense CCTCCTCATCTTCATCCAGGT
Hdac7 Sense GGGTGCACAGGAAATACTGG
Antisense GAGGTTCATGGGTTCTTCCTC
Gtf3c5 Sense CAAGAAGACATCCAACCAGCC
Antisense CAACTCCTCCACATTCAAATCAC
Gfi1 Sense CAAATGCAGCAAGGTGTTCTC
Antisense TCTTGCCACAGATCTTACAGTC
Foxo3 Sense CAAAGCAGACCCTCAAACTG
Antisense ATGTTATAGAGTTCTGTTCCACGG
Dgkz Sense TGGATCATGCACCTCCAGAG
Antisense CTGTGTCTTGAGCCTTCTCAG
Dcun1d4 Sense CTTCCCTACAATGTGATACAACAG
Antisense ACTTGGCAGTGTTTATGTCTAGG
Dcaf6 Sense CCGTTTGACCCAATTCTAGCC
Antisense GGTGTTCCGAGTCTCTTCCA
Chd3 Sense TAAGCCTGCTACTCCAGCTC
Antisense CACTTTGCTGTTCTTCTCTGG
Chd2 Sense AGTAAATCAAAGCGATCTCAGG
Antisense CATCCTCTCCTTACAAATGCTG
Cdk12 Sense CAGCGGCACTTGATCTATTGG
Antisense CAGTGAGGTAGGTCTGGAGG
Btaf1 Sense AGACTATTACTGTACTCTCAGCCC
Antisense ATTGTAACGCCTGGAATACATGAC
Table 2.2: Continued

Chapter 2 – Materials and Methods
83
Gene Primer Strand Primer Sequence (5'-3')
Bcl9 Sense CAGACCACATCAAGTCCCAG
Antisense CTTCTGCAGCCTTATTTGCC
Zmynd8 Sense CTCCAATCAAAGCTCTGTTAGCA
Antisense GGGAATGGTACTTCTGGGCT
Zfp36l2 Sense CACAAGCACAACTTTCCGTC
Antisense GGGATTTCTCCGTCTTGCAC
Unc5a Sense CTTTAACATCACTAAGGACACGAG
Antisense GGTGAAGTTTCTGGGCTAGAG
Ubr3 Sense AGTTAAGGGCACTGAAGAGG
Antisense CAATAGGACTGACCATCGCAC
Ssh2 Sense GACCAGTCGAAGGCAATCAC
Antisense CATGAATGGTGCTCTTCTTTGGT
Spic Sense AATGTCACCCACAGAGAACC
Antisense TTTCTCCTGCCTCTTCCTCC
Bptf Sense CTGTGATCGGTGTCAGAATTGG
Antisense TCTTGTGGGCCTGTAAGGAG
mTERT Sense TCAAGAATCCAGGAATGACAC
Antisense AGCTTTAAGGATGGTCATTGTC
Table 2.2: Continued

Chapter 2 – Materials and Methods
84
2.10 Real Time RT-PCR
Real Time PCR is a highly sensitive technique based on the same principle as
normal PCR with the adaptation of allowing the quantitative comparison of gene
expression from different samples (Pfaffl 2001). Real Time RT-PCR performs a
relative quantification based on the relative expression of a target gene against a
reference gene (often referred as ‘housekeeping’ or ‘endogenous’ gene). The
quantification is simply performed by the detection technique for newly
synthesised PCR products in real-time PCR using SYBR Green I fluorescence dye
which directly binds to double stranded DNA. After each round of the product
synthesis, the amount of product is calculated by the measurement of the
fluorescence (Morrison, Weis et al. 1998). The Real Time RT-PCR was performed
with QuantiTect SYBR Green PCR kit (Qiagen) as per the manufacturer’s
instructions; briefly using 1µl of cDNA and a final concentration of 0.2µM of
relevant sense and antisense primers in 1 x SYBR Green Master Mix. The Real Time
RT-PCR was performed on a Rotor-Gene System (Corbett Robotics) using the
following program.
95°C for 10 minutes
95°C for 20 seconds
Annealing temperature (50-65°C) for 30 seconds
72°C for 20 seconds
40 cycles

Chapter 2 – Materials and Methods
85
Like all techniques, there is a limitation that occurs with RT-PCR; the SYBR
Green also binds non-specifically to double strand DNA and can form primer dimer
complexes. Therefore, after the Real Time RT-PCR cycles had completed, a melting
curve analysis was performed, during which the fluorescence intensity was
monitored as the temperature was increased from 50°C to 90°C. The melting curve
identifies any non-specific products such as the primer dimers. The Tm is the
temperature at which 50% of a particular DNA duplex dissociates and becomes a
single stand DNA. The shape and the position of the DNA melting curve are
dependent on the GC/AT ratio, with the melting temperature of nucleic acid duplex
increases with both its length and width increasing GC content (Ririe, Rasmussen et
al. 1997). To validate, once the PCR reaction had completed, the products were run
on an agarose gel to confirm that there was only one band with the correct product
size.
2.10.1 Real Time RT-PCR Data Analysis
The data analysis for the Real Time RT-PCR was carried out using the Rotor-
Gene Software. The analysis was performed by choosing a threshold value which
was at the exponential phase of the reaction (when the number of copies of DNA
molecule doubles, during each cycle). Eventually the reaction comes to a plateau
phase, due to a number of factors such as utilisation of primers or nucleotides or
thermal inactivation of DNA polymerase. Hence the threshold value is chosen at
the exponential phase and the number of cycles (Ct) for the florescence to reach
the threshold for each sample is identified. The Ct values of the samples are then

Chapter 2 – Materials and Methods
86
compared to the Ct value of the reference gene (mouse β-actin was used), this is to
normalise the results, correcting any variances in the mRNA amount that permits
the comparison of different samples. The relative expression was calculated by the
ΔΔCt method using the following equation: 2^(Ct(β-actin)-Ct(target gene))x10000 (Livak and
Schmittgen 2001; Pfaffl 2001)
2.11 Western Blot
Some of the western blots were performed by Dr Tizong Miao at Barts and London
School of Medicine and Dentistry, Queen Mary University of London.
2.11.1 Protein Extraction
The cells were harvested and washed once with PBS. The cells were then
resuspended in 100µl of CelLytic M lysis buffer containing 1mM PMSF
(Phenylmethylsulfonyl fluoride) and protease and phosphatase inhibitors (Roche).
The cells were then swelled on ice for 15 minutes. The samples were centrifuged at
13000rpm for 5 minutes at 4°C and the supernatant containing the protein was
transferred into a new tube. The protein extraction was aliquoted and stored at
80°C.
2.11.2 Protein Quantification
The protein extraction was quantified using the Bradford Assay. Briefly a
standard curve was prepared using a serial dilution series (0mg/ml to 10mg/ml) of

Chapter 2 – Materials and Methods
87
purified BSA 100X (10mg/ml). The standard curve was constructed by plotting the
absorbance value against the known BSA concentration. The protein concentrations
of the samples were measured against the BSA standard curve.
2.11.3 SDS PAGE Electrophoresis and Western Blotting
The protein samples were mixed with 1x LDS buffer (Invitrogen) and 2-ME
and heated to 70°C for 10 minutes to denature and reduce the proteins. The
protein samples and 5µl of Novex® Sharp Pre-stained protein standard (Invitrogen)
were loaded into the wells of 12% NuPAGE® Bis-Tris Gel (Invitrogen). The SDS-PAGE
(Sodium Dodecyl Sulphate PolyAcrylamide Gel Electrophoresis) gels were cast and
run using the Bio-Rad Western apparatus and electrophoresed in 1X SDS-PAGE
running buffer at 200V for 35 minutes at 4°C. SDS-PAGE is a technique that
separates proteins according to their electrophoretic mobility (size and charge of
protein). The SDS detergent is used to coat the proteins with a negatively charged
sulphate group, as there is no relationship between the charge and size of a
protein. The SDS treated proteins will then migrate, in an electric field, according to
their size and can be separated by electrophoresis using a Polyacrylamide gel.
After separation by electrophoresis, the proteins were transferred onto a
nitrocellulose membrane (Amersham). Before the transfer, the membrane was
activated by incubating it in methanol for less than one minute, followed by 5
minute incubation in dH2O and finally soaking it in wet-transfer buffer. The gel was
placed on top of the nitrocellulose membrane, which was then sandwiched
between two pieces of Whatman filter paper. The sandwiched gel and

Chapter 2 – Materials and Methods
88
nitrocellulose paper were place in a cassette in the wet transfer system. The
transfer of the protein to the membrane for 1.5 hours at 30V was performed at 4°C.
This allowed the negatively charged proteins to move across towards the anode;
however it does not allow the proteins to pass through the nitrocellulose
membrane and hence are retained on the surface in the same alignment as in the
gel.
After the proteins were transferred on to the membrane, the membrane
was blocked in 5% w/v milk in TBST (Tris Buffered Saline with 0.1% Tween 20) for
1-2 hours at room temperature, before being incubated with the corresponding
primary antibodies (see Table 2.3). The primary antibodies were diluted according
to manufacturer’s instructions in blocking buffer and incubated at 4°C with
agitation. The following day, unbound primary antibody was removed by washing
the membrane 3 times in TBST, 15 minutes each at room temperature. The
membrane was then incubated in either goat anti-rabbit IgG HRP (Horseradish
peroxidase) conjugated or goat anti-mouse IgG HRP conjugated secondary antibody
for 1 hour at room temperature (Table 2.3). The secondary antibody was prepared
in 5% milk in TBST, at a 1:2000 dilution. The membrane was washed 3 times in TBST
for 15 minutes each at room temperature to remove any unbound secondary
antibody.

Chapter 2 – Materials and Methods
89
Primary Antibodies Secondary Antibodies
Antibody Species(Details)
Dilution Antibody Dilution
pSTAT3 Rabbit (Cell Signalling Technology, 9145)
1:2000 Goat anti rabbit IgG HRP (Biorad,
172-1019)
1:2000
STAT3 Rabbit (Cell Signalling Technology, 9132)
1:1000 Goat anti rabbit IgG HRP (Biorad,
172-1019)
1:2000
IKZF3 Rabbit (Abcam, ab26083) 1:500 Goat anti rabbit IgG HRP (Biorad,
172-1019)
1:2000
FOXO3 Rabbit (Abcam, ab47409) 1:1000 Goat anti rabbit IgG HRP (Biorad,
172-1019)
1:2000
Egr2 Rabbit (Santa Cruz, sc-20690)
1:1000 Goat anti rabbit IgG HRP (Biorad,
172-1019)
1:5000
Egr3 Rabbit (Santa Cruz, sc-191)
1:200 Goat anti rabbit IgG HRP (Biorad,
172-1019)
1:5000
β-actin Mouse (Cell Signalling Technology, 3700)
1:1000 Goat anti mouse IgG HRP (Sigma, A4416)
1:10000
Table 2.3: List of primary and secondary antibodies used for western blot with
relevant dilutions.

Chapter 2 – Materials and Methods
90
2.11.4 Protein Detection with Chemiluminescence
The membrane was transferred onto a cling film where the antibody
complexes were detected by ECL (Enhanced Chemiluminescence) plus kit
(Amersham) according to the manufacturer’s instructions. Briefly Solution A
containing 100mM Tris and 30% H2O2 was mixed with solution B containing
100mM Tris, 90mM coumaric acid and 250mM luminol was applied to the
membrane blot for 5 minutes at room temperature. This reagent contains
substances that are oxidised, catalysed by HRP, producing a luminescence signal.
All excess solutions were drained and the luminescence was detected by exposing a
photographic film (Kodak, Biomax x-ray film) to the membrane and then developing
the film.
2.12 Flow Cytometry
Flow cytometry is a technique used to investigate the multiple phenotype
and functional parameters simultaneously within a single cell or a mixed population
of cells. The protein of interest is identified by the use of antibodies that have a
high affinity to it. The antibodies are usually directly conjugated to a fluorescent
marker that is detectable by the fluorescence emitted from stained cell. Flow
cytometry can also detect the cell complexity and size by the forward and side
scattered light.
Single cell suspensions were obtained from the homogenised spleens or
lymph nodes, which were then incubated with indicated fluorescently labelled

Chapter 2 – Materials and Methods
91
antibodies on ice for 30 minutes in PBS containing 3% FBS. Fluorescein
isothiocyanate (FITC)-conjugated antibodies to B220, CD4, and CD8 were used.
Other antibodies that were used were phycoerythrin (PE)-conjugated antibodies to
CD3, CD4, CD8, CD19, CD25, CD62L, CD69; PerCP labelled antibodies to CD3, CD19,
B220; allophycocyanin (APC)-conjugated antibodies to CD44, CD3, and CD19. All
these antibodies were obtained from BD Biosciences. PE-conjugated antibody to
Aiolos was obtained from eBioscience (12-5789-80). Anti-Mouse Egr2 PE-
conjugated and Anti-Mouse Egr2 APC-conjugated antibodies were obtained from
eBioscience. After incubation the cells were washed and resuspended in PBS and
run through the flow cytometer, LSRII (BD Immunocytometry Systems) and the data
was analysed using FlowJo (Tree Star) at Queen Mary University of London BY
Professor Ping Wang.
2.13 Apoptosis Assay
The process of apoptosis brings about a number of changes to the cells
specific morphologic features, such as loss of plasma membrane asymmetry,
condensation of cytoplasm and nucleus. The loss of the plasma membrane
asymmetry occurs at the early stages of apoptosis and causes the membrane
phospholipid phosphatidylserine (PS) to translocate from the inner to the outer
leaflet of the plasma membrane, hence exposing it to the external cellular
environment. To determine the number of apoptotic cells, they were stained with
Annexin V (BD Bioscience); a protein that binds to the PS. The cells were also
stained in conjunction with Propidium Iodide (PI). This was to exclude the cells that

Chapter 2 – Materials and Methods
92
were already dead, as PI binds to nucleic acids and hence these are only obtainable
by the permeable membranes of dead cells. Therefore cells that are negative for
both Annexin V and PI are considered viable, while cells that are positive for
Annexin V and negative for PI are in their early stages of apoptosis. Cells that are
identified positive for both Annexin V and PI are cells in their late apoptosis or
already dead.
The staining was carried out as per the manufacturer’s instructions. Briefly
the cells were resuspended in Annexin V binding buffer containing 100mM HEPES,
140mM NaCl, 25mM CaCl2, pH 7.4 and APC-conjugated Annexin V and PI. The cells
were incubated for 15 minutes in the dark at room temperature. After 15 minutes,
the sample was further diluted in the binding buffer containing
7-amino-actinomycin (7AAD from BD Bioscience), which is used for the exclusion of
nonviable cells. The cells were analysed on a LSRII (BD Immunocytometry Systems)
at Queen Mary University of London.
2.14 Identification and characterisation of tumours
2.14.1 Tissue Preparations
All tissue samples collected were recorded and assigned an ID number. All
tumours were assigned the name “KO” followed by the next ascending letter, such
as ‘A’, ‘B’, or ‘C’.
The tissue samples were collected and fixed in 4% paraformaldehyde (PFA)
overnight at 4°C. The 4% PFA was replaced with 70% ethanol prior to paraffin

Chapter 2 – Materials and Methods
93
processing to wash away the PFA. The organs were secured within the cassettes
and placed within the Shandon Hypercenter XP tissue processor which takes the
tissue sample through a series of graded alcohol concentration washes to
dehydrate the tissues and then into xylene followed by the tissues permeating in
hot paraffin (Table 2.4).
Tissues processed into paraffin were melted at 65°C and the paraffinized
specimens were placed into a mould and embedded with hot paraffin. The samples
were left to cool and stored at room temperature. The tissue samples were
sectioned into 7μm sections using a microtome. The cut sections were placed into a
50°C water bath and then mounted onto polysine-coated microscope slides. The
slides were incubated at 60°C for approximately 30 minutes and left at 37°C
overnight.
Program Temp Immersion Time
1 x 70% Alcohol Room Temp 2 hours
1 x 90% Alcohol Room Temp 2 hours
1 x 95% Alcohol Room Temp 2 hours
3 x 100% Alcohol Room Temp 2 hours
2 x Xylene Room Temp 2 hours
2 x Paraffin wax 60°C 2 hours
Table 2.4: Tissue processing program. Tissues were dehydrated with alcohol,
cleared with xylene and infiltrated with paraffin wax.

Chapter 2 – Materials and Methods
94
2.14.2 Haematoxylin and Eosin Staining
Haematoxylin and eosin staining (H&E) is the most commonly used tissue
staining for the histology of animal tissues and routine pathology. Haematoxylin
gives a dark purplish blue, which stains the chromatin within the nucleus. Eosin is a
pink to red dye that stains the cytoplasmic material, as well as the connective
tissues and collagen.
The staining was performed as follow; the tissue sections were
deparaffinised and rehydrated by first incubating in 100% xylene and then in
decreasing concentrations of ethanol (100%, 95%) for 3 minutes each. The tissue
sections were dipped in ddH2O before incubating in Harris acidified haematoxylin
(6 minutes), acid alcohol (~15 secs), 0.2% ammonium, solution (40secs), Eosin
(45secs). Between each step, the slides were cleansed under running tap water. The
tissue sections were then dehydrated in a series of ethanol solutions (95%, 100%)
for 2 minutes each, followed by 3 times in 100% xylene. The slides were mounted
with Histomount (National Diagnostics, HS-103 ), covered with coverslips and left
overnight to dry. Histomount is a neutral solution of isomers and non-hazardous
ingredients in xylene. By applying this solution the coverslips were permanently
attached to the slides. The tissue sections were analysed using a conventional
microscopy (Axioskop 2). The histology examination of the tissue sections was done
in a blind manner.

Chapter 2 – Materials and Methods
95
2.14.3 Immunohistochemistry Staining
All Immunohistochemistry staining were analysed using a Zeiss fluorescence
microscope equipped with a CCD camera and the Smart Capture software (Digital
Scientific Cambridge, UK).
2.14.3.1 Immunohistochemistry Staining on cells
The cells were harvested and smeared onto Superfrost plus microscope
slides (Thermo Scientific). The cells were left to dry at room temperature for 30
minutes and then fixed in acetone for 10 minutes at -20°C. The slides were left dry
for approximately 10 minutes. The cells were washed twice in sterile cold 1 X PBS
for 5 minutes each followed by blocking in 10% normal goat serum (Invitrogen) for
one hour at room temperature, to minimise any non-specific binding of IgG. The
cells were incubated with the appropriate primary antibody (Table 2.5) in a
humidified chamber at 4°C overnight.
The following day, the cells were washed three times in 1 X PBS for 10
minutes each, at room temperature to remove any unbound primary antibody. The
cells were incubated with their respective secondary antibody (Table 2.5) for 2
hours in the dark at room temperature. The cells were washed again three times
with 1 X PBS for 10 minutes each at room temperature to remove any unbound
secondary antibody. The slides were dried before mounting them in Vectashield®
Mounting Medium containing DAPI and covered with a coverslip, removing any
excess mounting media and the cells were visualised with a fluorescent microscope.

Chapter 2 – Materials and Methods
96
Negative controls were prepared by omitting the primary antibody during the
immunohisotchemsitry procedure.
Primary Antibodies
Secondary Antibodies
Antibody Species(Details) Dilution Antibody Dilution
Ikaros Rabbit (Abcam, ab26083)
1:200 Goat anti rabbit Alex Flour 594 (Invitrogen, A11012 )
1:2500
FOXO3 Rabbit (Abcam, ab47409)
1:300 Goat anti rabbit Alex Flour 594 (Invitrogen, A11012 )
1:4000
Table 2.5: List of primary and secondary antibodies used in IHC on cells.
2.14.3.2 Immunohistochemistry staining on paraffin-
embedded tissues.
For the identification of the tumour phenotype, the paraffin embedded
tumour tissues were deparaffinised and rehydrated by incubating first in 100%
xylene and then in decreasing concentrations of ethanol (100%, 90%, 70%). Antigen
retrieval was performed by boiling the slides in 10mM Tris/1mM EDTA, pH 9.0 (or in
EDTA) for 20 minutes at 95°C. The slides were cooled at room temperature for 30
minutes and then blocked in 10% normal goat serum in PBS for 1 hour. The slides
were then stained with the relevant primary antibody (Table 2.6) prepared in 10%
normal goat serum in PBS and incubated overnight at 4°C in a humidified chamber.
After washing with PBS, the sections were stained with the relevant
secondary antibody (Table 2.6) for 2 hours at room temperature. The sections were

Chapter 2 – Materials and Methods
97
washed thrice with PBS and counterstained with DAPI and visualised with a
fluorescence microscope.
Primary Antibodies Secondary Antibodies
Antibody Species(Details) Dilution Antibody Dilution
CD3 Rabbit (Dako, A0452) 1:100 Goat anti rabbit Alexa Flour 594 (Invitrogen,
A11012)
1:400
B220 Rabbit (BD, 550286) 1:20 Goat anti rat FITC (Sigma, F-625)
Or
Rabbit anti rat Texas Red (Abcam, ab6732)
1:200
pSTAT3 Rabbit (Cell Signalling Technology, 9145)
1:200 Goat anti rabbit Alexa Flour 594 (Invitrogen,
A11012)
Or
Goat anti rabbit Alexa Fluor 488 (Invitrogen,
A-11008)
1:2000
1:1000
PCNA
Mouse (Santa Cruz, SC-56)
1:100 Rabbit anti Mouse Alexa Flour 488 (Invitrogen,
A11059)
1:100
Table 2.6: List of primary and secondary antibodies used in IHC on paraffin tissue
sections.
2.14.3.3 Detection of Immunoglobulin deposition in Kidney
The detection of the immunoglobulin deposition in the glomeruli was
performed by deparaffinising the kidney sections as mentioned above. The sections
were stained with Texas Red conjugated donkey anti-mouse IgG (Jackson

Chapter 2 – Materials and Methods
98
ImmunoResearch Lab, INC) at room temperature for 2 hours. The sections were
washed with PBS and counterstained with DAPI.
2.15 Microarray
CD4+ T cells were isolated from CD2-Egr2-/- and wild type mice by MACS, as
described in section 2.2, and were stimulated with or without plate bound anti-CD3
for 6 hours. Total RNA was extracted using the Trizol reagent as described in section
2.5. The genome –wild transcriptional profiles were analysed using MouseRef-8
v2.0 BeadChip expression array (Illumina). The BeadChip array consists of 50-mer
oligonucleotide probes that targets ~ 25,600 well-annotated RefSeq transcripts.
The probe labelling, array hybridization and data processing were carried
out at the Microarray Facility, Barts and London School of Medicine and Dentistry,
Queen Mary University of London, according to the manufacturer’s instructions.
Briefly the fluorescently labelled RNA sequence is hybridised to the array, where
the labelled RNA will hybridise to the complementary sequences present on the
array. Any unbound RNA was washed away. The array was then scanned to detect
the fluorescence intensity, providing the genome wide transcriptional profile for
the sample compared to the control.
The data analysis was also performed by Dr Alistair Symonds at Barts and
London School of Medicine and Dentistry, Queen Mary University of London, which
was returned to us to perform further data analysis. We focused on the gene that
showed a difference of at least 2 fold between the wild type and CD2-Egr2-/- CD4+ T
cells and excluded the gene that had a detection p value greater than 0.05. The

Chapter 2 – Materials and Methods
99
differently expressed genes were first grouped based on self-organisation maps
(SOMs) by clustering algorithm method. The SOM clusters were further clustered by
a hierarchical clustering program to confirm the different profile. The gene
expression profile genes were validated by Real Time RT-PCR and any genes that
has a detection p-value greater than 0.05 were excluded.
2.16 Chromatin Immunoprecipitation.
Chromatin Immunoprecipitation (ChIP) is a technique that enables the
detection of Protein DNA interaction in vivo. The protein of interest is specifically
precipitated by an antibody to its associated DNA. The ChIP assays were performed
in accordance with the protocol supplied with the kit (cat 9003 from Cell Signalling
Technology). This procedure was performed by Dr Tizong Miao.
Briefly, 5 x 10⁷ CD4+ T cells from Egr2 transgenic mice were stimulated with
plate bound anti-CD3 and anti CD28 for 3 hours at 37˚C. The cells were cross-linked
with 4ml of 10% formaldehyde for 10 minutes at room temperature (final
concentration of 1%). This chemical binds the chromatin together preventing the
dissociation that normally occurs upon cellular lysis. The formaldehyde was
quenched with 125 mM glycine and the cells were washed twice with PBS, followed
by the cell lysis with lysis buffer containing 1% SDS, 10mM EDTA, 50mM Tris pH8.
The cells were transferred into a 15ml tube and the lysed cells were then sonicated
to shear the DNA protein complexes into small length fragments. The sonication
was verified by taking a small sample of the chromatin and heating it to 65 ˚C
overnight, to reverse the crosslinks, and running it on 1% agarose gel. The sample

Chapter 2 – Materials and Methods
100
was centrifuged and the supernatant was dialysed in 200ml dilution buffer and
protease inhibitors for 1 hour at room temperature. This was repeated two more
times at 4°C for 1 hour each time.
The dialysed chromatin was transferred into a 15ml tubes containing 500µl
salmon sperm DNA (ssDNA)/BSA blocked protein A beads (Amersham) and
incubated at 4°C for 1hour with rotation to preclear. This step was done to remove
any proteins or DNA that binds non-specifically to Protein A beads. Chromatin
(500µg) was centrifuged and the supernatant was transferred into a new tube
(ensuring beads were present in supernatant). The chromatin was then used as a
template for immunoprecipitation. An anti-Egr2 antibody (Covance) or
anti-histone 3 antibody as positive control or anti-Ig as a negative control was
added and incubated at 4˚C overnight. The anti-Egr2 antibody binds to the Egr2
protein and associated DNA and this antibody-protein-DNA complex can then be
precipitated by the addition of ssDNA/BSA-blocked Protein A beads. The antibody-
chromatin complex was collected and purified using QIAquick PCR purification kit
to purify the DNA, after the final wash the pellet was resuspended in elution buffer
containing SDS, which denatures the antibody and Protein A, resulting in the
release of the immunoprecipitated chromatin complexes. The crosslinks were then
reversed by heating the complexes at 65˚C overnight. The DNA was purified in
accordance with the kit and template was used for PCR with ChIP primer sequences
shown in Table 2.7.

Chapter 2 – Materials and Methods
101
Gene Primer Strand Primer Sequence (5'-3')
SOCS3-1 Sense CAAGGATTTCACAAACGCCTG
Antisense GAGAGGCCTGTAGTACACCA
SOCS3-2 Sense CCAACTTCTCATTCACACTTTCC
Antisense TACATGAGGACCTCGGAGTG
Nab2 Sense ATAGCTCGGCCTCGGTCAC
Antisense GGACTCAAGAATCGGGCTC
IKAROS Sense CCCTCTAAGTCCTTCTTTATTCCT
Antisense GAAATGAGACACATCAGCCC
FOXO3 Sense CTGTATTCCAAAGTTGGCCG
Antisense CTAAGGAGGAAGGACCAAGAC
Table 2.7: ChIP primer sequences.
2.17 Chromatin Immunoprecipitation Microarray chip
One of the recent techniques performed to identify genes that directly
interact with Egr2 transcription factor was Chromatin Immunoprecipitation
Microarray chip (ChIP-on-chip).
The procedure follows on from the ChIP protocol. The purified
immunoprecipitated sample from the ChIP experiment was amplified using the
GenomePlex Whole Genome Amplification (WGA2) kit. The amplified sample was
labelled and hybridised to the GeneChip® Mouse Promoter 1.0R Array (a 49 Format
Array from Affymetrix). This array studies the protein/DNA interaction in over
Chapter 2 – Materials and Methods
102
26,000 mouse promoters. This was performed by Professor Ping Wang and Dr
Tizong Miao.
After hybridisation the chip was analysed using bioinformatics tools by Dr
Alistair Symonds. The genes of interest were validated by both Real Time RT-PCR
(section 2.10) and ChIP (section 2.16).
2.18 Enzyme-Linked immune Sorbent Assay (ELISA)
All cytokine analysis was performed by Dr T. Miao and Meera Raymond at
Barts and London School of Medicine and Dentistry, Queen Mary University of
London. The procedures have been briefly explained below. The concentrations of
cytokines in the cell culture supernatants and sera were measured using ELISA kits.
ELISA kits IFN-γ and IL-3 were obtained from R & D; whereas IL-6, IL-10, IL-17A, IL-
17F and GM-CSF were from BD Bioscience. The procedure was performed according
to the manufacturer’s instructions. The ELISA plates were coated with the relevant
1 X capture antibody at 4˚C overnight. The coating buffer was washed 5 times with
wash buffer (1 X PBS and 0.05% tween-20) for 5 minutes each at room
temperature. The plate was blocked with 1 X assay diluent (blocking buffer) for 3
hours at room temperature. The plate was washed five times with wash buffer at 5
minutes each followed by the addition of 1 X assay diluent to the control wells. A 2-
fold serial dilution was performed using the provided standard for each antibody
analysis. To the remaining wells, the serum from Egr2-/-Egr3-/- and wild type samples
were centrifuged at 8500rpm for 5 minutes and plated out into the relevant wells.
The ELISA plate was wrapped in foil and incubated at 4˚C overnight. The following

Chapter 2 – Materials and Methods
103
day the plate was washed 5 times with wash buffer, as previously mentioned. 100µl
of the appropriate detection buffer was added to each well and incubated for 3
hours at room temperature. The wells were washed 5 times with wash buffer. The
enzyme Avidin-HRP was added to the plates and incubated for 1 hour at room
temperature followed by 7 washes with the wash buffer. The substrate solution
was added to the wells for 15 minutes at room temperature followed by the
reading the plate at 450nm and the data was analysed.
2.19 Telomere Length
2.19.1 Metaphase Preparation
CD4+ T cells and CD19+ B cell were isolated as described in section 2.3. The
cells were cultures in medium with or without simulation as described in section
2.2. The cells were treated with colcemid (10μg/ml) (Sigma-Aldrich) for 2 hours at
37°C. Colcemid arrest the cells in metaphase by inhibiting the mitotic spindle
formation. The treated cells were transferred into a 15ml tube and centrifuges at
1200rpm for 5 minutes. The decant was discarded and the cells were treated with
pre warmed hypotonic buffer (75mM KCl) at 37°C for 15 minutes. This step is
critical and had to be performed with a Pasteur pipette with a drop at a time,
followed by gentle agitation. A total of 3 ml was added and the incubation time was
started from the first drop. The cells were centrifuged and then fixed in freshly
prepared fixative containing methanol and glacial acidic acid (3:1) for 10 minutes at
room temperature. The fixative process was repeated twice more, with incubation

Chapter 2 – Materials and Methods
104
times of 10 minutes and 30 minutes, respectively. When adding the fixative, care
was taken by initially adding the first ml of the fixative slowly and drop wise and
then gently followed by the remaining 2 ml. The cell pellet was resuspended in
fresh fixative and 20μl of the cells were dropped onto pre-cleaned slides. The cells
in the fixative solution ensure that the mitotic cells were spread over the surface of
slide effectively. The slides were left to dry and checked under a phase contrast
microscope.
2.19.2 Quantitative Fluorescent in situ hybridization (QFISH)
The slides containing the metaphase cells were aged at 54˚C overnight. The
slides were washed with PBS for 5 minutes. The slides were then fixed with 4%
Formaldehyde for 2 minutes followed by three 5 minute washes with PBS. The
slides were further processed with pre-warmed 0.1% pepsin (Sigma) prepared in
50ml acidified waster (49.5ml of ddH20 containing 0.5ml HCl) for 10 minutes at
37˚C. The slides were washed twice with PBS and fixed in 70% Formaldehyde for 2
minutes. The fixative was washed away with three PBS washes followed by
dehydration of the slides in ethanol series of 70%, 90% and 100%. The slides were
left to air dry at room temperature.
The slides were then hybridised to the synthetic oligonucleotide PNA
(peptide nuclei acid) labelled with FITC, which is specific for the telomeric DNA
sequence (CCCTAA)3. The slides were heated at 72˚C for 2 minutes and then left at
room temperature for 2 hours in a dark humidified chamber for hybridisation.

Chapter 2 – Materials and Methods
105
After hybridisation, the slides were washed twice in 70% formamide
solution for 15 minutes at room temperature, followed by three PBS washes.
Samples were then dehydrated in ethanol series as before and mounted with
Vectashield® Mounting Medium containing DAPI.
Images of both interphase and metaphase cells were acquired using the
Smart Capture software (Digital Scientific, Cambridge) and the telomere
fluorescence analysed using the IP Lab software.
2.20 Statistical Analysis
Data was expressed as mean± SEM. Statistical analysis was performed using
Student’s unpaired t-test to analyse the statistical significance of differences
between groups. A p-value of <0.05 was considered as significant.

Chapter 3 – Results
106
- Results Chapter 3
3.1 Genotyping of Egr2 and Egr3 Knockout Mice Model

Chapter 3 – Results
107
The aim of the project was to understand the mechanism of Egr2 and 3 in
the regulation of peripheral lymphocyte function. In order to establish Egr2 and 3
deficient lymphocytes, we cross-bred CD2-Egr2-/- mice, which were established in
our group (Zhu, Symonds et al. 2008) with Egr3-/- mice (Tourtellotte and Milbrandt
1998) to produce Egr2-/- Egr3-/- mice.
3.1.1 The CD2-specific Egr-2 knockout mice.
Before cross-breeding, the CD2-Egr2-/- mice were genotyped with specific
primers that resulted in three PCR products, which were the Egr2 LoxP, Cre and wild
type Egr2 bands. The PCR from CD2-Egr2-/- mice showed 210 base pair (bp) LoxP-
Egr2 and 150 bp Cre products (Figure 3.1). Wild type mice produced a 190bp band.
Figure 3.1: Generation of CD2-Egr2-/- mice.
Egr-2LoxP/LoxP mice were crossed with hCD2-Cre transgenic mice to produce CD2-Egr2-/- mice.
The genomic DNA was extracted from the mouse tail and the CD2-Egr2-/- mice were
identified by PCR. Lane 1 – positive control, lane 2 – WT (CD-Egr2+/+), lane 3 - CD2-Egr2-/+
and lane 4- CD2-Egr2-/- homozygous mice.
LoxP AlleleWT Allele
Cre
1 2 3 4

Chapter 3 – Results
108
3.1.2 Egr2 and Egr3 knockout mice.
We took F1 littermates from parental breeding to breed F2. From F2, we
selected mice with homozygous deletion of Egr3 or Egr2-LoxP and Cre for further
breeding. The sequential breeding reached final generation with homozygous
deletion of Egr3 and with homozygous positive for Egr2 LoxP and Cre. These mice
were then used as breeding pairs to produce experimental mice. The genotyping of
mice showed an 800bp PCR product of Neo allele, 400bp of Egr3 wild type allele,
150bp of Cre and 210bp of LoxP (Figure 3.2). Thus, we developed Egr2-/-Egr3-/- mice.
Figure 3.2: Generation of Egr2-/-Egr3-/- mice.
CD2-Egr2-/- mice were crossed with Egr3-/- mice. Egr2-/-Egr3-/- mice were identified by PCR,
testing for LoxP, Cre and Egr-3 Neo. Lanes 1 – Positive Control, lane 2 - CD2-Egr2-/+Egr3-/+
mice. Lanes 3 - Egr2-/-Egr3-/- positive mice.
LoxP AlleleWT Allele
Cre
Neo Allele
WT AlleleEgr3-/-
CD2-Egr2-/-
1 2 3

Chapter 3 – Results
109
3.1.3 Protein Expression of Egr2 and Egr3 in Egr2-/- Egr3-/- mice
The complete deletion of Egr2 and Egr3 at protein levels (by Tizong Miao)
was confirmed by western blot and flow cytometry. As expected the level of Egr2
and Egr3 was significantly reduced or undetected in the Egr2-/-Egr3-/- mice
compared to wild type (Figure 3.3).
Figure 3.3: Defective Egr2 and Egr3 protein expression in lymphocytes from Egr2-/-
Egr3-/- mice.
(A) Western blot analysis of Egr2 and Egr3 in unstimulated (-) and stimulated (+) CD4+ T
cells and CD19+ B cells(B) Egr2 protein expression validated by flow cytometry. Egr2-/-Egr3-/-
mice for unstimulated and stimulated CD4+ T cells and CD19+ B cells.
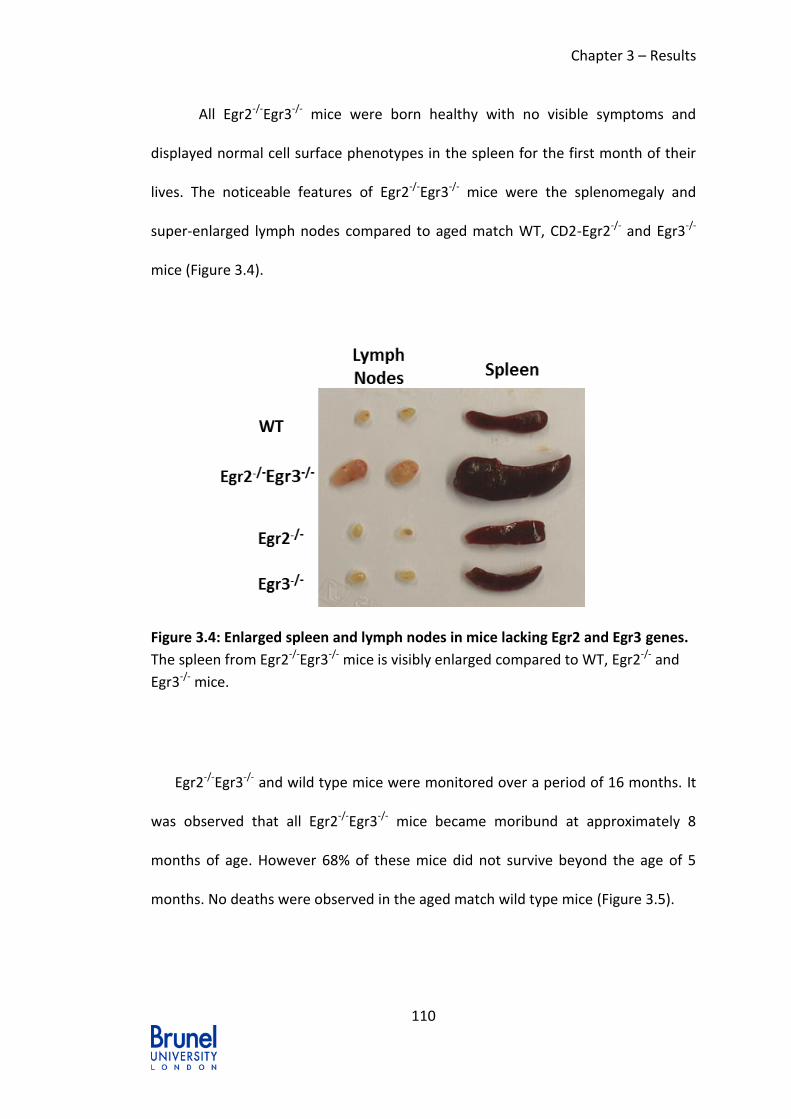
Chapter 3 – Results
110
All Egr2-/-Egr3-/- mice were born healthy with no visible symptoms and
displayed normal cell surface phenotypes in the spleen for the first month of their
lives. The noticeable features of Egr2-/-Egr3-/- mice were the splenomegaly and
super-enlarged lymph nodes compared to aged match WT, CD2-Egr2-/- and Egr3-/-
mice (Figure 3.4).
Figure 3.4: Enlarged spleen and lymph nodes in mice lacking Egr2 and Egr3 genes.
The spleen from Egr2-/-Egr3-/- mice is visibly enlarged compared to WT, Egr2-/- and
Egr3-/- mice.
Egr2-/-Egr3-/- and wild type mice were monitored over a period of 16 months. It
was observed that all Egr2-/-Egr3-/- mice became moribund at approximately 8
months of age. However 68% of these mice did not survive beyond the age of 5
months. No deaths were observed in the aged match wild type mice (Figure 3.5).

Chapter 3 – Results
111
Figure 3.5: Survival Rate of Egr2-/-Egr3-/- and wild type mice.
Egr2-/-Egr3-/- mice became moribund at approximately 8 months of age compared
to WT.
Along with the prominent features of splenomegaly and lymphadenopathy,
the mice also developed tumours (please refer to section 3.2) and chronic
inflammation (please refer to section 3.4).

Chapter 3 – Results
112
3.2 Spontaneous Lymphoma Development in Egr2 and Egr3
Double Knockout Mice

Chapter 3 – Results
113
3.2.1 Characterisation of lymphomas from Egr2 and Egr3 defective
mice.
Surprisingly we observed the development of spontaneous lymphoma in
Egr2-/-Egr3-/- mice (Figure 3.6). The initial step was to classify the tumour from the
Egr2-/-Egr3-/- mice. All the tumour samples and the organs, such as the spleen, lung,
liver, kidney, and various lymph nodes were processed for sectioning. To observe
the morphology of the cells, the tissue section slides were prepared and stained
with haematoxylin and eosin (H&E). Tissue sections were examined blindly, and
classified according to the Bethesda proposal (Morse, Anver et al. 2002) (Figure
3.7).
The tumours were characterised by immunostaining using antibodies
against T cell, B cell and monocytes specific markers, CD3, B220 and CD11b,
respectively. As expected we found the tumours to be of either T cell or B cell origin
and negative for monocytes (data not shown). Figure 3.7 shows both B cell positive
and T cell positive tumours in the Egr2-/-Egr3-/- mice.
The great majority of the tumours found in our cohort were classified as
small B cell lymphoma (SBCL) or small T cell lymphoma (STCL), due to their
histological characteristics of small, uniform cell size and round shape and scant,
basophilic cytoplasm. The majority of the tumours were of diffuse pattern as
suggested in the Bethesda proposal (Morse, Anver et al. 2002). It should be
mentioned, however, that the mouse SBCL and STCL cannot be considered the
counterpart of human small cell lymphoma because of notable differences in
histology features (Morse, Anver et al. 2002). According to the same classification,

Chapter 3 – Results
114
cases of T cell lymphoblastic lymphoma, large cell anaplastic T cell lymphoma and
diffuse large B cell lymphoma occurred at very low frequencies.
Figure 3.6: Tumour formation in Egr2 and Egr3 defective mice.
(A) Tumour (2 x 1.5 x 1.5cm2) formed outside of the chest of Egr2-/-Egr3-/- mice. (B) Tumour
found in the spleen (1cm2) of Egr2-/-Egr3-/- mice. (C) Tumour in spleen (6 X 2 x 2cm2), kidney
and liver of CD2-Egr2-/- mice. (D) Tumour (1cm2) formed outside of the chest in Egr2-/-Egr3-/-
mice.
CLiver
Kidney
Spleen
D
A B
Tumour in spleen
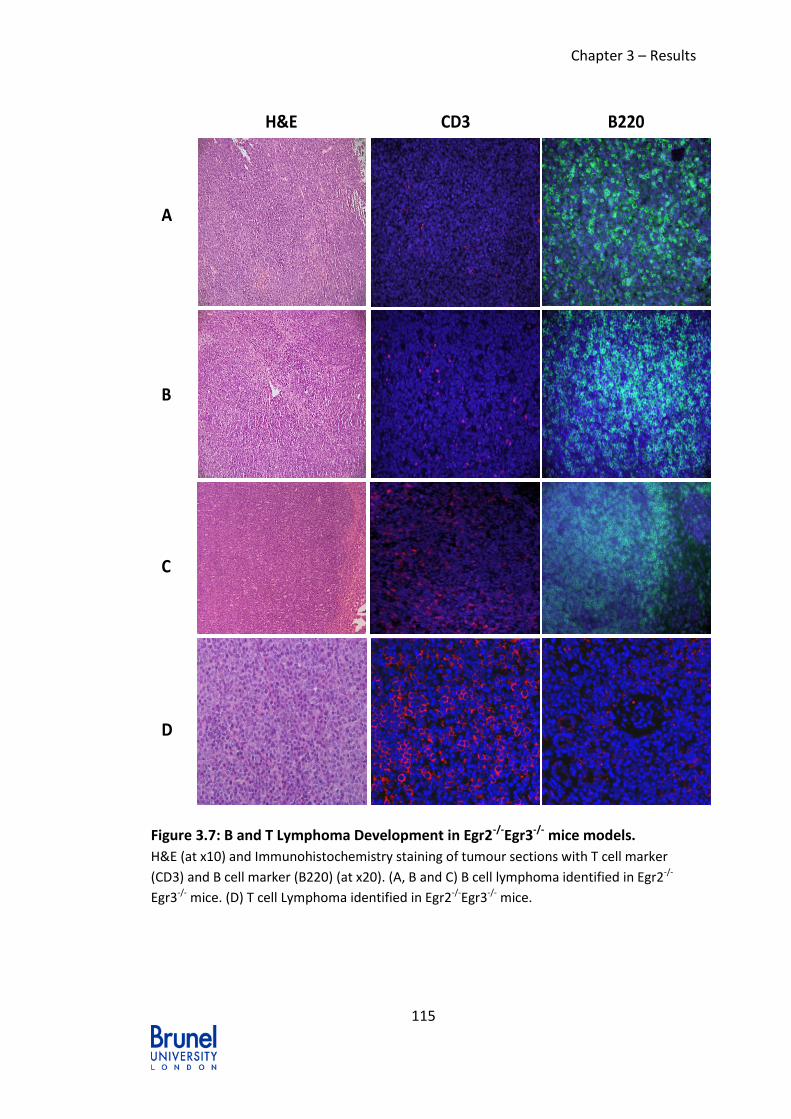
Chapter 3 – Results
115
Figure 3.7: B and T Lymphoma Development in Egr2-/-Egr3-/- mice models.
H&E (at x10) and Immunohistochemistry staining of tumour sections with T cell marker
(CD3) and B cell marker (B220) (at x20). (A, B and C) B cell lymphoma identified in Egr2-/-
Egr3-/- mice. (D) T cell Lymphoma identified in Egr2-/-Egr3-/- mice.
H&E CD3 B220
A
B
C
D
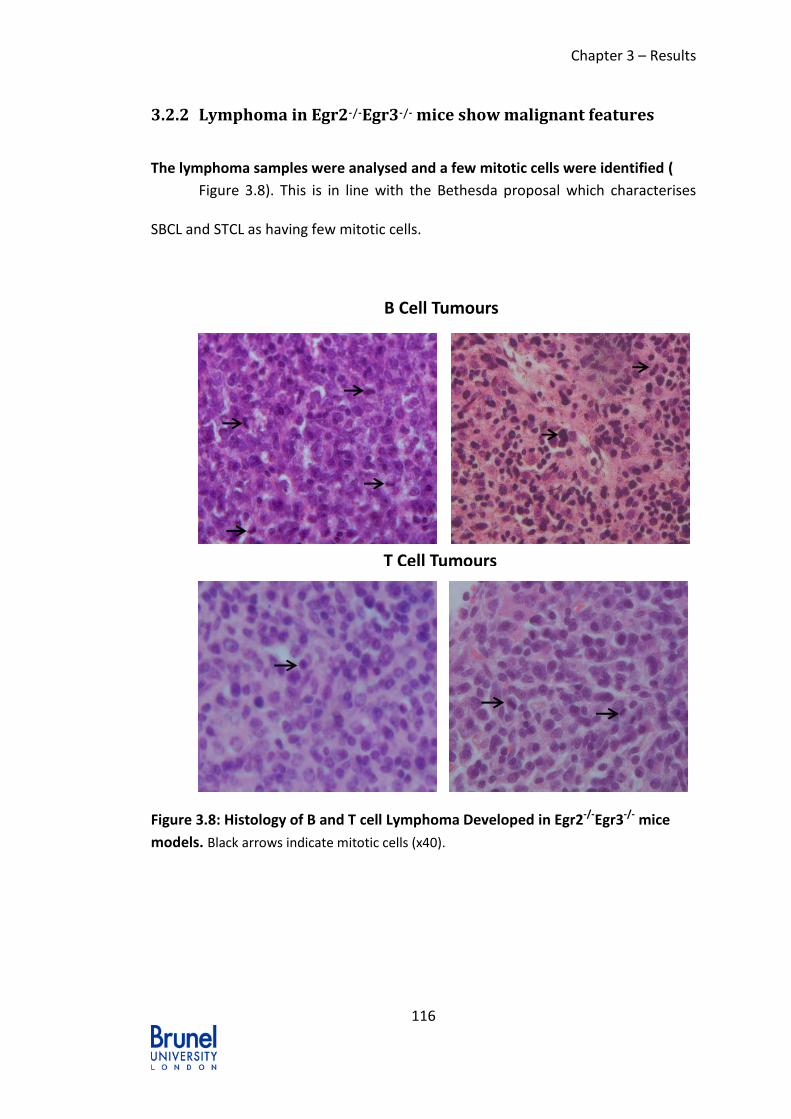
Chapter 3 – Results
116
3.2.2 Lymphoma in Egr2-/-Egr3-/- mice show malignant features
The lymphoma samples were analysed and a few mitotic cells were identified (
Figure 3.8). This is in line with the Bethesda proposal which characterises
SBCL and STCL as having few mitotic cells.
Figure 3.8: Histology of B and T cell Lymphoma Developed in Egr2-/-Egr3-/- mice
models. Black arrows indicate mitotic cells (x40).
T Cell Tumours
B Cell Tumours

Chapter 3 – Results
117
One of the characteristics of malignant tumours is metastasis; hence both
lymphoid and non-lymphoid organs were checked for any metastasis. As expected,
all the Egr2-/-Egr3-/- mice developed malignant tumours, which also extensively
invaded into the non-lymphoid organs. Histology of the organs from Egr2-/-Egr3-/-
mice revealed complete effacement of their normal tissue architecture by
accumulating lymphocytes (Figure 3.9).
Furthermore, immunostaining of the organs from the tumour bearing mice
also demonstrated the same immunophenotype as the tumour tissues. As seen in
Figure 3.9, the lymphoma was found outside of the chest and was confirmed as
SBCL (Figure 3.7B). The cell morphology and immunophenotype of the spleen, liver,
kidney and lung from this mouse were analysed. As seen in Figure 3.9, the normal
splenic architecture was obliterated with extensive invasion of the red pulp area by
lymphomatous infiltrations. Similar invasion of the lung, liver and kidney by
lymphoma cells was also observed. The immunophenotype of the lymphocytes was
confirmed to be B cell positive (Figure 3.9).
These results clearly demonstrate that the lymphomas in Egr2-/-Egr3-/- mice
are highly malignant.

Chapter 3 – Results
118
Figure 3.9: Lymphoma in Egr2-/-Egr3-/- deficient mice is highly malignant.
Lymphoid and non-lymphoid organs from B cell lymphoma mice stained with H&E (X10)
(left panels) and B cell marker B220 (X20) (right panels). All of the organs shown are
infiltrated with and positive for B cells.
Kidney
Liver
Spleen
Lung
H&E B220

Chapter 3 – Results
119
3.2.3 Genetic dose effect of Egr2 and Egr3 in lymphomagenesis
Interestingly, the lymphoma development is associated with the doses of
deficiency of Egr2 and 3. No lymphomagenesis was observed in aged match wild
type and Egr3-/- mice (Figure 3.10A). The majority of CD2-Egr2-/- mice had
lymphoma formation at later stages of their life. Surprisingly, we found that the
Egr2-/-Egr3-/+ and Egr2-/-Egr3-/- mice developed lymphoma much earlier, before the
age of 5 to 6 months compared to CD2-Egr2-/- mice which were up to 10 months of
age. Figure 3.10B and Figure 3.10C clearly demonstrate the genetic dose effect of
Egr2 in tumour formation.
All the tumours from the Egr2-/-Egr3-/- mice had metastasised into other
organs, specifically in the kidney, liver and lung, whereas only around 70% of the
CD2-Egr2-/- showed metastatic tumours. The number of tumour formation in the
Egr2-/-Egr3-/- mice was less compared to CD2-Egr2-/-, which could be owing to the
fact the Egr2-/-Egr3-/- became moribund at a much earlier age, due to the onset of
inflammatory autoimmune disease.

Chapter 3 – Results
120
Figure 3.10: Genetic Dose effect of Egr2 and Egr3 in lymphomagenesis.
(A) Tumour induction of all mice from birth and beyond 12 months. (B) and (C) are adapted from (A). (B) Tumour induction in all mice models ages 5
months or younger. (C) Tumour induction in all mice ages 10 months or older. NB: Egr2-/-Egr3-/- mice do not survive beyond 8 months.

Chapter 3 – Results
121
3.3 Hyper-Homeostatic Proliferation in Egr2 and Egr3
Defective Mice

Chapter 3 – Results
122
3.3.1 Increased lymphocytes in Egr2-/-Egr3-/- in lymphoid organs
The noticeable features of Egr2-/-Egr3-/- mice, along with lymphoma
development were the extremely enlarged spleen and super-enlarged lymph nodes
compared to aged match WT, CD2-Egr2-/- and Egr3-/- mice (Figure 3.4). The early
onset of spontaneous lymphomas led us to investigate the cell survival of the
lymphocytes. Firstly, we quantified the lymphocytes in peripheral lymphoid organs.
Consistent with the enlarged lymphoid organs, the total cells in spleen and lymph
nodes were significantly increased compared to wild type counter parts. The
absolute number of T cells was 7 times that of wild type age matched mice. This
was also seen in the B cells, which showed 6 times that of wild type age matched
mice. This suggests hyper-homeostatic proliferation in the Egr2-/-Egr3-/- mice (Figure
3.11B).
To observe the effect of the enlarged spleen and lymph nodes, we observed
the number of lymphocytes from wild type and Egr2-/-Egr3-/- mice, in different aged
mice. We found that up until 5 weeks the number of CD19+, CD4+ and CD8+ cells in
Egr2-/-Egr3-/- mice were similar to aged matched wild type mice. Conversely, from 7
weeks onwards we noticed an increase in the number of lymphocytes in our
Egr2-/-Egr3-/- mice, with a significant difference at 11 week old mice (Figure 3.11A).
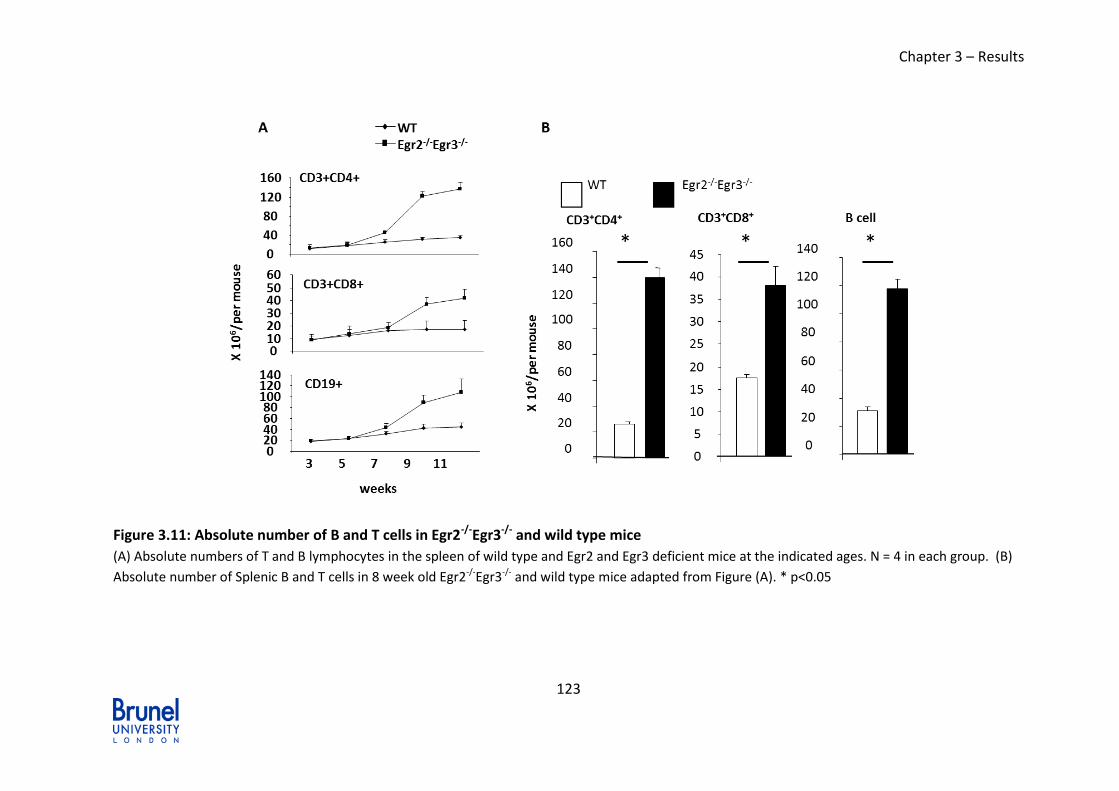
Chapter 3 – Results
123
Figure 3.11: Absolute number of B and T cells in Egr2-/-Egr3-/- and wild type mice
(A) Absolute numbers of T and B lymphocytes in the spleen of wild type and Egr2 and Egr3 deficient mice at the indicated ages. N = 4 in each group. (B)
Absolute number of Splenic B and T cells in 8 week old Egr2-/-Egr3-/- and wild type mice adapted from Figure (A). * p<0.05

Chapter 3 – Results
124
3.3.2 Survival of Egr2 and Egr3 deficient T and B cells
Lymphoma development was observed in our model, as supported by the
increased number of lymphocytes in Egr2-/-Egr3-/- compared to wild type; hence we
looked at the cell survival. This was performed by studying the cell viability of the
lymphocytes from Egr2-/-Egr3-/- mice compared to wild type. Briefly the CD4+ and
CD19+ cells were collected and their cell viability was examined by Trypan blue
exclusion assay from day 0 to day 13. As expected, we found both the CD4+ and
CD19+ cells from the Egr2-/-Egr3-/- mice to be more viable compared to the wild type
mice. Both CD4+ and CD19+ cells started with similar cell viability but by day 5,
Egr2-/-Egr3-/- CD4+ and CD19+ cells were around 2 times more viable than wild type
mice. This was also seen at Day 10, where CD4 cells in the Egr2-/-Egr3-/- show to be
2 times more viable and CD19+ cells show to be 3 times more viable than wild type
(Figure 3.12).
These results clearly show that the lymphocytes from Egr2-/-Egr3-/- mice are
more viable compared to wild type.

Chapter 3 – Results
125
Figure 3.12: Cell Viability of CD4+ and CD19+ cells in Egr2-/-Egr3-/- and wild type
mice.
(A) Cell viability of CD4+ T cells from Egr2-/-Egr3-/- and wild type mice for 13 days. (B) Cell
viability of CD19+ B cells from Egr2-/-Egr3-/- and wild type mice. Results represent 3
experiments; ** p<0.01; * p<0.05.
0
10
20
30
40
50
60
70
80
90
100
0 3 5 7 10 12
Ce
ll V
iab
ility
%
Days
CD4+ T Cells
WT
Egr2-/-Egr3-/-
*
**
*
*
-20
0
20
40
60
80
100
0 3 5 7 10 12
Ce
ll V
iab
ility
%
Days
CD19+ B Cells
WT
Egr2-/-Egr3-/- *
*
*

Chapter 3 – Results
126
Cell survival was further confirmed in lymphocytes from 5 month old Egr2
and Egr3 defective mice compared to aged matched wild type. Two
Egr2-/-Egr3-/- mice with different levels of severity symptoms (labelled K-1 and K-2)
were taken and compared with wild type. Enlarged spleen and lymph nodes were
observed in the K2-Egr2-/-Egr3-/- mouse but not in the K1-Egr2-/-Egr3-/-mouse. A
survival recall experiment was performed, where the CD4+ T cells and CD19+ B cells
were isolated and cultured for 3, 5 and 10 days, without the change of medium. On
these incubation days, the cells were stimulated with 200ng/ml PMA/INO for 48
hours followed by the incorporation of 3[H]-TdR for 8 hours.
Interestingly, both of the Egr2-/-Egr3-/- mice showed significant levels of
proliferating cells compared to wild type at day 3 and 5, whereas at day 10 the level
of proliferation was almost at a halt. An unexpected observation was seen in the
K2-Egr2-/-Egr3-/- mouse which demonstrated proliferation at a much higher rate
than that of K1-Egr2-/-Egr3-/- mouse, suggesting that this mouse was possibly at the
early stages of developing lymphoma (Figure 3.13).
This experiment clearly demonstrated that the lymphocytes from
Egr2-/-Egr3-/- mice have the ability to survive longer compared to wild type, under
homeostatic conditions.

Chapter 3 – Results
127
Figure 3.13: Cell Survival of CD4+ and CD19+ cells in Egr2-/-Egr3-/- and wild type
mice.
(A) Cell viability of CD4+ cells from Egr2-/-Egr3-/- and wild type mice for 13 days. (B) Cell
viability of CD19+ cells from Egr2-/-Egr3-/- and wild type mice. Egr2-/-Egr3-/- cells are more
viable than wild type lymphocytes. Results represent 3 experiments; * p<0.05, ** p<0.01;
*** p<0.001, NS – Not Significant
0.0
500.0
1000.0
1500.0
2000.0
2500.0
3000.0
3500.0
3 5 10
3H
Td
R (
cpm
)
Days
CD4+
WT
K1 - Egr2-/-Egr3-/-
K2 - Egr2-/-Egr3-/- *
* **
*
*
*
0.0
1000.0
2000.0
3000.0
4000.0
5000.0
6000.0
7000.0
8000.0
3 5 10
3H
Td
R (
cpm
)
Days
CD19+
WT
K1 - Egr2-/-Egr3-/-
K2 - Egr2-/-Egr3-/-
NS
**
NS
*
***
NS

Chapter 3 – Results
128
3.3.3 Survival of Egr2 and Egr3 deficient B and T cells in vivo.
The initial experiments demonstrated that the primary lymphocytes from
Egr2-/-Egr3-/- have the ability to survive longer in vitro. Hence we investigated the
proliferation ability of the lymphocytes in Egr2-/-Egr3-/- mice in vivo. To determine
whether the function of Egr2 and Egr3 in lymphoma development is intrinsic or
extrinsic, we looked at the population of Egr2-/-Egr3-/- lymphocytes in Rag2-/- mice.
Rag2-/- mice carry a germ line mutation, resulting in a large portion of Rag2 coding
region being deleted. This results in these mice lacking mature B and T cells, with a
severe combined immune disorder (SCID) phenotype (Shinkai, Rathbun et al. 1992).
We transferred either resting B or naïve CD4+ T cells from a 4 week old wild type
and Egr2-/-Egr3-/- mice into the Rag2-/- mice, before the onset of lymphadenopathy
and splenomegaly. Six weeks after the transfer, CD19+ B cells and CD4+ T cells were
isolated from the spleen and the phenotype of the cells were analysed. As
expected, the wild type B and T cells displayed a resting phenotype in the Rag2-/-
recipient mice. However the Egr2-/-Egr3-/- B and T cells were seen to be highly
activated in their recipient Rag2-/- mice (Figure 3.14) allied with high levels of Ig and
cytokines respectively (see section 3.4 for further details on cytokines in
Egr2-/-Egr3-/- mice).
We also transfected 50:50 B and CD4+ T cells from a 4 week mice old CD45.1
wild-type and CD45.2 Egr2-/-Egr3-/- mice into a Rag2-/- mice. After 2 and 6 weeks we
sacrificed the mice and isolated the CD19+ B cells and CD4+ T cells from the spleen.
As expected we identified a similar activated phenotype in the
Egr2-/-Egr3-/- deficient but not the wild type CD4+ T and B cells from the Rag2-/- mice.

Chapter 3 – Results
129
Additionally, when we looked at the absolute number of B and CD4+ T cells, we
found that the percentage of Egr2-/-Egr3-/- deficient mice were increased after 6
weeks of transfer. We identified 71% of B cells from Egr2-/-Egr3-/- compared to 21%
from wild type. Similarly we found 68% of CD4+ T cells derived from Egr2-/-Egr3-/-
compared to 38% from wild type (Figure 3.14). Consequently, Egr2 and Egr3
regulate the homeostasis of both B and T cells in a cell intrinsic manner.
Figure 3.14: Egr2 and Egr3 regulate the homeostasis of lymphocytes.
(A) Naïve B or CD4+ T cells from spleen of 4 week old WT and Egr2-/-Egr3-/- mice were
adoptively transferred into Rag2-/- mice. After six weeks the cells harvested from spleen
and lymph nodes and surface marker expression analysed. (B) Cell number was analysed.
(C) 50:50 mixture of wild type (CD45.1+) and Egr2-/-Egr3-/- (CD45.2+) lymphocytes, from 4
week old mice were transferred into Rag2-/- mice. 2 and 6 weeks after transfer activation
marker expression were analysed. The data are representative of two independent
experiments and N=3 in each.

Chapter 3 – Results
130
To support the hyper homeostatic proliferation observed in the
Egr2-/-Egr3-/- mice, we stained the spleen and tumour bearing tissue sections from
Egr2-/-Egr3-/- mice with a proliferating marker, proliferating cell nuclear antigen
(PCNA). The spleen from the wild type mice was also stained as control (Figure
3.15). PCNA is associated with the cell cycle and immunocytochemical detection of
PCNA represents a useful tool for the study of tumour proliferation activity,
whereby a correlation can be detected between PCNA index and the lymphoma
grading (Czader, Porwit et al. 1995; Rabenhorst, Burini et al. 1996). We found that
the lymphocytes from both lymphoid organs and invaded non-lymphoid organs
from the tumour bearing mice were highly proliferative.
Figure 3.15: Enhanced proliferation of lymphocytes in Egr2-/-Egr3-/- mice.
H&E staining of spleen tissue and PCNA staining on the same tissue section. Shown at
magnitude X5 and X20. The PCNA staining shows that the lymphocytes are proliferating.
WT
Egr2-/-
Egr3-/-
4 weeks old
Egr2-/-
Egr3-/-
5 months old
H&E
X5
X5
X5
PCNA X5
PCNA X20

Chapter 3 – Results
131
As seen in Figure 3.15, there is increased proliferation in both 4 week old
and 5 month old Egr2-/-Egr3-/- mice compared to wild type. Supporting the in vivo
cell survival mentioned in section 3.2.5, the level of proliferation is significantly
increased in the older mice compared to the 4 week old mice, resulting in the
normal splenic architecture being eradicated with extensive invasion of the red
pulp area by lymphocyte infiltrations. The extensive proliferation in the
Egr2-/-Egr3-/- mice affects the splenic architecture and results in fragmentation of
the follicular structure, whereas in young Egr2-/-Egr3-/- mice we still see a certain
level of follicular structure.
The level of proliferation was also checked in the lymphoma tissues and in
organs metastatically invaded by tumour cells. As expected the lymphoma cells also
carried a proliferating phenotype. Both the tumour tissues and the organ with
metastasis from B and T cell positive lymphomas were positive for the PCNA marker
(Figure 3.16).

Chapter 3 – Results
132
Figure 3.16: Enhanced proliferation in both T and B cell lymphomas in
Egr2-/-Egr3-/- mice.
(A) B cell lymphoma metastatically spread into the kidney. Sample stained for B cells, B220
(red) and for proliferation marker, PCNA (green). Staining shows the B cells to be highly
proliferative. (B) T cell lymphoma metastatically spread into the liver. Sample stained for T
cells, CD3 (red) and for proliferation marker, PCNA (green). Staining shows the T cells to be
highly proliferative.
It is evident that the Egr2-/-Egr3-/- mice are hyper proliferating, leading to
lymphoma development. Both Egr2 and Egr3 are transcription factors and have the
potential to regulate a number of other genes. The question arises as to which
regulation process causes the development of lymphoma in the absence of Egr2
and Egr3.
Cancer is a multi-step, genetic disease (Hanahan and Weinberg 2000). As
the normal cells progress to a neoplastic state, they acquire a succession of the
hallmarks of cancer. Initially six hallmarks of cancer were suggested by Hanahan

Chapter 3 – Results
133
and Weinberg in 2000; however since then they have identified a number of
emerging hallmarks that also contribute to the development of cancer, these
include tumour-promoting inflammation, genomic instability and mutation
(Hanahan and Weinberg 2011).
Uncontrolled proliferation is the main hallmark of all cancers and we were
able to demonstrate that the lymphocytes in our model were hyper-proliferative in
physiological conditions.
The second hallmark of cancer is the evasion of apoptosis; hence we looked
at the apoptosis in our model.

Chapter 3 – Results
134
3.3.4 Apoptosis not affected in lymphocytes from Egr2-/-Egr3-/- mice
A number of functional studies over the years have shown that programmed
cell death by apoptosis serves as a natural barrier to cancer development (Lowe,
Cepero et al. 2004). The evasion of the apoptosis pathway is also one of the
hallmarks of cancer. In 2003, Unoki and Nakamura demonstrated that Egr2 induced
apoptosis significantly in a number of cancer cell lines by directly inducing the
expression of two proapoptotic proteins of the Bcl-2 family. They carried out their
study mainly on different Human Carcinoma and Glioblastoma cell lines (Unoki and
Nakamura 2003). Yokota and colleagues have identified Egr2 as a direct target of
the p53 family in human cancer cell lines. They also confirmed the Egr2 expression
is induced in mouse and rat fibroblast cells by DNA-damage-induced p53 activity
(Yokota, Sasaki et al. 2010).
Here we studied the effects of apoptosis in our Egr2-/-Egr3-/- lymphocytes to
understand if suppression of apoptosis could play a role in the lymphoma
development. Naïve CD4+ T cells were isolated from 3 month old wild type,
Egr2-/-Egr3-/-, CD2-Egr2-/- and Egr3-/-. The CD4+ T cells were stimulated with plate-
bound anti-CD3 and anti-CD28 for 16 hours and stained for Annexin V and 7AAD.
The cells were measured by flow cytometry. As seen in Figure 3.17, there was a
slight but not significant difference in the percentage of apoptotic cells from the
Egr2-/-Egr3-/- CD4+ T cells compared to wild type.

Chapter 3 – Results
135
Figure 3.17: Apoptosis of activated T cells.
(A) Resting CD4 T cells from indicated mice were stimulated with anti-CD3 and anti-CD28
for 16 hours and Annexin V positive cell were measured. The data are representatives of
three experiments.
There was half the amount of early stage apoptotic steps (Annexin V
positive and 7-AAD negative cells) in the Egr2-/-Egr3-/- CD4+ T cells compared to wild
type, Egr3-/- and CD2-Egr2-/-. The same fold change was seen for cells at the late
stage of apoptosis (Annexin V and 7-AAD positive).
Clearly it is shown that apoptosis is not affected in the Egr2-/-Egr3-/- mice
model and possibly not the direct pathway causing the lymphoma development in
our model.
WT Egr2-/- Egr3-/- Egr2-/-Egr3-/-
0.6 1.7
90.2 7.5
0.3 0.8
96.4 2.5
0.6 1.7
90.2 7.5
0.6 1.7
90.2 7.5
7AAD
An
ex
inV

Chapter 3 – Results
136
3.3.5 Shorter Telomere Length in Egr2-/-Egr3-/- mice
One of the hallmarks of cancer cells is that they acquire an infinite
replication potential (Negrini, Gorgoulis et al. 2010). Telomeres, a repetitive DNA
sequence are based at the ends of the chromosomes which functions as the
molecular counter of the cell’s replicative potential. The telomeres are composed of
several thousand repeats of the sequence TTAGGG bound by a set of specific
protein. As the cell divides the telomeres shorten, eventually causes the cell to
undergo senescence, once it has reached its limit (Allsopp, Vaziri et al. 1992). It has
been proven that in cancer cells, telomeres are extremely short due to the intense
proliferation properties of the cells (Artandi and DePinho 2000).
We examined the telomere lengths of lymphocytes in Egr2-/-Egr3-/- and wild
type mice. The lymphocytes were collected from secondary lymphoid organs. Half
of the lymphocytes were stimulated with PMA/INO for 48 hours (hrs). The other
half was cultured without stimulation for 48hrs. Metaphase spread were prepared
and fixed onto slides. The telomere length was examined by Q-FISH, which
measures the fluorescence intensity of the telomere repeats (Wong and Slijepcevic
2004) (Figure 3.18).

Chapter 3 – Results
137
Figure 3.18: Q-FISH image of interphase and metaphase CD4+ T cells from wild
type and CD2-Egr2-/- mice
The telomere length of interphase CD4+ T cells and CD19+ B cells were
measured with the aid of IPLab software. The telomere length shortening was
compared between CD2-Egr2-/- and wild type. The telomere length of CD2-Egr2-/- T
and B cells were significantly shorter than wild type under homeostatic conditions
(unstimulated) (Figure 3.19).
We also tested the telomere length in fibroblast cells from both wild type
and CD2-Egr2-/- mice as a negative control because Egr2 was specifically removed
from the lymphocytes. As expected there was no significant difference in the
telomere length from both wild type and CD2-Egr2-/- fibroblast cells.
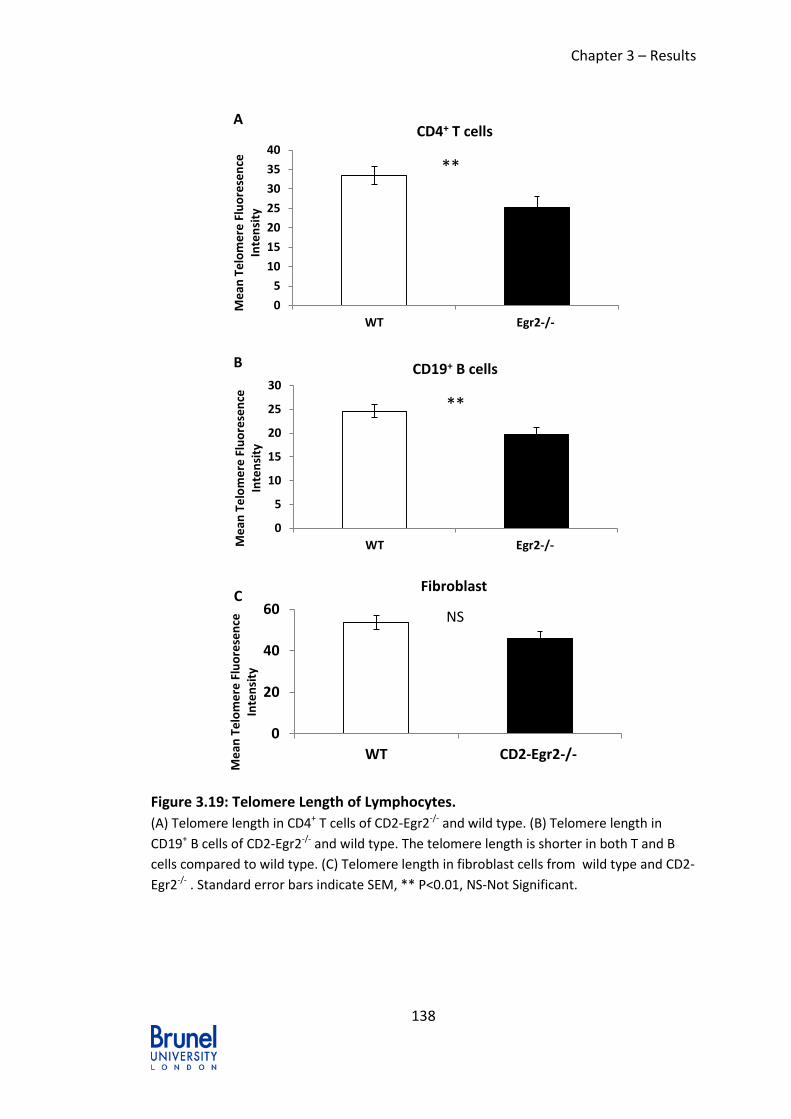
Chapter 3 – Results
138
Figure 3.19: Telomere Length of Lymphocytes.
(A) Telomere length in CD4+ T cells of CD2-Egr2-/- and wild type. (B) Telomere length in
CD19+ B cells of CD2-Egr2-/- and wild type. The telomere length is shorter in both T and B
cells compared to wild type. (C) Telomere length in fibroblast cells from wild type and CD2-
Egr2-/- . Standard error bars indicate SEM, ** P<0.01, NS-Not Significant.
0
5
10
15
20
25
30
35
40
WT Egr2-/-
Me
an T
elo
me
re F
luo
rese
nce
In
ten
sity
CD4+ T cells **
0
5
10
15
20
25
30
WT Egr2-/-Me
an T
elo
me
re F
luo
rese
nce
In
ten
sity
CD19+ B cells **
0
20
40
60
WT CD2-Egr2-/-
Me
an T
elo
me
re F
luo
rese
nce
In
ten
sity
Fibroblast
B
A
C
NS

Chapter 3 – Results
139
In line with telomere length, it is also known that the telomere length
shortening is maintained by telomerase enzyme (Meyerson 2000). We then looked
at the telomerase enzyme activity within the lymphocytes. RNA was extracted from
the isolated CD4+ T cells and CD19+ B cells before and after stimulation with
PMA/INO. RNA expression was determined by real-time PCR for mTERT gene.
Consistent with our findings for the telomere length, the expression of mTERT was
increased in the CD2-Egr2-/- model compared to wild type.
There was no difference in the expression of telomerase enzyme in the
unstimulated CD4+ T cells or CD19+ B cells, as no or very little telomerase activity is
detected in mature resting CD4+ and CD8+ T lymphocyte (Weng, Levine et al. 1996;
Weng, Granger et al. 1997). There was a 2 fold difference in the stimulated CD4+ T
cells and a 4 fold difference in CD19+ B cells.

Chapter 3 – Results
140
Figure 3.20: Telomerase Enzyme Expression.
(A) mTERT expression in CD4+ T cells from both wild type and CD2-Egr2-/- . (B) mTERT
expression in CD19+ B cells from both wild type and CD2-Egr2-/-. Standard error bars
indicate SEM ** p<0.01, NS – Not significant difference.
0
5
10
15
20
25
30
35
Unstimulated Stimulated
Re
lati
ve E
xpre
ssio
n
CD4+ T cells
WT
Egr2-/-
**
NS
0
20
40
60
80
100
120
Unstimulated Stimulated
Re
lati
ve E
xpre
ssio
n
CD19+ B Cells
WT
Egr2-/-
**
NS
A
B
Chapter 3 – Results
141
3.4 Molecular Mechanism of Egr2 and Egr3 in Preventing
Tumour Development

Chapter 3 – Results
142
To understand the mechanism of Egr2 and Egr3 in tumourgenesis two
approaches were taken.
1. The possible effect of the inflammatory microenvironment in the
support of tumour development was investigated in the
Egr2-/-Egr3-/- mice.
2. Using functional genomic tools to identify the transcriptional
program regulated by Egr2 in the control of tumourgenesis.
3.4.1 Possible effect of inflammatory microenvironment supports
the tumour development in Egr2-/-Egr3-/- mice.
Inflammation has long been associated with the development of cancer
(Rakoff-Nahoum 2006). The effect of microenvironment for the tumour
developments was investigated in the Egr2-/-Egr3-/- Mice.
Previously, our group found that Egr2 deficient T cells are highly active in
vivo under homeostatic conditions, leading to the development of autoimmune
diseases in the CD2-Egr2-/- mice in later age (Zhu, Symonds et al. 2008). However no
autoimmune symptoms were found in the Egr3-/- mice. An early onset of the
pathological phenotypes was seen in the Egr2-/-Egr3-/- mice. At 2 months of age,
both male and female Egr2-/-Egr3-/- mice developed chronic inflammation. Zhu, et al
(2008) demonstrated the inflammatory autoimmune disease in adult CD2-Egr2-/-
mice, with lymphocyte infiltration and severe glomerulonephritis (Zhu, Symonds et

Chapter 3 – Results
143
al. 2008). Here we report similar symptoms in the Egr2-/-Egr3-/- mice but onset
much earlier in age. In 3 month old Egr2-/-Egr3-/- mice the kidney histology revealed
deposition of immune complexes in the glomeruli and infiltration of lymphocytes in
non-lymphoid organs, but these symptoms were not seen in wild type mice (Figure
3.21).
Figure 3.21: Mice lacking Egr2 and Egr3 develop chronic inflammation disease.
(A) H&E analysis of the lung and kidney, from a 3 month old wild type and Egr2-/-Egr3-/-
mice. lymphocyte infiltration seen in the Egr2-/-Egr3-/- mice (marked by an arrow) compared
to wild type (B) Glomerular Ig deposits in 3 month Egr2-/-Egr3-/- mice (Texas red labelled
anti-mouse Ig).

Chapter 3 – Results
144
The CD4+ and CD8 T+ cells expressed high levels of activation markers such
as CD44, CD69 and CD25, while CD62L positive T cells were significantly reduced
compared with wild type (Figure 3.22A) suggesting that the Egr2 and 3 deficient T
cells are hyper-active. The activation markers, CD86 and CD69, were also analysed
for the splenic B cells. Both CD86 and CD69 were expressed significantly at high
levels (especially CD69) compared to wild type, suggesting that the B cells were
highly activated in the spleen (Figure 3.22A). The same active phenotype was seen
the LN too (Figure 3.22).

Chapter 3 – Results
145
Figure 3.22: Functional analysis of peripheral lymphocytes.
(A) Surface marker expression on splenic lymphocytes from 8-week-old wild type and Egr2-/-Egr3-/- mice. (B) Surface marker expression on lymph nodes
lymphocytes from 8-week-old wild type and Egr2-/-Egr3-/- mice. Results represent 3 experiments.

Chapter 3 – Results
146
Chronic inflammation observed in the Egr2-/-Egr3-/- mice provides the
inflammatory microenvironment for the tumour to progress. Tissue inflammation is
also brought upon due to a deregulated production of cytokines, such as IL-6, IL10
and IL-17 (Ohl and Tenbrock 2011). It was observed that the Egr2-/-Egr3-/- mice
became moribund at around 8 months of age, due to the multi-organ inflammation,
which is known to be associated with high levels of serum inflammatory cytokines.
We, therefore, checked the presence of cytokines in the Egr2-/-Egr3-/- mice
compared to wild type and as expected, we found that there was high levels of
inflammatory cytokine expressions of IL-17, IL-17F, IL-10, IL-6 and IL-3, granulocyte
macrophage colony stimulating factor (GM-CSF) and IFN-γ in the serum of
Egr2-/-Egr3-/- mice (Figure 3.23).

Chapter 3 – Results
147
Figure 3.23: Egr2 and Egr3 control the homeostasis of inflammatory cytokines.
Serum cytokine levels in 3 month old wild type (WT) and Egr2-/-Egr3-/- mice. High levels of inflammatory cytokines observed in Egr2-/-Egr3-/- mice
compared to WT. * p<0.05

Chapter 3 – Results
148
3.4.2 Constitutive activation of STAT3 oncogene expression
detected in Egr2-/-Egr3-/- mice.
Cytokines play an essential role in the development and differentiation of
lymphoid cells, which include interleukins and interferon. In section 3.4.1, cytokines
were described to be significantly increased in the Egr2-/-Egr3-/- serum compared to
those in wild type mice. Cytokines bind to their specific receptor chain, the
hematopoietin receptor, to initiate the formation of a functional cytokine receptor
complex and the intracellular signalling pathway (Kishimoto, Taga et al. 1994). The
cytokine signalling pathway induces proteins, such as Signal transducers and
activators of transcription (STATs). STATs function as transcription factors to
regulate gene expression of target genes, such as c-Myc. Importantly the cytokine
signalling pathways are negatively regulated by suppressors of cytokine signalling
(SOCS) proteins, which have also be profound to play additional roles in many
immunological processes (Kubo, Hanada et al. 2003).
Our group have earlier shown that SOCS1 and SOC3, suppressors of STAT1
and STAT3 activation, are induced in T cells by TCR stimulation (Anderson,
Sundstedt et al. 2003). Hence we reviewed the cytokine signalling pathways in B
and T cells. We focused our investigation on STAT3 as it is a known oncogene and
shown to be constitutively active in nearly 70% of solid and haematological tumours
(Avalle, Pensa et al. 2012). STAT3 protein expression was analysed in both T and B
cells from Egr2-/-Egr3-/- and wild type mice. As expected, STAT3 was highly activated
in the lymph nodes from 3 month old Egr2-/-Egr3-/-mice. This was further confirmed

Chapter 3 – Results
149
by western blot, where CD4+ T cells and CD19+ B cells were isolated from both
Egr2-/-Egr3-/- and wild type mice. The endogenous STAT3 was used as the
endogenous control. The pSTAT3 was significantly increased in both unstimulated
and stimulated CD4+ T cells and CD19+ B cells from the Egr2-/-Egr3-/- mice compared
to aged match wild type mice
Figure 3.24: Hyper activated STAT3 in Egr2 and Egr3 deficient B and T
lymphocytes.
(A) Phosphorylation of STAT3 in lymphocytes in both wild type and Egr2-/-Egr3-/- lymph
nodes at 3 months of age. (B) Western Blot analysis of phosphorylation of STAT3. Results
demonstrate high expression of pSTAT3 in Egr2-/-Egr3-/- compared to WT.
WT Egr2-/-Egr3-/-
CD3 (red)pSTAT3 (green)
B220(green)pSTAT3(red)
WT Egr2-/-Egr3-/- WT Egr2-/-Egr3-/- WT Egr2-/-Egr3-/- WT Egr2-/-Egr3-/-
CD4 B cells
Stimulation - - + + - - + +
pSTAT3
STAT3

Chapter 3 – Results
150
Further, the expression of STAT3 mRNA was confirmed to be upregulated in
both B and T cell lymphomas, as represented in Figure 3.25. The level of relative
mRNA expression was significantly increased in all representing B and T cell
lymphomas compared to normal T and B cell isolated from wild type lymphocytes.
Constitutive activity of STAT3 is essential for proliferation and survival in many
established primary tumour cells and its inhibition impairs tumour growth (Avalle,
Pensa et al. 2012).
To further investigate whether Egr2 and/or Egr3 can regulate the expression
of SOCS3, we analysed the expression of SOC3 in naïve B and CD4+ T cells from a 4
week old mice before and after antigen receptor stimulation. Supporting the
findings of hyper activated STAT3, the SOCS3 were highly deficient in the
Egr2-/-Egr3-/- mice in comparison to wild type mice (Figure 3.26A).
To investigate whether Egr2 regulates the expression of SOC3 we looked at
proximal promoters of SOCS3 for potential Egr2 binding sites with the aid multiTF
utility (http://multitd.dcode.org) (Figure 3.26B). By ChIP we demonstrated that Egr2
directly interacts with SOCS3 promoters and a conserved intergenic element in the
SOCS3 locus (Figure 3.26C). Hence the impaired function of SOCS3 leads to the
hyper-activation of STAT3 in the Egr2-/-Egr3-/- B and CD4+ T cells.

Chapter 3 – Results
151
Figure 3.25: Hyper activated STAT3 in B and T lymphoma from Egr2-/-Egr3-/- mice.
(A) STAT3 mRNA expression in B cell lymphomas (labelled KOJ and KOB) from Egr2-/-Egr3-/-
mice. (B) STAT3 mRNA expression T cell lymphomas (labelled KOB and KOG) from Egr2-/-
Egr3-/- mice. The expression was compared to normal STAT3 expression in wild type B and T
cells. Standard error bars indicate SEM. *p<0.05, **p<0.01 and ***p<0.001.
0
200
400
600
800
1000
1200
1400
1600
1800
WT-T cells KOB KOG
Re
lati
ve E
xpre
ssio
n
STAT3 expression in T cell lymphoma
*****
0
200
400
600
800
1000
WT- B cells KOJ KOK
Re
lati
ve E
xpre
ssio
n
STAT3 expression in B cell lymphoma
*
**

Chapter 3 – Results
152
Figure 3.26: Egr2 regulated the mRNA expression of SOCS3
(A) mRNA expression of SOCS3 in naïve B and CD4+ T cells from a 4 week old wild type and Egr2-/-Egr3-/- mice before and after antigen receptor
stimulation. (B) Identification of potential Egr2 binding sites in the proximal regions of SOCS3. (C) Binding of Egr2 to the proximal regions of the SOCS3
promoters. CD4+ T cells from Egr2 Transgenic mice (Egr2cTg) were stimulated with anti-CD3 and anti-CD28 for 3 hours and used in the ChIP with primers
flanking Egr2 binding sites in the promoters of SOCS3, and Nab. Total input DNA and anti-H3 precipitates served as positive control and anti-IgG
precipitates as negative control. Standard error bars indicate SEM. * p<0.05.
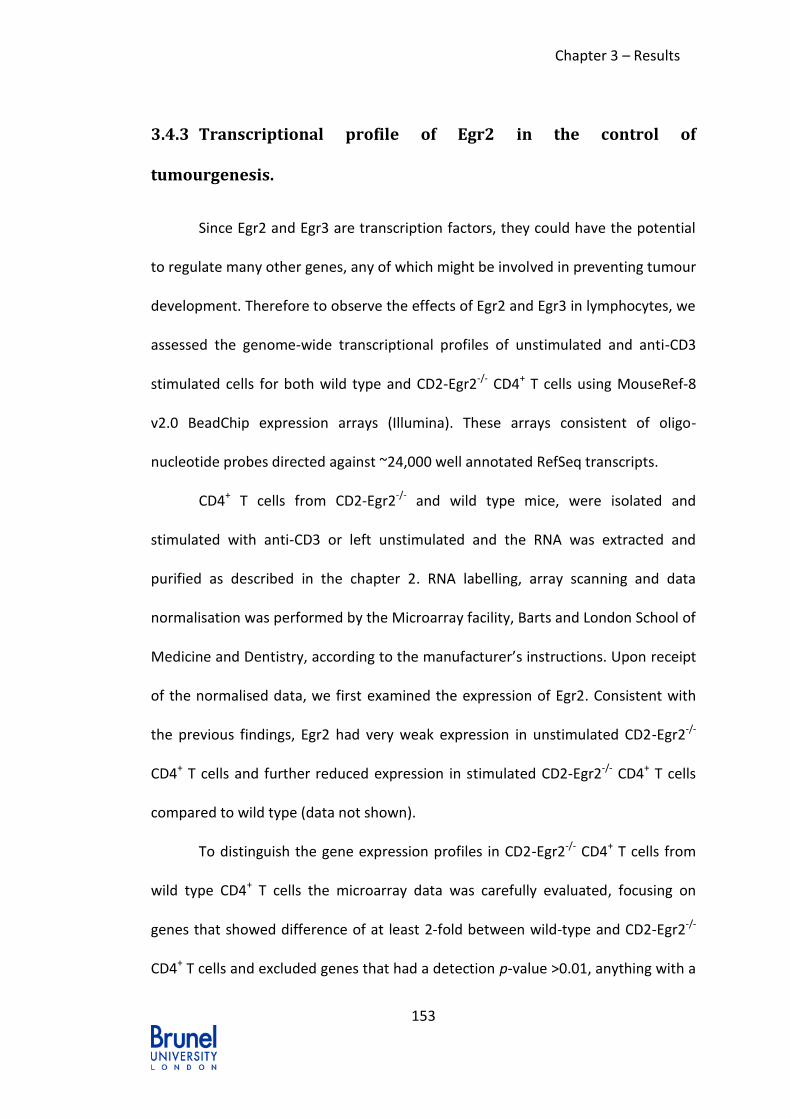
Chapter 3 – Results
153
3.4.3 Transcriptional profile of Egr2 in the control of
tumourgenesis.
Since Egr2 and Egr3 are transcription factors, they could have the potential
to regulate many other genes, any of which might be involved in preventing tumour
development. Therefore to observe the effects of Egr2 and Egr3 in lymphocytes, we
assessed the genome-wide transcriptional profiles of unstimulated and anti-CD3
stimulated cells for both wild type and CD2-Egr2-/- CD4+ T cells using MouseRef-8
v2.0 BeadChip expression arrays (Illumina). These arrays consistent of oligo-
nucleotide probes directed against ~24,000 well annotated RefSeq transcripts.
CD4+ T cells from CD2-Egr2-/- and wild type mice, were isolated and
stimulated with anti-CD3 or left unstimulated and the RNA was extracted and
purified as described in the chapter 2. RNA labelling, array scanning and data
normalisation was performed by the Microarray facility, Barts and London School of
Medicine and Dentistry, according to the manufacturer’s instructions. Upon receipt
of the normalised data, we first examined the expression of Egr2. Consistent with
the previous findings, Egr2 had very weak expression in unstimulated CD2-Egr2-/-
CD4+ T cells and further reduced expression in stimulated CD2-Egr2-/- CD4+ T cells
compared to wild type (data not shown).
To distinguish the gene expression profiles in CD2-Egr2-/- CD4+ T cells from
wild type CD4+ T cells the microarray data was carefully evaluated, focusing on
genes that showed difference of at least 2-fold between wild-type and CD2-Egr2-/-
CD4+ T cells and excluded genes that had a detection p-value >0.01, anything with a

Chapter 3 – Results
154
p-value greater than 0.01 was considered background. The genes that were
deferentially expressed were first grouped based on self-organizing maps (SOMs) by
clustering algorithm method. To confirm the differential profile of the expressed
genes, the SOM clusters were further clustered by hierarchical clustering program
(Figure 3.27).
The full set of microarray data is available from the ArrayExpress database
(http://www.ebi.ac.uk/arrayexpress) under the accession number E-MEXP-1698.

Chapter 3 – Results
155
Figure 3.27: Gene expression profile.
Altered expression of transcription factors, inflammation and cell cycle genes in CD2-Egr2-/- (represented as KO) CD4+ T cells as assessed by genome-wide
transcriptional analysis. The SOM cluster of transcription factors, inflammation and cell cycle genes were further clustered by hierarchical clustering
program to show the genes with differential expression profile. Note: Tg represents Egr2 Transgenic mice, which were not included as part of this
study.

Chapter 3 – Results
156
3.4.3.1 Egr2 regulates the gene expression of cell cycle genes
Cancers results from multiple molecular events that essentially amend the normal
properties of the cell. In the cancer cells, the cell cycle control, a process of regulating
normal cell division is disrupted. Cancer cells differ from normal cells, such as they have loss
of differentiation and increased invasiveness. However other characteristic of cancer cells
includes a category of genes that, when mutated, increases the genetic instability and
accelerates the cancer growth. These are the genes that regulate the cell cycle control
(Hartwell and Kastan 1994).
From our microarray analysis we looked at possible cell cycle genes that were
differently expressed in CD4+ T cells from Egr2-/-Egr3-/- model compared to the wild type. We
identified 23 genes that were 2 fold or more upregulated in the CD4+ T cells from Egr2-/-Egr3-
/- compared to wild type. We also identified 7 genes that were 2 fold downregulated in the
CD4+ T cells from Egr2-/-Egr3-/- compared to wild type (Table 3.1).
32 genes, categorised from cell cycle control function were validated by Real-Time
RT-PCR; of which only 7 did not correlate with the microarray data (Table 3.1).

Chapter 3 – Results
157
Gene Expression Microarray
Fold Change
RT-PCR
Fold Change
p-value
from
RT-PCR
Brca1 Upregulated 2.44 2.55 < 0.01
Casp3 Upregulated 3.06 6.43 < 0.01
Ccna2 Upregulated 3.89 3.81 > 0.05
Ccnb1 Upregulated 3.67 0.77 > 0.05
Ccnb2 Upregulated 3.08 0.34 < 0.01
Ccne1 Upregulated 2.78 2.92 < 0.05
Ccnf Upregulated 3.13 1.89 < 0.01
CDC25B Upregulated 2.05 1.41 > 0.05
Chek1 Upregulated 3.25 4.08 < 0.05
Cks1b Upregulated 4.41 3.01 > 0.05
E2f1 Upregulated 2.18 0.75 > 0.05
E2f2 Upregulated 2.36 2.66 < 0.05
Itgb1 Upregulated 2.8 6.85 < 0.05
Mad2l1 Upregulated 2.74 4.76 < 0.05
MCM2 Upregulated 2.01 2.06 < 0.05
Mcm3 Upregulated 2.55 3.78 < 0.05
Mki67 Upregulated 2.57 4.48 < 0.01
Mybl2 Upregulated 2.05 0.41 > 0.05
Nek2 Upregulated 4.21 4.01 < 0.05
Pmp22 Upregulated 2.06 3.03 < 0.05
Rad51 Upregulated 4.34 5.76 < 0.01
Rad51ap1 Upregulated 2.31 5.27 < 0.01
Wee1 Upregulated 2.34 1.81 > 0.05
Abl1 Downregulated 2.17 4.51 < 0.05
Atm Downregulated 2.74 2.77 < 0.01
Dstyk Downregulated 2.33 3.41 < 0.01
Macf1 Downregulated 3.06 5.98 < 0.01
Pkd1 Downregulated 2.62 2.83 < 0.05
Rad9b Downregulated 2.62 4.09 < 0.05
Sfn Downregulated 4.66 2.81 < 0.01
Table 3.1: Validation of Microarray Expression Profile with Real-Time PCR.

Chapter 3 – Results
158
While the pattern of expression usually related fairly well with those from the
microarray, the relative levels of expression sometimes differed. For example, Figure 3.28,
compares the expression of three differently expressed genes, Brca1, Ccna2 and SFN, in
unstimulated CD2-Egr2-/- and wild type CD4+ T cells, as detected by the two different
methods. The validated Real-Time expression shows a similar pattern to the normalised
microarray expression. Brca1 and Ccna2 both showed exactly the same fold change ratio of
2.5 and 3.8 respectively. SFN showed a slight decrease in the microarray expression
compared to Real-Time PCR. This quantitative difference may be due to the different
sensitivity of the two techniques.
Figure 3.28: Brca1, Ccna2 and SFN mRNA expression in CD2-Egr2-/- CD4+ T cells.
Splenic CD4+ T cells were isolated from the CD2-Egr2-/- and wild type mice. (A) Normalised expression
from the microarray. (B) Relative Expression from the Real-Time RT-PCR validation. Data represents 3
experiments. Standard error bars indicate SEM. *p< 0.05 and ** p< 0.01.
*

Chapter 3 – Results
159
The validation of the microarray results revealed number of genes that were
significantly (p<0.01) up-regulated in the CD2-Egr2-/- CD4+ T cells than in wild type CD4+ T
cells, which play an important role in the cell cycle control. Some of the interesting genes
were RAD51, RAD51AP1, and MKI67 (Figure 3.29).
Both RAD51 and RAD51AP1 participate in the DNA response pathway associated with
the activation homologous recombination and double-strand break repair. The microarray
data of normalised expression showed a 4.97 and 1.1 fold increases in Rad51 and Rad51ap1
respectively. The Real Time RT-PCR showed a 5 fold increase for both Rad51 and Rad51ap1
confirming the increased expression of these two DNA repair genes. A number of studies
have found that overexpression of RAD51 in cells leads to increased resistance to
chemotherapeutic drugs (Klein 2008). Overexpression of RAD51 genes results in the
overstimulation of homologous recombination and chromatid exchange mechanisms, this is
predicted to lead to genomic instability and eventually contributing to carcinogenesis
(Raderschall, Stout et al. 2002).
Mki67 (also known as Ki67) is a known marker for proliferation, with evidence of high
expression of this gene in diffuse large B-cell lymphoma and mantle cell lymphoma (Ek,
Bjorck et al. 2004; Li, Huang et al. 2012). The microarray indicated that CD2-Egr2-/- CD4+ T
cells expressed around 3 fold more Mki67 than WT CD4+ T cells. A similar correlation was
also seen with the Real Time RT-PCR data with around 4 fold increase in CD2-Egr2-/- CD4+ T
cells. This data also supports the enhanced expression of PCNA marker in Egr2-/-Egr3-/-
spleen and tumour samples (section 3.3).

Chapter 3 – Results
160
Figure 3.29: Cell cycle genes mRNA expression upregulated in CD2-Egr2-/- CD4+ T cells.
Relative expression of cell cycle genes analysed by Real Time RT-PCR for wild type (white) and CD2-Egr2-/- CD4+ T cells. Standard error bars represent
SEM. * P<0.05, ** p<0.01 and NS – Not Significant.

Chapter 3 – Results
161
7 genes were identified to have a 2 fold decrease gene expression from the
microarray data. All 7 genes were validated by Real Time RT-PCR and the results
correlated with the microarray data. Some of the interesting genes were Stratifin
(SFN) and Ataxia Telangiectasia Mutated (ATM) (Figure 3.30).
SFN, commonly known as 14-3-3, regulates a number of cellular processes
that are crucial for tumour biology, such as cell cycle regulation and apoptosis
(Dong, Kang et al. 2007). Here we have shown, from our microarray data, that SFN
is significantly reduced (by 4 fold) in the CD2-Egr2-/- CD4+ T cells. This correlation
was also demonstrated by Real Time RT-PCR, with a 3 fold reduction in the
CD2-Egr2-/- CD4+ T cells compared to the wild type.
There are seven isomers of 14-3-3, of which 14-3-3σ (sigma) is the most
researched and has shown to be directly linked to cancer (Hermeking 2003).
14-3-3σ acts in support of their relevance to tumour biology by negatively
regulating cell cycle control. 14-3-3σ has been shown to inactivate CDC25 proteins
by cytoplasmic sequestration, which prevents CDC25C and CDC25B from
dephosphorylating and activating cyclin-dependent kinase CDC2, hence the cells
become arrest at G2 (Graves, Lovly et al. 2001; Bulavin, Higashimoto et al. 2003).
Interestingly our microarray data reported a 3 fold increase of CDC25C gene in our
CD2-Egr2-/- CD4+ T cells compared to wild type (data not shown), showing a
correlation between the reduction of SFN gene expression and the increase of
CDC25C gene expression.
Both the microarray and Real-Time RT-PCR reported a 2.7 fold reduced
expression in the ATM gene in CD2-Egr2-/- CD4+ T cells compared to wild type

Chapter 3 – Results
162
(Figure 3.30). ATM is a pleiotropic protein kinase that is activated in response to a
double-stranded DNA breaks (Rotman and Shiloh 1997). This leads on to ATM
rapidly activating many factors that aid DNA repair and regulate cell cycle control
(Yan, Kuang et al. 2002). Deficiencies in ATM has been linked to a number of
deficiencies, including thymic lymphoma (Taylor, Metcalfe et al. 1996). Zha and
colleagues have provided compelling evidence of ATM deficiency and tumour
development. They showed that ATM-deficient mice developed a striking
predisposition to lymphoid malignancies, particularly thymic lymphoma, due to
V(D)J recombination errors at Tcrd, as opposed to Tcra locus (Zha, Bassing et al.
2010).

Chapter 3 – Results
163
Figure 3.30: Cell cycle genes mRNA expression downregulated in CD2-Egr2-/- CD4+ T cells.
Relative expression of cell cycle genes analysed by Real Time RT-PCR for wild type and CD2-Egr2-/- CD4+ T cells. Standard error bars represent SEM.
* P<0.05, ** p<0.01 and NS – Not Significant
0
200
400
SFN
0
10
20
RAD9B
0
1000
2000
PKD1
0
100
200
ABL1
0
1000
2000
ATM
0
100
200
DSTYK
0
1000
2000
MACF1
Re
lati
ve
Ex
pre
ssio
n
0
1000
2000
3000
WT Egr2-/-Egr3-/-
CDC25B
WT Egr2-/-Egr3-/-
**
*
** **
** **

Chapter 3 – Results
164
The microarray gene expression profile was conducted on CD4+ T cells,
which were also validated by Real Time RT-PCRs. However our group has shown
that Egr2 regulated both T and B cell development (Li, Symonds et al. 2011),
supported by the B cell lymphomas identified in the Egr2 deficient mice model. This
lead us to look at the genes, which demonstrated a significant difference in CD4+ T
cells, and further investigated in CD19+ B cells, by Real-Time RT-PCR.
From the 23 up-regulated genes, 18 showed a significant mRNA expression
increase in CD2-Egr2-/- CD4+ T cells. Interestingly, when the gene expression of the
23 genes was examined in CD19+ B cells, 57% of them also showed a significant
up-regulation in CD2-Egr2-/- cells compared to wild type (Figure 3.31).

Chapter 3 – Results
165
Figure 3.31: Cell cycle genes mRNA expression upregulated in CD2-Egr2-/- CD19+ B cells.
Relative expression of cell cycle genes analysed by Real Time RT-PCR for wild type and CD2-Egr2-/- CD19+ B cells. Standard error bars represent SEM.
* P<0.05, ** p<0.01 and NS – Not Significant

Chapter 3 – Results
166
Unlike CD4+ T cells, where all 7 down regulated genes showed a significant reduction
in the CD2-Egr2-/-Egr3-/- mice compared to wild type, all, except ABL1, showed an up-
regulation in CD2-Egr2-/-Egr3-/- compared to wild type. However, only three of the genes
showed a significant difference (SFN, PKD1 and MACF1) (Figure 3.32).
Figure 3.32: Cell cycle genes mRNA expression downregulated in CD2-Egr2-/- CD19+ B cells.
Relative expression of cell cycle genes analysed by Real Time RT-PCR for wild type and CD2-Egr2-/-
CD19+ B cells. Standard error bars represent SEM. * P<0.05, ** p<0.01 and NS – Not Significant
Re
lati
ve E
xpre
ssio
n
0
1000
2000
3000
WT Egr2-/-Egr3-/-
CDC25B
WT Egr2-/-Egr3-/-
0
100
200
300
PKD1
*
0
100
200
SFN
**
0
500
1000
1500
MACF1
*
0
10
20
30
RAD9B
NS
0
20
40
DSTYK
NS
140
160
180
200
ABL1
NS
0
1000
2000
ATM
NS

Chapter 3 – Results
167
3.4.4 Identification of target genes for Egr2 by ChIP-on-chip
With microarray gene expression alone we were unable to identify key genes that
demonstrate the effect of Egr2 and Egr3 leading to tumour development, as Egr2
and Egr3 are transcription factors and play a role in transcribing other genes. To
understand the mechanism between the loss of Egr2 and tumour development we
need to identify the genes that are regulated by Egr2 directly. The microarray gene
expression provided us with an insight of which genes might be involved under the
influence of Egr2, however it does not provide direct evidence that Egr2 directly
regulates the expression of these genes.
Hence, we carried out ChIP-on-chip. In ChIP-on-chip the Eg2 protein was
covalently cross-lined to the DNA by formaldehyde, cells were lysed, the chromatin
was immunoprecipitated with an Egr2 antibody and then fragmented DNA was
fluorescently labelled and hybridised to the GeneChip® Mouse Promoter 1.0R
Array.
The data generated, consisting of the intensity, which measures the relative
quantity of DNA at the probe’s genomic position in the immunoprecipitated
material, was analysed. We looked at both ChIP-on-chip data and microarray
expression data, to identify possible genes which are controlled or interact with
Egr2. The criteria used to identify these genes was set to include the genes that
were enriched with a p-value more than 0.01 in the ChIP-on-chip compared with
the genes that were 2 fold down regulated in the CD2-Egr2-/- CD4+ T cells from the
microarray analysis. The ChIP-on-chip suggests promoter regions of genes to which

Chapter 3 – Results
168
Egr2 binds to. The microarray 2 fold downregulated genes in CD-Egr2-/- CD4+ T cells
identified possible genes which are expressed in the presence of Egr2. From this
data mining we identified 137 genes, of which a number of these genes were found
to be involved in cell regulation, chromatin remodelling, etc. (Figure 3.33).
Figure 3.33: ChIP-chip Vs. Expression comparison.
137 genes enriched with a p-value greater than 0.01 in ChIP-on-chip and with a 2 fold
change in the microarray gene expression.
From the 137 genes identified, 33 of the genes were validated, which had a
known function in cell regulation, chromatin remodelling or tumour development.
These genes were validated by Real Time RT-PCR. From the 33 genes, three of the
genes; Ikaros, Aiolos and FOXO3, demonstrated a 2 fold downregulation in the
microarray expression as well as a DNA binding site for Egr2. These genes are also
known to function as tumour suppressor genes.

Chapter 3 – Results
169
3.4.4.1 Egr2 regulates the expression of Ikaros and Aiolos in
lymphocytes
Ikaros family, consisting of Ikaros (IKZF1), Aiolos (IKZF3), Helios (IKZF2), Eos
(IKZF4) and Pegasus (IKZF5) - are zinc finger nuclear proteins that play critical role in
T and B cell development and differentiation. These proteins are essential for the
normal development of lymphocytes and also function as tumour suppressor genes
(Clevers, Oosterwegel et al. 1993; Georgopoulos, Bigby et al. 1994; Molnar and
Georgopoulos 1994).
The comparison of the ChIP - on- chip and microarray gene expression
identified IKZF1 and IKZF3 as two possible target genes for Egr2 and their role in
preventing lymphoid tumour development. Inspection of the microarray data
revealed that the mRNA expression of IKZF1 and IKZF3 was reduced in CD2-Egr2-/-
CD4+ T cells compared to wild type. Under unstimulated (homeostatic conditions)
there was a 1.5 fold and 3 fold decreases in IKZF1 and IKZF3, respectively. After
stimulation a 2 fold and a significant 11 fold reduction was seen in IKZF1 and IKZF3,
respectively (Figure 3.34).

Chapter 3 – Results
170
Figure 3.34: mRNA expression of IKZF1 and IKZF3 in CD2-Egr2-/- CD4+ T cells.
(A) Microarray normalised expression of Ikzf1 and Ikzf3 in splenic CD4+ T cells isolated from the CD2- Egr2-/- and wild type mice. (B) Relative expression
measured by Real-Time PCR in splenic CD4+ T cells isolated from the Egr2-/-Egr3-/- and wild type mice. Standard error bars indicate SEM. ** p< 0.01,
NS - Not Significant.

Chapter 3 – Results
171
A lot of evidence has reported that a defect in IKZF1 and IKZF3 expression in
lymphocytes leads to lymphomas. Winandy and Colleagues found that the loss of Ikaros
activity at the late stages of thymocyte maturation leads to uncontrolled
lymphoproliferation and rapid development of malignant T cell leukaemia and lymphoma
(Winandy, Wu et al. 1995). More surprisingly the phenotype of the Ikaros heterozygous mice
was similar to that found in the Egr2-/-Egr3-/- mice, with a lymphadenopathy and
splenomegaly (Winandy, Wu et al. 1995). The same group also studied the Aiolos gene and
found that in a similar fashion to Ikaros in T cells, lack of Aiolos in B cells leads to
uncontrolled proliferation, causes the breakdown of B cell tolerance and facilitates the
development of B cell malignancies (Wang, Avitahl et al. 1998).
Here at mRNA gene expression level we have also shown a reduced level of IKZF1 and
IKZF3 in the Egr2-/-Egr3-/- mice model and that there is protein-DNA interaction, which we
further validated by ChIP assay. Below is a graph of the enriched regions for the IKZF1 locus
and possible binding sites for Egr2 (analysed by Dr Alistair Symonds). This was further
validated by ChIP, which demonstrated that Egr2 directly interacts with the IKZF1 promoters
(Figure 3.35).
At protein level we found that the Ikaros protein was significantly defective in our
Egr2-/-Egr3-/- CD4+ T cells. From the western blot there is a significant reduction of Ikaros
after stimulation but not in the unstimulated cells (Figure 3.36 B and C). However, when the
Ikaros was studied by immunohistochemistry we found that the Ikaros was also reduced
significantly in the CD4+ unstimulated T cells (Figure 3.36A).
Chapter 3 – Results
172
Figure 3.35: Graph of MAT scores and enriched regions for the IKZF1 locus.
(A) Data were exported into bedGraph format using the rtracklayer package (Lawrence et al., 2009)
and imported into the UCSC Genome Browser. “Egr2 - Input” is the difference in MAT score between
the Egr2 and Input samples and was used to calculate enriched regions (p<0.01). (B) Binding of Egr2
to the IKZF1 promoters. Total input DNA and anti-H3 precipitates served as positive controls and
anti-Ig precipitates as negative control. Standard error bars indicate SEM. ***p<0.001 as compared
to IgG.
A
B

Chapter 3 – Results
173
Figure 3.36: Lack of Egr2 Reduced the Protein Expression of Ikaros.
(A) Reduced Ikaros expression in Egr2-/-Egr3-/- unstimulated CD4+ T cells. (B) Western Blot analysis of
Ikaros protein expression in WT and Egr2-/-Egr3-/- CD4+ T cells. Ikaros is significantly reduced in Egr2-/-
Egr3-/- after stimulation. (C) Protein Density measured from the western blot.
WT
Stim
Ika
ros
Act
in
- ++-
WTEgr2-/-Egr3-/- Egr2-/-Egr3-/-
A
B
0
0.5
1
1.5
2
2.5
3
3.5
Unstimulated Stimulated
Pro
tein
De
nsi
ty
WT
Egr2-/-Egr3-/-
C

Chapter 3 – Results
174
Aiolos protein expression was also studied in both B and T cells and as expected
there was no major difference in the protein expression in Egr2-/-Egr3-/- CD4+ T cells but a
significant reduction in CD19+ B cells. Interestingly when the expression of Aiolos was
measured in Egr2 Transgenic mice (TG), which has an over expression of Egr2 protein, there
was a significant increase in the AIolos expression (Figure 3.37). These results are in line with
the Georgopoulos group, who also reported that a defect in Ikaros results in T cell
malignancies and defects in Aiolos results in the B cell malignancies (Maxwell, Li et al. 2009;
Zha, Bassing et al. 2010).
Figure 3.37: Aiolos Protein Expression.
Aiolos protein expression was measure in WT, Egr2-/-Egr3-/- and Egr2 TG B and T cells by flow
cytometry. A significant reduction in Aiolos protein observed in Egr2-/-Egr3-/- B cells but not in T cells.
73.4
34
51
K23
TG
WT
94
35
78
K23
TG
WT
CD19+ B CELLS
Stimulated
Unstimulated
CD4+ T CELLS

Chapter 3 – Results
175
3.4.4.2 Egr2 regulates the expression of FOXO3 in lymphocytes
The Forkhead box, class O (FOXO) family are transcription factors that function as
tumour suppressors that control cell fate, induce quiescence or cell cycle arrest (Fu and
Tindall 2008). Four subfamily members have been identified in mammals, FOXO1, FOXO3
(previously known as FKHRL1; (Anderson, Viars et al. 1998)), FOXO4 and FOXO6.
FOXO3 is the prime member of the FOXO family in lymphoid peripheral tissues. The
inactivation of FOXO3 is required for the lymphocytes to proliferation, this has been shown
in both B and T cells (Stahl, Dijkers et al. 2002; Yusuf, Zhu et al. 2004). It has also been shown
that the constitutively inactive form of FOXO3 also leads to leukaemia and lymphomas
(Obrador-Hevia, Serra-Sitjar et al. 2012).
FOXO3 was identified as one of the targets for Egr2 from the ChIP-on-chip and
microarray gene expression profile. The normalised expression was validated by Real-Time
RT-PCR and confirmed a significant reduced expression of FOXO3 in Egr2-/-Egr3-/- CD4+ T cells
compared to wild type. For unstimulated CD4+ T cells both the microarray and Real Time RT-
PCR showed a 3 fold reduced expression in CD2-Egr2-/-. The microarray normalised
expression for stimulated cells demonstrated a 4 fold reduction in FOXO3 gene expression
however when validated by Real Time RT-PCR there was only a 2 fold reduction in gene
expression, which statistically was not significantly different due to a p value of 0.06 (Figure
3.38).

Chapter 3 – Results
176
Figure 3.38: mRNA expression of FOXO3 in CD2-Egr2-/- CD4+ T cells.
(A) Microarray normalised expression of Ikzf1 and Ikzf3 in splenic CD4+ T cells isolated from the CD2-
Egr2-/- and wild type mice. (B) Relative expression measured by Real-Time PCR in splenic CD4+ T cells
isolated from the Egr2-/-Egr3-/- and wild type mice. Standard error bars indicate SEM. ** p< 0.01,
NS - Not Significant.
A
B

Chapter 3 – Results
177
To assess whether Egr2 proteins associates with the proximal regions of the
mouse FOXO3 promoter (analysed by Dr Alistair Symonds) , a ChIP assay was
performed. The results demonstrated that Egr2 binds to the promoter region of
FOXO3 and as expected, no signal above background was seen with irrelevant IgG
(Figure 3.39). At protein level no difference in FOXO3 expression was seen in
unstimulated CD4+ T cells from both wild type and Egr2-/-Egr3-/-. However a
significant 4 fold difference was seen in both the immunohistochemistry staining
and western blot for stimulated Egr2-/-Egr3-/- CD4+ T cells (Figure 3.40).

Chapter 3 – Results
178
Figure 3.39: Graph of MAT scores and enriched regions for the FOXO3 locus.
(A) Data were exported into bedGraph format using the rtracklayer package (Lawrence et
al., 2009) and imported into the UCSC Genome Browser. “Egr2 - Input” is the difference in
MAT score between the Egr2 and Input samples and was used to calculate enriched regions
(p<0.01). (B) Binding of Egr2 to the FOXO3 promoters. Total input DNA and anti-H3
precipitates served as positive controls and anti-Ig precipitates as negative control.
Standard error bars indicate SEM. **p<0.01 as compared to IgG.
A
B

Chapter 3 – Results
179
Figure 3.40: Lack of Egr2 Reduced the Protein Expression of FOXO3.
(A) Reduced FOXO3 protein expression in Egr2-/-Egr3-/- after stimulation. (B) Western Blot
analysis of FOXO3 protein expression in WT and Egr2-/-Egr3-/- CD4+ T cells. FOXO3 is
significantly reduced in Egr2-/-Egr3-/- after stimulation. (C) Protein Density measured from
the western blot.

Chapter 4 –Discussion
180
Discussion Chapter 4

Chapter 4 –Discussion
181
The study of Egr family in the immune system is still in its young ages. Egr2
and Egr3 transcription factors are members of the Egr family and have been
demonstrated to be involved in a number of different processes. To investigate the
role of Egr2 and Egr3 in lymphocytes we developed Egr2 and Egr3 double knockout
mice, where Egr2 was specifically deleted in lymphocytes with the aid of CD2
promoter.
In this study, we have discovered that Egr2 and Egr3 have major regulatory
functions in lymphocytes and the deficiency of these genes in B and T cells results in
the development of spontaneous lymphomas. The novel findings of this thesis have
been categorised into two sections.
Firstly, deficiency in Egr2 and Egr3 in B and T cells results in lymphoma
development. We demonstrated that the lymphocytes from the Egr2-/-Egr3-/- mice
were hyper-proliferative in all lymphoid tissues and also invade all major organs.
Egr2 transcription factor was found to interact with the promoters of Ikaros and
FOXO3 tumour suppressor genes, all of which are crucial for lymphocyte
development, as well as controlling lymphocyte proliferation and homeostasis. We
also demonstrated that the absence of Egr2 and Egr3 genes impaired the
expression of Ikaros, FOXO3 and Aiolos. Taken together, these observations clearly
demonstrate that Egr2 and Egr3 are essential regulators of Ikaros, Aiolos and
FOXO3 tumour suppressor genes.
Secondly, deficiency in Egr2 and Egr3 genes in the lymphocytes resulted in
inflammatory autoimmune disease. There was an overproduction of inflammatory
cytokines by the lymphocytes in Egr2-/-Egr3-/- mice, which we found was associated

Chapter 4 –Discussion
182
with hyper-activation of STAT3. We found that Egr2 and Egr3 play an important role
in the control of inflammatory cytokine signalling under homeostatic conditions by
directly regulating the expression of SOCS3, which is an essential regulator of
STAT3.
4.1 Defective Egr2 and Egr3 lymphocytes lead to rapid
development of lymphoma.
Egr2 and Egr3 deficiency in lymphocytes lead to spontaneous lymphoma,
bearing the immunophenotype of either T or B cells. The hyper-homeostatic lymph-
proliferation in Egr2-/-Egr3-/- mice and the accumulation of active lymphocytes led
to the development of spontaneous lymphoma in mice as young as 5 months old.
Interestingly, spontaneous lymphoma development was also seen in the CD2-Egr2-/-
mice models, but at a much later age. Importantly, no tumours were observed in
aged match wild type mice or Egr3-/- mice. These observations demonstrate that
Egr3 compensates for the functions of Egr2 in its absence, hence the late onset of
lymphoma development. This is a novel finding, as to date no reports have been
published on linking Egr2 and Egr3 knockout mice with the development of
lymphoma.
The hyper-homeostatic proliferation of lymphocytes in Egr2-/-Egr3-/- mice
initiates spontaneous lymphoproliferation, which manifests as splenomegaly and
lymphadenopathy at an early age. This may be due to an accumulation of active
lymphocytes in the periphery caused by the increased production of cytokines.

Chapter 4 –Discussion
183
Notably, several models that have perturbed lymphocyte cell homeostasis
also develop an onset of chronic inflammation and lymphoma (Ohashi 2002;
Suarez, Lortholary et al. 2006; Zhang, Wang et al. 2007) as observed in
Egr2-/-Egr3-/- mice model.
Similar to our model, Hagenbeek and Spits (2008) developed T cell specific
PTEN deficient mice, using either proximal Lck promoter (Lck-Cre mice) or CD4
promoter (CD4-Cre mice). They found that both PTEN Lck-Cre deficient and PTEN
CD4-Cre deficient mice developed T cell lymphomageneis in the thymus, as early as
1 month of age, much earlier than what we observe in the Egr2-/-Egr3-/- mice.
However these mice had a much shorter lifespan of 3 months in comparison to
Egr2-/-Egr3-/- mice which survived to 4-8 months in age. Similar to the Egr2-/-Egr3-/-
mice, the T cells from PTEN T cell deficient mice reflected a constitutive state of
activation and infiltration of lymphocytes into non lymphoid organs (Hagenbeek
and Spits 2008). Interaction between PTEN and Egr2 was first described in the
hindbrain study. Suzuki, et al., 1998 used Egr2 as a hindbrain marker in PTEN
deficient mice embryos, where they found cephalic region was severely overgrown
and abnormal Egr2 expression occurred on one side of the prospective forebrain.
This indicated that Egr2 expression was regulated by PTEN (Suzuki, de la Pompa et
al. 1998). Similarly Unoki, and Nakamura, (2003) identified Egr2 as an important
mediator of the PTEN growth suppressor signalling pathway. They found exogenous
expression of Egr2, with AdCAEGR2 significantly induced apoptosis in various cancer
cell lines (Unoki and Nakamura 2003). In contrast we did not see any effect in the
level of apoptosis in theEgr2-/-Egr3-/- mice in our model. However Unoki, M., et al.,

Chapter 4 –Discussion
184
2003 carried out the analysis of apoptosis only in carcinomas cell lines and not in
lymphoma/leukaemia cell lines. PTEN expression was evaluated in our microarray
data and we found that the normalised expression was reduced, but not
significantly in CD2-Egr2-/- CD4+ T cells compared to wild type.
Although a number of spontaneous lymphoma models have been proposed,
here we have found a novel model which demonstrates aggressive spontaneous B
or T cell lymphoma development in the absence of Egr2 and Egr3.
As it is well known that tumourgenesis results from a multiple molecular
events that amend the normal properties of a cell. We looked at the possible
hallmarks of cancer formation and to our surprise we identified Egr2 and/or Egr3
are essential for the regulation of tumour suppressor genes; Ikaros, Aiolos and
FOXO3, which are important for lymphoid lineage development and homeostasis.
4.1.1 Ikaros family in haematological malignancies
We found Egr2 regulates the expression of Ikaros protein, which is a zinc
finger transcription factor encoded by the IKZF1 gene. The Ikaros gene was
discovered 20 years ago and is part of the Ikaros family, which also consists of
Helios, Aiolos, Eos and Pegasus. Ikaros and Aiolos are highly conserved and are
expressed in the lymphoid tissues (Molnar and Georgopoulos 1994; John, Yoong et
al. 2009). Aiolos was identified as a homologue to the largest Ikaros isoform with
similarities in the DNA binding activation and dimerisation domains. Aiolos forms
homo and heterodimers with Ikaros proteins in T and B cells (Rebollo and Schmitt
Chapter 4 –Discussion
185
2003). Ikaros was first identified in 1990s by Georgopoulos’ team, they proposed it
as a master regulator of haematopoiesis and found it to be essential for lymphocyte
development (Georgopoulos, Moore et al. 1992). The importance of Ikaros as a
tumour suppressor in murine T cell leukaemia has been known for about 20 years
and more recently the Ikaros inactivation in human T-ALL is becoming clearer.
The role of Ikaros in lymphoid development was illustrated by the complete
lack of lymphoid cells following gene inactivation by targeted deletion of exons 3-5,
which generate dominant negative Ikaros isoform in mice. Mice homozygous to the
mutation fail to prosper after birth and completely lack T and B cells and their
earlier progenitors (Georgopoulos, Bigby et al. 1994; Nichogiannopoulou, Trevisan
et al. 1999). In contrast, mice heterozygous for this mutation have a normal
lymphoid cell distribution after birth but after a few months the activity at the late
stage of thymocyte maturation leads to uncontrolled lymphoproliferation and rapid
development of malignant T cell leukaemia and lymphoma, with the lymphocytes
being highly activated (Winandy, Wu et al. 1995), as seen in the Egr2-/-Egr3-/- mice.
Interestingly, the phenotype of the heterozygous mutant of Ikaros mice was very
similar to our model. They also demonstrated splenomegaly and lymphadenopathy
in their Ikaros heterozygous mice, with 10-fold increase in the number of
splenocytes and circulating lymphocytes in the peripheral blood, supporting the
increase in absolute T and B cells in secondary lymphoid organs found in
Egr2-/-Egr3-/- mice. Increase in the white pulp and decrease in the red pulp areas of
the spleen was consistently observed in their Ikaros heterozygous mice, in align
with the structure of our spleen and destruction of the follicular structure of the

Chapter 4 –Discussion
186
lymph nodes due to the hyper-proliferation of the lymphocytes (Winandy, Wu et al.
1995). They observed a general lymphoproliferative lead to T cell leukaemia and
lymphoma.
In contrast, in human disease, Ikaros mutations are rare in T cell leukaemia.
One group studied the Ikaros mRNA and protein expression in 25 human T-ALL
samples and found only one sample harboured non-functional Ikaros (Davis 2011).
In contrast to the findings in mice, deregulation of Ikaros function in humans is far
more common in primary B progenitor ALL (B-ALL). Notably, dominant negative
isoforms of Ikaros proteins are present in about a quarter of high-risk paediatric B-
ALL cases (Mullighan, Su et al. 2009). Ikaros mutations are also associated with a
poor prognosis in terms of overall survival and frequency of relapse, most of which
was studied in paediatric B-ALL but has also shown true for adult B-ALL (Kuiper,
Waanders et al. 2010; Dupuis, Gaub et al. 2013).
Ikaros has been shown to regulate expression of multiple genes that are
essential for T cell differentiation. One of the pathways that are essential for T cell
development is the Notch pathway. Activation of the Notch-1 gene has been found
in over 50% of T-cell ALL (Weng, Ferrando et al. 2004; Chiaramonte, Basile et al.
2005). Synergism between the loss of Ikaros and the Notch activation in T cell
leukemogenesis has been demonstrated by Beverly and Capobianco (Kleinmann,
Geimer Le Lay et al. 2008). Ikaros directly bind to the upstream regulatory element
of a Notch target gene Hes-1 and down regulates its expression. High expression of
HES-1 is found in T-cell ALL cells (Chiaramonte, Basile et al. 2005; Kleinmann,
Geimer Le Lay et al. 2008).

Chapter 4 –Discussion
187
Ma et al, have demonstrated that Aiolos and Ikaros suppress c-Myc
expression in pre-B cells, by directly binding to its promoter in vivo. c-Myc as well as
cyclin D3 is crucial for the expansion of pre-B cells, which are driven by signals from
the IL-7 receptor. The downregulation of c-Myc by Ikaros and Aiolos precedes p27
induction and cyclin D3 suppression (Ma, Pathak et al. 2010). However in our
model, we did not find any difference in the normalised expression of p27 and
c-Myc.
Along with Ikaros, Aiolos has also been shown to act as a tumour suppressor
gene. The inactivation of the Aiolos gene in knockout mice produced an increase in
B cell precursors and spontaneous production of autoantibodies, hence causing the
breakdown of B cell tolerance and facilitating the development of B cell lymphoma
(Wang, Avitahl et al. 1998). In the Aiolos null mice the marginal zone B cells were
severely deleted, hence the enhanced maturation of the follicular B cells. In
addition, those mice that were heterozygous for null mutation in Ikaros and
homozygous for a null mutation in Aiolos developed T cell lymphomas more rapidly
than mice with a homozygous knockout of Ikaros (Rebollo and Schmitt 2003). This
also supports the interaction of Aiolos and Ikaros, together function to inhibit pre-
B-BCR signalling, as the loss of these two genes results in continued or even
increased signalling (Thompson, Cobb et al. 2007).
Elevated expression of Bcl-xL (part of the Bcl-2 family) has also been
associated with the loss of Ikaros function. It is suggested that Ikaros downregulates
Bcl-xL expression (Yagi, Hibi et al. 2002; Kano, Morimoto et al. 2008), hypothesising
that Ikaros regulated apoptosis. However this hypothesis still remains speculative

Chapter 4 –Discussion
188
due to lack of evidence to define the mechanism of this action. Bcl-xL normalised
gene expression was not effected in our Egr2 deficient mice.
The observations of all the studies and analysis in both mouse and human
lymphomas have always concluded Ikaros and Aiolos as tumour suppressor genes.
The findings in this study have identified Egr2 and Egr3 to regulate the mRNA and
protein expression of Ikaros and Aiolos in lymphocytes, supporting the hypothesis
of Egr2 and/or Egr3 functioning as a tumour suppressor genes.
4.1.2 FOXO3 in haematological malignancies
FOXO3 is a transcription factor that is crucial for the haematopoietic cell
fate and controls proliferation and apoptosis, amongst other processes. FOXO3 is
the predominant member of the FOXO family in lymphoid peripheral tissues (Lin,
Hron et al. 2004). The deactivation of FOXO3 is associated with proliferation of B
cells (Yusuf, Zhu et al. 2004) and T cells (Stahl, Dijkers et al. 2002).
A study looked at the key FOXO genes, in particular FOXO3 in a panel of MCL
cell lines and primary MCL cultures. The analysis of the MCL cell lines and patient
derived cells found the phosphorylated form of FOXO3 in the cytoplasm,
representing that the FOXO3 was in the inactive state. (Obrador-Hevia, Serra-Sitjar
et al. 2012). A similar expression of phosphorylated and cytoplasmic FOXO3 was
also reported in acute myeloid leukaemia (Kornblau, Singh et al. 2010). The
phosphorylation of FOXO3 causes the recruitment of 14-3-3 proteins; microarray
expression of CD4+ T cells in Egr2-/-Egr3-/- mice and the validation of mRNA
Chapter 4 –Discussion
189
expression by Real-Time PCR confirmed the significant reduction of 14-3-3.
However, it is unknown if the 14-3-3 protein is reduced due to the downregulation
of FOXO3 protein or vice versa.
Interestingly, one group studied the role of FOXO3 in lymphoid homeostasis.
They derived mice deficient in FOXO3a by generating animals bearing a disabled
FOXO3 allele. They observed that the FOXO3a deficiency leads to spontaneous
lymphoproliferation, which was also associated with inflammation of several key
organs. Immunohistochemical examination revealed a mixed infiltration of CD4+
and B220+ cells, suggesting a lymphoid infiltration (Lin, Hron et al. 2004). Similarly
we also found chronic inflammation in the Egr2-/-Egr3-/- mice and hyper activated T
and B cells. Surprisingly, same as the lymphocyte phenotype in our model, they also
observed that the T cells were highly activated, but they did not observe any
autoantibody production.
Tsai group have demonstrated that FOXO3a DNA-damage pathway is
mediated by protein complexes such as ATM and its downstream mediators to
sense DNA damage and control damage induced cell cycle checkpoints and DNA
repair (Tsai, Chung et al. 2008). This is in align with our results which show a
reduction in FOXO3 expression and significant downregulation of ATM mRNA in
CD4+ T cells.
Collectively, the observations on FOXO3 function as a tumour suppressor
gene, by inducing apoptosis and inhibiting proliferation in lymphocytes, supports
the findings of Egr2 regulating the expression of FOXO3. However the exact
mechanism of action is still unknown.

Chapter 4 –Discussion
190
4.1.3 Egr2 and Egr3 essential for the control of homeostatic
proliferation
Notably, several models that have disturbed T cell homeostasis also develop
late onset of inflammation disease (Salvador, Hollander et al. 2002; Doyle, Gee et
al. 2003; Arias, Ballesteros-Tato et al. 2007). Deficiency in both Egr2 and Egr3 in
lymphocytes resulted in chronic inflammatory disease. The Egr2-/-Egr3-/- mice
developed symptoms similar to those seen in systemic lupus erythematosus, with
lymphocyte infiltration in multiple organs, severe glomerulonephritis, and deposits
of immune complexes in the glomeruli. Egr2 and Egr3 deficient B and T cells
induced excessive production of inflammatory cytokines, despite the impaired
production of IL-2 (data not shown). The transfer of either naïve B or CD4+ T cells
from Egr2-/-Egr3-/- mice into Rag2-/- mice resulted in the development of
inflammation in recipient mice and importantly an increase in hyper-homeostatic
proliferation was observed. These observations validate that Egr2 and Egr3 function
via cell-intrinsic mechanisms to regulate inflammatory autoimmune response and
homeostasis of lymphocytes.
In our Egr2-/-Egr3-/- mice model the lymphocytes resulted in hyper-
homeostatic proliferation, coinciding with the splenomegaly and super-enlarged
lymph nodes. Previously in our CD2-Egr2-/- mice no effect was seen on the
development of the major thymocyte subsets, regulatory T cells, and major sub-
groups of peripheral T and B cells. This was due to the incomplete excision of the

Chapter 4 –Discussion
191
floxed Egr2 gene in the B cells from specific Egr2-/- mice affected by the
heterozygous phenotype of Cre-transgene (Zhu, Symonds et al. 2008).
Egr2 and Egr3 are induced in both naïve and tolerant T cells (Harris, Bishop
et al. 2004; Anderson, Manzo et al. 2006). The B and T cells from Egr2-/-Egr3-/- mice
were hyper-proliferative, with hyper-activated phenotypes and produced excessive
levels of proinflammatory cytokines.
4.1.4 Egr2 and Egr3 essential for the control of inflammation
and cytokine microenvironment
The over-production of inflammatory cytokines by B and T cells in
Egr2-/-Egr3-/- mice is allied with the hyper activation of STAT3, the major
inflammatory cytokine pathway controlling the development of Th17 cells and
expression of inflammatory cytokines. This indicates that Egr2 and 3 play vital roles
in the control of inflammatory cytokine signalling under homeostatic conditions.
Several key effector cytokines were altered in the serum of Egr2-/-Egr3-/-
mice, compared to wild type mice, such as IL-6 and IL-3. We also found increased
expression of the anti-inflammatory cytokine IL-10 in our mice model. Although IL-
10 is an anti-inflammatory cytokine, IL-10 has been implicated as having a
pathogenic role in lupus (Moore, de Waal Malefyt et al. 2001).
Interestingly, we detected high levels of IL-17 producing CD4+ T cells in
diseased Egr2 and Egr3 mice, in which half of them also produced IFNγ. Hence we
put forward that Th17 play major roles in inflammatory pathology of diseased

Chapter 4 –Discussion
192
Egr2-/-Egr3-/- mice. Li, et al, 2012 have demonstrated that Egr2 and 3 directly
regulate SOCS3 expression and deficiency in Egr2 and 3 results in reduced
expression of SOCS3 (Li, Miao et al. 2012). SOCS3 is a critical regulator for the
control of STAT3 mediated cytokine expression and differentiation of Th17 cells
(Yang, Panopoulos et al. 2007; Tamiya, Kashiwagi et al. 2011).
In unstimulated cells, STATs are inactive and typically the SOCS genes are
not expressed. Upon binding of cytokines, receptor aggregation occurs and the
STATs are activated by phosphorylation, which allows their dimerisation and
translocation to the nucleus, where they stimulate the transcription of cytokines
responsive genes, as well as those that encode for SOCS proteins. The SOCS
proteins bind to Janus Kinase (JAK) or cytokine receptors, thereby suppressing
further signalling events (Alexander 2002).
SOCS3 is a major negative feedback regulator of STAT3 activating cytokines.
SOCS3 is crucial for the control of Th17 differentiation by desensitising STAT3 to
activating cytokines, such as IL-23, thus governing the expression of Th17 cytokines
(Chen, Laurence et al. 2006; Tanaka, Ichiyama et al. 2008). Therefore the absence of
SOCS3 has a dramatic proinflammatory effects by promoting TH17 development.
However, T cell specific SOCS3 defect showed a reduced immune response, and
produced significant levels of transforming growth factor (TGF)-β1 and IL-10, but
less of IL-4, hence inhibiting Th1 and Th2 development (Kinjyo, Inoue et al. 2006;
Taleb, Romain et al. 2009; Yoshimura, Suzuki et al. 2012). Deficiency of SOCS3
specifically in lymphoid and myeloid cells results in the development of
inflammatory diseases (Chong, Metcalf et al. 2005; O'Sullivan, Liongue et al. 2007).

Chapter 4 –Discussion
193
These findings put forward that inflammatory pathology, which normally
results from pathological functions of Th17 cytokines, is controlled by SOCS3. We
have now established that SOCS3 are expressed in B and T cells in response to
antigen receptor stimulation. The excessive production of Th17 cytokines and
activation of STAT3 in Egr2 and 3 deficient B and T cells propose that regulation of
SOCS3 expression by Egr2 and 3 is vital, not only for averting the development of
autoimmune diseases, but similarly for preventing immunopathology during
productive adaptive immune responses.
STAT3 has been implicated in tumourgenesis in both mice and humans.
STAT3 is considered as a powerful oncogene, as it plays an important role in cell
growth and its activation has been described in nearly 70% of haematological and
solid tumours (Frank 1999). Studies have found STAT3 to be constitutively
activated in human cutaneous T cell lymphoma and diffuse large B cell lymphoma
(Sommer, Clemmensen et al. 2004; Ding, Yu et al. 2008; Wu, Song et al. 2011).
STAT3 is an important downstream target of IL-6. It has been demonstrated that
the Il-6 mediated T cell survival is impaired in T cell specific STAT3 deficient mice
(Takeda, Kaisho et al. 1998). In the Egr2-/-Egr3-/- model, we also demonstrated, in
vivo, an increase in IL-6 expression as well as an increased STAT3 expression,
coinciding with the findings of Takeda K. et al., 1998.

Chapter 4 –Discussion
194
4.2 Conclusion
Our work has confirmed a role for Egr2 and/or Egr3 in the control of
inflammation and lymphocyte homeostasis. The study revealed hitherto unknown
roles of Egr2 and/or Egr3 in regulating the expression of tumour suppressor genes,
Ikaros, Aiolos and FOXO3, controlling the formation of lymphoma.
Based on our findings presented here, I have proposed two possible
pathways for the development of lymphoma in defective Egr2 and Egr3 mice.
Firstly, the defect of Egr2 and 3 results in the downregulation of important tumour
suppressor genes, Ikaros and Aiolos, as well as of FOXO3. Secondly, the chronic
inflammation in the mice provides the microenvironment for the tumour growth by
activating STAT3 oncogenes (Shacter and Weitzman 2002; Rakoff-Nahoum 2006).
Defects in Ikaros and Aiolos may suppress the target genes involved in cell
proliferation; however we have not studied any of the Ikaros or Aiolos target genes
in our model. FOXO3 is known to aid DNA repair by interacting with ATM. Defects in
these tumour suppressor genes allow the cells to proliferate rapidly and
continuously, without crucial controls in place. In parallel, Egr2 and/or Egr3 are
unable to control oncogene STAT3, by unable to bind to their suppressors SOCS3,
hence activating their target genes, such as CDC25B. This leads to lymphoma
development. The inflammation caused by Egr2 and 3 defect increases the
cytokines, in the microenvironment, hence increasing the availability of growth
factors for the tumours to expand. This has been illustrated in Figure 4.1.

Chapter 4 –Discussion
195
Figure 4.1: Proposed role of Egr2 and/Egr3 in preventing lymphoma development.
This figure demonstrates that the absence of Egr2 and Egr3 in lymphocytes is unable to
activate the expression of Ikaros, Aiolos and FOXO3 genes, which results in the
dysregulations of the tumour suppressor functions of these genes. Similarly Egr2 and Egr3
are unable to bind to and activate the expression of SOCS3 gene, which is important for
inhibiting the STAT3 oncogene. This results in the activation of oncogene function. Both the
evasion of growth suppressors and activation of oncogenes are key hallmarks of cancer
development.
To summarise our model Egr2 and Egr3 act as tumour suppressor genes.
They retard proliferation and prevent tumourgenesis by positively regulating other
transcription factors and inhibiting oncogenes. Currently there has already been
research on possible STAT3 inhibitors for cancer therapy. The novelty of the
findings in this thesis provides new insights of cancer therapy. Here we put forward
that Egr2 and Egr3 can be investigated as potential cancer therapy targets.

Chapter 4 –Discussion
196
4.3 Future Work
The ultimate aim of tumour suppressor genes is to repress the effect of cell
cycle or promote apoptosis, which can be performed in a number of ways, such as
by repressing gene that are essential for promoting cell growth or by coupling the
cell cycle DNA damage. We have shown that Egr2 and/or Egr3 act as a tumour
suppressor gene by regulating the expression of other transcription factors; Ikaros,
Aiolos and FOXO3. The absence of Egr2 and/or Egr3 results in a defect expression of
these genes, which may result in lymphoma development.
To date the exact mechanism and key target genes of Ikaros, Aiolos and
FOXO3 is still not clear. It is therefore important in future development to identify
the exact pathway/mechanism of how these transcription factors function with the
presence of Egr family proteins and what target genes are activated or suppressed
to prevent lymphoma development.
Proposal of using ChIP-sequencing to systemically investigate all possible
genes involved in tumour development in relation to Egr2 function.
Many lymphomas are a result of chromosome deletions. These deletions are
thought to contain the tumour suppressor genes within the lost region. However,
most loss of function mutations that occur in the tumour suppressor genes are
recessive mutations hence both of the cells tumour suppressor genes must be
mutated or lost (‘two-hit’ theory) for cancer to progress. Here in this study
chromosome deletion has not been investigated, which should be considered for

Chapter 4 –Discussion
197
further investigation to support the function of Egr2 and or Egr3 as tumour
suppressor genes.

198
List of References

199
Abbas, A. K., J. Lohr, B. Knoechel and V. Nagabhushanam (2004). "T cell tolerance
and autoimmunity." Autoimmunity reviews 3(7-8): 471-475.
Alexander, W. S. (2002). "Suppressors of cytokine signalling (SOCS) in the immune
system." Nature reviews. Immunology 2(6): 410-416.
Allman, D. and S. Pillai (2008). "Peripheral B cell subsets." Current opinion in
immunology 20(2): 149-157.
Allsopp, R. C., H. Vaziri, C. Patterson, S. Goldstein, E. V. Younglai, A. B. Futcher, C. W.
Greider and C. B. Harley (1992). "Telomere length predicts replicative
capacity of human fibroblasts." Proc Natl Acad Sci U S A 89(21): 10114-
10118.
Allsopp, R. C., H. Vaziri, C. Patterson, S. Goldstein, E. V. Younglai, A. B. Futcher, C. W.
Greider and C. B. Harley (1992). "Telomere length predicts replicative
capacity of human fibroblasts." Proceedings of the National Academy of
Sciences of the United States of America 89(21): 10114-10118.
Alt, F. W., G. D. Yancopoulos, T. K. Blackwell, C. Wood, E. Thomas, M. Boss, R.
Coffman, N. Rosenberg, S. Tonegawa and D. Baltimore (1984). "Ordered
rearrangement of immunoglobulin heavy chain variable region segments."
The EMBO journal 3(6): 1209-1219.
Anderson, M. J., C. S. Viars, S. Czekay, W. K. Cavenee and K. C. Arden (1998).
"Cloning and characterization of three human forkhead genes that comprise
an FKHR-like gene subfamily." Genomics 47(2): 187-199.
Anderson, M. W., S. H. Reynolds, M. You and R. M. Maronpot (1992). "Role of
proto-oncogene activation in carcinogenesis." Environ Health Perspect 98:
13-24.

200
Anderson, P., A. Sundstedt, L. Li, E. J. O'Neill, S. Li, D. C. Wraith and P. Wang (2003).
"Differential activation of signal transducer and activator of transcription
(STAT)3 and STAT5 and induction of suppressors of cytokine signalling in
T(h)1 and T(h)2 cells." International immunology 15(11): 1309-1317.
Anderson, P. O., B. A. Manzo, A. Sundstedt, S. Minaee, A. Symonds, S. Khalid, M. E.
Rodriguez-Cabezas, K. Nicolson, S. Li, D. C. Wraith and P. Wang (2006).
"Persistent antigenic stimulation alters the transcription program in T cells,
resulting in antigen-specific tolerance." European journal of immunology
36(6): 1374-1385.
Arbuckle, M. R., M. T. McClain, M. V. Rubertone, R. H. Scofield, G. J. Dennis, J. A.
James and J. B. Harley (2003). "Development of autoantibodies before the
clinical onset of systemic lupus erythematosus." The New England journal of
medicine 349(16): 1526-1533.
Arias, C. F., A. Ballesteros-Tato, M. I. Garcia, J. Martin-Caballero, J. M. Flores, A. C.
Martinez and D. Balomenos (2007). "p21CIP1/WAF1 controls proliferation of
activated/memory T cells and affects homeostasis and memory T cell
responses." J Immunol 178(4): 2296-2306.
Armitage, J. O. (2005). "Staging non-Hodgkin’s lymphoma." CA: a cancer journal for
clinicians 55(6): 368-376.
Artandi, S. E. and R. A. DePinho (2000). "A critical role for telomeres in suppressing
and facilitating carcinogenesis." Curr Opin Genet Dev 10(1): 39-46.
Avalle, L., S. Pensa, G. Regis, F. Novelli and V. Poli (2012). "STAT1 and STAT3 in
tumorigenesis: A matter of balance." JAK-STAT 1(2): 1-8.

201
Baecklund, E., A. Iliadou, J. Askling, A. Ekbom, C. Backlin, F. Granath, A. I. Catrina, R.
Rosenquist, N. Feltelius, C. Sundstrom and L. Klareskog (2006). "Association
of chronic inflammation, not its treatment, with increased lymphoma risk in
rheumatoid arthritis." Arthritis and rheumatism 54(3): 692-701.
Balkwill, F. and A. Mantovani (2001). "Inflammation and cancer: back to Virchow?"
Lancet 357(9255): 539-545.
Bandyopadhyay, S., N. Soto-Nieves and F. Macian (2007). "Transcriptional
regulation of T cell tolerance." Semin Immunol 19(3): 180-187.
Bassing, C. H., W. Swat and F. W. Alt (2002). "The mechanism and regulation of
chromosomal V(D)J recombination." Cell 109 Suppl: S45-55.
Baumgarth, N. (2011). "The double life of a B-1 cell: self-reactivity selects for
protective effector functions." Nature reviews. Immunology 11(1): 34-46.
Beckmann, A. M. and P. A. Wilce (1997). "Egr transcription factors in the nervous
system." Neurochemistry international 31(4): 477-510; discussion 517-476.
Bertram, J. S. (2000). "The molecular biology of cancer." Molecular aspects of
medicine 21(6): 167-223.
Bossen, C., A. Tardivel, L. Willen, C. A. Fletcher, M. Perroud, F. Beermann, A. G.
Rolink, M. L. Scott, F. Mackay and P. Schneider (2011). "Mutation of the
BAFF furin cleavage site impairs B-cell homeostasis and antibody
responses." European journal of immunology 41(3): 787-797.
Boyman, O., S. Letourneau, C. Krieg and J. Sprent (2009). "Homeostatic proliferation
and survival of naive and memory T cells." European journal of immunology
39(8): 2088-2094.

202
Boyman, O., J. F. Purton, C. D. Surh and J. Sprent (2007). "Cytokines and T-cell
homeostasis." Current opinion in immunology 19(3): 320-326.
Boyman, O., C. Ramsey, D. M. Kim, J. Sprent and C. D. Surh (2008). "IL-7/anti-IL-7
mAb complexes restore T cell development and induce homeostatic T Cell
expansion without lymphopenia." J Immunol 180(11): 7265-7275.
Brewer, B. J. and W. L. Fangman (1993). "Initiation at closely spaced replication
origins in a yeast chromosome." Science 262(5140): 1728-1731.
Bulavin, D. V., Y. Higashimoto, Z. N. Demidenko, S. Meek, P. Graves, C. Phillips, H.
Zhao, S. A. Moody, E. Appella, H. Piwnica-Worms and A. J. Fornace, Jr.
(2003). "Dual phosphorylation controls Cdc25 phosphatases and mitotic
entry." Nature cell biology 5(6): 545-551.
Bult, C. J., J. T. Eppig, J. A. Kadin, J. E. Richardson and J. A. Blake (2008). "The Mouse
Genome Database (MGD): mouse biology and model systems." Nucleic acids
research 36(Database issue): D724-728.
CancerResearch. (2011). "Cancer in the UK: April 2011." Retrieved 28th April,
2011, from
http://info.cancerresearchuk.org/prod_consump/groups/cr_common/@nre
/@sta/documents/generalcontent/018070.pdf.
CancerResearch. (2011). "CancerStats report - Incidence 2008 - UK." Cancer
Research UK Retrieved 28th April 2011, from
http://info.cancerresearchuk.org/prod_consump/groups/cr_common/@nre
/@sta/documents/generalcontent/cr_072111.pdf.
Carleton, M., M. C. Haks, S. A. Smeele, A. Jones, S. M. Belkowski, M. A. Berger, P.
Linsley, A. M. Kruisbeek and D. L. Wiest (2002). "Early growth response

203
transcription factors are required for development of CD4(-)CD8(-)
thymocytes to the CD4(+)CD8(+) stage." J Immunol 168(4): 1649-1658.
Carleton, M., M. C. Haks, S. A. A. Smeele, A. Jones, S. M. Belkowski, M. A. Berger, P.
Linsley, A. M. Kruisbeek and D. L. Wiest (2002). "Early growth response
transcription factors are required for development of CD4(-)CD8(-)
thymocytes to the CD4(+)CD8(+) stage." Journal of Immunology 168(4):
1649-1658.
Cedar, H. and Y. Bergman (1999). "Developmental regulation of immune system
gene rearrangement." Current opinion in immunology 11(1): 64-69.
Chang, E. and C. B. Harley (1995). "Telomere length and replicative aging in human
vascular tissues." Proceedings of the National Academy of Sciences of the
United States of America 92(24): 11190-11194.
Chang, H. C., L. Han, R. Goswami, E. T. Nguyen, D. Pelloso, M. J. Robertson and M.
H. Kaplan (2009). "Impaired development of human Th1 cells in patients
with deficient expression of STAT4." Blood 113(23): 5887-5890.
Chaplin, D. D. (2010). "Overview of the immune response." The Journal of allergy
and clinical immunology 125(2 Suppl 2): S3-23.
Chen, C., Z. Nagy, M. Z. Radic, R. R. Hardy, D. Huszar, S. A. Camper and M. Weigert
(1995). "The site and stage of anti-DNA B-cell deletion." Nature 373(6511):
252-255.
Chen, J., M. Trounstine, C. Kurahara, F. Young, C. C. Kuo, Y. Xu, J. F. Loring, F. W. Alt
and D. Huszar (1993). "B cell development in mice that lack one or both
immunoglobulin kappa light chain genes." The EMBO journal 12(3): 821-830.

204
Chen, Z., A. Laurence, Y. Kanno, M. Pacher-Zavisin, B. M. Zhu, C. Tato, A. Yoshimura,
L. Hennighausen and J. J. O'Shea (2006). "Selective regulatory function of
Socs3 in the formation of IL-17-secreting T cells." Proceedings of the
National Academy of Sciences of the United States of America 103(21):
8137-8142.
Chiaramonte, R., A. Basile, E. Tassi, E. Calzavara, V. Cecchinato, V. Rossi, A. Biondi
and P. Comi (2005). "A wide role for NOTCH1 signaling in acute leukemia."
Cancer letters 219(1): 113-120.
Cho, J. H., O. Boyman, H. O. Kim, B. Hahm, M. P. Rubinstein, C. Ramsey, D. M. Kim,
C. D. Surh and J. Sprent (2007). "An intense form of homeostatic
proliferation of naive CD8+ cells driven by IL-2." The Journal of experimental
medicine 204(8): 1787-1801.
Cho, J. H. and P. K. Gregersen (2011). "Genomics and the multifactorial nature of
human autoimmune disease." The New England journal of medicine
365(17): 1612-1623.
Chomczynski, P. (1993). "A reagent for the single-step simultaneous isolation of
RNA, DNA and proteins from cell and tissue samples." BioTechniques 15(3):
532-534, 536-537.
Chomczynski, P. and N. Sacchi (1987). "Single-step method of RNA isolation by acid
guanidinium thiocyanate-phenol-chloroform extraction." Analytical
biochemistry 162(1): 156-159.
Chomczynski, P. and N. Sacchi (2006). "The single-step method of RNA isolation by
acid guanidinium thiocyanate-phenol-chloroform extraction: twenty-
something years on." Nature protocols 1(2): 581-585.

205
Chong, M. M., D. Metcalf, E. Jamieson, W. S. Alexander and T. W. Kay (2005).
"Suppressor of cytokine signaling-1 in T cells and macrophages is critical for
preventing lethal inflammation." Blood 106(5): 1668-1675.
Christy, B. and D. Nathans (1989). "DNA binding site of the growth factor-inducible
protein Zif268." Proceedings of the National Academy of Sciences of the
United States of America 86(22): 8737-8741.
Chung, J. B., M. Silverman and J. G. Monroe (2003). "Transitional B cells: step by
step towards immune competence." Trends in immunology 24(6): 343-349.
Chung, K. W., I. N. Sunwoo, S. M. Kim, K. D. Park, W. K. Kim, T. S. Kim, H. Koo, M.
Cho, J. Lee and B. O. Choi (2005). "Two missense mutations of EGR2 R359W
and GJB1 V136A in a Charcot-Marie-Tooth disease family." Neurogenetics
6(3): 159-163.
Clevers, H. C., M. A. Oosterwegel and K. Georgopoulos (1993). "Transcription
factors in early T-cell development." Immunology today 14(12): 591-596.
Collins, S., M. A. Lutz, P. E. Zarek, R. A. Anders, G. J. Kersh and J. D. Powell (2008).
"Opposing regulation of T cell function by Egr-1/NAB2 and Egr-2/Egr-3."
European journal of immunology 38(2): 528-536.
Collins, S., M. A. Lutz, P. E. Zarek, R. A. Anders, G. J. Kersh and J. D. Powell (2008).
"Opposing regulation of T cell function by Egr-1/NAB2 and Egr-2/Egr-3." Eur
J Immunol 38(2): 528-536.
Coussens, L. M. and Z. Werb (2002). "Inflammation and cancer." Nature 420(6917):
860-867.
206
Czader, M., A. Porwit, E. Tani, A. Ost, J. Mazur and G. Auer (1995). "DNA image
cytometry and the expression of proliferative markers (proliferating cell
nuclear antigen and Ki67) in non-Hodgkin’s's lymphomas." Modern
pathology : an official journal of the United States and Canadian Academy of
Pathology, Inc 8(1): 51-58.
Darnell, J. E., Jr. (1998). "Studies of IFN-induced transcriptional activation uncover
the Jak-Stat pathway." Journal of interferon & cytokine research : the official
journal of the International Society for Interferon and Cytokine Research
18(8): 549-554.
Davis, K. L. (2011). "Ikaros: master of hematopoiesis, agent of leukemia."
Therapeutic advances in hematology 2(6): 359-368.
de Boer, J., A. Williams, G. Skavdis, N. Harker, M. Coles, M. Tolaini, T. Norton, K.
Williams, K. Roderick, A. J. Potocnik and D. Kioussis (2003). "Transgenic mice
with hematopoietic and lymphoid specific expression of Cre." Eur J Immunol
33(2): 314-325.
de Lange, T. (1994). "Activation of telomerase in a human tumor." Proceedings of
the National Academy of Sciences of the United States of America 91(8):
2882-2885.
Debatin, K. M. and P. H. Krammer (2004). "Death receptors in chemotherapy and
cancer." Oncogene 23(16): 2950-2966.
Decker, E. L., C. Skerka and P. F. Zipfel (1998). "The early growth response protein
(EGR-1) regulates interleukin-2 transcription by synergistic interaction with
the nuclear factor of activated T cells." The Journal of biological chemistry
273(41): 26923-26930.

207
Dillon, R. L., S. T. Brown, C. Ling, T. Shioda and W. J. Muller (2007). "An
EGR2/CITED1 transcription factor complex and the 14-3-3sigma tumor
suppressor are involved in regulating ErbB2 expression in a transgenic-
mouse model of human breast cancer." Molecular and cellular biology
27(24): 8648-8657.
Ding, B. B., J. J. Yu, R. Y. Yu, L. M. Mendez, R. Shaknovich, Y. Zhang, G. Cattoretti and
B. H. Ye (2008). "Constitutively activated STAT3 promotes cell proliferation
and survival in the activated B-cell subtype of diffuse large B-cell
lymphomas." Blood 111(3): 1515-1523.
Dinkel, A., K. Warnatz, B. Ledermann, A. Rolink, P. F. Zipfel, K. Burki and H. Eibel
(1998). "The transcription factor early growth response 1 (Egr-1) advances
differentiation of pre-B and immature B cells." The Journal of experimental
medicine 188(12): 2215-2224.
Dolmetsch, R. E., R. S. Lewis, C. C. Goodnow and J. I. Healy (1997). "Differential
activation of transcription factors induced by Ca2+ response amplitude and
duration." Nature 386(6627): 855-858.
Dong, S., S. Kang, T. L. Gu, S. Kardar, H. Fu, S. Lonial, H. J. Khoury, F. Khuri and J.
Chen (2007). "14-3-3 Integrates prosurvival signals mediated by the AKT and
MAPK pathways in ZNF198-FGFR1-transformed hematopoietic cells." Blood
110(1): 360-369.
Doyle, H. A., R. J. Gee and M. J. Mamula (2003). "A failure to repair self-proteins
leads to T cell hyperproliferation and autoantibody production." J Immunol
171(6): 2840-2847.
Dranoff, G. (2004). "Cytokines in cancer pathogenesis and cancer therapy." Nature
reviews. Cancer 4(1): 11-22.

208
Dupuis, A., M. P. Gaub, M. Legrain, B. Drenou, L. Mauvieux, P. Lutz, R. Herbrecht, S.
Chan and P. Kastner (2013). "Biclonal and biallelic deletions occur in 20% of
B-ALL cases with IKZF1 mutations." Leukemia 27(2): 503-507.
Ek, S., E. Bjorck, A. Porwit-MacDonald, M. Nordenskjold and C. A. Borrebaeck
(2004). "Increased expression of Ki-67 in mantle cell lymphoma is associated
with de-regulation of several cell cycle regulatory components, as identified
by global gene expression analysis." Haematologica 89(6): 686-695.
Eldredge, L. C., X. M. Gao, D. H. Quach, L. Li, X. Han, J. Lomasney and W. G.
Tourtellotte (2008). "Abnormal sympathetic nervous system development
and physiological dysautonomia in Egr3-deficient mice." Development
135(17): 2949-2957.
Fahmy, R. G. and L. M. Khachigian (2004). "Locked nucleic acid modified DNA
enzymes targeting early growth response-1 inhibit human vascular smooth
muscle cell growth." Nucleic acids research 32(7): 2281-2285.
Fathman, C. G. and N. B. Lineberry (2007). "Molecular mechanisms of CD4+ T-cell
anergy." Nature reviews. Immunology 7(8): 599-609.
Ferguson, B. M. and W. L. Fangman (1992). "A position effect on the time of
replication origin activation in yeast." Cell 68(2): 333-339.
Ferreri, A. J., I. Ernberg and C. Copie-Bergman (2009). "Infectious agents and
lymphoma development: molecular and clinical aspects." Journal of internal
medicine 265(4): 421-438.
Frank, D. A. (1999). "STAT signaling in the pathogenesis and treatment of cancer."
Molecular medicine 5(7): 432-456.

209
Friesen, C., S. Fulda and K. M. Debatin (1997). "Deficient activation of the CD95
(APO-1/Fas) system in drug-resistant cells." Leukemia 11(11): 1833-1841.
Fu, Z. and D. J. Tindall (2008). "FOXOs, cancer and regulation of apoptosis."
Oncogene 27(16): 2312-2319.
Fulda, S. (2009). "Inhibitor of apoptosis proteins in hematological malignancies."
Leukemia 23(3): 467-476.
Fulda, S. (2009). "Tumor resistance to apoptosis." International journal of cancer.
Journal international du cancer 124(3): 511-515.
Gallatin, W. M., I. L. Weissman and E. C. Butcher (1983). "A cell-surface molecule
involved in organ-specific homing of lymphocytes." Nature 304(5921): 30-
34.
Gaudin, E., M. Rosado, F. Agenes, A. McLean and A. A. Freitas (2004). "B-cell
homeostasis, competition, resources, and positive selection by self-
antigens." Immunol Rev 197: 102-115.
Gay, D., T. Saunders, S. Camper and M. Weigert (1993). "Receptor editing: an
approach by autoreactive B cells to escape tolerance." The Journal of
experimental medicine 177(4): 999-1008.
Georgopoulos, K., M. Bigby, J. H. Wang, A. Molnar, P. Wu, S. Winandy and A. Sharpe
(1994). "The Ikaros gene is required for the development of all lymphoid
lineages." Cell 79(1): 143-156.
Georgopoulos, K., D. D. Moore and B. Derfler (1992). "Ikaros, an early lymphoid-
specific transcription factor and a putative mediator for T cell commitment."
Science 258(5083): 808-812.

210
Germain, R. N. (2002). "T-cell development and the CD4-CD8 lineage decision." Nat
Rev Immunol 2(5): 309-322.
Godfrey, D. I., J. Kennedy, T. Suda and A. Zlotnik (1993). "A Developmental Pathway
Involving 4 Phenotypically and Functionally Distinct Subsets of Cd3-Cd4-Cd8-
Triple-Negative Adult-Mouse Thymocytes Defined by Cd44 and Cd25
Expression." Journal of Immunology 150(10): 4244-4252.
Goldrath, A. W. and M. J. Bevan (1999). "Selecting and maintaining a diverse T-cell
repertoire." Nature 402(6759): 255-262.
Good, R. A. and S. J. Zak (1956). "Disturbances in gamma globulin synthesis as
experiments of nature." Pediatrics 18(1): 109-149.
Goodnow, C. C., J. Crosbie, S. Adelstein, T. B. Lavoie, S. J. Smith-Gill, R. A. Brink, H.
Pritchard-Briscoe, J. S. Wotherspoon, R. H. Loblay, K. Raphael and et al.
(1988). "Altered immunoglobulin expression and functional silencing of self-
reactive B lymphocytes in transgenic mice." Nature 334(6184): 676-682.
Goodnow, C. C., J. Sprent, B. Fazekas de St Groth and C. G. Vinuesa (2005). "Cellular
and genetic mechanisms of self tolerance and autoimmunity." Nature
435(7042): 590-597.
Graves, P. R., C. M. Lovly, G. L. Uy and H. Piwnica-Worms (2001). "Localization of
human Cdc25C is regulated both by nuclear export and 14-3-3 protein
binding." Oncogene 20(15): 1839-1851.
Grawunder, U., T. M. Leu, D. G. Schatz, A. Werner, A. G. Rolink, F. Melchers and T.
H. Winkler (1995). "Down-regulation of RAG1 and RAG2 gene expression in
preB cells after functional immunoglobulin heavy chain rearrangement."
Immunity 3(5): 601-608.

211
Greider, C. W. (1996). "Telomere length regulation." Annual review of biochemistry
65: 337-365.
Greider, C. W. and E. H. Blackburn (1985). "Identification of a specific telomere
terminal transferase activity in Tetrahymena extracts." Cell 43(2 Pt 1): 405-
413.
Greider, C. W. and E. H. Blackburn (1989). "A telomeric sequence in the RNA of
Tetrahymena telomerase required for telomere repeat synthesis." Nature
337(6205): 331-337.
Grivennikov, S. I., F. R. Greten and M. Karin (2010). "Immunity, inflammation, and
cancer." Cell 140(6): 883-899.
Gross, J. A., S. R. Dillon, S. Mudri, J. Johnston, A. Littau, R. Roque, M. Rixon, O.
Schou, K. P. Foley, H. Haugen, S. McMillen, K. Waggie, R. W. Schreckhise, K.
Shoemaker, T. Vu, M. Moore, A. Grossman and C. H. Clegg (2001). "TACI-Ig
neutralizes molecules critical for B cell development and autoimmune
disease. impaired B cell maturation in mice lacking BLyS." Immunity 15(2):
289-302.
Grulich, A. E., C. M. Vajdic and W. Cozen (2007). "Altered immunity as a risk factor
for non-Hodgkin’s lymphoma." Cancer epidemiology, biomarkers &
prevention : a publication of the American Association for Cancer Research,
cosponsored by the American Society of Preventive Oncology 16(3): 405-
408.
Hachem, A. and R. B. Gartenhaus (2005). "Oncogenes as molecular targets in
lymphoma." Blood 106(6): 1911-1923.

212
Hagenbeek, T. J. and H. Spits (2008). "T-cell lymphomas in T-cell-specific Pten-
deficient mice originate in the thymus." Leukemia 22(3): 608-619.
Hampe, C. S. (2012). "B Cell in Autoimmune Diseases." Scientifica 2012.
Hanahan, D. and R. A. Weinberg (2000). "The hallmarks of cancer." Cell 100(1): 57-
70.
Hanahan, D. and R. A. Weinberg (2011). "Hallmarks of cancer: the next generation."
Cell 144(5): 646-674.
Hardy, R. R. and K. Hayakawa (2001). "B cell development pathways." Annual
review of immunology 19: 595-621.
Harle-Bachor, C. and P. Boukamp (1996). "Telomerase activity in the regenerative
basal layer of the epidermis inhuman skin and in immortal and carcinoma-
derived skin keratinocytes." Proceedings of the National Academy of
Sciences of the United States of America 93(13): 6476-6481.
Harless, S. M., V. M. Lentz, A. P. Sah, B. L. Hsu, K. Clise-Dwyer, D. M. Hilbert, C. E.
Hayes and M. P. Cancro (2001). "Competition for BLyS-mediated signaling
through Bcmd/BR3 regulates peripheral B lymphocyte numbers." Current
biology : CB 11(24): 1986-1989.
Harley, C. B., A. B. Futcher and C. W. Greider (1990). "Telomeres shorten during
ageing of human fibroblasts." Nature 345(6274): 458-460.
Harris, J. E., K. D. Bishop, N. E. Phillips, J. P. Mordes, D. L. Greiner, A. A. Rossini and
M. P. Czech (2004). "Early growth response gene-2, a zinc-finger
transcription factor, is required for full induction of clonal anergy in CD4+ T
cells." J Immunol 173(12): 7331-7338.

213
Harris, N. L., E. S. Jaffe, H. Stein, P. M. Banks, J. K. Chan, M. L. Cleary, G. Delsol, C. De
Wolf-Peeters, B. Falini, K. C. Gatter and et al. (1994). "A revised European-
American classification of lymphoid neoplasms: a proposal from the
International Lymphoma Study Group." Blood 84(5): 1361-1392.
Hartwell, L. H. and M. B. Kastan (1994). "Cell cycle control and cancer." Science
266(5192): 1821-1828.
Hartwell, L. H. and T. A. Weinert (1989). "Checkpoints: controls that ensure the
order of cell cycle events." Science 246(4930): 629-634.
Hastie, N. D., M. Dempster, M. G. Dunlop, A. M. Thompson, D. K. Green and R. C.
Allshire (1990). "Telomere reduction in human colorectal carcinoma and
with ageing." Nature 346(6287): 866-868.
Hathcock, K. S., N. P. Weng, R. Merica, M. K. Jenkins and R. Hodes (1998). "Cutting
edge: antigen-dependent regulation of telomerase activity in murine T
cells." J Immunol 160(12): 5702-5706.
Hengartner, M. O. (2000). "The biochemistry of apoptosis." Nature 407(6805): 770-
776.
Hermeking, H. (2003). "The 14-3-3 cancer connection." Nature reviews. Cancer
3(12): 931-943.
Hickman, E. S., M. C. Moroni and K. Helin (2002). "The role of p53 and pRB in
apoptosis and cancer." Current opinion in genetics & development 12(1):
60-66.
Hollander, G. A. and P. Peterson (2009). "Learning to be tolerant: how T cells keep
out of trouble." Journal of Internal Medicine 265(5): 541-561.

214
Hollstein, M., D. Sidransky, B. Vogelstein and C. C. Harris (1991). "p53 mutations in
human cancers." Science 253(5015): 49-53.
Holt, S. E., W. E. Wright and J. W. Shay (1996). "Regulation of telomerase activity in
immortal cell lines." Molecular and cellular biology 16(6): 2932-2939.
Illes, A., L. Varoczy, G. Papp, P. C. Wilson, P. Alex, R. Jonsson, T. Kovacs, Y. T.
Konttinen, M. Zeher, B. Nakken and P. Szodoray (2009). "Aspects of B-cell
non-Hodgkin’s's lymphoma development: a transition from immune-
reactivity to malignancy." Scandinavian journal of immunology 69(5): 387-
400.
Ishida, T. and R. Ueda (2011). "Immunopathogenesis of lymphoma: focus on CCR4."
Cancer science 102(1): 44-50.
Jaffe, E. S. (2009). "The 2008 WHO classification of lymphomas: implications for
clinical practice and translational research." Hematology / the Education
Program of the American Society of Hematology. American Society of
Hematology. Education Program: 523-531.
Jemal, A., R. C. Tiwari, T. Murray, A. Ghafoor, A. Samuels, E. Ward, E. J. Feuer and
M. J. Thun (2004). "Cancer statistics, 2004." CA: a cancer journal for
clinicians 54(1): 8-29.
Jenkins, M. K., C. A. Chen, G. Jung, D. L. Mueller and R. H. Schwartz (1990).
"Inhibition of antigen-specific proliferation of type 1 murine T cell clones
after stimulation with immobilized anti-CD3 monoclonal antibody." J
Immunol 144(1): 16-22.
Jenkins, M. K. and J. G. Johnson (1993). "Molecules involved in T-cell costimulation."
Current opinion in immunology 5(3): 361-367.

215
Jenkins, M. K. and R. H. Schwartz (1987). "Antigen presentation by chemically
modified splenocytes induces antigen-specific T cell unresponsiveness in
vitro and in vivo." The Journal of experimental medicine 165(2): 302-319.
John, L. B., S. Yoong and A. C. Ward (2009). "Evolution of the Ikaros gene family:
implications for the origins of adaptive immunity." J Immunol 182(8): 4792-
4799.
Jung, D. and F. W. Alt (2004). "Unraveling V(D)J recombination; insights into gene
regulation." Cell 116(2): 299-311.
Kaldis, P., Z. W. Pitluk, I. A. Bany, D. A. Enke, M. Wagner, E. Winter and M. J.
Solomon (1998). "Localization and regulation of the cdk-activating kinase
(Cak1p) from budding yeast." Journal of cell science 111 ( Pt 24): 3585-3596.
Kano, G., A. Morimoto, M. Takanashi, S. Hibi, T. Sugimoto, T. Inaba, T. Yagi and S.
Imashuku (2008). "Ikaros dominant negative isoform (Ik6) induces IL-3-
independent survival of murine pro-B lymphocytes by activating JAK-STAT
and up-regulating Bcl-xl levels." Leukemia & lymphoma 49(5): 965-973.
Karasuyama, H., T. Nakamura, K. Nagata, T. Kuramochi, F. Kitamura and K. Kuida
(1997). "The roles of preB cell receptor in early B cell development and its
signal transduction." Immunology and cell biology 75(2): 209-216.
Kerr, J. F., C. M. Winterford and B. V. Harmon (1994). "Apoptosis. Its significance in
cancer and cancer therapy." Cancer 73(8): 2013-2026.
Khachigian, L. M. (2004). "Early growth response-1: blocking angiogenesis by
shooting the messenger." Cell cycle 3(1): 10-11.

216
Kinjyo, I., H. Inoue, S. Hamano, S. Fukuyama, T. Yoshimura, K. Koga, H. Takaki, K.
Himeno, G. Takaesu, T. Kobayashi and A. Yoshimura (2006). "Loss of SOCS3
in T helper cells resulted in reduced immune responses and
hyperproduction of interleukin 10 and transforming growth factor-beta 1."
The Journal of experimental medicine 203(4): 1021-1031.
Kishimoto, T., T. Taga and S. Akira (1994). "Cytokine signal transduction." Cell 76(2):
253-262.
Kitamura, D., A. Kudo, S. Schaal, W. Muller, F. Melchers and K. Rajewsky (1992). "A
critical role of lambda 5 protein in B cell development." Cell 69(5): 823-831.
Kitamura, D., J. Roes, R. Kuhn and K. Rajewsky (1991). "A B cell-deficient mouse by
targeted disruption of the membrane exon of the immunoglobulin mu chain
gene." Nature 350(6317): 423-426.
Klein, H. L. (2008). "The consequences of Rad51 overexpression for normal and
tumor cells." DNA repair 7(5): 686-693.
Kleinmann, E., A. S. Geimer Le Lay, M. Sellars, P. Kastner and S. Chan (2008). "Ikaros
represses the transcriptional response to Notch signaling in T-cell
development." Molecular and cellular biology 28(24): 7465-7475.
Knudson, A. G., Jr. (1971). "Mutation and cancer: statistical study of
retinoblastoma." Proc Natl Acad Sci U S A 68(4): 820-823.
Knudson, A. G., Jr. (1971). "Mutation and cancer: statistical study of
retinoblastoma." Proceedings of the National Academy of Sciences of the
United States of America 68(4): 820-823.

217
Knudson, A. G., Jr., A. T. Meadows, W. W. Nichols and R. Hill (1976). "Chromosomal
deletion and retinoblastoma." The New England journal of medicine
295(20): 1120-1123.
Kornblau, S. M., N. Singh, Y. Qiu, W. Chen, N. Zhang and K. R. Coombes (2010).
"Highly phosphorylated FOXO3A is an adverse prognostic factor in acute
myeloid leukemia." Clinical cancer research : an official journal of the
American Association for Cancer Research 16(6): 1865-1874.
Kortylewski, M., M. Kujawski, T. Wang, S. Wei, S. Zhang, S. Pilon-Thomas, G. Niu, H.
Kay, J. Mule, W. G. Kerr, R. Jove, D. Pardoll and H. Yu (2005). "Inhibiting
Stat3 signaling in the hematopoietic system elicits multicomponent
antitumor immunity." Nature medicine 11(12): 1314-1321.
Kubo, M., T. Hanada and A. Yoshimura (2003). "Suppressors of cytokine signaling
and immunity." Nat Immunol 4(12): 1169-1176.
Kuhn, A., S. Beissert and P. H. Krammer (2009). "CD4(+)CD25 (+) regulatory T cells in
human lupus erythematosus." Arch Dermatol Res 301(1): 71-81.
Kuiper, R. P., E. Waanders, V. H. van der Velden, S. V. van Reijmersdal, R.
Venkatachalam, B. Scheijen, E. Sonneveld, J. J. van Dongen, A. J. Veerman, F.
N. van Leeuwen, A. G. van Kessel and P. M. Hoogerbrugge (2010). "IKZF1
deletions predict relapse in uniformly treated pediatric precursor B-ALL."
Leukemia 24(7): 1258-1264.
Kultz, D. (2005). "Molecular and evolutionary basis of the cellular stress response."
Annual review of physiology 67: 225-257.
Kyewski, B. and J. Derbinski (2004). "Self-representation in the thymus: An
extended view." Nature Reviews Immunology 4(9): 688-698.

218
Lai, A. Y. and M. Kondo (2008). "T and B lymphocyte differentiation from
hematopoietic stem cell." Seminars in immunology 20(4): 207-212.
Lane, D. P. (1992). "Cancer. p53, guardian of the genome." Nature 358(6381): 15-
16.
Lazarevic, V., A. J. Zullo, M. N. Schweitzer, T. L. Staton, E. M. Gallo, G. R. Crabtree
and L. H. Glimcher (2009). "The gene encoding early growth response 2, a
target of the transcription factor NFAT, is required for the development and
maturation of natural killer T cells." Nat Immunol 10(3): 306-313.
Levine, M. H., A. M. Haberman, D. B. Sant'Angelo, L. G. Hannum, M. P. Cancro, C. A.
Janeway, Jr. and M. J. Shlomchik (2000). "A B-cell receptor-specific selection
step governs immature to mature B cell differentiation." Proceedings of the
National Academy of Sciences of the United States of America 97(6): 2743-
2748.
Li, S., T. Miao, M. Sebastian, P. Bhullar, E. Ghaffari, M. Liu, A. L. Symonds and P.
Wang (2012). "The transcription factors Egr2 and Egr3 are essential for the
control of inflammation and antigen-induced proliferation of B and T cells."
Immunity 37(4): 685-696.
Li, S., A. L. Symonds, B. Zhu, M. Liu, M. V. Raymond, T. Miao and P. Wang (2011).
"Early growth response gene-2 (Egr-2) regulates the development of B and T
cells." PLoS One 6(4): e18498.
Li, Z. M., J. J. Huang, Y. Xia, Y. J. Zhu, W. Zhao, W. X. Wei, W. Q. Jiang, T. Y. Lin, H. Q.
Huang and Z. Z. Guan (2012). "High Ki-67 expression in diffuse large B-cell
lymphoma patients with non-germinal center subtype indicates limited
survival benefit from R-CHOP therapy." European journal of haematology
88(6): 510-517.

219
Lieber, M. R. (1991). "Site-specific recombination in the immune system." FASEB
journal : official publication of the Federation of American Societies for
Experimental Biology 5(14): 2934-2944.
Lin, L., J. D. Hron and S. L. Peng (2004). "Regulation of NF-kappaB, Th activation, and
autoinflammation by the forkhead transcription factor Foxo3a." Immunity
21(2): 203-213.
Lindsey, J., N. I. McGill, L. A. Lindsey, D. K. Green and H. J. Cooke (1991). "In vivo loss
of telomeric repeats with age in humans." Mutat Res 256(1): 45-48.
Liu, G. Y., P. J. Fairchild, R. M. Smith, J. R. Prowle, D. Kioussis and D. C. Wraith
(1995). "Low avidity recognition of self-antigen by T cells permits escape
from central tolerance." Immunity 3(4): 407-415.
Livak, K. J. and T. D. Schmittgen (2001). "Analysis of relative gene expression data
using real-time quantitative PCR and the 2(-Delta Delta C(T)) Method."
Methods 25(4): 402-408.
Lockshin, R. A. and Z. Zakeri (2007). "Cell death in health and disease." Journal of
cellular and molecular medicine 11(6): 1214-1224.
Lowe, S. W., E. Cepero and G. Evan (2004). "Intrinsic tumour suppression." Nature
432(7015): 307-315.
Lowe, S. W. and A. W. Lin (2000). "Apoptosis in cancer." Carcinogenesis 21(3): 485-
495.
Lu, H., W. Ouyang and C. Huang (2006). "Inflammation, a key event in cancer
development." Molecular cancer research : MCR 4(4): 221-233.

220
Luderus, M. E., B. van Steensel, L. Chong, O. C. Sibon, F. F. Cremers and T. de Lange
(1996). "Structure, subnuclear distribution, and nuclear matrix association of
the mammalian telomeric complex." The Journal of cell biology 135(4): 867-
881.
Ma, S., S. Pathak, M. Mandal, L. Trinh, M. R. Clark and R. Lu (2010). "Ikaros and
Aiolos inhibit pre-B-cell proliferation by directly suppressing c-Myc
expression." Molecular and cellular biology 30(17): 4149-4158.
Macian, F., F. Garcia-Cozar, S. H. Im, H. F. Horton, M. C. Byrne and A. Rao (2002).
"Transcriptional mechanisms underlying lymphocyte tolerance." Cell 109(6):
719-731.
Macian, F., S. H. Im, F. J. Garcia-Cozar and A. Rao (2004). "T-cell anergy." Current
opinion in immunology 16(2): 209-216.
MacLennan, I. C., K. M. Toellner, A. F. Cunningham, K. Serre, D. M. Sze, E. Zuniga, M.
C. Cook and C. G. Vinuesa (2003). "Extrafollicular antibody responses."
Immunol Rev 194: 8-18.
Marshall, O. J. (2004). "PerlPrimer: cross-platform, graphical primer design for
standard, bisulphite and real-time PCR." Bioinformatics 20(15): 2471-2472.
Martensson, I. L., N. Almqvist, O. Grimsholm and A. I. Bernardi (2010). "The pre-B
cell receptor checkpoint." FEBS letters 584(12): 2572-2579.
Maxwell, S. A., Z. Li, D. Jaye, S. Ballard, J. Ferrell and H. Fu (2009). "14-3-3zeta
mediates resistance of diffuse large B cell lymphoma to an anthracycline-
based chemotherapeutic regimen." The Journal of biological chemistry
284(33): 22379-22389.

221
McClintock, B. (1941). "The Stability of Broken Ends of Chromosomes in Zea Mays."
Genetics 26(2): 234-282.
McKenzie, S. and N. Kyprianou (2006). "Apoptosis evasion: the role of survival
pathways in prostate cancer progression and therapeutic resistance."
Journal of cellular biochemistry 97(1): 18-32.
Meffre, E., R. Casellas and M. C. Nussenzweig (2000). "Antibody regulation of B cell
development." Nat Immunol 1(5): 379-385.
Melchers, F. (2005). "The pre-B-cell receptor: selector of fitting immunoglobulin
heavy chains for the B-cell repertoire." Nature reviews. Immunology 5(7):
578-584.
Meyerson, M. (2000). "Role of telomerase in normal and cancer cells." J Clin Oncol
18(13): 2626-2634.
Michie, A. M., J. R. Carlyle, T. M. Schmitt, B. Ljutic, S. K. Cho, Q. Fong and J. C.
Zuniga-Pflucker (2000). "Clonal characterization of a bipotent T cell and NK
cell progenitor in the mouse fetal thymus." J Immunol 164(4): 1730-1733.
Michie, A. M. and J. C. Zuniga-Pflucker (2002). "Regulation of thymocyte
differentiation: pre-TCR signals and beta-selection." Seminars in
immunology 14(5): 311-323.
Miller, M. A., B. Karacay, X. Zhu, M. S. O'Dorisio and A. D. Sandler (2006). "Caspase
8L, a novel inhibitory isoform of caspase 8, is associated with
undifferentiated neuroblastoma." Apoptosis : an international journal on
programmed cell death 11(1): 15-24.
222
Mittelstadt, P. R. and J. D. Ashwell (1999). "Role of Egr-2 in up-regulation of Fas
ligand in normal T cells and aberrant double-negative lpr and gld T cells."
The Journal of biological chemistry 274(5): 3222-3227.
Miyazaki, T. (1997). "Two distinct steps during thymocyte maturation from CD4-
CD8- to CD4+CD8+ distinguished in the early growth response (Egr)-1
transgenic mice with a recombinase-activating gene-deficient background."
The Journal of experimental medicine 186(6): 877-885.
Mok, C. C. and C. S. Lau (2003). "Pathogenesis of systemic lupus erythematosus."
Journal of clinical pathology 56(7): 481-490.
Molnar, A. and K. Georgopoulos (1994). "The Ikaros gene encodes a family of
functionally diverse zinc finger DNA-binding proteins." Molecular and
cellular biology 14(12): 8292-8303.
Moore, K. W., R. de Waal Malefyt, R. L. Coffman and A. O'Garra (2001). "Interleukin-
10 and the interleukin-10 receptor." Annual review of immunology 19: 683-
765.
Morrison, S. J., K. R. Prowse, P. Ho and I. L. Weissman (1996). "Telomerase activity
in hematopoietic cells is associated with self-renewal potential." Immunity
5(3): 207-216.
Morrison, T. B., J. J. Weis and C. T. Wittwer (1998). "Quantification of low-copy
transcripts by continuous SYBR Green I monitoring during amplification."
BioTechniques 24(6): 954-958, 960, 962.
Morse, H. C., 3rd, M. R. Anver, T. N. Fredrickson, D. C. Haines, A. W. Harris, N. L.
Harris, E. S. Jaffe, S. C. Kogan, I. C. MacLennan, P. K. Pattengale and J. M.

223
Ward (2002). "Bethesda proposals for classification of lymphoid neoplasms
in mice." Blood 100(1): 246-258.
Muller, H. J. (1951). "[Radiation injuries of the genetic material]." Strahlentherapie
85(4): 509-536.
Mullighan, C. G., X. Su, J. Zhang, I. Radtke, L. A. Phillips, C. B. Miller, J. Ma, W. Liu, C.
Cheng, B. A. Schulman, R. C. Harvey, I. M. Chen, R. J. Clifford, W. L. Carroll, G.
Reaman, W. P. Bowman, M. Devidas, D. S. Gerhard, W. Yang, M. V. Relling,
S. A. Shurtleff, D. Campana, M. J. Borowitz, C. H. Pui, M. Smith, S. P. Hunger,
C. L. Willman and J. R. Downing (2009). "Deletion of IKZF1 and prognosis in
acute lymphoblastic leukemia." The New England journal of medicine
360(5): 470-480.
Mullis, K., F. Faloona, S. Scharf, R. Saiki, G. Horn and H. Erlich (1986). "Specific
enzymatic amplification of DNA in vitro: the polymerase chain reaction."
Cold Spring Harb Symp Quant Biol 51 Pt 1: 263-273.
Mullis, K. B. and F. A. Faloona (1987). "Specific synthesis of DNA in vitro via a
polymerase-catalyzed chain reaction." Methods Enzymol 155: 335-350.
Murali-Krishna, K., L. L. Lau, S. Sambhara, F. Lemonnier, J. Altman and R. Ahmed
(1999). "Persistence of memory CD8 T cells in MHC class I-deficient mice."
Science 286(5443): 1377-1381.
Nathan, C. (2002). "Points of control in inflammation." Nature 420(6917): 846-852.
Negrini, S., V. G. Gorgoulis and T. D. Halazonetis (2010). "Genomic instability--an
evolving hallmark of cancer." Nat Rev Mol Cell Biol 11(3): 220-228.
224
Nemazee, D. A. and K. Burki (1989). "Clonal deletion of B lymphocytes in a
transgenic mouse bearing anti-MHC class I antibody genes." Nature
337(6207): 562-566.
Newmeyer, D. D. and S. Ferguson-Miller (2003). "Mitochondria: releasing power for
life and unleashing the machineries of death." Cell 112(4): 481-490.
Nichogiannopoulou, A., M. Trevisan, S. Neben, C. Friedrich and K. Georgopoulos
(1999). "Defects in hemopoietic stem cell activity in Ikaros mutant mice."
The Journal of experimental medicine 190(9): 1201-1214.
Nossal, G. J. (1993). "Tolerance and ways to break it." Annals of the New York
Academy of Sciences 690: 34-41.
Nowell, P. C. (1976). "The clonal evolution of tumor cell populations." Science
194(4260): 23-28.
Nowell, P. C. (2002). "Tumor progression: a brief historical perspective." Semin
Cancer Biol 12(4): 261-266.
O'Donovan, K. J., W. G. Tourtellotte, J. Millbrandt and J. M. Baraban (1999). "The
EGR family of transcription-regulatory factors: progress at the interface of
molecular and systems neuroscience." Trends in neurosciences 22(4): 167-
173.
O'Sullivan, L. A., C. Liongue, R. S. Lewis, S. E. Stephenson and A. C. Ward (2007).
"Cytokine receptor signaling through the Jak-Stat-Socs pathway in disease."
Molecular immunology 44(10): 2497-2506.
Obrador-Hevia, A., M. Serra-Sitjar, J. Rodriguez, P. Villalonga and S. Fernandez de
Mattos (2012). "The tumour suppressor FOXO3 is a key regulator of mantle

225
cell lymphoma proliferation and survival." British journal of haematology
156(3): 334-345.
Oguro, H. and A. Iwama (2007). "Life and death in hematopoietic stem cells."
Current opinion in immunology 19(5): 503-509.
Ohashi, P. S. (2002). "T-cell signalling and autoimmunity: molecular mechanisms of
disease." Nature reviews. Immunology 2(6): 427-438.
Ohl, K. and K. Tenbrock (2011). "Inflammatory cytokines in systemic lupus
erythematosus." J Biomed Biotechnol 2011: 432595.
Okada, H. and T. W. Mak (2004). "Pathways of apoptotic and non-apoptotic death
in tumour cells." Nature reviews. Cancer 4(8): 592-603.
Olovnikov, A. M. (1973). "A theory of marginotomy. The incomplete copying of
template margin in enzymic synthesis of polynucleotides and biological
significance of the phenomenon." Journal of theoretical biology 41(1): 181-
190.
Parkin, J. and B. Cohen (2001). "An overview of the immune system." Lancet
357(9270): 1777-1789.
Pettersson, T., E. Pukkala, L. Teppo and C. Friman (1992). "Increased risk of cancer
in patients with systemic lupus erythematosus." Annals of the rheumatic
diseases 51(4): 437-439.
Pfaffl, M. W. (2001). "A new mathematical model for relative quantification in real-
time RT-PCR." Nucleic acids research 29(9): e45.
Philip, M., D. A. Rowley and H. Schreiber (2004). "Inflammation as a tumor
promoter in cancer induction." Semin Cancer Biol 14(6): 433-439.

226
Pietropaolo, M., J. M. Surhigh, P. W. Nelson and G. S. Eisenbarth (2008). "Primer:
immunity and autoimmunity." Diabetes 57(11): 2872-2882.
Pike, B. L., A. W. Boyd and G. J. Nossal (1982). "Clonal anergy: the universally
anergic B lymphocyte." Proceedings of the National Academy of Sciences of
the United States of America 79(6): 2013-2017.
Pillai, S. and A. Cariappa (2009). "The follicular versus marginal zone B lymphocyte
cell fate decision." Nature reviews. Immunology 9(11): 767-777.
Pillai, S., A. Cariappa and S. T. Moran (2004). "Positive selection and lineage
commitment during peripheral B-lymphocyte development." Immunol Rev
197: 206-218.
Podojil, J. R. and S. D. Miller (2009). "Molecular mechanisms of T-cell receptor and
costimulatory molecule ligation/blockade in autoimmune disease therapy."
Immunol Rev 229(1): 337-355.
Poirier, R., H. Cheval, C. Mailhes, S. Garel, P. Charnay, S. Davis and S. Laroche
(2008). "Distinct functions of egr gene family members in cognitive
processes." Frontiers in neuroscience 2(1): 47-55.
Quach, D. H., M. Oliveira-Fernandes, K. A. Gruner and W. G. Tourtellotte (2013). "A
sympathetic neuron autonomous role for Egr3-mediated gene regulation in
dendrite morphogenesis and target tissue innervation." The Journal of
neuroscience : the official journal of the Society for Neuroscience 33(10):
4570-4583.
Rabenhorst, S. H., R. C. Burini and F. C. Schmitt (1996). "Proliferating cell nuclear
antigen (PCNA) in non-Hodgkin’s's lymphomas: correlation with working

227
formulation and Kiel classification in formalin-fixed paraffin-embedded
material." Pathology 28(1): 12-16.
Raderschall, E., K. Stout, S. Freier, V. Suckow, S. Schweiger and T. Haaf (2002).
"Elevated levels of Rad51 recombination protein in tumor cells." Cancer
research 62(1): 219-225.
Rakoff-Nahoum, S. (2006). "Why cancer and inflammation?" The Yale journal of
biology and medicine 79(3-4): 123-130.
Ray, R. J., A. Stoddart, J. L. Pennycook, H. O. Huner, C. Furlonger, G. E. Wu and C. J.
Paige (1998). "Stromal cell-independent maturation of IL-7-responsive pro-B
cells." J Immunol 160(12): 5886-5897.
Rebollo, A. and C. Schmitt (2003). "Ikaros, Aiolos and Helios: transcription
regulators and lymphoid malignancies." Immunology and cell biology 81(3):
171-175.
Resino, S., J. Navarro, J. M. Bellon, D. Gurbindo, J. A. Leon and M. A. Munoz-
Fernandez (2001). "Naive and memory CD4+ T cells and T cell activation
markers in HIV-1 infected children on HAART." Clinical and experimental
immunology 125(2): 266-273.
Rioux, J. D. and A. K. Abbas (2005). "Paths to understanding the genetic basis of
autoimmune disease." Nature 435(7042): 584-589.
Ririe, K. M., R. P. Rasmussen and C. T. Wittwer (1997). "Product differentiation by
analysis of DNA melting curves during the polymerase chain reaction."
Analytical biochemistry 245(2): 154-160.

228
Rolink, A. G., T. Winkler, F. Melchers and J. Andersson (2000). "Precursor B cell
receptor-dependent B cell proliferation and differentiation does not require
the bone marrow or fetal liver environment." The Journal of experimental
medicine 191(1): 23-32.
Rotman, G. and Y. Shiloh (1997). "The ATM gene and protein: possible roles in
genome surveillance, checkpoint controls and cellular defence against
oxidative stress." Cancer surveys 29: 285-304.
Safford, M., S. Collins, M. A. Lutz, A. Allen, C. T. Huang, J. Kowalski, A. Blackford, M.
R. Horton, C. Drake, R. H. Schwartz and J. D. Powell (2005). "Egr-2 and Egr-3
are negative regulators of T cell activation." Nat Immunol 6(5): 472-480.
Sallusto, F., D. Lenig, R. Forster, M. Lipp and A. Lanzavecchia (1999). "Two subsets
of memory T lymphocytes with distinct homing potentials and effector
functions." Nature 401(6754): 708-712.
Salvador, J. M., M. C. Hollander, A. T. Nguyen, J. B. Kopp, L. Barisoni, J. K. Moore, J.
D. Ashwell and A. J. Fornace, Jr. (2002). "Mice lacking the p53-effector gene
Gadd45a develop a lupus-like syndrome." Immunity 16(4): 499-508.
Sandal, T. (2002). "Molecular aspects of the mammalian cell cycle and cancer." The
oncologist 7(1): 73-81.
Sandell, L. L. and V. A. Zakian (1993). "Loss of a yeast telomere: arrest, recovery,
and chromosome loss." Cell 75(4): 729-739.
Sarasin, A. (2003). "An overview of the mechanisms of mutagenesis and
carcinogenesis." Mutat Res 544(2-3): 99-106.
229
Schiemann, B., J. L. Gommerman, K. Vora, T. G. Cachero, S. Shulga-Morskaya, M.
Dobles, E. Frew and M. L. Scott (2001). "An essential role for BAFF in the
normal development of B cells through a BCMA-independent pathway."
Science 293(5537): 2111-2114.
Schneider-Maunoury, S., P. Topilko, T. Seitandou, G. Levi, M. Cohen-Tannoudji, S.
Pournin, C. Babinet and P. Charnay (1993). "Disruption of Krox-20 results in
alteration of rhombomeres 3 and 5 in the developing hindbrain." Cell 75(6):
1199-1214.
Schneider, P., F. MacKay, V. Steiner, K. Hofmann, J. L. Bodmer, N. Holler, C.
Ambrose, P. Lawton, S. Bixler, H. Acha-Orbea, D. Valmori, P. Romero, C.
Werner-Favre, R. H. Zubler, J. L. Browning and J. Tschopp (1999). "BAFF, a
novel ligand of the tumor necrosis factor family, stimulates B cell growth."
The Journal of experimental medicine 189(11): 1747-1756.
Schwartz, R. H. (2003). "T cell anergy." Annual review of immunology 21: 305-334.
Seiler, M. P., R. Mathew, M. K. Liszewski, C. J. Spooner, K. Barr, F. Meng, H. Singh
and A. Bendelac (2012). "Elevated and sustained expression of the
transcription factors Egr1 and Egr2 controls NKT lineage differentiation in
response to TCR signaling." Nat Immunol 13(3): 264-271.
Seyfert, V. L., V. P. Sukhatme and J. G. Monroe (1989). "Differential expression of a
zinc finger-encoding gene in response to positive versus negative signaling
through receptor immunoglobulin in murine B lymphocytes." Molecular and
cellular biology 9(5): 2083-2088.
Shacter, E. and S. A. Weitzman (2002). "Chronic inflammation and cancer."
Oncology 16(2): 217-226, 229; discussion 230-212.

230
Shampay, J., J. W. Szostak and E. H. Blackburn (1984). "DNA sequences of telomeres
maintained in yeast." Nature 310(5973): 154-157.
Shay, J. W. and S. Bacchetti (1997). "A survey of telomerase activity in human
cancer." European journal of cancer 33(5): 787-791.
Shay, J. W. and W. E. Wright (2005). "Senescence and immortalization: role of
telomeres and telomerase." Carcinogenesis 26(5): 867-874.
Shinkai, Y., G. Rathbun, K. P. Lam, E. M. Oltz, V. Stewart, M. Mendelsohn, J. Charron,
M. Datta, F. Young, A. M. Stall and et al. (1992). "RAG-2-deficient mice lack
mature lymphocytes owing to inability to initiate V(D)J rearrangement." Cell
68(5): 855-867.
Skerka, C., E. L. Decker and P. F. Zipfel (1997). "Coordinate expression and distinct
DNA-binding characteristics of the four EGR-zinc finger proteins in Jurkat T
lymphocytes." Immunobiology 198(1-3): 179-191.
Skibola, C. F., J. D. Curry and A. Nieters (2007). "Genetic susceptibility to
lymphoma." Haematologica 92(7): 960-969.
Slavov, S. N., H. L. Gimenes Teixeira and E. M. Rego (2010). "The role of micro-
ribonucleic acids in normal hematopoiesis and leukemic T-lymphogenesis."
Brazilian journal of medical and biological research = Revista brasileira de
pesquisas medicas e biologicas / Sociedade Brasileira de Biofisica ... [et al.]
43(7): 619-626.
Sommer, V. H., O. J. Clemmensen, O. Nielsen, M. Wasik, P. Lovato, C. Brender, K. W.
Eriksen, A. Woetmann, C. G. Kaestel, M. H. Nissen, C. Ropke, S. Skov and N.
Odum (2004). "In vivo activation of STAT3 in cutaneous T-cell lymphoma.

231
Evidence for an antiapoptotic function of STAT3." Leukemia 18(7): 1288-
1295.
Sprent, J., J. H. Cho, O. Boyman and C. D. Surh (2008). "T cell homeostasis."
Immunology and cell biology 86(4): 312-319.
Stahl, M., P. F. Dijkers, G. J. Kops, S. M. Lens, P. J. Coffer, B. M. Burgering and R. H.
Medema (2002). "The forkhead transcription factor FoxO regulates
transcription of p27Kip1 and Bim in response to IL-2." J Immunol 168(10):
5024-5031.
Starr, T. K., S. C. Jameson and K. A. Hogquist (2003). "Positive and negative selection
of T cells." Annu Rev Immunol 21: 139-176.
Suarez, F., O. Lortholary, O. Hermine and M. Lecuit (2006). "Infection-associated
lymphomas derived from marginal zone B cells: a model of antigen-driven
lymphoproliferation." Blood 107(8): 3034-3044.
Sukhatme, V. P. (1990). "Early transcriptional events in cell growth: the Egr family."
Journal of the American Society of Nephrology : JASN 1(6): 859-866.
Surh, C. D. and J. Sprent (2008). "Homeostasis of naive and memory T cells."
Immunity 29(6): 848-862.
Suzuki, A., J. L. de la Pompa, V. Stambolic, A. J. Elia, T. Sasaki, I. del Barco Barrantes,
A. Ho, A. Wakeham, A. Itie, W. Khoo, M. Fukumoto and T. W. Mak (1998).
"High cancer susceptibility and embryonic lethality associated with mutation
of the PTEN tumor suppressor gene in mice." Current biology : CB 8(21):
1169-1178.

232
Swirnoff, A. H. and J. Milbrandt (1995). "DNA-binding specificity of NGFI-A and
related zinc finger transcription factors." Molecular and cellular biology
15(4): 2275-2287.
Taillebourg, E., S. Buart and P. Charnay (2002). "Conditional, floxed allele of the
Krox20 gene." Genesis 32(2): 112-113.
Tait, S. W. and D. R. Green (2010). "Mitochondria and cell death: outer membrane
permeabilization and beyond." Nature reviews. Molecular cell biology 11(9):
621-632.
Takahama, Y. (2006). "Journey through the thymus: stromal guides for T-cell
development and selection." Nature reviews. Immunology 6(2): 127-135.
Takahama, Y. (2006). "Journey through the thymus: stromal guides for T-cell
development and selection." Nature Reviews Immunology 6(2): 127-135.
Takeda, K. and S. Akira (2000). "STAT family of transcription factors in cytokine-
mediated biological responses." Cytokine & growth factor reviews 11(3):
199-207.
Takeda, K., T. Kaisho, N. Yoshida, J. Takeda, T. Kishimoto and S. Akira (1998). "Stat3
activation is responsible for IL-6-dependent T cell proliferation through
preventing apoptosis: generation and characterization of T cell-specific
Stat3-deficient mice." J Immunol 161(9): 4652-4660.
Taleb, S., M. Romain, B. Ramkhelawon, C. Uyttenhove, G. Pasterkamp, O. Herbin, B.
Esposito, N. Perez, H. Yasukawa, J. Van Snick, A. Yoshimura, A. Tedgui and Z.
Mallat (2009). "Loss of SOCS3 expression in T cells reveals a regulatory role
for interleukin-17 in atherosclerosis." The Journal of experimental medicine
206(10): 2067-2077.

233
Tamiya, T., I. Kashiwagi, R. Takahashi, H. Yasukawa and A. Yoshimura (2011).
"Suppressors of cytokine signaling (SOCS) proteins and JAK/STAT pathways:
regulation of T-cell inflammation by SOCS1 and SOCS3." Arteriosclerosis,
thrombosis, and vascular biology 31(5): 980-985.
Tan, J. T., E. Dudl, E. LeRoy, R. Murray, J. Sprent, K. I. Weinberg and C. D. Surh
(2001). "IL-7 is critical for homeostatic proliferation and survival of naive T
cells." Proceedings of the National Academy of Sciences of the United States
of America 98(15): 8732-8737.
Tanaka, K., K. Ichiyama, M. Hashimoto, H. Yoshida, T. Takimoto, G. Takaesu, T.
Torisu, T. Hanada, H. Yasukawa, S. Fukuyama, H. Inoue, Y. Nakanishi, T.
Kobayashi and A. Yoshimura (2008). "Loss of suppressor of cytokine
signaling 1 in helper T cells leads to defective Th17 differentiation by
enhancing antagonistic effects of IFN-gamma on STAT3 and Smads." J
Immunol 180(6): 3746-3756.
Tanchot, C., F. A. Lemonnier, B. Perarnau, A. A. Freitas and B. Rocha (1997).
"Differential requirements for survival and proliferation of CD8 naive or
memory T cells." Science 276(5321): 2057-2062.
Taylor, A. M., J. A. Metcalfe, J. Thick and Y. F. Mak (1996). "Leukemia and lymphoma
in ataxia telangiectasia." Blood 87(2): 423-438.
Thiel, G. and G. Cibelli (2002). "Regulation of life and death by the zinc finger
transcription factor Egr-1." Journal of cellular physiology 193(3): 287-292.
Thompson, E. C., B. S. Cobb, P. Sabbattini, S. Meixlsperger, V. Parelho, D. Liberg, B.
Taylor, N. Dillon, K. Georgopoulos, H. Jumaa, S. T. Smale, A. G. Fisher and M.
Merkenschlager (2007). "Ikaros DNA-binding proteins as integral

234
components of B cell developmental-stage-specific regulatory circuits."
Immunity 26(3): 335-344.
Tiegs, S. L., D. M. Russell and D. Nemazee (1993). "Receptor editing in self-reactive
bone marrow B cells." The Journal of experimental medicine 177(4): 1009-
1020.
Topilko, P., S. Schneider-Maunoury, G. Levi, A. Baron-Van Evercooren, A. B.
Chennoufi, T. Seitanidou, C. Babinet and P. Charnay (1994). "Krox-20
controls myelination in the peripheral nervous system." Nature 371(6500):
796-799.
Tourtellotte, W. G. and J. Milbrandt (1998). "Sensory ataxia and muscle spindle
agenesis in mice lacking the transcription factor Egr3." Nat Genet 20(1): 87-
91.
Tourtellotte, W. G. and J. Milbrandt (1998). "Sensory ataxia and muscle spindle
agenesis in mice lacking the transcription factor Egr3." Nature genetics
20(1): 87-91.
Tsai, W. B., Y. M. Chung, Y. Takahashi, Z. Xu and M. C. Hu (2008). "Functional
interaction between FOXO3a and ATM regulates DNA damage response."
Nature cell biology 10(4): 460-467.
Tsujimoto, Y., L. R. Finger, J. Yunis, P. C. Nowell and C. M. Croce (1984). "Cloning of
the chromosome breakpoint of neoplastic B cells with the t(14;18)
chromosome translocation." Science 226(4678): 1097-1099.
Unoki, M. and Y. Nakamura (2003). "EGR2 induces apoptosis in various cancer cell
lines by direct transactivation of BNIP3L and BAK." Oncogene 22(14): 2172-
2185.

235
Van Der Zwaag, B., H. T. Verzijl, D. Beltran-Valero De Bernabe, V. L. Schuster, H. Van
Bokhoven, H. Kremer, M. Van Reen, G. H. Wichers, H. G. Brunner and G. W.
Padberg (2002). "Mutation analysis in the candidate Mobius syndrome
genes PGT and GATA2 on chromosome 3 and EGR2 on chromosome 10."
Journal of medical genetics 39(6): E30.
van Gent, D. C., D. A. Ramsden and M. Gellert (1996). "The RAG1 and RAG2 proteins
establish the 12/23 rule in V(D)J recombination." Cell 85(1): 107-113.
Veiga-Fernandes, H., U. Walter, C. Bourgeois, A. McLean and B. Rocha (2000).
"Response of naive and memory CD8+ T cells to antigen stimulation in vivo."
Nat Immunol 1(1): 47-53.
Vermeulen, K., D. R. Van Bockstaele and Z. N. Berneman (2003). "The cell cycle: a
review of regulation, deregulation and therapeutic targets in cancer." Cell
proliferation 36(3): 131-149.
Voiculescu, O., P. Charnay and S. Schneider-Maunoury (2000). "Expression pattern
of a Krox-20/Cre knock-in allele in the developing hindbrain, bones, and
peripheral nervous system." Genesis 26(2): 123-126.
von Boehmer, H. and H. J. Fehling (1997). "Structure and function of the pre-T cell
receptor." Annu Rev Immunol 15: 433-452.
Vose, J. M. (2008). "Update on T-cell lymphoma." Annals of oncology : official
journal of the European Society for Medical Oncology / ESMO 19 Suppl 4:
iv74-76.
Walker, L. S. and A. K. Abbas (2002). "The enemy within: keeping self-reactive T
cells at bay in the periphery." Nat Rev Immunol 2(1): 11-19.

236
Wan, Y. Y. and R. A. Flavell (2009). "How diverse--CD4 effector T cells and their
functions." Journal of molecular cell biology 1(1): 20-36.
Wang, J. H., N. Avitahl, A. Cariappa, C. Friedrich, T. Ikeda, A. Renold, K.
Andrikopoulos, L. Liang, S. Pillai, B. A. Morgan and K. Georgopoulos (1998).
"Aiolos regulates B cell activation and maturation to effector state."
Immunity 9(4): 543-553.
Warner, L. E., J. Svaren, J. Milbrandt and J. R. Lupski (1999). "Functional
consequences of mutations in the early growth response 2 gene (EGR2)
correlate with severity of human myelinopathies." Human molecular
genetics 8(7): 1245-1251.
Weening, J. J., V. D. D'Agati, M. M. Schwartz, S. V. Seshan, C. E. Alpers, G. B. Appel,
J. E. Balow, J. A. Bruijn, T. Cook, F. Ferrario, A. B. Fogo, E. M. Ginzler, L.
Hebert, G. Hill, P. Hill, J. C. Jennette, N. C. Kong, P. Lesavre, M. Lockshin, L.
M. Looi, H. Makino, L. A. Moura and M. Nagata (2004). "The classification of
glomerulonephritis in systemic lupus erythematosus revisited." Kidney
international 65(2): 521-530.
Weng, A. P., A. A. Ferrando, W. Lee, J. P. t. Morris, L. B. Silverman, C. Sanchez-
Irizarry, S. C. Blacklow, A. T. Look and J. C. Aster (2004). "Activating
mutations of NOTCH1 in human T cell acute lymphoblastic leukemia."
Science 306(5694): 269-271.
Weng, N. P. (2002). "Regulation of telomerase expression in human lymphocytes."
Springer seminars in immunopathology 24(1): 23-33.
Weng, N. P., L. Granger and R. J. Hodes (1997). "Telomere lengthening and
telomerase activation during human B cell differentiation." Proceedings of

237
the National Academy of Sciences of the United States of America 94(20):
10827-10832.
Weng, N. P., B. L. Levine, C. H. June and R. J. Hodes (1996). "Regulated expression of
telomerase activity in human T lymphocyte development and activation."
The Journal of experimental medicine 183(6): 2471-2479.
Weng, N. P., L. D. Palmer, B. L. Levine, H. C. Lane, C. H. June and R. J. Hodes (1997).
"Tales of tails: regulation of telomere length and telomerase activity during
lymphocyte development, differentiation, activation, and aging." Immunol
Rev 160: 43-54.
Winandy, S., P. Wu and K. Georgopoulos (1995). "A dominant mutation in the Ikaros
gene leads to rapid development of leukemia and lymphoma." Cell 83(2):
289-299.
Wong, H. P. and P. Slijepcevic (2004). "Telomere length measurement in mouse
chromosomes by a modified Q-FISH method." Cytogenetic and genome
research 105(2-4): 464-470.
Wright, W. E., M. A. Piatyszek, W. E. Rainey, W. Byrd and J. W. Shay (1996).
"Telomerase activity in human germline and embryonic tissues and cells."
Developmental genetics 18(2): 173-179.
Wu, Z. L., Y. Q. Song, Y. F. Shi and J. Zhu (2011). "High nuclear expression of STAT3 is
associated with unfavorable prognosis in diffuse large B-cell lymphoma."
Journal of hematology & oncology 4(1): 31.
Wyllie, A. H., J. F. Kerr and A. R. Currie (1980). "Cell death: the significance of
apoptosis." International review of cytology 68: 251-306.

238
Xi, H. and G. J. Kersh (2004). "Early growth response gene 3 regulates thymocyte
proliferation during the transition from CD4-CD8- to CD4+CD8+." J Immunol
172(2): 964-971.
Yagi, T., S. Hibi, M. Takanashi, G. Kano, Y. Tabata, T. Imamura, T. Inaba, A.
Morimoto, S. Todo and S. Imashuku (2002). "High frequency of Ikaros
isoform 6 expression in acute myelomonocytic and monocytic leukemias:
implications for up-regulation of the antiapoptotic protein Bcl-XL in
leukemogenesis." Blood 99(4): 1350-1355.
Yan, M., X. Kuang, W. Qiang, J. Shen, K. Claypool, W. S. Lynn and P. K. Wong (2002).
"Prevention of thymic lymphoma development in Atm-/- mice by
dexamethasone." Cancer research 62(18): 5153-5157.
Yang, X. O., A. D. Panopoulos, R. Nurieva, S. H. Chang, D. Wang, S. S. Watowich and
C. Dong (2007). "STAT3 regulates cytokine-mediated generation of
inflammatory helper T cells." The Journal of biological chemistry 282(13):
9358-9363.
Yokota, I., Y. Sasaki, L. Kashima, M. Idogawa and T. Tokino (2010). "Identification
and characterization of early growth response 2, a zinc-finger transcription
factor, as a p53-regulated proapoptotic gene." International journal of
oncology 37(6): 1407-1416.
Yoshimura, A., M. Suzuki, R. Sakaguchi, T. Hanada and H. Yasukawa (2012). "SOCS,
Inflammation, and Autoimmunity." Frontiers in immunology 3: 20.
Yu, H., D. Pardoll and R. Jove (2009). "STATs in cancer inflammation and immunity:
a leading role for STAT3." Nature reviews. Cancer 9(11): 798-809.

239
Yusuf, I., X. Zhu, M. G. Kharas, J. Chen and D. A. Fruman (2004). "Optimal B-cell
proliferation requires phosphoinositide 3-kinase-dependent inactivation of
FOXO transcription factors." Blood 104(3): 784-787.
Zha, S., C. H. Bassing, T. Sanda, J. W. Brush, H. Patel, P. H. Goff, M. M. Murphy, S.
Tepsuporn, R. A. Gatti, A. T. Look and F. W. Alt (2010). "ATM-deficient
thymic lymphoma is associated with aberrant tcrd rearrangement and gene
amplification." The Journal of experimental medicine 207(7): 1369-1380.
Zhang, B., Z. Wang, T. Li, E. N. Tsitsikov and H. F. Ding (2007). "NF-kappaB2
mutation targets TRAF1 to induce lymphomagenesis." Blood 110(2): 743-
751.
Zhu, B., A. L. Symonds, J. E. Martin, D. Kioussis, D. C. Wraith, S. Li and P. Wang
(2008). "Early growth response gene 2 (Egr-2) controls the self-tolerance of
T cells and prevents the development of lupuslike autoimmune disease."
The Journal of experimental medicine 205(10): 2295-2307.
Zhu, B., A. L. Symonds, J. E. Martin, D. Kioussis, D. C. Wraith, S. Li and P. Wang
(2008). "Early growth response gene 2 (Egr-2) controls the self-tolerance of
T cells and prevents the development of lupuslike autoimmune disease." J
Exp Med 205(10): 2295-2307.
Zhu, J. and W. E. Paul (2008). "CD4 T cells: fates, functions, and faults." Blood
112(5): 1557-1569.
National Institute of Health, Appendix A: Early Development. In Stem Cell
Information, accessed on 11th July 2013,] Available at
<http://stemcells.nih.gov/info/scireport/pages/appendixa.aspx>

240
Conference Presentation
The work from this thesis was represented at the following conferences:
Bhullar P.K, Miao T, Symonds A.L, Ghaffari E, Li S and Wang P (2013) Early growth
response gene 2 and 3 are essential for the regulation of tumour suppressor genes,
Ikaros, Aiolos and FOXO3 – oral presentation at “15th International Congress of
Immunology – ICI”, Milan, Italy.
Bhullar P.K, Miao T, Symonds A.L, Ghaffari E, Li S and Wang P (2013) Early growth
response gene 2 and 3 are essential for the regulation of tumour suppressor genes,
Ikaros, Aiolos and FOXO3 – poster presentation at “NCRI Cancer Conference”,
Liverpool, UK.

241
Publications
During my PhD, I have also been involved in the following publications:
Li S, Miao T, Sebastian M, Bhullar P, Ghaffari E, Liu M, Symonds A.L.J and
Wang P (2012) The Transcription Factors Egr2 and Egr3 Are Essential for the Control
of Inflammation and Antigen-Induced Proliferation of B and T cells. Immunity, 37(4-
2): 685-696.
Miao T, Raymond M, Bhullar P, Ghaffari E, Symonds A.L.J, Meier U.C,
Giovannoni G, Li S and Wang P (2013) Early Growth Response Gene-2 Controls IL-17
Expression and Th17 Differentiation by Negatively Regulating Batf. The Journal of
Immunology, 190(1): 58-65.

242
Appendix
Genotype Age
(Months) Gender CD3 B220 Metastasis
Egr2-/- 12+ Female + - NO
Egr2-/- 12+ Female + - NO
Egr2-/- 12+ Female - + NO
Egr2-/- 8 Female + - YES
Egr2-/- 8 Female + - YES
Egr2-/- 10 Male + YES
Egr2-/- 8 Female + - YES
Egr2-/- 12 Female - + YES
Egr2-/-Egr3-/+ 7 Female - + YES
Egr2-/- 12+ Female - + YES
Egr2-/-Egr3-/- 5 Male - + YES
Egr2-/-Egr3-/+ 6 Female - + YES
Egr2-/-Egr3-/+ 6 Male - + YES
Egr2-/-Egr3-/- 4 Female - + YES
Egr2-/- 12 Female - + YES
Egr2-/-Egr3-/- 5 Female + - YES
Egr2-/-Egr3-/+ 5 Female + - YES
Table A.1 Summary of tumour development in Egr2-/-Egr3-/- mice models
Note: around 80% of the tumours were characterised as small cell lymphoma.*