Embed Size (px)
Citation preview
1
EG0800314 Applicability of Activated Carbon to Treatment of Waste Containing
Iodine-Labeled Compounds. H. M. H. Gad*, N. R. A. El-Mouhty and H. F. Aly.
Hot Laboratories and Waste Management Centre, AEA, P. O. 13759, Cairo, Egypt. ABSTRACT
The applicability of activated carbon prepared from sawdust (SD) by one-step chemical activation process using H3PO4 (H) to treatment of aqueous waste contaminated with iodine-labeled prolactin (I-PRL) has been investigated. Treatment processes were performed under the varying conditions; contact time, temperature, carbon type, carbon dosage, and different particle size of activated carbon (SDH). Effect of aqueous waste volume has been investigated to calculate the batch factor (V/M) and the distribution coefficient (Kd). The used activated carbon (SDH) was characterized by N2 adsorption, FTIR, density, pH, point of zero charge pHpzc, moisture and ash content. Methylene blue (MB) and iodine number was calculated by adsorption from solution. In order to investigate the mechanism of sorption and potential rate controlling steps, pseudo first- and second-order equations, intraparticle diffusion equation and the Elovich equation have been used to test experimental data. Kinetic analysis of the four models has been carried out for system variables in order to assess which model provides the best fit predicted data with experimental results. 7 M NaOH can be used for regeneration of spent SDH activated carbon with the efficiency of 99.6% and the regenerated carbon can be reused for five cycles effectively.
The prospect of applying the SDH activated carbon prepared from agricultural by-product, sawdust, to treatment of aqueous waste contaminated with I-PRL appears promising and is considered highly applicable because of its high adsorption capacity, available at low cost, easily regenerated and reused. Keywords: Sawdust, activated carbon, iodine-labeled prolactin, agricultural by-products,
regeneration INTRODUCTION
Environmental pollution and its abatement have drawn keen attention for a long time.
The problem of removing pollutants from water and wastewater has grown with rapid industrialization. Heavy metals, dyes, oil and other salts, which are toxic to many living life and organisms, are present in the wastewater streams of many industrial processes, such as dyeing, printing, mining and metallurgical engineering, electroplating, nuclear power operations and/or isotopes production for radiotherapy, semiconductor, aerospace, battery manufacturing processes, etc.(1). All of them have faced increasing pressure regarding environmental and waste-related concerns as a result of the quantity and toxicity of generated wastewaters. The waste generated in large volumes is high in pollutant load and must be cleaned before it is released. Many methods have been used to remove the pollutants, namely, membrane filtration (2), coagulation (3), adsorption (4), oxidation (5), ion exchange (6), precipitation (7), etc. have been reported in the literature, but few of them were accepted due to cost, low efficiency, and inapplicability to a wide variety of pollutants. The most widely used method for removing pollutants is coagulation and precipitation (7). A major problem with this type of treatment is the disposal of the precipitated waste. Another weak point is that in most time the precipitation itself cannot reduce the contaminant far enough to meet current water-quality standards. Ion exchange treatment is the second most widely used method for metal removal. This method does not present a sludge disposal problem and has the advantage of reclamation of metals. It can reduce the metal ion concentration to a very low level. However, ion exchange does not appear to be practicable to wastewater treatment from a cost stand point. Adsorption with activated carbon can also be highly efficient for the removal of numerous trace
2
elements from water, but the high cost of activated carbon inhibits its large-scale use as adsorbent. Then, the need for effective and economical removal of unwanted materials resulted in a research for unconventional methods and materials that might be useful in this field. Scientists have, therefore, centered their interest on adsorbents research in recent years. The utilization of agricultural waste materials is increasingly becoming of vital concern because these unused resources are little or no economic value, and some, such as sawdust, which are available in large quantities in lumber mills, are often present a disposal problem. The use of sawdust for removing pollutants would benefit both the environment and wood agriculture: contaminated streams would be cleaned, and a new market would be opened for the sawdust.
In this study, the proposed research program is aimed at the investigation of the removal of organic compounds containing iodine using activated carbon prepared from a biomass material, sawdust (SD), by phosphoric acid (H3PO4) activation processes (SDH activated carbon). As the sorption characteristics of adsorbents are controlled by a number of physico-chemical interfacial properties, it is of prime importance to evaluate their effects on removal behavior of SDH towards wastewater containing organic compounds in the processes of production of labeled isotopes used as tracer in the radioimmunoassay.
Radioimmunoassay (RIA) is a very sensitive technique to detect as low as quantity of hormone [prolactin (PRL), thyroglobulin (TG)…ect] in circulation or in any substance in biological fluids (8). Many essential reagents are required for RIA technique (9), the most important one is the tracer. The tracers are the radio labeled ligands used in the RIA (10). The tracer is the substance labeled with radioisotope I125, although other isotopes such as H3 have been used, practically for smaller molecules such as steroids and prostaglandin’s (11). Of all the isotopic labels used (I131, P32, I125, S35, H3, C14 ), The isotope I125 remains the ideal reagent of choice because of sufficient long half-life (60.2 days), ease of iodination into tyrosyl residues of the biomlecules (11) and it is the essential component of the waste of RIA technique. Since the advent of radioactive waste, various approaches and technologies have been developed and adopted for the disposal and immobilization of radioactive aqueous wastes generated. The treatment process based on adsorption/ion exchange phenomenon plays an important role in pre-concentration/separation of toxic radionuclide from aqueous wastes (12, 13). The sorption behavior of new adsorbents makes them promising candidates for application in radioactive aqueous waste treatment. They are expected to play an important role in regulating the migration of radionuclide because of their wide spread natural existence, high sorption capacities and selectivity's for certain ions, high thermal radiation and chemical stability and their compatibility with various immobilization matrices.
EXPERIMENTAL Preparation of activated carbon
Different agricultural by-product, e.g. rice husk (RH), sawdust (SD), apricot stone (AS), apricot stone core (ASC), apricot stone shell (ASS), bagasse pith (BP), olive stone (OS), and peach stone (PS) were chosen as precursors for the production of activated carbons by one-step chemical activation using H3PO4 (or KOH) to study the effect of the precursor nature on the adsorptive capacity of activated carbons. In each experiment, 30 g of crushed precursor was soaked in 50 ml of pre-diluted phosphoric acid of 70 wt. % concentration starting with an 85 wt. % H3PO4 (BDH) (or 70 % KOH, BDH) solution to cover it completely, slightly agitated to ensure penetration of the solution throughout, then the mixture heated to 80 °C for 1 h and left overnight at room temperature to help appropriate wetting and impregnation of the precursor. The impregnated mass was dried in an air oven at 80°C overnight, then, admitted into the reactor (ig-nition tube), which was then placed in a tubular electric furnace open from both ends. The temperature was raised at the rate of (50°C/10 min.) to the required end temperature. The carbonization process was carried out at 500 0C for 80 min. The product was thoroughly washed
3
with hot distilled water till pH = 6.5, and finally dried at 110° C. The prepared carbons and commercial activated carbon (Prolabo) were investigated in the preliminary test for removal of iodine labeled prolactin (I-PRL) and iodine labeled thyroglobulin (I-TG). The results are listed in Table 1.
Table (1): Effect of activated carbon precursor on the removal of iodine-labeled compounds.
% Removal No. Types of precursors I-PRL I-TG
1 *Rice husk (RHH) 92 82 2 Rice husk (RHK) 37 38 3 Sawdust (SDH) 96 81 4 Sawdust (SDK) 24 22 5 Bagasse pith (BPH) 93 60.8 6 Bagasse pith (BPK) 69.9 39.6 7 Apricot Stone (ASH) 94 33 8 Apricot Stone (ASK) 44.8 15 9 Olive stone (OSK) 28 19.5 10 Peach stone (PSK) 31 21 11 (AC+AS+RH; 1:1:1)H 92 44.3 12 (AC+AS+RH; 1:1:1)K 91 29.6 13 Commercial activated carbon 0.5 2
*Precursor followed by H, i.e. treated with H3PO4; and K, means that it treated with KOH.
Characterization of activated carbon Packed and apparent densities were determined by a tamping procedure using a 10 ml
graduated glass cylinder. Particle size was determined using sieves of different particle size. The texture characteristics were determined by the standard N2 adsorption isotherms, followed by their analysis to evaluate the porous parameters. The total pore volumes estimated from the volume of nitrogen adsorbed at p/p° = 0.95 (Vf) and an average pore radius from r = 2Vp/SBET. For iodine number (mg iodine/g carbon) 0.1 g of the sample was equilibrated for 1 h with a 0.1N standardized iodine solution. The remaining iodine was titrated with a 0.1N standardized sodium thiosulfate solution. The ash content of all samples was obtained after burning a given amount of carbon at 973K for 3 h and was calculated on a dry basis (14). The pH of carbons was measured after suspending 1 g of the material in 20 ml CO2-free distilled water for 48 h (14). The point of zero charge, pHpzc, of the SDH activated carbons was determined.
Methylene blue number was estimated by the extent of adsorption of milligrams of methylene blue adsorbed by 1 g of carbon in equilibrium with a solution of methylene blue having a concentration of 1.0 mg l-1. Fourier transformed infrared spectroscopy (before and after adsorption of I-PRL) was used for the analyses of surface functional groups. The SDH activated carbon was analyzed for moisture content. Preparation of labeled hormone
Iodogen is a mild oxidizing agent and it can be used for oxidation radioiodonation of proteins, polypeptides, hormones and others. It is essentially insoluble in water. So that, it can be used as a thin film plated onto a bottom of glass vials. Labeling procedure: 125I labeling of PRL (or TG)
Ten micrograms of PRL (or TG) were incubated with 500 µCi 125I-Na and 10 µl 0.5 PO42-
(pH=7.4) for 30 second at room temperature with gentle shaking and 100 µl PO42- (pH=7.4) 0.05
4
M was then added to stop the reaction. Human prolactin (or thyroglobulin) was iodinated by the method of Hunter and Greenwood (8) and the iodinated hormone was separated from free iodine by gel filtration on a Sephadex column. The 125I-PRL (or 125I-TG) was eluted with 0.05M PO4
3- (pH 7.4) and immediately placed on a Sephadex G-25 column to remove any damaged 125I-PRL. Kinetic models applied to the sorption of I-PRL onto sawdust activated carbon
In order to examine the controlling mechanism of sorption process such as chemical reaction, diffusion control and mass transfer, several kinetic models are used to test experimental data. From a system design viewpoint, a lumped analysis of sorption rates is thus sufficient for practical operation (15). 1. Pseudo first-order equation The pseudo first-order equation is generally expressed as follows (16):
dqt/dt = k1(q1 − qt) (1)
After integration and applying the boundary conditions, for qt = 0 at t = 0 and qt = qt at t = t, the integrated form of Eq. (1) becomes:
log(q1 − qt) = log q1 − (k1/2.303) t (2) where q1 and qt are the amounts of I-PRL sorbed at equilibrium and at time t (mg.g-1), respectively, and k1 is the rate constant of pseudo first-order sorption (1.min-1). 2. Pseudo second-order equation If the rate of sorption is a second-order mechanism, the pseudo second-order chemisorption kinetic rate equation is expressed as (16):
dqt/dt = k2(q2 − qt)2 (3) Integrating this equation for the boundary conditions, gives:
1/q2 − qt = 1/q2 + k2t (4) Which is the integrated law for a second-order reaction where q2 is the amount of I-PRL sorbed at equilibrium (mg.g-1), k2 is the equilibrium rate constant of pseudo second-order sorption (g.mg-1. min-1). Eq. (4) can be rearranged to obtain a linear form:
t/qt =1/k2q22 + 1/q2t (5)
and h = k2q22 (6)
Where h is the initial sorption rate (mg.g-1 min-1).
2.3. Intraparticle diffusion equation
The fractional approach to equilibrium changes according to a function of (Dt/r2)1/2, where r is the particle radius and D the diffusivity of solute within the particle. The initial rate of the intraparticle diffusion is the following (17):
qt = f(t1/2) + I (7) The rate parameter (kint) for intraparticle diffusion can be defined as:
5
qt = kint t1/2 + I (8)
where kint is the intraparticle diffusion rate constant (mg.g-1 min1/2) and I is the boundary layer(mg.g-1). 2.4. The Elovich equation
The Elovich equation is given as follows (18):
dqt/dt = αe−βqt (9) The integration of the rate equation with the same boundary conditions as the pseudo first- and second-order equations becomes the Elovich equation.
qt =1/β ln(αβ) + 1/β ln t (10) Where α is the initial sorption rate (mg.g-1 min-1), and the parameter β is related to the extent of surface coverage and activation energy for chemisorptions (g/mg).
Distribution coefficients (Kd) The distribution coefficients (Kd) of I-PRL for SDH adsorbents was measured by batch
adsorption experiments. The pH of experiments was adjusted to 7. In the batch adsorption experiment, the adsorbent was added to known volume of the I-PRL solution, and was stirred at 298K for interval times. The sample solution was separated from the adsorbent by centrifugation. The remaining activity of I-PRL was determined by gamma counter. The distribution coefficient was calculated as follows:
Kd = (Ai − Ae)/Ae x V/W (11) Where Ai is the initial activity of I-PRL in the solution, Ae is the equilibrium activity of I-PRL in the solution, V is the volume of the solution, W is the weight of the adsorbent(SDH). The percentage sorption was calculated from either of the following equations;
% Sorption = [(Ai-A)/Ai] 100 (12) % Sorption = 100 [Kd /(Kd+V/M)] (13)
Regeneration activated carbon
After the attainment of equilibrium, the supernatants were carefully decanted and desorption experiments for the loaded matrixes of SDH were carried out in aqueous medium of H2O, HNO3 and NaOH to regenerate of activated carbon and reuse of it for several times.
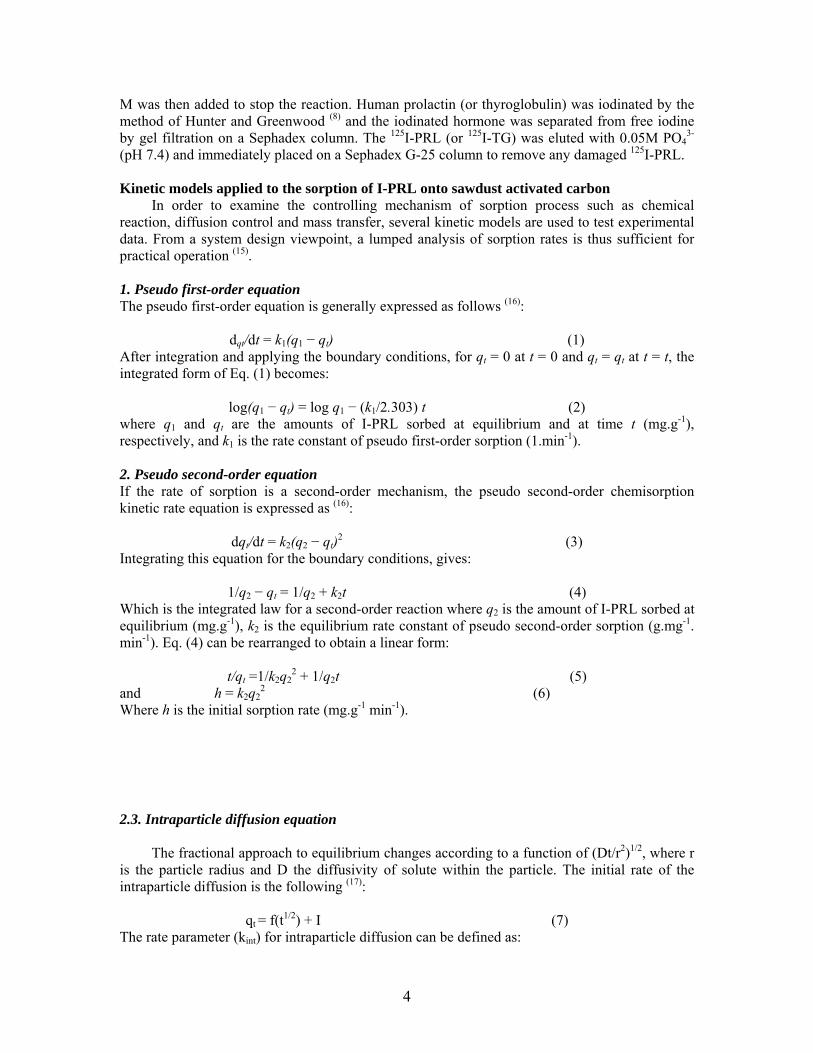
Results and discussion Effect of particle size by-product
The experimental data for the adsorption of I-PRL onto SDH at different particle size of carbons (> 1.0, > 0.50, > 0.25, < 0.25 mm) at a fixed adsorbent dose are shown in Fig. 1(A). The results show that the I-PRL adsorbed is higher for smaller adsorbent particle size. As the particle size increases from 0.25 to 1.0 mm, the uptake decreases from 70 to 63 (µg.g-1)-3. This is because adsorption being a surface phenomenon, the smaller adsorbent particle sizes offered
6
comparatively large surface area and, hence, higher adsorption occurs at equilibrium. According toWeber Jr. (19), breaking of larger particles tends to open tiny cracks and channels on the particle surface, providing added surface area which can be employed in the adsorption process. The study also reveals that the size of the adsorbent particle is playing an important role in the adsorption process (20).
0 5 1040
45
50
55
60
65
70
(A)
> 1.0 mm < 1.0 >0.5 mm < 0.5 >0.25mm < 0.25 mm
Upt
ake(
µg.g
-1)x
10-3
Time(h)50 100 150 200 250 300
10
20
30
40
50
60
(B)
o.1 gm 0.3 gm 0.5 gm 0.7 gm 1.0 gm
q e (µ
g.g-1
x10
-3)
Time(min)
50 100 150 200 250 300
10
20
30
40
50
60
70
( C )
5 ml10 ml15 ml20 ml25 ml30 ml
q t(µ
g.g-1
)x10
-3
Time(min)50 100 150 200 250 300
10
20
30
40
50
60
70
( D )
15 0C 20 0C 40 0C 60 0C
q t(µ
g.g-1
)-3
Time(min) Figure (1): Effect of different factors on the adsorption of I-PRL onto SDH activated carbon; (A) Particle size, (B) Adsorbent dose, (C) Waste volume, and (D) Temperature.
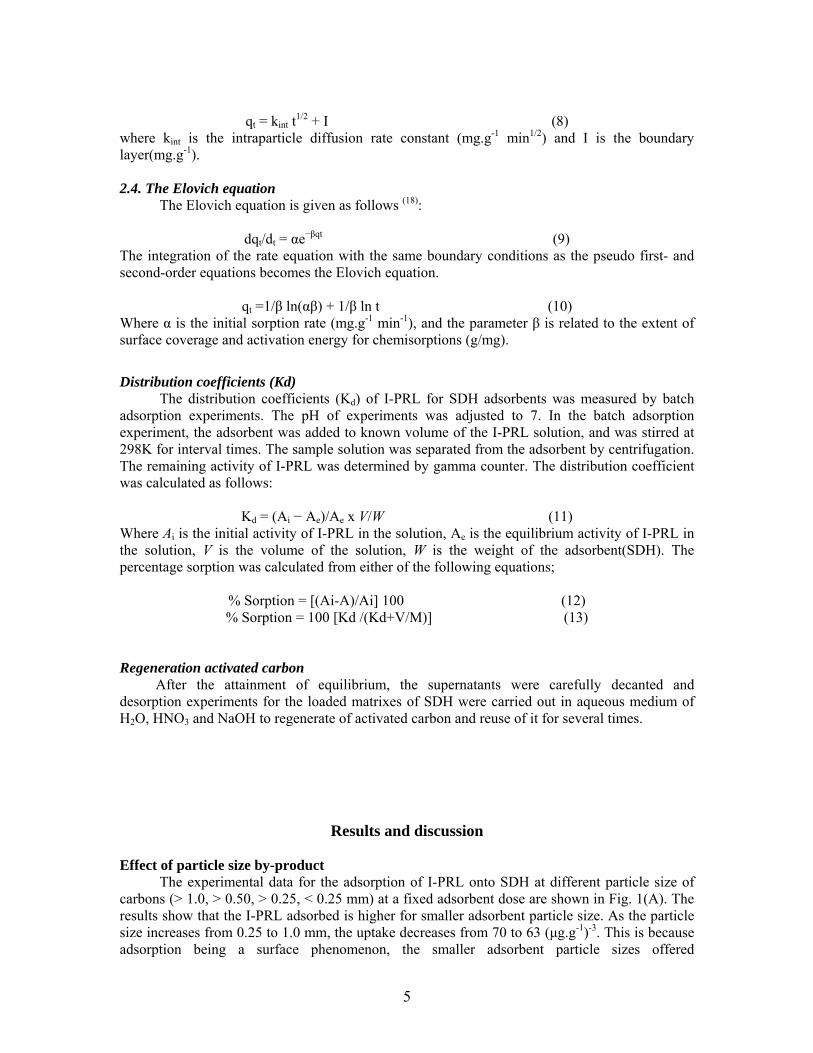
Numerous kinetic models have been proposed to elucidate the mechanism by which
pollutants may be adsorbed. The mechanism of adsorption depends on the physical and/or chemical characteristics, the surface area of the adsorbent as well as on the mass transport process. In order to investigate the mechanism of I-PRL adsorption, four kinetic models are selected in this study (22). The applicability of the above four models can be examined by each linear plot of log (q1 −qt) versus t, (t/q) versus t, qt versus ln t and q versus t0.5, respectively and are presented in Fig 2. In order to quantify the applicability of each model for different particle size of activated carbon, the correlation coefficient (r2) was calculated from these plots and listed in Table 2. The linearity of these plots indicates the applicability of the four models. However, the analyses of the correlation coefficients (r2) showed that the experimental data (r2 > 0.98) fit the pseudo-second-order model (an indication of a chemisorptions mechanism) better the experimental data than the pseudo-first-order model (r2 ranging between 0.839 and 0.978). The
7
rate of adsorption (k), and initial sorption rate (h) were decreased with an increase in the SDH activated carbon particle size as shown from Table 2.
0 80 160 240 320 400
0.0
0.4
0.8
1.2
1.6
( A )
log(q1 - qt) = log q1 - (k1/2.303) t
> 1.0 mm < 1.0 > 0.5 mm < 0.5 > 0.25 mm < 0.25 mm
Log
(ql-q
t)
Time(min.) 50 100 150 200 250 300 350
1.0
1.5
2.0
2.5
3.0
3.5
4.0
4.5
5.0
5.5
( B )
t/qt =1/k2q22 + 1/q2t
> 1.0 mm < 1.0 >0.5 mm < 0.5 >0.25mm < 0.25 mm
t/qt [
min
(µg.
gx10
-3)]
Time (min.)
4.0 4.2 4.4 4.6 4.8 5.0 5.2 5.4 5.6 5.8 6.0
32
36
40
44
48
52
56
60
64
68
( C )
qt =1/β ln (α β) + 1/β ln t
> 1.0 mm < 1.0 >0.5 mm < 0.5 >0.25mm < 0.25 mm
q t (µg
.g x
10-3
)
ln t6 8 10 12 14 16 18 20
40
44
48
52
56
60
64
68
72
( D )
qt = kint t1/2+ I
> 1.0 mm < 1.0 >0.5 mm < 0.5 >0.25mm < 0.25 mm
q t(µg.
g-1)
t0.5 (min0.5) Figure (2): Kinetic parameters of four kinetic model of sorption of I-PRL onto SDH activated carbon at different particle size; (A) First order reaction, (B) Second order reaction, (C) Elovich equation, and (D) Intraparticle diffusion.
The values of the maximum adsorption capacity determined using the linear transformation
of the Elovich equation (Table 2) are much lower than the experimental adsorbed amounts at equilibrium corresponding to the plateau of the adsorption process, in spite of the good correlation coefficients. This means that the assumption of the exponential covering of adsorption sites is not in agreement with the experiment in the studied concentration range (21).
The intraparticle diffusion was also involved in the adsorption of I-PRL by SDH activated carbons. The linear portion of the plot for a wide range of contact time between adsorbent and adsorbate does not pass through the origin. This deviation from the origin or near saturation may be perhaps due to the difference in the rate of mass transfer in the initial and final stages of adsorption (22). Further, such deviation from origin indicates that the pore diffusion is not the only rate controlling step. From Fig. 2 it may be seen that, there are two regions—the initial pore diffusion due to external mass transfer effects followed by the intraparticle diffusion. Generally, (as shown from Table 2) as the particle size decreases, the adsorption capacity and the rate of adsorption increases with best correlation coefficient at the particle size of < 0.25 mm with four kinetic models.
The values of intercept, I, in the intraparticle diffusion equation (Table 2) give an idea about the boundary layer thickness, i.e. the larger the intercept, the greater is the boundary layer effect. The boundary layer diffusion depends on several parameters, including the external surface area
8
of the adsorbent, which is mainly controlled by the particle size (as the particle size decreases, the boundary layer increases in our investigation), the shape and density of the particles, the concentration of the solution and the agitation velocity. The greater the particle size, the intraparticle diffusion resistance is the great in the control of the sorption kinetics of low-porous materials (23), and this is confirmed by lower rate of adsorption as seen in Table 2. Effect of SDH activated carbon dose
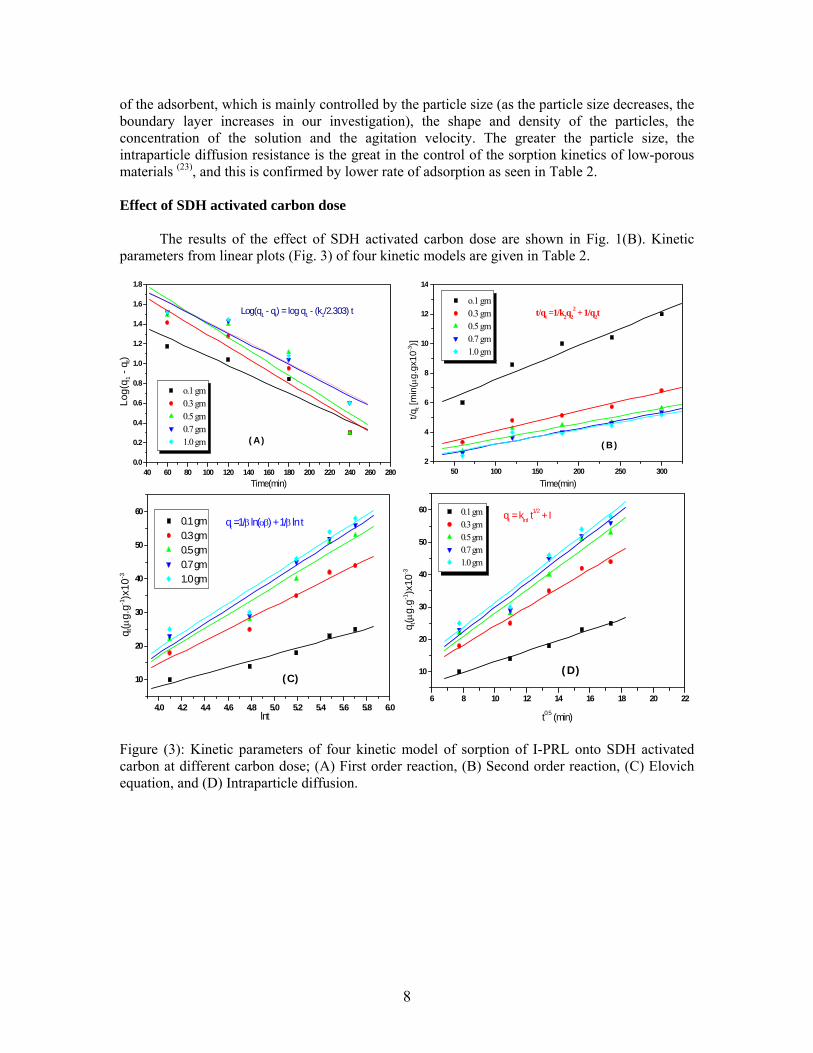
The results of the effect of SDH activated carbon dose are shown in Fig. 1(B). Kinetic parameters from linear plots (Fig. 3) of four kinetic models are given in Table 2.
40 60 80 100 120 140 160 180 200 220 240 260 2800.0
0.2
0.4
0.6
0.8
1.0
1.2
1.4
1.6
1.8
( A )
o.1 gm 0.3 gm 0.5 gm 0.7 gm 1.0 gm
Log(q1 - qt) = log q1 - (k1/2.303) t
Log(
q 1 - q
t)
Time(min) 50 100 150 200 250 300
2
4
6
8
10
12
14
( B )
t/qt =1/k2q22 + 1/q2t
o.1 gm 0.3 gm 0.5 gm 0.7 gm 1.0 gm
t/q t [
min
(µg.
gx10
-3)]
Time(min)
4.0 4.2 4.4 4.6 4.8 5.0 5.2 5.4 5.6 5.8 6.0
10
20
30
40
50
60
( C )
qt =1/β ln(αβ) + 1/β ln t 0.1 gm 0.3 gm 0.5 gm 0.7 gm 1.0 gm
q t(µ
g.g-1
)x10
-3
lnt 6 8 10 12 14 16 18 20 22
10
20
30
40
50
60
( D )
0.1 gm 0.3 gm 0.5 gm 0.7 gm 1.0 gm
qt = kint t1/2 + I
q t(µ
g.g-1
)x10
-3
t0.5 (min)
Figure (3): Kinetic parameters of four kinetic model of sorption of I-PRL onto SDH activated carbon at different carbon dose; (A) First order reaction, (B) Second order reaction, (C) Elovich equation, and (D) Intraparticle diffusion.
9
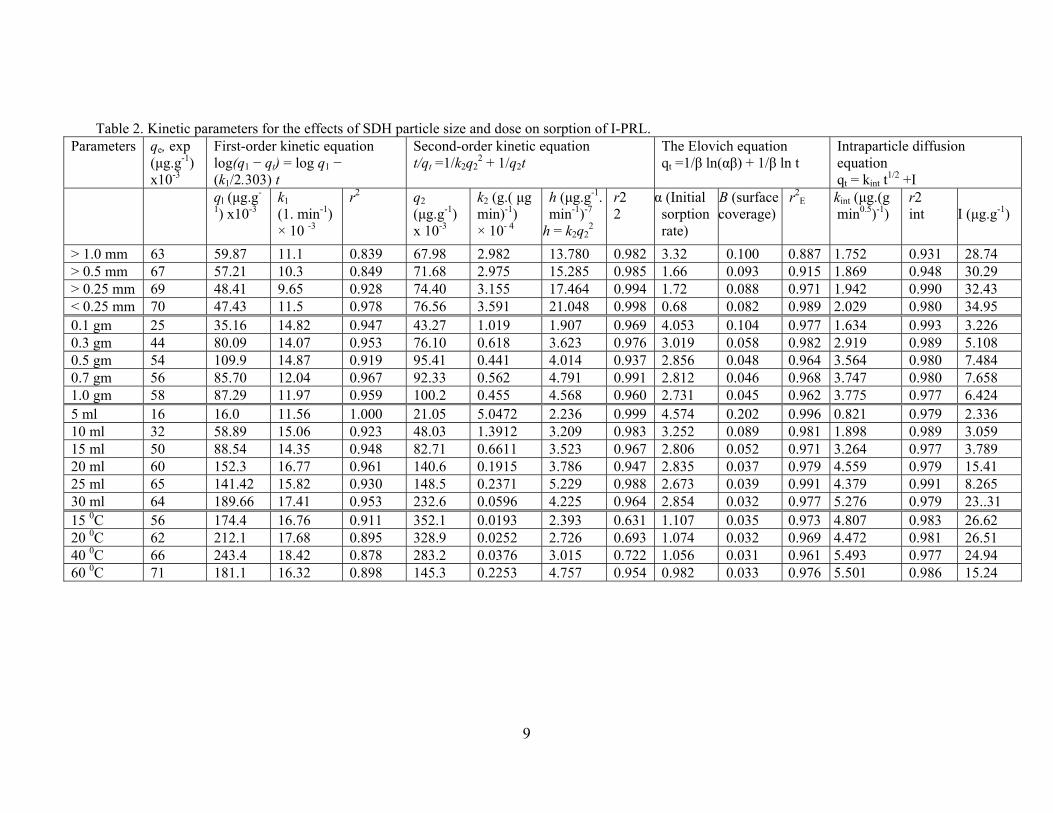
Table 2. Kinetic parameters for the effects of SDH particle size and dose on sorption of I-PRL. Parameters
qe, exp (µg.g-1) x10-3
First-order kinetic equation log(q1 − qt) = log q1 − (k1/2.303) t
Second-order kinetic equation t/qt =1/k2q2
2 + 1/q2t The Elovich equation qt =1/β ln(αβ) + 1/β ln t
Intraparticle diffusion equation qt = kint t1/2 +I
ql (µg.g-
1) x10-3 k1 (1. min-1) × 10 -3
r2
q2 (µg.g-1) x 10-3
k2 (g.( µg min)-1) × 10- 4
h (µg.g-1. min-1)-7
h = k2q22
r2 2
α (Initial sorption rate)
Β (surface coverage)
r2E
kint (µg.(g min0.5)-1)
r2 int
I (µg.g-1)
> 1.0 mm 63 59.87 11.1 0.839 67.98 2.982 13.780 0.982 3.32 0.100 0.887 1.752 0.931 28.74 > 0.5 mm 67 57.21 10.3 0.849 71.68 2.975 15.285 0.985 1.66 0.093 0.915 1.869 0.948 30.29 > 0.25 mm 69 48.41 9.65 0.928 74.40 3.155 17.464 0.994 1.72 0.088 0.971 1.942 0.990 32.43 < 0.25 mm 70 47.43 11.5 0.978 76.56 3.591 21.048 0.998 0.68 0.082 0.989 2.029 0.980 34.95 0.1 gm 25 35.16 14.82 0.947 43.27 1.019 1.907 0.969 4.053 0.104 0.977 1.634 0.993 3.226 0.3 gm 44 80.09 14.07 0.953 76.10 0.618 3.623 0.976 3.019 0.058 0.982 2.919 0.989 5.108 0.5 gm 54 109.9 14.87 0.919 95.41 0.441 4.014 0.937 2.856 0.048 0.964 3.564 0.980 7.484 0.7 gm 56 85.70 12.04 0.967 92.33 0.562 4.791 0.991 2.812 0.046 0.968 3.747 0.980 7.658 1.0 gm 58 87.29 11.97 0.959 100.2 0.455 4.568 0.960 2.731 0.045 0.962 3.775 0.977 6.424 5 ml 16 16.0 11.56 1.000 21.05 5.0472 2.236 0.999 4.574 0.202 0.996 0.821 0.979 2.336 10 ml 32 58.89 15.06 0.923 48.03 1.3912 3.209 0.983 3.252 0.089 0.981 1.898 0.989 3.059 15 ml 50 88.54 14.35 0.948 82.71 0.6611 3.523 0.967 2.806 0.052 0.971 3.264 0.977 3.789 20 ml 60 152.3 16.77 0.961 140.6 0.1915 3.786 0.947 2.835 0.037 0.979 4.559 0.979 15.41 25 ml 65 141.42 15.82 0.930 148.5 0.2371 5.229 0.988 2.673 0.039 0.991 4.379 0.991 8.265 30 ml 64 189.66 17.41 0.953 232.6 0.0596 4.225 0.964 2.854 0.032 0.977 5.276 0.979 23..31 15 0C 56 174.4 16.76 0.911 352.1 0.0193 2.393 0.631 1.107 0.035 0.973 4.807 0.983 26.62 20 0C 62 212.1 17.68 0.895 328.9 0.0252 2.726 0.693 1.074 0.032 0.969 4.472 0.981 26.51 40 0C 66 243.4 18.42 0.878 283.2 0.0376 3.015 0.722 1.056 0.031 0.961 5.493 0.977 24.94 60 0C 71 181.1 16.32 0.898 145.3 0.2253 4.757 0.954 0.982 0.033 0.976 5.501 0.986 15.24
10
The data for I-PRL again show a good compliance with the pseudo second-order equation and the regression coefficients, r2, for the linear plots were all higher than those of the first-order equation confirming again that the adsorption is chemisorptions mechanism. From the data listed in Table 2, it is clear that: (i) For first and second-order equation; the rate of adsorption increases as the adsorbent dose decreases with the best result for 0.1 gm of SDH activated carbon. But, the best correlation coefficient was obtained with 0.7 gm i.e. at a batch ratio (V/M) =7.1. (ii) The initial rate of adsorption of a second-order reaction increases with the increase of carbon dose and this is may be due to the larger surface area available at high carbon dose. (iii) From the Elovich equation, the initial sorption rate and surface coverage have a conversely relationship with carbon dose with the highest values with 0.1 gm carbon dose. (iv) The linear plots of qt versus t0.5 at different carbon dose show that the rate of adsorption (kint) has a direct relationship with the carbon dose confirming that the increase in carbon dose leading to higher surface area available for adsorption of I-PRL. On the other hand, the boundary layer increases with an increase of carbon dose and carbon dose of 0.1 gm has lowest boundary layer with the best correlation coefficient (0.993). Waste volume effect.
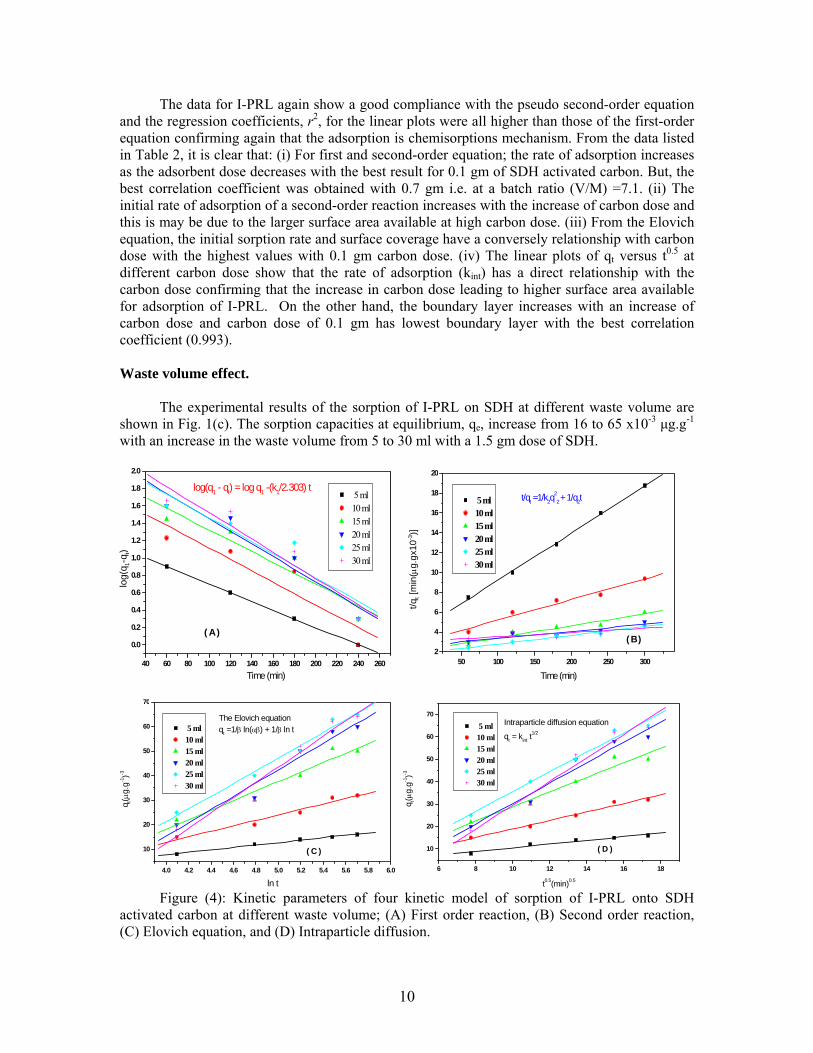
The experimental results of the sorption of I-PRL on SDH at different waste volume are shown in Fig. 1(c). The sorption capacities at equilibrium, qe, increase from 16 to 65 x10-3 µg.g-1 with an increase in the waste volume from 5 to 30 ml with a 1.5 gm dose of SDH.
40 60 80 100 120 140 160 180 200 220 240 260
0.0
0.2
0.4
0.6
0.8
1.0
1.2
1.4
1.6
1.8
2.0
( A )
log(q1 - qt) = log q1 -(k1/2.303) t 5 ml10 ml15 ml20 ml25 ml30 ml
log(
q 1-q
t)
Time (min) 50 100 150 200 250 300
2
4
6
8
10
12
14
16
18
20
( B )
t/qt =1/k2q22 + 1/q2t 5 ml
10 ml15 ml20 ml25 ml30 ml
t/q t
[min
(µg.
gx10
-3)]
Time (min)
4.0 4.2 4.4 4.6 4.8 5.0 5.2 5.4 5.6 5.8 6.0
10
20
30
40
50
60
70
( C )
The Elovich equationqt =1/β ln(αβ) + 1/β ln t 5 ml
10 ml15 ml20 ml25 ml30 ml
q t(µg.
g-1)-3
ln t 6 8 10 12 14 16 18
10
20
30
40
50
60
70
( D )
Intraparticle diffusion equation
qt = kint t1/2
5 ml10 ml15 ml20 ml25 ml30 ml
q t(µg.
g-1)-3
t0.5(min)0.5 Figure (4): Kinetic parameters of four kinetic model of sorption of I-PRL onto SDH
activated carbon at different waste volume; (A) First order reaction, (B) Second order reaction, (C) Elovich equation, and (D) Intraparticle diffusion.
11
Fig. 4 show the kinetic parameters of four kinetic model of sorption of I-PRL onto SDH activated carbon at different waste volume. The characteristic parameters of all the kinetic models and correlation coefficients are tabulated in Table 2. Again correlation coefficients of second-order equation are higher than those of first-order equation. This suggest that the sorption systems studied belongto the second-order kinetic model, based on the assumption that the rate limiting step may be chemical sorption or chemisorptions involving valency forces through sharing or exchange of electrons between sorbent and sorbate. The similar phenomena have also been observed in biosorption of dyes RB2, RY2, and Remazol Black B on biomass (24). For the pseudo second-order model:(a) The rate constant decreases with an increasing of waste volume, this is logic due to the increase of resistance for I-PRL molecule to reach the surface of adsorbent with the increase of waste volume, and this is confirmed by: (1) increasing the boundary layer in the intraparticle diffusion. (2) Decreasing the surface coverage, β, in the Elovich equation. (b) The initial sorption rate, h, increases with an increasing of waste volume (due to increase of concentration of I-PRL with higher waste volume), and this also confirmed by: (1) significant increase in the adsorption capacities (q2). (2) Increasing the rate of intraparticle diffusion, Kint, with increasing waste volume.
The agreement of the Elovich equation with experimental data may be explained as below. The previous successful applications of the Elovich equation to heterogeneous catalyst surfaces helps to explain its success in predicting the sorption of I-PRL on SDH activated carbon. The general explanation for this form of kinetic law involves a variation of the energetic of chemisorptions with the active sites are heterogeneous sawdust and therefore, exhibit different activation energies for chemisorptions (15). Because the cell walls of sawdust mainly consist of cellulose and lignin, and many hydroxyl groups, such as tannins or other phenolic compounds (15). Effect of temperature
Temperature has a direct influence on the amount of the adsorbed substance. In the present investigation, the adsorption experiments were performed in the temperature range of 15–60 ◦C. It was found that, Fig. 1 (D), the amount of I-PRL adsorbed on SDH activated carbons increase with the solution temperature. Fig. 5 shows the kinetic parameters of four kinetic model of sorption of I-PRL onto SDH activated carbon at different temperature, and the results are given in the Table 2. It is observed that the correlation coefficients of the intraparticle diffusion equation are higher than those of the other three kinetic models. The results also show that kint is an increasing function of the solution temperature. The increase of kint with temperature indicates that the affinity for I-PRL is favored by high temperature, and therefore, this adsorption process is endothermic in nature. The increase in capacity, qe, with respect to temperature indicates that: (a) some kind of chemical interaction may be take place during adsorption process. (b) Our sample has high porosity (microporous), kint values increases with increase of temperature that is why mobility of I-PRL molecules increases. However, I (boundary layer thickness) values decrease with increase kint values and temperature. The results of the present investigation on temperature effect also support the conclusion that I-PRL sorption is controlled by pore diffusion. Thermodynamic parameters of adsorption
Effect of temperature on the I-PRL adsorption is shown in Fig. 1(D). As the temperature increases, the adsorption capacities of I-PRL removal increases, indicating the adsorption to be endothermic. The change in standard free energy (∆G◦), enthalpy (∆H◦) and entropy (∆S◦) of adsorption were calculated from the following equation (25):
∆G◦ = −RT lnKc (14)
12
Where R is the gas constant (8.314 J/mol K), K c is the equilibrium constant and T is temperature in K. The Kc value is calculated from Eq. (15):
Kc = CAe/CSe (15)
40 60 80 100 120 140 160 180 200 220 240 2600.0
0.2
0.4
0.6
0.8
1.0
1.2
1.4
1.6
1.8
2.0
2.2
( A )
log(q1 - qt) = log q1 - (k1/2.303) t
15 0C 20 0C 40 0C 60 0C
log(
q l-q
t)
Time(min) 50 100 150 200 250 300
2.4
2.8
3.2
3.6
4.0
4.4
4.8
5.2
5.6
( B )
t/qt =1/k2q22 + 1/q2t
15 0C
20 0C
40 0C
60 0C
t/qt [
min
(µg.
gx10
-3)]
Time (min)
4.0 4.2 4.4 4.6 4.8 5.0 5.2 5.4 5.6 5.8 6.0
10
20
30
40
50
60
70
80
( C )
qt =1/β ln( αβ ) + 1/β ln t 15 0C
20 0C
40 0C
60 0C
q t(µ
g.g-1
)-3
lnt 6 8 10 12 14 16 18
10
20
30
40
50
60
70
( D )
qt = kint t1/2+ I 15 0C
20 0C
40 0C
60 0C
q t(µ
g.g-1
)-3
t0.5(min) Figure (5): Kinetic parameters of four kinetic model of sorption of I-PRL onto SDH activated carbon at different temperature; (A) First order reaction, (B) Second order reaction, (C) Elovich equation, and (D) Intraparticle diffusion.
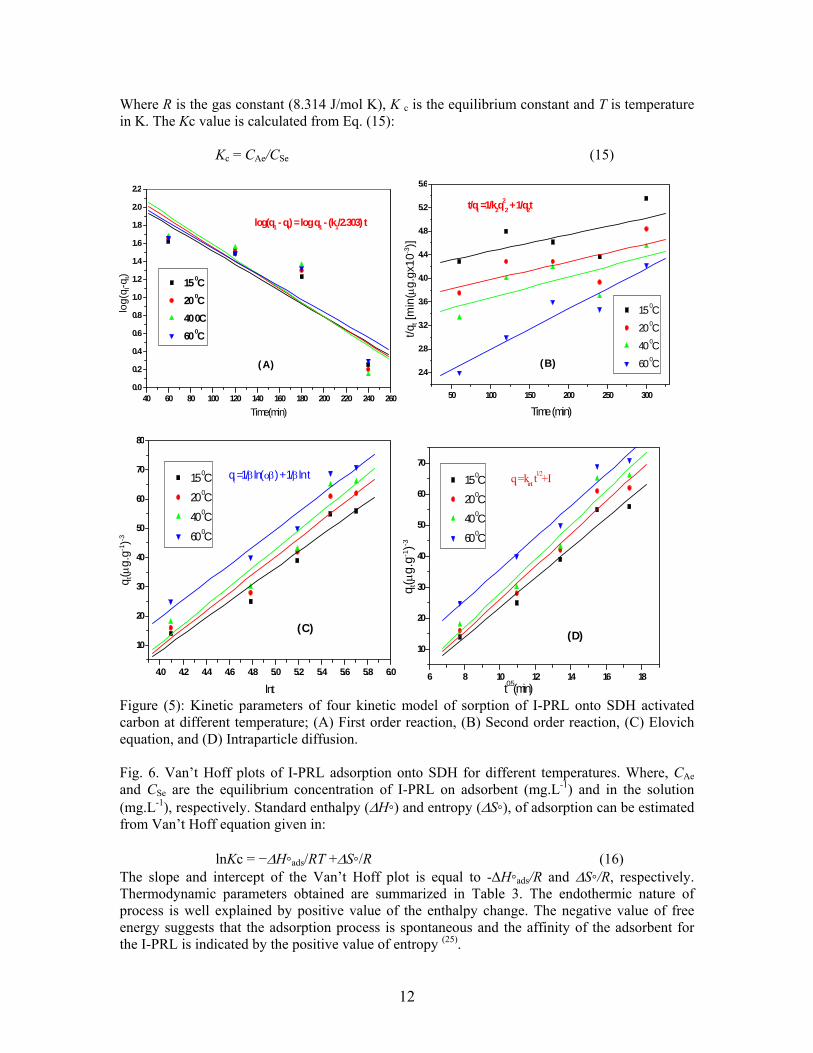
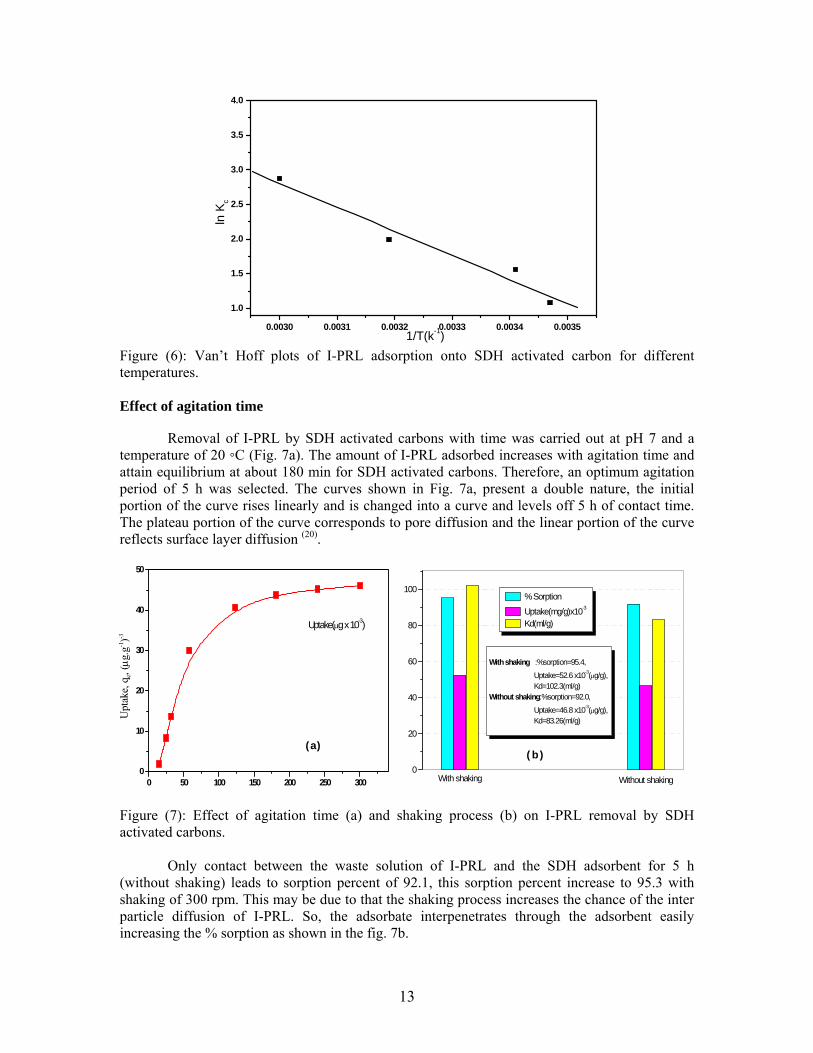
Fig. 6. Van’t Hoff plots of I-PRL adsorption onto SDH for different temperatures. Where, CAe and CSe are the equilibrium concentration of I-PRL on adsorbent (mg.L-1) and in the solution (mg.L-1), respectively. Standard enthalpy (∆H◦) and entropy (∆S◦), of adsorption can be estimated from Van’t Hoff equation given in:
lnKc = −∆H◦ads/RT +∆S◦/R (16) The slope and intercept of the Van’t Hoff plot is equal to -∆H◦ads/R and ∆S◦/R, respectively. Thermodynamic parameters obtained are summarized in Table 3. The endothermic nature of process is well explained by positive value of the enthalpy change. The negative value of free energy suggests that the adsorption process is spontaneous and the affinity of the adsorbent for the I-PRL is indicated by the positive value of entropy (25).
13
0.0030 0.0031 0.0032 0.0033 0.0034 0.0035
1.0
1.5
2.0
2.5
3.0
3.5
4.0
ln K
c
1/T(k-1) Figure (6): Van’t Hoff plots of I-PRL adsorption onto SDH activated carbon for different temperatures. Effect of agitation time
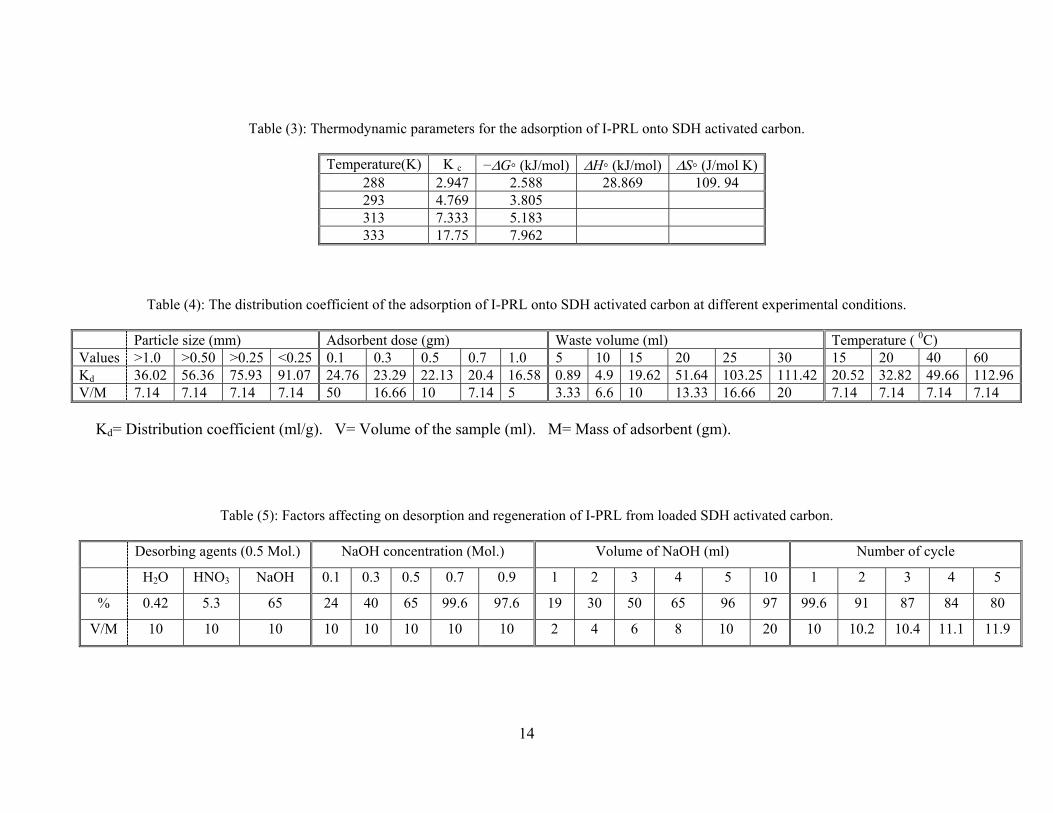
Removal of I-PRL by SDH activated carbons with time was carried out at pH 7 and a temperature of 20 ◦C (Fig. 7a). The amount of I-PRL adsorbed increases with agitation time and attain equilibrium at about 180 min for SDH activated carbons. Therefore, an optimum agitation period of 5 h was selected. The curves shown in Fig. 7a, present a double nature, the initial portion of the curve rises linearly and is changed into a curve and levels off 5 h of contact time. The plateau portion of the curve corresponds to pore diffusion and the linear portion of the curve reflects surface layer diffusion (20).
0 50 100 150 200 250 3000
10
20
30
40
50
( a )
Uptake(µg x 10-3)
Upt
ake,
qe,
(µg.
g-1)-3
0
20
40
60
80
100
( b )
With shaking :%sorption=95.4, Uptake=52.6 x10⁻³(µg/g), Kd=102.3(ml/g)Without shaking:%sorption=92.0, Uptake=46.8 x10⁻³(µg/g), Kd=83.26(ml/g)
Without shakingWith shaking
% Sorption
Uptake(mg/g)x10-3
Kd(ml/g)
Figure (7): Effect of agitation time (a) and shaking process (b) on I-PRL removal by SDH activated carbons.
Only contact between the waste solution of I-PRL and the SDH adsorbent for 5 h
(without shaking) leads to sorption percent of 92.1, this sorption percent increase to 95.3 with shaking of 300 rpm. This may be due to that the shaking process increases the chance of the inter particle diffusion of I-PRL. So, the adsorbate interpenetrates through the adsorbent easily increasing the % sorption as shown in the fig. 7b.
14
Table (3): Thermodynamic parameters for the adsorption of I-PRL onto SDH activated carbon.
Temperature(K) K c −∆G◦ (kJ/mol) ∆H◦ (kJ/mol) ∆S◦ (J/mol K)288 2.947 2.588 28.869 109. 94 293 4.769 3.805 313 7.333 5.183 333 17.75 7.962
Table (4): The distribution coefficient of the adsorption of I-PRL onto SDH activated carbon at different experimental conditions.
Particle size (mm) Adsorbent dose (gm) Waste volume (ml) Temperature ( 0C) Values >1.0 >0.50 >0.25 <0.25 0.1 0.3 0.5 0.7 1.0 5 10 15 20 25 30 15 20 40 60 Kd 36.02 56.36 75.93 91.07 24.76 23.29 22.13 20.4 16.58 0.89 4.9 19.62 51.64 103.25 111.42 20.52 32.82 49.66 112.96 V/M 7.14 7.14 7.14 7.14 50 16.66 10 7.14 5 3.33 6.6 10 13.33 16.66 20 7.14 7.14 7.14 7.14
Kd= Distribution coefficient (ml/g). V= Volume of the sample (ml). M= Mass of adsorbent (gm).
Table (5): Factors affecting on desorption and regeneration of I-PRL from loaded SDH activated carbon.
Desorbing agents (0.5 Mol.) NaOH concentration (Mol.) Volume of NaOH (ml) Number of cycle
H2O HNO3 NaOH 0.1 0.3 0.5 0.7 0.9 1 2 3 4 5 10 1 2 3 4 5
% 0.42 5.3 65 24 40 65 99.6 97.6 19 30 50 65 96 97 99.6 91 87 84 80
V/M 10 10 10 10 10 10 10 10 2 4 6 8 10 20 10 10.2 10.4 11.1 11.9
15
Distribution coefficient (Kd)
The distribution coefficient Kd, which defines the affinity of the I-PRL for the SDH adsorbent was determined and listed in Table 4. The Kd is commonly used as a means of assessing the mobility of radionuclides in the environment and for comparing adsorption data obtained from different sources. While the Kd values in laboratory batch experiments should not be assumed to be identical to field sorption values, this type of partitioning information can be used to compare the likely mobility of radionuclides in the environment (26).
From the results shown in Table 4 it is clear that: (i) as the particle size decreases, the Kd increases and this is may be due to the increase of surface area of the adsorbent with the small particle size at fixed batch ratio(V/M). (ii) The Kd decreases with the increase of the mass of adsorbent. This is may be due to the increase of resistance of inter particle diffusion with the decrease in batch ratio as shown from the table. (iii) On the contrast to mass of adsorbent, as the waste volume increases, (i.e. increase of the concentration) the Kd increases due to the lower resistance at higher batch ratio. (iv) As expected, the increasing of temperature leads to increasing the Kd and this may be due to the increase the mobility of adsorbate molecules toward the adsorbent surface at fixed batch ratio. Adsorption interaction in this case must involve some type of specific interaction at higher temperature, i.e., probable bond cleavage (endo-process) to result in smaller entities feasible to certain pore size. Alternatively, such behavior may be ascribed to “activated” adsorption which accelerates diffusion into certain pores in the adsorbent (27). Desorption and regeneration
Desorption of the adsorbed I-PRL from the spent adsorbent SDH was also studied. It was found that there are four parameters significantly affect of desorption and regeneration process: (a) Type of desorbing agent: The carbon loaded with the maximum amount of I-PRL were placed into desorption medium containing H2O, 0.5 M HNO3 and 0.5M NaOH and the amount of I-PRL desorbed in 4 h was measured and the result are listed in Table 5. The 0.5 M of NaOH give the higher value of desorption percent. (b) Effect concentration of NaOH: 0.7 M of NaOH is the best concentration as shown from Table 5. This may be due to the higher concentration of OH- ions give the chance for I-PRL to replace with it leading to high desorption percent. (c) Effect of batch ratio (V/M): as the batch ratio increases, desorption percent increases which is may be due to the ease with which the OH- can be exchanged with I-PRL molecules. (d) Number of regeneration cycle: the SDH activated carbon can be used for 5 cycles effectively. From Table 5 the desorption percent decreased from 99.6 to 80 % after 5 cycle, which is may be due to the loss of weight (approximately 14% loss).
Characterization of SDH activated carbon.
Fig. 8a demonstrates nitrogen adsorption isotherms of SDH carbon. It is clear that this isotherm show mixture of Type I and Type II in BDDT classification (28). Pore size distributions of SDH activated carbons is displayed in Fig. 8b. It can be seen that SDH carbons does not contain macropores. Phosphoric acid activated SDH carbon exhibit two large peaks; one in micropore range and the other in mesopore range. The main adsorption characteristics of the carbon were summarized in Table 6. It is clear that SDH activated carbon has different porous structure. The total surface area of SDH is 1254 m2.g-1, of which 52% is contained in micropores. Thus, the amount of mesopores is 48%. The total pore volume of SDH is 0.923 cm3/g, of which 44.64% is contained in micropores, the amount of mesopores is 55.36%.
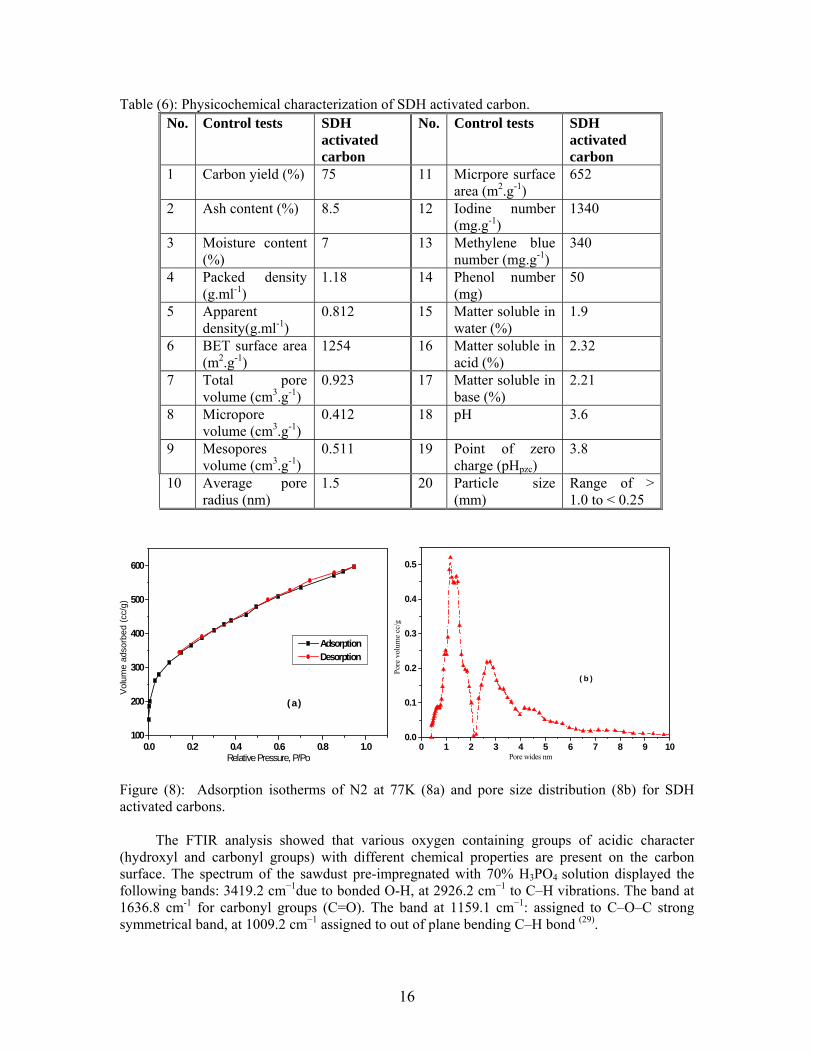
16
Table (6): Physicochemical characterization of SDH activated carbon. No. Control tests SDH
activated carbon
No. Control tests SDH activated carbon
1 Carbon yield (%) 75 11 Micrpore surface area (m2.g-1)
652
2 Ash content (%) 8.5 12 Iodine number (mg.g-1)
1340
3 Moisture content (%)
7 13 Methylene blue number (mg.g-1)
340
4 Packed density (g.ml-1)
1.18 14 Phenol number (mg)
50
5 Apparent density(g.ml-1)
0.812 15 Matter soluble in water (%)
1.9
6 BET surface area (m2.g-1)
1254 16 Matter soluble in acid (%)
2.32
7 Total pore volume (cm3.g-1)
0.923 17 Matter soluble in base (%)
2.21
8 Micropore volume (cm3.g-1)
0.412 18 pH 3.6
9 Mesopores volume (cm3.g-1)
0.511 19 Point of zero charge (pHpzc)
3.8
10 Average pore radius (nm)
1.5 20 Particle size (mm)
Range of > 1.0 to < 0.25
0.0 0.2 0.4 0.6 0.8 1.0100
200
300
400
500
600
( a )
Adsorption Desorption
Vol
ume
adso
rbed
(cc/
g)
Relative Pressure, P/Po0 1 2 3 4 5 6 7 8 9 10
0.0
0.1
0.2
0.3
0.4
0.5
( b )
Pore
vol
ume
cc/g
Pore wides nm
Figure (8): Adsorption isotherms of N2 at 77K (8a) and pore size distribution (8b) for SDH activated carbons.
The FTIR analysis showed that various oxygen containing groups of acidic character
(hydroxyl and carbonyl groups) with different chemical properties are present on the carbon surface. The spectrum of the sawdust pre-impregnated with 70% H3PO4 solution displayed the following bands: 3419.2 cm−1due to bonded O-H, at 2926.2 cm−1 to C–H vibrations. The band at 1636.8 cm-1 for carbonyl groups (C=O). The band at 1159.1 cm−1: assigned to C–O–C strong symmetrical band, at 1009.2 cm−1 assigned to out of plane bending C–H bond (29).
17
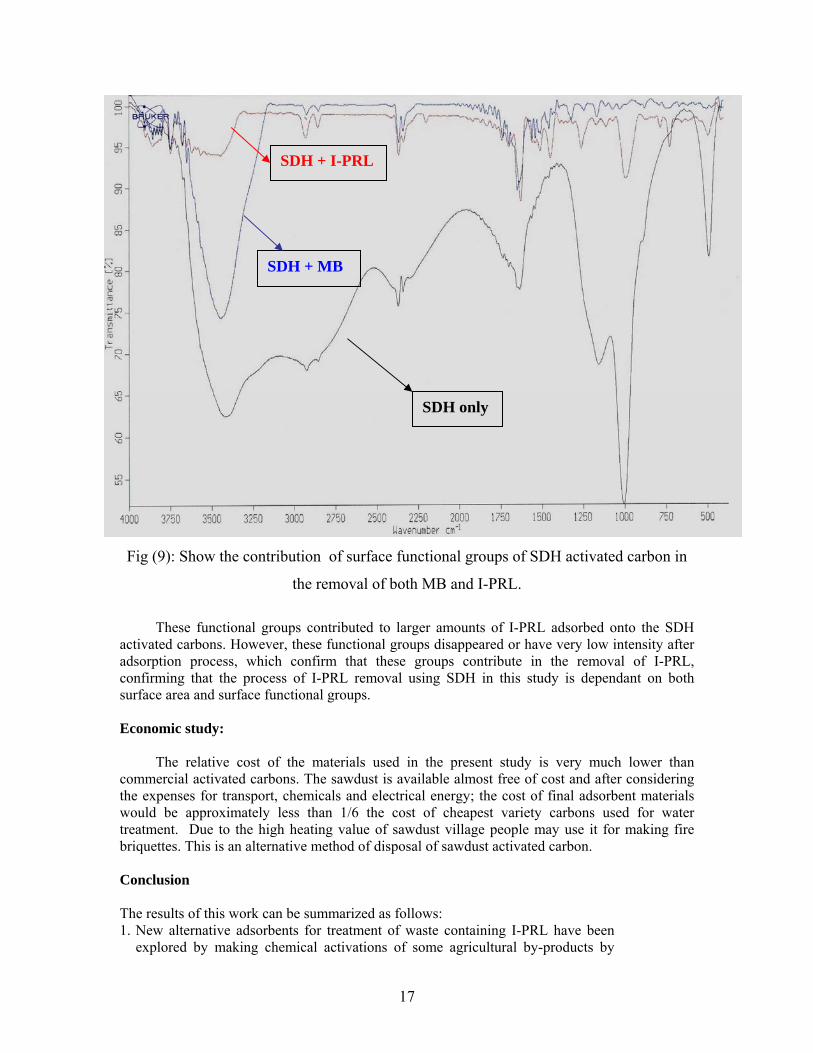
Fig (9): Show the contribution of surface functional groups of SDH activated carbon in
the removal of both MB and I-PRL.
These functional groups contributed to larger amounts of I-PRL adsorbed onto the SDH
activated carbons. However, these functional groups disappeared or have very low intensity after adsorption process, which confirm that these groups contribute in the removal of I-PRL, confirming that the process of I-PRL removal using SDH in this study is dependant on both surface area and surface functional groups.
Economic study:
The relative cost of the materials used in the present study is very much lower than commercial activated carbons. The sawdust is available almost free of cost and after considering the expenses for transport, chemicals and electrical energy; the cost of final adsorbent materials would be approximately less than 1/6 the cost of cheapest variety carbons used for water treatment. Due to the high heating value of sawdust village people may use it for making fire briquettes. This is an alternative method of disposal of sawdust activated carbon. Conclusion The results of this work can be summarized as follows: 1. New alternative adsorbents for treatment of waste containing I-PRL have been
explored by making chemical activations of some agricultural by-products by
SDH only
SDH + MB
SDH + I-PRL
18
phosphoric acid. This study showed that activated carbon prepared from sawdust is the best one for the removal of I-PRL and this may be due to high surface area (1254 m2.g-1) and the presence of many surface functional groups(FTIR).
2. The kinetics of sorption of I-PRL onto SDH was studied by using pseudo first-order and pseudo second-order equations, intraparticle diffusion and the Elovich equation. The sorption kinetics of I-PRL was studied as a function of particle size, mass of adsorbent, waste volume and temperature of the system. For all the systems examined, the pseudo second-order kinetic model provided the best correlation of the experimental data. The pseudo second-order equation is based on the sorption capacity on the solid-phase and is in agreement with a chemisorption mechanism being the rate controlling step.
3. The sorption of I-PRL onto SDH can also be successfully interpreted by the Elovich equation. This supports the heterogeneous sorption mechanism likely to be responsible for I-PRL uptake.
4. The uptake of I-PRL was found to be controlled by external mass transfer at earlier stages and by intraparticle diffusion at later stages. The adsorption of I-PRL was found to be endothermic indicating that the adsorption (and distribution coefficient, Kd) would be enhanced at temperature above the ambient temperature, and the agitation slightly increases the uptake than the static sorption process. The SDH activated carbon can be regenerated and recycled five times effectively with 0.7 M NaOH and the economic cost was estimated.
References
(1) Alka Shukla, Yu-Hui Zhang, P. Dubey, J. L. Margrave and Shyam S. Shukla , The role of
sawdust in the removal of unwanted materials from water Journal of Hazardous Materials, 95 (1-2), 137 (2002).
(2) C.A. Brandon, J.S. Johnson, R.E. Mintura, J.J. Proter, Text Chem. Color 5; 134 (1973). (3) NA Ibrahim, A Hashem, MH Abou-Shosha - Animation of Wood Sawdust for Removing
Anionic Dyes from Aqueous Solutions, Polymer-Plastics Technology and Engineering. 36(6), 963(1997).
(4) S.D. Faustt, A.M. Osman, Adsorption Processes for Water Treatment, Butterworth, Stockholm, MA, (1987).
(5) Kabita Dutta, Sekhar Bhattacharjee, Basab Chaudhuri and Subrata Mukhopadhyay, Chemical oxidation of C. I. Reactive Red 2 using Fenton-like reactions, J. Environ. Monit., 4, 754 (2002).
(6) C. Sarzanini, E. Mentaasti,V. Porta, in: M. Streat (Ed.), Ion Exchange for Industry, Ellis Horword, Chichester, UK, 189 (1988).
(7) G.C. Cushnie, Removal of Metals from WasteWater: Neutralization and Precipitation, Noyes Publications, Park Ridge, NJ, 1984.
(8) F. C. Greenwood, W. M. Hunter and J. S. Glover, Biochem. J., 89, 114(1963). (9) R., Borth, B. Lumenfield, and V. H. Dewatte; Acta. Endocrinol., 24; 119 (1957). (10) A.F. Bristow, A. T. H. Georing and R. Thrope, In" Radioisotopes in Biology, a practical
approach" stated, R. G. Oxford University press, 242 (1990). (11) R. S. Hamilton, In "Immunoassay a practical Guide" D. W. Chon, and M. T. Perlstein, edn
Acta demic press, INC.USA., 35, 38( 1987). (12) K.W. Carley-Macanly; Option for the treatment of low- and intermediate-level active liquid
wastes. In: Proc. Int. Conf. Radioactive Waste Management, IAEA, Vienna, 2, 15 (1984). (13)H.W. Levi; Fixation of radionuclides in TiO2 and titanates via coprecipitation. In: Treatment
and Storage of High Level Radioactive Wastes Proc. Symp., IAEA, Vienna, p. 587 (1963).
19
(14) Polymnia Galiatsatou, Michail Metaxas and Vasilia Kasselouri-Rigopoulou,, Adsorption of zinc by activated carbons prepared from solvent extracted olive pulp, Journal of Hazardous Materials, 91(1-3), 187 (2002).
(15) Mahmut Özacar and I. Ayhan S. engil., A kinetic study of metal complex dye sorption onto pine sawdust., Process Biochemistry, 40 (2), 565 (2005).
(16) Y. S. Ho and G. McKay, Pseudo-second order model for sorption processes, Process Biochemistry, 34 (5), 451 (1999).
(17) M. Özacar, Equilibrium and kinetic modeling of adsorption of phosphorus on calcined alunite. Adsorption; 9,125(2003).
(18) C.W. Cheung, J.F. Porter, G. McKay. Sorption kinetics for the removal of copper and zinc from effluents using bone char. Sep Purif Technol ;19, 55 (2000).
(19) W.J. Weber Jr., in: S.A. Faust, J.V. Hunter (Eds.), Principles and Applications of Water Chemistry, Wiley,New York, 1967.
(20) K. Anoop Krishnan, T.S. Anirudhan., Removal of mercury(II) from aqueous solutions and chlor-alkali industry effluent by steam activated and sulphurised activated carbons prepared from bagasse pith: kinetics and equilibrium studies. J. Hazardous Materials B92, 161 (2002).
(21) Oualid Hamdaoui, Batch study of liquid-phase adsorption of methylene blue using cedar sawdust and crushed brick, Journal of Hazardous Materials B135, 264 (2006).
(22) Kaustubha Mohanty, D. Das, M.N. Biswas, Adsorption of phenol from aqueous solutions using activated carbons prepared from Tectona grandis sawdust by ZnCl2 activation. Chemical Engineering Journal 115, 121 (2005).
(23)Y. ¨ Onal , C. Akmil-Bas¸ar, Didem Eren , C¸ igdem Sarıcı- ¨ Ozdemir, Tolga epic, Adsorption kinetics of malachite green onto activated carbon prepared from Tunc¸bilek lignite. Journal of Hazardous Materials B128, 150 (2006).
(24) Z. Aksu, S. Tezer. Equilbrium and kinetic modelling of biosorption of Remazol Black B by Rhizopus arrhizus in a batch system: effect of temperature. Process Biochem 36, 431 (2000).
(25)Önal, C. Akmil-Başar and Ç. Sarıcı-Özdemir, Investigation kinetics mechanisms of adsorption malachite green onto activated carbon , J. Hazardous Materials, 146 ( 1-2) , 194 (2007).
(26) M.I. Sheppard, D.H. Thibault, Default soil solid/liquid partition coefficients, Kds, for four major soil types: a compendium. Health Physics 59, 471 (1990).
(27) A.A.M. Daifullah, B.S. Girgis, H.M.H. Gad "A study of the factors affecting the removal of humic acid by activated carbon prepared from biomass material" Colloids and Surfaces A: Physicochem. Eng. Aspects 235, 1 (2004).
(28) Brunauer; S., Deming; L. S., Deming W. S., and Teller E., On a theory of the van der Waals adsorption of gases. J., Amer; Chem. Soc., 62, 1723 (1940).
(29) C. Moreno-Castilla , M.V. Lopez-Ramon , F. Carrasco-Marın “Changes in surface chemistry of activated carbons by wet oxidation” Carbon 38, 1995 (2000).


![Activated Carbon[1]](https://img.dokumen.tips/doc/110x75/56d6be9b1a28ab301692d8de/activated-carbon1.jpg)