Embed Size (px)
Citation preview

EFFICIENT LARGE-SCALE UNDERGROUND UTILITY MAPPING USING A NEW MULTI-CHANNEL GROUND-PENETRATING IMAGING RADAR SYSTEM
Ralf Birken Douglas E Miller Maclyn Burns Paul Albats Robert Casadonte Ross Deming Tony Derubeis Thorkild Hansen and Michael Oristaglio
Witten Technologies Inc Boston MA USA rbirkenwittentechcom
Abstract
Ground-penetrating imaging radar (ldquoGPiRrdquo) is a new technology that combines standard GPR (Ground-Penetrating Radar) with accurate positioning and advanced signal processing to create threeshydimensional (3D) images of the shallow subsurface These images can reveal soil conditions and buried infrastructuremdashsuch as utility lines and conduitsmdashdown to depths of about 2 to 3 m (in typical organic soils) with a resolution of centimeters A commercial GPiR called the CART Imaging System which was designed for mapping urban infrastructure has been developed in collaboration between Witten Technologies Malaring Geoscience and Schlumberger The Electric Power Research Institute (EPRI) sponsored research leading to the development of GPiR
The CART system uses a radar array consisting of 17 shielded antennas (9 transmitters and 8 receivers) that cover a 2 m swath on the ground with 16 bi-static GPR profiles Each radar element in the array is a wideband bowtie antenna with a peak frequency of 200 MHz and a bandwidth extending from 50 MHz to 400 MHz The array can collect data while moving at speeds up to about 1 kmh During operation a laser theodolite tracks the position of the array at all times The system collects enough data in a single pass over the ground to form a 3D image beneath its track multiple side-by-side passes are stitched togethermdashusing the positioning information provided by the theodolite and special processing and imaging algorithmsmdashto create a seamless image of the subsurface
GPiR was first tested on a large scale in December 2000 in a pilot project for Consolidated Edison Co of New York (ConEdison) that mapped a large underground area near the intersection of 149th Street Southern Boulevard and Prospect Avenue in the south Bronx Four nights of surveying covered an area of approximately 12000 m2 (nearly 3 acres) The positions of surface features such as curbs street signs valve and manhole covers were also surveyed with the theodolite to provide a local reference grid Final images were visualized with large-scale maps and electronic movies that scroll through the 3D data volume in depth slices and show the enormous complexity of the subsurface in large cities
Introduction
Mapping urban infrastructure
Infrastructure locating and mapping in the United States is mainly done through One-Call or ldquoCall Before You Digrdquo services (httpwwwunderspacecomexonecallhtm) that are now mandatory in all states According to McCann and Fenning (2000) most infrastructure locating in the United Kingdom is done by land surveyors In both countriesmdashin fact in most of worldmdashthese locating services use inexpensive inductive metal detectors from commercial manufacturers (see eg the lists at httpwwwunderspacecomexlocatinghtm) Subsurface Utility Engineering (SUE) projects typically conducted by geophysical or engineering consulting firms combine those locating methods with other geophysical invasive observational techniques and reconciliation of maps
These inductive metal detectors use low-frequency radio waves in the 1 to 100 kHz range The instruments operate either by placing a trace current directly on a pipe (with a direct contact or a toroidal clamp) or by inducing current indirectly with a transmitter at the surface The trace of the underground line is then tracked with a sensitive handheld radio-frequency receiver and marked immediately on the ground with paint Inductive systems work well on individual conductive (metal) utility lines or conduits but are ineffective with non-metallic (plastic or clay) ones and provide only crude estimates of depth Many researchers have suggested supplementing metal detectors with GPR to pinpoint the depth of buried lines since standard two-dimensional (2D) GPR profiles are recognized as a fast and (generally)
reliable way of providing depth estimates for subsurface structures (Cardimona et al 2000 Grandjean et al 2000)
Changing the paradigm
McCann and Fenning (2000) are convinced that GPR surveys will eventually play a major role in the utility locating services especially in the detection of plastic pipes and water leaks but believe that GPR surveys need to be marketed as a rapid and low-cost package similar to One Call services
A more radical approach would attempt to change current practicemdashin which individual lines are located in limited areas based on requests coming from those diggingmdashby mapping infrastructure in advance over large areas ie literally mapping the entire underground grid in an urban or suburban area Network mapping will initially be more expensive (because it covers more area) and would therefore have to generate better maps of infrastructure to compete with existing services Provided however that it can be done cost and time efficiently an important advantage of mapping an entire network would be the possibility of creating a permanent digital record that can be accessed anytime and anywhere before digging and could also help to monitor changes in the underground network over time Ground-penetrating imaging radar is a new technology that may allow for the first time the creation of such large-scale underground maps GPiR combines standard GPR technology with accurate positioning and advanced signal processing to create high-resolution underground radar images (Oristaglio et al 2001) The remainder of this paper describes an efficient new system for deploying GPiR on a large scale and summarizes results from a pilot project conducted in New York City for ConEdison
GPiR and the CART imaging system
Numerous researchers have pointed out the possibilities of imaging the subsurface with standard GPR systems and have carried out tests on a small scale (for a review of early work see Daniels 1996) and many companies carry out such GPR surveys routinely However there are some obvious drawbacks of using a standard single channel GPR system for imaging large underground areas (ten thousands of sq ft) Ciochetto et al (1998) for example used a 4-channel system and still suggested that the speed of such data acquisition is painfully slow and could be improved by using larger channel arrays Lehmann and Green (1999) tested a self-tracking laser theodolite to record and to trigger a GPR system automatically (see below) Automatic and accurate positioning cannot only speed up the overall survey but it can also make the layout of straight profiles less important Accurate positioning also makes possible surveying over a dense spatial grid which can be essential to extracting subtle features from 3D or 4D (ldquotime-lapserdquo) surveys (Versteeg and Birken 2001ab)
In this paper we would like to introduce GPiR as a standard term for GPR surveys (or systems) that combine efficient radar surveying with precise positioning control and advanced signal processing allowing the creation of high-resolution 3D images of the subsurface on a large scale By ldquolarge-scalerdquo and ldquohigh-resolutionrdquo we mean surveys covering thousands of square meters with a resolution of centimeters Such underground images take on the quality of satellite radar images In fact in many ways GPiR has more in common with (a scaled-down version of) satellite radar or 3D seismic imaging than with traditional GPR profiling New technology for GPiR was developed and tested in a project sponsored by EPRI that began with early research in the mid-1990s at Lockheed continued at Schlumberger-Doll Research from 1998 to 2000 (Bernstein et al 2000) and has now been commercialized (EPRI 2001)
Hardware
A commercial GPiR system called the CART Imaging System has been tested for more than a year in surveys in major cities of the US and Europe The CART system uses an efficient new GPR array (developed by Malaring Geoscience) which can be towed by a vehicle or pushed in front of a modified commercial lawnmower (Figure 1) at speeds up to about 1 kmh (30 cms)
Mark of Witten Technologies ldquoCARTrdquo stands for ldquoComputer Assisted Radar Tomographyrdquo
Figure 1 The radar array in the CART Imaging System can be deployed in a trailer that is towed by a vehicle (left) or in a special deck mounted in front of a commercial riding lawnmower (right)
The CART radar array (Johansson et al 2000) has 9 transmitters and 8 receivers in two parallel rows (Figure 2) Each radar element in the array uses an ultra-wideband bowtie antenna with a bandwidth from about 50 MHz to 400 MHz The transmitters broadcast a radio-wave impulse with a peak frequency of about 200 MHz A system with higher-frequency elements having a spectrum between 100 and 650 MHz has also been tested Control electronics with special timing circuit fire the transmitters and controls the receivers in sequence to create 16 GPR channels covering a 2 m swath on the ground (Figure 2 right) In this standard ldquobi-staticrdquo mode of operation each transmitter fires twice in sequence with each firing being recorded by an adjacent receiver A multi-static mode in which each transmitter fires once in sequence and is recorded by all the receivers is also possible
TOP VIEW
Transmitters
Receivers
2 meter equivalent 16 channel array
(bi-static fixed offset)
Figure 2 (Left) Photo inside the CART trailer housing the 17 radar antennas (Right) Schematic top view of CART antenna array which distributes 16 standard GPR channels over a 2 m swath considering a bi-static fixed offset data acquisition mode
System
The CART system relies on precise geometry control provided by a self-tracking laser theodolite GPS (global positioning system) was also considered but is not yet accurate and fast enough in city environments to control precise radar surveying As the CART array moves along the ground a laser theodolite locks on and follows a prism mounted next to the array Lehmann and Green (1999) described a semiautomated georadar acquisition system (SAGAS) also using a laser theodolite to trigger collection of GPR surveys SAGAS relied on a fiber-optic link between the positioning system and GPR control unit Since such a link is not practical for surveys over large areas in a city the CART system uses a different approach The CART system records the geometry data independently from the radar data and merges the two data streams using information provided by a trigger wheel that controls firing of the radar antennas (Burns et al 2001) In CART surveys the laser theodolite is also used to map surface featuresmdashsuch as curbs manholes valve covers fire hydrants and light postsmdashto provide a local reference map for the final 3D radar images of the underground
Processing the raw radar data into images involves several steps Data are filtered with preshyprocessing algorithms that align traces in each channel and balance channels with filters that remove static shifts and match the mean (or median) response across channels (based on a reasonable assumptions about the response in certain areas of the survey) Radar data is then merged with geometry data gridded and migrated (single-velocity 3D) to produce 3D radar images of the subsurface (Oristaglio et al 2001 Hansen and Johansen 2000)
Image processing and visualization software is then used to extract features from the 3D radar images A typical final product consists of slices through the radar image along with extracted features (eg interpreted utility lines coded in depth) that are rendered in a CAD (Computer Aided Design) system These final maps can be merged with client CAD drawings if available
Applications
Currently the CART imaging system is primarily used to map buried infrastructure lines and other subsurface features related to utilities In many cases this has reduced the number of test pits that are typically dug by construction contractors It is expected that the combination of GPiR surveys (a nonshyinvasive surface geophysical method) with a sparse number of test pits (to calibrate and improve the depth estimates) will be most cost and time effective for large-scale subsurface mapping needs
This concept of merging large-scale geophysical surveys with local borehole results which are more precise on a very small scale is already the standard in the oil-industry (combining seismic 3D surveys with borehole measurements) and could become as important for applications such as
bull General detection of discontinuities in electrical properties of subsurface features bull Mapping urban infrastructure bull Identify and assess buried utilities bull Planning and verification of underground construction
bull Pro-active procedure for engineering projects bull Characterization of the subsurface before excavation bull Comparison of ldquoas builtrdquo to plan bull Locating paved over features eg manholes
bull Environmental assessment bull Brownfield development bull Leak detection bull Monitoring of fluid flow bull Waste site investigations bull UXO detection and de-mining
bull Geological Investigations bull Mapping of trenches geological layers and soils bull Bedrock mapping
The existing CART imaging system could be applied to most of those applications listed today It may however require some additional research and development to adapt this technology to many of them Hardware changes such as array configuration or antenna frequencies may be needed to adjust
for depth to target or resolution requirements Custom software will most certainly be needed to visualize the particular target features Some experimental surveys have already been conducted for environmental site mapping and verification of concrete underground structures
In support of this concept Owen (2000) found that surface geophysical methods offer significant advantages to traditional ldquodrillingrdquo and sampling techniques including interpolating the results between boreholes reduce number of boreholes and laboratory analyses needed increased data quality and reduced cost for the design and rehabilitation of Californiarsquos transportation infrastructure
ConEdison pilot project
A pilot project to test GPiR on a large-scale in New York City was carried out by Witten Technologies Inc (WTI) for ConEdison starting in December 2000 Data was collected during four nights in December 2000 with a towed CART System (Figure 1 left) containing 200 MHz radar antennas Each night of surveying covered about 3000 m2 (30000 ft2) of road surface for a total of about 12000 m2 (120000 ft2 or nearly 3 acres) The final acquired data grid (after merging geometry information) had a spacing of 10 cm in-line (ie in the direction of individual channel profiles) and 15 cm crossline Positions of surface featuresmdashcurbs street signs valve and manhole coversmdashwere mapped to provide a reference grid for the radar images
Survey area
Figure 3 Main area surveyed at intersection of 149th Street Southern Boulevard and Prospect Avenue in the south Bronx
Figure 3 shows the site of the survey at the 3-way intersection of 149th Street Southern Boulevard and Prospect Avenue in the south Bronx The feature of most interest to ConEdison for mapping was a high-voltage transmission line (ldquooil-o-staticrdquo) that runs along 149th Street and up Prospect Avenue Many other utility conduits crisscross the intersection In addition tests pits dug in May 2000 had uncovered buried trolley tracks along 149th Street west of the intersection with Prospect The dense and complex underground network poses a huge challenge to precision mapping on such a large scale
Presentation of 3D migrated radar data volume
A merged image covering the entire area surveyed (12000 m2) was produced on a 3 in (76 cm) horizontal grid down to a depth of 96 in (24 m) in 1 in (254 cm) depth increments with a single-velocity 3D migration Figures 4 to 6 show typical large-format depth slices Image slices are plotted with respect to the curb boundaries mapped at the time of the radar survey Symbols representing surface features are also overlaid on the images
Figure 4 Twelve inch depth slice of migrated CART radar data from Bronx survey
Figure 5 Partial view of migrated CART radar data slices from Bronx survey at depths of 18 in and 24 in
Figure 6 Thirty-six inch depth slice of migrated CART radar data from Bronx survey
For example the image slice at 12 in depth (Figure 4) shows (a radar view of) the subsurface as it would look if the top 12 in of cover were removed In this display the ldquocopperrdquo color scale (like a grayscale) codes different intensities of the radar image Pure black and pure white correspond to features that generate the strongest radar echoes and different shades of copper correspond to intermediate levels black is the strongest positive amplitude white the strongest negative amplitude In ideal conditions the pattern of different polarities can distinguish different materialsmdasheg metallic versus plastic pipes
Any radar image highlights changes in subsurface (electrical) properties These changes can be caused not only by man-made objects such as pipes conduits or foundation structures but also by differences in soil conditions such as the moisture content or composition (a change from sandy to clay soil) In fact the most prominent features in nearly all underground radar images are boundaries of trenches filled with material other than native soil Also prominent especially at shallow depth are road cuts or changes in pavement surfaces Slices at different depths generally show only features that occur at that depth However large metallic objects can cast radar ldquoshadowsrdquo on deeper layersmdashso eg a manhole cover will usually cast a strong shadow on slices at every depth below
Interpretation
The images contain a tremendous amount of detail much more than can be described here Typically high-resolution PDF files and QuickTime movies with slices every inch in depth are used for detailed interpretation on a computer This section will describe the major features seen in the image slices at different depths and a map of the trench containing the oil-o-static line extracted from the migrated radar data volume (the trace of the line is marked with red on the image slices in Figure 4 to 6)
The most prominent features in these slices are pairs of buried trolley tracks running along 149th Street and along Southern Boulevard The full pattern of branching and intersecting trolley tracks under 149th Streetmdashespecially the complex junctions near the three-way intersectionmdashis especially impressive in the full image at 12 in depth (Figure 4) The buried trolley tracks along Southern Boulevard show up most clearly in the slice at 18 in depth (Figure 5) The presence of buried tracks along 149th Street was known from test pit records there were no (available) records of the tracks along Southern Boulevard
Also prominent in these slices are numerous trenches containing buried utilities The trench containing the oil-o-static line runs east to west along 149th Street (near the south curb) and then curves north up Prospect Avenue best seen in the 36 in depth slice shown in Figure 6 Clearly visible at this depth and scale is the trench of a second oil-o-static line along Prospect Avenue east of the first one
Figure 7(a) shows the conduit configuration of the oil-o-static line which consists of two 4 in PVC pipes over an 8 in steel pipe In some areas metal protection plates cover the pipes Figure 7(b)-(d) shows vertical sections through the image at three different locations including two locations where plates are not apparent The vertical sections show that the configuration of three separate conduits in the oil-o-static trench is visible in the CART image under good conditions but is not well resolved by the 200 MHz radar used for this survey Sharp images of the three pipes would probably require highershyfrequency radar The images appear good enough however to make an estimate of the thickness of the ldquocoverrdquo over the line at all positions along the survey (shown in Witten Technologies Inc 2001)
Figure 8 shows a schematic 3D rendering of infrastructure lines extracted from the 3D CART images This display removes all extraneous features and simply shows different conduits (and the buried tracks) under the intersection of 149th Street and Southern Boulevard in their relative positions in space All infrastructure lines are idealized as fixed-diameter cylinders except the three conduits of the oil-o-static line (Figure 7a) which are represented by a single cylinder The 3D view shows the oil-o-static line passing under the buried tracks while a high-pressure gas line (trench) cuts through the rails This highshypressure gas conduit is contained in another highly visible trench in the slice at 18 in depth which runs along 149th Street and crosses the buried tracks along Southern Boulevard
Another trench (unidentified in the conduit map) runs between the two islands in the intersection and crosses both the oil-o-static and gas lines (Figure 4) Many other trenches and conduits crisscross the intersection In addition most (if not all) of the test pits previously dug by ConEdison are clearly visible as rectangular patches in the image (eg the pit just west of the intersection of 149th Street and Prospect Avenue)
Figure 7 (a) Schematic of ldquooil-o-staticrdquo line with protective plate over three-conduit configuration (b)-(d) Oil-o-static line at different locations as seen in vertical sections through the migrated radar image Note (b) shows a location where the pipes are protected by a metal plate
Figure 8 (top) 3D rendering of features extracted from the CART image at the intersection of 149th Street and Southern Boulevard (Figure 5) All conduits are idealized as fixed-diameter cylinders the three conduits in the oil-o-static line are represented by a single cylinder 3D view shows the oil-o-static line passing under the buried tracks the gas line (trench) cuts through the rails
Summary and conclusions
This paper introduces ground-penetrating imaging radar (GPiR) as a new technology (and terminology) for efficient radar mapping of the shallow subsurface on a large scale GPiR combines standard GPR with precise positioning control and advanced signal and image processing to create highshyresolution 3D radar images of the first 2 to 3 m below the surface (in typical organic soils penetration in dry sandy soils can be as deep as 6 to 7 m) Radar images of the subsurfacemdashand features extracted form themmdashcan provide permanent digital records to monitor infrastructure in place or plan new installations GPiR has been tested in a pilot project conducted in New York City for ConEdison that mapped the subsurface below about 12000 m2 (nearly 3 acres) of street in the south Bronx Radar data covering this large scale were collected in 4 days with an efficient new GPiR called the CART Imaging System
The final migrated 3D radar images from the pilot project survey contain a tremendous amount of detail which was examined and interpreted through depth slices Slices through the radar image at shallow depths (12 in Figure 4) clearly show street cuts and trenches outlining most if not all of the underground utility lines in the area including numerous lines not present on the conduit map supplied by ConEdison Two pairs of buried trolley tracks were revealed by the radar image Some utility lines pass beneath the tracks In other places tracks were cut away to emplace the infrastructure line (Figure 8) Slices at deeper depths (12 in to 36 in Figures 4-6) show many of the utility conduits in the trenches including the oil-o-static line and the high-pressure plastic gas mains at depths between 1 ft and 3 ft
Images provided by a GPiR system can eventually lead to accurate 3D maps of urban infrastructure that are produced efficiently with a minimum of digging or drilling Some excavation will always be needed to check the results as Owen (2000) pointed out as well With continued improvement GPiR can become a standard for planning and verification of underground construction environmental assessment and geological investigations
Acknowledgements
The pilot project for ConEdison was part of the commercialization phase of the GPiR Project (EPRI 2001) sponsored by the Electric Power Research Institute (httpwwwepricom) and the former Gas Research Institute (GRI) now the Gas Technology Institute (GTI httpwwwgriorg) Phase II of the GPiR project was carried out at Schlumberger-Doll Research from 1998 to 2000 In May 2000 this project was spun off from Schlumberger and merged with Witten Technologies Inc (httpwwwwittentechcom) which had independently started development in 1998 of the CART Imaging System with Malaring Geoscience (httpwwwmalagscom)
Ralph Bernstein was project manager of the GPiR Project for EPRI Kiran Kothari was project manager for GRI Frank Doherty (ConEdison Research and Development) arranged our initial contacts and first work with ConEdison during the GPiR Project he also organized the meeting in October that led to this pilot project Len Toscano (ConEdison Construction Management) coordinated all phases of the pilot project from choice of sites and initial site inspections through the actual surveys and presentation of the images and comparisons with test pit records
References
Bernstein R Oristaglio M Miller DE and Haldorsen J 2000 Imaging Radar Maps underground objects in 3-D IEEE Computer Applications in Power 7 20-24
Burns M Derubeis T Albats P Casadonte R Birken R Deming R Haldorsen J Hansen T Miller DE Oristaglio ML 2001 Method for merging position information with measurements and filtering to obtain high-quality images that are positioned accurately with respect to global coordinates Provisional patent P02134US0
Cardimona S Webb DJ and Lippincott T 2000 Ground Penetrating Radar Proceedings of GEOPHYSICS 2000 The First International Conference on the Application of Geophysical Methodologies amp NDT to Transportation Facilities and Infrastructure December 11-15th 2000 St Louis Missouri US Department of Transportation
Ciochetto G Giavelli A Polidoro R Roscini F and De Pasquale G 1998 Automatic output of underground utility maps using GPR Proceedings of the 7th international conference on groundshypenetrating radar (GPR rsquo98) May 27-30 1998 Lawrence Kansas USA 2 557-560
Daniels DJ 1996 Surface-penetrating radar IEE
EPRI 2001 Ground Penetrating imaging Radar (GPiR) - Phase II EPRI report 1006152 June 2001 EPRI Customer Fulfillment Center 1355 Willow Way Suite 278 Concord CA 94520-5728 USA
Grandjean G Gourry JC and Bitri A 2000 Evaluation of GPR techniques for civil-engineering applications study on a test site Journal of applied geophysics 45 141-156
Hansen T and Johansen PM 2000 Inversion scheme for ground penetrating radar that takes into account the planar air-soil interface IEEE Geoscience and remote sensing 38 1 496-506
Johansson B Witten A Devany AJ 2000 Ground-penetrating radar array and timing circuits US patent application 60152607 (provisional filing September 1999)
Lehmann F and Green AG 1999 Semiautomated georadar acquisition system in three dimensions Geophysics 64 3 710-731
McCann DM and Fenning PJ 2000 Underground pipe location ndash geophysics or surveying Proceedings of the Symposium on the Application of Geophysics to Engineering and Environmental Problems (SAGEEP 2000) Arlington Virginia Environmental and Engineering Geophysical Society 887-896
Oristaglio M Miller DE and Haldorsen J 2001 Ground Probing Radar in Scattering P Sabatier and E R Pike (eds) v 1 chapter 164 Academic Press London
Owen WP 2000 Selling geophysics Some observations on creating and marketing a geophysics program in state government Proceedings of GEOPHYSICS 2000 The First International Conference on the Application of Geophysical Methodologies amp NDT to Transportation Facilities and Infrastructure December 11-15th 2000 St Louis Missouri US Department of Transportation
Roubal M 2000 Evaluating amp locating engineering structures using non-destructive testing technologies Proceedings of GEOPHYSICS 2000 The First International Conference on the Application of Geophysical Methodologies amp NDT to Transportation Facilities and Infrastructure December 11-15th 2000 St Louis Missouri US Department of Transportation
Versteeg R and Birken R 2001a An automated facility to study processes using 4D GPR Proceedings of the Symposium on the Application of Geophysics to Engineering and Environmental Problems (SAGEEP 2001) Denver Colorado Environmental and Engineering Geophysical Society CD-ROM
Versteeg R And Birken R 2001b Imaging fluid flow and relative hydraulic conductivity using ground penetrating radar in a controlled setting Proceedings of the Symposium on the Application of Geophysics to Engineering and Environmental Problems (SAGEEP 2001) Denver Colorado Environmental and Engineering Geophysical Society CD-ROM
Witten Technologies Inc 2001 Final report Pilot project Large-scale underground utility mapping with ground-penetrating imaging radar Witten Technologies Inc 295 Huntington Avenue Suite 203 Boston MA 02115 USA
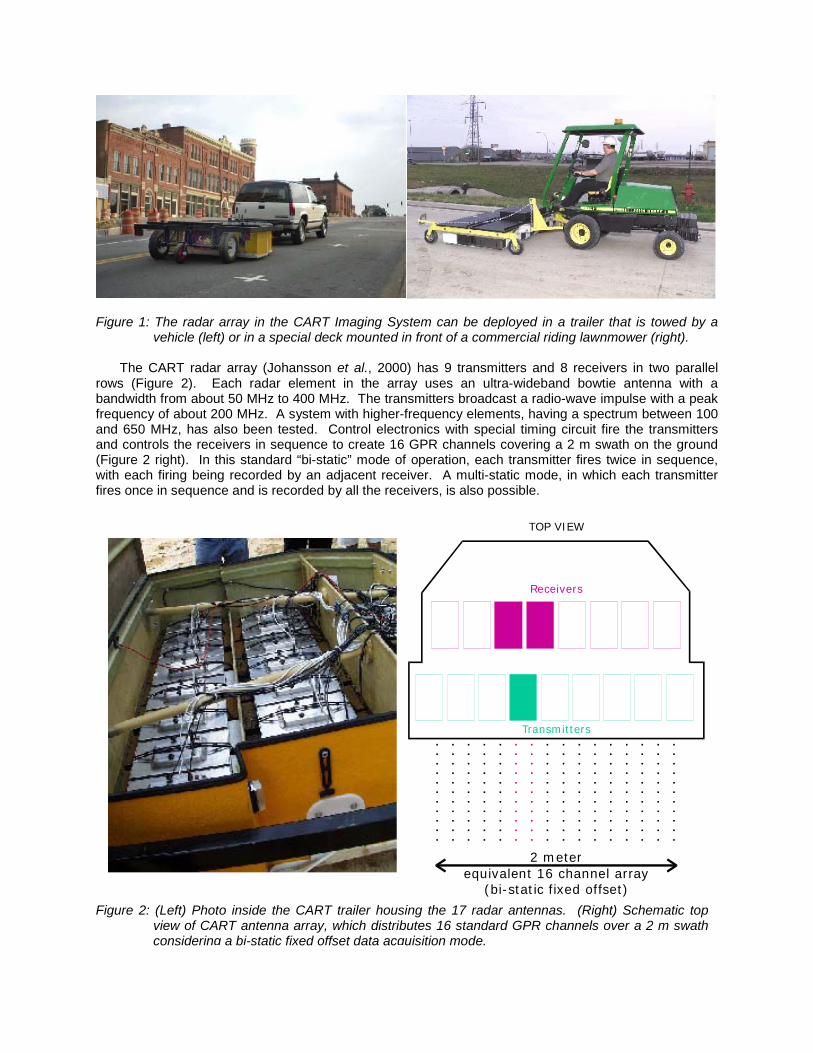
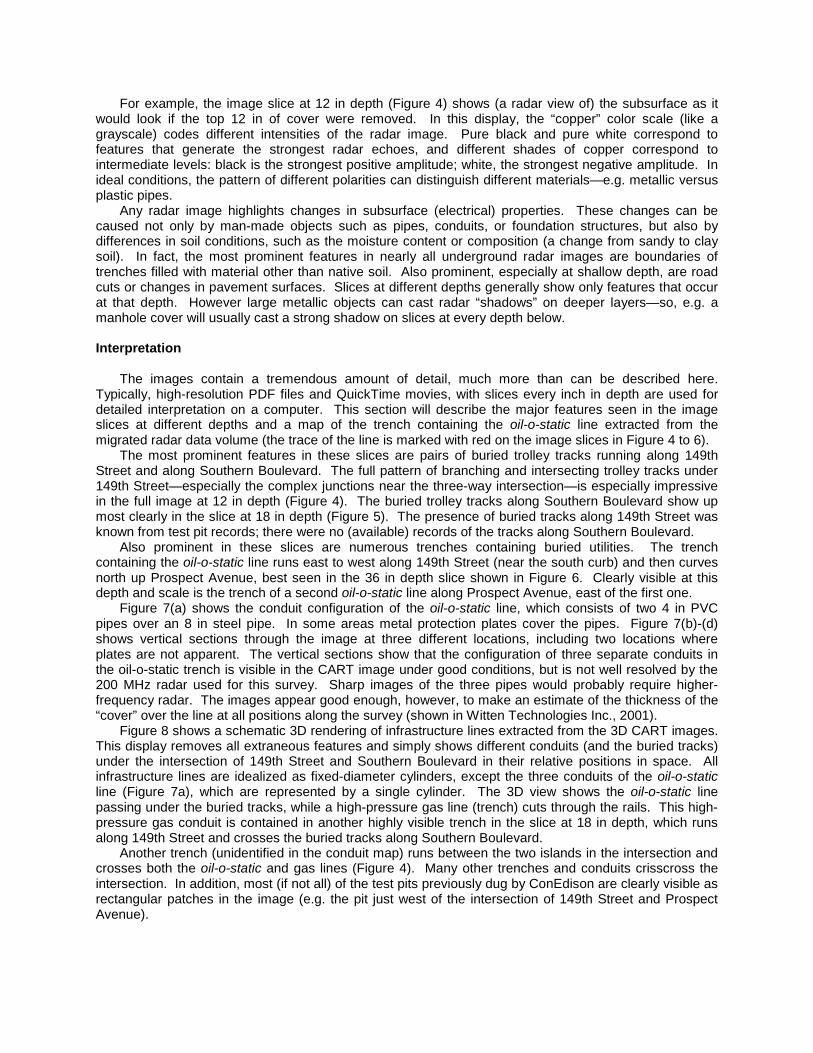