Embed Size (px)
Citation preview

Efficiency Review in
Wexford Local Authorities
Adrian Doyle/Annette O’NeillDoS, Corporate Affairs/Head of Finance
May,2012

Efficiency Agenda – Drivers/ContextFrom 2008 Economic Downturn
July 2008 3% Requirement to reduce Pay Costs for 2008
Feb 2009 Public Service Pension Levy
Feb 2009 8% reduction in Consultancy/Professional Fees
March 2009 25% reduction in Travel & Subsistence Rate
March 2009 Moratorium on Recruitment
May 2009 Incentivised Scheme for early retirement
July 2009 Incentivised Career Break Scheme
Jan 2010 5-8% Pay Cut: Financial Emergency Measures
2010 Efficiency Review Of Local Government Announced in Government Budget 2010
Report Published in July 2010 106 Recommendations in total
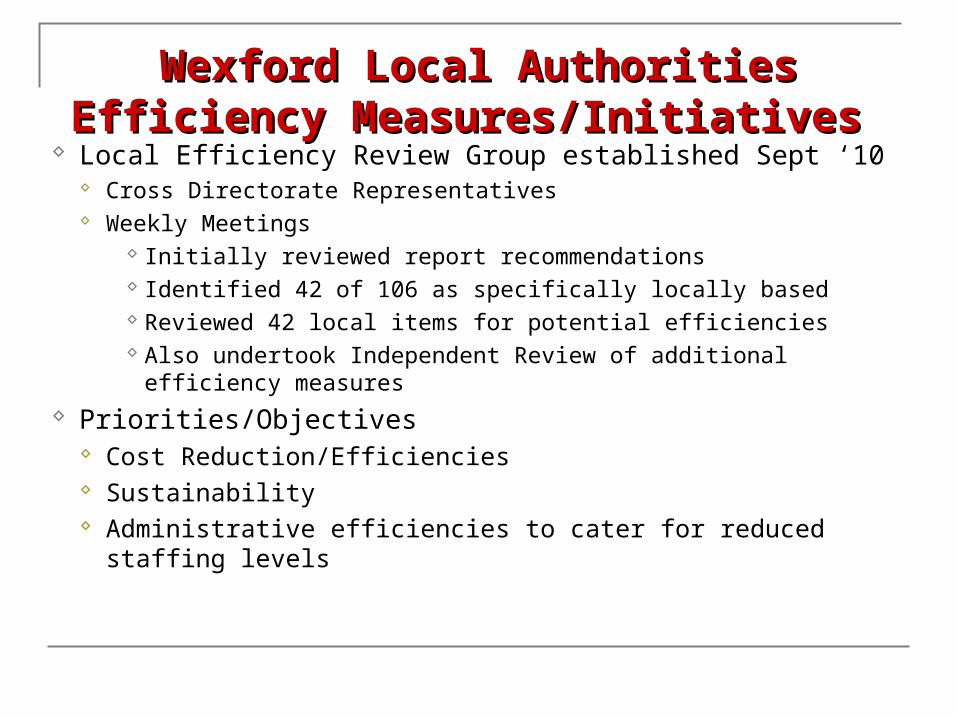
Wexford Local AuthoritiesWexford Local AuthoritiesEfficiency Measures/Initiatives Efficiency Measures/Initiatives
Local Efficiency Review Group established Sept ‘10 Cross Directorate Representatives Weekly Meetings
Initially reviewed report recommendations Identified 42 of 106 as specifically locally based Reviewed 42 local items for potential efficiencies Also undertook Independent Review of additional efficiency
measures Priorities/Objectives
Cost Reduction/Efficiencies Sustainability Administrative efficiencies to cater for reduced staffing levels

Local Efficiency MeasuresLocal Efficiency Measures- Format of Presentation- Format of Presentation
1. Pay Costs Initiatives
2. Non Pay Costs Initiatives
3. Efficiencies Reviews–Ongoing/In Progress
4. Overall Financial Context

Local Efficiency Measures- Agenda
1. Pay Costs Initiatives
2. Non Pay Costs Initiatives
3. Efficiencies Reviews–Ongoing/In Progress
4. Overall Financial Context

STAFF NUMBERS 2008-2012 STAFF NUMBERS 2008-2012 (Q1)(Q1)
Source: Annual Staff ReturnsSource: Annual Staff Returns
Retirements Q1 2012 = 29
Year No.
WTE
Head Count
No. Permanent Vacancies
2008 925 1084 37
2009 865 1020 75
2010 847 1013 101
2011 819 978 144
2012 Q1
797 950 1620
200
400
600
800
1000
1200
2008 2009 2010 2011 2012Q1
WTE
H.Count
Vacancies

TEMPORARY VACANCIES/FAMILY FRIENDLY
INITIATIVES AT 31/03/2012Incentivised Career Breaks 7
Other Career Breaks 8
Long Term Sick Leave 11
Maternity Leave 14
Other: Shorter Working Year/Carers Leave /Special Leave without Pay
5
Totalling approx 200 Weeks in 2012Total Value €1.3m

REDEPLOYED/REASSIGNED STAFF
Refuse Collectors 18 Canteen Staff 3 Clerks of Works 2 Business Unit/NPPR/Household Charge 4 Planners to Biodiversity 1 Storekeeper to Civic Amenity Site 1 Total 29
Short Term Redeploymentso Planners to Planning Levy Collectiono Motor Tax Staff to Higher Education Grants & NPPR

OVERTIME LEVELS Completed a Full Countywide
Review of Activity Implemented Greater Control
through Changed Practices Better Use of Technology Categorisation of Overtime Weekly Monitoring of Costs
Year 2008 2009 2010 2011 2012
Annual Costs €3.372m €2.361m €2.227m €1.579m €1.3m(E)
Annual Savings €1.011m €0.134m €0.648m €0.2m(E)
Cumulative Savings €1.011m €1.145m €1.793m €2.0m (E)
Figures are based on Overtime Costs in all Wexford Local Authorities
01234
2008 2009 2010 2011 2012 Q1
Year
€m

Wexford Local Authorities – Monthly Comparative Analysis 2008 - 2012
Jan Feb Mar Apr May Jun Jul Aug Sep Oct Nov Dec Total
2012 To Date
124,428 70,691 56,786 60,849 87,830 79,215 479,798
2011218,478 103,119 121,765 77,902 105,278 121,709 102,058 111,315 85,473 72,134 108,376 57,985 1,285,591
2010 391,589 141,565 135,920 92,373 108,380 136,641 104,313 107,143 120,857 82,281 127,511 255,538 1,804,110
2009 224,693 184,358 169,879 220,459 171,375 153,326 176,602 115,437 118,079 95,153 152,108 128,700 1,910,171
2008294,629 217,105 194,566 286,625 208,782 246,732 304,951 201,357 233,890 234,347 279,277 234,299 2,936,561

SICK PAY Greater Control through Central Notification of Absence More Structured Approach to Certification of illnesses Return to Work Interviewing and Reporting Increased Use of Independent Medicals
2009 – 7 Referrals to Independent Medicals 2011 – 22 Referrals to Independent Medicals
SICK PAY (PERCENTAGE OF PAYROLL)
YEAR 2008 2009 2010 2011
CERTIFIED 5.01 5.21 5.60 4.71
UNCERTIFIED 0.77 0.73 0.59 0.48
TOTAL % 5.78 5.94 6.19 5.19
TOTAL € 2.44M 2.34M 2.20M 1.72M

RATIONALISATION OF ANNUAL LEAVE
LEAVE REDUCTION
NO. OF STAFF
NO. OF DAYS
1 DAY 22 22
2 DAYS 14 28
3 DAYS 13 39
4 DAYS 17 68
5 DAYS 0 0
6 DAYS 16 96
TOTAL 82 253
Estimated Value: €100,000
Move to Electronic Leave Recording
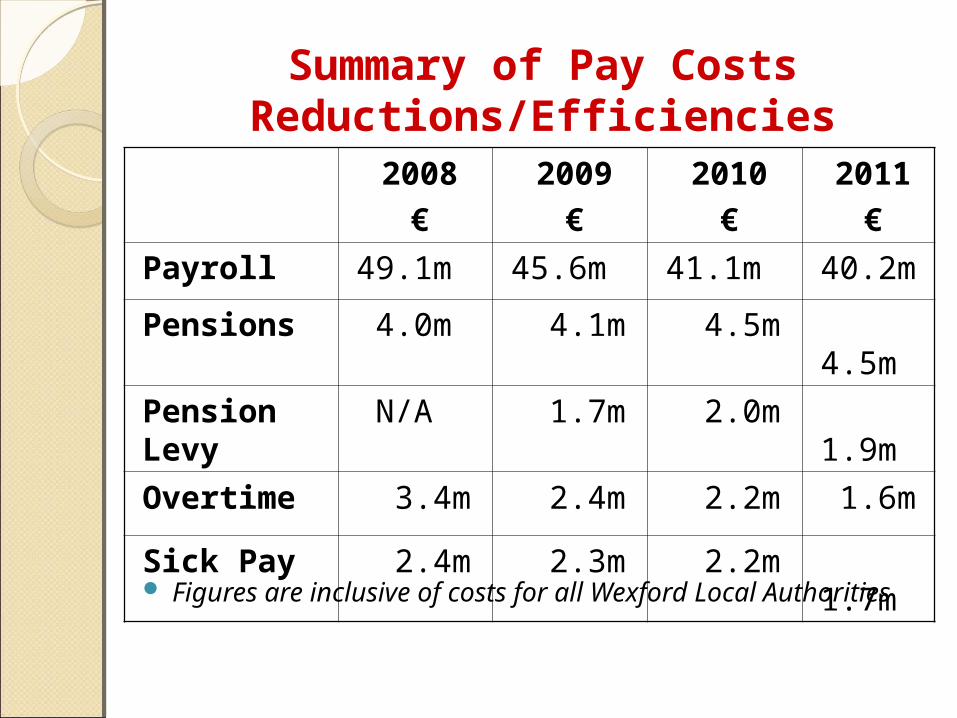
Summary of Pay Costs Reductions/Efficiencies
Figures are inclusive of costs for all Wexford Local Authorities
2008€
2009€
2010€
2011€
Payroll 49.1m 45.6m 41.1m 40.2m
Pensions 4.0m 4.1m 4.5m 4.5m
Pension Levy
N/A 1.7m 2.0m 1.9m
Overtime 3.4m 2.4m 2.2m 1.6m
Sick Pay 2.4m 2.3m 2.2m 1.7m

Local Efficiency Measures- Agenda
1. Pay Costs Initiatives
2. Non Pay Costs Initiatives
3. Efficiencies Reviews–Ongoing/In Progress
4. Overall Financial Context

TRAVELLING EXPENSESYEAR 2008 2009 2010 2011
Travel Expenses€1,100,000 €730,000 €690,000 €650,000
Total Travel & Subs. €1,380,000 €920,000 €820,000 €770,000
Annual Savings €460,000 €100,000 €50,000
Cumulative Savings €460,000 €560,000 €610,000
NOTES: Travel Rates Reduced By 25% from 12th March 2009Limits set for each employee from 2011Regular Review and Reporting

ADVERTISING Revised Contract Arrangements Central/Combined Contract for Wexford Local
Authorities Costs & Savings Generated…….
2008 2009 2010 2011
€550,000 €450,000 €310,000 €230,000
Annual Savings €100,000 €140,000 €80,000
Cumulative Savings €100,000 €240,000 €320,000

MACHINERY & STORES
Reorganisation of Machinery Workshop € 60,000
Merger of Machinery Overseer/Storekeeper € 50,000
Purchase of Pickup Trucks (Hire Replacement) €100,000
Purchase of Patching Units € 40,000
Road Chip Deliveries to Depots €120,000

SUMMARY OF OTHER NON PAY COST INITIATIVES
Non Pay Activity Average Annual Savings
TelephonesComprehensive Review – Mobiles and LandlinesTenderingAdministrative efficiencies
€54k
Printing & StationeryMoved to Energy Efficient Managed Print SystemPaper Usage reduction initiatives/efficiencies introduced
€100k
Payroll Administration Harmonisation of Payroll to Countywide processExtension of Electronic Pay initiativesMove to Fortnightly Pay
€75k

SUMMARY OF OTHER NON PAY COST INITIATIVES………….contd
Non Pay Activity Average Annual Savings
Consultancies•Increased use in in-house expertise•Reassignment of staff
€100k
ICT Costs/Licences/Procurement•Contract Reviews•Review of Costs
€140k
Cleaning• Reorganisation of Working Hours and Staffing•Elimination of Cleaning Contracts
€30k
Canteen ServicesPrivatisation of Service €40k
Overall Annual Savings on Non Pay Costs Initiatives €1,720,000

Local Efficiency Measures- Agenda
1. Pay Costs Initiatives
2. Non Pay Costs Initiatives
3. Efficiencies Reviews–Ongoing/In Progress
4. Overall Financial Context

Local Efficiency Review – Ongoing Programme
Work Ongoing – Sustainability a key objective Building on Efficiencies already gained Sub Groups for specific efficiency focus Current Agenda
Attendance Management - Absenteeism etc Payroll – Overtime, Travel etc Energy Costs and efficiencies Procurement – Recurring Contracts, Purchasing Cards etc Housekeeping – Advertising, Postage, Telephones etc Income and Collections Pay Parking

WORKS IN PROGRESSFuture Initiatives (Already Commenced) Savings Target
Postage Discount €50,000
Public Lighting €50,000
Parking Machine Maintenance-Countywide €30,000
Continuing efforts on existing Initiatives
Energy
To be assessed
GPS (All Vehicles) – Regional Tender
Legal Services
Coroners Services
Further Overtime Savings
Extension of Managed Print Service
Extension of Purchasing Card Usage

Local Efficiency Measures- Agenda
1. Pay Costs Initiatives
2. Non Pay Costs Initiatives
3. Efficiencies Reviews–Ongoing/In Progress
4. Overall Financial Context

Operational Spend 2008 - 2012
80859095
100105110115120
2008 2009 2010 2011 2012 (B)
Year
€M
Year 2008 2009 2010 2011 2012
(Budget)
Revenue Expenditure
€118.7m €110.8m €113.5m €109.8m € 99.3m
Annual Movement -6.68% 2.49% -3.29% -9.52%
Cumulative Movement -6.68% -4.36% -7.50% -16.31%
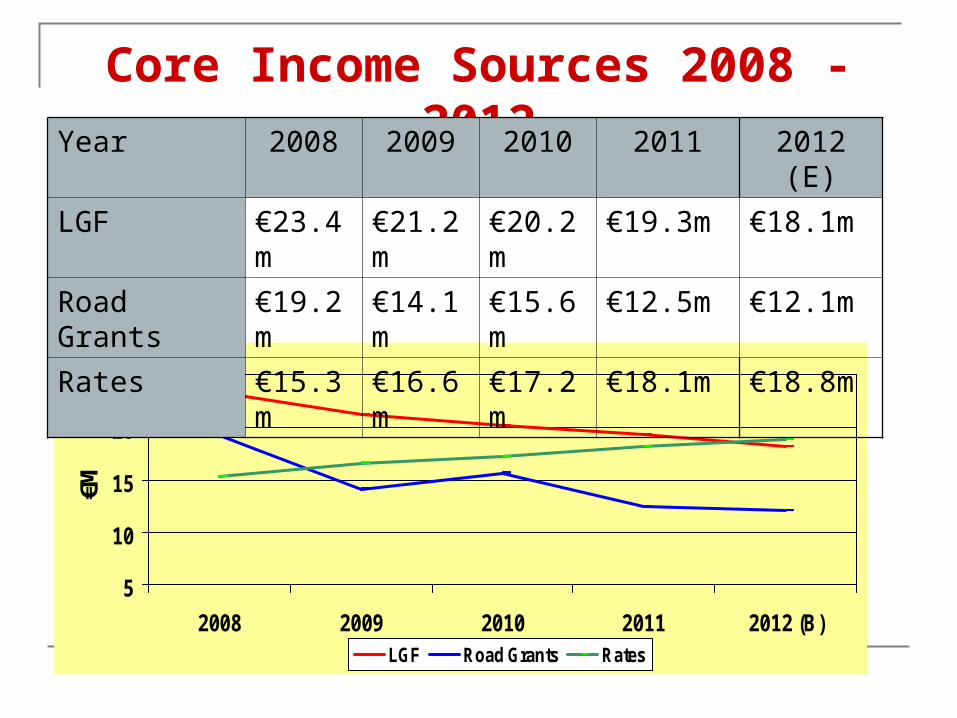
Core Income Sources 2008 - 2012
5
10
15
20
25
2008 2009 2010 2011 2012 (B)Year
€M
LGF Road Grants Rates
Year 2008 2009 2010 2011 2012 (E)
LGF €23.4m €21.2m €20.2m €19.3m €18.1m
Road Grants €19.2m €14.1m €15.6m €12.5m €12.1m
Rates €15.3m €16.6m €17.2m €18.1m €18.8m

Core Income Sources 2008 – 2012% Movements
2008 2009 2010 2011 2012 (E)
Road Grant Movement €19.2m €14.1m €15.6m €12.5m €12.1m
Annual Movement -26.67% 10.44% -19.87% -3.20%
Movement since 2008 -26.67% -19.02% -34.90% -36.98%
LGF Movement (incl P/Levy €23.4m €21.2m €20.2m €19.3m €18.1m
Annual Movement -9.41% -4.87% -4.20% -6.22%
Movement since 2008 -9.41% -13.82% -17.44% -22.65%
Rates Movements €15.3 €16.6 €17.2 €18.2m €18.8m
Annual Movement 7.96% 3.70% 5.89% 3.30%
Movement since 2008 7.96% 11.95% 18.55% 22.88%
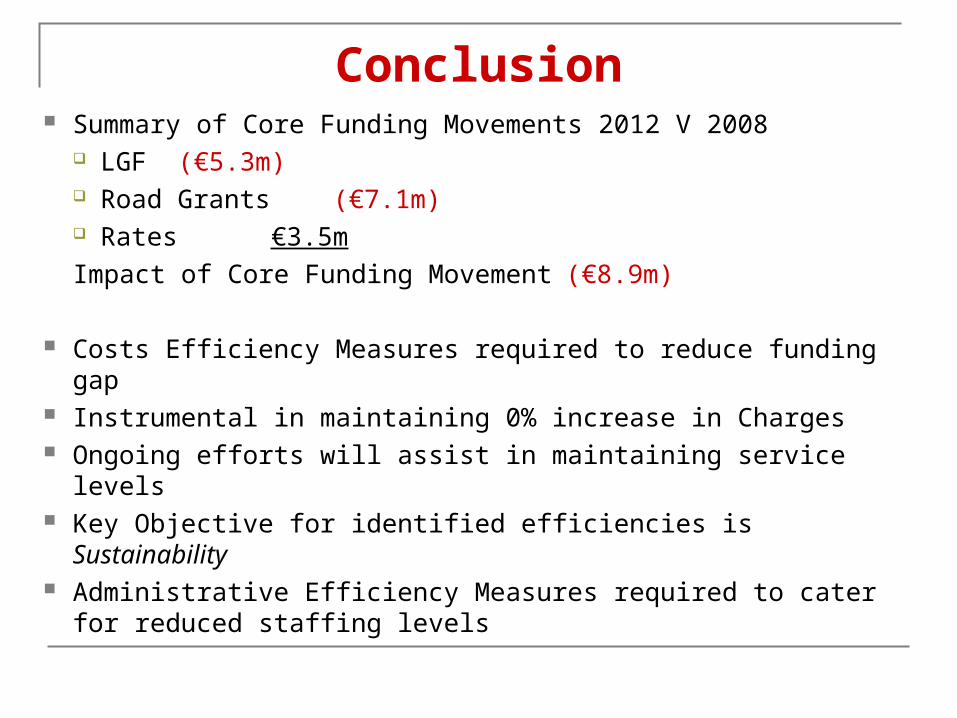
Conclusion Summary of Core Funding Movements 2012 V 2008
LGF (€5.3m) Road Grants (€7.1m) Rates €3.5m
Impact of Core Funding Movement (€8.9m)
Costs Efficiency Measures required to reduce funding gap Instrumental in maintaining 0% increase in Charges Ongoing efforts will assist in maintaining service levels Key Objective for identified efficiencies is Sustainability Administrative Efficiency Measures required to cater for
reduced staffing levels

Thank YouThank You
Questions?Questions?