Embed Size (px)
Citation preview

EFFICIENCY AND SURVIVABILITY OF NEW ENTRANT AIRLINES Jinn-Tsai WONG Professor and Chairman Institute of Traffic and Transportation National Chiao Tung University 4F, 114 Chung Hsiao W. Rd., Sec. 1, Taipei, Taiwan 100. Fax: +886 (2) 2349-4953 E-mail: [email protected]
Chun-Nan CHEN Supervisor Business Development Office China Airlines 13F, 131 Nanking E. Rd., Sec. 3, Taipei, Taiwan 104. Fax: +886 (2) 2514-5814 E-mail: [email protected]
Abstract: On November 18, 1987, the Ministry of Transportation and Communications, Taiwan, announced an ordinance allowing new airlines to be established and routes developed. Taiwan’s air industry thus saw a lot of change. This paper explores the outcomes of airline competition and survivability resulting from the liberalization policy through a research on the relative efficiencies of Taiwan's domestic airlines. The result shows that all of the new-entrant airlines had difficulty in using their inputs efficiently in their initial stage of operations. However, their scale efficiencies improved year after year. The incumbent airlines’ efficiencies were also improved. This implies that competition between the carriers resulting from entry relaxation was indeed intensified and thus performances were improved. In addition, because of the un-removable barriers of competition, most new entrant airlines indeed experienced the life cycle challenge: growth, decline, and collapse. All the newcomers except UNI Air, a subsidiary of EVA Airways, disappeared. Key Words: efficiency, survivability, DEA, entry relaxation policy 1. INTRODUCTION The rapid economic growth of Taiwan in 1980s had resulted in high domestic air travel demand. The incumbent airlines were unable to expand the capacity effectively so as to meet the market demand. As a consequence, the average load factor of air transportation reached as high as 82.2% in 1987. Passengers were denied booking frequently during the peak periods. Therefore, on November 18, 1987, the Ministry of Transportation and Communications, Taiwan, announced an ordinance allowing new airlines to be established and routes developed. It was the so-called “Taiwan’s open sky policy.” In fact, it was not an open sky, but an entry relaxation policy. After more than 20 years of regulation, Taiwan’s air industry thus saw a lot of change. Originally, only four airlines (China Airlines, Far Eastern Air Transport, Formosa Airlines, and Taiwan Airways) operated in the market. After the inauguration of the entry
Journal of the Eastern Asia Society for Transportation Studies, Vol. 6, pp. 752 - 767, 2005
752

relaxation policy, new entrants such as Great China Airlines, Makung Airlines (UNI Air), and China Asia Airlines (U-Land Airlines) joined the market one after another. In 1997, there were ten airlines in the market and the average load factor dropped dramatically to 66.5%. As of now, one has ceased operation completely; three has been merged and two operate exclusively international flights. Only four airlines survive in the domestic market. Since 1991, despite an average flying time of around only 40 minutes, airlines have successively introduced relatively large airplanes, such as A320 series, MD 90 series and Boeing 757 series etc., into Taiwan’s domestic markets, especially on those routes with strong demand (air freight in the domestic market is extremely low and can be ignored). Under the entry relaxation policy, airlines are devoted to expanding routes and flight capacity. However, the limitations of airport capacity, slot availability and limited price freedom have restrained the airlines’ development and thus, possibly, their performance and survivability. It is therefore interesting and worthwhile to explore the effects of the entry relaxation policy. With this background, the focus of this paper will be on the competitiveness of Taiwan’s domestic airlines through exploring their relative operational efficiencies. Efficiency variation for each airline during 1984-1998 and efficiency difference among airlines are analyzed. Also studied are the changes in efficiency resulting from technology and productivity improvement due to the entry relaxation policy. 2. METHODOLOGY Traditionally, methods such as financial ratio analysis and partial productivity measures (Windle and Dresner, 1992) were used to evaluate airline performance. However, using financial ratio analysis and partial productivity measures raises the problem of which ratios should be selected. Selecting a representative ratio among numerous ones is not only difficult but also crucial. In addition, the value of the ratio is often affected by such matters as company’s scale, operating type and scope. Bailey, Graham, and Kaplan(1985), Burning and Hu(1988), Antoniou(1992), Oum and Yu (1998), have adopted an airline’s profitability as an indicator to evaluate its operating performance. Most of them assumed that some specific variables are correlated with profitability, and regression analyses were used to test the correlation. Using profitability to evaluate an airline’s operating performance has its drawbacks. Airlines in Taiwan were regulated by the government before 1987, and were not allowed to enter/exit markets and adjust their operations at will. As a result, some airlines were unprofitable for a long period, but were nevertheless not allowed to exit the unprofitable market. These airlines thus are not fairly judged on their financial performance.
Journal of the Eastern Asia Society for Transportation Studies, Vol. 6, pp. 752 - 767, 2005
753

Frontier functions have been used to measure the efficiency of firms. Data Envelopment Analysis (DEA), which involves mathematical programming, is one of the principal methods used to estimate the frontiers. The production frontier and relative efficiency for each decision-making unit (DMU) is evaluated through the linear programming technique (Boussofiane, Dyson, and Thanassoulis, 1991). It is a non-parametric technique based only on the observed input-output data of firms and does not require any data on the input and output prices. Golany and Roll (1989) presented an application procedure for DEA analysis. Charnes et al. (1994) have also surveyed the state of the art and its numerous applications. Despite its drawbacks (Coelli, Rao, and Battese, 1999; Tofallis, 1997; Charnes, Gallegos, and Li, 1996), due to the flexible feature and its various advantages (Sengupta, 1999; Lewin and Minton, 1986), DEA was widely used in a variety of research including the area of transportation (Oum and Yu, 1994; Parker, 1999; Chapin and Schmidt, 1999; Sarkis, 2000; Scheraga, 2004). Though aware of the limitations of conducting a DEA analysis, considering the data availability, and information being derived from the analysis, we chose to adopt DEA in this paper to analyze the airlines’ relative efficiencies so that their competitiveness and survivability could be judged. To measure separately technical and scale efficiency, the constant returns to scale model, proposed by Charnes, Cooper and Rhodes (1978, 1981) and variable returns to scale model, proposed by Banker, Charnes, and Cooper (1984) are both employed. For detail, please see Coelli, Rao, and Battese (1999). 3. DATA Data Envelopment Analysis (DEA) evaluates a firm’s efficiency on the basis of the associated inputs and outputs. The exclusion of an important input or output can result in biased results. As a consequence, selecting correct variables, which can properly represent the inputs and outputs, becomes very important. Those considered in this paper are: 3.1 Inputs
Carrier’s Assets: including office buildings, airplanes, engines, hangers and the associated facilities, etc.
Labor Expenses:expenses for all kinds of employees, including the wages of flight crews, maintenance personnel, and other company staff.
Fuel Expenses:expense of aircraft fuel. Maintenance Expenses:expense of equipment and material for repairing and maintaining
aircraft and other physical assets.
Journal of the Eastern Asia Society for Transportation Studies, Vol. 6, pp. 752 - 767, 2005
754

3.2 Outputs Operating Revenues:including the revenues from scheduled and non-scheduled flights. Available Seat Kilometer (ASK):the sum over all flights of their available seats
multiplied by the associated distance. Revenue Passenger Kilometer (RPK): the sum over all flights of their revenue
passengers multiplied by the associated distance (used only in sensitivity analysis).
The main focus of this paper is on efficiencies of Taiwan’s domestic airlines, and thus excludes China Airlines (CAL), EVA Airways (EVA), and Mandarin Airlines (MDA), which operate international routes without domestic markets feeding for them. The separation of the industry into international and domestic sectors has proved to be appropriate since different structural characteristics of the frontiers emerged for each sector (Charnes, Gallegos, and Li, 1996; Oum and Yu, 1994). Thus, only airlines operating in the domestic markets are examined in this study. They are: Far Eastern Air Transport (FAT), Trans Asia Airways (TNA), Formosa Airlines (FAC), UNI Air (UIA), Taiwan Airways (TAC), Great China Airlines (GCA), and U-Land Airlines (ULA). The total number of DMUs is shown in Table 1.
Table 1. Period of Data Collection and Number of DMU
Airlines Period of data collection Number of DMU FAT 1984~1998 15 TNA 1988~1998 11 FAC 1984~1988 15 TAC 1986~1997 12 GCA 1989~1997 9 UIA 1989~1997 9 ULA 1993~1998 6 Total 77
Although no specific forms of production are needed for the DEA analysis, the inputs and outputs should be able to logically explain the efficiency. This means that the input and output data must satisfy the hypothesis of “Isotonocity;” that is, the outputs should not decrease with the increase of inputs. To make sure of this, before executing the Data Envelopment Analysis, the correlation between inputs and outputs are examined. It is not possible to divulge the actual financial data and so the paper is able to present only the results from the analyses. The coefficients of correlation shown in Table 2 clearly reveal that all the inputs and outputs are highly positively correlated, which agrees with expectations.
Table 2. The Correlation Coefficients of the Selected Inputs and Outputs Operating revenue ASK RPK
Carrier’s assets 0.862 0.862 0.826 Labor expenses 0.960 0.924 0.957 Fuel expenses 0.946 0.967 0.985
Maintenance expenses 0.922 0.952 0.940
Journal of the Eastern Asia Society for Transportation Studies, Vol. 6, pp. 752 - 767, 2005
755

Because the data spans 15 years, it should be corrected to reflect each year’s inflation rate so that data biases of the earlier DMUs can be avoided. After using the data of FAT, TNA, FAC, UIA, TAC, GCA, ULA to conduct Data Envelopment Analysis, the result shows that the efficiency of TransAsia Airways is highly influenced by the operation of its flight catering subsidiary. Although the output of the subsidiary can be clearly identified, its inputs are ambiguously mixed. In a DEA analysis, outliers may significantly influence the results. Consequently, in the subsequent analyses, the data of the TransAsia Airways are not included. 4. EFFICIENCY ANALYSIS 4.1 Technical efficiency The technical efficiency is used to show whether or not an airline has well utilized its inputs to achieve the maximum outputs. This is affected by many factors. In the input aspect, the assets of an airline are substantially influenced by the introduction of new airplanes and depreciation of old airplanes. The amount of fuel consumed by different type of aircraft varies. It depends on the size and type of aircraft. The cost of aircraft maintenance could also be decreased by employing a younger fleet and adopting better maintenance techniques. Furthermore, new model airplanes and various management technique improvements all have the potential to raise technical efficiency. In the output aspect, the technical efficiency is influenced by the number of available seats, distance of journey and number of revenue passengers. Before the government announced the entry relaxation policy, FAC and TAC used only BN-2 and DO-228 aircraft to fly offshore island routes. Their assets were not large and inputs could be well managed to attain the relatively good outputs. The technical efficiency was high compared to the inefficient FAT. The fleet of FAT consisted of old Boeing 737 series and the aircraft were very old. Two Boeing 737 aircraft had been in service for almost 20 years. Therefore, the associated cost of maintenance and fuel was quite high and the technical efficiency was relatively low before the entry relaxation policy began (Table 3). After entry relaxation, the new entrants such as GCA, ULA and UIA introduced new aircraft. Equipped with the new facilities and relatively small assets, these new companies achieved technical efficiency in the first year of operation. However, subsequent to introducing new aircraft, the airlines’ assets increased substantially. And after introducing the new airplanes, the airlines had to recruit more pilots and cabin crews, as well as increase maintenance staff and aircraft handling staff at airport terminals. As a result, the cost of labor and fuel increased quickly. Consequently, the domestic airlines could not achieve technical efficiency during the period of 1991-1992. During 1993 -1996, the airlines continued to introduce new airplanes into the
Journal of the Eastern Asia Society for Transportation Studies, Vol. 6, pp. 752 - 767, 2005
756

market. The flight capacity and available seat kilometers increased substantially. At the same time, the domestic air transportation demand grew tremendously. This growth partly came from the increase of personal income and partly from the convenient and fare-reduced air transportation in the main markets because of the severe competition after the entry relaxation policy began. The results in Table 3 show that airlines during this period had very efficiently managed their inputs to achieve the output. In 1997, the domestic air transportation market reached a peak; the number of flights, the available seat kilometers and the number of revenue passenger grew phenomenally. All the airlines except TAC, which only flies routes to the very small offshore islands, had achieved the technical efficiency.
Table 3. Airline Technical Efficiencies in Past Years
Year FAT FAC TAC GCA UIA ULA 1984 0.972 1.000 1985 0.929 0.987 1986 0.947 1.000 1.000 1987 0.886 1.000 1.000 1988 0.997 0.891 0.857 1989 1.000 0.910 0.859 1.000 1.000 1990 1.000 0.718 0.787 0.747 0.702 1991 0.829 0.858 0.775 0.757 1.000 1992 0.927 0.977 0.850 0.840 0.948 1993 1.000 0.977 0.582 0.989 1.000 1.000 1994 1.000 1.000 0.484 1.000 1.000 1.000 1995 1.000 0.962 0.503 0.969 0.979 1.000 1996 1.000 1.000 0.893 1.000 0.973 1.000 1997 1.000 1.000 0.793 1.000 1.000 1.000 1998 1.000 0.877 1.000
In summary, FAT, UIA and ULA belong to the higher technical efficiency group. They can effectively utilize their resources and attain the maximum output at the associated production scale. FAC and GCA belong to the second-tier group and TAC has inferior technical efficiency. This result may have some connection with the market operated. In other words, airlines operating in the heavy demand market with large aircraft may achieve higher technical efficiency. For instance, after the commencement of the entry relaxation policy, Far Eastern Air Transport introduced airplanes such as the MD-82, MD-83 and B757; UIA used BAe146 and MD-90; and ULA purchased the MD-82. These large aircraft helped the mentioned airlines attain higher technical efficiency due to the economy of density. On the other hand, TAC used only small airplanes in the small offshore market. As a consequence, it always had relatively very low technical efficiency. As for FAC and GCA, they operated medium and small sized aircraft (FAC:FK-100, DO-228;GCA:MD-90, DH8-300) in some small to medium markets. Therefore, their technical efficiencies are somewhere between the other two groups.
Journal of the Eastern Asia Society for Transportation Studies, Vol. 6, pp. 752 - 767, 2005
757

4.2 Scale efficiency Scale efficiency is used to measure the degree of difference from the airline with the optimal scale (attaining the maximum productivity). The scale efficiency is influenced by production scale. Any carrier with too small (increasing returns to scale) or too large scale (decreasing returns to scale) will result in scale inefficiency. Thus, when there is scale inefficiency, an airline should analyse the state of its production scale so as to increase or decrease the production scale to attain the maximum productivity and improve the scale efficiency. Before the entry relaxation policy began in 1987, all DMUs except FAC in 1986 and TAC in 1986 and 1987 operated under scale inefficiency (Table 4). All of them were in the stage of increasing returns to scale, suggesting that expanding their production scale, if possible, should be implemented so as to allow them to compete effectively in the market. From 1988 (the year of entry relaxation) to 1992, only FAT in 1989 and 1990 attained scale efficiency. Other airlines including FAC, TAC and the new entrants GCA and UIA did not achieve scale efficiency. None of the domestic airlines could achieve maximum scale efficiency during 1991 and 1992. Among them, GCA, TAC and UIA were not big enough, while FAT and FAC had expanded over the optimal scale. Both FAT and FAC purchased airplanes in such great quantity that their scales became excessive. Similarly, the scale inefficiencies of UIA and GCA in 1995 also resulted from aircraft purchases. Both FAC and TAC are the carriers that provide services on the offshore island routes. There is a difference, however, between FAC and TAC. TAC serves only offshore island routes. FAC serves not only offshore island routes, but also some secondary routes on the main island of Taiwan. Before the entry relaxation policy, FAC served mainly the offshore island routes and had increasing returns to scale resulting from insufficient scale. It has been loss-making in business for a long period of time. Therefore, it applied eagerly for the routes and expanded quickly after the entry relaxation policy began. However, it then came under decreasing returns to scale that resulted from large increases in fleet and secondary routes. As for TAC, because it has been operating entirely offshore routes, the topography of offshore airports and associated navigation aids have limited the type of aircraft used. Only small airplanes can be employed. Besides, the demand of offshore islands and the market potential are limited. As a result, the scale of TAC cannot be effectively expanded and the carrier has been, for a long time, under the constraint of increasing returns to scale. This suggests that in principle the carrier should enlarge its scale, but in reality it is hard to do. In such a situation, a government subsidy or other effective measures might properly be considered to support carriers offering the essential services. In 1997, except for FAC and TAC, all other airlines attained scale efficiencies after market development and growth. In 1998, FAT purchased another two B757 aircraft for the purpose
Journal of the Eastern Asia Society for Transportation Studies, Vol. 6, pp. 752 - 767, 2005
758
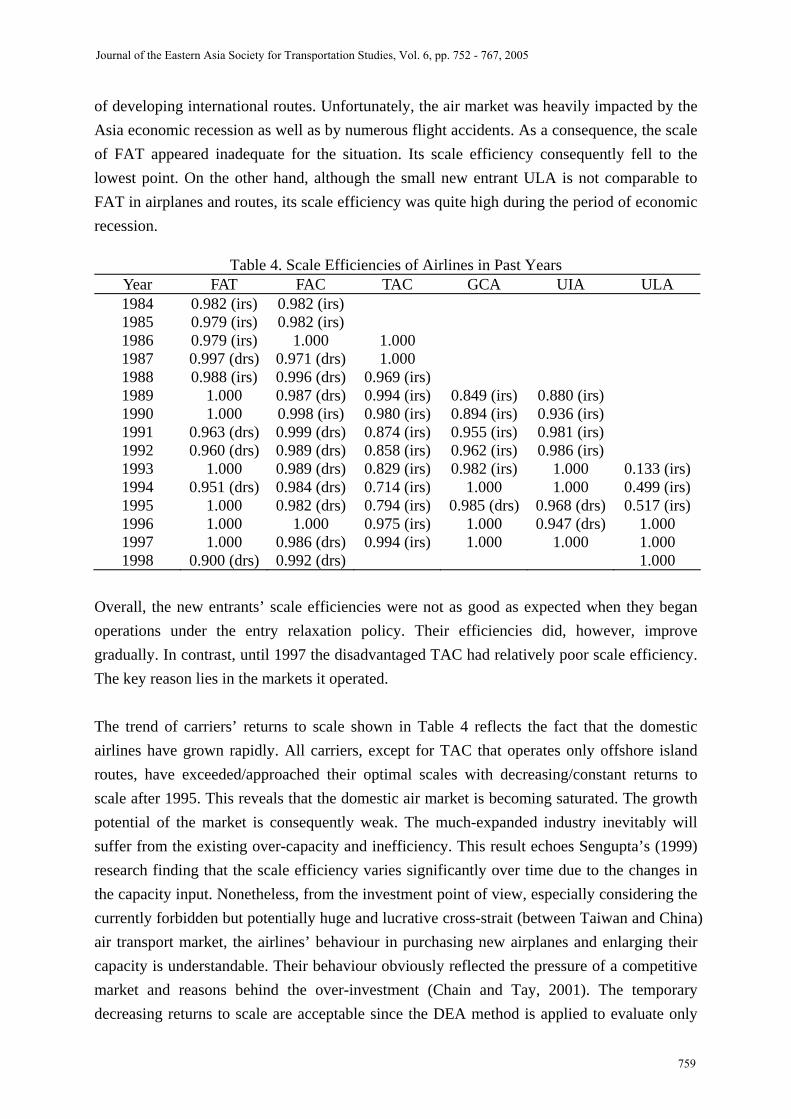
of developing international routes. Unfortunately, the air market was heavily impacted by the Asia economic recession as well as by numerous flight accidents. As a consequence, the scale of FAT appeared inadequate for the situation. Its scale efficiency consequently fell to the lowest point. On the other hand, although the small new entrant ULA is not comparable to FAT in airplanes and routes, its scale efficiency was quite high during the period of economic recession.
Table 4. Scale Efficiencies of Airlines in Past Years
Year FAT FAC TAC GCA UIA ULA 1984 0.982 (irs) 0.982 (irs) 1985 0.979 (irs) 0.982 (irs) 1986 0.979 (irs) 1.000 1.000 1987 0.997 (drs) 0.971 (drs) 1.000 1988 0.988 (irs) 0.996 (drs) 0.969 (irs) 1989 1.000 0.987 (drs) 0.994 (irs) 0.849 (irs) 0.880 (irs) 1990 1.000 0.998 (irs) 0.980 (irs) 0.894 (irs) 0.936 (irs) 1991 0.963 (drs) 0.999 (drs) 0.874 (irs) 0.955 (irs) 0.981 (irs) 1992 0.960 (drs) 0.989 (drs) 0.858 (irs) 0.962 (irs) 0.986 (irs) 1993 1.000 0.989 (drs) 0.829 (irs) 0.982 (irs) 1.000 0.133 (irs)1994 0.951 (drs) 0.984 (drs) 0.714 (irs) 1.000 1.000 0.499 (irs)1995 1.000 0.982 (drs) 0.794 (irs) 0.985 (drs) 0.968 (drs) 0.517 (irs)1996 1.000 1.000 0.975 (irs) 1.000 0.947 (drs) 1.000 1997 1.000 0.986 (drs) 0.994 (irs) 1.000 1.000 1.000 1998 0.900 (drs) 0.992 (drs) 1.000
Overall, the new entrants’ scale efficiencies were not as good as expected when they began operations under the entry relaxation policy. Their efficiencies did, however, improve gradually. In contrast, until 1997 the disadvantaged TAC had relatively poor scale efficiency. The key reason lies in the markets it operated. The trend of carriers’ returns to scale shown in Table 4 reflects the fact that the domestic airlines have grown rapidly. All carriers, except for TAC that operates only offshore island routes, have exceeded/approached their optimal scales with decreasing/constant returns to scale after 1995. This reveals that the domestic air market is becoming saturated. The growth potential of the market is consequently weak. The much-expanded industry inevitably will suffer from the existing over-capacity and inefficiency. This result echoes Sengupta’s (1999) research finding that the scale efficiency varies significantly over time due to the changes in the capacity input. Nonetheless, from the investment point of view, especially considering the currently forbidden but potentially huge and lucrative cross-strait (between Taiwan and China) air transport market, the airlines’ behaviour in purchasing new airplanes and enlarging their capacity is understandable. Their behaviour obviously reflected the pressure of a competitive market and reasons behind the over-investment (Chain and Tay, 2001). The temporary decreasing returns to scale are acceptable since the DEA method is applied to evaluate only
Journal of the Eastern Asia Society for Transportation Studies, Vol. 6, pp. 752 - 767, 2005
759

the operating performance in the past. It doesn’t extend to include forecasting future performance, or positioning in the market. Unfortunately, due to the political stalemate between Taiwan and China, the lucrative cross-strait market potential has not yet been realized. Many airlines, which were too optimistic about the market and which had made inappropriate expansion decisions, have now begun to merge and process their slack assets. For instance, TAC and GCA were merged into UIA in 1998. Since then, many aircrafts have been leased out and route networks adjusted. Even worse, because of financial difficulties, the newcomer ULA ceased operation in the year 2000. These results agree well with Chin and Tay (2001) finding, which stated that the airline’s asset played a large role in determining the mean lifetimes of airlines as well as their survival probabilities. 4.3 Slack Analysis The slack analysis of DEA provides the information for the inefficient DMU of the direction and the associated magnitude for the potential improvement. It can find out the possible decrease of the inputs or the potential increase of the outputs so as to attain the maximum efficiency. The slack variable indicates the distance between the DMU and the point of the relevant efficiency frontier. In other words, the slack variables will tell the inefficient DMU how to move to the efficiency frontier. For instance, FAC’s labor cost was pretty well controlled. Its assets had been over-invested for years (Table 5). It is especially worth noting that its maintenance cost in 1998 was unreasonably high; the slack was as high as 91.16 million dollars. This was because of FAC’s numerous air disasters and the ensuing comprehensive check and maintenance of its fleet ordered by the Civil Aviation Authority. Besides, its operating revenue and ASK had considerable room to improve. As a whole, the new entrants (ULA, UIA and GCA) contain non-zero slack variables during the initial operation stage. This means that these airlines have not used the input resources efficiently in their initial operation stage.
Journal of the Eastern Asia Society for Transportation Studies, Vol. 6, pp. 752 - 767, 2005
760

Table 5. Slack Variables of Formosa Airlines
Year Total efficiency
Assets (million dollars)
Labor (million dollars)
Fuel (million dollars)
Maintenance(million dollars)
Operating revenue
(million dollars)
ASK (million seat kilometers)
1984 0.982 45.05 0.10 0.01 0.01 2.57 1.51 1985 0.970 4.34 0.00 0.00 0.52 5.67 1.41 1986 1.000 0.00 0.00 0.00 0.00 0.00 0.00 1987 0.971 0.00 0.00 3.62 1.02 10.02 25.36 1988 0.888 335.24 0.00 0.00 0.00 48.25 50.08 1989 0.899 251.33 0.00 0.00 4.43 56.68 13.37 1990 0.717 48.84 0.00 0.00 1.30 154.08 40.64 1991 0.857 20.03 0.00 0.00 0.00 79.14 39.18 1992 0.966 0.00 0.00 0.45 0.00 19.47 24.86 1993 0.967 477.03 0.00 0.00 0.00 23.19 32.36 1994 0.984 435.29 0.00 0.00 0.00 16.46 48.03 1995 0.945 1484.91 0.00 0.00 1.76 71.93 19.57 1996 1.000 0.00 0.00 0.00 0.00 0.00 0.00 1997 0.986 0.00 0.00 0.00 4.23 32.06 9.49 1998 0.871 0.00 0.00 0.00 91.16 215.61 71.53
Summarizing the above analyses, we can briefly show the results as in Table 6. Only fuel cost was well controlled by all the carriers. FAT outperformed its competitors in asset management. FAC and UIA were better than other carriers in the area of labor performance. As for maintenance, the performances of FAT and UIA were better than the other airlines. In fact, in terms of accident rate, they have better safety record too. This suggests that carriers do not necessarily reduce the associated safety standards as a sacrifice to gain good maintenance performance. On the contrary, those with inferior maintenance performances are due to their poor safety management and practices. Regarding the operating revenue and ASK, none of the airlines performed as well as expected. This suggests that Taiwan’s domestic air market is rather limited and may not be able to support so many carriers if all are to function effectively. Actually, ULA had ceased operation since year 2000 and TAC, GCA has been merged to UIA in 1998. This evidence supports Gudmundsson (1998) analysis that the new entrant airlines are very likely to experience the life cycle challenge: growth, decline, and collapse.
Journal of the Eastern Asia Society for Transportation Studies, Vol. 6, pp. 752 - 767, 2005
761

Table 6. Performance Summary of Airlines after Entry Relaxation Policy
Airlines Assets Labor Fuel Maintenance Operating revenue ASK
FAT ○ X ○ ○ X X ULA X X ○ X X X TAC X X ○ X X X FAC X ○ ○ X X X GCA X X ○ X X X UIA X ○ ○ ○ X X
Note:○ represents good performance;X represents poor performance 4.4 The Efficiency Before and After Entry Relaxation Policy Before the beginning of the entry relaxation policy, the proportion of efficient DMUs for the whole air industry was 23.08%. This increased to 30.19% after the entry relaxation policy began. About 50% of ULA’s DMUs attained total efficiency; this was the best among the new entrants (GCA, ULA and UIA). GCA and UIA attained only one-third efficient DMUs. Considering those carriers in operation before the entry relaxation policy (FAC, TAC and FAT), we find that FAT’s total efficient DMUs had increased from 0% before the entry relaxation to 60% afterwards. But the proportion of the total efficient DMUs for the carriers that operate the offshore island routes (FAC and TAC) had fallen since the entry relaxation policy. FAC had decreased from 20% to 10% and TAC from 66.67% to 0%. Examining carefully the technical, and scale efficiencies of these three carriers over the years, it can further be seen that FAT made progress in both efficiencies after the entry relaxation policy. TAC’s efficiency was acceptable before the entry relaxation policy, but it declined afterwards until 1996. The efficiency of FAC also fell after the entry relaxation policy began until 1992. After the inauguration of the entry relaxation policy, the airlines invested a great amount of capital to replace their old, small aircraft with new and larger aircraft. Because of the new investment, aircrafts’ engine efficiency and fuel consumption have been substantially improved. In addition, advancement of the maintenance skill and change of the air market structure all had significant impact on the airlines’ production and shifted the production frontier. Therefore, it is worth analyzing efficiency changes before and after the entry relaxation policy by using the efficiency shift model (Fare and Grosskopf, 1996). The shift in technology (SIT) shows the level of technical change, which is defined as the geometrical average of shift of the production frontiers on periods 0 and t (before and after the inauguration of Taiwan’s entry relaxation policy). This may be due to the unremitting progress of production technique or a change in administrative and regulatory policy. If SIT>1.0, technical advance occurs. The catching-up in efficiency (CIE), the ratio of the
Journal of the Eastern Asia Society for Transportation Studies, Vol. 6, pp. 752 - 767, 2005
762

efficiency in period t to the efficiency in period 0, evaluates efficiency improvement of a DMU during the period from 0 to t. If CIE>1.0, improvement in efficiency occurs. Thus, for each DMU, to measure the productivity change (PC) over period 0 to t, both the technical shift and catching-up in efficiency should be taken into account (Fare and Grosskopf, 1996); that is,
ttt CIESITPC ,0,0,0 ×= (1)
Eq.(1) says that if a firm’s relative efficiency has no change (CIE=1.0) during the period from 0 to t , the productivity change (PC) over period 0 to t will be exactly equal to the technical change due to the unremitting progress of production technique or a change in administrative and regulatory policy. If firms relative efficiency has been improved (CIE>1.0) or deteriorated (CIE<1.0) during the period from 0 to t, the productivity change (PC) over period 0 to t should also take this into account. By looking at the value of SIT, CIE and PC shown in Table 7, it can be seen that FAT made the greatest progress among the three carriers. FAC also made some progress after the entry relaxation policy. However, TAC did not gain any efficiency after the entry relaxation policy. The poor relative efficiency of TAC reveals that it is not competitive. The values of SIT for FAT and FAC are both greater than 1, suggesting that there were improvements in management of production technique after the entry relaxation policy began. The SIT of FAT is better than that of FAC. This is due to FAT operating only high-density routes. As to TAC, its SIT value is less than 1. That means TAC fell behind in production technique. This outcome is expected and resulted from the airport and aircraft limitations imposed on TAC. The CIE of FAT, the highest among the three carriers’, is greater than 1. This means that the degree of progress made by FAT is better than its counterparts. Again, the CIE of TAC is smaller than 1, which means its relative competitiveness became even worse after the entry relaxation policy. The PC index, representing the change of carrier’s relative productivity, is the product of SIT and CIE. Both FAT’s and FAC’s PC values are greater than 1, which demonstrates that their productivity grew after the entry relaxation policy began. In addition, the growth rate of FAT’s productivity is better than FAC’s. In contrast, TAC’s PC value is smaller than 1. This illustrates that TAC’s productivity fell relative to the others after the entry relaxation policy. It also answers the puzzle of TAC’s great efficiency decline from operating at relative technical efficiency in 1986/1987 to inefficiency after ‘relaxation’.
Journal of the Eastern Asia Society for Transportation Studies, Vol. 6, pp. 752 - 767, 2005
763

Table 7. The Change of Efficiency Over Time
Airlines Shift in technology (SIT)
Catching-up in efficiency (CIE)
Productivity change (PC)
FAT (1987-1997) 1.3928 1.0520 1.4653 TAC (1987-1997) 0.8078 0.9266 0.7485
FAC (1987-1997) 1.2188 1.0000 1.2188
Finally, efficiencies of the carriers that operate offshore island routes and those that operate main island routes are analysed as shown in Table 8. The performance of the carriers operating the main island routes is much better than that of the carriers operating the offshore island routes. This result strongly suggests that the relatively poor efficiencies of FAC and TAC may be largely attributed to their poor offshore operating environment. This result also suggests that government subsidy may be needed for carrier survival in offshore island routes to provide essential air services. Table 8: Efficiency Comparison between Main-Island Carriers and Offshore-Island Carriers
Carriers Relative efficiency
Relative inefficiency Airlines Relative
efficiency Relative
inefficiencyFAT 40.00% 60.00% GCA 33.33% 66.67% UIA 33.33% 66.67%
Operating main-island routes 38.46% 61.54%
ULA 50.00% 50.00% FAC 13.33% 86.67% Operating
offshore island routes
14.81% 85.19% TAC 16.67% 83.33%
Total 28.79% 71.21% Total 28.79% 71.21% 5. CONCLUSION Judged from the technical efficiency, Far Eastern Air Transport, UNI Air and U-Land Airlines, which operate in relatively dense markets with large aircrafts, are the operators with relatively high efficiency. Their inputs were effectively converted into products. Taiwan Airways, which offers services only to offshore island routes, however, had the poorest technical efficiency. Formosa Airlines and Great China Airlines are in between. It is clear that the airlines operating on the main island commercial routes performed much better than those operating on offshore island essential service routes. As a matter of fact, the loss-making carriers offering the essential services to offshore islands have requested the subsidies from the government. This agrees well with the research result. Thus, this performance measurement not only provides the evidence but also can be a useful tool for government subsidy decision-making.
Journal of the Eastern Asia Society for Transportation Studies, Vol. 6, pp. 752 - 767, 2005
764

All of the new-entrant airlines after the entry relaxation policy began had poor scale efficiencies. These new entrants (UNI Air、Great China Airlines and U-Land Airlines) had slack inputs in their first period of operation, showing that new entrants could not effectively make the best use of their inputs and were in a disadvantaged position. However, their scale efficiencies improved year after year. Furthermore, the incumbent airlines’ efficiencies improved after the entry relaxation policy except that of Taiwan Airways. Among the airlines, FAT with the highest market share made the most progress. This implies that competition between the carriers resulting from entry relaxation policy was indeed intensified and thus performances were improved. In addition, because of the un-removable barriers of competition, the incumbents have a greater advantage than those of the newcomers. Most new entrant airlines indeed experienced the life cycle challenge: growth, decline, and collapse After 1995 most airlines were beyond their associated optimal scales. As a result, their returns to scale decreased. This suggests that the domestic air transport market has become saturated. Over-supply due to the changes in the capacity input will undoubtedly bring about inefficiency and result in decreasing returns to scale. However, if the future potential traffic across the Taiwan Strait is given proper consideration, the over-scale investment in advance may be reasonable and acceptable. Nonetheless, the unlimited entry relaxation may result in too many carriers competing in the limited market. The valuable transportation resources may be wasted, especially in the case of limited market where new entrants have no enough space to expand and compete. In fact, the airlines in Taiwan in a state of over-capacity have also experienced the inevitable process – fare war, government intervention, cooperation, and merging. Currently, there are only four carriers in Taiwan’s domestic market. This is the same as that before the entry relaxation policy began. All the newcomers except UIA disappeared. On this basis, we may argue that the direction of entry relaxation policy is probably right since it promotes the market competition; but the implementation of the policy can be elaborated further so that more social welfare can be created.
REFERENCES Antoniou, A., (1992) The factors determining the profitability of international airlines: Some econometric results. Managerial and Decision Economics, Vol. 13, No. 6, 503-514. Bailey, E. E., Graham, D. R., and Kaplan, D. P. (1985) Deregulating the Airlines. Cambridge, MIT Press. Banker, R. D., Charnes, A. and Cooper, W. W. (1984) Some models for estimating technical and scale inefficiencies in data envelopment analysis. Management Science, Vol. 30, No. 9, 1078-1092. Boussofiane, A., Dyson, R. G. and Thanassoulis E. (1991) Applied data envelopment analysis. European Journal of Operational Research, Vol. 52, No. 1, 1-15.
Journal of the Eastern Asia Society for Transportation Studies, Vol. 6, pp. 752 - 767, 2005
765

Burning, E. R., Hu, M. Y. (1988) Profitability, firm size, efficiency and flexibility in the U.S. domestic airline industry. International Journal of Transportation Economics, Vol. 15, No. 3, 313-327. Chapin, A., and Schmidt, S. (1999) Do mergers improve efficiency? – Evidence from deregulated rail freight. Journal of Transport Economics and Policy, Vol. 33, No.2, 147-162. Charnes, A., Cooper, W. W., Lewin, A. Y., Seiford, L. M. (Eds.) (1994) Data Envelopment Analysis: Theory, Methodology and Applications, Kluwer Academic Publishers. Charnes, A., Cooper, W. W. and Rhodes, E. (1978) Measuring the efficiency of decision making units. European Journal of Operation Research, Vol. 2, No. 6, 429-444. Charnes, A., Cooper, W. W. and Rhodes, E. (1981) Evaluating program and managerial efficiency: An application of data envelopment analysis to program follow through. Management Science, Vol. 27, No. 6, 668-697. Charnes, A., Gallegos, A. and Li, H. (1996) Robustly efficient parametric frontiers via multiplicative DEA for domestic and international operations of the Latin American airline industry. European Journal of Operational Research, Vol. 88, No. 3, 525-536. Chin, T.H. and Tay, H. (2001) Developments in air transport: implications on investment decisions, profitability and survival of Asian airlines. Journal of Air Transport Management, Vol. 7, 319-330. Coelli, T., Rao, D.S.P., and Battese, G.E. (1999) An Introduction to Efficiency and Productivity Analysis. Kluwer Academic Publishers. Fare, R., Grosskopf, S. (1996) Intertemporal Production Frontiers: With Dynamic DEA. Kluwer Academic Publishers. Golany, B., and Roll, Y. (1989) An application procedure for DEA. OMEGA, Vo. 17, No. 3, 237-250. Gudmundsson S. V. (1998) New-entrant airlines’ life-cycle analysis: Growth, decline and collapse. Journal of Air Transportation Management, Vol. 4, No. 4, 217-228. Lewin, A. Y., and Minton, J. W. (1986) Determining organization effectiveness: Another look and an agenda for research. Management Science, Vol. 32, No. 5, 514-538 Oum, T. H., and Yu, C. (1998) An analysis of profitability of the world’s major airlines. Journal of Air Transportation Management, Vol. 4, No. 4, 229-237. Oum, T. H., and Yu, C. (1994) Economic efficiency of railways and implications for public policy: A comparative study of the OECD countries’ railways. Journal of Transport Economics and Policy, Vol. 28, No. 2, 121-138. Parker, D. (1999) The performance of BAA before and after privatization – A DEA study. Journal of Transport Economics and Policy, Vol. 33, No. 2, 133-146. Sarkis, J. (2000) An analysis of operational efficiency of major airports in the United States. Journal of Operations Management, Vol. 18, No. 3, 335-351.
Journal of the Eastern Asia Society for Transportation Studies, Vol. 6, pp. 752 - 767, 2005
766

Scheraga, C. (2004) Operational efficiency versus financial mobility in the global airline industry: a data envelopment and Tobit analysis. Transpn. Res.-A, Vol. 38, 383-404. Sengupta, J. K. (1999) A dynamic efficiency model using data envelopment analysis, Int. Journal of Production Economics, Vol. 62, No. 3, 209-218. Tofallis, C. (1997) Input efficiency profiling: An application to airlines. Computers & Operations Research, Vol. 24, No. 3, 253-258. Windle, R. J., and Dresner, M. E. (1992) Partial productivity measures and total factor productivity in the air transport industry: Limitations and uses. Transpn. Res.-A, Vol. 26, No. 6, 435-445.
Journal of the Eastern Asia Society for Transportation Studies, Vol. 6, pp. 752 - 767, 2005
767