Embed Size (px)
Citation preview
Effects on Seed Prices of Proposed Mergers and Acquisitions Among Biotechnology Firms
Aleksandre Maisashvili Henry Bryant
J. Marc Raulston George Knapek
Joe Outlaw James Richardson
Correspondencetobesentto:HenryBryant,2124TAMU,DepartmentofAgriculturalEconomics,TexasA&MUniversity,CollegeStation,TX,77843-2124,telephone:979-845-5913,fax:979-845-3140,email:[email protected]
Submissiondate:September20,2016
Abstract
This research examines the likely effects on prices in agricultural seed markets of proposed mergers: DuPont with Dow and Monsanto with Bayer. These markets feature poor contestability, and we therefore apply a method of estimating likely price changes under the assumption of no new entry. We find expected increases in seed prices of 2.3% for corn, 1.9% for soybeans, and 18.2% for cotton. Additionally, changes in seed market concentration that would result from the proposed mergers meet Department of Justice and Federal Trade Commission criteria such that they are considered “likely to enhance market power” for corn and cotton.
1
Effects on Seed Prices of Proposed Mergers and Acquisitions Among Biotechnology Firms
1. Introduction
This research analyzes price effects in the seed markets for corn, soybean, and cotton of two
proposed mergers: DuPont/Pioneer with Dow, and Monsanto with Bayer1. We review the
literature regarding the changes that have occurred in agricultural input markets over the last
several years, and relevant concepts from industrial organization theory. We apply a model of
changes in price markups (above the marginal cost of production) caused by merger/acquisition
under the assumption of no new entry to quantify expected price changes. We additionally
characterize the changes in concentration that would result from the proposed mergers.
In the following section, we outline technological changes and rising concentration in
agricultural seed and chemical industries, emerging trends in market concentration, and how the
mergers and acquisitions further intensified market concentration. In the third section, we discuss
the concept of market contestability, particularly as it relates to the agricultural seed and
chemical industries. In the fourth section, we present the methodology that we use to analyze the
price impacts of the proposed mergers. In the fifth section, we discuss the data employed and list
their sources. In the sixth section, we calculate changes in Herfindahl-Hirschman Index values
that would result from the proposed mergers. In the seventh section, we apply the methodology
to the proposed DuPont/Pioneer-Dow merger in the corn and soybean seed markets and the
proposed Monsanto-Bayer merger in the seed market for cotton.
1The proposed union of Bayer and Monsanto is sometimes referred to as an acquisition and other times as a merger. We use the term merger for consistency with the DuPont-Dow proposal and to reduce verbosity.
2
2. Background
In the past few decades, one of the most noticeable changes in U.S. agriculture has been in
agricultural input markets. The unprecedented growth in yields and agricultural total factor
productivity were due to biological innovations in crop seeds, development of hybrid crops with
adoption of high-yielding varieties, and modern biotechnology. Development of new types of
pesticides and seeds have substantially improved agricultural productivity (Fernandez-Cornejo
2004; Fernandez-Cornejo and Just 2007). Agricultural input markets have evolved, and family–
owned and other small businesses transformed into larger enterprises that integrated plant
breeding, conditioning, production, marketing, and other functions. These dramatic changes have
raised significant concerns regarding market power and its influence on agriculture, in general
(Fernandez-Cornejo 2004; Fernandez-Cornejo and Just 2007).
Along with industry evolution, there has been a rapid growth in private research and
development, which shifted the roles of public research and development. Thus, research the
agricultural input industry became predominantly private, and private firms have transformed
from small scale operations to large and integrated enterprises (Fernandez-Cornejo and
Schimmepfenning, 2004). However, a relatively recent study conducted by Fuglie et al. (2012)
shows that increased consolidation and concentration in the private seed industry over the past
decade have slowed down the intensity of private research undertaken on crop biotechnology
relative to what would have occurred without consolidation, at least for corn, cotton, and
soybeans. As found by Schimelpfenning et al. (2004), patents and concentration are substitutes,
meaning more concentration is associated with fewer patents. As the input market became
increasingly concentrated and firms developed market power, they had fewer competitors from
which to protect their intellectual property.
3
2.1. Market Concentration
Over the last two decades, global market concentration (the share of global industry sales
earned by the largest firms) has increased in the crop seed/biotechnology and agricultural
chemical industries (Fuglie et al. 2012). These industries also invest heavily in research.
Currently, the largest four firms in each of these industries account for more than 50% of global
market sales. Growth in global market concentration over 1994-2013 was most rapid in the crop
seed industry, where the market share of the four largest firms more than doubled from 21% to
58%.
These firms increased their market dominance through expanding their sales faster than
the industry average or by through mergers and acquisitions of other firms (Fuglie et al. 2012).
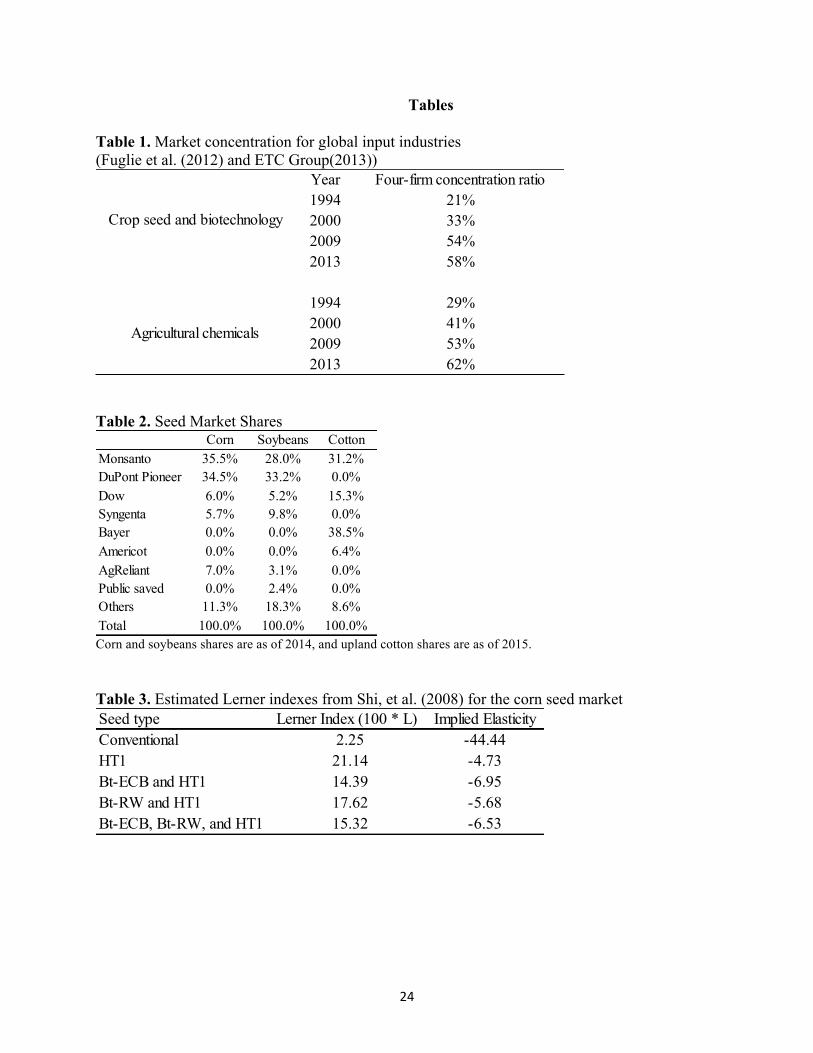
Table 1 outlines how four-firm concentration has changed over time in agricultural seed and
chemical industries. The enormous growth in the concentration mainly came from acquisitions of
other firms.
As outlined by Fernandez-Cornejo and Schimmelpfenning (2004), due to the
development and rapid producer acceptance of hybrid seeds and greater protection of intellectual
property rights, the amount of private capital devoted to the seed industry and the number of
private firms engaged in plant breeding grew rapidly until peaking in the early 1990s. Later, seed
industry consolidation became widespread, with fewer firms capable of investments in research
sufficient to develop new seed varieties. This resulted in increased concentration, with the
majority of seed sales controlled by four large firms. The share of U.S. seed sales controlled by
the four largest firms providing seed of each crop reached 91% for cotton, 82% for corn, and
76% for soybeans in 2014-2015. One contrast to this general trend was wheat, with more than
70% of the planted wheat coming from varieties developed in the public sector (Heyenga 1998).
4
2.2. Mergers and Acquisitions
Over the last two decades, the big companies (i.e. Monsanto, DuPont) have led the way
with massive investments in biotechnology research and with seed and biotechnology company
mergers and acquisitions.
As described by Fuglie et al. (2012), historically, the seed-biotechnology companies have
been dependent on small and medium scale companies as major sources of innovation. The new
small and medium-sized enterprises were specializing in developments of genetic traits, new
research, or a combination of both. Most of these new entries occurred in the late 1970s and
early 1980s, and in the late 1990s and early 2000s. However, in the last several years, exits of
small and medium-sized enterprises have outweighed new entry. By 2010, there were less than
30 active small and medium-sized enterprises that were specializing in crop biotechnology. The
main reason of disappearance of these companies was acquisition by larger firms (Fuglie et al.
2012). Fernandez-Cornejo and Just (2007) find a positive link between pesticide productivities
and concentration. They discuss that as the productivity derived from improvements of pesticides
and seeds has increased, the concentration of these input industries has also increased. In the
1960s, over 70 basic manufacturers of pesticides were operating in the United States, but
mergers and acquisitions have combined those firms into roughly eight major multinational
manufacturers. Hubbard (2009) backs up the aforementioned arguments, and he points out that
because of the enormous amount of mergers and acquisitions that expanded agricultural
biotechnology, many smaller companies could not compete with large firms that owned much of
the genetic resource base in seed. Also, licensing genetics from these firms was costly. He finds
that at least 200 independent seed companies have been lost in the thirteen years prior to 2009.
Moreover, biotechnology research demands financial resources that most smaller firms do not
5
have. Large firms investing in these technologies and earning royalties from licensing
agreements quickly achieved a market advantage that led to numerous buy-outs (Hubbard, 2009).
There are several factors that can explain increased merging and acquisitions among agricultural
input firms.
One reason discussed in the literature is intellectual property rights (IPRs). Lesser (1998)
studied the relationships between IPRs and agricultural biotechnology industry concentration. He
argues that IPRs have significant impacts on firm entry, and they make vertical integration in
downstream industries essentially necessary, creating financial incentives for downstream
mergers and acquisitions. He concludes that IPRs have significant structural impacts in
agricultural biotechnology. In addition, Heyenga (1998) discusses that chemical companies have
vertically integrated into the seed and biotechnology industries. As he explains, the goal of such
integration was to capture profits from biotechnology innovations which, in some cases, are also
complementary to their chemical technology. In addition, these moves are an effort by the
chemical companies to defend themselves against their competitors’ moves. Moreover, Heyenga
(1998) argues that as a result of acquisitions the increasing dominance of a few major players
and the biotechnology and chemical patent restrictions on what competitors can do, raised
questions arise regarding the potential for too much market power in parts of the seed and
chemical industries.
Other motivations for increased mergers and acquisitions are economies of scale and
scope. As explained by Fulton and Giannakas (2001), economies of scale and scope mean that
larger and diversified firms have lower average costs, which gives a clear incentive for firms to
get large. Moreover, those that do not get large are vulnerable to being driven out of the market
by larger and more cost efficient firms. As mentioned by Fulton and Giannakas (2001),
6
economies of scale and scope are created as a result of investment in non-rival goods; intellectual
property is an example of a non-rival good.
Howard (2009) describes the details on how agricultural chemical and seed industries
consolidated and came to be controlled by just six large multinational corporations. Until
recently, these big corporations were focused on mainly producing agrochemicals. He points out
that agrochemical corporations were experiencing declining profit opportunities as a result of
increased regulations and fewer markets in which to expand. Therefore, these companies decided
to build on their existing relationships with farmers to enter into another, and more profitable
input industry, the seed market. As explained by Matson et al. (2014), the main motivation was
to grant full patent protections on soon-to-be commercialized transgenic seeds and the
expectation of strong government enforcement of these monopolies. Howard (2009) further
stresses that the big companies did not focus on outcompeting already established seed firms, but
by acquiring them. Each of these acquisitions not only expanded the market share, but also added
to these companies’ seed distribution resources. The agrochemical companies bought hundreds
of independent biotechnology and seed companies, and they also merged with one another. The
outcome was that the number of big multinational companies was reduced to just six, which
intensified the agricultural input industry consolidation further.
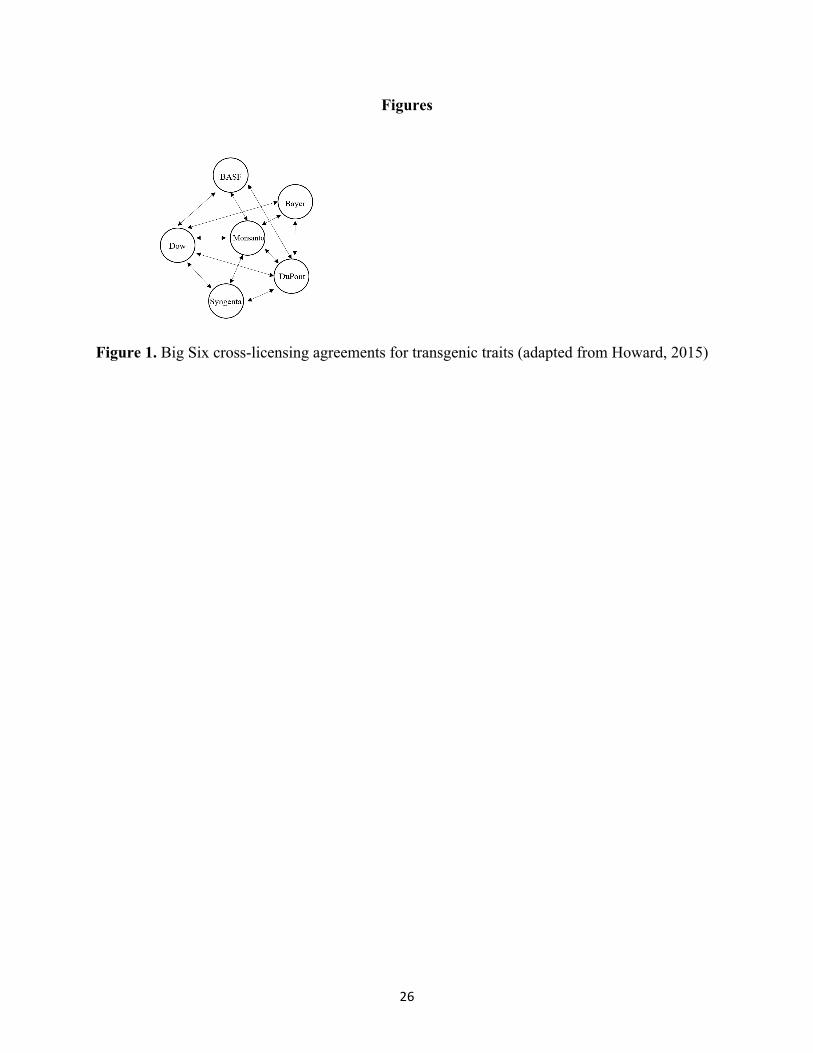
Figure 1 is adapted from Howard (2015) and shows cross-licensing agreements involving
pharmaceutical/chemical companies for transgenic seed traits. These arrangements among the
big six agrochemical-seed companies are sometimes referred to as “non-merger mergers”, as
there is no change in the ownership, but they nonetheless raise important questions regarding
cartel behavior and market dominance.
7
From figure 1, we can see that Monsanto has a central position in this network. As
explained by Howard (2015), the entire outcome is similar to formation of a cartel that excluded
other competitors and potential entrants, implying that many remaining small firms either must
join the big six, or go out of business. This suggests a substantial barrier to new entry in the
markets for transgenic seed.
3. Contestability
A market is contestable if there is freedom of entry and exit into the market and there are little to
no sunk costs. Because of the threat of new entrants, existing companies in a contestable market
must behave in a reasonably competitive manner, even if they are few in number.
Concentrated markets do not necessarily imply the presence of market power (Fulton and
Giannakas, 2001; Henrickson and Heffernan, 2007). Key requirements for market contestability
are: (a) Potential entrants must not be at a cost disadvantage to existing firms, and (b) entry and
exit must be costless. For entry and exit to be costless or near costless, there must be no sunk
costs. If there were low sunk costs, then new firms would use a hit and run strategy. In other
words, they would enter an industry, undercut the price, and exit before the existing firms have
time to retaliate. However, if there are high sunk costs, firms would not be able to exit without
losing a significant portion of their investment. Therefore, if there are high sunk costs, hit-and-
run strategies are less profitable, firms keep prices above average costs, and markets are not
contestable. In this case, market power is a concern. Fulton and Giannakas (2001) outline that
substantial sunk costs exist in agricultural biotechnology, and firms charge prices above marginal
costs. They stress the seed and chemical industry is not contestable and the threat of entry
cannot be relied upon to keep profits at normal levels.
8
3.1. Barriers to entry
Comanor (1964) and Scherer (1984) both suggest that rapidly evolving and costly
agricultural biotechnology innovations tend to limit entry. King (2001) points out that
investments in agricultural input markets are often risky, expensive, and long-term. Additionally,
he discusses that intellectual property protection in the seed industry helps inventors exercise
market power and prevents the entry of imitators and competitors. A similar argument was
supported by Barton (1998) as well.
Ollinger and Fernandez-Cornejo (1998) examine sunk costs and regulation in the U. S.
pesticide industry. Using data over the 1972-89 period, they find that research costs and pesticide
regulation costs negatively affect the number of companies in the industry, and that smaller firms
are affected more strongly by these costs than are larger firms.
Harl (2000) points out that existing patent and plant variety protection may mean that
potential competitors are frozen out of competition as a practical matter for the duration of the
patent. The author further stresses that smaller firms are unable to maintain access to higher
performing germplasm, and most of these firms would not be able to survive economically.
Howard (2009) also mentions high expenditure costs and argues that developing transgenic traits
and identifying gene sequences creates a strong barrier to entry for smaller firms.
Brennan et al. (1999) point out that the cost of obtaining permission to use patented
technology or genetic material prevents smaller firms from participating in innovative research
and creates significant barriers to entry. Hubbard (2009) also supported the argument and
discussed that there is a financial disincentive to seek access to patented material to expand
research because of costly royalties and onerous licensing agreements with patent owners, some
9
of which have led to lawsuits. This reality serves as a major barrier to new companies entering
the plant breeding industry.
Boyd (2003) and Glenna and Cahoy (2009) discuss that agrochemical–seed firm
relationships are not always cooperative, and they have filed numerous lawsuits against each
other. As pointed out by the authors, these lawsuits create “patent thickets,” in which broad
claims overlap. Such thickets make it difficult to bring a product to market without potentially
infringing on a patent, thus creating a significant barrier to entry for small firms.
Moretti (2006) points out that even though the original purpose of patents was to
encourage innovation, the increased concentration and intellectual property congestion had an
opposite effect. He argues that multinational agrochemical companies have growing control over
essential proprietary technologies and created a barrier to entry for new start-ups.
3.2. Recent Evidence Regarding the Effects of Market Structure on Agricultural Input Prices
If a market was contestable, existing firms would behave in a more or less competitive
manner. Thus, if the market is highly profitable, this may suggest that an industry is less
contestable. According to Yahoo Finance, the aforementioned six multinational companies
reported multimillion dollar profits in the years of 2013-2015.
Fuglie et al. (2012) discusses that market power resulting from the structural changes in
agricultural input industries make farmers pay higher prices for purchased inputs. Shand (2012)
also discusses that from 1994-2010, seed prices in the U.S. increased more than any other farm
input, more than doubling relative to the prices farmers received for their harvested crops.
Hubbard (2015) stressed that with a diminished ability to save seeds and fewer options in
the market, the price of seeds has increased as much as 30% annually in recent years,
10
significantly higher than the rate of inflation. In addition, Howard (2015) emphasizes that
transgenic seeds frequently require the purchase of proprietary inputs such as glyphosate
herbicides, and this precedent is even being extended to non-transgenic seeds. These impacts
have served to increase the profits and market capitalization of dominant firms, and they have
also reduced options for farmers. This argument was discussed when Just and Heuth (1993)
projected that chemical companies would develop biological innovations that increase
dependence on the chemicals that they sell.
In summary, large sunk research costs and intellectual property protections create
substantial barriers to new entry in these markets, and they are therefore not contestable. Prices
for seed and some other agricultural inputs have consequently increased in recent years.
4. Methodology
In this section, we briefly review some available methods for analyzing the price effects of
proposed mergers, and then describe the Hausman method that we employ in some detail. This
method is appropriate for markets with differentiated goods and the assumption of no new entry.
We additionally briefly describe the microeconomic theory we use to calibrate, using available
econometric evidence, the own and cross-price elastiticities of demand that we require.
Several methods have been proposed in the literature to study competitive analysis with
differentiated products. Werden and Froeb (1994) used a logit model and assumed Nash
equilibrium in prices and constant marginal costs to study the impact of mergers in differentiated
products industries. However, this approach has been criticized by Hausman (2010). In
particular, this method assumes that market shares are indicative of consumers’ second choices
only if the “independence of irrelevant alternatives” (IIA) property holds for consumer demand.
11
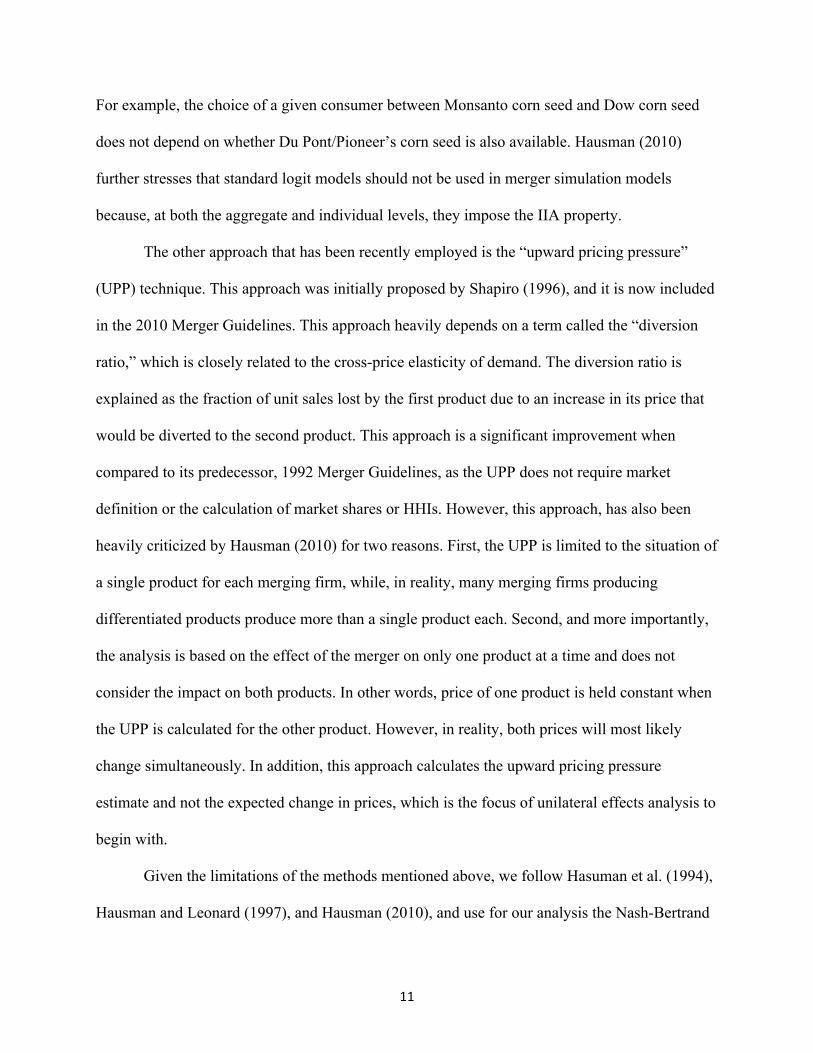
For example, the choice of a given consumer between Monsanto corn seed and Dow corn seed
does not depend on whether Du Pont/Pioneer’s corn seed is also available. Hausman (2010)
further stresses that standard logit models should not be used in merger simulation models
because, at both the aggregate and individual levels, they impose the IIA property.
The other approach that has been recently employed is the “upward pricing pressure”
(UPP) technique. This approach was initially proposed by Shapiro (1996), and it is now included
in the 2010 Merger Guidelines. This approach heavily depends on a term called the “diversion
ratio,” which is closely related to the cross-price elasticity of demand. The diversion ratio is
explained as the fraction of unit sales lost by the first product due to an increase in its price that
would be diverted to the second product. This approach is a significant improvement when
compared to its predecessor, 1992 Merger Guidelines, as the UPP does not require market
definition or the calculation of market shares or HHIs. However, this approach, has also been
heavily criticized by Hausman (2010) for two reasons. First, the UPP is limited to the situation of
a single product for each merging firm, while, in reality, many merging firms producing
differentiated products produce more than a single product each. Second, and more importantly,
the analysis is based on the effect of the merger on only one product at a time and does not
consider the impact on both products. In other words, price of one product is held constant when
the UPP is calculated for the other product. However, in reality, both prices will most likely
change simultaneously. In addition, this approach calculates the upward pricing pressure
estimate and not the expected change in prices, which is the focus of unilateral effects analysis to
begin with.
Given the limitations of the methods mentioned above, we follow Hasuman et al. (1994),
Hausman and Leonard (1997), and Hausman (2010), and use for our analysis the Nash-Bertrand
12
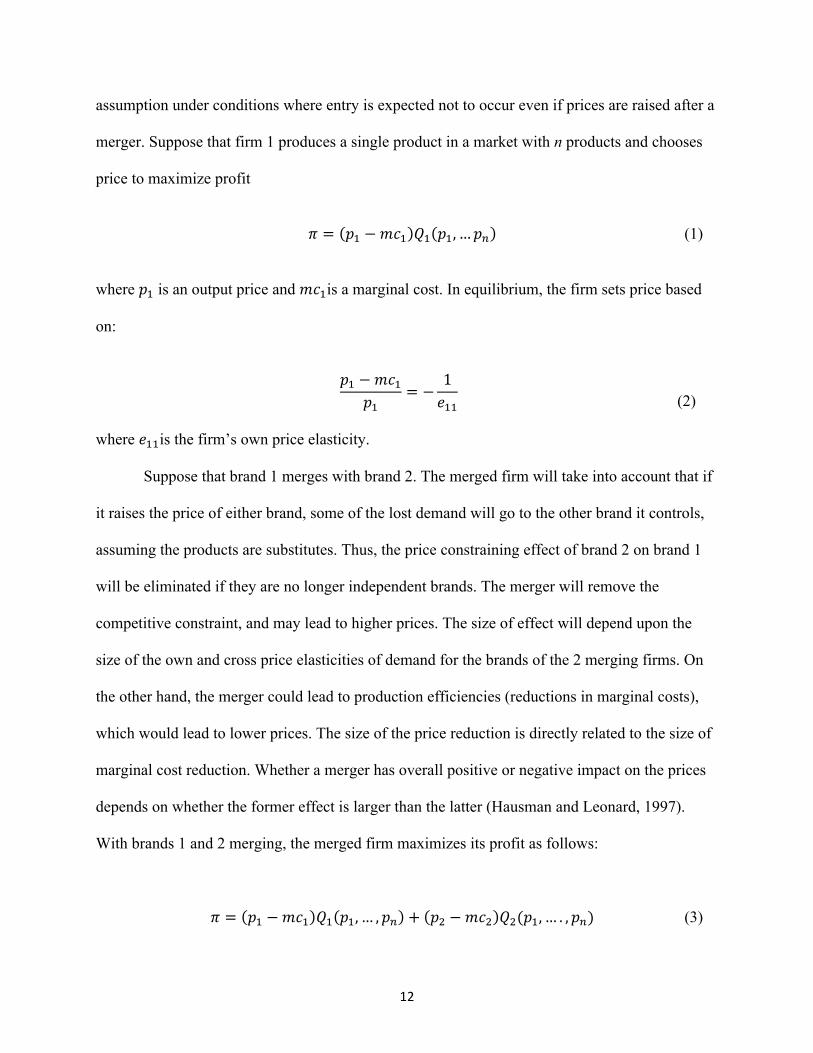
assumption under conditions where entry is expected not to occur even if prices are raised after a
merger. Suppose that firm 1 produces a single product in a market with n products and chooses
price to maximize profit
! = !! −!!! !! !!,…!! (1)
where !! is an output price and !!!is a marginal cost. In equilibrium, the firm sets price based
on:
!! −!!!
!!= − 1
!!!
(2)
where !!!is the firm’s own price elasticity.
Suppose that brand 1 merges with brand 2. The merged firm will take into account that if
it raises the price of either brand, some of the lost demand will go to the other brand it controls,
assuming the products are substitutes. Thus, the price constraining effect of brand 2 on brand 1
will be eliminated if they are no longer independent brands. The merger will remove the
competitive constraint, and may lead to higher prices. The size of effect will depend upon the
size of the own and cross price elasticities of demand for the brands of the 2 merging firms. On
the other hand, the merger could lead to production efficiencies (reductions in marginal costs),
which would lead to lower prices. The size of the price reduction is directly related to the size of
marginal cost reduction. Whether a merger has overall positive or negative impact on the prices
depends on whether the former effect is larger than the latter (Hausman and Leonard, 1997).
With brands 1 and 2 merging, the merged firm maximizes its profit as follows:
! = !! −!!! !! !!,… ,!! + !! −!!! !!(!!,… . ,!!) (3)
13
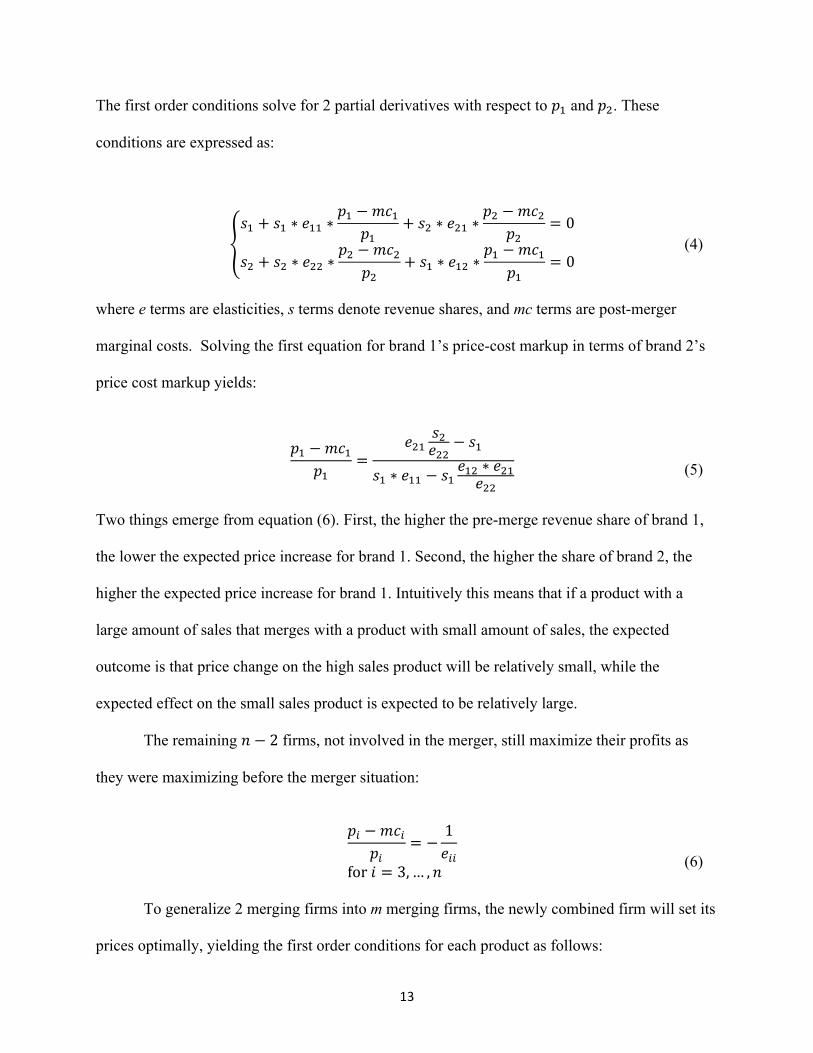
The first order conditions solve for 2 partial derivatives with respect to !! and !!. These
conditions are expressed as:
!! + !! ∗ !!! ∗!! −!"!
!!+ !! ∗ !!" ∗
!! −!"!!!
= 0
!! + !! ∗ !!! ∗!! −!"!
!!+ !! ∗ !!" ∗
!! −!"!!!
= 0
(4)
where e terms are elasticities, s terms denote revenue shares, and mc terms are post-merger
marginal costs. Solving the first equation for brand 1’s price-cost markup in terms of brand 2’s
price cost markup yields:
!! −!"!
!!=
!!" !!!!! − !!!! ∗ !!! − !! !!" ∗ !!"!!!
(5)
Two things emerge from equation (6). First, the higher the pre-merge revenue share of brand 1,
the lower the expected price increase for brand 1. Second, the higher the share of brand 2, the
higher the expected price increase for brand 1. Intuitively this means that if a product with a
large amount of sales that merges with a product with small amount of sales, the expected
outcome is that price change on the high sales product will be relatively small, while the
expected effect on the small sales product is expected to be relatively large.
The remaining ! − 2 firms, not involved in the merger, still maximize their profits as
they were maximizing before the merger situation:
!! −!!!
!!= − 1
!!!
for ! = 3,… ,!
(6)
To generalize 2 merging firms into m merging firms, the newly combined firm will set its
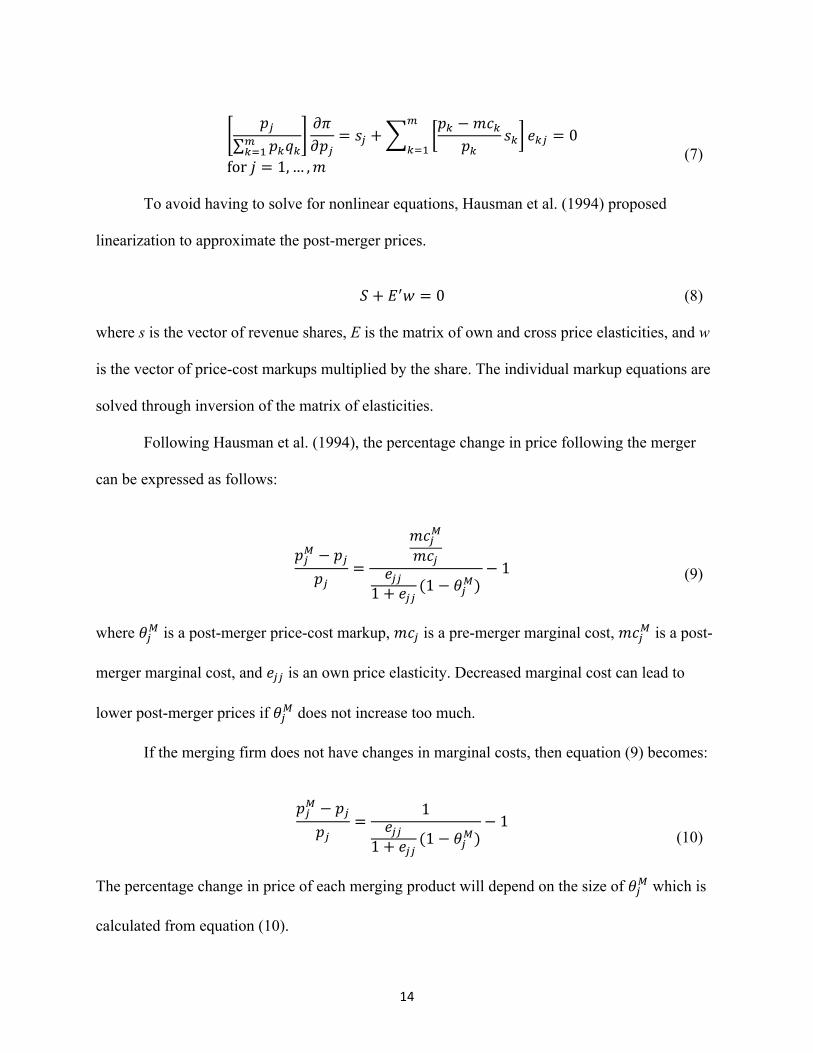
prices optimally, yielding the first order conditions for each product as follows:
14
!!
!!!!!!!!
!"!!!
= !! +!! −!!!
!!!! !!"
!
!!!= 0
for ! = 1,… ,!
(7)
To avoid having to solve for nonlinear equations, Hausman et al. (1994) proposed
linearization to approximate the post-merger prices.
! + !!! = 0 (8) where s is the vector of revenue shares, E is the matrix of own and cross price elasticities, and w
is the vector of price-cost markups multiplied by the share. The individual markup equations are
solved through inversion of the matrix of elasticities.
Following Hausman et al. (1994), the percentage change in price following the merger
can be expressed as follows:
!!! − !!!!
=!!!!!!!
!!!1+ !!! (1− !!
!)− 1
(9)
where !!! is a post-merger price-cost markup, !!! is a pre-merger marginal cost, !!!! is a post-
merger marginal cost, and !!! is an own price elasticity. Decreased marginal cost can lead to
lower post-merger prices if !!! does not increase too much.
If the merging firm does not have changes in marginal costs, then equation (9) becomes:
!!! − !!
!!= 1
!!!1+ !!! (1− !!
!)− 1
(10)
The percentage change in price of each merging product will depend on the size of !!! which is
calculated from equation (10).
15
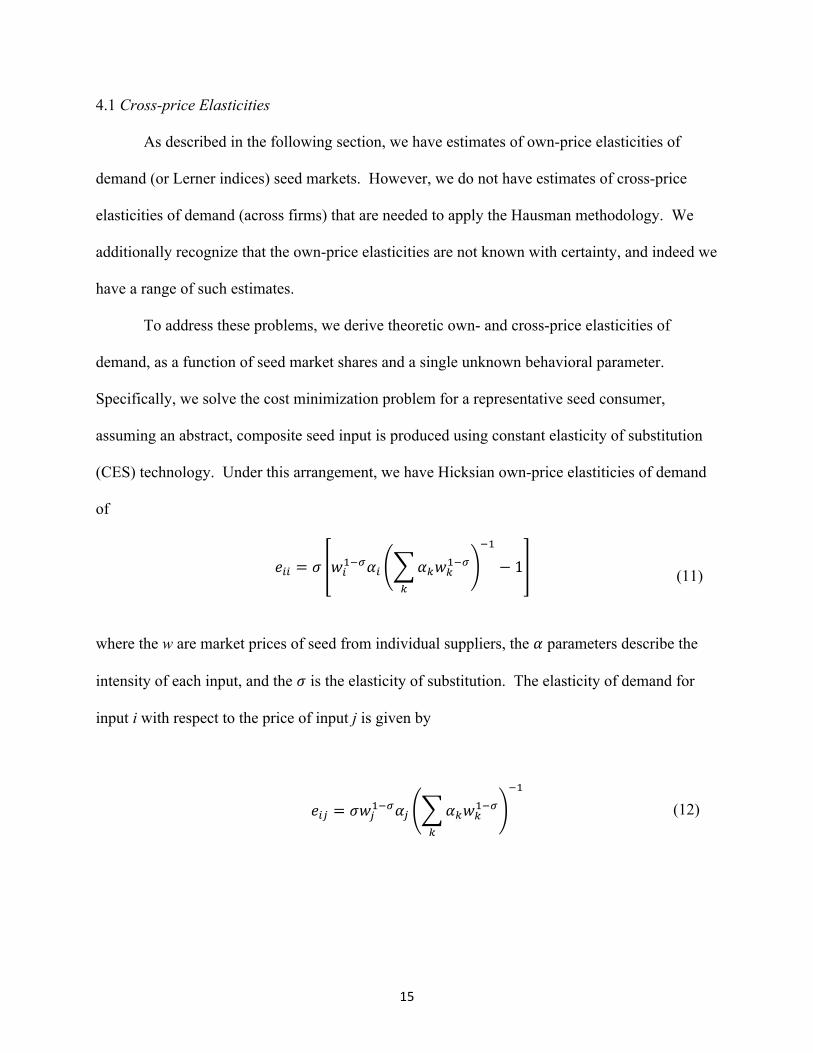
4.1 Cross-price Elasticities
As described in the following section, we have estimates of own-price elasticities of
demand (or Lerner indices) seed markets. However, we do not have estimates of cross-price
elasticities of demand (across firms) that are needed to apply the Hausman methodology. We
additionally recognize that the own-price elasticities are not known with certainty, and indeed we
have a range of such estimates.
To address these problems, we derive theoretic own- and cross-price elasticities of
demand, as a function of seed market shares and a single unknown behavioral parameter.
Specifically, we solve the cost minimization problem for a representative seed consumer,
assuming an abstract, composite seed input is produced using constant elasticity of substitution
(CES) technology. Under this arrangement, we have Hicksian own-price elastiticies of demand
of
!!! = ! !!!!!!! !!!!!!!
!
!!
− 1
(11)
where the w are market prices of seed from individual suppliers, the ! parameters describe the
intensity of each input, and the ! is the elasticity of substitution. The elasticity of demand for
input i with respect to the price of input j is given by
!!" = !!!!!!!! !!!!!!!!
!!
(12)

16
Given a value for !, input cost shares si for each input from an observed equilibrium, and
assuming all input prices are one2, the ! parameters are calibrated as
!! = !! !!!/!!
!!
(13)
4.2 Simulations
We conduct a simulation exercise, with each trial consisting of the following series of
steps:
1. We draw a random value for the ! parameter from a distribution that generates a
resulting range of own-price elasticities consistent with econometric evidence described
in the data section below.
2. We use the value for ! from step 1, observed market shares described in the data section
below, and equations 14 through 16 to calculate commensurate own- and cross-price
elasticities.
3. We use the elasticites for the merging firms from step 2 in equation 13 to calculate a
percentage change in seed prices due to the merger.3
We then characterize the distribution of possible post-merger price increases using values across
all trials.
2Allowing arbitrary quantity units for seed facilitates the assumption that all prices are one. This approach is typical in Computable General Equilibrium modeling. 3Note that using equation 10 rather than equation 9 implies that marginal costs do not change as a result of the merger. The primary marginal cost associated with seed production, transgenic or otherwise, is simply the cultivation cost, which will scale approximately linearly with quantity produced. Mergers in this industry may well produce reductions in fixed costs (e.g., trait development), but are not likely to substantially reduce the marginal costs of seed production.
17
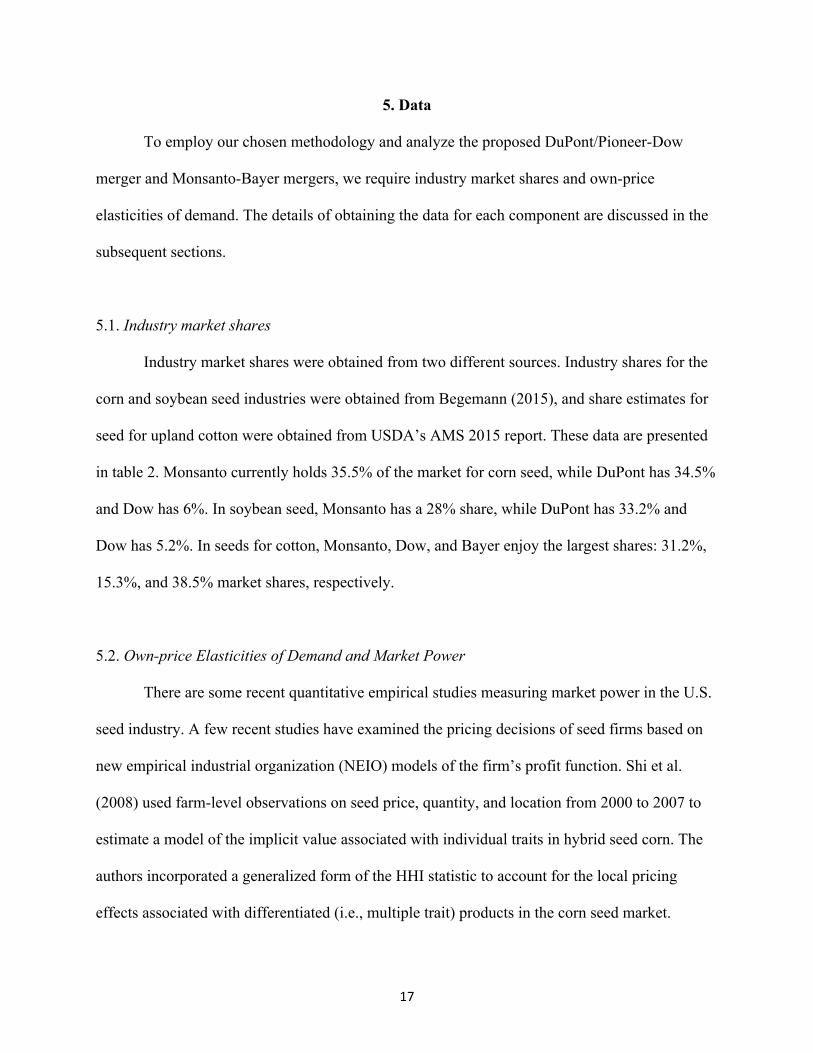
5. Data
To employ our chosen methodology and analyze the proposed DuPont/Pioneer-Dow
merger and Monsanto-Bayer mergers, we require industry market shares and own-price
elasticities of demand. The details of obtaining the data for each component are discussed in the
subsequent sections.
5.1. Industry market shares
Industry market shares were obtained from two different sources. Industry shares for the
corn and soybean seed industries were obtained from Begemann (2015), and share estimates for
seed for upland cotton were obtained from USDA’s AMS 2015 report. These data are presented
in table 2. Monsanto currently holds 35.5% of the market for corn seed, while DuPont has 34.5%
and Dow has 6%. In soybean seed, Monsanto has a 28% share, while DuPont has 33.2% and
Dow has 5.2%. In seeds for cotton, Monsanto, Dow, and Bayer enjoy the largest shares: 31.2%,
15.3%, and 38.5% market shares, respectively.
5.2. Own-price Elasticities of Demand and Market Power
There are some recent quantitative empirical studies measuring market power in the U.S.
seed industry. A few recent studies have examined the pricing decisions of seed firms based on
new empirical industrial organization (NEIO) models of the firm’s profit function. Shi et al.
(2008) used farm-level observations on seed price, quantity, and location from 2000 to 2007 to
estimate a model of the implicit value associated with individual traits in hybrid seed corn. The
authors incorporated a generalized form of the HHI statistic to account for the local pricing
effects associated with differentiated (i.e., multiple trait) products in the corn seed market.
18
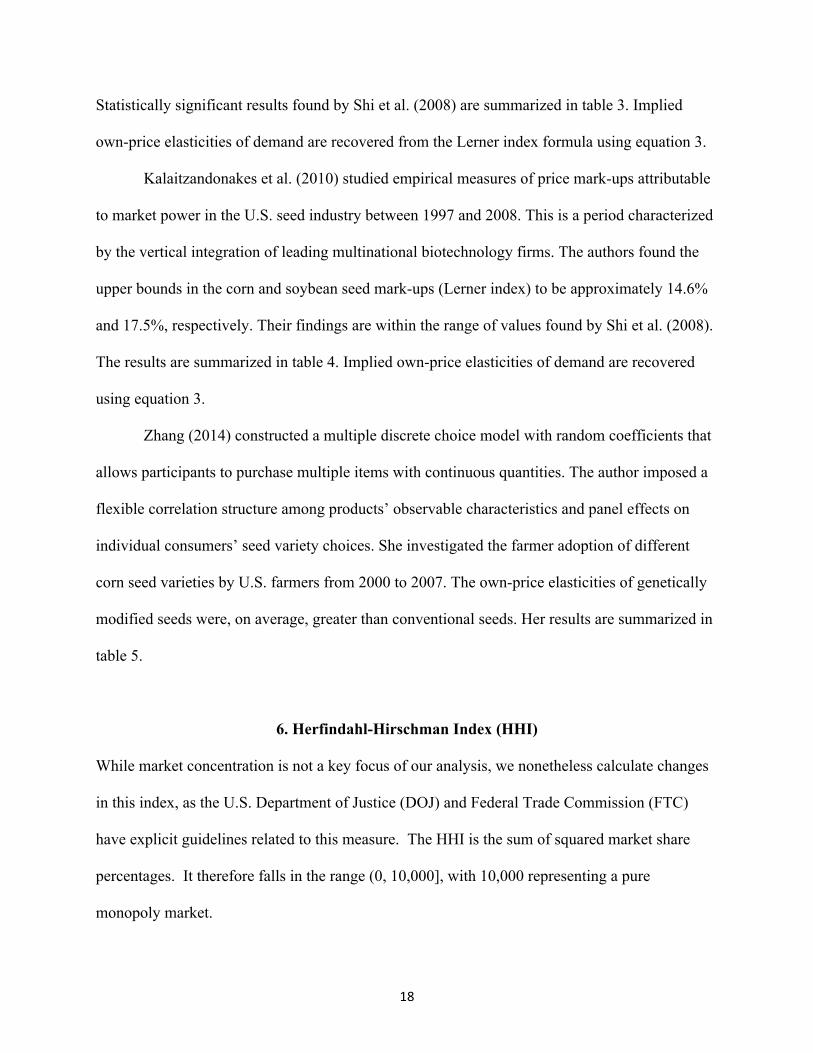
Statistically significant results found by Shi et al. (2008) are summarized in table 3. Implied
own-price elasticities of demand are recovered from the Lerner index formula using equation 3.
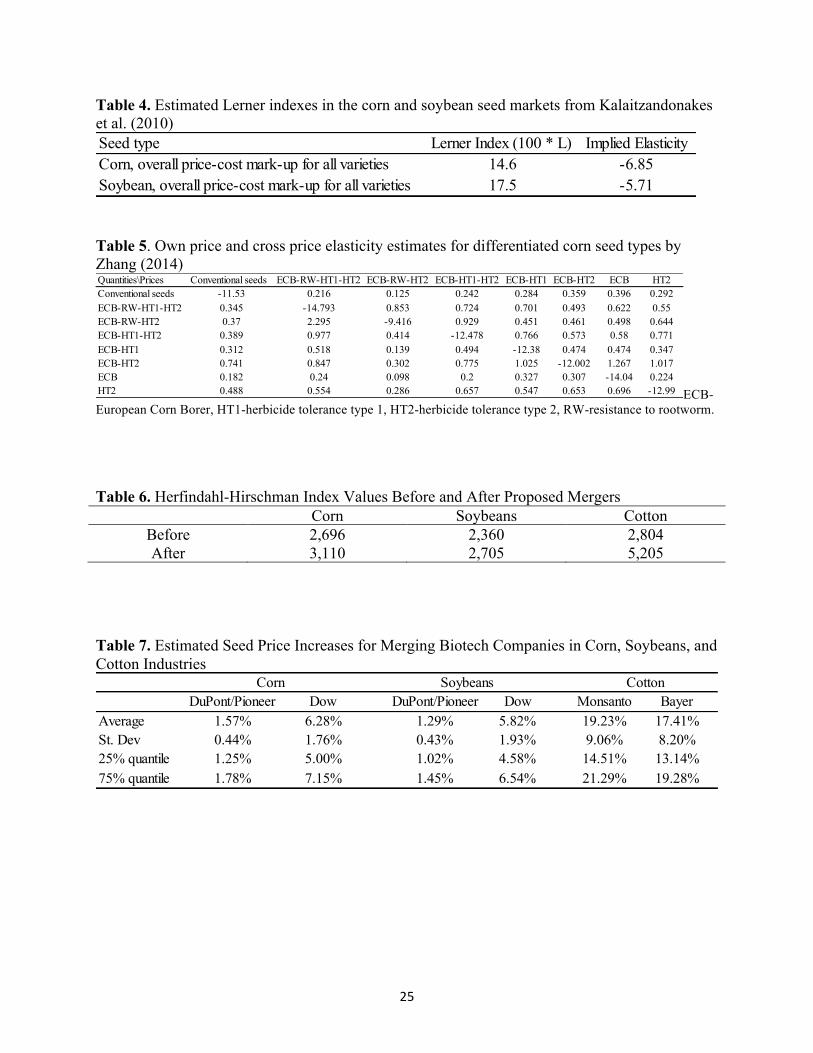
Kalaitzandonakes et al. (2010) studied empirical measures of price mark-ups attributable
to market power in the U.S. seed industry between 1997 and 2008. This is a period characterized
by the vertical integration of leading multinational biotechnology firms. The authors found the
upper bounds in the corn and soybean seed mark-ups (Lerner index) to be approximately 14.6%
and 17.5%, respectively. Their findings are within the range of values found by Shi et al. (2008).
The results are summarized in table 4. Implied own-price elasticities of demand are recovered
using equation 3.
Zhang (2014) constructed a multiple discrete choice model with random coefficients that
allows participants to purchase multiple items with continuous quantities. The author imposed a
flexible correlation structure among products’ observable characteristics and panel effects on
individual consumers’ seed variety choices. She investigated the farmer adoption of different
corn seed varieties by U.S. farmers from 2000 to 2007. The own-price elasticities of genetically
modified seeds were, on average, greater than conventional seeds. Her results are summarized in
table 5.
6. Herfindahl-Hirschman Index (HHI)
While market concentration is not a key focus of our analysis, we nonetheless calculate changes
in this index, as the U.S. Department of Justice (DOJ) and Federal Trade Commission (FTC)
have explicit guidelines related to this measure. The HHI is the sum of squared market share
percentages. It therefore falls in the range (0, 10,000], with 10,000 representing a pure
monopoly market.
19
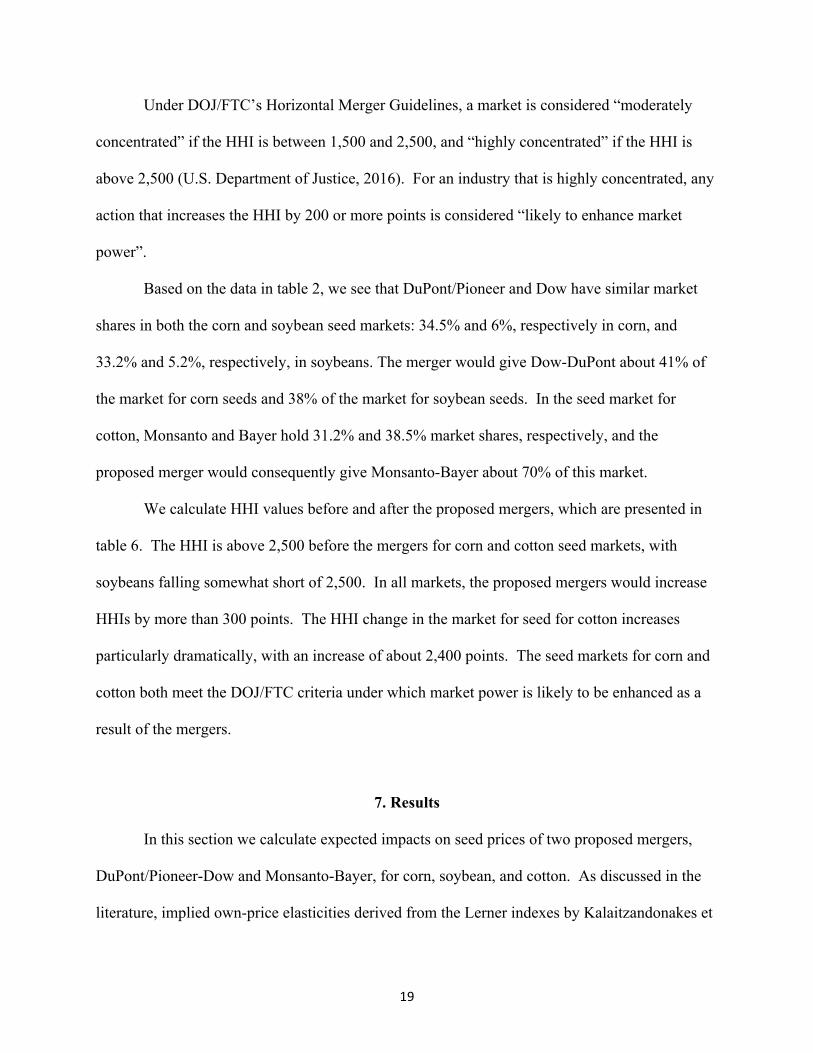
Under DOJ/FTC’s Horizontal Merger Guidelines, a market is considered “moderately
concentrated” if the HHI is between 1,500 and 2,500, and “highly concentrated” if the HHI is
above 2,500 (U.S. Department of Justice, 2016). For an industry that is highly concentrated, any
action that increases the HHI by 200 or more points is considered “likely to enhance market
power”.
Based on the data in table 2, we see that DuPont/Pioneer and Dow have similar market
shares in both the corn and soybean seed markets: 34.5% and 6%, respectively in corn, and
33.2% and 5.2%, respectively, in soybeans. The merger would give Dow-DuPont about 41% of
the market for corn seeds and 38% of the market for soybean seeds. In the seed market for
cotton, Monsanto and Bayer hold 31.2% and 38.5% market shares, respectively, and the
proposed merger would consequently give Monsanto-Bayer about 70% of this market.
We calculate HHI values before and after the proposed mergers, which are presented in
table 6. The HHI is above 2,500 before the mergers for corn and cotton seed markets, with
soybeans falling somewhat short of 2,500. In all markets, the proposed mergers would increase
HHIs by more than 300 points. The HHI change in the market for seed for cotton increases
particularly dramatically, with an increase of about 2,400 points. The seed markets for corn and
cotton both meet the DOJ/FTC criteria under which market power is likely to be enhanced as a
result of the mergers.
7. Results
In this section we calculate expected impacts on seed prices of two proposed mergers,
DuPont/Pioneer-Dow and Monsanto-Bayer, for corn, soybean, and cotton. As discussed in the
literature, implied own-price elasticities derived from the Lerner indexes by Kalaitzandonakes et
20
al. (2010) and Shi et al. (2008), and empirically estimated own-price elasticities found by Zhang
(2014) were in the range of -12% and -5%. Following CES production function framework
discussed above, we chose the ! parameter values that would generate the own-price elasticities
of demand in the range of -12% and -5%. For simulating the ! parameter, we specify a GRKS
distribution. The GRKS is a parametric, piece-wise linear probability distribution function
similar to the triangular distribution, that has been used extensively in applied simulation studies
(Richardson et al. 2007a, 2007b; Palma et al., 2011; Monge et al., 2014). The distribution is fully
characterized by minimum, expected, and maximum values. However, the assumed minimum
and maximum values in the GRKS represent the 2.5% and 97.5% quantiles, respectively,
whereas for the triangular distribution, they represent the lower and upper bounds of the domain.
Hence, in contrast to the triangular distribution, the GRKS allows the random variable to take on
values slightly below and slightly above the assumed minimum and maximum, respectively, with
low probabilities of occurrence.
7.1. DuPont/Pioneer-Dow Merger in Corn and Soybean Markets
We calculated the impacts of the proposed merger between DuPont/Pioneer and Dow in
corn and soybean industries. We did not study the impacts of the proposed Monsanto-Bayer
merger in the corn and soybean seed markets given that Bayer does not participate in corn and
soybean seed markets.
We calculated the change in price for the merging seed products using the methodology
described in section 4. The estimated results from the simulation are summarized in table 7.
Assuming no changes in the marginal costs, we find that the estimated price increases in both
markets would be modest. In corn, average price increases are estimated to be 1.57% and 6.3%.
21
Interquartile range values indicate that there is a 75% chance that the DuPont-Dow merger price
increases would be less than or equal to 1.78% and 7.15%.
In soybeans, the results are almost identical. Assuming no changes in the marginal costs,
the estimated price increases would be quite small. The average price increases are estimated to
be 1.29% and 5.82%. Interquartile range values show that there is a 75% chance that the DuPont-
Dow merger price increases would be less than or equal to 1.45% and 6.54%. The market-share
weighted expected price increased 2.3% for corn seed and 1.9% for soybean seed.
7.2. Monsanto-Bayer Merger in Seed Market for Cotton
We did not analyze the effects on the seed market for cotton of the proposed DuPont-
Dow merger given that DuPont has a 0% share in this market. We calculated the change in prices
for the merger and the estimated results are summarized in table 7. Assuming no changes in
marginal costs, we find that the estimated price increases would be quite large. The average price
increases by Monsanto and Bayer are estimated to be 19.2% and 17.4%, respectively.
Interquartile range values indicate that there is a 75% chance that the Monsanto and Bayer would
increase their prices by more than 14.5% and 13.1%, respectively. The market-share weighted
expected increase in market price for seed for cotton is 18.2%.
7.3. Implications of Seed Price Increase on Corn, Soybean, and Cotton Producers
To study the implications of projected seed price increases on corn, soybean, and cotton
producers, we consulted 2016 enterprise budgets published by the extension institutions. For
corn and soybean industries we used Iowa State University Extension and Outreach documents
(Iowa State Extension and Outreach, 2016), and, for dryland and irrigated cotton producers, we
22
consulted Texas A&M AgriLife Extension’s enterprise budgets (Texas A&M Agrilife Extension,
2016). Soybean seed and corn seed account for about 31.4% and 31.5% of total variable costs.
Cotton seeds costs account about 10% and 17% of total variable cost expenses for irrigated and
dryland cotton producers, respectively. Using the results from table 7, this implies approximately
0.72%, 0.6%, 1.82%, and 3.09% variable cost increases for corn, soybean, irrigated cotton, and
dryland cotton producers.
8. Conclusions
Over the past few decades, development of new types of pesticides and seeds have
substantially improved agricultural productivity. Agricultural input markets have evolved and
family owned and small businesses gave way to larger enterprises. This evolution in the industry
was coupled with increasing market concentration in seed and chemical supply. The
agrochemical companies bought hundreds of independent biotechnology and seed companies and
merged with one another. This has resulted in an industry that is comprised primarily of six large
multinational firms.
Agricultural input markets are not likely to be contestable. Increased concentration by
few firms overseeing the major processes by which genetic manipulation occurs enables them to
control the technologies to block use by other firms. In addition, there are substantial sunk costs,
including intellectual property cross-licensing and R&D expenditures, which are a substantial
barrier to new entry in these markets. The market power resulting from the structural changes in
agricultural input industries make farmers pay higher prices for purchased inputs. Seed prices in
the U.S. have increased by larger percentages than other farm inputs in recent years.
The proposed DuPont/Pioneer-Dow merger would increase market concentration by
about 414 HHI points, from 2696 to 3110, in the corn seed market. In the soybean seed market,
23
the merger would increase the concentration by 345 HHI points, from 2360 to 2705. These
values imply that the DOJ/FTC Horizontal Merger Guidelines would consider the
DuPont/Pioneer-Dow merger likely to enhance market power in the corn seed market. Expected
seed price increases in both markets are projected to be modest. In corn, the market-share
weighted expected price increase is 2.3%. Interquartile range values indicate that there is a 25%
chance that the DuPont-Dow merger average price increases for corn seed would be greater than
or equal to 2.6%. In soybeans, the results are similar; assuming no changes in marginal costs, the
market-share weighted expected price increases is 1.9%, and interquartile range values indicate
that there is a 25% chance that the DuPont-Dow merger average soybean seed price increase
would be greater than or equal to 2.1%.
The Monsanto-Bayer merger is projected to substantially increase seed prices for cotton.
The merger would give Monsanto-Bayer about 70% of the market. The merger would increase
market concentration by about 2400 HHI points, from 2804 to 5205. This high starting HHI
value and the dramatic increase easily qualifies the proposed Monsanto-Bayer merger as likely to
enhance market power in the seed market for cotton under DOJ/FTC merger guidelines. The
market-share weighted expected price increase is 18.2%. Interquartile range values indicate that
there is a 25% chance that Monsanto and Bayer would increase their seed prices for cotton by
more than 20.2%.
24
Tables
Table 1. Market concentration for global input industries (Fuglie et al. (2012) and ETC Group(2013))
Table 2. Seed Market Shares
Corn and soybeans shares are as of 2014, and upland cotton shares are as of 2015. Table 3. Estimated Lerner indexes from Shi, et al. (2008) for the corn seed market
Year Four-firm concentration ratio1994 21%2000 33%2009 54%2013 58%
1994 29%2000 41%2009 53%2013 62%
Crop seed and biotechnology
Agricultural chemicals
Corn Soybeans CottonMonsanto 35.5% 28.0% 31.2%DuPont Pioneer 34.5% 33.2% 0.0%Dow 6.0% 5.2% 15.3%Syngenta 5.7% 9.8% 0.0%Bayer 0.0% 0.0% 38.5%Americot 0.0% 0.0% 6.4%AgReliant 7.0% 3.1% 0.0%Public saved 0.0% 2.4% 0.0%Others 11.3% 18.3% 8.6%Total 100.0% 100.0% 100.0%
Seed type Lerner Index (100 * L) Implied ElasticityConventional 2.25 -44.44HT1 21.14 -4.73Bt-ECB and HT1 14.39 -6.95Bt-RW and HT1 17.62 -5.68Bt-ECB, Bt-RW, and HT1 15.32 -6.53
25
Table 4. Estimated Lerner indexes in the corn and soybean seed markets from Kalaitzandonakes et al. (2010)
Table 5. Own price and cross price elasticity estimates for differentiated corn seed types by Zhang (2014)
ECB-European Corn Borer, HT1-herbicide tolerance type 1, HT2-herbicide tolerance type 2, RW-resistance to rootworm. Table 6. Herfindahl-Hirschman Index Values Before and After Proposed Mergers
Corn Soybeans Cotton Before 2,696 2,360 2,804 After 3,110 2,705 5,205
Table 7. Estimated Seed Price Increases for Merging Biotech Companies in Corn, Soybeans, and Cotton Industries
Seed type Lerner Index (100 * L) Implied ElasticityCorn, overall price-cost mark-up for all varieties 14.6 -6.85Soybean, overall price-cost mark-up for all varieties 17.5 -5.71
Quantities\Prices Conventional seeds ECB-RW-HT1-HT2 ECB-RW-HT2 ECB-HT1-HT2 ECB-HT1 ECB-HT2 ECB HT2Conventional seeds -11.53 0.216 0.125 0.242 0.284 0.359 0.396 0.292ECB-RW-HT1-HT2 0.345 -14.793 0.853 0.724 0.701 0.493 0.622 0.55ECB-RW-HT2 0.37 2.295 -9.416 0.929 0.451 0.461 0.498 0.644ECB-HT1-HT2 0.389 0.977 0.414 -12.478 0.766 0.573 0.58 0.771ECB-HT1 0.312 0.518 0.139 0.494 -12.38 0.474 0.474 0.347ECB-HT2 0.741 0.847 0.302 0.775 1.025 -12.002 1.267 1.017ECB 0.182 0.24 0.098 0.2 0.327 0.307 -14.04 0.224HT2 0.488 0.554 0.286 0.657 0.547 0.653 0.696 -12.99
DuPont/Pioneer Dow DuPont/Pioneer Dow Monsanto BayerAverage 1.57% 6.28% 1.29% 5.82% 19.23% 17.41%St. Dev 0.44% 1.76% 0.43% 1.93% 9.06% 8.20%25% quantile 1.25% 5.00% 1.02% 4.58% 14.51% 13.14%75% quantile 1.78% 7.15% 1.45% 6.54% 21.29% 19.28%
Corn Soybeans Cotton
26
Figures
Figure 1. Big Six cross-licensing agreements for transgenic traits (adapted from Howard, 2015)
27
References
Barton, J.H. 1998. The impact of contemporary patent law on plant biotechnology research. In S.A. Eberhart, H.L. Shands, W. Collins, & R.L. Lower (Eds.), Intellectual property rights III, global genetic resources: Access and property rights. Madison, WI: CSSA.
Begemann, S. 2015. Seed Competition Heats Up. Available at:
http://www.agweb.com/article/seed-competition-heats-up-naa-sonja-gjerde/ Boyd, W. 2003. Wonderful potencies? Deep structure and the problem of monopoly in
agricultural biotechnology. In: R.A. Schurman and D. Kelso, editors, Engineering trouble: Biotechnology and its discontents. Univ. California Press, Berkeley, CA. p. 24–62.
Brennan, M.F., C. E. Pray, and A. Courtmanche. 1999. Impact of Industry Concentration on
Innovation in the U.S. Plant Biotech Industry. Rutgers University Department of Agricultural, Food and Resource Economics, working paper.
Comanor, W.S. 1964. Research and competitive product differentiation in the pharmaceutical
industry in the United States. Economica 31: 372-84. ETC Group. 2013. Putting the Cartel before the Horse…. and Farm, Seeds, Soil, Peasants, etc.
ETC Group Communique #111. Available at: http://www.etcgroup.org/sites/www.etcgroup.org/files/CartelBeforeHorse11Sep2013.pdf
Fernandez-Cornejo, J., and R.E. Just. 2007. Researchability of modern agricultural input markets
and growing concentration. American Journal of Agricultural Economics 89(5): 1269-1275. Fernandez-Cornejo., and D. Schimelpfenning. 2004. Have Seed Industry Changes Affected
Research Effort? Amber Waves 2(1): 14-19. Fuglie, K., P. Haisey., J. King., and D. Schimmelpfenning. 2012. Rising Concentration in
Agricultural Input Industries Influences New Farm Technologies. USDA ERS Report. Available at: http://www.ers.usda.gov/amber-waves/2012-december/rising-concentration-in-agricultural-input-industries-influences-new-technologies.aspx#.V37C5fkrJhF
Fulton, M., and K. Giannakas. 2001. Agricultural biotechnology and industry structure.
AgBioForum 4(2): 137-151. Glenna, L.L., and D.R. Cahoy. 2009. Agribusiness concentration, intellectual property, and the
prospects for rural economic benefits from the emerging biofuel economy. S. Rural Soc. 24:111–129.
Harl, N.E., 2000. The age of contract agriculture: consequences of concentration in input supply.
Journal of Agribusiness 18: 115–127.
28
Hausman, J.A., G. Leonard., and D. Zona. 1994. “Competitive Analysis with Differentiated Products.” Annales, D'Economie et de Statistique 34:159-180.
Hausman, J. A., and G.K. Leonard. 1996. “Economic Analysis of Differentiated Products
Mergers Using Real World Data.” Geo. Mason L. Rev: 5: 321-343. Hausman, J. A. 2010. “2010 Merger Guidelines: Empirical Analysis.” The Antitrust Source. Hayenga, M. 1998. Structural change in the biotech seed and chemical industrial complex.
AgBioForum 1(2): 43-55. Hendrickson, M., and W. Heffernan. 1999. Consolidation in the Food and Agriculture System.
Washington, DC: Report to the National Farmers Union. Available at: http://www.foodcircles.missouri.edu/whstudy.pdf
Howard, P.H. 2009. Visualizing consolidation in the global seed industry: 1996–2008.
Sustainability 1(4): 1266-1287. Howard, P.H. 2015. Intellectual property and consolidation in the seed industry. Crop Science
55(6): 2489-2495. Hubbard, K. 2009. Farmers face the consequences of a consolidated seed industry. The Farmer to
Farmer Campaign. Iowa State University Extension and Outreach. 2016. Estimated Costs of Crop Production in
Iowa – 2016. Available at: https://www.extension.iastate.edu/agdm/crops/html/a1-20.html Just, R.E., D.L. Hueth. 1993. Multimarket exploitation: the case of biotechnology and chemicals.
American Journal of Agricultural Economics 75: 936–945. Kalaitzandonakes, N., A. Maginer., and D. Miller. 2010. A Worrisome Crop. Regulation 33: 20-
26. King, J. L. 2001. Concentration and technology in agricultural input industries. U.S. Department
of Agriculture. Lesser, W. 1998. Intellectual property rights and concentration in agricultural biotechnology.
AgBioForum 1(2): 56-61. Matson, J., M. Tang, and S. Wynn. 2014. Seeds, patents and power: The shifting foundation of
our food system. Social Science Electronic Publishing, Inc. Available at: http://ssrn.com/abstract=2525120
Monge, J. J., L.A. Ribera., J.L. Jifon., J.A. da Silva., and J.W. Richardson. 2014. Economics and
uncertainty of lignocellulosic biofuel production from energy cane and sweet sorghum in South Texas. Journal of Agricultural and Applied Economics 46(4): 457-485.
29
Moretti, I. M. 2006. Tracking the trend towards market concentration: The case of the
agricultural input industry. In United Nations Conference on Trade and Development: Geneva, Switzerland.
Ollinger, M. and J. Fernandez-Cornejo. 1998. Sunk costs and regulation in the U. S. pesticide
industry. International Journal of Industrial Organization 16: 139-168. Palma, M.A., Richardson, J.W., Roberson, B.E., Ribera, L.A., Outlaw, J.L., & Munster, C. 2011. Economic feasibility of a mobile fast pyrolysis system for sustainable bio-crude oil production. International Food and Agribusiness Management Review 14(3): 1–16. Richardson, J.W., B. Herbst., J. Outlaw., and C. Gill, II. 2007a. Including Risk inEconomic
Feasibility Analyses: The Case of Ethanol in Texas. Journal of Agribusiness 25(2): 115-132.
Richardson, J.W., W. Lemmer., and J. Outlaw. 2007b. Bio-Ethanol Production from Wheat in
the Winter Rainfall Region of South Africa: A Quantitative Risk Analysis. International Food and Agribusiness Management Review 10(2): 181-204.
Scherer, F.M. 1984. Innovation and growth: Schumpeterian perspectives, Cambridge, MA:
Massachusetts Institute of Technology Press. Schimmelpfenning, D.E., C.E. Pray., and M.F. Brennan. 2004. The impact of seed industry
concentration on innovation: a study of U. S. biotech market leaders. Agricultural Economics 30: 157-167.
Shand, H. 2012. The Big Six: A profile of corporate power in seeds, agrochemicals & biotech.
The Heritage Farm Companion 10-15. Shapiro C. 1995. “Mergers with Differentiated Products.” Antitrust: 10:23. Shi, G., J.-P. Chavas., and K. Stiegert. 2008. An Analysis of Bundling: The Case of the Corn
Seed Market. Staff Paper 529, Department of Agricultural and Applied Economics, University of Wisconsin-Madison, 2008.
Texas A&M Agrilife Extension. 2016. Estimated Costs and Returns per Acre. Available at:
http://agecoext.tamu.edu/files/2016/01/2016D2CottonPivot.pdf USDA, AMS. 2015. Cotton Varieties Planted 2015 Crop. Available at:
https://www.ams.usda.gov/mnreports/cnavar.pdf U.S. Department of Justice, 2016. “Herfindahl-Hirsxhman Index,” web page accessed August
19, 2016. https://www.justice.gov/atr/herfindahl-hirschman-index.
30
Werden, G.J., and L.M. Froeb. 1994. “The Effects of Mergers in Differentiated Products Industries: Logit Demand And Merger Policy.” Journal of Law, Economics, & Organization: 407-426.
Zhang, W. 2014. Product Differentiation Choices and Biotechnology Adoption: The U.S. Corn
Seed Market. Doctoral Dissertation, University of Wisconsin-Madison.