Embed Size (px)
Citation preview

SME Annual Meeting Feb. 22-Feb. 25, 2009, Denver, CO
1 Copyright © 2009 by SME
Preprint 09-019
EFFECTS OF WEATHERING AND ALTERATION ON POINT LOAD AND SLAKE DURABILITY INDICES OF QUESTA MINE MATERIALS, NEW MEXICO
G. F. Ayakwah, New Mexico Inst. Of Mining and Tech., Socorro, NM
V. T. McLemore, New Mexico Bureau of Geology and Mineral Resources, Socorro, NM A. Fakhimi, New Mexico Inst. Of Mining and Tech., Socorro, NM
V. C. Viterbo, FMI, Morenci, AZ A. K. Dickens, New Mexico Bureau of Geology and Mineral Resources, Socorro, NM
ABSTRACT
Point load strength (Is50) and slake durability (ID2) indices provide a measure of the strength and durability of rock fragments and are related to the alteration intensity and frictional resistance of the materials. Samples were collected from the rock piles, alteration scars and debris flows at the Questa mine with the purpose of examining relationships between Is50 and ID2, mineralogy, chemistry, weathering, hydrothermal alteration, and other geotechnical parameters. The Is50 from the various rock piles ranges from 0.6-8.2 MPa and the ID2 ranges from 80.9-99.5%. The Is50 and ID2 results indicate that the samples from the debris flows are stronger (average Is50= 4.0 MPa and ID2= 98.4%) than the rock-pile samples and that the alteration scar samples are weaker (average Is50 = 2.8 MPa and ID2 = 89.2%) than the rock-pile samples, but still most of these rocks are strong in terms of their Is50 and ID2. The Is50 decreases as the degree of alteration increases in some rock pile and alteration scar samples, but not in all. However, the majority of the rock fragments within the rock piles still indicate high strength, even after 25-40 years of weathering.
INTRODUCTION
Point load strength and slake durability indices are two important geotechnical parameters that can be used in characterizing the strength of rock fragments and their durability to weathering. The point load strength index is one of several suitable methods used to determine the intact rock strength. Because point load strength testing can be applied to irregular rock samples, it is suitable for studying weathered rocks, many of which cannot be easily machined into regular shaped samples because they are too fractured or friable. The slake durability test was developed to evaluate the influence of alteration on rocks by measuring their resistance to deterioration and breakdown when subjected to wetting and drying cycles. The purpose of this study is 1) to determine how point load strength and slake durability indices are affected by chemistry and mineralogy of rocks and 2) to determine the effect of weathering and alteration of the Questa mine materials on these indices.
The durability of rocks can be described as their resistance to breakdown under weathering conditions over time. Slaking occurs from the swelling of clay minerals in rocks when in contact with water. The slake durability index provides a measure of durability. It gives quantitative information on the mechanical behavior of rocks according to the amount of clay and other secondary minerals produced in them due to exposure to weathering (Fookes et al., 1972).
Many researchers have studied the point load strength of rocks and have tried to show correlations between the point load strength index and other geotechnical parameters (D’Andrea et al., 1964 ; Broch and Franklin, 1972; Bieniawski, 1975 ; Hassani et al., 1980; Gunsallus and Kulhawy, 1984 and Panek and Fannon, 1992). The work of Franklin and Chandra (1972), Rodrigues (1991), and Dick and Shakoor (1995) suggest that slaking of rocks is also an important consideration in evaluating the engineering behavior of rock mass and
rock materials in geotechnical practices. Dick and Shakoor (1995) emphasized the fact that durability is an important rock characteristic parameter controlling the stability of natural and man-made slopes. Dhakal et al. (2002) indicated that the slaking behavior of a rock has a major influence on rock failure. Johnson and DeGraff (1988) and Cetin et al. (2000) explained that nondurable behavior of rocks is a result of the long- and short-term influences of chemical weathering; this indicates how necessary it is to assess weathering and to determine the mineralogy and textural properties of rocks when assessing the slaking property. Dick and Shakoor (1995) explained that slake durability is an important parameter that affects the stability of natural and man-made slopes consisting of mudrocks. Dhakal et al. (2002) stated that the slaking behavior of pyroclastic (similar to the Questa volcanic rocks) and sedimentary rocks can play a major role in slope failure. Nevertheless, very few studies of rock piles evaluate point load and slake durability tests with respect to mineralogy, chemistry and other geotechnical parameters of the tested rocks. Actual slake durability and point load indices from researchers such as Quine (1993) reported point load indices for some rock pile samples collected in Nevada that ranged from 2.9 to 4.6 MPa, while the slake durability indices ranged from 88 to 99% with an additional single value of 6%. Samples from the Eskihisar lignite mine in Turkey (Gökçeoglu et al., 2000) had slake durability indices ranging from 88.7 to 96.8%, and rock pile material from a marble mine in India had slake durability indices ranging from 89.9 to 97.0% (Maharana, 2005).
LOCATION AND SITE DESCRIPTION
The Questa molybdenum mine (operated by Cheveron Mining Inc, formerly Molycorp, Inc.) is located 5.6 km (3.5 miles) from Questa, between Questa and Red River, in the western part of the Taos Range of the Sangre de Cristo Mountains, in Taos County, northern New Mexico (Fig. 1). The mine is on a south-facing slope of an east-west trending ridgeline in the Red River Valley at an elevation of approximately 2438 m (8000 ft) (URS Corporation, 2003).
Associated with the mine are nine rock piles that were formed by blasting of the overburden (material overlying the ore deposit), transported by truck, and dumped by end-haul methods over the edge of the slope into steep valleys near the Questa open pit (URS Corporation, 2003, Appendix C). End-haul dumping results in a rock pile that consists of numerous layers of clay to gravel rock material. At the top of the rock pile, the rock material tends to be matrix supported and finer in particle size, whereas towards the base of the rock pile, the material tends to be coarser grained and clast supported (McLemore et al., 2005, 2006a, b). The resulting layers locally are at, or near, the angle of repose and subparallel to the original slope angle. Detailed geologic mapping and sampling in the Goathill North (GHN) rock pile at Questa revealed that these layers could be defined as mappable stratigraphic units in the trenches and drill holes that were cut into the rock pile (McLemore et al., 2005, 2006a, b). The overburden that became apart of the rock piles was fractured, and upon blasting, resulted in angular rock fragments. The overburden was

SME Annual Meeting Feb. 22-Feb. 25, 2009, Denver, CO
2 Copyright © 2009 by SME
hydrothermally altered before mining (McLemore et al., 2008b). The mineralogical and chemical variations that occurred during hydrothermal alteration before mining are greater than the variations found during weathering of the rock-pile materials after mining.
Figure 1. Location map of the Questa molybdenum mine.
The Goat Hill North (GHN) rock pile is one of nine rock piles created during open-pit mining and contains approximately 10.6 million metric tons of overburden material with slopes similar to the original steep, mountainous topography. GHN was divided into two areas: a stable area and an unstable area. The unstable area had crept down slope since its construction. Chevron Mining, Inc. stabilized this rock pile by removing material off the top portion of both areas to the bottom of the pile (Norwest Corporation, 2003). This regrading decreased the slope angle, reduced the load, and created a buttress to prevent movement of the rock pile. During the progressive down-cutting of the top of the stable portion of GHN (regrading), trenches were constructed to examine, map, and sample the internal geology of the rock pile. End-dumping generally results in the segregation of materials with the finer-grained material at the top and coarser-grained material at the base. The resulting layers locally are at, or near, the angle of repose and subparallel to the original slope angle. Detailed geologic mapping and sampling revealed that these layers could be defined as mappable geologic units in the rock pile (Fig. 2). Geologic units were defined on the basis of grain size, color, texture, stratigraphic position, and other physical properties that could be observed in the field (McLemore et al., 2005, 2006a, b). Units were correlated between benches and to opposite sides of each trench, and several units were correlated down slope through the excavated trenches.
Figure 2. Conceptual geological model of GHN rock pile, as interpreted from surface mapping, detailed geologic cross-sections, trenches, drill holes, construction method and observations during reclamation of GHN (McLemore et al., 2008a).
ALTERATION AND WEATHERING OF THE QUESTA ROCK PILES
Rock fragments in the Questa samples are comprised of two main lithologies, which are andesite and rhyolite (Amalia Tuff), both of which are hydrothermally altered. Intrusive rocks, although present within colluvium/weathered bedrock, alteration scar, debris flows and other rock piles, are minor to absent within the GHN rock pile. All three rock types exhibit original igneous textures, although the andesite fragments have typically undergone significant hydrothermal alteration, whereas the rhyolite (Amalia Tuff) fragments are relatively pristine or consisted of QSP (quartz, sericite/illite, pyrite) alteration. The rhyolite (Amalia Tuff) fragments consisted of large (~mm size) quartz and feldspar phenocrysts, surrounded by a devitrified glass matrix. Three types of alteration have been described at Questa, including propyllitic, QSP, and argillic alteration (McLemore et al., 2008b). Propylitic alteration consists of essential chlorite (producing the green color), epidote, albite, pyrite, quartz, carbonate minerals, and a variety of additional minerals. Argillic or clay alteration consists of kaolinite, smectite (montmorillonite clays), chlorite, epidote, and sericite and overlaps the other types of hydrothermal alteration. Phyllic or QSP (quartz-sericite-pyrite) alteration is defined by the predominance of quartz, sericite, and pyrite. QSP alteration typically is found as thin QSP veinlets cutting the host rock and as quartz, sericite, and pyrite replacing the groundmass and primary igneous minerals. Rough estimates of the intensity of these three alteration styles in the GHN rock pile were made petrographically (McLemore et al., 2008b).
The evidence for weathering in the Questa rock piles studied for this paper includes (McLemore et al., 2006a, b, 2008a):
• Change in color from darker brown and gray in less weathered samples (original color of igneous rocks) to yellow to white to light gray in the weathered samples
• Paste pH, in general, is low in oxidized, weathered samples and paste pH is higher in less weathered samples
• Presence of jarosite, gypsum, iron oxide minerals and Fe-soluble salts (often as cementing minerals), and low abundance to absence of calcite, pyrite, and epidote in weathered samples
• Tarnish or coatings of pyrite surfaces within weathered samples
• Dissolution textures of minerals (skeletal, boxwork, honeycomb, increase in pore spaces, fractures, change in mineral shape, accordion-like structures, loss of interlocking textures, pits, etching) within weathered samples (McLemore et al., 2008a)
• Chemical classification as potential acid-forming materials using acid base accounting methods (Tachie-Menson, 2006).
In GHN, typically, paste pH increased with distance from the outer, oxidized units (west) towards the interior units (east) of the GHN rock pile. The outer units were oxidized (weathered) based upon the white and yellow coloration, low paste pH, presence of jarosite and authigenic gypsum, and absence of calcite. The base of the rock pile adjacent to the bedrock/colluvium surface represents the oldest part of the rock pile because it was laid down first. Portions of the base appeared to be nearly or as oxidized (weathered) as the outer, oxidized zone of the rock pile. This suggests that air and water flowed along the basal interface, implying that it must be an active weathering zone.
A simple weathering index (SWI) was developed to differentiate the weathering intensity of Questa rock pile materials (SWI=1, fresh to SWI=5, most weathered; Table 1; Gutierrez et al., 2008). The 5 classes in Table 1 describes the SWI classification for the mine soils at the Questa mine based on relative intensity of both physical and chemical weathering (modified in part from Little, 1969; Gupta and Rao, 2001; Blowes and Jambor, 1990). The SWI accounts for changes in color, texture, and mineralogy due to weathering, but it is based on field descriptions. Some problems with this weathering index are:
• It is subjective and based upon field observations.

SME Annual Meeting Feb. 22-Feb. 25, 2009, Denver, CO
3 Copyright © 2009 by SME
• This index does not always enable distinction between pre-mining supergene hydrothermal alteration and post-mining weathering.
• The index is developed from natural residual soil weathering profiles, which typically weathered differently from the acidic conditions within the Questa rock piles and, therefore, this index may not adequately reflect the weathering conditions within the rock piles.
• This index refers mostly to the soil matrix; most rock fragments within the sample are not weathered except perhaps at the surface of the fragment and along cracks.
• The index is based primarily upon color and color could be indicative of other processes besides weathering intensity.
• This index was developed for the Questa rock piles and may not necessarily apply to other rock piles.
• Weathering in the Questa rock piles is an open not a closed system (i.e. water analysis indicates the loss of cations and anions due to oxidation).
Table 1. Simple weathering index for rock-pile material (including rock fragments and matrix) at the Questa mine.
SWI Name Description
1 Fresh
Original gray and dark brown to dark gray colors of igneous rocks; little to
no unaltered pyrite (if present); calcite, chlorite, and epidote common
in some hydrothermally altered samples. Primary igneous textures
preserved.
2 Least weathered
Unaltered to slightly altered pyrite; gray and dark brown; angular to sub-angular rock fragments; presence of chlorite, epidote and calcite, although
these minerals are not required. Primary igneous textures still partially
preserved.
3 Moderately weathered
Pyrite altered (tarnished and oxidized), light brown to dark orange
to gray: more clay- and silt-size material; presence of altered chlorite,
epidote and calcite, but these minerals are not required. Primary igneous textures rarely preserved.
4 Weathered
Pyrite very altered (tarnished, oxidized, and pitted); Fe-hydroxides and oxides present; light brown to
yellow to orange; no calcite, chlorite, or epidote except possibly within center of rock fragments (but the
absence of these minerals does not indicate this index), more clay-size material. Primary igneous textures
obscured.
5 Highly
weathered
No pyrite remaining; Fe-hydroxides and oxides, shades of yellow and red
typical; more clay minerals; no calcite, chlorite, or epidote (but the absence of these minerals does not indicate this index); angular to sub-
rounded rock fragments
Paste pH is another indication of weathering used in this project, but it has limitations as well. Paste pH is the pH measured from a paste or slurry that forms upon mixing soil material and deionized water. In an acidic material, paste pH is an approximate measurement of the acidity of a soil material that is produced by the oxidation of pyrite and other sulfides. A low paste pH (2-3) along with yellow to orange color and the presence of jarosite, gypsum, and low abundance to absence of calcite is consistent with oxidized conditions in the Questa rock piles (McLemore et al., 2006a, b; Gutierrez et al., 2008).
In general, paste pH increases from the outer, oxidized units of GHN to the inner, less oxidized units.
Changes of mineralogy and chemistry between the outer, oxidized zone and the interior, unoxidized zones of the rock piles are a result of differences due to pre-mining composition as well as chemical weathering. These differences can be difficult to distinguish, except by detailed field observations and petrographic analysis and the changes due to hydrothermal alteration are more pronounced than those due to weathering. Weathering processes, intensity, and rates will differ throughout the rock piles. Because weathering intensities and effects are so variable and dependent upon many factors, no single weathering index is valid over the entire spectrum of weathered states (Duzgoren-Aydin and Aydin, 2002). Therefore, several indices can be used to indicate some aspects of weathering in the Questa rock piles (McLemore et al., 2008a): SWI, paste pH, authigenic gypsum, sum of gypsum and jarosite, SO4, and Net NP (neutralizing potential).
FIELD AND ANALYTICAL METHODS
Sampling Samples were collected, located by GPS coordinates, bagged,
labled and transported to New Mexico Institute of Mining and Technology (NMIMT) and stored in a trailer. Samples consist of representative rock pieces, each weighing between 40-60 g (approximately 4-10 cm in dimension; more details are in Viterbo, 2007). Samples were collected specifically for examining relationships between slake durability and point load indices and mineralogy, chemistry, lithology, geotechnical parameters, and weathering-alteration. Several different types of samples were collected for point load and slake durability tests and included a range of lithologies, alteration assemblages, and weathering intensities:
• Rock fragments from rock-pile material that includes mixtures of different lithologies and alteration assemblages o Samples collected from the surface and from test pits in
the rock piles o Samples of the rock pile material collected from
trenches in GHN (5 ft channel or composite of selected layers)
• Outcrop samples of unweathered (or least weathered) igneous rocks representative of the mined rock (overburden) (includes all predominant lithologies and alteration assemblages at various hydrothermal alteration and weathering intensities) o andesite o quartz latite o rhyolite tuff (Amalia Tuff) o aplite, granitic porphyry o miscellaneous dike, flow, and tuffaceous rocks o material from alteration scars
• Rock-pile material that for this study includes only rock fragments that were o Samples collected from the surface and from test pits
throughout the rock piles o Samples of the rock pile material collected from
trenches in GHN (5 ft channel or composite of selected layers)
• Residual weathered soil profiles of colluvium/weathered bedrock, alteration scar, and debris flows
• Sections of drill-core samples of the mined rock (overburden) and ore deposit before mining
Different sampling strategies were employed based upon the purpose of each sampling task. Typically, at each site, the samples for this report consisted of grab samples of two or more pieces of rock-pile material, outcrop, or drill core samples (typically 3-8 cm in diameter). These samples are more homogeneous than a grab sample of rock-pile samples in that they are composed of one lithology and alteration assemblage, whereas the grab sample of rock-pile material typically consists of multiple lithologies and/or alteration assemblage. A portion of the collected sample was crushed and pulverized for geochemical

SME Annual Meeting Feb. 22-Feb. 25, 2009, Denver, CO
4 Copyright © 2009 by SME
analysis. Thin sections were made of another portion of selected rock samples for petrographic analysis, and another portion was used for the geotechnical testing. Rock pile locations are shown in Figure 1.
LABORATORY ANALYSIS
Point Load Test The point load test, developed by Broch and Franklin (1972) for
classifying and characterizing rock material, is a relatively simple test for estimating rock strength. The International Society of Rock Mechanics (ISRM) standardized and established it in 1985 and it has been used for geotechnical study for over twenty years (ISRM, 1985). The point load strength index can be used to predict other strength parameters because it correlates closely with uniaxial tensile and compressive strengths (Broch and Franklin, 1972; ISRM, 1985).
The equipment consists of a loading frame that measures the force required to split the sample and a system for measuring the distance between the two contact loading points. The point load test can be performed on rock samples with different shapes, both cylindrical (core) and irregular shapes, because the samples are placed between two pressure points and pressure is applied. The point load strength index (Is50) corresponding to a specimen of 0.05 m in diameter, is calculated using (ISRM, 1985):
FDPIs
e
×= 250 (1)
where P is the peak load, De is the equivalent core diameter, and F is a size correction factor (De/0.050)0.45. All samples are classified according to the classification index in Table 2.
Table 2. Point load strength index classification (Broch and Franklin, 1972).
Is50 (MPa) Strength classification < 0.03 Extremely low
0.03 – 0.1 Very low 0.1 – 0.3 Low 0.3 – 1.0 Medium 1.0 – 3.0 High 3.0 – 10 Very high
> 10 Extremely high
Slake Durability Test The slake durability test was developed by Franklin and Chandra
(1972), was recommended by the International Society for Rock Mechanics (ISRM, 1979), and standardized by the American Society for Testing and Materials (ASTM, 2001). The purpose of this test is to evaluate the influence of alteration (both hydrothermal and weathering) on rocks by measuring their resistance to deterioration and breakdown as simulated by being exposed to wetting and drying cycles. The slake durability index (ID2) is a measure of durability and provides quantitative information on the mechanical behavior of rocks according to the amount of clay and other secondary minerals produced in them due to exposure to climatic conditions (Fookes et al., 1971). The ID2 is obtained from:
1002 ×−−
=DB
DA
WWWW
ID (2)
where WB is the mass of drum plus oven-dried sample before the first cycle, WA is the mass of drum plus oven-dried sample retained after the second cycle, and WD is the mass of drum. All samples are classified according to the classification index in Table 3. Note that each sample in the slake durability testing is made of 10 pieces of rock each weighing 40 to 60 g that were collected from a specific location.
Table 3. Slake durability index classification (Franklin and Chandra, 1972).
ID2 (%) Durability classification 0 – 25 Very low
25 – 50 Low 50 – 75 Medium 75 – 90 High 90 – 95 Very high
95 – 100 Extremely high
Direct Shear Tests Direct shear tests were performed in a 2-inch shear box, using
manual operation (Gutierrez et al., 2008). Samples were first sieved on a No. 6 sieve (3.35 mm), then a minimum of four fractions of approximately 120 g of each specimen were used for the tests. A dry density of 1.7 ± 0.2 g/cm3 was achieved for all samples. All specimens were prepared by lightly compacting three lifts to attain the same relative compression. A strain rate of 1% and normal stress varying from 159 to 800 kPa were adopted for all the tests. For dry samples used in the experiments, the shear rate is not important since no pore water is present. Normal stresses required for testing were estimated by dividing the applied load by the area of the shear box. Loads represented the weight of the rock pile overburden consistent with the depth of the sample in the rock pile. Using a 2-inch shear box, the normal stress varied between 50 kPa and 800 kPa. These values duplicate depths in the rock pile between 3 m and 48 m (considering sample density of 1.69 g/cm3). Peak shear strength and residual shear strength were determined from plots of shear stress versus shear strain (Gutierrez et al., 2008). All tests were continued until the shear stress became constant or until a maximum shear deformation of 10 mm had been reached, per ASTM D3080. In almost all samples the maximum shear stress was achieved at deformation less than 10 mm. Internal friction angle was obtained using a linear best-fit line from the plot of peak shear strength versus normal stress (Gutierrez et al., 2008). The residual friction angle was obtained using a similar best-fit line.
Other Laboratory Analyses Laboratory paste tests and gravimetric moisture contents were
performed at New Mexico Institute of Mining and Technology (NMIMT) using laboratory procedures (SOPs) established as part of the overall Questa project. Petrographic analyses describing the mineralogy, lithology, hydrothermal and weathering alteration were performed using soil petrographic techniques using a binocular microscope, more detailed petrography using thin sections (using both polarized and reflected light), and electron microprobe techniques.. These analyses were supplemented by microprobe, X-ray diffraction analyses, and whole-rock chemical analyses for confirmation. Clay mineralogy, in terms of the major clay mineral groups was determined using standard clay separation techniques and X-ray diffraction analyses of the clay mineral separates on oriented glass slides (Hall, 2004; Moore and Reynolds, 1989). This method does not liberate or measure the amount of clay minerals within the rock fragments.
The concentrations of major and trace elements, except for S, SO4, LOI (loss on ignition), and F, were determined by X-ray fluorescence spectroscopy at the New Mexico State University and Washington State University laboratories. F concentrations were determined by ion probe and LOI concentrations were determined by gravimetric methods at NMIMT. S and SO4 were determined by ALS Chemex Laboratory. The modified ModAn technique (McLemore et al., 2009) provides a quantitative bulk mineralogy that is consistent with the petrographic observations, electron microprobe analysis, clay mineral analysis, and the whole-rock chemistry of the sample. Unlike most normative mineral analyses, all of the minerals calculated for the bulk mineralogy are in the actual sample analysis using ModAn. ModAn is a normative calculation that estimates modes “…by applying Gaussian elimination and multiple linear regression techniques to simultaneous mass balance equations” (Paktunc, 2001) and allows location-specific mineral compositions to be used. Representative mineral compositions for minerals in the Questa samples were

SME Annual Meeting Feb. 22-Feb. 25, 2009, Denver, CO
5 Copyright © 2009 by SME
determined from electron microprobe analysis and used in ModAn for this study (McLemore et al., 2009). The mineralogy and chemical analyses were performed on splits of the same sample set that were used in the geotechnical testing and represent the mineralogy and chemistry of the sample tested by geotechnical methods.
RESULTS
Point load strength and slake durability tests were performed on rock samples from the rock piles, drill cores of the mined rock drilled before open-pit mining began, the alteration scars, and the debris flow. The samples from drill cores represent unweathered and least weathered rock-pile material, since these samples were of the open pit deposit before mining and not exposed to surface weathering. Samples from the alteration scars and debris flows represent material that was exposed to weathering processes over the last 4000 years (debris flows) to 10,000 yrs or more (alteration scars; Graf, 2008; V.Lueth, written communication October 2008). The results are summarized in Appendix 1. The methodology in evaluation of point load strength index is discussed in Appendix 2 of this paper. Summary statistics of the point load strength and slake durability indices are in Tables 4 and 5. The individual analyses are in Viterbo (2007) and G. Ayakwah (in preparation).
Table 4. Summary descriptive statistics of the point load strength for all samples. Samples from Southwest Hansen (SWH) and Hansen (HAS) alteration scars were too weak to perform point load test, hence those point load test results are not included in this table. This was probably a result of highly fractured nature of the samples collected from these areas.
Table 5. Summary descriptive statistics of the slake durability indices for all samples from the different locations at the Mine.
DISCUSSION
Samples from the GHN rock pile are relatively similar in slake durability and point load indices regardless of the geologic layer and location within the GHN rock pile. However, some samples located in the outer edge of the rock pile (Units C and I) disintegrated more and presented lower durability than similar rocks around the same area (Fig. 3). This suggests that for some, but not all samples, point load strength index and slake durability index of the GHN rock pile decreased as the degree of weathering increased. However, in general, the point load and slake indices of rock fragments are still quite high and suggest that 25-40 years of weathering have not substantially affected the shear strength properties of these rock pile materials (Fig. 3, Tables 1-1 to 1-6 in Appendix 1; Viterbo, 2007; Gutierrez et al., 2008). These are similar to results concerning friction angle and slake durability index by Gutierrez et al. (2008), where lower friction angles were obtained from some but not all weathered samples from the outer edge of the GHN rock pile than from samples from the interior of GHN rock pile.
The slake durability indices from the various rock piles range from 80.9 to 99.5 % and the point load strength indices range from 0.6 to 8.2 MPa (Tables 4 and 5; Tables 1-3 and 1-4 in Appendix 1). Samples from Sugar Shack South and Spring Gulch rock piles have a lower average of point load index than the other rock piles (Table 1-3 in Appendix 1; Fig. 4); more samples from these rock piles are needed to determine if this is significant. Figures 4 and 5 show the range of point load strength and slake durability indices and averages values of the various sample locations at the Questa mine.

SME Annual Meeting Feb. 22-Feb. 25, 2009, Denver, CO
6 Copyright © 2009 by SME
Figure 3. Scatter plot of Slake Durability Index and Point Load Index vs. distance from outer edge of GHN rock pile. The weathering intensity was confirmed by petrographic analyses, especially textures, as described by McLemore et al. (2008a). See Figure 2 for location of trenches in GHN where samples were obtained. Appendix 1 includes a summary of the description of these samples.
Figure 4. Point load strength index values for the rock piles, alteration scars and debris flows. The average point load strength index for each location is shown with a circle. The number of samples for each location is shown in parenthesis. PIT samples are outcrop samples of andesite and rhyolite (Amalia Tuff) of various weathering and hydrothermal alteration intensities. See Figure 1 for location of rock piles. See Figure 2 for location of trenches in GHN where samples were obtained. Appendix 1 summarizes the location and description of these samples.
The slake durability values for samples of relatively unweathered andesite and rhyolite (Amalia Tuff) collected from outcrops throughout the area, range from 83.7 to 99.1%, with all samples classified as having high to extremely high durability (Table 1-6 in Appendix 1 and Table 3). There is no significant difference in slake durability and point load indices between different lithologies and different alteration assemblages (Figs. 6, 7, 8). The point load values for these samples range from 1.3 to 6.9 MPa (Table 1-5 in Appendix 1), with all samples classified with high and very high strength (Table 2); the rhyolite (Amalia Tuff) samples have slightly lower point load indices.
The slake durability and point load test results indicate that the samples from the debris flows (average slake durability index of 98.4% and point load index of 4.0 MPa) and the alteration scar samples (average slake durability index of 89.2% and point load index of 2.8 MPa) are relatively similar to the range in values of rock-pile samples (Tables 4, 5, Figs. 4, 5). The debris flows and alteration scars were
exposed to weathering longer than the rock pile material. There are no strong correlations between point load and slake durability with mineralogy or chemistry (Fig. 9).
Figure 5. Slake durability index values for the rock piles, alteration scars, and debris flows. The average slake durability index for each location is shown with a circle. The number of samples for each location is shown in parenthesis. PIT samples are outcrop samples of andesite and rhyolite (Amalia Tuff) of various weathering and hydrothermal alteration intensities. See Figure 1 for location of rock piles. See Figure 2 for location of trenches in GHN where samples were obtained. Appendix 1 summarizes the location and description of these samples.
Location and description of these samples.
Figure 6. Variation in slake index, point load and alteration (QSP, Propylitic and Argillic) of the Questa rock materials. See Figure 1 for location of rock piles. See Figure 2 for location of trenches in GHN where samples were obtained. Appendix 1 summarizes the location and description of these samples.
Samples with low values of point load index tend to also have low values of slake durability index but not all samples. The friction angle of the fine-grained soil matrix of samples collected along with the rock fragments tested for slake durability and point load indices was obtained using a 2-inch laboratory shear box (Gutierrez, 2006;

SME Annual Meeting Feb. 22-Feb. 25, 2009, Denver, CO
7 Copyright © 2009 by SME
Gutierrez et al., 2008). Shear tests were conducted on the air-dried samples. There are no strong correlations between friction angle and point load and slake durability indices of the Questa materials (Fig. 10).
Figure 7. Slake durability index values for different lithologies (Amalia, Andesite and Intrusive). The average slake durability index for each lithology is shown with a circle. See Figure 1 for location of rock piles. See Figure 2 for location of trenches in GHN where samples were obtained. Appendix 1 summarizes the location and description of these samples.
Figure 8. Point load strength index values for different lithologies (Amalia, Andesite and Intrusive). The average point load strength index for each lithology is shown with a circle. See Figure 1 for location of rock piles. See Figure 2 for location of trenches in GHN where samples were obtained. Appendix 1 summarizes the location and description of these samples.
Some weathered samples from the edge of GHN, other Questa rock piles, and analog materials show lower slake durability and point load indices than unweathered material, but not all weathered samples have lower slake durability and point load indices. The weathered samples exhibited a change in color, low paste pH, Presence of jarosite, gypsum, iron oxide minerals and Fe- soluble salts (often as cementing minerals), and low abundance to absence of calcite, pyrite, and epidote in weathered samples, Tarnish or coatings of pyrite surfaces, Dissolution textures of minerals, and Chemical classification as potential acid-forming materials using acid base accounting methods (as described above and summarized in Appendix 1). Some samples with low paste pH, but not all, from the edge of GHN, other Questa rock piles, and analog materials show lower slake durability
and point load indices (Fig. 11). Paste pH is an indication of weathering, as discussed above, with lower paste pH suggesting more weathered material (McLemore et al., 2008a). Figure 12 shows the variation of point load and slake indices with the simple weathering index (SWI). No definite correlation is observed in this figure. This could indicate that the main reason for observed variations of slakes and point load indices are the pre-mining alteration and that the weathering effects have been so far of less significance. Comparison of the slake and point load indices of the weathered and unweathered samples (samples from drill logs) confirms that the overall intensity of the weathering in last 25-40 years has not been significant to decrease the strength of the Questa rock-pile materials.
Figure 9. Variations between slake durability index, point load index, mineralogy, and chemistry. The mineralogy and chemical analyses were performed on splits of the same sample set that were used in the geotechnical testing and represent the mineralogy and chemistry of the sample tested by geotechnical methods. See Figure 1 for location of rock piles. Appendix 1 summarizes the location and description of these samples.
CONCLUSIONS
The slake durability indices from the Questa rock piles are high to extremely high according to the slake durability index classification (Franklin and Chandra, 1972) and the point load indices are medium to very high according to the point load strength index classification (Broch and Franklin, 1972). Samples from the GHN rock pile are similar in slake durability and point load indices regardless of geologic layer and location within the rock pile, except that some, but not all samples located in the outer, weathered edge of the rock pile (Units C and I) that are weaker and have lower slake durability and point load indices. There is no significant difference in slake durability or point load indices between different lithologies or hydrothermal alteration. The rhyolite samples have slightly lower point load indices. The slake durability and point load test results indicate that the debris flow and the alteration scar samples are similar to the range in values of rock-pile samples. The debris flows and alteration scars represent the more weathered material that has occurred over thousands to millions of

SME Annual Meeting Feb. 22-Feb. 25, 2009, Denver, CO
8 Copyright © 2009 by SME
years. Some weathered samples from the edge of GHN, other Questa rock piles, and analog materials show lower slake durability and point load indices than unweathered material, but not all weathered samples have lower slake durability and point load indices. There are no strong correlations between point load and slake durability with mineralogy or chemistry (Fig. 9). Samples with low values of point load index tend to also have low values of slake durability index but not all samples. There are no strong correlations between friction angle and point load indices with the Questa materials. GHN rock pile samples have high durability and strength even after having undergone hydrothermal alteration and blasting prior to deposition and after potential exposure to weathering for about 40 years. Collectively, these results suggest that future weathering (< 1000 years) will not substantially decrease the strength indices of the rock piles with time.
Figure 10. Variations between slake durability index, point load index, friction angle, and residual friction angle. The friction angle was determined on the fine-grained matrix from the same location as the samples tested for slake durability and point load, which were determined on larger rock fragments. See Figure 1 for location of rock piles. See Figure 2 for location of trenches in GHN where samples were obtained. Appendix 1 summarizes the location and description of these samples.
ACKNOWLEDGEMENTS
This project was funded by Chevron Mining Inc. (formerly Molycorp Inc.), and the New Mexico Bureau of Geology and Mineral Resources (NMBGMR), a division of New Mexico Institute of Mining and Technology (NMIMT). We would like to thank the professional staff and students of a large multi-disciplinary field team for their assistance in the fieldwork and data analyses. We also would like to thank Jim Vaughn and Mike Ness of Chevron Mining Inc. for their training and assistance in this study. David Jacobs and Dirk van Zyl reviewed an earlier version of this manuscript and their comments were appreciated. Thanks also to Dawn Sweeney and Frederick Ennin for assisting with the mineralogy determinations. Chemical analyses were performed by Washington State University. This paper is part of an on-going study of the environmental effects of mineral resources in New Mexico at NMBGMR, Peter Scholle, Director and State Geologist.
Figure 11. Variation in slake index, point load index and paste pH of the Questa rock materials. See Figure 1 for location of rock piles. See Figure 2 for location of trenches in GHN where samples were obtained. Appendix 1 summarizes the location and description of these samples.
Figure 12. Variation in slake index, point load and simple weathering indices (SWI) of the Questa rock materials. See Figure 1 for location of rock piles. See Figure 2 for location of trenches in GHN where samples were obtained. Appendix 1 summarizes the location and description of these samples.

SME Annual Meeting Feb. 22-Feb. 25, 2009, Denver, CO
9 Copyright © 2009 by SME
REFERENCES
1. ASTM, 2001, American Society for Testing Materials. Procedures for testing soils, 1964. Standard Test Method for Slake Durability of Shales and Similar Weak Rocks: D464487 (Reapproved 1992): Annual Book of ASTM Standards, West Conshohocken, PA.
2. Bieniawski, Z.T., 1975, Point load test in geotechnical practice, Engineering Geology, v. 9(1), p. 1- 11.
3. Blowes, D. W., and Jambor, J.L., 1990, The pore-water geochemistry and mineralogy of the vadose zone of sulfide tailings, Waite Amulet, Quebec, Canasa: Applied Geochemistry. v. 5, p. 327-346.
4. Broch, E. and Franklin, J. A., 1972, The Point Load Strength Test: International Journal of Rock Mechanics and Mineral Sciences, v. 9, p. 669-697.
5. Cetin, H., Laman, M. and Ertunc, 2000, Settlement and slaking problems in the world’s fourth largest rock-fill dam, the Ataturk Dam in Turkey, Engineering Geology, v. 56(3-4), p. 225-242.
6. D’Andrea, D.V., Fisher, R.L. and Fogelson, D.E., 1964, Prediction of compression strength from other rock properties, Colorado School of Mines Quarterly, v. 59(4B), p. 623-640.
7. Dhakal, G., Yoneda, T., Kato, M., and Kaneko, K., 2002, Slake Durability and Mineralogical Properties of some Pyroclastic and Sedimentary Rocks: Engineering Geology, v. 65, p. 31-45.
8. Dick, J.C. and Shakoor, A., 1995, Characterizing durability of mudrocks for slope stability purposes: Geological Society America, Reviews in Engineering Geology, v. 10, p. 121-130.
9. Duzgoren-Aydin, N.S., Aydin, A., and Malpas, A.J., 2002, Re-assessment of chemical weathering indices: case study on pyroclastic rocks of Hong Kong: Engineering Geology, v. 63, p. 99-119.
10. Fookes, P. G., Dearman, W. R., and Franklin, J. A., 1971, Some engineering aspects of rock weathering with field examples from Dartmoor and elsewhere: Quarterly Journal of Engineering Geology, v. 4, p. 139-185.
11. Franklin, J.A., and Chandra, A., 1972, The slake durability test: International Journal of Rock Mechanics and Mineral Sciences, v. 9, p. 325–341.
12. Gupta, A.S. and Rao, K. S., 2001, Weathering indices and their applicability for crystalline rocks: Bull. Eng. Geol. Env., v. 60, p. 201-221.
13. Gunsallus, K.L. and Kulhawy, F.H., 1984, Comparative evaluation of rock strength measures, International Journal Rock Mechanic Mining Science Geomechanic Abstract, v. 2(5), p. 233-248.
14. Gutierrez, L. A. F., 2006, The Influence of Mineralogy, Chemistry and Physical Engineering properties on Shear Strength Parameters of the Goathill North Rock Pile Material, Questa Molybdenum Mine, New Mexico: M. S. thesis, New Mexico Institute of Mining and Technology, Socorro, p. 201 ,http://geoinfo.nmt.edu/staff/mclemore/Molycorppapers.htm,. Accessed October, 10 2008.
15. Gutierrez, L.A.F., Viterbo, V.C., McLemore, V.T., and Aimone-Martin, C.T., 2008, Geotechnical and Geomechanical Characterisation of the Goathill North Rock Pile at the Questa Molybdenum Mine, New Mexico, USA; in Fourie, A., ed., First International Seminar on the Management of Rock Dumps, Stockpiles and Heap Leach Pads: The Australian Centre for Geomechanics, University of Western Australia, p. 19-32.
16. Gökçeo lu, C., Ulusay, R. and Sönmez, H., 2000, Factors affecting the durability of selected weak and claybearing rocks from Turkey, with particular emphasis in the influence of the
number of drying and wetting cycles: Engineering Geology, v. 57, p. 215-237.
17. Hall, J.S. 2004, New Mexico Bureau of Mines and Mineral Resource’s Clay Laboratory Manual: Unpublished New Mexico Bureau of Geology and Mineral Resources report.
18. Hassani, F.P., Scoble, M.J and Whittaker, B.N., 1980, Application of point load index test to strength determination of rock and proposals for new size correction chart, Proc. 21st Symposium Rock Mechanics Rolla, p. 543-564.
19. International Society for Rock Mechanics (ISRM), 1979, Suggested Methods for determination of the slake durability index: International Journal of Rock Mechanics and Mineral Sciences Geomech., v. 16, p. 154-156.
20. International Society for Rock Mechanics (ISRM), 1985, Suggested Methods for determining point load strength: International Journal of Rock Mechanics and Mineral Sciences Geomech., v. 22, p. 53-60.
21. Johnson, R.B., DeGraff, J.V., 1988, Principles of Engineering Geology, Wiley, New York, p. 497.
22. Little, A.L., 1969, The engineering weathering classification of residual tropical soils; in Proceedings of the 7th International Conference on Soil Mechanics and Foundation Engineering, Special Session on the Engineering Properties if Lateritic Soils: Mexico City, p. 1-10.
23. Maharana Pratap University of Agriculture and Technology, 2005, Designing of waste dumps vis a vis land use planning for marble quarries in southern Rajasthan, India: 20th World Mining Congress.
24. McLemore, V.T., Ayakwah, G., Boakye, K., Campbell, A., Donahue, K., Dunbar, N., Gutierrez, L. Heizler, L., Lynn, R., Lueth, V., Osantowski, E., Phillips, E., Shannon, H., Smith, M. Tachie-Menson, S., van Dam, R., Viterbo, V.C., Walsh, P., and Wilson, G.W., 2008a, Characterization of Goathill North Rock Pile: revised unpublished report to Molycorp, Tasks: 1.3.3, 1.3.4, 1.4.2, 1.4.3, 1.11.1.3, 1.11.1.4, 1.11.2.3, B1.1.1, B1.3.2.
25. McLemore, V. T., Walsh, P., Donahue, K., Gutierrez, L., Tachie-Menson, S.,Shannon, H. R., and Wilson, G. W., 2005, Preliminary Status Report on Molycorp Goathill North Trenches, Questa, New Mexico In: 2005 National Meeting of the American Society of Mining and Reclamation. American Society of Mining and Reclamation, Breckenridge, Colorado, p.26, http://geoinfo.nmt.edu/staff/mclemore/Molycorppapers.htm, accessed June 19, 2008.
26. McLemore, V.T., Donahue, K.M., Phillips, E., Dunbar, N., Walsh, P., Gutierrez, L.A.F., Tachie-Menson, S., Shannon, H.R., Wilson, G.W., and Walker, B.M., 2006a, Characterization of Goathill North Mine Rock Pile, Questa Molybdenum Mine, Questa, New Mexico: National Meeting of the 7th ICARD, SME, and American Society of Mining and Reclamation, St. Louis, Mo., March, CD-ROM, http://geoinfo.nmt.edu/staff/mclemore/Molycorppapers.htm
27. McLemore, V.T., Donahue, K., Phillips, E., Dunbar, N., Smith, M., Tachie-Menson, S., Viterbo, V., Lueth, V.W., Campbell, A.R. and Walker, B.M., 2006b, Petrographic, mineralogical and chemical characterization of Goathill North Mine Rock Pile, Questa Molybdenum Mine, Questa, New Mexico: 2006 Billings Land Reclamation Symposium, June, 2006, Billings, Mt. Published by Published by American Society of Mining and Reclamation, 3134 Montavesta Rd., Lexington, KY CD-ROM, http://geoinfo.nmt.edu/staff/mclemore/Molycorppapers.htm
28. McLemore, V.T., Donahue, K., and Sweeney, D., 2008b, Lithologic atlas for the Questa mine, Taos County, New Mexico: revised unpublished report to Molycorp, February 11, 2004,

SME Annual Meeting Feb. 22-Feb. 25, 2009, Denver, CO
10 Copyright © 2009 by SME
Revised August 27, 2008 (revised from appendix 2.3, May 2005 report).
29. McLemore, V.T., Sweeney, D., Dunbar, N., Heizler, L. and Phillips, E., 2009, Determining bulk mineralogy using a combination of petrographic techniques, whole rock chemistry, and MODAN: Society of Mining, Metallurgy and Exploration Annual Convention, preprint Feb 2009.
30. Moore, O.M. and Reynolds, R.O., Jr. 1989, X-ray diffraction and the identification and analyses of clay minerals: Oxford University Press, New York.
31. Paktunc, A.D., 2001, MODAN- a computer program for estimating mineral quantities based on bulk composition: windows version. Computers and Geoscience, v.27 (7), p. 883-886.
32. Panek, L. A. and Fannon, T.A., 1992, Size and shape effects in point load tests of irregular rock fragments, Rock Mechanics Rock Engineering, v. 25, p. 109-40.
33. Quine, R. L., 1993, Stability and deformation of mine waste dumps in north central Nevada: PhD. dissertation, University of Nevada, Reno, p. 402.
34. Rodrigues, J.G., 1991, Physical characterization and assessment of rock durability through index properties. NATO ASI Ser. Ed. Applied Sciences 200, p. 7-34.
35. Tachie-Mensen, S., 2006, Characterization of the acid producing potential and investigation of its effect on weathering of the Goathill North rock pile at the Questa Molybedenum Mine, New Mexico: M.S. thesis, New Mexico Institute of Mining and Technology, Socorro, NM, p. 209, http://gepinfo.nmt.edu/staff/mclemore/Molycorppapers.htm. Accessed January 19, 2008.
36. URS Corporation, 2003, Mine rock pile erosion and stability evaluations, Questa mine: Unpublished Report to Molycorp, Inc. 4 volumes.
37. Viterbo, V., 2007, Effect of premining hydrothermal alteration processes and postmining weathering on rock engineering properties of Goathill north rock pile at the Questa Mine, Toas , New Mexico: M. S. thesis, New Mexico Institute of Mining and Technology, Socorro, NM, p. 209, http://geoinfo.nmt.edu/staff/mclemore/Molycorppapers.htm, accessed March 10, 2008.

SME Annual Meeting Feb. 22-Feb. 25, 2009, Denver, CO
11 Copyright © 2009 by SME
APPENDIX 1
SUMMARY STATISTICS OF THE STRENGTH CLASSIFICATION FOR QUESTA MATERIALS.
Table 1-1. Slake durability index, point load index, friction angle (degrees), ultimate (residual) friction angle (degrees), paste pH, and SWI for samples tested for slake durability and point load.
Sample Slake Durability Index
% Point Load Index (mPa) Peak Friction Angle Ultimate Friction Angle Paste pH SWI
Samples from trenches, test pits in GHN (rock pile material and colluvium) GHN-EHP-0001 97.42 41.4 38.6 2.68 4 GHN-EHP-0002 97.22 42.3 35.6 3.18 3 GHN-EHP-0003 95.24 3.04 3 GHN-EHP-0004 94.76 3.02 3 GHN-EHP-0007 96.68 5.43 2 GHN-HRS-0096 96.64 43.7 38.2 3.29 3 GHN-JRM-0001 93.99 3.3 44.9 33.7 2.14 2 GHN-JRM-0031 97.27 4.46 4 GHN-JRM-0037 96.67 40.8 34.2 2.91 4 GHN-JRM-0038 96.4 42.7 39.9 2.99 2 GHN-JRM-0039 96.79 41.8 41.4 3.06 2 GHN-JRM-0040 93.23 40.8 38.5 3.37 4 GHN-JRM-0047 80.93 42.8 39.8 2.99 2 GHN-KMD-0013 96.77 2.74 40.7 39.7 2.49 2 GHN-KMD-0014 98.44 8.2 46.9 44.3 3.19 2 GHN-KMD-0015 95.71 4.3 46.9 43.7 4.92 3 GHN-KMD-0016 95.64 3.38 43.2 39.3 5.74 3 GHN-KMD-0017 89.29 0.61 43.2 39.3 2.19 3 GHN-KMD-0018 95.17 6.7 42.7 37.6 3.5 3 GHN-KMD-0019 97.61 2.96 47.3 42.2 5.84 3 GHN-KMD-0026 96.59 3.7 42.7 42 3.8 3 GHN-KMD-0027 97.02 1.1 43.5 39.7 2.49 2 GHN-KMD-0028 93.99 2.6 2 GHN-KMD-0048 98.28 5.25 6.18 2 GHN-KMD-0050 96.69 5.71 4 GHN-KMD-0051 96.58 39.9 37.2 7.19 3 GHN-KMD-0052 98.13 4.3 40.5 37.9 5.08 2 GHN-KMD-0053 94.03 3.3 41.9 40 4.32 2 GHN-KMD-0054 97.23 5.72 44.5 38.4 3.93 3 GHN-KMD-0055 94.97 1.56 44.2 39 4.27 3 GHN-KMD-0056 97.41 6.09 49 41.2 4.85 2 GHN-KMD-0057 97.65 3.19 43.1 42.4 7.96 2 GHN-KMD-0062 96.7 2.13 41.7 38.7 4.43 2 GHN-KMD-0063 98.54 7.04 44.7 40.1 3.95 2 GHN-KMD-0064 97.06 6.03 2.67 3 GHN-KMD-0065 95.86 4.36 43.6 41.6 5.77 4 GHN-KMD-0071 96.74 41.1 35.9 4.35 4 GHN-KMD-0072 97.68 40.5 37.5 7.15 2 GHN-KMD-0073 95.93 43.5 39.5 6.55 2 GHN-KMD-0074 98.5 41.9 42.4 3.36 3 GHN-KMD-0077 92.84 42.8 38.4 2.45 4 GHN-KMD-0078 97.58 3.58 46.2 38.7 3.26 3 GHN-KMD-0079 98 41.4 36.9 3.07 2 GHN-KMD-0080 98.4 3.45 6.36 2 GHN-KMD-0081 97.32 7.29 43.4 40.7 3.29 2 GHN-KMD-0082 96.89 5.41 42.5 39.2 3.3 2 GHN-KMD-0088 96.21 43.7 36.8 2.63 2 GHN-KMD-0090 95.66 2.44 2 GHN-KMD-0092 97.39 42.9 41.4 3.72 3 GHN-KMD-0095 97.85 47.5 43.2 2.73 2 GHN-KMD-0096 97.42 41.7 31.8 2.56 2

SME Annual Meeting Feb. 22-Feb. 25, 2009, Denver, CO
12 Copyright © 2009 by SME
Sample Slake Durability Index
% Point Load Index (mPa) Peak Friction Angle Ultimate Friction Angle Paste pH SWI
GHN-KMD-0097 93.64 47.8 39.7 2.55 2 GHN-KMD-0100 97.19 44.4 40.3 3.42 2 GHN-LFG-0018 96.03 4.19 2 GHN-LFG-0020 97.97 4.45 2 GHN-LFG-0037 96.49 37.8 37.8 4.5 2 GHN-LFG-0041 97.87 5.37 4 GHN-LFG-0057 98.22 2.74 4 GHN-LFG-0060 96.78 3.03 2 GHN-LFG-0085 94.42 39.6 37.5 2.98 4 GHN-LFG-0086 93.98 3.02 3 GHN-LFG-0088 98.11 40.6 38.3 5.43 4 GHN-LFG-0089 97.69 6.49 3.51 4 GHN-LFG-0090 96.72 43.8 35 6.71 4 GHN-LFG-0091 95.6 37.2 36.8 2.46 5 GHN-RDL-0002 95.72 42.2 32.1 5.48 2 GHN-RDL-0003 95.32 3.75 3 GHN-SAW-0002 99.15 2.83 2 GHN-SAW-0003 99.15 45.1 44.2 3.2 5 GHN-SAW-0004 97.13 40.1 39 2.38 2 GHN-SAW-0005 98.32 44.6 36.7 4.06 3 GHN-SAW-0200 93.62 37.6 37.5 7.54 5 GHN-SAW-0201 96.81 43.4 37.6 2.74 5 GHN-VTM-0263 85.15 40.3 37.7 2.7 3 GHN-VTM-0293 82.23 41.6 34.6 4.07 3 GHN-VTM-0450 97.98 44.5 44.5 6.7 3 GHN-VTM-0453 93.93 45.2 37.6 4.55 3 GHN-VTM-0456 95.66 3.19 4 GHN-VTM-0508 92.98 43.4 38.6 3.45 4 GHN-VTM-0554 85.54 7.06 3 GHN-VTM-0598 98.5 2.7 3 GHN-VTM-0599 97.07 39.3 35.4 6.96 4 GHN-VTM-0603 95.89 42.1 42.6 3.42 4 GHN-VTM-0606 96.66 43 37.2 3.25 2 GHN-VTM-0607 97.2 43.7 41.7 2.66 2 GHN-VTM-0614 98.47 42.1 39.1 3.09 5
Goat Hill alteration scar GHR-VWL-0004 86.88 41.2 36.1 2.41 3
Hansen alteration scar HAS-GJG-0006 70.84 33.4 32.1 2.52 2 HAS-GJG-0007 90.2 45.5 34.2 2.98 4 HAS-GJG-0008 92.42 43 2.8 5 HAS-GJG-0009 94.01 2.05 4 HAS-GJG-0010 87.02 2.6 4 HAS-GJG-0014 81.24 2.41 4
Middle rock pile MID-AAF-0001 95.61 4.36 42.5 38.1 2.41 4 MID-AAF-0002 97.33 38 37.9 2.62 3 MID-VTM-0002 97.64 4.53 44.5 36.7 4.16 4
Goat Hill debris flow MIN-AAF-0001 96.78 45.1 35.2 2.04 4 MIN-AAF-0004 96.1 40.6 37.9 4.23 2 MIN-AAF-0006 95.98 4.21 3 MIN-AAF-0010 97.32 3.52 48.3 37.9 3.45 3 MIN-AAF-0012 98.9 3.5 43.1 42.3 3.16 4 MIN-AAF-0013 98.23 4.01 3.44 4 MIN-AAF-0015 99.09 3.25 50.1 36 3.28 2

SME Annual Meeting Feb. 22-Feb. 25, 2009, Denver, CO
13 Copyright © 2009 by SME
Sample Slake Durability Index
% Point Load Index (mPa) Peak Friction Angle Ultimate Friction Angle Paste pH SWI
MIN-GFA-0001 98.42 2.75 50 37.8 3.2 4 MIN-GFA-0003 99.46 5.95 45.7 33.8 3.87 4 MIN-GFA-0005 98.71 2.61 39.2 34.9 3.24 3 MIN-GFA-0009 98.57 3.8 45.2 35.5 3.58 3 MIN-SAN-0002 98.61 5.04 39.7 40.1 3.53 4 MIN-VTM-0002 98.65 4.64 4 MIN-VTM-0003 99.23 3.67 4 MIN-VTM-0004 98.88 4.21 4 MIN-VTM-0006 98.85 3.64 3 MIN-VTM-0007 98.87 4.45 4.22 3 MIN-VTM-0008 98.81 5.06 3 MIN-VTM-0009 98.58 4.86 3.81 3
Samples from the open pit PIT-LFG-0011 97.49 6.19 3 PIT-LFG-0013 92.33 37.8 37.5 2.55 3 PIT-RDL-0002 95.96 4.85 3
Drill core in the open pit deposit PIT-VCV-0001 97.41 6.5 8.25 3 PIT-VCV-0002 96.44 5 7.87 3 PIT-VCV-0003 98.19 4.1 7.42 3 PIT-VCV-0004 88.9 1.8 4.32 3 PIT-VCV-0005 94.26 3 4.75 3 PIT-VCV-0006 95.78 3.1 4.65 3 PIT-VCV-0007 95.62 1.8 8.06 3 PIT-VCV-0008 95.25 2.3 7.95 2 PIT-VCV-0009 98.47 5.3 8.31 4 PIT-VCV-0010 94.46 3.6 8.59 2 PIT-VCV-0011 92.15 4.8 8.46 1 PIT-VCV-0012 97.22 2.6 7.93 1 PIT-VCV-0013 97.37 3 8.2 1 PIT-VCV-0014 83.65 1.8 7.9 1 PIT-VCV-0015 99.01 5 8.61 1 PIT-VCV-0016 97.2 3.44 8.46 1 PIT-VCV-0017 94.09 5.57 8.22 1 PIT-VCV-0018 94.25 1.41 8.18 1 PIT-VCV-0019 91.7 3.5 7.4 1 PIT-VCV-0020 95.38 4.4 7.56 1 PIT-VCV-0021 87.17 1.3 7.98 1 PIT-VCV-0022 93.91 2.8 7.6 1 PIT-VCV-0023 95.3 5 7.52 1 PIT-VCV-0024 94.96 2.05 8.17 1 PIT-VCV-0025 96.17 1.75 7.43 1 PIT-VCV-0026 92.89 2.65 5.36 1 PIT-VCV-0027 99.08 4.96 8.24 1 PIT-VCV-0028 99.07 6.52 8.88 1 PIT-VCV-0029 98.65 6.9 8.55 1 PIT-VCV-0030 97.62 2.2 8.36 1
Samples from the open pit PIT-VTM-0001 98.62 5.08 1 PIT-VTM-0002 99.48 6.72 1
Questa Pit Alteration scar QPS-AAF-0001 97.1 46.5 39.8 3.09 1 QPS-AAF-0003 90.1 36.5 37 3.19 1 QPS-AAF-0005 97 43.1 38.7 2.98 1 QPS-AAF-0009 94.9 41.7 35.8 2.96 1 QPS-AAF-0020 94.69 2.57 41.9 36.4 2.6 1

SME Annual Meeting Feb. 22-Feb. 25, 2009, Denver, CO
14 Copyright © 2009 by SME
Sample Slake Durability Index
% Point Load Index (mPa) Peak Friction Angle Ultimate Friction Angle Paste pH SWI
QPS-AAF-0022 94.41 2.52 39 39.3 2.56 1 QPS-SAN-0002 92.39 3.5 38.4 34 2.84 1 QPS-VTM-0001 95.23 1.71 34.9 34.6 2.59 1 Outcrop samples ROC-KMD-0001 99.51 38.7 35.9 6.8 1 ROC-KMD-0002 99.61 6.62 1 ROC-VTM-0032 98.29 41.2 39.7 6.37 5
Straight Creek scar SCS-LFG-0004 73.9 37.7 37.5 2.5 5 SCS-LFG-0005 92.43 42.9 44.8 2.72 5 SCS-LFG-0006 98.49 38.3 34.6 2.67 4 SCS-LFG-0007 98.5 45.7 37.9 3.21 5 SCS-LFG-0008 96.31 2.42 2
Spring Gulch and Blind Gulch rockpiles SPR-AAF-0001 97.21 3.92 38.9 36.3 3.48 1 SPR-AAF-0003 90.68 4.8 49.3 38.7 3.66 2 SPR-SAN-0002 97.96 2.08 38.1 34.2 4.22 5 SPR-VTM-0005 98.64 2.81 36.1 34.9 5.26 5 SPR-VTM-0008 98.49 3.39 40.4 35.8 6.22 5 SPR-VTM-0010 97.82 1.34 40.3 39.9 6.56 4 SPR-VTM-0012 96.9 42 38.5 3.29 4 SPR-VTM-0014 98.21 38.8 39.5 3.28 2 SPR-VTM-0017 67.67 39.2 37.3 2.84 2 SPR-VTM-0021 96.84 2.6 35.9 32.8 2.43 2
Sugar Shack South rock pile SSS-AAF-0001 94.54 47.3 39.7 2.7 2 SSS-AAF-0004 96.94 1.62 41.1 38 2.65 2 SSS-AAF-0005 96.49 1.03 43.3 41.2 2.48 2 SSS-AAF-0007 93.12 2.19 43.7 38.6 2.48 2 SSS-AAF-0009 94.41 45 41.9 2.19 2 SSS-AAF-0011 85.33 2.54 2 SSS-AAF-0012 97.21 2.08 2.44 2 SSS-EHP-0002 98.45 6.17 2 SSS-EHP-0003 98.87 6.52 2 SSS-EHP-0011 98.66 7.41 2 SSS-EHP-0012 98.27 7.44 4 SSS-EHP-0014 99.13 2.45 6.6 4 SSS-EHP-0015 99.28 6.46 4 SSS-EHP-0017 99.16 4.4 4 SSS-EHP-0019 99.18 4.08 3 SSS-EHP-0020 97.28 4.21 3 SSS-EHP-0023 39.71 3.92 3 SSS-EHP-0025 98.95 4.01 3 SSS-EHP-0031 99.28 3.18 3 SSS-EHP-0032 99.52 3.52 3 SSS-EHP-0033 99.35 4.67 3 SSS-EHP-0034 99.5 5.71 3 SSS-EHP-0036 99.13 2.86 3 SSS-VEV-0001 90.76 4.26 3 SSS-VTM-0012 96.8 2.19 4.13 3 SSS-VTM-0600 96.8 38.9 35.9 4.49 3
Sugar Shack West rock pile SSW-AAF-0001 97.07 4.37 45.7 40.3 3.01 3 SSW-AAF-0002 96.09 41.9 38.6 2.36 3 SSW-AAF-0005 82.3 1.68 42.1 37.5 2.95 3 SSW-AAF-0007 95.21 5.3 44.6 41.6 3.09 3

SME Annual Meeting Feb. 22-Feb. 25, 2009, Denver, CO
15 Copyright © 2009 by SME
Sample Slake Durability Index
% Point Load Index (mPa) Peak Friction Angle Ultimate Friction Angle Paste pH SWI
SSW-AAF-0009 4.01 3 SSW-SAN-0002 96.07 2.51 41.6 39.8 2.9 3 SSW-SAN-0006 95.18 2.03 35.3 35.5 2.4 4 SSW-VTM-0001 98.61 41.8 35.5 2.64 4 SSW-VTM-0016 97.51 4.4 42.6 39.2 5.58 4 SSW-VTM-0019 98.5 5.02 39.5 35.7 4.35 3 SSW-VTM-0022 98.61 4.57 5.21 2 SSW-VTM-0023 98.44 5.2 39.7 37.3 5.22 2 SSW-VTM-0026 97.86 41.1 41.2 2.44 2 SSW-VTM-0028 97.15 6.06 47.9 39.4 2.39 2 SSW-VTM-0030 96.63 4.19 37 37 3.58 2
Southwest Hansen alteration scar SWH-GJG-0008 76.12 2.36 2 SWH-GJG-0009 64.52 2.37 3 SWH-GJG-0012 92.36 35.1 35.2 2.41 2 SWH-GJG-0015 96.16 2.64 5

SME Annual Meeting Feb. 22-Feb. 25, 2009, Denver, CO
16 Copyright © 2009 by SME
APPENDIX 1 (Cont’d)
Table 1-2. Summary of location of samples tested for point load and slake durability.
Sample identification
number
Trench, test pit, or drill
hole identification
number
Sample description
UTM easting
(m)
UTM northing
(m)
Elevation (ft)
Sample location
GHN-EHP-0001 LFG-017 soil 453688 4062313.3 9651.2 top layer
GHN-EHP-0002 LFG-017 soil 453690.9 4062314.5 9651.2 15-25 ft, lowest layer
GHN-EHP-0003 LFG-013 soil 453678.4 4062414.8 9712.1 0-3 ft
GHN-EHP-0004 LFG-013 soil 453680.9 4062415.8 9712.1
GHN-EHP-0005 LFG-013 soil 453681.7 4062416.1 9712.1 N wall
GHN-EHP-0006 LFG-013 soil 453681.2 4062415.9 9712.1 N wall
GHN-EHP-0007 LFG-013 soil 453681.2 4062415.9 9712.1 N wall
GHN-HRS-0096 LFG-012 soil 453693.1 4062353.7 9692.7
GHN-JRM-0001 soil 453710 4062089 9764 in yellow-orange red material from north
tensiometer pit, 60-70 cm below ground level
GHN-JRM-0002 soil 453710 4062089 9764 in gray material from north tensiometer pit, 70-80
cm below ground level GHN-JRM-0022 LFG-009 soil 453649.8 4062137.5 9605.1 bench 22, N Wall, 86 ft from 22NW
GHN-JRM-0027 LFG-009 soil 453644.7 4062115.3 9599.3 bench 23, 80ft from 23SW, S wall
GHN-JRM-0031 LFG-009 soil 453645 4062115.3 9598.5 unit O right above GHN-JRM-0030
GHN-JRM-0037 LFG-011 soil 453664.8 4062334.2 9666.5
GHN-JRM-0038 LFG-011 soil 453670.1 4062340 9666.5
GHN-JRM-0039 LFG-011 soil 453670.8 4062334.3 9659
GHN-JRM-0040 LFG-011 soil 453670 4062333.4 9659
GHN-JRM-0047 LFG-011 soil 453669.4 4062334.8 9663.1
GHN-KMD-0013 LFG-006 soil 453711.1 4062142.2 9734.1 Bench 9, N wall, 52ft E of 9NW peg
GHN-KMD-0014 LFG-006 soli 453717.8 4062144.5 9737.2 Bench 8, N wall, 33ft 8NW peg
GHN-KMD-0015 LFG-006 soil 453722.7 4062141.5 9735.8 Bench 9, N wall, 90-95ft E of 9NW
GHN-KMD-0016 LFG-006 soil 453725.1 4062141.4 9736.1 Bench 9, N wall, 98-105 ft E of 9NW peg, 10ft W of
8NE GHN-KMD-0017 LFG-006 soil 453695.9 4062143.2 9730.9 Bench 9, N wall, 2ft E of 9NW peg
GHN-KMD-0018 LFG-006 soil 453698.2 4062143.2 9730.5 Bench 9, N wall, 10ft E of 9NW peg
GHN-KMD-0019 LFG-006 soil 453726.7 4062144.1 9738.6 Bench 8, N wall, 63 ft 8NW
GHN-KMD-0026 LFG-006 soil 453728.8 4062141.1 9736.1 bench 9, N wall, 110 ft 9NW
GHN-KMD-0027 LFG-006 soil 453707.9 4062147.9 9738.5 bench 7, Nwall, 10 ft 7NW
GHN-KMD-0028 LFG-006 soil 453706.9 4062141.6 9726.8 bench 10, S wall, 3 ft
GHN-KMD-0048 LFG-007 soil 453691.8 4062131.5 9688.4 bench 15 north wall, 52 ft 15NW
GHN-KMD-0050 LFG-007 soil 453704.2 4062145.4 9702.8 floor of bench 12, 84 ft east of 12NW
GHN-KMD-0051 LFG-007 soil 453695.1 4062145.8 9698 bench 12, 54 ft east 12NW
GHN-KMD-0052 LFG-007 soil 453692.6 4062145.9 9697 floor bench 12, 46 ft east 12NW
GHN-KMD-0053 LFG-007 soil 453684.7 4062146.2 9693.7 floor bench 12, 20 ft east 12NW
GHN-KMD-0054 LFG-007 soil 453682 4062146.3 9692.6 floor bench 12, 11 ft east 12NW
GHN-KMD-0055 LFG-007 soil 453676.5 4062146.5 9691.3 floor bench 12, -7 ft east 12NW
GHN-KMD-0056 LFG-007 soil 453704.9 4062139.5 9696.9 bench 14, north wall, 97 ft 14NW
GHN-KMD-0057 LFG-007 soil 453695.8 4062139.9 9694 bench 14, north wall, 67 ft from 14NW
GHN-KMD-0062 LFG-007 soil 453682.4 4062140.5 9689.8 bench 14, north wall, 23 ft from 14NW
GHN-KMD-0063 LFG-007 soil 453677.2 4062140.7 9688.1 bench 14, north wall, 6 ft from 14NW
GHN-KMD-0064 LFG-007 soil 453694.9 4062131.9 9690.1 bench 15, north wall, 57 ft from 15NW
GHN-KMD-0065 LFG-007 soil 453698.9 4062131.7 9691.5 bench 15, north wall, 70 ft from 15NW
GHN-KMD-0071 LFG-008 soil 453678.7 4062137.5 9649.2 bench 18, north wall, 97 ft 18NW
GHN-KMD-0072 LFG-008 soil 453671.4 4062137.4 9646.1 bench 18, north wall, 73 ft 18NW
GHN-KMD-0073 LFG-008 soil 453666.8 4062137.4 9644.1 bench 18, north wall, 58 ft 18NW
GHN-KMD-0074 LFG-008 soil 453680.2 4062137.5 9649.8 bench 18, north wall, 102 ft 18NW
GHN-KMD-0077 LFG-008 soil 453670.2 4062134.1 9643.7 bench 19, south wall, 71 ft 19SW
GHN-KMD-0078 LFG-008 soil 453671.7 4062134.1 9644.4 bench 19, south wall, 76 ft 19SW
GHN-KMD-0079 LFG-008 soil 453679.3 4062137.5 9651.9 bench 18, north wall, 99 ft 18NW
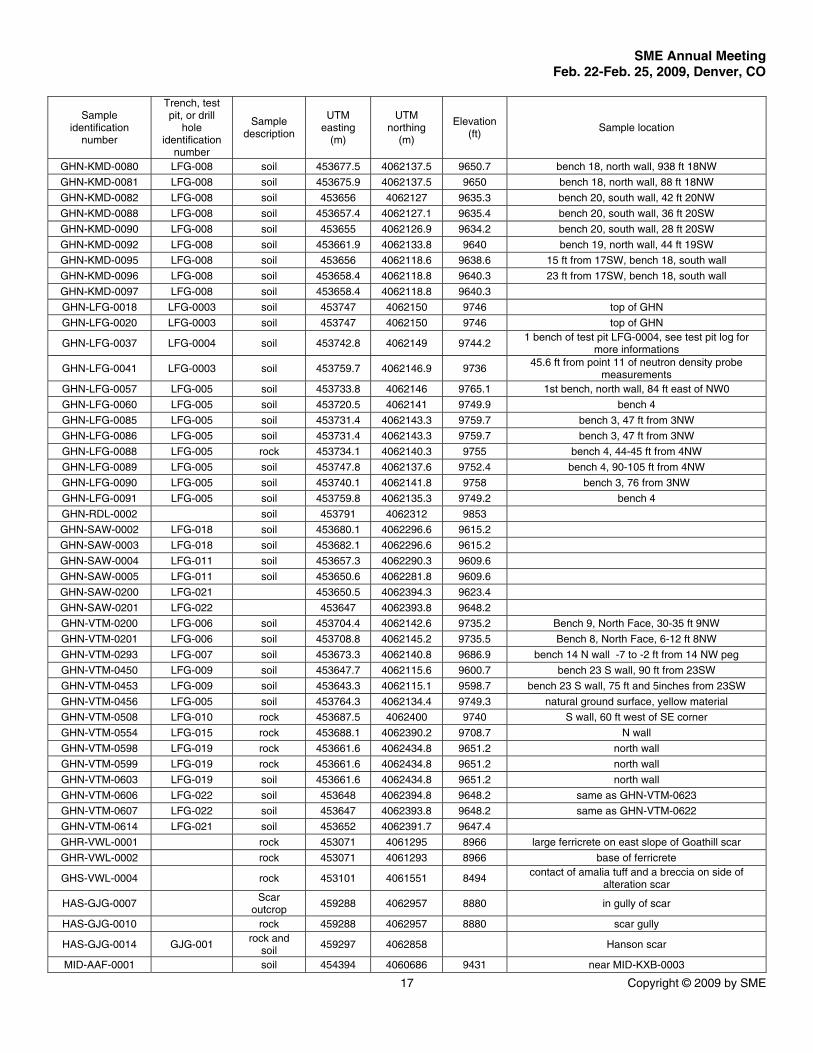
SME Annual Meeting Feb. 22-Feb. 25, 2009, Denver, CO
17 Copyright © 2009 by SME
Sample identification
number
Trench, test pit, or drill
hole identification
number
Sample description
UTM easting
(m)
UTM northing
(m)
Elevation (ft)
Sample location
GHN-KMD-0080 LFG-008 soil 453677.5 4062137.5 9650.7 bench 18, north wall, 938 ft 18NW
GHN-KMD-0081 LFG-008 soil 453675.9 4062137.5 9650 bench 18, north wall, 88 ft 18NW
GHN-KMD-0082 LFG-008 soil 453656 4062127 9635.3 bench 20, south wall, 42 ft 20NW
GHN-KMD-0088 LFG-008 soil 453657.4 4062127.1 9635.4 bench 20, south wall, 36 ft 20SW
GHN-KMD-0090 LFG-008 soil 453655 4062126.9 9634.2 bench 20, south wall, 28 ft 20SW
GHN-KMD-0092 LFG-008 soil 453661.9 4062133.8 9640 bench 19, north wall, 44 ft 19SW
GHN-KMD-0095 LFG-008 soil 453656 4062118.6 9638.6 15 ft from 17SW, bench 18, south wall
GHN-KMD-0096 LFG-008 soil 453658.4 4062118.8 9640.3 23 ft from 17SW, bench 18, south wall
GHN-KMD-0097 LFG-008 soil 453658.4 4062118.8 9640.3
GHN-LFG-0018 LFG-0003 soil 453747 4062150 9746 top of GHN
GHN-LFG-0020 LFG-0003 soil 453747 4062150 9746 top of GHN
GHN-LFG-0037 LFG-0004 soil 453742.8 4062149 9744.2 1 bench of test pit LFG-0004, see test pit log for
more informations
GHN-LFG-0041 LFG-0003 soil 453759.7 4062146.9 9736 45.6 ft from point 11 of neutron density probe
measurements GHN-LFG-0057 LFG-005 soil 453733.8 4062146 9765.1 1st bench, north wall, 84 ft east of NW0
GHN-LFG-0060 LFG-005 soil 453720.5 4062141 9749.9 bench 4
GHN-LFG-0085 LFG-005 soil 453731.4 4062143.3 9759.7 bench 3, 47 ft from 3NW
GHN-LFG-0086 LFG-005 soil 453731.4 4062143.3 9759.7 bench 3, 47 ft from 3NW
GHN-LFG-0088 LFG-005 rock 453734.1 4062140.3 9755 bench 4, 44-45 ft from 4NW
GHN-LFG-0089 LFG-005 soil 453747.8 4062137.6 9752.4 bench 4, 90-105 ft from 4NW
GHN-LFG-0090 LFG-005 soil 453740.1 4062141.8 9758 bench 3, 76 from 3NW
GHN-LFG-0091 LFG-005 soil 453759.8 4062135.3 9749.2 bench 4
GHN-RDL-0002 soil 453791 4062312 9853
GHN-SAW-0002 LFG-018 soil 453680.1 4062296.6 9615.2
GHN-SAW-0003 LFG-018 soil 453682.1 4062296.6 9615.2
GHN-SAW-0004 LFG-011 soil 453657.3 4062290.3 9609.6
GHN-SAW-0005 LFG-011 soil 453650.6 4062281.8 9609.6
GHN-SAW-0200 LFG-021 453650.5 4062394.3 9623.4
GHN-SAW-0201 LFG-022 453647 4062393.8 9648.2
GHN-VTM-0200 LFG-006 soil 453704.4 4062142.6 9735.2 Bench 9, North Face, 30-35 ft 9NW
GHN-VTM-0201 LFG-006 soil 453708.8 4062145.2 9735.5 Bench 8, North Face, 6-12 ft 8NW
GHN-VTM-0293 LFG-007 soil 453673.3 4062140.8 9686.9 bench 14 N wall -7 to -2 ft from 14 NW peg
GHN-VTM-0450 LFG-009 soil 453647.7 4062115.6 9600.7 bench 23 S wall, 90 ft from 23SW
GHN-VTM-0453 LFG-009 soil 453643.3 4062115.1 9598.7 bench 23 S wall, 75 ft and 5inches from 23SW
GHN-VTM-0456 LFG-005 soil 453764.3 4062134.4 9749.3 natural ground surface, yellow material
GHN-VTM-0508 LFG-010 rock 453687.5 4062400 9740 S wall, 60 ft west of SE corner
GHN-VTM-0554 LFG-015 rock 453688.1 4062390.2 9708.7 N wall
GHN-VTM-0598 LFG-019 rock 453661.6 4062434.8 9651.2 north wall
GHN-VTM-0599 LFG-019 rock 453661.6 4062434.8 9651.2 north wall
GHN-VTM-0603 LFG-019 soil 453661.6 4062434.8 9651.2 north wall
GHN-VTM-0606 LFG-022 soil 453648 4062394.8 9648.2 same as GHN-VTM-0623
GHN-VTM-0607 LFG-022 soil 453647 4062393.8 9648.2 same as GHN-VTM-0622
GHN-VTM-0614 LFG-021 soil 453652 4062391.7 9647.4
GHR-VWL-0001 rock 453071 4061295 8966 large ferricrete on east slope of Goathill scar
GHR-VWL-0002 rock 453071 4061293 8966 base of ferricrete
GHS-VWL-0004 rock 453101 4061551 8494 contact of amalia tuff and a breccia on side of
alteration scar
HAS-GJG-0007 Scar
outcrop 459288 4062957 8880 in gully of scar
HAS-GJG-0010 rock 459288 4062957 8880 scar gully
HAS-GJG-0014 GJG-001 rock and
soil 459297 4062858 Hanson scar
MID-AAF-0001 soil 454394 4060686 9431 near MID-KXB-0003

SME Annual Meeting Feb. 22-Feb. 25, 2009, Denver, CO
18 Copyright © 2009 by SME
Sample identification
number
Trench, test pit, or drill
hole identification
number
Sample description
UTM easting
(m)
UTM northing
(m)
Elevation (ft)
Sample location
MID-VTM-0002 soil 454395 4060694 9441 near MID-KXB-0003
MIN-AAF-0001 colluvium 452374 4059911 7904 in forest SW of gas pipeline to admin bldg
MIN-AAF-0006 colluvium 452374 4059912 7904 in forest SW of gas pipeline to admin bldg
MIN-AAF-0010 debris flow 452366 4059925 7900 west of MIN-AAF-0001
MIN-AAF-0012 452363 4059922 7861 west of MIN-AAF-0001
MIN-AAF-0013 debris flow 452374 4059930 7858 north of MIN-AAF-0012
MIN-AAF-0015 debris flow 452366 4059925 7900 north of MIN-AAF-0012
MIN-GFA-0001 debris flow 452331 405989 7791
MIN-GFA-0003 debris flow 452331 4059891 7791
MIN-GFA-0005 452331 4059891 7791
MIN-GFA-0006 debris flow 452331 4059891 7791
MIN-GFA-0007 debris flow 452331 405989 7791
MIN-GFA-0009 452331 405989 7791
MIN-SAN-0001 debris flow 452369 4059919 7966 debris flow, site of in situ test MIN-AAF-0001
MIN-VTM-0002 soil along road above headframe, below powerline,
alunite outcrop MIN-VTM-0003 VTM-001 colluvium 455648.3 4060959.7 8120
MIN-VTM-0004 VTM-001 colluvium 455648.3 4060959.7 8120
MIN-VTM-0006 VTM-001 colluvium 455648.3 4060959.7 8120
MIN-VTM-0007 VTM-001 colluvium 455648.3 4060959.7 8120
MIN-VTM-0008 VTM-001 colluvium 455648.3 4060959.7 8120
MIN-VTM-0009 VTM-001 colluvium 455648.3 4060959.7 8120
PIT-LFG-0011 soil 453845 4061403 9932
PIT-LFG-0013 soil 453659 4061819 9947 Crest of Goathill North Scar
PIT-RDL-0002 rock 453822 4061505 9912
PIT-VCV-0001 538420 core 453678.2 4061878.7 9630 core shed
PIT-VCV-0002 538420 core 453678.2 4061878.7 9625 core shed
PIT-VCV-0003 315328 core 453086.6 4061207.8 8557 core shed
PIT-VCV-0004 538420 core 453678.2 4061878.7 9901 core shed
PIT-VCV-0005 538420 core 453678.2 4061878.7 9911 core shed
PIT-VCV-0006 538420 core 453678.2 4061878.7 9918 core shed
PIT-VCV-0007 538420 core 453678.2 4061878.7 9318 core shed
PIT-VCV-0008 538420 core 453678.2 4061878.7 9315 core shed
PIT-VCV-0009 538420 core 453678.2 4061878.7 9305 core shed
PIT-VCV-0010 538420 core 453678.2 4061878.7 8819 core shed
PIT-VCV-0011 538420 core 453678.2 4061878.7 8827 core shed
PIT-VCV-0012 538420 core 453678.2 4061878.7 9490 core shed
PIT-VCV-0013 538420 core 453678.2 4061878.7 9479 core shed
PIT-VCV-0014 538420 core 453678.2 4061878.7 9471 core shed
PIT-VCV-0015 631587 core 454185.6 4062158.5 8140 core shed
PIT-VCV-0016 631587 core 454185.6 4062158.5 8346 core shed
PIT-VCV-0017 631587 core 454185.6 4062158.5 8175 core shed
PIT-VCV-0018 631587 core 454185.6 4062158.5 8182 core shed
PIT-VCV-0019 480680 core core shed
PIT-VCV-0020 480680 core core shed
PIT-VCV-0021 480680 core core shed
PIT-VCV-0022 480680 core core shed
PIT-VCV-0023 480680 core core shed
PIT-VCV-0024 480680 core core shed
PIT-VCV-0025 590539 core 454039.9 4062034.6 9276 core shed
PIT-VCV-0026 590539 core 454039.9 4062034.6 9273 core shed
PIT-VCV-0027 590539 core 454039.9 4062034.6 9543 core shed

SME Annual Meeting Feb. 22-Feb. 25, 2009, Denver, CO
19 Copyright © 2009 by SME
Sample identification
number
Trench, test pit, or drill
hole identification
number
Sample description
UTM easting
(m)
UTM northing
(m)
Elevation (ft)
Sample location
PIT-VCV-0028 590539 core 454039.9 4062034.6 7667 core shed
PIT-VCV-0029 590539 core 454039.9 4062034.6 9076 core shed
PIT-VCV-0030 590539 core 454039.9 4062034.6 9067 core shed
PIT-VTM-0001 rock 453800 4061694 top of pit
PIT-VTM-0002 rock 443841 4061908 top of pit
QPS-AAF-0019 alteration
scar 454135 4062582 9467 bench above pit
QPS-AAF-0020 alteration
scar 454135 4062582 9467 bench above pit
QPS-AAF-0022 alteration
scar 454135 4062582 9467 bench above pit
QPS-SAN-0001 waste rock 454146 4062551 9581 pit scar in between 2 in-situ test pits
QPS-VTM-0001 alteration
scar 454122 4062568 9463 bench above pit
ROC-KMD-0001 soil La Bocita campground at base of andesite outcrop
ROC-KMD-0002 rock La Bocita campground at base of andesite outcrop
ROC-VTM-0032 soil 466507 4055963 9404 Fourth of July Canyon
SCS-LFG-0004 soil 459926 4064047 9429
SCS-LFG-0005 soil 459973 4063905 9433
SCS-LFG-0006 soil 459973 4063905 9433
SCS-LFG-0007 soil 459973 4063905 9433
SCS-LFG-0008 rock 459973 4063905 9433
SGS-KXB-0002 COP-10 cuttings 455469.2 4061388 8435.89
SGS-KXB-0004 COP-10 cuttings 455469.2 4061388 8545.89
SGS-KXB-0006 COP-10 cuttings 455469.2 4061388 8545.89
SGS-KXB-0013 COP-10 cuttings 455469.2 4061388 8235.89
SGS-KXB-0033 COP-7 cuttings 455515.3 4061227.5 8404.23
SGS-LFG-0001 LFG-0001 soil 455162 4061343 Sulphur Gulch South
SPR-AAF-0001 waste rock 455245 4062313 9225
SPR-AAF-0003 455245 4062313 9225
SPR-SAN-0001 rock pile 455255 4062285 9314 near in-situ test SPR
SPR-VTM-0005 waste rock 455255 4062367 9320 top of Spring Gulch at bend in road
SPR-VTM-0008 waste rock 455257 4062287 9322 top of Spring Gulch at bend in road
SPR-VTM-0010 waste rock 455257 4062287 9322 top of Spring Gulch at bend in road
SPR-VTM-0011 waste rock 455257 4062287 9322 top of Spring Gulch at bend in road
SPR-VTM-0014 waste rock 454439 4062735 9539 Spring Gulch near old powder magazine
SPR-VTM-0017 waste rock 454439 4062735 9539 Spring Gulch near old powder magazine
SPR-VTM-0019 waste rock 454440 4062735 9539 Spring Gulch near old powder magazine
SPR-VTM-0021 waste rock 454440 4062735 9539 Spring Gulch near old powder magazine
SSSAAF-0001 waste rock 454131 4060898 9636 top of SSS
SSS-AAF-0004 waste rock 454131 4060898 9636 top of SSS
SSS-AAF-0005 waste rock 454132 4060901 9647 top of SSS
SSS-AAF-0007 waste rock 454132 4060901 9647 top of SSS
SSS-AAF-0009 waste rock 454132 4060902 9647 top of SSS
SSS-AAF-0011 waste rock 454132 4060901 9647 top of SSS
SSS-AAF-0012 waste rock 454132 4060902 9624 top of SSS
SSS-EHP-0001 SI-50 cuttings 454404 4060242 8756 Sugar Shack South rock pile, lower bench
SSS-EHP-0002 SI-50 cuttings 454404 4060242 8747 Sugar Shack South rock pile, lower bench
SSS-EHP-0003 SI-50 cuttings 454404 4060242 8737 Sugar Shack South rock pile, lower bench
SSS-EHP-0006 SI-50 cuttings 454404 4060242 8707 Sugar Shack South rock pile, lower bench
SSS-EHP-0011 SI-50 cuttings 454404 4060242 8667 Sugar Shack South rock pile, lower bench
SSS-EHP-0012 SI-50 cuttings 454404 4060242 8657 Sugar Shack South rock pile, lower bench
SSS-EHP-0014 SI-50 cuttings 454404 4060242 8637 Sugar Shack South rock pile, lower bench

SME Annual Meeting Feb. 22-Feb. 25, 2009, Denver, CO
20 Copyright © 2009 by SME
Sample identification
number
Trench, test pit, or drill
hole identification
number
Sample description
UTM easting
(m)
UTM northing
(m)
Elevation (ft)
Sample location
SSS-EHP-0015 SI-50 cuttings 454404 4060242 8627 Sugar Shack South rock pile, lower bench
SSS-EHP-0016 SI-50 cuttings 454404 4060242 8617 Sugar Shack South rock pile, lower bench
SSS-EHP-0017 SI-50 cuttings 454404 4060242 8607 Sugar Shack South rock pile, lower bench
SSS-EHP-0019 SI-50 cuttings 454404 4060242 8587 Sugar Shack South rock pile, lower bench
SSS-EHP-0020 SI-50 cuttings 454404 4060242 8577 Sugar Shack South rock pile, lower bench
SSS-EHP-0021 SI-50 cuttings 454404 4060242 8567 Sugar Shack South rock pile, lower bench
SSS-EHP-0022 SI-50 454404 4060242 8567 Sugar Shack South rock pile, lower bench
SSS-EHP-0023 SI-50 cuttings 454404 4060242 8547 Sugar Shack South rock pile, lower bench
SSS-EHP-0025 SI-50 cuttings 454404 4060242 8527 Sugar Shack South rock pile, lower bench
SSS-EHP-0029 SI-50 cuttings 454404 4060242 8497 Sugar Shack South rock pile, lower bench
SSS-EHP-0030 SI-50 cuttings 454404 4060242 8487 Sugar Shack South rock pile, lower bench
SSS-EHP-0031 SI-50 cuttings 454404 4060242 8477 Sugar Shack South rock pile, lower bench
SSS-EHP-0032 SI-50 cuttings 454404 4060242 8467 Sugar Shack South rock pile, lower bench
SSS-EHP0033 SI-50 cuttings 454404 4060242 8457 Sugar Shack South rock pile, lower bench
SSS-EHP-0034 SI-50 cuttings 454404 4060242 8447 Sugar Shack South rock pile, lower bench
SSS-EHP-0036 SI-50 cuttings 454404 4060242 8427 Sugar Shack South rock pile, lower bench
SSS-VEV-0001 rock 454286 4060187 8756 same as SSS-JMS-0001, lower lysimeter
SSS-VTM-0010 waste rock 454120 4060712 9703 near repeater site on SSS
SSS-VTM-0012 waste rock 454110 4060712 9696 near repeater site on SSS
SSS-VTM-0600 waste rock 454120 4060712 9703 near repeater site on SSS
SSW-AAF-0001 waste rock 453672 4060616 9022 middle road near drill hole 39-93
SSW-AAF-0002 waste rock 453672 4060617 9028 middle road near drill hole 39-93
SSW-AAF-0005 waste rock 453699 4060554 9038 middle road, south end
SSW-AAF-0007 waste rock 453687 4060551 8997 Middle road
SSW-SAN-0001 waste rock 453682 4060534 8969
SSW-SAN-0007 453975 4060822 9676 from the same location as SSW-SAN-0005
SSW-VTM-0001 waste rock 453963 4060829 9656 edge of SSW
SSW-VTM-0002 waste rock 453963 4060829 9656 edge of SSW
SSW-VTM-0016 waste rock 453841 4060491 9326
SSW-VTM-0019 waste rock 453841 4060491 9326
SSW-VTM-0022 waste rock 453838 4060499 9322
SSW-VTM-0023 waste rock 453838 4060499 9322
SSW-VTM-0026 waste rock 453832 4060592 9520
SSW-VTM-0028 waste rock 453832 4060592 9520
SSW-VTM-0030 waste rock 453831 4060588 9520
SWH-GJG-0008 rock 458732 4062439 8710 arroyo, SWH scars
SWH-GJG-0009 rock 458732 4062439 8710 Lower SWH
SWH-GJG-0012 rock with
soil 458732 4062439 8721 Lower SWH
SWH-GJG-0015 rock with
soil 458732 4062439 8746 Lower SWH

SME Annual Meeting Feb. 22-Feb. 25, 2009, Denver, CO
21 Copyright © 2009 by SME
APPENDIX 1 (Cont’d)
Table 1-3. Summary of hand specimen descriptions of samples tested for point load and slake durability. Sample
identification number
Field description Color Grain size Alteration
GHN-EHP-0001 unit AE orange brown sandy gravel with clay oxidized GHN-EHP-0002 unit AF gray with little yellow sandy gravel weathered GHN-EHP-0003 rubble zone yellow sandy gravel with cobbles, clay oxidized GHN-EHP-0004 colluvium possible shear black silt-clay with organics GHN-EHP-0005 colluvium gryey bron sandy clay weathered GHN-EHP-0006 bedrock gray clay weathered GHN-EHP-0007 bedrock brown sandy gravel weathered GHN-HRS-0096 colluvium yellow fines with g ravel acid weathered GHN-JRM-0001 Unit J orange to yellowish green clayey gravel highly weathered
GHN-JRM-0002 Unit N Brown well graded gravel, fine to coarse
gravel propylitic
GHN-JRM-0008 Unit N Dark Brown GHN-JRM-0009 Unit J Light greay (light yellowish) argilic + weathering GHN-JRM-0022 Unit K grey clay to gravel GHN-JRM-0027 Unit K clay-sand-pebble weathered GHN-JRM-0031 Unit O GHN-JRM-0037 unit AC orange brown less weathered GHN-JRM-0038 unit AD mottled gray, brown, orange yellow brown GHN-JRM-0039 unit AD mottled gray, yellow, brown clayey gravel with cobbles, boulder
GHN-JRM-0040 unit AD mottled gray, brown, yellow clayey gravel with cobbles,
boulder oxidized
GHN-JRM-0047 unit AD mottled gray, brown, orange yellow brown GHN-KMD-0013 Unit O dark brown w/ orange clayey gravel weathered
GHN-KMD-0014 Unit K dark greenish gray sandy gravel little weathering, epidote alteration
GHN-KMD-0015 Unit R dark brown w/ orange sandy gravel weathered epidote to iron, Mn oxide
GHN-KMD-0016 Unit S brownish gray w/ green sandy gravel epidote
GHN-KMD-0017 Unit I, sandy clay w/ some
gravel grayish yellow sandy clay QSP Altered
GHN-KMD-0018 Unit J, clayey gravel with
coarse gravel dark orange brown clayey gravel
minor oxidation; Fe, Mn oxides
GHN-KMD-0019 Unit O, clayey gravel with some
coarse gravel grayish brown clayey gravel epidote weathered
GHN-KMD-0026 Unit M orange-brown clayey gravel oxidized GHN-KMD-0027 Unit N dark orange clayey sand with gravel oxidized GHN-KMD-0028 Unit N bright greenish orange clayey gravel oxidized GHN-KMD-0048 Unit S dark brown to black sandy gravel propollytic GHN-KMD-0050 Unit O brown GHN-KMD-0051 Unit O dark brown GHN-KMD-0052 Unit K purplish gray GHN-KMD-0053 contact between Unit N-J brown GHN-KMD-0054 Unit J orange brown GHN-KMD-0055 Unit I yellow brown GHN-KMD-0056 Unit V brown and orange sand gravel with clay weathered
GHN-KMD-0057 Unit O brown and greenish gray sandy gravel weathered proplytitic
GHN-KMD-0062 Unit N orange brown sandy gravel with clay weathered GHN-KMD-0063 Unit J orange brown clayey gravel with sand weathered GHN-KMD-0064 Unit U orange brown clayey gravel with sand weathered GHN-KMD-0065 Unit V dark brown to purplish black sandy gravel with some cobbles propolytic GHN-KMD-0071 Unit U, V contact brown orange clay to cobble weathered GHN-KMD-0072 coarse zone in Unit O brown cobbles weathered GHN-KMD-0073 Unit O brown cobbles to clay weathered GHN-KMD-0074 Unit U brown GHN-KMD-0077 Unit U dark brown fine sand, clay

SME Annual Meeting Feb. 22-Feb. 25, 2009, Denver, CO
22 Copyright © 2009 by SME
Sample identification
number Field description Color Grain size Alteration
GHN-KMD-0078 Unit U orange brown clay to large cobble oxidized GHN-KMD-0079 Unit U medium brown, orange clay to large cobble oxidized GHN-KMD-0080 Unit S dark brown GHN-KMD-0081 Unit R brown clay to cobble GHN-KMD-0082 Unit O dark brown clay to cobble GHN-KMD-0088 Unit O yellow orange clay to cobble oxidixed GHN-KMD-0090 Unit O orange brown clay to cobble GHN-KMD-0092 Unit O1 greenish GHN-KMD-0095 Unit C yellow gray clay to gravel GHN-KMD-0096 Unit J GHN-KMD-0097 Unit O GHN-LFG-0018 traffic zone grey orange GHN-LFG-0020 traffic zone GHN-LFG-0037 Unit H orange gravel sand with some fine GHN-LFG-0041 rubble zone brown/olive GHN-LFG-0057 Unit J GHN-LFG-0060 rubble zone GHN-LFG-0085 Unit K gravel with clay and boulders weathered GHN-LFG-0086 Unit N brown orange oxidized GHN-LFG-0088 Unit O brown to gray oxidized GHN-LFG-0089 rubble zone gray to purple GHN-LFG-0090 Unit P brown GHN-LFG-0091 colluvium yellow to green to brown clay to rubble oxidized GHN-RDL-0002 white to light gray gravel with fines QSP GHN-RDL-0003 white to light gray fine porphyritic QSP GHN-SAW-0002 unit AF gray fine GHN-SAW-0003 unit AF gray GHN-SAW-0004 unit AD yellow GHN-SAW-0005 Unit E brown GHN-SAW-0200 colluvium olive gray to dark brown gravel with fines GHN-SAW-0201 colluvium light-medium brown gravel with fines
GHN-VTM-0200 Unit N orange brown; clay to
cobbles orange brown clay to cobbles clay oxidized
GHN-VTM-0201 Unit N; clay to boulders (up to
30cm) light brown to orange clay to boulders oxidized clay
GHN-VTM-0263 Unit I orange yellow with gray clay to large cobbles oxidized GHN-VTM-0293 Unit I GHN-VTM-0450 Unit O dk brown coarse layer weathering GHN-VTM-0453 Unit O (clay rich) orange brown some gray sandy gravel with clay weathering GHN-VTM-0456 weathered bedrock yellowish to greenish brown clay to cobble oxidized GHN-VTM-0508 colluvium brown fine GHN-VTM-0554 bedrock gray to red gray to green gray fine grained
GHN-VTM-0598 rubble zone yelow to gray mostly cobbles with some clay-
sand matrix weathered
GHN-VTM-0599 saprolitic bedrock gray clay to gravel weathered GHN-VTM-0603 weathered bedrock black brown clay to cobble weathered GHN-VTM-0606 colluvium brown clay GHN-VTM-0607 rubbe zone yellow gray boulders with fines GHN-VTM-0614 colluvium greenish gray to white gray GHR-VWL-0001 reddish brown acid sulfate GHR-VWL-0002 orange brown acid sulfate
GHS-VWL-0004 Ferricrete dark brown to orange strong QSP of host
rock HAS-GJG-0006 andesite gry, brown, green QSP, prop HAS-GJG-0007 andesite gray unweathered QSP
HAS-GJG-0008 rock fragments and residual
soil brown to tan cobbles with fines

SME Annual Meeting Feb. 22-Feb. 25, 2009, Denver, CO
23 Copyright © 2009 by SME
Sample identification
number Field description Color Grain size Alteration
HAS-GJG-0009 gray to white andesite gray, white cobbles with fines QSP HAS-GJG-0010 gray to white andesite gray, white cobbles with fines QSP
HAS-GJG-0014 light gray to brown to olive
mottled gravel with slit and some clay qsp
MID-AAF-0001 well graded soil yellow brown gravel with fines QSP of Amalia and
prophyry MID-VTM-0002 yellow brown boulders to clay QSP
MIN-AAF-0001 tan gravelly sand with boulders and
fines QSP
MIN-AAF-0006 tan gravelly sand with boulders and
fines QSP
MIN-AAF-0010 well graded debris flow light brown cobbles to clay QSP MIN-AAF-0012 light brown cobbles to clay QSP MIN-AAF-0013 well graded debris flow light brown cobbles to clay QSP MIN-AAF-0015 well graded debris flow light brown cobbles to clay QSP MIN-GFA-0001 well graded brown boulders to clay QSP MIN-GFA-0003 well graded brown boulder to clay QSP MIN-GFA-0005 well graded brow boulders to clay MIN-GFA-0006 poorly graded gravel brown gravel to fine silt QSP MIN-GFA-0007 poorly garded sandy gravel brown cobble to fine silt QSP MIN-GFA-0009 light redish brown coarse gravel to sandy MIN-SAN-0001 well graded light brown cobbles to clay MIN-VTM-0002 rock pink, white fine to coarse acid sulfate MIN-VTM-0003 debris flow, unit A2 light brown cobbles to clay/silt MIN-VTM-0004 debris flow, unit A3 light brown cobbles to clay/silt MIN-VTM-0006 debris flow, unit A5 light brown cobbles to clay/silt MIN-VTM-0007 debris flow, unit A6 light brown cobbles to clay/silt MIN-VTM-0008 debris flow, unit A1 dark brown cobbles to clay/silt MIN-VTM-0009 debris flow, unit A1 light brown cobbles to clay/silt PIT-LFG-0011 dark brown to black sandy, gravel, silty-clay fresh weathered PIT-LFG-0013 yellowish Brown Clay and Sand silty matrix highly weathered PIT-RDL-0002 Amalia light gray fine grained PIT-VCV-0001 andesite gray brown QSP/oxidized PIT-VCV-0002 andesite light green to gray prophylitic PIT-VCV-0003 andesite light green to gray prophylitic
PIT-VCV-0004 Amalia white to gray QSP/yellow
oxidation PIT-VCV-0005 Amalia Tuff gray/light yellow slight oxidized PIT-VCV-0006 Amalia Tuff gray-white slight oxidized PIT-VCV-0007 andesite breccia green gray clasts to 2 inch prophylitic PIT-VCV-0008 porphytic andesite gray-green 1-2 mm phenocrysts prophylitic chlorite PIT-VCV-0009 andesite breccia 1-3 cm prophylitic PIT-VCV-0010 Goat Hill porphyry white gray prophylitic PIT-VCV-0011 Goat Hill porphyry white gray 1-5 mm phenocrysts prophylitic chlorite PIT-VCV-0012 porphyritic andesite green 1-3 mm phenocrysts prophylitic PIT-VCV-0013 porphyritic andesite green gray 1-3 mm phenocrysts prophylitic PIT-VCV-0014 porphyritic andesite gray 1-5 mm phenocrysts QSP, pyrite PIT-VCV-0015 aplite pink prophylitic PIT-VCV-0016 granite pink with black 1-5 mm phenocrysts prophylitic PIT-VCV-0017 andesite gray, slight green fine grained PIT-VCV-0018 granite white, gray, green prophylitic PIT-VCV-0019 andesite gray brown QSP PIT-VCV-0020 andesite gray brown QSP PIT-VCV-0021 andesite gray brown QSP PIT-VCV-0022 andesite gray green prophylitic PIT-VCV-0023 prophylitic andesite green PIT-VCV-0024 andesite breccia green, purple prophylitic

SME Annual Meeting Feb. 22-Feb. 25, 2009, Denver, CO
24 Copyright © 2009 by SME
Sample identification
number Field description Color Grain size Alteration
PIT-VCV-0025 oxidized porphyry gray, white, brown oxidized PIT-VCV-0026 oxidized porphyry gray, white, brown oxidized PIT-VCV-0027 andesite gray brown QSP PIT-VCV-0028 aplite pink QSP PIT-VCV-0029 andesite gray QSP, pyrite
PIT-VCV-0030 andesite gray brown QSP, pyrite,
chlorite, prophylitic
PIT-VTM-0001 mapped as water mellon
breccia, part of Christmas Tree porphyry
gray to green fine to medium epidote, chlorite
PIT-VTM-0002 mapped as water mellon
breccia, part of Christmas Tree porphyry
gray to green fine to medium epidote, chlorite
QPS-AAF-0019 well graded GWGC yellow brown large rocks to clay QSP QPS-AAF-0020 well graded GWGC yellow brown large rocks to clay QSP QPS-AAF-0022 well graded GWGC brown large rocks to clay QSP QPS-SAN-0001 well graded brown boulders to clay QSP QPS-VTM-0001 well graded GWGC brown large rocks to clay QSP
ROC-KMD-0001 soil with large range of particle
size brown gravel with fines prophlytic
ROC-KMD-0002 andesite blue black fine with phenocrysts ROC-VTM-0032 soil with roots black clay to gravel less weathered
SCS-LFG-0004 light gray to white with severe
iron stainy along joints Sand/Silty clay QSP Altered
SCS-LFG-0005 light brown with yellow
greewish sand/clayey gravel highly altereted
SCS-LFG-0006 Block size (50mm) indicates
degree of weathering light grey with brown
SCS-LFG-0007 rock with severe iron stainy along joints SCS-LFG-0008 SGS-KXB-0002 gray sand SGS-KXB-0004 gray sand SGS-KXB-0006 gray sand SGS-KXB-0013 yellow brown sand with pebble SGS-KXB-0033 grren and gray coarse sand to gravel prophyitic SGS-LFG-0001 10YR 6/8 2 inches to sand or fine SPR-AAF-0001 brown to dark brown gray GPGC cobbles to fines propyllitic SPR-AAF-0003 matrix supported brown cobbles to fines prop SPR-SAN-0001 well graded brown angular prop SPR-VTM-0005 rocky soil dark gray gravel with fines, cobbles argillic
SPR-VTM-0008 loose rocky soilwith grass roots dark gray gravel with fines, cobbles argillic, calcite,
chlorite
SPR-VTM-0010 loose rocky soil with grass
roots dark gray gravel with fines, cobbles
argillic, calcite, chlorite
SPR-VTM-0011 loose rocky soil with grass
roots dark gray gravel with fines, cobbles
argillic, calcite, chlorite
SPR-VTM-0014 weathered rocky soil gray clayey gravel with cobbles QSP SPR-VTM-0017 weathered rocky soil dark gray clayey gravel with cobbles QSP SPR-VTM-0019 rocky clayey soil gray with brown clayey gravel with cobbles QSP SPR-VTM-0021 rocky clayey soil gray with brown clayey gravel with cobbles QSP SSSAAF-0001 rocky light brown cobbles with fines QSP SSS-AAF-0004 light brown cobbles with fines QSP SSS-AAF-0005 orange brown cobbles with fines QSP SSS-AAF-0007 orange brown cobbles with fines QSP SSS-AAF-0009 gray with some brown cobbles with fines QSP SSS-AAF-0011 brown layer of in situ block brown cobbles with fines QSP SSS-AAF-0012 gray with some brown cobbles with fines QSP SSS-EHP-0001 light gray gravel with fines SSS-EHP-0002 light gray gravel with fines

SME Annual Meeting Feb. 22-Feb. 25, 2009, Denver, CO
25 Copyright © 2009 by SME
Sample identification
number Field description Color Grain size Alteration
SSS-EHP-0003 gray gravel with fines SSS-EHP-0006 gray gravel with fines SSS-EHP-0011 gray gravel with fines SSS-EHP-0012 gray gravel with fines SSS-EHP-0014 gray gravel with fines yellow coatings SSS-EHP-0015 gray gravel with fines SSS-EHP-0016 orange brown sandy gravel SSS-EHP-0017 orange brown sandy gravel SSS-EHP-0019 orange brown gravel with fines SSS-EHP-0020 yellow gray gravel with fines SSS-EHP-0021 yellow gray gravel with fines SSS-EHP-0022 yellow gray gravel with fines SSS-EHP-0023 light gray gravel with fines SSS-EHP-0025 gray gravel with fines SSS-EHP-0029 light gray cobbles with gravel SSS-EHP-0030 gray cobbles with gravel yellow coating SSS-EHP-0031 gray cobbles with gravel yellow coating SSS-EHP-0032 gray cobbles with gravel yellow coating SSS-EHP0033 gray to orange gray gravel with fines yellow coating SSS-EHP-0034 orange gray gravel with a lot of fines SSS-EHP-0036 gray sandy gravel
SSS-VEV-0001 ferricrete boulder, probably from alteration scar befor
covering with rock pile dark orange to brown ferricrete
SSS-VTM-0010 rocky soil brown gray gravel with fines, cobbles argillic, some
chlorite
SSS-VTM-0012 loose rock pile material brown gravel with fines, cobbles argillic, some
chlorite
SSS-VTM-0600 rocky soil brown gray gravel with fines, cobbles argillic, some
chlorite SSW-AAF-0001 well graded soil brown gravey sand QSP SSW-AAF-0002 select clay lense white gray clayey gravel QSP SSW-AAF-0005 well graded brown cobbles to clay QSP SSW-AAF-0007 well graded brown cobbles to clay QSP SSW-SAN-0001 well graded light brown cobbles to clay QSP SSW-SAN-0007
SSW-VTM-0001 rocky soii with clay lenses brown gravel with fines QSP acid generating
SSW-VTM-0002 rocky soii with clay lenses brown gravel with fines QSP acid generating
SSW-VTM-0016 dark gray with some yellow cobbles to clay QSP
SSW-VTM-0019 layered, dipping 15 degrees on
north wall dark olive gray to brown with
some yellow orange cobbles to clay QSP
SSW-VTM-0022 layered, dipping 15 degrees on
north wall gray with some yellow orange cobbles to clay QSP
SSW-VTM-0023 layered, dipping 15 degrees on
north wall gray with some yellow orange cobbles to clay QSP
SSW-VTM-0026 yellow orange cobbles to clay QSP SSW-VTM-0028 yellow orange cobbles to clay QSP SSW-VTM-0030 yellow brown cobbles to clay QSP SWH-GJG-0008 bedrock gray QSP SWH-GJG-0009 weathered bedrock brown rock, little fines QSP SWH-GJG-0012 soil to weathered bedrock cobbles to sands QSP SWH-GJG-0015 brown to green gray cobbles with fines

SME Annual Meeting Feb. 22-Feb. 25, 2009, Denver, CO
26 Copyright © 2009 by SME
APPENDIX 1 (Cont’d)
Table 1-4. Summary of lithology and hydrothermal alteration for samples tested for slake durability and point load. Sample rhyolite (Amalia Tuff) % Andesite % Intrusive aplite % QSP % Propylitic % Argillic %
GHN-EHP-0007 100 GHN-JRM-0001 100 90 2 GHN-KMD-0013 25 75 30 5 3 GHN-KMD-0014 10 90 25 20 GHN-KMD-0015 0 100 25 12 3 GHN-KMD-0016 0 100 25 20 GHN-KMD-0017 17 83 50 2 20 GHN-KMD-0018 35 65 20 8 GHN-KMD-0019 0 100 10 25 GHN-KMD-0026 60 40 40 1 GHN-KMD-0027 50 50 30 7 GHN-KMD-0051 60 40 25 15 3 GHN-KMD-0052 GHN-KMD-0053 50 50 30 5 GHN-KMD-0054 GHN-KMD-0055 20 80 50 GHN-KMD-0056 70 30 30 7 2 GHN-KMD-0057 100 15 40 GHN-KMD-0065 60 40 20 5 GHN-KMD-0071 40 30 30 25 10 GHN-KMD-0072 GHN-KMD-0073 10 90 25 12 2 GHN-KMD-0074 20 80 35 10 GHN-KMD-0079 20 80 50 7 3 GHN-KMD-0080 GHN-KMD-0081 50 50 55 10 3 GHN-KMD-0082 95 5 30 15 GHN-KMD-0088 100 60 10 GHN-KMD-0096 100 0 70 GHN-KMD-0097 60 2 GHN-LFG-0085 90 10 25 2 4 GHN-LFG-0086 GHN-LFG-0088 0 100 25 12 3 GHN-LFG-0089 GHN-LFG-0090 0 100 25 8 3 GHN-LFG-0091 100 0 70 6 GHN-RDL-0002 100 GHN-RDL-0003 100 GHN-VTM-0263 12 88 3 55 GHN-VTM-0450 10 80 10 15 8 5 GHN-VTM-0453 0 75 25 55 15 4 GHN-VTM-0456 100 GHN-VTM-0508 0 100 40 10 GHN-VTM-0554 100 GHN-VTM-0599 100 75 GHN-VTM-0603 75 5 GHN-VTM-0606 75 25 40 20 GHN-VTM-0614 0 100 70 25 MIN-GFA-0001 1 99 65 5 MIN-GFA-0003 100 85 2 MIN-GFA-0005 99 1 70 10 MIN-GFA-0009 100 70 MIN-SAN-0002 5 95 30 3 MIN-VTM-0003 100 PIT-LFG-0013 100

SME Annual Meeting Feb. 22-Feb. 25, 2009, Denver, CO
27 Copyright © 2009 by SME
Sample rhyolite (Amalia Tuff) % Andesite % Intrusive aplite % QSP % Propylitic % Argillic % PIT-RDL-0002 100 PIT-VCV-0001 100 25 1 PIT-VCV-0002 100 80 PIT-VCV-0003 100 40 5 PIT-VCV-0004 100 60 PIT-VCV-0005 100 20 PIT-VCV-0006 100 25 PIT-VCV-0007 100 40 5 PIT-VCV-0008 100 10 20 PIT-VCV-0009 100 20 15 PIT-VCV-0010 100 50 10 PIT-VCV-0011 100 60 PIT-VCV-0012 100 60 3 PIT-VCV-0013 100 65 PIT-VCV-0014 100 50 PIT-VCV-0015 100 65 PIT-VCV-0016 100 25 PIT-VCV-0017 100 30 PIT-VCV-0018 100 35 PIT-VCV-0019 100 70 PIT-VCV-0020 100 90 PIT-VCV-0021 100 85 PIT-VCV-0022 100 50 PIT-VCV-0023 100 60 PIT-VCV-0024 100 60 PIT-VCV-0025 100 75 PIT-VCV-0026 100 70 PIT-VCV-0027 100 90 PIT-VCV-0028 100 60 PIT-VCV-0029 100 45 PIT-VCV-0030 100 70 PIT-VTM-0001 100 PIT-VTM-0002 100 QPS-AAF-0001 80 90 QPS-AAF-0003 80 20 QPS-AAF-0005 80 20 QPS-AAF-0009 80 20 QPS-SAN-0002 95 5 30 7 ROC-KMD-0001 100 ROC-KMD-0002 100 ROC-VTM-0032 0 100 8 2 SCS-LFG-0004 0 0 100 32 68 SCS-LFG-0005 0 0 100 30 20 SCS-LFG-0006 0 0 100 45 55 SCS-LFG-0007 100 SCS-LFG-0008 100 SPR-SAN-0002 100 35 7 SPR-VTM-0005 100 SPR-VTM-0008 100 SPR-VTM-0010 100 SPR-VTM-0017 100 SSS-AAF-0004 100 SSS-AAF-0005 100 SSS-AAF-0009 100 SSS-EHP-0014 100 SSS-EHP-0015 100 SSS-EHP-0019 100

SME Annual Meeting Feb. 22-Feb. 25, 2009, Denver, CO
28 Copyright © 2009 by SME
Sample rhyolite (Amalia Tuff) % Andesite % Intrusive aplite % QSP % Propylitic % Argillic % SSS-EHP-0020 100 SSS-EHP-0023 100 SSS-EHP-0025 100 SSS-VTM-0600 80 20 SSW-AAF-0001 80 20 SSW-AAF-0002 80 20 SSW-AAF-0005 SSW-AAF-0007 SSW-AAF-0009 SSW-SAN-0002 100 25 5 SSW-SAN-0006 95 3 2 50 1

SME Annual Meeting Feb. 22-Feb. 25, 2009, Denver, CO
29 Copyright © 2009 by SME
APPENDIX 1 (Cont’d)
Table 1-5. Mineralogy in weight percent for samples tested for slake durability and point load, as determined by modified ModAn (McLemore et al., 2009).
Sample Quartz K-feldspar Plagioclase Epidote Calcite Pyrite Fe Oxide Gypsum Molybdenite Biotite GHN-EHP-0001 35 24 13 0.9 1 2 0.1 GHN-EHP-0002 47 21 1 0.6 0.1 0.9 0.6 GHN-JRM-0001 35 7 15 0.01 0.4 3 1.2 0.01 GHN-KMD-0013 29 20 16 0.2 0.4 0.1 6 1 0.01 0.01 GHN-KMD-0014 19 37 19 9 1.4 0.2 1 0.04 0.01 0.01 GHN-KMD-0015 30 20 15 0.1 1.4 0.1 5 0.7 GHN-KMD-0016 24 22 22 12 0.01 0.2 0.5 1 GHN-KMD-0017 32 3 21 0.1 3 0.6 1.5 GHN-KMD-0018 39 25 4 0.4 0.4 1.7 1.2 GHN-KMD-0019 24 18 24 7 2 0.1 2 0.24 GHN-KMD-0026 36 29 15 0.01 0.3 0.1 4 0.6 GHN-KMD-0027 35 26 11 0.01 0.7 0.01 5 0.6 GHN-KMD-0048 25 24 24 10 0.4 0.1 2 GHN-KMD-0050 25 23 22 8 0.9 0.1 2 GHN-KMD-0051 27 25 19 4 1.8 0.2 3 2 GHN-KMD-0052 29 20 16 3 2.5 2 2 0.4 GHN-KMD-0053 38 27 8 1 0.7 0.1 3 0.6 GHN-KMD-0054 28 24 17 5 0.5 0.5 3 1 GHN-KMD-0055 48 14 5 0.5 3 0.7 1 GHN-KMD-0056 30 24 20 3 0.5 0.2 3 0.41 GHN-KMD-0057 26 17 25 7 1 0.2 2 GHN-KMD-0062 35 21 10 1 0.01 5 0.1 GHN-KMD-0063 33 16 13 0.1 0.2 1 4 0 GHN-KMD-0064 33 27 16 2 0.1 0.3 4 GHN-KMD-0065 29 22 17 3 0.4 0.1 5 0.3 0.01 GHN-KMD-0071 30 23 20 2 0.4 0.8 2 0.8 GHN-KMD-0072 27 24 20 6 1 0.1 3 GHN-KMD-0073 25 22 21 5 1 0.3 2 0.4 GHN-KMD-0074 28 21 18 5 0.4 0.2 3 0.4 GHN-KMD-0077 32 26 19 2 0.4 0.1 3.5 GHN-KMD-0078 35 26 18 0.4 0.4 3 GHN-KMD-0079 31 23 17 2 0.5 0.3 4 0.8 GHN-KMD-0080 24 23 23 10 0.4 0.1 2 GHN-KMD-0081 33 21 18 1 0.5 0.6 3 0.7 GHN-KMD-0082 26 23 23 5 1 0.3 2 1.2 0.01 GHN-KMD-0088 29 23 19 0.01 0.2 0.9 3 1.8 GHN-KMD-0092 30 20 17 0.3 0.7 3 GHN-KMD-0095 48 25 0 0.3 0.7 0.2 GHN-KMD-0096 46 19 2 0.01 0.5 0.3 0.4 0.81 0.01 GHN-KMD-0097 39 25 2 0.01 0.3 1 0.4 0 GHN-KMD-0100 34 25 11 0.5 0.01 4 GHN-LFG-0085 27 22 17 7 0.4 0.1 4 0.2 GHN-LFG-0086 26 22 16 7 0.3 2 2 1.7 GHN-LFG-0088 24 24 22 8 2 0.1 2 0.28 GHN-LFG-0089 GHN-LFG-0090 23 21 23 3 1.2 1 4 1.5 GHN-LFG-0091 55 6 4 0.001 1 1 6 GHN-RDL-0002 0.02 GHN-SAW-0200 0.23 GHN-SAW-0201 0.21 GHN-VTM-0263 45 14 0.6 0.5 4 0.3 0.7 GHN-VTM-0293 42 14 4 1 3 0.7 2 GHN-VTM-0450 26 20 22 5 0.6 0.4 4 0.01 GHN-VTM-0453 25 20 17 1 1 2 4 2 1

SME Annual Meeting Feb. 22-Feb. 25, 2009, Denver, CO
30 Copyright © 2009 by SME
Sample Quartz K-feldspar Plagioclase Epidote Calcite Pyrite Fe Oxide Gypsum Molybdenite Biotite GHN-VTM-0456 GHN-VTM-0508 44 13 11 2 1 3 4.8 0.001 GHN-VTM-0599 30 13 3 0.1 5 0.4 4 0.2 GHN-VTM-0603 33 2 7 0 2 0.01 3 0.4 GHN-VTM-0606 49 12 8 0 0.001 0.001 1 1 0 0.001 GHN-VTM-0607 39 13 9 0.01 0.6 0.4 3 0.6 GHN-VTM-0614 31 1 1 3 0.3 0.1 6 GHR-VWL-0004 28 14 0.1 12 HAS-GJG-0006 21 21 4 4 2 8 HAS-GJG-0007 24 9 5 5 3 12 HAS-GJG-0008 28 6 3 0.4 15 HAS-GJG-0009 25 1 5 HAS-GJG-0010 45 0.2 1 5 MID-AAF-0001 32 13 14 0.1 0.8 4 3 MID-AAF-0002 35 10 9 0.2 0.6 4 3 MID-VTM-0002 49 19 2 0.01 0.2 2 0.01 0.7 MIN-AAF-0001 47 15 0.01 0.1 0.01 2 0.1 MIN-AAF-0004 45 22 0.1 0.1 0.01 2 0.1 MIN-AAF-0010 44 12 0.6 1 0.1 0.7 0.1 MIN-AAF-0013 48 22 0.3 0.01 1 0.08 MIN-GFA-0001 45 18 0.6 0.2 0.1 2 0.01 MIN-GFA-0003 43 16 5 0.5 3 0.3 0.01 MIN-GFA-0005 46 20 0.04 0.1 2 0.04 MIN-GFA-0009 48 16 0.7 0.1 0.1 2 0.1 MIN-SAN-0002 45 13 2 0.1 0.01 1 0.2 PIT-LFG-0013 39 0.6 17 0.3 0.9 0.5 PIT-RDL-0002 46 40 0.1 1 PIT-VCV-0001 25 30 15 0.01 1 7 0.01 0.2 PIT-VCV-0002 37 33 2 5 0.01 0.2 PIT-VCV-0003 23 17 29 0.5 7 0.3 PIT-VCV-0004 59 16 0.1 0.01 1 PIT-VCV-0005 58 12 0.1 0.01 1 0 PIT-VCV-0006 75 7 1E-04 PIT-VCV-0007 30 35 2 0.2 1 4 0.8 0.3 0.01 PIT-VCV-0008 41 17 2 0.9 5.3 3.7 0 2 PIT-VCV-0009 31 17 14 1.5 2.1 5.6 0 PIT-VCV-0010 28 32 19 0.01 2 3 0.01 0.2 3 PIT-VCV-0011 30 35 9 2 3 0.01 0.2 5 PIT-VCV-0012 48 18 1 0.01 0.8 3 1 0.1 PIT-VCV-0013 55 10 0.2 0.01 3 2 0.4 0.2 PIT-VCV-0014 47 19 0.2 0.01 2 2 0.7 0.2 PIT-VCV-0015 41 37 15 0.01 0.5 0.6 0.01 0.1 1 PIT-VCV-0016 29 38 14 0.01 2 1E-04 0.2 0.1 1 PIT-VCV-0017 33 38 7 0.01 1 0.9 0.1 0.2 2 PIT-VCV-0018 36 38 11 0.01 2 1 0.01 0.1 PIT-VCV-0019 30 4 0.01 0.1 0.9 1 4 PIT-VCV-0020 24 17 4 5 0.5 2 1 0.5 7 PIT-VCV-0021 23 16 15 0.01 0.05 3 0.01 7 0.03 0 PIT-VCV-0022 23 18 24 0.01 0.1 7 0.01 7 3 PIT-VCV-0023 26 14 18 0.01 0.1 9 0.01 9 0.01 0.01 PIT-VCV-0024 30 21 3 0.01 1 2 0.01 0.6 PIT-VCV-0025 40 18 0.7 0.01 0.8 6 0.01 0.3 PIT-VCV-0026 37 19 1 0.01 0.3 7 0.01 0.4 PIT-VCV-0027 28 28 6 0.01 0.7 5 0.4 0.2 PIT-VCV-0028 38 35 23 0.01 1 4 0.1 0.2 1 PIT-VCV-0029 55 15 6 0.3 PIT-VTM-0001 32 6 30 0.5 0.1 0.1 4

SME Annual Meeting Feb. 22-Feb. 25, 2009, Denver, CO
31 Copyright © 2009 by SME
Sample Quartz K-feldspar Plagioclase Epidote Calcite Pyrite Fe Oxide Gypsum Molybdenite Biotite PIT-VTM-0002 23 27 24 11 0.1 0.2 2 QPS-AAF-0001 38 12 13 0.01 0.7 0.2 2 0.9 QPS-AAF-0003 34 10 14 0.1 0.1 3 2 QPS-AAF-0005 34 6 14 0.01 0.09 3 2 QPS-AAF-0009 35 17 6 3 0.3 0.3 3 0.9 QPS-SAN-0002 42 4 10 0.2 0.8 1 QPS-VTM-0001 33 12 16 0.01 0.4 0.2 4 1 ROC-KMD-0002 16 20 36 0.2 6 0.8 0 ROC-VTM-0032 19 18 24 1 6 0.02 1 SCS-LFG-0004 17 0.001 0.001 2 8 13 SCS-LFG-0005 34 6 5 2 0.1 0.3 2.3 SCS-LFG-0006 30 18 21 0.1 0.5 0.1 1 6 SPR-AAF-0001 26 17 24 5 0.6 0.5 2 0.6 SPR-AAF-0003 25 18 22 2 0.4 0.5 4 1 SPR-SAN-0002 25 21 18 2 0.5 0.3 4 2 SPR-VTM-0012 56 11 0.8 0.01 0.1 0.3 0.7 0.04 SPR-VTM-0017 49 18 0.1 0.9 0.3 0.02 SPR-VTM-0021 51 22 0.1 0.2 0.5 0.02 SSS-AAF-0001 29 14 7 0.2 0.4 6 3 SSS-AAF-0005 38 4 5 0.01 0.4 4 1.21 SSS-AAF-0009 47 15 1 0.4 0.5 1 0 SSS-VTM-0600 36 17 13 0.2 0.2 4 0 SSW-AAF-0001 25 21 20 0 0.1 0.4 6 0.51 SSW-AAF-0005 33 11 18 0.2 0.2 4 0 SSW-AAF-0007 34 16 10 0.1 1 2 2 SSW-AAF-0009 30 16 16 5 0.3 0.8 1 0 0.01 SSW-SAN-0002 32 8 18 0.01 0.1 0.3 2 2 0.01 SSW-SAN-0006 37 22 2 3 0.3 0.1 0.6 1 SSW-VTM-0001 49 3 6 0.3 0.4 4 2 SSW-VTM-0030 31 8 13 7 0.6 1 1 3.1 SWH-GJG-0008 30 24 22 0.6 7 SWH-GJG-0009 23 13 20 1 12 12 SWH-GJG-0012 30 13 28 0.7 4 SWH-GJG-0015 33 16 4
Sample Fluorite Magnetite Apatite Kaolonite Chlorite Illite Smectite Copiapite Jarosite Sphalerite Rutile Zircon
GHN-EHP-0001
0.5 1 3 17 1 0 0.4 0.04
GHN-EHP-0002
0.1 1 2 23 1 2 0.2 0.06
GHN-JRM-0001
0.2 1 3 27 2 4 0.4 0.03
GHN-KMD-0013
0.6 1 3 20 2 0.2 0.01 0.01 0.3 0.03
GHN-KMD-0014
0.7 1 7 1 2 0.2 0.01 0.8 0.03
GHN-KMD-0015
0.6 2 5 16 3 0.14 0.01 0.5 0.03
GHN-KMD-0016
0.7 1 7 4 5 0 0.7 0.03
GHN-KMD-0017
0.4 1 4 25 3 0.06 4 0.01 0.6 0.03
GHN-KMD-0018
0.01 0.2 1 3 19 3 0.06 1.4 0.3 0.04
GHN-KMD-0019
0.6 1 8 9 3 0 0.7 0.03
GHN-KMD-0026
0.3 1 2 10 2 0 0.1 0.04
GHN-KMD-0027
0.5 2 2 15 2 0.3 0.2 0.04
GHN-KMD-

SME Annual Meeting Feb. 22-Feb. 25, 2009, Denver, CO
32 Copyright © 2009 by SME
Sample Fluorite Magnetite Apatite Kaolonite Chlorite Illite Smectite Copiapite Jarosite Sphalerite Rutile Zircon 0028
GHN-KMD-0048
0.8 1 7 4 1 0.7 0.04
GHN-KMD-0050
0.8 1 7 8 2 0.7 0.03
GHN-KMD-0051
0.4 2 4 8 4 0 0.5 0.04
GHN-KMD-0052
0.7 1 6 16 1 0 0.5 0.03
GHN-KMD-0053
0.01 0.1 2 2 15 2 0.5 0.2 0.06
GHN-KMD-0054
0.01 0.8 1 6 12 1 0.5 0.6 0.03
GHN-KMD-0055
0.03 0.2 1 2 28 1 1 0.3 0.04
GHN-KMD-0056
0.4 1 4 10 4 0 0.5 0.04
GHN-KMD-0057
0.01 0.8 1 7 11 2 0.6 0.03
GHN-KMD-0062
0.2 1 3 20 2 1 0.3 0.04
GHN-KMD-0063
0.3 2 5 20 2 1.6 0.5 0.03
GHN-KMD-0064
0.4 1 2 11 3 0.2 0.04
GHN-KMD-0065
0.5 2 5 14 2 0 0.4 0.04
GHN-KMD-0071
0.3 2 3 13 2 0 0.4 0.03
GHN-KMD-0072
0.7 1 6 8 3 0.5
GHN-KMD-0073
0.5 4 7 8 4 0 0.5 0.03
GHN-KMD-0074
0.5 2 6 12 2 0 0.6 0.03
GHN-KMD-0077
0.4 1 2 11 2 0.2 0.04
GHN-KMD-0078
0.4 2 3 10 2 0.3 0.04
GHN-KMD-0079
0.4 1 4 13 3 0.01 0.4 0.04
GHN-KMD-0080
0.7 3 7 4 3 0.7 0.04
GHN-KMD-0081
0.2 0.5 1 3 14 3 0 0.3 0.04
GHN-KMD-0082
0.6 1 7 8 1 0 0.6 0.03
GHN-KMD-0088
0.2 2 4 14 2 0.1 0.4 0.03
GHN-KMD-0092
0.4 1 4 19 3 0.4 0.03
GHN-KMD-0095
0.01 2 1 20 2 1 0.1 0.06
GHN-KMD-0096
0.1 2 2 23 1 2.5 0.2 0.06
GHN-KMD-0097
0.2 1 3 23 1 2 0.4 0.04
GHN-KMD-0100
0.4 3 4 15 2 0.3 0.04
GHN-LFG-0018 1 2 3 3 GHN-LFG-0020 2 2 3 2 GHN-LFG-0037 1 2 2 4 GHN-LFG-0041 1 1 3 4 GHN-LFG-0085 0.6 1 7 13 1 0 0.6 GHN-LFG-0086 0.7 1 6 13 1 0 0.6 0.03 GHN-LFG-0088 0.7 1 8 7 1 0 0.7
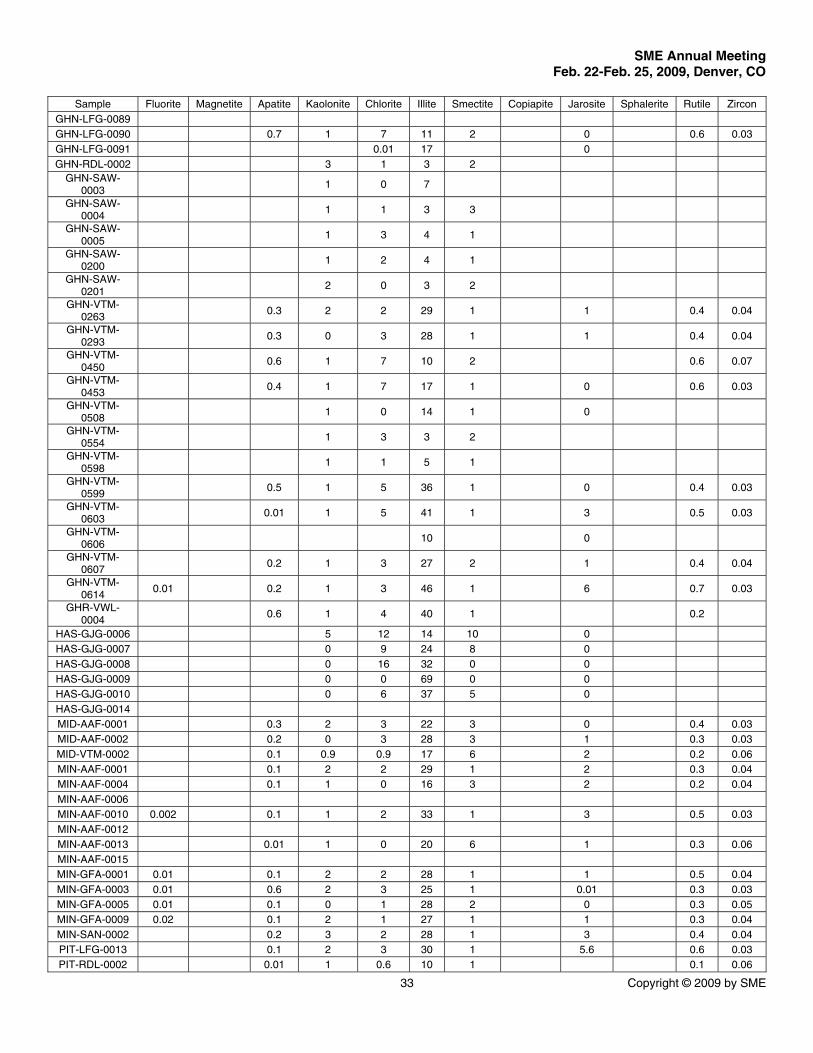
SME Annual Meeting Feb. 22-Feb. 25, 2009, Denver, CO
33 Copyright © 2009 by SME
Sample Fluorite Magnetite Apatite Kaolonite Chlorite Illite Smectite Copiapite Jarosite Sphalerite Rutile Zircon GHN-LFG-0089 GHN-LFG-0090 0.7 1 7 11 2 0 0.6 0.03 GHN-LFG-0091 0.01 17 0 GHN-RDL-0002 3 1 3 2
GHN-SAW-0003
1 0 7
GHN-SAW-0004
1 1 3 3
GHN-SAW-0005
1 3 4 1
GHN-SAW-0200
1 2 4 1
GHN-SAW-0201
2 0 3 2
GHN-VTM-0263
0.3 2 2 29 1 1 0.4 0.04
GHN-VTM-0293
0.3 0 3 28 1 1 0.4 0.04
GHN-VTM-0450
0.6 1 7 10 2 0.6 0.07
GHN-VTM-0453
0.4 1 7 17 1 0 0.6 0.03
GHN-VTM-0508
1 0 14 1 0
GHN-VTM-0554
1 3 3 2
GHN-VTM-0598
1 1 5 1
GHN-VTM-0599
0.5 1 5 36 1 0 0.4 0.03
GHN-VTM-0603
0.01 1 5 41 1 3 0.5 0.03
GHN-VTM-0606
10 0
GHN-VTM-0607
0.2 1 3 27 2 1 0.4 0.04
GHN-VTM-0614
0.01 0.2 1 3 46 1 6 0.7 0.03
GHR-VWL-0004
0.6 1 4 40 1 0.2
HAS-GJG-0006 5 12 14 10 0 HAS-GJG-0007 0 9 24 8 0 HAS-GJG-0008 0 16 32 0 0 HAS-GJG-0009 0 0 69 0 0 HAS-GJG-0010 0 6 37 5 0 HAS-GJG-0014 MID-AAF-0001 0.3 2 3 22 3 0 0.4 0.03 MID-AAF-0002 0.2 0 3 28 3 1 0.3 0.03 MID-VTM-0002 0.1 0.9 0.9 17 6 2 0.2 0.06 MIN-AAF-0001 0.1 2 2 29 1 2 0.3 0.04 MIN-AAF-0004 0.1 1 0 16 3 2 0.2 0.04 MIN-AAF-0006 MIN-AAF-0010 0.002 0.1 1 2 33 1 3 0.5 0.03 MIN-AAF-0012 MIN-AAF-0013 0.01 1 0 20 6 1 0.3 0.06 MIN-AAF-0015 MIN-GFA-0001 0.01 0.1 2 2 28 1 1 0.5 0.04 MIN-GFA-0003 0.01 0.6 2 3 25 1 0.01 0.3 0.03 MIN-GFA-0005 0.01 0.1 0 1 28 2 0 0.3 0.05 MIN-GFA-0009 0.02 0.1 2 1 27 1 1 0.3 0.04 MIN-SAN-0002 0.2 3 2 28 1 3 0.4 0.04 PIT-LFG-0013 0.1 2 3 30 1 5.6 0.6 0.03 PIT-RDL-0002 0.01 1 0.6 10 1 0.1 0.06

SME Annual Meeting Feb. 22-Feb. 25, 2009, Denver, CO
34 Copyright © 2009 by SME
Sample Fluorite Magnetite Apatite Kaolonite Chlorite Illite Smectite Copiapite Jarosite Sphalerite Rutile Zircon PIT-VCV-0001 0.6 0 2 18 0 0 0.7 0.03 PIT-VCV-0002 0.3 0 2 20 0 0 0.4 0.06 PIT-VCV-0003 0.7 0.8 3 18 0.8 0 0.8 0.03 PIT-VCV-0004 0.01 1 1 21 1 0.06 0.1 0.06 PIT-VCV-0005 0.01 1 1 24 1 1 0.1 0.06 PIT-VCV-0006 0.0001 0.5 PIT-VCV-0007 0.01 0.5 1 2 22 1 0.01 0.6 0.04 PIT-VCV-0008 0.5 0.4 0.9 0.3 25 0.9 0.2 0.5 PIT-VCV-0009 1 0.5 0.9 3 22 0.9 0.06 0.6 0.04 PIT-VCV-0010 0.01 0.4 0.9 3 10 0.9 0 0.5 0.04 PIT-VCV-0011 0 0.6 1 3 14 1 0 0.5 0.04 PIT-VCV-0012 0.01 0.2 1 2 24 0.9 0 0.3 0.03 PIT-VCV-0013 0.0001 0.2 0 1 28 0 0 0.3 0.03 PIT-VCV-0014 1 0.01 1 2 26 1 0 0.3 0.03 PIT-VCV-0015 0.0001 0.1 1 0.6 3 1 0 0.2 0.01 PIT-VCV-0016 0.01 0.7 1 3 10 1 0 0.8 0.07 PIT-VCV-0017 0.4 1 2 15 1 0 0.5 0.04 PIT-VCV-0018 0.01 0.4 1 1 9 1 0 0.3 0.03 PIT-VCV-0019 0.4 1 0.4 55 1 3 0.7 0.03 PIT-VCV-0020 0.8 1 0.8 41 1 0 0.8 0.03 PIT-VCV-0021 0.7 1 12 18 1 3 0.9 PIT-VCV-0022 6 1 9 8 1 0.3 0.9 0.03 PIT-VCV-0023 7 1 4 17 1 1 1 0.02 PIT-VCV-0024 2 1 6 32 1 0 0.7 0.03 PIT-VCV-0025 0.4 1 2 29 1 0 0.5 0.04 PIT-VCV-0026 0.4 1 3 29 1 0 0.5 0.04 PIT-VCV-0027 0.5 1 4 25 1 0 0.6 0.03 PIT-VCV-0028 0.4 1 0.4 0.1 1 0 0.2 0.01 PIT-VCV-0029 0.6 0 PIT-VCV-0030 0 PIT-VTM-0001 0.5 1 6 18 1 0.6 0.03 PIT-VTM-0002 0.6 1 6 4 1 0.5 0.03 QPS-AAF-0001 0.4 0 3 27 0 2 0.5 0.03 QPS-AAF-0003 0.4 1 4 28 1 2 0.5 0.03 QPS-AAF-0005 0.4 3 4 29 0.9 3 0.5 0.03 QPS-AAF-0009 0.7 1 3 28 1 0 0.6 0.03 QPS-SAN-0002 0.2 1 3 31 3 4 0.4 0.04 QPS-VTM-0001 0.5 1 3 25 3 0.3 0.4 0.03
ROC-KMD-0001
1 2 4 2
ROC-KMD-0002
0.6 1 5 10 3 0.7 0.8 0.03
ROC-VTM-0032
2 1 0.01 11 16 0 0.4
SCS-LFG-0004 5 5 26 24 0 SCS-LFG-0005 0.3 1 6 35 3 3 0.6 0.03 SCS-LFG-0006 0.3 1 5 19 1 1 0.6 0.03 SCS-LFG-0007 0 2 4 3 SCS-LFG-0008 0 1 7 1 SPR-AAF-0001 0.7 1 10 9 3 0.01 0.7 0.03 SPR-AAF-0003 0.8 1 9 12 3 0 0.7 0.03 SPR-SAN-0002 0.9 1 8 14 3 0.03 0.6 SPR-VTM-0012 0.01 2 0 26 2 0.6 0.1 0.06 SPR-VTM-0014 SPR-VTM-0017 0.02 2 0 24 5 1 0.3 0.04 SPR-VTM-0021 2 0 20 4 0 0.2 0.06 SSS-AAF-0001 0.4 3 6 27 3 0.6 0.4 0.03 SSS-AAF-0004

SME Annual Meeting Feb. 22-Feb. 25, 2009, Denver, CO
35 Copyright © 2009 by SME
Sample Fluorite Magnetite Apatite Kaolonite Chlorite Illite Smectite Copiapite Jarosite Sphalerite Rutile Zircon SSS-AAF-0005 0.3 1 5 36 2 3 0.5 0.04 SSS-AAF-0007 SSS-AAF-0009 0.3 1 0 23 7 2 0.3 0.04 SSS-EHP-0023 1 1 3 3 SSS-VEV-0001 1 2 3 2 SSS-VTM-0600 0.7 7 2 18 1 0.6 0.4 0.04 SSW-AAF-0001 0.9 1 5 14 5 0.5 SSW-AAF-0005 0.01 0.3 1 0.4 25 3 3 0.6 0.03 SSW-AAF-0007 0.3 1 4 23 4 2 0.4 0.03 SSW-AAF-0009 0.5 2 5 16 2 2 0.6 0.03
SSW-SAN-0002
0.3 1 5 23 4 4 0.5 0.03
SSW-SAN-0006
0.3 1 3 23 1 5 0.4 0.04
SSW-VTM-0001
0.1 1 2 29 2 4 0.4 0.04
SSW-VTM-0030
0.7 1 5 23 2 3.5 0.6 0.03
SWH-GJG-0008
3 4 5 4 0
SWH-GJG-0009
3 0 10 8 0
SWH-GJG-0012
0 0.6 16 7 0
SWH-GJG-0015
7 0 27 14

SME Annual Meeting Feb. 22-Feb. 25, 2009, Denver, CO
36 Copyright © 2009 by SME
APPENDIX 1 (Cont’d)
Table 1-6. Chemical analyses in weight percent for samples tested for slake durability and point load. Sample SiO2 TiO2 Al2O3 Fe2O3T MnO MgO CaO Na2O K2O P2O5 S SO4 C LOI Total
GHN-EHP-0001 67.14 0.47 13.71 3.62 0.11 1.23 0.81 2.22 3.97 0.19 0.6 0.03 0.08 4.55 98.7
GHN-EHP-0002 74.45 0.25 12.27 2.046 0.061 0.62 0.32 0.79 4.46 0.071 0.1 0.3 0.08 3.24 99.04
GHN-EHP-0003 65.03 0.443 12.61 4.74 0.041 0.78 0.33 1.26 3.97 0.117 0.6 0.3 0.08 7.88 98.15
GHN-EHP-0004 63.29 0.555 13.58 3.41 0.37 1.04 0.76 0.95 3.55 0.277 9.9
GHN-EHP-0007 58.15 0.624 17.43 6.237 0.166 2.31 0.77 1.3 3.68 0.271 7.13
GHN-HRS-0096 65.77 0.64 14.87 2.827 0.033 0.81 0.09 3.18 3.84 0.111 0 0.99 0.08 5.43 98.7
GHN-JRM-0001 61.64 0.53 13.65 5.24 0.08 1.28 0.98 1.87 3.91 0.19 2 1.12 0.07 8.81 101.38
GHN-JRM-0037 75.72 0.15 11.6 1.93 0.028 0.25 0.252 1.726 5.68 0.03 0.2 0.24 0.05 2.48 100.34
GHN-JRM-0038 68.8 0.42 13.43 4.573 0.056 0.72 0.108 0.398 4.2 0.165 1.1 0.54 0.06 5.63 100.22
GHN-JRM-0039 66.64 0.6 15.1 2.58 0.02 0.5 0.08 0.15 3.65 0.23 0.4 0.58 0.08 6.28 96.92
GHN-JRM-0040 70.26 0.5 14.75 3.212 0.011 0.37 0.08 0.1 3.69 0.19 2.1 0.47 0.05 5.85 101.61
GHN-JRM-0047 66.84 0.55 14.69 4.706 0.078 0.99 0.52 0.86 3.77 0.25 0.7 0.52 0.07 5.99 100.51
GHN-KMD-0013 63.68 0.6 14.59 6.23 0.07 1.46 1.17 2.42 3.68 0.23 0.1 0.23 0.05 4.81 99.28
GHN-KMD-0014 61.05 0.82 14.79 5.1 0.22 2.74 3.12 3.31 4.65 0.29 0 0.01 0.17 2.34 98.62
GHN-KMD-0015 63.83 0.7 14.36 5.72 0.37 2.05 1.38 2.49 4.07 0.25 0.1 0.17 0.16 3.7 99.3
GHN-KMD-0016 61.88 0.79 14.44 5.51 0.31 2.83 2.97 3.36 3.12 0.29 3.42
GHN-KMD-0017 61.34 0.61 14.37 6.03 0.08 1.51 1.15 2.5 3.49 0.23 1.7 1.22 0.03 7.4 101.64
GHN-KMD-0018 70.45 0.36 12.95 3.48 0.22 1.23 0.81 1.29 4.81 0.08 0 4.2
GHN-KMD-0019 61.78 0.81 14.94 5.35 0.32 3.14 3.59 3.48 2.92 0.26 0 0.05 0.24 4.3 101.22
GHN-KMD-0026 69.83 0.32 12.81 3.86 0.15 0.76 0.5 2.59 4.26 0.13 0 0.12 0.05 3.53 98.94
GHN-KMD-0027 68.03 0.43 12.93 4.57 0.21 1.05 0.56 2.03 4.15 0.19 0 0.18 0.07 4.48 98.89
GHN-KMD-0028 62.36 0.574 14.28 4.796 0.269 1.82 1.56 2.51 3.64 0.251 5.49
GHN-KMD-0048 63.11 0.75 14.72 5.55 0.45 2.64 2.79 3.57 3.28 0.34 0.13 3.43
GHN-KMD-0050 62.5 0.74 14.74 5.423 0.43 2.74 2.78 3.29 3.33 0.34 0.1 3.84
GHN-KMD-0051 67.83 0.59 14.44 4.32 0.29 1.8 1.94 3.22 3.96 0.16 2.72
GHN-KMD-0052 61.82 0.6 14.16 5.34 0.37 2.23 2.32 2.48 3.44 0.27 1 0.09 0.29 4.49 98.88
GHN-KMD-0053 70.62 0.33 12.82 3.73 0.3 0.91 0.53 1.78 4.54 0.06 0.1 0.2 0.07 3.65 99.6
GHN-KMD-0054 62.74 0.73 14.19 5.21 0.24 2.33 2.19 2.7 3.64 0.32 0.3 0.23 0.05 4.2 99.02
GHN-KMD-0055 71.86 0.27 12.19 3.49 0.06 0.63 0.76 0.38 3.88 0.1 2 0.46 0.06 5.04 101.15
GHN-KMD-0056 68.34 0.59 14.53 4.31 0.22 1.64 1.21 3.21 3.8 0.16 0.1 0.08 0.04 3.09 101.32
GHN-KMD-0057 62.67 0.71 14.99 5.192 0.349 2.62 2.56 3.05 3.52 0.326 0.1 0.01 0.13 3.38 99.6

SME Annual Meeting Feb. 22-Feb. 25, 2009, Denver, CO
37 Copyright © 2009 by SME
Sample SiO2 TiO2 Al2O3 Fe2O3T MnO MgO CaO Na2O K2O P2O5 S SO4 C LOI Total
GHN-KMD-0062 67.01 0.49 13.66 5.27 0.442 1.35 0.51 1.8 4.18 0.2 0 0.24 0.12 4.72 100.01
GHN-KMD-0063 64.27 0.62 13.64 5.91 0.166 1.89 1.25 2 3.79 0.22 0.6 0.75 0.04 5.97 101.07
GHN-KMD-0064 68.4 0.42 13.51 4.54 0.22 0.95 0.66 2.68 4.06 0.178 0 3.58
GHN-KMD-0065 66.82 0.66 14.69 6.12 0.52 2.15 1.29 2.76 3.73 0.2 0.1 0.06 0.03 3.59 102.67
GHN-KMD-0071 67.81 0.49 14.77 3.85 0.13 1.35 1.28 3.1 3.75 0.13 0.4 0.19 0.04 3.35 100.66
GHN-KMD-0072 63.63 0.65 14.26 5.25 0.4 2.25 2.1 3.09 3.57 0.29 0.1 0.01 0.1 3.6 99.25
GHN-KMD-0073 62.63 0.72 14.38 5.14 0.34 2.65 2.28 3.33 3.37 0.26 0.1 0.1 0.14 3.17 98.65
GHN-KMD-0074 65.16 0.71 14.68 5.7 0.33 2.26 1.66 2.86 3.53 0.22 0.1 0.08 0.04 3.23 100.57
GHN-KMD-0077 68.84 0.37 13.93 4.004 0.114 0.85 0.84 3.02 3.96 0.165 0.1 0.12 0.04 3.4 99.7
GHN-KMD-0078 70 0.43 13.14 3.597 0.113 1.08 0.38 2.92 3.93 0.173 0.2 0.2 0.04 3.31 99.53
GHN-KMD-0079 67.58 0.55 14.22 4.56 0.23 1.49 1.26 2.8 3.82 0.16 0.2 0.17 0.05 3.21 100.25
GHN-KMD-0080 64.18 0.68 14.57 5.193 0.375 2.37 2.35 3.36 3.4 0.309 0.1 0.1 0.08 3.09 100.16
GHN-KMD-0081 66.8 0.43 14.17 3.82 0.13 1.32 1.11 2.79 3.87 0.19 0.3 0.14 0.05 3.16 98.3
GHN-KMD-0082 60.3 0.74 14.32 5.31 0.64 2.74 2.74 3.46 3.05 0.34 0 0.25 0.12 4.6 98.64
GHN-KMD-0088 64.35 0.49 14.19 4.19 0.16 1.51 1.13 2.92 3.8 0.21 0.6 0.41 0.04 5.14 99.09
GHN-KMD-0092 63.51 0.49 14.93 4.268 0.223 1.69 1.45 2.63 3.7 0.226 0.4 0.47 0.04 5.43 99.5
GHN-KMD-0095 75.4 0.16 11.65 1.727 0.025 0.39 0.14 0.47 4.81 0.032 0.2 0.28 0.04 3.51 98.81
GHN-KMD-0096 72.29 0.23 11.91 2.31 0.037 0.63 0.66 0.77 4.57 0.046 0.2 0.66 0.06 4.84 99.17
GHN-KMD-0097 67.2 0.37 12.99 3.245 0.12 1 0.98 0.92 5.14 0.147 0.8 0.77 0.06 6.03 99.76
GHN-KMD-0100 67.74 0.48 13.19 4.708 0.311 1.47 0.93 2.05 4.15 0.211 0 0.2 0.06 3.91 99.42
GHN-LFG-0018 69.22 0.36 13.7 4.313 0.102 0.78 0.397 2.335 4.35 0.161 0 3.94
GHN-LFG-0020 72.49 0.28 12.49 4.044 0.143 0.69 0.598 2.619 4.53 0.125 0 2.25
GHN-LFG-0037 61.32 0.5 13.88 5.1 0.29 1.87 1.39 2.05 3.57 0.24 0 5.5
GHN-LFG-0041 75.45 0.16 12.02 2.42 0.091 0.24 0.212 2.579 4.92 0.044 0 1.92
GHN-LFG-0060 64.64 0.583 13.49 4.664 0.109 1.57 1.17 2.64 3.44 0.213 5.12
GHN-LFG-0085 62.66 0.69 14.68 6.13 0.28 2.48 2.08 2.62 3.56 0.24 0 0.24 0.04 4.94 100.68
GHN-LFG-0086 60.4 0.67 14.25 6.09 0.3 2.37 2.03 2.53 3.46 0.31 5.32
GHN-LFG-0088 61.25 0.77 14.44 5.04 0.3 2.77 2.96 3.31 3.41 0.27 0.1 0.05 0.23 6.03 100.88
GHN-LFG-0089 70.71 0.307 13.21 3.09 0.054 0.52 0.6 3.07 4.3 0.121 2.39
GHN-LFG-0090 60.36 0.77 14.7 6.52 0.46 2.55 2.3 3.32 3.37 0.29 0.6 0.31 0.13 4.13 99.78
GHN-LFG-0091 62.44 0.59 14.64 4.66 0.051 1.52 0.78 2.94 3.65 0.179 1.5 0.96 0.05 6.87 100.8
GHN-RDL-0002 71 0.63 14.27 1.3 0.02 0.64 0.09 0.11 4.24 0.07 0 0.19 0.31 4.29 97.17

SME Annual Meeting Feb. 22-Feb. 25, 2009, Denver, CO
38 Copyright © 2009 by SME
Sample SiO2 TiO2 Al2O3 Fe2O3T MnO MgO CaO Na2O K2O P2O5 S SO4 C LOI Total
GHN-RDL-0003 71.84 0.64 15.09 0.67 0.02 0.76 0.06 0.04 4.41 0.03 0 3.14
GHN-SAW-0003 80.93 0.15 11.21 0.645 0.018 0.31 0.032 0.056 3.56 0.029 0.1 0.09 0.04 2.21 99.41
GHN-SAW-0004 62.63 0.57 14.32 5.437 0.052 1.25 0.721 2.678 3.65 0.133 0.3 1.03 0.07 7.04 99.87
GHN-SAW-0005 75.34 0.17 11.85 2.945 0.046 0.34 0.087 1.417 5.06 0.046 0 0.16 0.03 2.69 100.2
GHN-SAW-0200 61.04 0.58 14.78 5.201 0.204 1.71 1.212 0.793 3.6 0.219 0.1 0.26 0.51 6.02 96.23
GHN-SAW-0201 69.8 0.26 12.266 4.303 0.058 0.77 0.417 1.077 4.22 0.286 0.1 0.49 0.15 5.46 99.64
GHN-VTM-0263 71.17 0.338 13.01 4.345 0.072 0.86 0.67 0.5 3.93 0.169 2.4 0.37 0.06 5.07 102.95
GHN-VTM-0293 69.66 0.359 13.27 4.279 0.125 0.99 1.35 0.86 3.86 0.144 1.9 0.6 0.11 5.53 103.08
GHN-VTM-0450 63.45 0.77 14.62 6.38 0.36 2.6 1.68 3.27 3.3 0.25 0.1 0.11 0.06 3.19 100.1
GHN-VTM-0453 59.8 0.71 14.49 6.18 0.46 2.57 2.26 2.61 3.53 0.29 1.3 0.47 0.14 5.13 99.95
GHN-VTM-0508 55.32 0.59 15.18 5.61 0.07 1.62 2.32 2.51 3 0.25 0.1 1.86 0.13 9.81 98.32
GHN-VTM-0554 49.69 0.54 14.31 4.4 0.217 1.93 6.58 0.07 3.44 0.221 0.01 9.21
GHN-VTM-0598 76.44 0.23 12.4 1.94 0.05 0.53 0.21 0.16 3.73 0.04 0.01 4.19
GHN-VTM-0599 59.87 0.56 15.65 4.873 0.186 2.1 2.25 0.74 3.74 0.219 0.2 0.04 0.53 6.08 97.03
GHN-VTM-0603 61.31 0.68 15.99 5.33 0.1 1.75 0.77 0.93 3.64 0.15 0 0.63 0.89 8.37 100.55
GHN-VTM-0606 71.25 0.35 12.09 3.63 0.06 0.67 0.31 1.09 4.27 0.16 0 0.33 0.13 5.32 99.69
GHN-VTM-0607 68.88 0.5 14.32 4.05 0.16 1.21 0.57 1.45 3.81 0.14 0.2 0.39 0.07 5.25 101.03
GHN-VTM-0614 63.72 0.71 18.09 4.14 0.05 1.23 4.11 0.21 5.36 0.06 0 2.53 0.23 9.28 109.72
GHR-VWL-0004 58.53 0.68 16.41 8.4 0.11 1.84 0.37 0.4 4.16 0.17 0 9.15
HAS-GJG-0006 49.79 1.002 13.46 8.052 0.125 5.68 3.11 0.63 4.02 0.568 2.6 1.7 0.03 11.35 102.07
HAS-GJG-0007 46.86 0.84 12.39 9.339 0.084 4.7 4.19 0.74 2.44 0.66 3.3 2.68 0.02 15.63 103.9
HAS-GJG-0008 47.31 0.938 12.43 7.975 0.124 5.29 4.39 0.45 2.54 0.439 0.3 2.98 0.05 13.58 98.75
HAS-GJG-0009 59.18 1.048 21.37 1.232 0.009 0.61 1.07 0.11 5.96 0.166 0.2 0.97 0.01 6.33 98.23
HAS-GJG-0010 66.89 0.778 14.32 2.002 0.049 2.29 1.11 0.07 4.04 0.161 0.1 0.89 0.02 6.27 98.98
MID-AAF-0001 61.97 0.513 13.722 5.148 0.052 1.27 1.67 2.04 4.09 0.197 0.5 1.24 0.03 7.2 99.62
MID-AAF-0002 63.01 0.517 13.67 5.005 0.039 1.14 1.61 1.34 4.19 0.153 0.4 1.29 0.04 7.6 99.98
MID-VTM-0002 73.35 0.14 11.05 2.62 0.05 0.43 0.57 0.31 4.82 0.04 1 0.53 0.02 3.98 98.92
MIN-AAF-0001 73.34 0.391 12.82 3.014 0.021 0.66 0.1 0.39 4.29 0.114 0 0.38 0.23 4.27 100.02
MIN-AAF-0004 71.85 0.376 13.14 3.19 0.018 0.62 0.09 0.45 4.39 0.12 0 0.43 0.26 4.71 99.65
MIN-AAF-0010 70.2 0.499 13.68 2.948 0.02 0.67 0.06 0.42 4.51 0.098 0.1 0.62 0.39 4.58 98.76
MIN-AAF-0012 70.76 0.364 12.4 3.751 0.02 0.63 0.04 0.4 3.99 0.137 0 0.6 0.21 5.2 98.51
MIN-AAF-0013 74.83 0.33 12.12 1.74 0.02 0.5 0.04 0.53 4.28 0.07 0 0.23 0.07 3.2 97.97

SME Annual Meeting Feb. 22-Feb. 25, 2009, Denver, CO
39 Copyright © 2009 by SME
Sample SiO2 TiO2 Al2O3 Fe2O3T MnO MgO CaO Na2O K2O P2O5 S SO4 C LOI Total
MIN-AAF-0015 74.47 0.407 12.36 1.782 0.018 0.59 0.04 0.56 4.3 0.066 0 0.22 0.04 3.07 97.95
MIN-GFA-0001 72.65 0.502 13.17 2.442 0.22 0.79 0.1 0.62 4.31 0.102 0.1 0.21 0.02 3.46 98.65
MIN-GFA-0003 70.88 0.46 12.98 3.586 0.39 1.23 0.71 1.07 3.53 0.179 0.1 0.07 0.03 2.91 98.11
MIN-GFA-0005 73.7 0.392 13.2 2.112 0.022 0.68 0.02 0.46 4.19 0.092 0.1 0.25 0.01 3.68 98.86
MIN-GFA-0009 74.7 0.397 12.5 2.585 0.02 0.6 0.06 0.57 4.03 0.129 0 0.23 0.03 3.42 99.3
MIN-SAN-0002 71.07 0.45 12.74 2.96 0.02 0.64 0.1 0.69 4.23 0.12 0 0.54 0.3 4.68 98.54
MIN-VTM-0003 67.02 0.47 14.55 3.091 0.043 1.01 1.4 2.51 4.91 0.164 0 0.21 0.04 4.3 99.75
MIN-VTM-0004 65.16 0.542 13.29 4.026 0.079 1.48 1.45 1.79 4.1 0.221 0.1 0.69 0.14 5.13 98.22
MIN-VTM-0006 67.04 0.509 12.72 3.146 0.029 1.18 1.81 1.5 4.12 0.183 0 1.03 0.05 5.64 98.98
MIN-VTM-0007 66.84 0.565 13.5 4.389 0.039 1.42 0.72 1.55 4.12 0.234 0 0.42 0.08 4.99 98.88
MIN-VTM-0008 68.01 0.535 13.43 3.718 0.065 1.35 0.61 1.87 4.24 0.203 0.1 0.19 0.44 4.43 99.16
MIN-VTM-0009 65.27 0.536 13.14 4.455 0.05 1.44 1.36 1.62 4.02 0.219 0 0.77 0.04 5.93 98.86
PIT-LFG-0013 64.37 0.57 13.89 4.126 0.049 1.19 0.44 1.905 3.8 0.102 0.5 1.23 0.05 8.29 100.55
PIT-RDL-0002 78.11 0.15 11.39 1.188 0.017 0.29 0.06 0.39 5.86 0.024 0.1 0 1.81
PIT-VCV-0001 62.64 0.686 15.49 5.346 0.134 0.9 1.02 2.62 4.75 0.337 4.4 0.05 0.15 4.91 103.46
PIT-VCV-0002 68.37 0.352 13.16 4.235 0.123 0.75 1.32 0.9 5.3 0.134 3.1 0.05 0.29 4.05 102.16
PIT-VCV-0003 61.44 0.708 16.07 5.83 0.097 1.34 0.81 3.42 3.92 0.342 4.5 0.06 0.07 5.09 103.66
PIT-VCV-0004 81.8 0.135 10.45 0.803 0.029 0.33 0 0.07 3.46 0.023 0 0.01 0.02 1.99 99.14
PIT-VCV-0005 79.67 0.133 10.62 1.463 0.034 0.36 0 0.07 3.48 0.021 0 0.23 0.02 4.77 100.89
PIT-VCV-0006 0 0.13 0.05
PIT-VCV-0007 66 0.56 14.88 4.301 0.057 0.85 1.04 1.28 5.61 0.19 2.4 0.06 0.16 4.21 101.57
PIT-VCV-0008 68.84 0.443 12.56 3.806 0.14 0.79 2.29 0.38 4.45 0.162 2.2 0.04 0.67 4.76 101.49
PIT-VCV-0009 63.49 0.591 14.29 6.138 0.153 1.3 1.37 1.75 4.11 0.225 3.3 0.06 0.26 4.9 101.94
PIT-VCV-0010 66.98 0.467 14.45 2.277 0.032 1.16 1.12 2.4 6.16 0.187 1.6 0.05 0.23 3.46 100.52
PIT-VCV-0011 66.49 0.49 14.21 2.695 0.083 1.29 1.52 2.12 5.24 0.179 1.9 0.05 0.3 4.38 100.93
PIT-VCV-0012 71.65 0.324 12.45 3.267 0.174 0.64 1.14 0.2 5.19 0.107 1.5 0.03 0.36 3.79 100.85
PIT-VCV-0013 73.97 0.278 11.81 2.2 0.123 0.55 1.57 0.08 4.05 0.083 1.1 0.04 0.37 3.47 99.65
PIT-VCV-0014 73.3 0.3 12.35 2.398 0.133 0.58 0.96 0.12 4.73 0.088 1.1 0.04 0.29 3.22 99.59
PIT-VCV-0015 76.04 0.157 11.49 0.539 0.007 0.19 0.34 1.91 6.45 0.031 0.3 0.02 0.06 1.09 98.66
PIT-VCV-0016 67.83 0.726 14.1 1.155 0.044 1.22 1.44 1.79 6.98 0.247 0.1 0.03 0.24 2.47 98.4
PIT-VCV-0017 70.05 0.47 13.96 0.408 0.024 0.71 0.88 0.99 7.25 0.159 0.5 0.04 0.14 2.48 98.02
PIT-VCV-0018 71.07 0.33 12.52 0.649 0.022 0.57 1.04 1.41 6.78 0.116 0.5 0.02 0.22 2.24 97.52

SME Annual Meeting Feb. 22-Feb. 25, 2009, Denver, CO
40 Copyright © 2009 by SME
Sample SiO2 TiO2 Al2O3 Fe2O3T MnO MgO CaO Na2O K2O P2O5 S SO4 C LOI Total
PIT-VCV-0019 61.11 0.709 18.55 3.08 0.025 0.17 2.65 0.31 3.68 0.279 0.6 1.4 0.03 7.03 99.57
PIT-VCV-0020 60.32 0.75 18.5 4.356 0.047 0.33 1.89 0.49 5.26 0.296 1.4 0.1 0.05 5.55 99.38
PIT-VCV-0021 52.11 0.858 13.48 5.874 0.101 4.16 4.63 2.18 3.9 0.375 2 2.28 0.05 8.36 100.31
PIT-VCV-0022 54.33 0.86 12.5 7.65 0.075 3 4.19 3.28 2.77 0.399 4.7 1.85 0.05 8.95 104.56
PIT-VCV-0023 51.62 0.838 11.98 8.734 0.048 1.46 4.51 2.33 3.06 0.421 6.3 2.04 0.06 10.83 104.26
PIT-VCV-0024 61.86 0.66 15.36 1.529 0.086 0.73 5.22 0.21 5.39 0.534 1 0.13 0.1 3.81 96.63
PIT-VCV-0025 68.14 0.509 13.49 4.73 0.078 1.08 0.68 0.18 4.94 0.199 3.4 0.19 0.12 4.86 102.58
PIT-VCV-0026 65.79 0.532 13.6 5.599 0.033 1.24 0.49 0.27 5 0.173 4.1 0.18 0.05 5.53 102.55
PIT-VCV-0027 64.85 0.548 15.73 4.51 0.019 1.37 0.72 1.6 4.99 0.242 2.7 0.05 0.1 4.3 101.7
PIT-VCV-0028 75.21 0.172 12.04 0.539 0.015 0.15 0.5 2.81 5.91 0.032 0.2 0.04 0.12 0.91 98.68
PIT-VCV-0029 63.58 0.544 15.8 4.081 0.039 1.54 1.37 1.67 5.6 0.24 2.4 0.06 0.25 4.32 101.53
PIT-VCV-0030 64.81 0.539 15.51 3.784 0.025 1.5 1.15 1.34 5.02 0.246 2.5 0.04 0.2 4.99 101.63
PIT-VTM-0001 65.63 0.738 15.41 5.005 0.185 2.13 1.02 3.67 1.92 0.218 3.33
PIT-VTM-0002 62.18 0.554 14.84 5.984 0.139 2.36 2.57 3.63 3.55 0.248 2.73
QPS-AAF-0001 66.22 0.6 14.16 3.88 0.05 1.23 0.885 1.85 3.61 0.2 0.1 0.55 0.09 5.27 98.7
QPS-AAF-0003 63.06 0.592 14.53 4.796 0.054 1.57 1.25 1.88 3.71 0.241 0.1 0.91 0.03 6.74 99.42
QPS-AAF-0005 61.85 0.599 14.31 4.84 0.049 1.54 1.44 1.82 3.65 0.23 0 1.17 0.03 8.03 99.58
QPS-AAF-0009 63.95 0.692 14.47 4.334 0.028 1.02 1.61 1.21 3.65 0.263 0.2 1.18 0.03 6.93 99.55
QPS-AAF-0020 62.88 0.637 14.42 5.357 0.035 1.27 1.04 1.55 3.75 0.31 0 1.02 0.05 7.16 99.49
QPS-AAF-0022 64.34 0.626 14.57 4.785 0.034 1.34 0.74 1.56 3.59 0.254 0.1 0.75 0.08 6.08 98.8
QPS-SAN-0002 67.69 0.5 13.66 3.36 0.02 0.93 0.68 1.24 3.71 0.17 0 0.97 0.04 5.13 98.1
QPS-VTM-0001 63.62 0.61 14.26 4.58 0.04 1.4 1 1.85 3.6 0.24 0.1 0.75 0.05 6.27 98.4
ROC-KMD-0001 61.14 0.7 13.61 5.27 0.13 3.11 2.86 2.84 3.23 0.35 0.1 0.01 1.74 6.81 101.85
ROC-KMD-0002 60.4 0.73 14.18 5.654 0.09 3.44 5.26 3.5 4.1 0.35 0 0.01 0.06 1.38 99.17
ROC-VTM-0032 58.69 0.66 16.11 5.99 0.1 1.3 3.12 2.41 3.01 0.16 0 0 0 6.49 98.04
SCS-LFG-0004 61.48 0.525 15.445 2.235 0.06 2.71 1.89 0.815 2.6 0.13 0.3 1.35 0.07 7.82 97.38
SCS-LFG-0005 64.97 0.61 15.86 2.81 0.07 2.58 1.53 0.85 4.11 0.14 0.9 1.13 0.04 5.59 101.22
SCS-LFG-0006 67.07 0.55 15.6 1.97 0.05 2.19 0.76 3.03 3.81 0.19 0.3 0.46 0.05 4.59 100.59
SCS-LFG-0007 65.27 0.51 15.13 3.2 0.06 2.06 0.49 3.81 3.79 0.24 1.7 0.12 0.05 4.29 100.73
SCS-LFG-0008 64.75 0.46 13.28 9 0.01 0.46 0.25 0.15 3.92 0.19 7.4 0.36 0.05 7.44 107.68
SPR-AAF-0001 62 0.78 14.42 5.5 0.11 3.69 2.18 3.38 2.77 0.33 0.3 0.12 0.04 2.96 98.57
SPR-AAF-0003 60.25 0.79 14.42 5.82 0.13 3.31 1.86 3.2 3.04 0.35 0.3 0.27 0.05 4.24 98.02

SME Annual Meeting Feb. 22-Feb. 25, 2009, Denver, CO
41 Copyright © 2009 by SME
Sample SiO2 TiO2 Al2O3 Fe2O3T MnO MgO CaO Na2O K2O P2O5 S SO4 C LOI Total
SPR-SAN-0002 59.74 0.73 14.39 5.9 0.11 2.96 2.31 2.79 3.5 0.38 0.2 0.46 0.05 4.22 97.72
SPR-VTM-0005 62.12 0.711 15.74 6.006 0.09 2.69 1.82 4.72 3.21 0.345 0.3 0.04 0.06 2.04 99.92
SPR-VTM-0008 60.54 0.752 14.517 5.887 0.1 3.87 2.596 3.565 2.81 0.322 0 0.03 0.21 3.37 98.6
SPR-VTM-0010 61.9 0.814 14.51 6.116 0.13 3.81 2.65 3.54 2.72 0.341 0.4 0.03 0.28 3.1 100.38
SPR-VTM-0012 80.11 0.145 11.66 0.308 0.009 0.23 0.02 0.14 3.48 0.035 0.2 0.11 0.03 2.64 99.07
SPR-VTM-0014 77.69 0.15 11.55 0.9 0.01 0.27 0.02 0.36 4 0.03 0.1 0.11 0.03 2.44 97.65
SPR-VTM-0017 76.17 0.293 12.85 1.397 0.015 0.51 0.01 0.14 4.23 0.028 0.5 0.21 0.03 3.23 99.57
SPR-VTM-0021 76.77 0.15 11.8 1.09 0.02 0.37 0.01 0.11 4.29 0.03 0.1 0.11 0.01 2.71 97.6
SSS-AAF-0001 59.44 0.64 14.29 6.34 0.06 2.28 1.85 1.33 3.67 0.27 0.3 0.83 0.02 6.79 98.09
SSS-AAF-0004 59.56 0.576 13.678 6.596 0.059 2.65 2.265 1.55 2.86 0.276 0.3 1.02 0.02 7.3 98.74
SSS-AAF-0005 64.12 0.64 14.46 5.69 0.041 2.03 0.76 0.67 3.59 0.23 0.2 0.78 0.03 6.4 99.63
SSS-AAF-0007 59.5 0.615 13.72 7.0697 0.062 2.57 1.88 1.66 3.11 0.298 0.3 0.96 0.03 7.44 99.23
SSS-AAF-0009 73.62 0.313 12.62 1.62 0.025 0.72 0.45 0.58 4.11 0.034 0.3 0.45 0.03 4.08 98.91
SSS-EHP-0002 68.53 0.478 12.85 3.102 0.095 1.56 1.88 2.17 4.65 0.19 0.9 0.11 0.21 3.02 99.78
SSS-EHP-0003 70.14 0.374 12.7 2.981 0.67 0.71 1.42 1.74 5.33 0.138 1.3 0.15 0.19 3.14 101.01
SSS-EHP-0011 65.66 0.52 13.87 3.45 0.039 1.53 1.58 1.41 5.51 0.198 1.8 0.08 0.23 3.4 99.26
SSS-EHP-0012 61.66 0.716 14.67 4.78 0.069 2.63 2.19 1.67 4.66 0.341 1.9 0.14 0.29 4.04 99.73
SSS-EHP-0014 59.84 0.808 14.681 5.446 0.114 3.35 3.479 3.55 3 0.375 0.8 0.09 0.35 3.09 98.99
SSS-EHP-0015 57.44 0.799 14.01 6.597 0.107 4.44 3.247 3.29 3.05 0.422 1.6 0.35 0.19 4.5 100.04
SSS-EHP-0017 59.01 0.706 14.523 6.311 0.06 2.35 2.12 1.3 3.85 0.338 2.4 0.91 0.09 7.55 101.55
SSS-EHP-0019 60.77 0.69 15.168 6.103 0.057 1.72 1.44 1.488 3.92 0.287 2.9 0.61 0.05 6.61 101.8
SSS-EHP-0020 64.88 0.456 13.375 3.265 0.062 1.33 1.058 1.391 4.57 0.162 1.3 0.91 0.04 7.05 99.89
SSS-EHP-0023 62.29 0.525 14.415 4.655 0.115 1.27 1.035 0.875 3.92 0.15 0.18 9.955
SSS-EHP-0025 68.19 0.383 13.574 3.68 0.1 1.14 0.637 1.38 4.13 0.149 1.2 0.42 0.05 4.84 99.91
SSS-EHP-0031 71.67 0.355 12.81 3.29 0.115 0.95 0.56 1.3 4.21 0.11 0.5 0.16 0.02 3.1 99.15
SSS-EHP-0032 72.04 0.336 12.37 2.662 0.105 0.9 0.71 1.39 4.68 0.109 0.5 0.21 0.1 3.23 99.32
SSS-EHP-0033 70.29 0.478 13.35 3.597 0.126 1.19 0.62 2.24 4.18 0.169 0.1 0.07 0.03 2.79 99.21
SSS-EHP-0034 70.01 0.434 13.39 3.718 0.167 1.2 0.53 2.26 4.26 0.169 0.2 0.08 0.04 3.04 99.45
SSS-EHP-0036 68.37 0.528 14.09 4.07 0.085 1.15 0.65 1.67 3.43 0.187 1.2 0.19 0.04 3.96 99.57
SSS-VEV-0001 49.48 0.79 11.43 22.759 0.017 0.69 0.147 1.713 3.01 0.222 0.9 0 8.47
SSS-VTM-0012 69.48 0.503 13.98 4.29 0.13 1.28 0.66 1.25 3.79 0.21 0.1 4.17
SSS-VTM-0600 67.31 0.526 14.75 4.444 0.132 1.25 0.82 1.5 4.1 0.225 0.1 0.1 0.06 4.2 99.53

SME Annual Meeting Feb. 22-Feb. 25, 2009, Denver, CO
42 Copyright © 2009 by SME
Sample SiO2 TiO2 Al2O3 Fe2O3T MnO MgO CaO Na2O K2O P2O5 S SO4 C LOI Total
SSW-AAF-0001 60.28 0.78 14.9 6.54 0.11 2.25 1.58 2.35 3.64 0.36 0.2 0.1 0.06 6.01 99.18
SSW-AAF-0002 61.99 0.577 14.08 5.456 0.097 1.75 1.75 1.13 3.65 0.212 0.4 0.43 0.07 7.48 99.11
SSW-AAF-0005 60.01 0.56 13.63 5.3 0.06 1.86 1.85 2.28 3.67 0.25 0.1 1.34 0.04 7.63 98.6
SSW-AAF-0007 64.77 0.57 13.76 4.58 0.05 1.69 1.14 1.67 3.83 0.24 0.8 0.61 0.04 5.37 99.11
SSW-SAN-0002 62.56 0.59 14.28 5.03 0.07 1.79 1.29 2.38 3.78 0.25 0.2 1.26 0.03 5.44 98.95
SSW-SAN-0006 65.71 0.47 13.16 3.7 0.06 0.93 0.87 0.9 4.03 0.12 0.1 1.45 0.03 6.84 98.32
SSW-VTM-0001 68.4 0.34 11.64 3.619 0.081 0.84 1.34 0.8 3.59 0.075 0.2 1.39 0.02 7.86 100.24
SSW-VTM-0016 62.24 0.679 14.9 5.995 0.105 2.01 1.98 2.5 3.61 0.303 0.9 0.27 0.14 4.6 100.21
SSW-VTM-0019 60.99 0.652 14.74 6.204 0.1 2.04 1.85 2.48 3.66 0.295 1 0.58 0.07 5.48 100.12
SSW-VTM-0023 61.46 0.627 14.62 6.061 0.086 1.86 1.88 1.91 3.69 0.276 1.4 0.55 0.08 5.87 100.33
SSW-VTM-0028 62.79 0.638 14.46 5.852 0.01 2.2 1.33 1.67 3.63 0.268 0.5 0.66 0.03 5.58 99.59
SSW-VTM-0030 62.14 0.628 14.47 5.467 0.087 1.78 2.09 1.88 3.66 0.263 0.6 0.71 0.07 5.8 99.68
SWH-GJG-0008 62.52 0.402 12.69 3.883 0.035 1.02 2.32 2.72 4.36 0.213 0.3 1.49 0.03 7.64 99.64
SWH-GJG-0009 49.71 0.423 11.99 10.494 0.085 1.79 2.73 2.23 2.82 0.671 0.6 2.59 0.05 13.98 100.15
SWH-GJG-0012 66.11 0.567 15.49 1.375 0.036 1.61 1.13 2.94 2.96 0.048 0.4 0.75 0.02 5.47 98.91
SWH-GJG-0015 53.13 0.492 13.12 5.203 0.064 2.35 4.26 1.26 2.35 0.394 0.1 3.41 0.02 13.9 100.03

SME Annual Meeting Feb. 22-Feb. 25, 2009, Denver, CO
43 Copyright © 2009 by SME
APPENDIX 1 (Cont’d)
Table 1-7. Summary statistics of the point load strength for GHN rock-pile samples. Geologic conceptual model is in Figure 2. Location Statistics Point Load Strength Index
No. of Samples 2
Mean (MPa) 1.1
Standard Deviation (MPa) NA
Minimum (MPa) 0.6
Maximum (MPa) 1.6
Unit I
Coefficient of Variation (%) NA
No. of Samples 6
Mean (MPa) 5.0
Standard Deviation (MPa) 1.7
Minimum (MPa) 3.3
Maximum (MPa) 7.0
Unit J
Coefficient of Variation (%) 34.0
No. of Samples 4
Mean (MPa) 2.6
Standard Deviation (MPa) 1.4
Minimum (MPa) 1.1
Maximum (MPa) 4.5
Unit N
Coefficient of Variation (%) 53.8
No. of Samples 4
Mean (MPa) 5.3
Standard Deviation (MPa) 2.0
Minimum (MPa) 3.7
Maximum (MPa) 8.2
Unit K
Coefficient of Variation (%) 37.7
No. of Samples 4
Mean (MPa) 3.5
Standard Deviation (MPa) 1.3
Minimum (MPa) 2.4
Maximum (MPa) 5.4
Unit O
Coefficient of Variation (%) 37.1
No. of Samples 2
Mean (MPa) 5.8
Standard Deviation (MPa) NA
Minimum (MPa) 4.3
Maximum (MPa) 7.3
Unit R
Coefficient of Variation (%) NA
No. of Samples 3
Mean (MPa) 4.0
Standard Deviation (MPa) 1.0
Minimum (MPa) 3.4
Maximum (MPa) 5.3
Unit S
Coefficient of Variation (%) 25.0
No. of Samples 1
Mean (MPa) 6.1
Standard Deviation (MPa) NA
Minimum (MPa) 6.1
Maximum (MPa) 6.1
Unit U
Coefficient of Variation (%) NA
No. of Samples 2
Mean (MPa) 5.3
Standard Deviation (MPa) NA
Unit UV
Minimum (MPa) 4.5

SME Annual Meeting Feb. 22-Feb. 25, 2009, Denver, CO
44 Copyright © 2009 by SME
Location Statistics Point Load Strength Index Maximum (MPa) 6.1
Coefficient of Variation (%) NA
No. of Samples 1
Mean (MPa) 3.7
Standard Deviation (MPa) NA
Minimum (MPa) 3.7
Maximum (MPa) 3.7
Unit M
Coefficient of Variation (%) NA
No. of Samples 1
Mean (MPa) 6.5
Standard Deviation (MPa) NA
Minimum (MPa) 6.5
Maximum (MPa) 6.5
Rubble
Coefficient of Variation (%) NA

SME Annual Meeting Feb. 22-Feb. 25, 2009, Denver, CO
45 Copyright © 2009 by SME
APPENDIX 1 (Cont’d)
Table 1-8. Summary statistics of the slake durability indices for GHN rock pile samples. Geologic conceptual model is in Figure 2. Units Statistics Slake Durability Index
No. of Samples 2 Mean (%) 97.0
Standard Deviation (%) NA Minimum (%) 96.0 Maximum (%) 98.0
Traffic
Coefficient of Variation (%) NA
No. of Samples 1
Mean (%) 97.9
Standard Deviation (%) NA
Minimum (%) 97.9
Maximum (%) 97.9
Unit C
Coefficient of Variation (%) NA
No. of Samples 4
Mean (%) 87.9
Standard Deviation (%) 5.5
Minimum (%) 82.2
Maximum (%) 95.0
Unit I
Coefficient of Variation (%) 6.3
No. of Samples 7
Mean (%) 95.8
Standard Deviation (%) 1.9
Minimum (%) 94.0
Maximum (%) 98.5
Unit J
Coefficient of Variation (%) 2.0
No. of Samples 5
Mean (%) 96.3
Standard Deviation (%) 1.4
Minimum (%) 94.0
Maximum (%) 98.5
Unit N
Coefficient of Variation (%) 1.5
No. of Samples 5
Mean (%) 96.2
Standard Deviation (%) 2.2
Minimum (%) 93.6
Maximum (%) 98.4
Unit K
Coefficient of Variation (%) 2.3
No. of Samples 18
Mean (%) 96.5
Standard Deviation (%) 1.4
Minimum (%) 93.6
Maximum (%) 98.1
Unit O
Coefficient of Variation (%) 1.5
No. of Samples 2
Mean (%) 96.4
Standard Deviation (%) NA
Minimum (%) 95.5
Maximum (%) 97.3
Unit R
Coefficient of Variation (%) NA
No. of Samples 3
Mean (%) 97.4
Standard Deviation (%) 1.6
Minimum (%) 95.6
unit S
Maximum (%) 98.4

SME Annual Meeting Feb. 22-Feb. 25, 2009, Denver, CO
46 Copyright © 2009 by SME
Units Statistics Slake Durability Index Coefficient of Variation (%) 1.6
No. of Samples 5
Mean (%) 97.7
Standard Deviation (%) 0.6
Minimum (%) 97.1
Maximum (%) 98.5
Unit U
Coefficient of Variation (%) 0.6
No. of Samples 3
Mean (%) 96.7
Standard Deviation (%) 0.8
Minimum (%) 95.9
Maximum (%) 97.4
Unit UV
Coefficient of Variation (%) 0.8
No. of Samples 1
Mean (%) 96.6
Standard Deviation (%) NA
Minimum (%) 96.6
Maximum (%) 96.6
Unit M
Coefficient of Variation (%) NA
No. of Samples 7
Mean (%) 97.4
Standard Deviation (%) 1.1
Minimum (%) 95.2
Maximum (%) 98.5
Rubble
Coefficient of Variation (%) 1.1
No. of Samples 9.0
Mean (%) 95.7
Standard Deviation (%) 1.7
Minimum (%) 93.0
Maximum (%) 98.5
Colluvium
Coefficient of Variation (%) 1.8
No. of Samples 11
Mean (%) 95.7
Standard Deviation (%) 5.1
Minimum (%) 80.9
Maximum (%) 99.2
Unstable GHN
Coefficient of Variation (%) 5.3

SME Annual Meeting Feb. 22-Feb. 25, 2009, Denver, CO
47 Copyright © 2009 by SME
APPENDIX 1 (Cont’d)
Table 1-9. Summary statistics of the point load strength for all rock pile samples. Location of Questa rock piles is in Figure 1. Rock Pile Location Statistics Point Load Strength Index
No. of Samples 31 Mean(MPa) 4.3
Standard Deviation (MPa) 1.9 Minimum (MPa) 0.6 Maximum (MPa) 8.2
Goat Hill North (GHN)
Coefficient of Variation (%) 43.4
No. of Samples 7
Mean(MPa) 3.0
Standard deviation (MPa) 1.2
Minimum (MPa) 1.3
Maximum (MPa) 4.8
Spring Gulch (SPR)
Coefficient of Variation (%) 38.8
No. of Samples 8
Mean(MPa) 2.2
Standard Deviation (MPa) 0.8
Minimum (MPa) 1.0
Maximum (MPa) 3.8
Sugar Shack South (SSS)
Coefficient of Variation (%) 35.9
No. of Samples 11
Mean(MPa) 4.2
Standard Deviation (MPa) 1.3
Minimum (MPa) 2.0
Maximum (MPa) 6.1
Sugar Shack West (SSW)
Coefficient of Variation (%) 31.0
No. of Samples 2
Mean(MPa) 4.5
Standard Deviation (MPa) NA
Minimum (MPa) 4.4
Maximum (MPa) 4.5
Middle (MID)
Coefficient of Variation (%) NA

SME Annual Meeting Feb. 22-Feb. 25, 2009, Denver, CO
48 Copyright © 2009 by SME
APPENDIX 1 (Cont’d)
Table 1-10. Summary statistics of the slake durability indices for all rock pile samples. The locations of the Questa rock piles are in Figure 1. Location Statistics Slake Durability Index
Number of Samples 76 Mean (%) 96.1
Standard Deviation (%) 3.2 Minimum (%) 80.9 Maximum (%) 99.2
GHN
Coefficient of Variation (%) 3.4
Number of Samples 8
Mean (%) 96.1
Standard Deviation (%) 5.2
Minimum (%) 83.5
Maximum (%) 99.2
SPR
Coefficient of Variation (%) 5.4
Number of Samples 30
Mean (%) 97.4
Standard Deviation (%) 2.8
Minimum (%) 85.3
Maximum (%) 99.5
SSS
Coefficient of Variation (%) 2.7
Number of Samples 15
Mean (%) 96.3
Standard Deviation (%) 4.0
Minimum (%) 82.3
Maximum (%) 98.6
SSW
Coefficient of Variation (%) 4.1
Number of Samples 3
Mean (%) 96.9
Standard Deviation (%) 1.1
Minimum (%) 95.6
Maximum (%) 97.6
MID
Coefficient of Variation (%) 1.1
Table 1-11. Summary statistics of the point load strength for all weathered (outcrop) and unweathered (drill core) rock samples. Lithology Statistics Point Load Strength Index
No. of Samples 15
Mean (MPa) 3.7
Standard Deviation (MPa) 1.7
Minimum (MPa) 1.3
Maximum (MPa) 6.9
Unweathered andesite
Coefficient of Variation (%) 46.5
No. of Samples 3
Mean (MPa) 2.6
Standard Deviation (MPa) 0.7
Minimum (MPa) 1.8
Maximum (MPa) 3.1
rhyolite (Amalia Tuff)
Coefficient of Variation (%) 27.5
No. of Samples 2
Mean (MPa) 4.2
Standard Deviation (MPa) NA
Minimum (MPa) 3.6
Maximum (MPa) 4.8
Unweathered aplite
Coefficient of Variation (%) NA

SME Annual Meeting Feb. 22-Feb. 25, 2009, Denver, CO
49 Copyright © 2009 by SME
APPENDIX 1 (Cont’d)
Table 1-12. Summary statistics of the slake durability indices for all weathered (outcrop) and unweathered (drill core) rock samples. Lithology Statistics Slake Durability Index
No. of Samples 8 Mean (%) 96.4
Standard Deviation (%) 4.8 Minimum (%) 85.5 Maximum (%) 99.6
andesite
Coefficient of Variation (%) 4.8
No. of Samples 19
Mean (%) 94.9
Standard Deviation (%) 4.0
Minimum (%) 83.7
Maximum (%) 99.1
unweathered andesite
Coefficient of Variation (%) 4.2
No. of Samples 8
Mean (%) 94.5
Standard Deviation (%) 2.7
Minimum (%) 88.9
Maximum (%) 97.5
rhyolite (Amalia Tuff)
Coefficient of Variation (%) 2.9
No. of Samples 10
Mean (%) 92.2
Standard Deviation (%) 2.7
Minimum (%) 92.5
Maximum (%) 99.5
unweathered aplite
Coefficient of Variation (%) 2.8

SME Annual Meeting Feb. 22-Feb. 25, 2009, Denver, CO
50 Copyright © 2009 by SME
APPENDIX 2
METHODOLOGY IN CALCULATION OF POINT LOAD STRENGTH INDEX OF A SAMPLE
The plot of P versus De
2 of rock fragments of a sample generally results in a straight line but points around this line are usually scattered for weathered irregular rock fragments. Hence ISRM, 1985 states that points that deviate from the straight line should be disregarded but should not be deleted. Figure 2-1 shows a plot of P versus De
2 with the entire data points whereas Figure 2-2 shows a plot with the removed deviated points. The average of Is50 values of these remaining points is the reported Is50 for each sample.
Figure 2-1. P (peak load) versus De
2 for sample MIN-SAN-0001 with 14 test points with graphical IS50 of 4.0 MPa and an average IS50 using the correction factor (equation 2) for the entire 14 tests of 4.82 MPa.
Figure 2-2. P (peak load) versus De
2 (equivalent diameter) for sample MIN-SAN-0001 with 10 test points after eliminating the points deviating from the straight line with graphical IS50 of 4.0 MPa and an average IS50 using the correction factor (equation 2) for the 10 remaining points of 5.04 MPa. The reported Is50 for sample MIN-SAN-0001 is 5.04 MPa.