Embed Size (px)
Citation preview

Prepared in cooperation with Johnson County Wastewater
Effects of Wastewater Effluent Discharge and Treatment Facility Upgrades on Environmental and Biological Conditions of Indian Creek, Johnson County, Kansas, June 2004 through June 2013
Scientific Investigations Report 2014–5187
U.S. Department of the InteriorU.S. Geological Survey
Cover. Background photograph: Indian Creek near College Boulevard in Johnson County, Kansas, March 2012. Front cover photographs: A, U.S. Geological Survey monitoring station on Indian Creek at Indian Creek Parkway in Johnson County, Kansas. B, Middle Basin Wastewater Treatment Facility in Johnson County, Kansas. C, Tomahawk Creek in Johnson County, Kansas, February 2012. D, Water-quality monitoring instrumentation on Indian Creek at State Line Road in Johnson County, Kansas.
A
B
C
D
Effects of Wastewater Effluent Discharge and Treatment Facility Upgrades on Environmental and Biological Conditions of Indian Creek, Johnson County, Kansas, June 2004 through June 2013
By Jennifer L. Graham, Mandy L. Stone, Teresa J. Rasmussen, Guy M. Foster, Barry C. Poulton, Chelsea R. Paxson, and Theodore D. Harris
Prepared in cooperation with Johnson County Wastewater
Scientific Investigations Report 2014–5187
U.S. Department of the InteriorU.S. Geological Survey

U.S. Department of the InteriorSALLY JEWELL, Secretary
U.S. Geological SurveySuzette M. Kimball, Acting Director
U.S. Geological Survey, Reston, Virginia: 2014
For more information on the USGS—the Federal source for science about the Earth, its natural and living resources, natural hazards, and the environment, visit http://www.usgs.gov or call 1–888–ASK–USGS.
For an overview of USGS information products, including maps, imagery, and publications, visit http://www.usgs.gov/pubprod
To order this and other USGS information products, visit http://store.usgs.gov
Any use of trade, firm, or product names is for descriptive purposes only and does not imply endorsement by the U.S. Government.
Although this information product, for the most part, is in the public domain, it also may contain copyrighted materials as noted in the text. Permission to reproduce copyrighted items must be secured from the copyright owner.
Suggested citation:Graham, J.L., Stone, M.L., Rasmussen, T.J., Foster, G.M., Poulton, B.C., Paxson, C.R., and Harris, T.D., 2014, Effects of wastewater effluent discharge and treatment facility upgrades on environmental and biological conditions of Indian Creek, Johnson County, Kansas, June 2004 through June 2013: U.S. Geological Survey Scientific Investigations Report 2014–5187, 78 p., http://dx.doi.org/10.3133/sir20145187.
ISSN 2328-0328 (online)
iii
Acknowledgments
The authors thank Susan Pekarek, Doug Nolkemper, Tamara Lorenzen, and Aaron Witt of Johnson County Wastewater for technical assistance and providing data and information about wastewater treatment at the Douglas L. Smith Middle Basin and Tomahawk Creek Wastewater Treatment Facilities. The authors also thank Tony Holt and other staff members of the Johnson County Wastewater Water-Quality Laboratory for support in coordination of water-sample analysis. The authors also thank Mark Ellersick, University of Missouri, for his assistance with the statistical analyses of periphyton and macroinvertebrate data.
The authors also appreciate the assistance of Jenny Lanning-Rush, U.S. Geological Survey, with the analysis and interpretation of land use data. And last, but not least, the authors thank the U.S. Geological Survey staff that assisted with data collection, analysis, and interpretation including Andrew Clark, Patrick Finnegan, Jackline Gatotho, Justina Gonzalez, John Hamill, William Holladay, Derrick Holmes, Brian Klager, Eric Looper, Benjamin Prewitt, Patrick Rasmussen, and Andrew Toth. Donald Wilkison of the Missouri Water Science Center and Paul Bradley of the South Carolina Water Science Center provided helpful reviews that improved earlier drafts of this report.
iv
Contents
Acknowledgments ........................................................................................................................................iiiAbstract ...........................................................................................................................................................1Introduction.....................................................................................................................................................2Purpose and Scope .......................................................................................................................................4Description of Study Area ............................................................................................................................4Previous Investigations.................................................................................................................................5Methods...........................................................................................................................................................7
Data Collection ......................................................................................................................................7Middle Basin and Tomahawk Creek Wastewater Treatment Facility Effluent Data .........7Previously Collected Data ..........................................................................................................7Discrete Water-Quality Samples ...............................................................................................7Continuous Water-Quality Monitoring......................................................................................8Streambed-Sediment Samples ..................................................................................................8Habitat Assessment ....................................................................................................................8
Light Intensity ......................................................................................................................8Physical-Habitat Characteristics .....................................................................................9
Periphyton .....................................................................................................................................9Periphyton Communities ....................................................................................................9Periphyton Biomass ...........................................................................................................9
Macroinvertebrates ....................................................................................................................9Data Analysis .......................................................................................................................................10
Stream-Water Chemistry Data ................................................................................................10Periphyton Data .........................................................................................................................11Macroinvertebrate Data ...........................................................................................................12Stream Metabolism Data ..........................................................................................................12
Quality Assurance and Quality Control ...........................................................................................12Stream-Water Chemistry Data ................................................................................................12Streambed-Sediment Chemistry Data ....................................................................................13Periphyton Data .........................................................................................................................13Macroinvertebrate Data ...........................................................................................................13
Environmental Conditions in Indian Creek ...............................................................................................13Streamflow ...........................................................................................................................................14Stream-Water Chemistry ...................................................................................................................15
Specific Conductance, pH, Water Temperature, and Dissolved Oxygen .........................15Turbidity, Suspended Solids, and Suspended Sediment .....................................................25Dissolved Solids and Major Ions .............................................................................................28Nutrients ......................................................................................................................................28
Nutrients in Wastewater Effluent ...................................................................................28Nutrient Concentrations Upstream and Downstream from Wastewater
Treatment Facilities .............................................................................................34Computed Total Nitrogen and Total Phosphorus Concentrations and Loads .........37
Biochemical Oxygen Demand .................................................................................................43

v
Indicator Bacteria ......................................................................................................................44Organic Wastewater-Indicator Compounds .........................................................................44
Streambed-Sediment Chemistry ......................................................................................................44Habitat 45
Light Intensity .............................................................................................................................45Physical-Habitat Characteristics ............................................................................................46
Biological Conditions of Indian Creek ......................................................................................................48Periphyton ............................................................................................................................................48
Periphyton Community Composition .......................................................................................48Periphyton Metrics ....................................................................................................................50
Saprobity ............................................................................................................................50Trophic Condition ..............................................................................................................51Nitrogen-Uptake Metabolism .........................................................................................52Bahls Index ........................................................................................................................52
Periphyton Chlorophyll, Abundance, and Biovolume ..........................................................53Seasonal Periphyton Biomass .................................................................................................54
Macroinvertebrate Communities .....................................................................................................56Macroinvertebrate Community Composition ........................................................................57Macroinvertebrate Metrics .....................................................................................................57
Aquatic Life Support Metrics ..........................................................................................57Macroinvertebrate Biotic Index ............................................................................58Kansas Biotic Index .................................................................................................58Ephemeroptera, Plecoptera, and Trichoptera Taxa Richness ..........................58Percentage of Ephemeroptera, Plecoptera, and Trichoptera ..........................58Aquatic Life Support Status ...................................................................................58
Stream Metabolism ............................................................................................................................60Gross Primary Production ........................................................................................................60Community Respiration .............................................................................................................61
Effects of Wastewater Effluent Discharge on Environmental and Biological Conditions of Indian Creek ....................................................................................................................................64
Summary........................................................................................................................................................68References Cited..........................................................................................................................................71Appendixes 1 through 18 are available online at
http://pubs.usgs.gov/sir/2014/5187/downloads/sir2014-5187_appendixes.xlsx

vi
Figures 1. Map showing location of municipal wastewater treatment facilities and study sites
in the Indian Creek Basin ............................................................................................................3 2. Graph showing comparison between sensor-measured and laboratory-measured
nitrate plus nitrite concentrations at the Indian Creek study sites ....................................10 3. Graph showing streamflow duration curves at the Indian Creek study sites during
July 2011 through June 2013 .....................................................................................................14 4. Graphs showing the percent contribution of wastewater effluent to streamflow
during below-normal, normal, and above-normal streamflows at the Marty and State Line study sites on Indian Creek during the before-upgrade, transitional, and after-upgrade periods at the Middle Basin Wastewater Treatment Facility ....................17
5. Graphs showing duration curves for continuously measured water-quality constituents at the State Line site during the before-upgrade, transitional, and after-upgrade periods at the Middle Basin Wastewater Treatment Facility ....................19
6. Graphs showing duration curves for continuously measured water-quality constituents at all Indian Creek study sites, July 2011 through June 2013 .......................20
7. Graphs showing annual mean wastewater effluent total nitrogen and phosphorus concentrations and loads at the Middle Basin and Tomahawk Creek Wastewater Treatment Facilities during 2004 through 2013 .......................................................................33
8. Graphs showing relations between nutrient concentrations and streamflow at all Indian Creek study sites, June 2011 through June 2013 ......................................................35
9. Graphs showing nitrate plus nitrite and orthophosphorus concentrations and percent contribution to total nitrogen and phosphorus concentrations during below-normal, normal, and above-normal streamflows at all Indian Creek study sites, June 2011 through June 2013 .........................................................................................36
10. Graphs showing comparison between measured and computed total nutrient concentrations at the Indian Creek study sites .....................................................................39
11. Graphs showing duration curves for computed total nutrient concentrations at the Indian Creek study sites, July 2011 through June 2013 ........................................................40
12. Graphs showing computed total nutrient loads originating from wastewater treatment facility discharges compared to total loads at the State Line site during 2005 through 2012 .......................................................................................................................41
13. Graphs showing computed total nutrient loads originating from wastewater treatment facility discharges compared to total loads at the Indian Creek study sites during July 2011 through June 2012 and July 2012 through June 2013 ....................42
14. Graph showing monthly mean light intensity at the Indian Creek study sites during October 2011 through June 2013 ..............................................................................................46
15. Graphs showing normalized total habitat and selected individual habitat variable scores at the Indian Creek study sites during July 2012 ......................................................47
16. Graphs showing selected periphyton metric scores at the Indian Creek study sites during August 2012 and April 2013 ...........................................................................................51
17. Graphs showing periphyton chlorophyll concentrations at the Indian Creek study sites during August 2011 through September 2012 ...............................................................55
18. Graph showing relation between periphyton chlorophyll concentration and streamflow at the Indian Creek study sites during August 2011 through September 2012 ...............................................................................................................................................56

vii
19. Graphs showing macroinvertebrate aquatic life support metrics at the Indian Creek study sites during August 2012 and April 2013 .......................................................................59
20. Graphs showing seasonal patterns in mean gross primary production and community respiration at the Indian Creek study sites during July 2011 through June 2013 .....................................................................................................................................62
Tables 1. Location and description of Indian Creek Basin study sites in Johnson County,
Kansas, including drainage area, land cover, and distance from the Middle Basin and Tomahawk Creek Wastewater Treatment Facility effluent discharges .......................6
2. Streamflow statistics for the Marty and State Line sites on Indian Creek, flow statistics for the Middle Basin and Tomahawk Creek Wastewater Treatment Facilities, and the percent contribution of wastewater effluent to annual streamflow at the Marty and State Line sites during January 2004 through December 2013 ............................................................................................................................16
3. Summary statistics for water-quality constituents measured continuously at the State Line study site during the before-upgrade, transitional, and after-upgrade periods at the Middle Basin Wastewater Treatment Facility during below-normal, normal, and above-normal streamflow conditions, June 2004 through June 2013 .........18
4. Summary statistics for water-quality constituents measured continuously at all Indian Creek study sites during below-normal, normal, and above-normal streamflow conditions, July 2011 through June 2013 ...........................................................21
5. Summary of results from discrete water-quality samples collected at the State Line study site during the before-upgrade, transitional, and after-upgrade periods at the Middle Basin Wastewater Treatment Facility, June 2004 through June 2013 ..................26
6. Summary of results from discrete water-quality samples collected at all Indian Creek study sites, June 2011 through June 2013 ...................................................................29
7. Computed loads for total nitrogen and phosphorus at the Indian Creek study sites, July 2011 through June 2013 .....................................................................................................43
8. Percent contributions of each algal periphyton division to total abundance and biovolume at the Indian Creek study sites during August 2012 and April 2013 ................49
9. Mean and standard deviation of periphytic chlorophyll concentration and periphytic algal abundance and biovolume at the Indian Creek study sites during August 2012 and April 2013 .......................................................................................................53
10. Criteria for four macroinvertebrate metrics used in Kansas to evaluate aquatic life support status of streams .........................................................................................................57
11. Framework and ratio criteria proposed by Young and others (2008) for assessing functional stream health using stream metabolism data .....................................................60
12. Seasonal and overall summary of functional stream health ratios at the Indian Creek study sites during July 2011 through June 2013 .........................................................63

viii
Conversion FactorsSI to Inch/Pound
Multiply By To obtain
Length
centimeter (cm) 0.3937 inch (in.)millimeter (mm) 0.03937 inch (in.)meter (m) 3.281 foot (ft) kilometer (km) 0.6214 mile (mi)micrometer (µm) 0.001 millimeter (mm)meter (m) 1.094 yard (yd) nanometer (nm) 0.001 micrometer (µm)
Area
square meter (m2) 10.76 square feet (ft2) square kilometer (km2) 0.3861 square mile (mi2)
Volume
milliliter (mL) 0.0338 ounce, fluid (oz)gallon (gal) 3.785 liter (L)million gallons (Mgal) 3,785 cubic meter (m3)cubic foot (ft3) 0.02832 cubic meter (m3)
Flow rate
cubic foot per second (ft3/s) 0.02832 cubic meter per second (m3/s)million gallons per day (Mgal/d) 0.04381 cubic meter per second (m3/s)
Concentration
milligrams per liter (mg/L) 1 parts per billion (ppb)micrograms per liter (µg/L) 1 parts per million (ppm)micrograms per kilogram (µg/kg) 1 parts per billion (ppb)milligrams per kilogram (mg/kg) 1 parts per million (ppm)milligrams per square meter (mg/m2) 0.000001 kilogram per square meter (kg/m2)
Mass
kilogram (kg) 2.204 pounds (lb)milligram (mg) 0.001 gram (g)microgram (µg) 0.000001 gram (g)metric ton per year 1.102 ton per year (ton/yr)
Temperature in degrees Celsius (°C) may be converted to degrees Fahrenheit (°F) as follows:
°F=(1.8×°C)+32
Specific conductance is given in microsiemens per centimeter at 25 degrees Celsius (µS/cm at 25 °C).
Concentrations of chemical constituents in water are given either in milligrams per liter (mg/L) or micrograms per liter (µg/L).
ix
AbbreviationsADAS Algal Data Analysis System
ANOVA analysis of variance
billion cells/m2 billion cells per square meter
BNR biological nutrient removal
BOD biological oxygen demand
CEPT chemically enhanced primary treatment
COD chemical oxygen demand
CR community respiration
CV coefficient of determination
DEET N,N-Diethyl-m-toluamide
DOC dissolved organic carbon
EPA U.S. Environmental Protection Agency
EPT Ephemeroptera, Plecoptera, and Trichoptera
F F-statistic
FNU formazin nephelometric units
g O2/m2/d grams of oxygen per meter squared per day
GPP gross primary production
IDAS Invertebrate Data Analysis System
KBI Kansas Biotic Index
KDHE Kansas Department of Health and Environment
lm/m2 lumens per square meter
ln natural logarithm
log10 common logarithm
MBI Macroinvertebrate Biotic Index
n number of measurements
NAWQA National Water-Quality Assessment
NEET Nutrient Enrichment Effects Team
NEP net ecosystem production
NPDES national pollutant discharge elimination system
NWQL National Water Quality Laboratory
OWC organic wastewater indicator compound

x
P/R production to respiration ratio
PAH polyaromatic hydrocarbon
PEC probable effect concentration
p-value probability value
R 2 coefficient of determination
RBP Rapid Bioassessment Protocols
rho value Spearman rank-correlation coefficient
RPD relative percentage difference
SSC suspended-sediment concentration
TAN total ammonia nitrogen
TMDL total maximum daily load
TN total nitrogen
TOC total organic carbon
TP total phosphorus
TSS total suspended solids
USGS U.S. Geological Survey
UV ultraviolet radiation
WWTF wastewater treatment facility
YSI Yellow Springs Instruments

Effects of Wastewater Effluent Discharge and Treatment Facility Upgrades on Environmental and Biological Conditions of Indian Creek, Johnson County, Kansas, June 2004 through June 2013
By Jennifer L. Graham, Mandy L. Stone, Teresa J. Rasmussen, Guy M. Foster, Barry C. Poulton, Chelsea R. Paxson, and Theodore D. Harris
AbstractIndian Creek is one of the most urban drainage basins
in Johnson County, Kansas, and environmental and bio-logical conditions of the creek are affected by contaminants from point and other urban sources. The Johnson County Douglas L. Smith Middle Basin (hereafter referred to as the “Middle Basin”) and Tomahawk Creek Wastewater Treat-ment Facilities (WWTFs) discharge to Indian Creek. In summer 2010, upgrades were completed to increase capacity and include biological nutrient removal at the Middle Basin facility. There have been no recent infrastructure changes at the Tomahawk Creek facility; however, during 2009, chemi-cally enhanced primary treatment was added to the treatment process for better process settling before disinfection and dis-charge with the added effect of enhanced phosphorus removal. The U.S. Geological Survey, in cooperation with Johnson County Wastewater, assessed the effects of wastewater effluent on environmental and biological conditions of Indian Creek by comparing two upstream sites to four sites located downstream from the WWTFs using data collected during June 2004 through June 2013. Environmental conditions were evaluated using previously and newly collected discrete and continu-ous data and were compared with an assessment of biologi-cal community composition and ecosystem function along the upstream-downstream gradient. This study improves the understanding of the effects of wastewater effluent on stream-water and streambed sediment quality, biological community composition, and ecosystem function in urban areas.
After the addition of biological nutrient removal to the Middle Basin WWTF in 2010, annual mean total nitrogen concentrations in effluent decreased by 46 percent, but still exceeded the National Pollutant Discharge Elimination System (NPDES) wastewater effluent permit concentration goal of 8.0 milligrams per liter (mg/L); however, the NPDES waste-water effluent permit total phosphorus concentration goal of 1.5 mg/L or less was achieved at the Middle Basin WWTF.
At the Tomahawk Creek WWTF, after the addition of chemi-cally enhanced primary treatment in 2009, effluent discharges also had total phosphorus concentrations below 1.5 mg/L. After the addition of biological nutrient removal, annual total nitrogen and phosphorus loads from the Middle Basin WWTF decreased by 42 and 54 percent, respectively, even though effluent volume increased by 11 percent. Annual total phosphorus loads from the Tomahawk Creek WWTF after the addition of chemically enhanced primary treatment decreased by 54 percent despite a 33-percent increase in effluent volume.
Total nitrogen and phosphorus from the WWTFs con-tributed between 30 and nearly 100 percent to annual nutrient loads in Indian Creek depending on streamflow conditions. In-stream total nitrogen primarily came from wastewater efflu-ent except during years with the highest streamflows. Most of the in-stream total phosphorus typically came from efflu-ent during dry years and from other urban sources during wet years. During 2010 through 2013, annual mean discharge from the Middle Basin WWTF was about 75 percent of permitted design capacity. Annual nutrient loads likely will increase when the facility is operated at permitted design capacity; however, estimated maximum annual nutrient loads from the Middle Basin WWTF were 27 to 38 percent lower than before capacity upgrades and the addition of biological nutrient removal to treatment processes. Thus, the addition of biologi-cal nutrient removal to the Middle Basin wastewater treatment process should reduce overall nutrient loads from the facility even when the facility is operated at permitted design capacity.
The effects of wastewater effluent on the water qual-ity of Indian Creek were most evident during below-normal and normal streamflows (about 75 percent of the time) when wastewater effluent represented about 24 percent or more of total streamflow. Wastewater effluent had the most substan-tial effect on nutrient concentrations in Indian Creek. Total and inorganic nutrient concentrations at the downstream sites during below-normal and normal streamflows were 10 to 100 times higher than at the upstream sites, even after changes in treatment practices at the WWTFs. Median total phosphorus

2 Effects of Wastewater Effluent Discharge on Indian Creek, Johnson County, Kansas
concentrations during below-normal and normal stream-flows at a downstream site were 43 percent lower following improvements in wastewater treatment processes. Similar decreases in total nitrogen were not observed, likely because total nitrogen concentrations only decreased in Middle Basin effluent and wastewater contributed a higher percentage to streamflows when nutrient samples were collected during the after-upgrade period.
The wastewater effluent discharges to Indian Creek caused changes in stream-water quality that may affect biological community structure and ecosystem processes, including higher concentrations of bioavailable nutrients (nitrate and orthophosphorus) and warmer water temperatures during winter months. Other urban sources of contaminants also caused changes in stream-water quality that may affect biological community structure and ecosystem processes, including higher turbidities downstream from construction areas and higher specific conductance and chloride concentra-tions during winter months. Chloride concentrations exceeded acute and chronic exposure criteria at all Indian Creek study sites, regardless of wastewater influence, for weeks or months during winter. Streambed sediment chemistry was affected by wastewater (elevated nutrient and organic wastewater-indicator compound concentrations) and other contaminants from urban sources (elevated polyaromatic hydrocarbon concentrations). Overall habitat conditions were suboptimal or marginal at all sites; general decline in habitat conditions along the upstream-downstream gradient likely was caused by the cumulative effects of urbanization with increasing drain-age basin size.
Wastewater effluent likely affected algal periphyton biomass and community composition, primary production, and community respiration in Indian Creek. Functional stream health, evaluated using a preliminary framework based on primary production and community respiration, was mildly or severely impaired at most downstream sites relative to an urban upstream Indian Creek site. The mechanistic cause of the changes in these biological variables are unclear, though elevated nutrient concentrations were positively correlated with algal biomass, primary production, and community respi-ration. Macroinvertebrate communities indicated impairment at all sites, and Kansas Department of Health and Environment aquatic life support scores indicated conditions nonsupport-ing of aquatic life, regardless of wastewater influences. Urban influences, other than wastewater effluent discharge, likely control macroinvertebrate community structure in Indian Creek.
Changes in treatment processes at the Middle Basin and Tomahawk Creek WWTFs improved wastewater effluent quality and decreased nutrient loads, but wastewater efflu-ent discharges still had negative effects on the environmen-tal and biological conditions at downstream Indian Creek sites. Wastewater effluent discharge into Indian Creek likely contributed to changes in measures of ecosystem structure (streamflow, water and streambed-sediment chemistry, algal
biomass, and algal periphyton community composition) and function (primary production and community respiration) along the upstream-downstream gradient. Wastewater efflu-ent discharges maintained streamflows and increased nutri-ent concentrations, algal biomass, primary production, and community respiration at the downstream sites. Functional stream health was severely impaired downstream from the Middle Basin WWTF and mildly impaired downstream from the Tomahawk WWTF relative to the urban upstream site. As distance from the Middle Basin WWTF increased, nutri-ent concentrations, algal biomass, primary production, and community respiration decreased, and functional stream health was no longer impaired 9.5 kilometers downstream from the discharge relative to the urban upstream site. Therefore, although wastewater effluent caused persistent changes in environmental and biological conditions and functional stream health at sites located immediately downstream from WWTF effluent discharges, some recovery to conditions more similar to the urban upstream site occurred within a relatively short distance.
IntroductionJohnson County is the fastest growing county in Kan-
sas, with a population of about 560,000 people in 2012. The population in Johnson County has increased by approximately 20 percent every decade, a growth trajectory that is expected to continue for at least the next 20 years (U.S. Census Bureau, 2013). Infrastructure needs will continue to increase with ongoing population growth and urban development. Urban growth and development can have substantial effects on water quality (Walsh and others, 2005), and streams in Johnson County are affected by nonpoint-source and urban-source con-taminants from stormwater runoff and point-source discharges such as municipal wastewater effluent (Lee and others, 2005). Understanding of current (2014) water-quality conditions and the effects of urbanization is critical for the protection and remediation of aquatic resources in Johnson County, Kansas, and farther downstream.
Nutrients, particularly nitrogen and phosphorus, are con-sidered leading causes of water-quality impairment in Kansas and throughout the nation (Kansas Department of Health and Environment, 2004; U.S. Environmental Protection Agency, 2009). Nutrients are essential for the growth of all organisms; however, excessive concentrations in aquatic environments may cause adverse human health and ecological effects includ-ing nuisance algal growth. Overly abundant algal growth causes aesthetic concerns, degrades habitats, and decreases dissolved oxygen stability. There are nonpoint, point, and urban sources of nutrient pollution, but point sources, such as wastewater effluent discharges, are easily identified and provide targeted opportunities to decrease nutrient loads in the environment (Kansas Department of Health and Environment, 2004).
Introduction 3
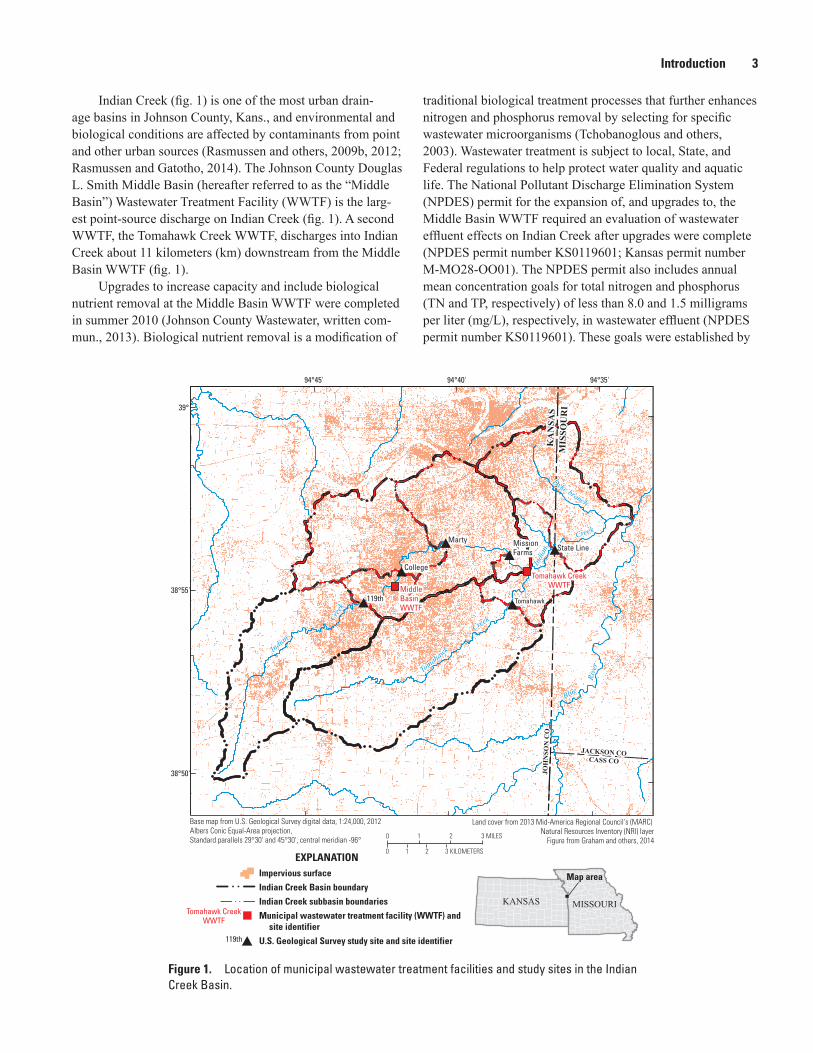
Indian Creek (fig. 1) is one of the most urban drain-age basins in Johnson County, Kans., and environmental and biological conditions are affected by contaminants from point and other urban sources (Rasmussen and others, 2009b, 2012; Rasmussen and Gatotho, 2014). The Johnson County Douglas L. Smith Middle Basin (hereafter referred to as the “Middle Basin”) Wastewater Treatment Facility (WWTF) is the larg-est point-source discharge on Indian Creek (fig. 1). A second WWTF, the Tomahawk Creek WWTF, discharges into Indian Creek about 11 kilometers (km) downstream from the Middle Basin WWTF (fig. 1).
Upgrades to increase capacity and include biological nutrient removal at the Middle Basin WWTF were completed in summer 2010 (Johnson County Wastewater, written com-mun., 2013). Biological nutrient removal is a modification of
traditional biological treatment processes that further enhances nitrogen and phosphorus removal by selecting for specific wastewater microorganisms (Tchobanoglous and others, 2003). Wastewater treatment is subject to local, State, and Federal regulations to help protect water quality and aquatic life. The National Pollutant Discharge Elimination System (NPDES) permit for the expansion of, and upgrades to, the Middle Basin WWTF required an evaluation of wastewater effluent effects on Indian Creek after upgrades were complete (NPDES permit number KS0119601; Kansas permit number M-MO28-OO01). The NPDES permit also includes annual mean concentration goals for total nitrogen and phosphorus (TN and TP, respectively) of less than 8.0 and 1.5 milligrams per liter (mg/L), respectively, in wastewater effluent (NPDES permit number KS0119601). These goals were established by
Figure 1. Location of municipal wastewater treatment facilities and study sites in the Indian Creek Basin.
94°35'94°40'94°45'
JACKSON COJACKSON CO
JOH
NSO
N C
OJO
HN
SON
CO
KA
NSA
SK
AN
SAS
MIS
SOU
RI
MIS
SOU
RI
CASS COCASS CO
Dyke branch
Dyke branch
IndianIndian
Indi
anIn
dian
BlueBlue
Tomahawk
Tomahawk
Cree
kCr
eek
CreekCreek
Rive
rRi
ver
Creek
Creek
MartyMarty
CollegeCollege
MiddleBasinWWTF
MiddleBasinWWTF
Tomahawk CreekWWTF
Tomahawk CreekWWTF
Tomahawk CreekWWTF
Tomahawk CreekWWTF
119th119th
119th119th
State LineState Line
TomahawkTomahawk
Mission FarmsMission Farms
Base map from U.S. Geological Survey digital data, 1:24,000, 2012Albers Conic Equal-Area projection,Standard parallels 29°30' and 45°30', central meridian -96°
Land cover from 2013 Mid-America Regional Council's (MARC) Natural Resources Inventory (NRI) layer
Figure from Graham and others, 2014
EXPLANATIONImpervious surfaceIndian Creek Basin boundaryIndian Creek subbasin boundariesMunicipal wastewater treatment facility (WWTF) and
site identifierU.S. Geological Survey study site and site identifier
39°
38°55'
38°50'
KANSAS MISSOURI
Map area
0 1 2 3 MILES
0 1 2 3 KILOMETERS

4 Effects of Wastewater Effluent Discharge on Indian Creek, Johnson County, Kansas
the Kansas Department of Health and Environment (KDHE) based on typical removal efficiencies for nutrients by biologi-cal nutrient removal processes as part of the Kansas Surface Water Nutrient Reduction Plan (Kansas Department of Health and Environment, 2004).
There have been no recent infrastructure changes at the Tomahawk Creek WWTF (NPDES permit number KS0055484; Kansas permit number M-MO27-OO01). The Tomahawk Creek WWTF currently (2014) is operating under an administratively extended permit while Johnson County Wastewater negotiates a new permit and implements recom-mended improvements (Johnson County Wastewater, written commun., 2014). During 2009, chemically enhanced primary treatment (CEPT) was added to the treatment process for bet-ter process settling before disinfection and discharge with the added effect of enhanced phosphorus removal. Through the CEPT process, ferric chloride was added to precipitate solids from the effluent (Johnson County Wastewater, written com-mun., 2014; Tchobanoglous and others, 2003).
Indian Creek also is affected by urban factors other than point-source wastewater discharges. Urban development can alter stream hydrology, channel and riparian habitat, water chemistry, and biological communities (U.S. Environmental Protection Agency, 1997; Paul and Meyer, 2001; Cuffney and others, 2010; Poff and others, 2010). As stormwater from rain-fall and snowmelt moves across the urban landscape, it often carries trash, sediment, nutrients, metals, pesticides, household chemicals, and other contaminants into streams. In the urban drainage basins of Johnson County, the largest loads of sedi-ment, fecal bacteria, and nutrients have originated from urban sources transported to streams during stormwater runoff (Ras-mussen and others, 2008; Rasmussen and Gatotho, 2014). The complexity of altered stream systems, biological processes, contaminant sources and transport, and biological responses in urban drainage basins can make it difficult to separate indi-vidual effects, such as wastewater discharges.
The U.S. Geological Survey, in cooperation with Johnson County Wastewater, assessed the effects of wastewater effluent on environmental and biological conditions of Indian Creek by comparing two upstream sites to four sites located down-stream from the WWTFs using data collected during June 2004 through June 2013. Water-quality and biological data were collected to allow assessment of chemical and resulting ecological effects of wastewater effluent discharge before and after Middle Basin WWTF upgrades. This study improves the understanding of the effects of wastewater effluent on stream-water and streambed sediment quality, biological com-munity composition, and ecosystem function in urban areas. In addition, this information helps to fulfill the NPDES-permit required post-upgrade evaluation of Middle Basin WWTF effluent effects on Indian Creek.
Purpose and ScopeThe purpose of this report is to describe the effects
of wastewater effluent discharge and facility upgrades on environmental and biological conditions in Indian Creek, downstream from the Middle Basin and Tomahawk WWTFs. Data collected by the USGS from the Indian Creek Basin during June 2004 through June 2013, including data from before and after the Middle Basin WWTF upgrade and the addition of CEPT at the Tomahawk WWTF, were used to evaluate environmental and biological conditions. Streamflow, discrete and continuously measured stream-water chemistry, streambed-sediment chemistry, and habitat data were used to evaluate differences in environmental conditions upstream and downstream from the wastewater effluent discharges, describe mean annual concentrations and loads of total and dissolved nitrogen and phosphorus in Indian Creek, and determine the percent contribution of wastewater nutrients to total annual nutrient loads in Indian Creek. Periphyton, macroinvertebrate, and stream metabolism (primary productivity and respiration of biological communities) data were used to evaluate differ-ences in biological conditions upstream and downstream from the wastewater effluent discharges. Evaluation of environmen-tal and biological data allowed assessment of the physical, chemical, and resulting ecological effects of wastewater efflu-ent discharges in an urban area.
Description of Study AreaThe Indian Creek Basin is 194 square kilometers (km2)
and includes parts of Johnson County, Kans., and Jackson County, Missouri. Approximately 86 percent of the Indian Creek Basin is located in Johnson County, Kans. Indian Creek flows east from its headwaters in central Johnson County, Kansas, to the Blue River (fig. 1). Overall, 93 percent of land use in the Indian Creek Basin is classified as urban and 47 per-cent is classified as impervious surface.
Two WWTFs, Middle Basin and Tomahawk Creek, discharge into Indian Creek within Johnson County, Kans. (fig. 1). The Middle Basin WWTF was originally constructed in the 1950s as a facultative lagoon plant and has undergone numerous upgrades to increase capacity and improve tech-nology. The most recent upgrades during 2007–10 increased treatment capacity and implemented biological nutrient removal (Johnson County Wastewater, written commun., 2013). Upgrades increased permitted design capacity from 18.6 cubic feet per second (ft3/s) to 22.4 ft3/s (12 to 14.5 mil-lion gallons per day) and complete mix activated sludge was replaced with a biological nutrient removal activated sludge system (NPDES permit number KS0119601). Expansion and upgrades were officially completed in summer 2010. The Tomahawk Creek WWTF, originally constructed in 1955, is a trickling filter plant and has a permitted design capacity of 15.5 ft3/s (10 million gallons per day; NPDES permit number

Previous Investigations 5
KS0055484). During 2011 and 2012, the Middle Basin and Tomahawk Creek WWTFs contributed about 25 and 15 per-cent, respectively, of the total wastewater effluent discharged by Johnson County Wastewater (Johnson County Wastewater, 2012 and 2013).
The Middle Basin and Tomahawk Creek WWTFs are located upstream from the continuous water-quality monitor-ing site on Indian Creek at State Line Road (fig. 1, table 1) that has been operated since 2004. Study sites located upstream and downstream from both WWTFs were needed to assess environmental and biological conditions before and after the upgrades to the Middle Basin facility and to compare waste-water and urban influences on environmental and biological conditions; therefore, five sites along a 15.4-km reach of Indian Creek and one site on Tomahawk Creek, the larg-est tributary to Indian Creek, were sampled (fig. 1, table 1). For simplicity, the Indian Creek and Tomahawk Creek sites are collectively referred to as the Indian Creek study sites throughout the report. The 119th and Tomahawk sites are located upstream from WWTF effluent discharges. The Col-lege, Marty, and Mission Farms sites are located 1.0, 5.1, and 9.5 km, respectively, downstream from the Middle Basin WWTF effluent discharge. The State Line site is located 13 km downstream from the Middle Basin WWTF effluent discharge and 2.3-km downstream from the Tomahawk Creek WWTF effluent discharge (fig. 1, table 1). The Tomahawk Creek subbasin is the least developed area of the drainage basin; 83 percent of land use is classified as urban and 47 per-cent is classified as impervious surface. Land use at all other Indian Creek study sites is greater than 90 percent urban and generally similar among sites (fig. 1, table 1).
The KDHE has listed several Johnson County, Kans., streams as impaired waterways under section 303(d) of the 1972 Clean Water Act. Five contaminants are listed as impair-ing designated uses of Indian Creek (Kansas Department of Health and Environment, 2012). Total phosphorus and diazi-non, an organophosphate insecticide, are listed as impairments for aquatic life. Nitrate and chloride are listed as impairments for water supply. Fecal coliform bacteria is listed as an impair-ment for recreation.
Previous Investigations
Numerous sites in the Indian Creek Basin have been included in studies of water quality in Johnson County streams or large-scale assessments of water quality in the Kansas City metropolitan area (Lee and others, 2005; Wilkison and others, 2002, 2006, 2009; Poulton and others, 2007; Rasmussen and others, 2008, 2009b, 2012; Rasmussen and Gatotho, 2014). Continuous streamflow data have been collected at the Marty site since 1963 and at the State Line site since 2003. Continu-ous water-quality data have been collected at the State Line site since 2004. Current and previously collected streamflow
and discrete and continuous water-quality data are available online at http://waterdata.usgs.gov/nwis.
Studies in Johnson County indicate that streamflow at sites located downstream from wastewater effluent discharges is largely composed of wastewater effluent during base-flow conditions. During below-normal streamflows, wastewater effluent may represent more than 99 percent of total stream-flow (Wilkison and others, 2002; Lee and others, 2005). Dur-ing below-normal and normal streamflows, nutrient concen-trations are commonly an order of magnitude higher at sites located immediately downstream from WWTFs than at sites unaffected by wastewater effluent discharge. Concentrations of dissolved solids, pharmaceuticals, and organic wastewater-indicator compounds also are higher downstream from WWTFs. Because of the diluting effect of wastewater efflu-ent, sediment and bacteria concentrations typically are lower downstream from WWTFs (Lee and others, 2005; Wilkison and others, 2006, 2009; Rasmussen and others, 2008; Graham and others, 2010).
Discrete and continuous water-quality data collected during 2002–06 were used to develop regression models for computing continuous measurements of suspended sediment, dissolved solids, major ions, total nitrogen, total phosphorus, and indicator bacteria in the five largest drainage basins in Johnson County including Indian Creek (Rasmussen and oth-ers, 2008). Constituent concentrations and loads were com-puted for the State Line site during 2004–11. During that time, water temperature of Indian Creek was higher than the other sites about 50 percent of the time, particularly during winter months. Dissolved oxygen concentrations were less than the KDHE minimum criterion of 5 mg/L more frequently at the Indian Creek site than the other sites, about 15 percent of the time. Each winter during the study period, chloride concentra-tions in Indian Creek exceeded the U.S. Environmental Protec-tion Agency (EPA) recommended criterion of 230 mg/L for at least 10 consecutive days. Turbidity and suspended-sediment concentrations generally were lowest at the Indian Creek site because of wastewater contributions, but large sediment load-ing events occurred during stormwater runoff. Annual percent contribution of total nitrogen in Indian Creek from WWTFs ranged from 35 percent in 2010 to 93 percent in 2006. Annual percent contribution of total phosphorus in Indian Creek from WWTFs was at least 39 percent annually. Annual mean bacte-ria load and yield in Indian Creek was more than three times any other site. Less than 1 percent of the total downstream Indian Creek indicator bacteria load originated from WWTFs, except during 2006 when about 6 percent of the Indian Creek load originated from wastewater (Rasmussen and Gatotho, 2014).
During previous studies, results from habitat assess-ments indicated suboptimal overall conditions at the upstream Indian Creek sites, which was similar to conditions at other sites in the Johnson County. The downstream State Line site had among the poorest stream habitat conditions in Johnson County. Lower habitat scores at the State Line site relative to other sites in the Indian Creek Basin were associated with

6 Effects of Wastewater Effluent Discharge on Indian Creek, Johnson County, Kansas
increased channel disturbance and alteration, diminished and altered riparian areas, including loss of riparian vegetation, and diminished in-stream habitat for aquatic organisms (Ras-mussen and others, 2009b, 2012). Not only was the down-stream site affected by the large percentage of upstream urban land use and discharge from two WWTFs, it also may have been more susceptible to localized effects of several major roadways.
Algal periphyton biomass and community composition were assessed in three synoptic studies of Johnson County streams in March 2007, July 2007, and April 2010. Three Indian Creek sites, two of which are included in the current study (College and State Line), and the Tomahawk Creek site (fig. 1, table 1) were sampled as part of the 2007 and 2010 synoptic studies (Rasmussen and others, 2009b, 2012). In general, diatoms dominated (greater than 95 percent of abun-dance and biovolume) the periphytic algal community at these sites, though cyanobacteria and green algae also were occa-sionally present. Chlorophyll, a surrogate for algal biomass, at the State Line and Tomahawk sites occasionally exceeded 100 milligrams per square meter (mg/m2), but did not exceed the numeric endpoint of 150 mg/m2 that KDHE uses as a total maximum daily load (TMDL) endpoint (Kansas Department of Health and Environment, 2010).
Macroinvertebrate bioassessments of Johnson County streams included the same Indian and Tomahawk Creek sites as algal periphyton. Data collected in 2003, 2004, 2007, and 2010 indicated that the Indian and Tomahawk Creek sites were
consistently nonsupporting of aquatic life according to KDHE criteria that use a combination of macroinvertebrate metrics to evaluate status (Rasmussen at others, 2012). Environmen-tal variables that were negatively correlated with biological quality of streams included specific conductance of water, polycyclic aromatic hydrocarbon concentrations in stream-bed sediment, nutrient concentrations in water, percentage of impervious surface, wastewater discharges, and density of stormwater outfalls adjacent to streams (Rasmussen and oth-ers, 2009b, 2012).
During 2008 through 2010, the USGS, in cooperation with Johnson County Wastewater, conducted a study to assess the effects of the Blue River Main WWTF effluent discharge and treatment facility upgrades on the environmental and bio-logical conditions of the upper Blue River using data collected during January 2003 through March 2009. Upgrades to the Blue River Main WWTF improved wastewater effluent qual-ity, but wastewater effluent discharge still had negative effects on water quality and biological conditions at downstream sites. Wastewater effluent discharge into the upper Blue River likely contributed to changes in ecosystem structure (stream-flow, water chemistry, algal biomass, algal periphyton, and macroinvertebrate community composition) and function (pri-mary production) along the upstream-downstream gradient. Because the Blue River Main WWTF is located in a rapidly urbanizing area, urbanization effects also may play a role in the decline in environmental and biological conditions along the upstream-downstream gradient. Despite these differences
Table 1. Location and description of Indian Creek Basin study sites in Johnson County, Kansas, including drainage area, land cover, and distance from the Middle Basin and Tomahawk Creek Wastewater Treatment Facility effluent discharges.
[km2, square kilometers; km, kilometers; C, creek; KS, Kansas; Blvd, boulevard; Co, county; Pkwy, parkway; nr, near; --, not applicable; Rd, road]
Site identifier
(fig. 1)
Site descriptionDistance from Middle Basin Wastewater
Treatment Facility
discharge (km)
Distance from Tomahawk
Creek Wastewater
Treatment Facility
discharge (km)
Approximate upstream land use
(percent)
Site nameU.S. Geological Survey station
number
Drainage area (km2)
Urban1 Impervious surface2
119th Indian C at 119th Street, Overland Park, KS
385446094430700 36.9 2.4 above 13 above 91 52
College Indian C at College Blvd, Johnson Co, KS
385520094420000 40.9 1.0 below 10 above 94 52
Marty Indian C at Overland Park, KS 06893300 68.9 5.1 below 5.8 above 95 54Mission Farms Indian C at Indian C Pkwy, KS 385608094380300 94.8 9.5 below 1.4 above 96 53Tomahawk Tomahawk C nr Overland Park,
KS 06893350 61.9 -- 2.7 above 83 47
State Line Indian C at State Line Rd, Leawood, KS
06893390 166 13 below 2.3 below 90 49
1Urban land use was derived from the 2006 30-meter resolution National Land Cover Dataset (NLCD; Fry and others, 2011).2Impervious surface was derived from 2.5-meter resolution Mid-America Regional Council (MARC) 2012 land cover data (NRI 2.0) (Mid-America Regional
Council, 2013).

Methods 7
in environmental and biological conditions, functional stream health was not impaired downstream from the WWTF during most times of the year, indicating the declines in environmen-tal and biological conditions along the upstream-downstream gradient were not substantial enough to cause persistent changes in ecosystem function (Graham and others, 2010).
MethodsEnvironmental and biological conditions were assessed
at six sites in the Indian Creek Basin; five sites were located on Indian Creek and one was located on Tomahawk Creek, the largest tributary to Indian Creek. Study sites were located upstream (119th, Tomahawk) from the WWTFs, downstream from the Middle Basin WWTF but upstream from the Toma-hawk Creek WWTF (College, Marty, and Mission Farms), and downstream from the Middle Basin and Tomahawk Creek WWTFs (State Line; fig. 1). Data collected by the USGS during June 2004 through June 2013 were used to evaluate the environmental and biological conditions upstream and downstream from the wastewater effluent discharges to Indian Creek.
Data Collection
Middle Basin and Tomahawk Creek Wastewater Treatment Facility Effluent Data
The Middle Basin and Tomahawk Creek WWTFs keep a daily record of wastewater effluent discharge volume. In addition, wastewater effluent is monitored for several water-quality variables, including nutrients, once per week. All wastewater effluent samples are analyzed by the Johnson County Wastewater Water-Quality Laboratory, Olathe, Kans. Daily wastewater effluent volume and weekly water-quality data were obtained from Johnson County Wastewater for the period January 2004 through December 2013. These data were used to describe annual mean wastewater effluent discharge volume, TN and TP concentrations in wastewater effluent, and TN and TP loads contributed by the WWTFs. The period 2004 through 2013 was selected for analysis because it allowed an evaluation of changes in wastewater effluent discharge vol-ume, nutrient concentrations, and nutrient loads after capacity and biological nutrient removal upgrades were completed at the Middle Basin WWTF and CEPT was added to the treat-ment process at the Tomahawk WWTF; in addition, continu-ous water-quality monitoring at the State Line site began in 2004.
Previously Collected Data
Streamflow data from the Marty site (fig. 1), continu-ously measured since 1963, were used to compare streamflow
conditions during the June 2004 through June 2013 study period to historical streamflow conditions in Indian Creek. A streamflow gage has been operating at the State Line (fig. 1) site since April 2003; a continuous water-quality monitor has been operating at the State Line site since February 2004. Dis-crete water-quality data have been routinely collected from the State Line site since April 2003. These data facilitated com-parison of water-quality conditions in Indian Creek before and after upgrades to the Middle Basin WWTF and the addition of CEPT at the Tomahawk WWTF. For parity, Indian Creek data collected before 2003 were not used in this report. Previously collected samples were analyzed for a variety of water-quality constituents; analyses were most commonly conducted by the USGS National Water Quality Laboratory (NWQL), Lakewood, Colorado, and the Johnson County Environmen-tal Laboratory (now called the Johnson County Wastewater Water-Quality Laboratory) (Lee and others, 2005; Rasmus-sen and others, 2008, 2009b, 2012; Rasmussen and Gatotho, 2014). Samples were collected by several methods, including equal-width-increment (EWI) methods, grab samples, and autosampler-collected samples (Stone and Graham, 2014). Streamflow and water-chemistry data were downloaded from the USGS National Water Information System Web site at http://waterdata.usgs.gov/nwis.
Discrete Water-Quality SamplesStream-water samples were collected from all six sites
over a range of streamflow conditions during June 2011 through June 2013 (Stone and Graham, 2014). In addition, water samples were collected concurrent with biological samples during August 20–21, 2012 and April 2, 2013. Water samples were collected following USGS EWI methods, unless precluded by extreme low-flow conditions (U.S. Geological Survey, 2006). Single vertical or grab samples were col-lected from the centroid of flow during extreme low flow (U.S. Geological Survey, 2006). Additional details on discrete water-quality sample collection are provided in Stone and Gra-ham (2014). All water samples were analyzed for suspended sediment, dissolved solids, major ions, nutrients (nitrogen and phosphorus species), organic carbon, biochemical and chemical oxygen demand (BOD and COD, respectively), and indicator bacteria. Samples collected on April 2, 2013, also were analyzed for organic wastewater-effluent compounds.
Suspended-sediment concentration was analyzed at the USGS Iowa Sediment Laboratory, Iowa City, Iowa, accord-ing to methods described in Guy (1969). Dissolved solids, major ions, nutrients, BOD, COD, and indicator bacteria were analyzed by the Johnson County Wastewater Water-Quality Laboratory according to Standard Methods (American Public Health Association and others, 2005). Total and dissolved organic carbon (TOC and DOC, respectively) were analyzed by the NWQL according to Standard Methods (American Public Health Association and others, 2005) and methods presented in Brenton and Arnett (1993). Select replicate samples and samples collected during evenings and weekends
8 Effects of Wastewater Effluent Discharge on Indian Creek, Johnson County, Kansas
were sent to the NWQL and analyzed according to methods presented in Fishman and Friedman (1989).
Organic wastewater-indicator compounds were analyzed at the NWQL using methods described by Zaugg and others (2006). These methods are sensitive to sub-microgram per liter (µg/L) levels. Reported values may be denoted as estimated (E) for some constituents when values are reported outside of instrument calibration range, performance of the analyte does not meet acceptable method-specific criteria, or there were matrix interferences. Values reported with the E qualifier are considered firm detections, although the precision of the value is frequently less than for values without this qualifier (Chil-dress and others, 1999).
Continuous Water-Quality Monitoring
Continuous streamflow and water-quality data were col-lected from all six sites (fig. 1). Streamflow gages have been operating at the Marty site since March 1963 and the State Line site since April 2003. Streamflow gages were installed at the 119th, College, and Mission Farms sites in June 2011 and the Tomahawk site in July 2011. Streamflow was measured using standard USGS methods (Sauer and Turnipseed, 2010; Turnipseed and Sauer, 2010). A continuous water-quality monitor has been operating at the State Line site since Febru-ary 2004; monitors were installed at the other five sites in May 2011. The continuously monitored sites were equipped with YSI 6600EDS water-quality monitors that measured specific conductance, pH, water temperature, turbidity (YSI 6136 optical turbidity sensor), and dissolved oxygen (YSI optical dissolved oxygen sensor). In March 2012, nitrate monitors (HACH® Nitratax plus sc) also were installed at all sites. The nitrate sensor does not differentiate between nitrate and nitrite; therefore, all reported concentrations include nitrate plus nitrite (Pellerin and others, 2013). For simplicity, nitrate is used throughout the report to refer to the sensor and associated data. To facilitate comparison of sensor- and laboratory-mea-sured nitrate concentrations, grab samples were collected near the nitrate monitors on a weekly basis during May 4 through September 19, 2012, and analyzed for nitrate at the Johnson County Wastewater Water-Quality Laboratory.
Monitors were installed near the centroid of the stream cross-section to best represent conditions across the width of the stream and were maintained in accordance with standard USGS procedures (Wagner and others, 2006; Rasmussen and others, 2008; Pellerin and others, 2013). Continuous water-quality data were recorded at 15-minute intervals. Continuous streamflow and water-quality data are available on the USGS Web site at http://waterdata.usgs.gov/ks/nwis. Results are presented in this report for the State Line site for the period June 1, 2004 through June 30, 2013 and all other sites for the period July 1, 2011, through June 30, 2013; nitrate data are reported for the period April 1, 2012, through June 30, 2013.
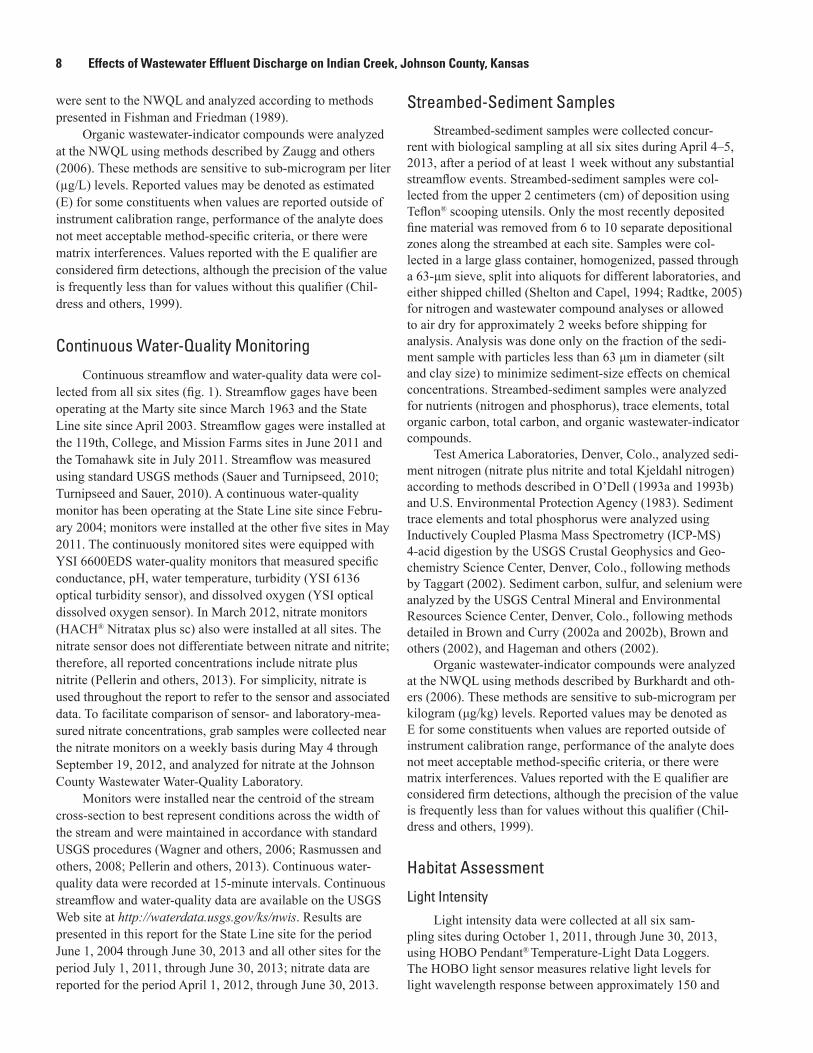
Streambed-Sediment Samples
Streambed-sediment samples were collected concur-rent with biological sampling at all six sites during April 4–5, 2013, after a period of at least 1 week without any substantial streamflow events. Streambed-sediment samples were col-lected from the upper 2 centimeters (cm) of deposition using Teflon® scooping utensils. Only the most recently deposited fine material was removed from 6 to 10 separate depositional zones along the streambed at each site. Samples were col-lected in a large glass container, homogenized, passed through a 63-μm sieve, split into aliquots for different laboratories, and either shipped chilled (Shelton and Capel, 1994; Radtke, 2005) for nitrogen and wastewater compound analyses or allowed to air dry for approximately 2 weeks before shipping for analysis. Analysis was done only on the fraction of the sedi-ment sample with particles less than 63 μm in diameter (silt and clay size) to minimize sediment-size effects on chemical concentrations. Streambed-sediment samples were analyzed for nutrients (nitrogen and phosphorus), trace elements, total organic carbon, total carbon, and organic wastewater-indicator compounds.
Test America Laboratories, Denver, Colo., analyzed sedi-ment nitrogen (nitrate plus nitrite and total Kjeldahl nitrogen) according to methods described in O’Dell (1993a and 1993b) and U.S. Environmental Protection Agency (1983). Sediment trace elements and total phosphorus were analyzed using Inductively Coupled Plasma Mass Spectrometry (ICP-MS) 4-acid digestion by the USGS Crustal Geophysics and Geo-chemistry Science Center, Denver, Colo., following methods by Taggart (2002). Sediment carbon, sulfur, and selenium were analyzed by the USGS Central Mineral and Environmental Resources Science Center, Denver, Colo., following methods detailed in Brown and Curry (2002a and 2002b), Brown and others (2002), and Hageman and others (2002).
Organic wastewater-indicator compounds were analyzed at the NWQL using methods described by Burkhardt and oth-ers (2006). These methods are sensitive to sub-microgram per kilogram (μg/kg) levels. Reported values may be denoted as E for some constituents when values are reported outside of instrument calibration range, performance of the analyte does not meet acceptable method-specific criteria, or there were matrix interferences. Values reported with the E qualifier are considered firm detections, although the precision of the value is frequently less than for values without this qualifier (Chil-dress and others, 1999).
Habitat Assessment
Light Intensity
Light intensity data were collected at all six sam-pling sites during October 1, 2011, through June 30, 2013, using HOBO Pendant® Temperature-Light Data Loggers. The HOBO light sensor measures relative light levels for light wavelength response between approximately 150 and

Methods 9
1,200 nanometers (nm), a much broader spectrum of light wavelengths than are visible to the human eye (approxi-mately 390 to 700 nm; Wetzel, 2001). Five data loggers were deployed at each site: one on the streamgage house, one adjacent to the YSI 6600EDS water-quality monitor, and three in the stream near the water-quality monitor at approximately the left bank, centroid of flow, and right bank. Light data were recorded every 5 minutes. The data loggers were cleaned every 1 to 2 weeks depending on stream conditions, and data were downloaded approximately monthly. Data from the three in-stream sensors were averaged to summarize light conditions at each site.
Physical-Habitat CharacteristicsPhysical-habitat characteristics were evaluated at all six
sampling sites during July 2012 using methods described in Rasmussen and others (2009b). A total of 17 habitat variables in three categories (channel conditions and characteristics, bank and riparian conditions, and aquatic habitat availability) were evaluated. Data collection was completed using a combi-nation of field measurements and surveys, and available aerial photography and topographic maps.
Each habitat variable was assigned a score on a scale of 1 to 12 (Rasmussen and others, 2009b); all habitat data were integrated into one total site score by summing each of the scores from individual variables. All scores were normalized to a scale of 0 to 100 by dividing each score by the total pos-sible score and then multiplying by 100 to simplify compari-sons and graphic presentations. Four rating categories (based on those described by Rasmussen and others, 2009b) of rela-tive quality were used to evaluate habitat conditions at each site (score 80 to 100 is optimal, 55 to 79 is suboptimal, 30 to 54 is marginal, and less than 30 is poor). Normalized scores of individual habitat variables and normalized total habitat scores were used to describe among-site differences in habitat conditions.
Periphyton
Periphyton CommunitiesPeriphyton community samples were collected from all
six sites during August 21–22, 2012 (summer) and April 3–5, 2013 (spring), after a period of at least 1 week without sub-stantial streamflow events. Cobble substrate in riffles and runs was sampled for periphyton at each site because the stream-bed along the study reach was dominated by coarse-grained substrates (gravel and cobbles). This single habitat sampling approach for periphyton helps to minimize variability among sites because of habitat differences (Stevenson and Bahls, 1999; Moulton and others, 2002). Duplicate or triplicate samples were collected at each site to more accurately com-pare differences among sites while accounting for within-site variability.
Periphyton samples were collected using the methods described in Rasmussen and others (2012). Samples were
a composite of 12 cobbles collected from 3 adjacent riffles. Periphyton was scraped from a known area on each cobble and composited into a single sample. Samples were analyzed for chlorophyll and taxonomic identification and enumeration of algae. Chlorophyll samples were processed as described in Hambrook-Berkman and Canova (2007). Samples for taxo-nomic identification and enumeration were preserved with a 9:1 Lugol’s iodine:acetic acid solution.
Chlorophyll was analyzed at the USGS Kansas Water Science Center. Chlorophyll (uncorrected for degradation products) was analyzed fluorometrically using a modification of EPA Method 445.0 (Arar and Collins, 1997); instead of acetone extraction, samples were extracted in heated ethanol (Knowlton, 1984; Sartory and Grobbelar, 1986). Samples were analyzed in duplicate and the results reported as an average of the two. BSA Environmental Services, Inc., Beachwood, Ohio, analyzed periphyton samples for taxonomic identifica-tion, enumeration, and biovolume of diatoms and soft algae as described in Rasmussen and others (2012).
Periphyton Biomass
Periphyton biomass may change rapidly because of changing environmental conditions, such as scouring dur-ing high-flow events, and repeated sampling is necessary to evaluate among-site differences. Periphyton samples were collected approximately weekly during August 30, 2011, through September 25, 2012, at all six sites and analyzed for chlorophyll, an indicator of algal biomass. Periphyton samples for chlorophyll analysis were a composite of three cobbles col-lected from one riffle. Cobbles were placed in a plastic bucket with enough streamwater to ensure all cobbles were covered and transported to the laboratory for more convenient sample processing. All samples were processed within 4 hours of col-lection. Cobbles were processed as described in Rasmussen and others (2012) and chlorophyll was analyzed in the same manner as described for periphyton communities.
MacroinvertebratesMacroinvertebrates were collected from all six sites
during August 21–23, 2012 (summer) and April 2–4, 2013 (spring) after a period of at least 1 week without substantial streamflow events. Duplicate or triplicate samples were col-lected at each site to more accurately compare differences among sites while accounting for within-site variability. Mac-roinvertebrate samples were collected following semiquan-titative KDHE protocols (Kansas Department of Health and Environment, 2000) as described in previous reports (Poulton and others, 2007; Rasmussen and others, 2009b; Graham and others, 2010; Rasmussen and others, 2012). Two independent 100-organism samples were collected from multiple habitat types and counted onsite by two scientists simultaneously for about 1 hour and later pooled into one 200-organism sample. Samples were preserved in 80-percent ethanol and shipped to the USGS NWQL for taxonomic identification and

10 Effects of Wastewater Effluent Discharge on Indian Creek, Johnson County, Kansas
enumeration following methods described by Moulton and others (2000).
Data Analysis
Stream-Water Chemistry Data
Water-quality conditions at the State Line site before (June 1, 2004, through May 31, 2008), during (June 1, 2008, through May 31, 2010) and after (June 1, 2010, through June 30, 2013) the Middle Basin WWTF upgrade and at all six sites along the upstream-downstream gradient were compared with respect to below-normal, normal, and above-normal streamflows. Streamflow conditions were classified using the percentile classes defined on the USGS WaterWatch Web site (U.S. Geological Survey, 2014); below-normal stream-flows are less than the 25th percentile (exceeded 75 percent of the time), normal streamflows are between the 25th and 75th percentiles (exceeded 25 to 75 percent of the time), and above-normal streamflows are greater than the 75th percentile (exceeded 25 percent of the time).
Ordinary least squares analysis (Helsel and Hirsch, 2002) was used to develop regression models between sensor- and laboratory-measured nitrate concentrations for all sites using all available data. In general, the nitrate sensor tended to overestimate nitrate concentrations by about 7 percent rela-tive to laboratory-measured concentrations, but there were strong linear relations [all adjusted coefficient of determina-tion (R2) greater than or equal to 0.95] between sensor- and laboratory-measured nitrate at all sites (fig. 2, appendix 1).
The regression relations for each individual site were used to adjust sensor-measured nitrate concentrations to more closely reflect laboratory-measured nitrate concentrations before data analysis and interpretation.
Duration curves were used to compare streamflow and water-quality conditions for continuously measured variables at the State Line site during the before-upgrade, transitional, and after-upgrade periods during June 2004 through June 2013 and among sites along the upstream-downstream gradi-ent during July 2011 through June 2013. Duration curves are cumulative distribution functions and were constructed using 15-minute values to evaluate and compare frequency and magnitude characteristics (Rasmussen and Ziegler, 2003; Ras-mussen and others, 2005). The curves indicate the percentage of time that specified conditions were equaled or exceeded, or the frequency of exceedance (Maidment, 1993). Although several similar formulas exist for calculating plotting position, the Weibull formula (Helsel and Hirsch, 2002) was used in this study. Streamflow, water-quality condition duration curves, and periods of exceedance for water-quality criteria for all six sites are available for the period of record on the USGS Web site at http://nrtwq.usgs.gov/ks/.
Annual mean nutrient concentrations and loads from the Middle Basin and Tomahawk Creek WWTFs were calculated from weekly water-quality and wastewater effluent discharge volume data provided by Johnson County Wastewater for 2004 through 2013. There were occasional peak wet-weather flow events at the WWTFs during the study period. These peak flow events were not included in load calculations from the WWTFs because data on nutrient concentrations were
Figure 2. Comparison between sensor-measured and laboratory-measured nitrate plus nitrite concentrations at the Indian Creek study sites.
0
2
4
6
8
10
12
14
Labo
rato
ry-m
easu
red
nitra
te p
lus
nitri
te, i
n m
illig
ram
s pe
r lite
r as
nitro
gen
Sensor-measured nitrate plus nitrite, in milligrams per liter as nitrogen
0 2 4 6 8 10 12 14
1:1 relation
EXPLANATION119th
College
Marty
Mission Farms
Tomahawk
State Line

Methods 11
not available; therefore, total annual nutrient loads from the WWTFs likely are underestimates.
Relative differences in Indian Creek water-quality conditions among sites, streamflow conditions, and the before-upgrade, transitional, and after-upgrade periods at the Middle Basin WWTF were described using relative percent-age difference (RPD). The RPD was calculated by dividing the difference between two values by the mean and multiplying that value by 100 (Zar, 1999). The RPD approach was used in these instances because of the emphasis on relative differences in conditions among time periods, sites, and streamflows. Decreases in wastewater effluent nutrient concentrations after changes in wastewater treatment practices and increases and decreases in nutrient concentrations along the upstream-down-stream gradient in Indian Creek were described using percent-age change. Percentage change was calculated by dividing the difference between two values by one of the values and mul-tiplying that value by 100 (Zar, 1999). The percentage change approach was used in these instances to quantify how much nutrient concentrations in effluent decreased after wastewater treatment processes were improved and increased in Indian Creek downstream from wastewater effluent discharges.
Regression models were developed for all six Indian Creek study sites to establish relations between continuously measured water-quality parameters and discretely collected water-quality constituents in Stone and Graham (2014). Nutri-ent models differed among sites, and explanatory variables included turbidity, streamflow, and a seasonal variable. A combination of total, particulate, and dissolved nutrient mod-els were used to calculate 15-minute concentrations of TN and TP for the period July 1, 2011, through June 30, 2013. Model development and selection criteria are discussed in detail in Stone and Graham (2014). Total nitrogen models were used to calculate TN concentrations for the 119th, Tomahawk, and State Line (after upgrade) sites, and TP models were used to calculate TP for 119th and Tomahawk sites. Total nutrient concentrations at all other sites were calculated by adding the computed values for particulate and dissolved forms rather than using the TN and TP models directly because the sepa-rate models generally explained more variability than the total nutrient models (appendix 2). Continuous loads were calculated using 15-minute concentration (in milligrams per liter), 15-minute streamflow (in cubic feet per second), and a unit conversion factor as described in Rasmussen and others (2009a). Monthly and total loads were calculated by summing 15-minute calculations. Nutrient loads derived from urban sources other than WWTFs at the downstream sites were cal-culated as the difference between total load and load derived from upstream WWTFs.
Data exceeding 20 percent of the maximum measured value in discrete samples were truncated to avoid calculat-ing concentrations outside the range used to develop nutrient models. Nutrient concentrations were interpolated between the data points on either side of the truncated gap by linear regres-sion to avoid missing data. Less than 0.05 percent of all data at each site were interpolated.
Turbidity was an explanatory variable in some nutrient models, and computed concentrations and loads of nutrients at some sites were affected by missing turbidity data. Stream-flow-based models were developed and used to calculate nutrient concentrations when turbidity data were missing to minimize the effect on concentration and load estimates. Total nitrogen calculations at the College, Mission Farms, and State Line sites and total phosphorus calculations at all six sites occasionally used streamflow-based models in place of the best-available model because of missing turbidity data (appendix 2). No more than 5 percent of nutrient concentra-tions were calculated using streamflow-based models in place of turbidity-based models, depending on the site and the constituent.
Periphyton Data
A total of 277 periphyton community metrics were calcu-lated using the Algal Data Analysis System v. 2.5.2 (ADAS) developed for the USGS National Water-Quality Assessment (NAWQA) Program (Cuffney, 2003). During analysis with ADAS, rare taxa were not deleted and lowest taxonomic levels were used. Abundance was selected for these calculations rather than biovolume because abundance is used in the calcu-lation of most published bioassessment metrics for periphyton and interpretation of biovolume results can be ambiguous (Stevenson and Bahls, 1999). The ADAS program uses a common logarithm (log10) base to calculate the Shannon Diversity Index; however, previous studies in Johnson County used a natural logarithm base (ln) for Shannon Diversity Index calculation. The ADAS calculated Shannon Diversity Index values were converted to a natural logarithm base by multiplying by 2.3026 to allow direct comparison among studies (Brower and others, 1990). A subset of 24 metrics in five categories (oxygen tolerance, saprobity, trophic condition, nitrogen-uptake metabolism, and other indices) was selected for additional analyses to determine among-site differences. All metrics, with the exception of the Shannon Diversity Index, used only diatom data. These metrics were chosen to minimize redundancy and represent water-quality variables of particular interest. Some metrics, such as TN, TP, specific con-ductance, and chloride tolerances, were excluded because less than 50 percent of all taxa present, and less than 30 percent of dominant taxa, had autecological classifications in ADAS with respect to these variables. Utility of these metrics is limited because of the small amount of autecological data available relative to other metrics calculated by ADAS. Statistical dif-ferences in periphyton chlorophyll, abundance, biovolume, and community metrics among sites were tested using analysis of variance (ANOVA), least-squares means, and simultaneous confidence intervals (Sokal and Rohlf, 1995) as described in Graham and others (2010). The August 2012 and April 2013 sampling periods were analyzed independently. Significance for these analyses was set at a probability value ( p-value) of less than 0.05.

12 Effects of Wastewater Effluent Discharge on Indian Creek, Johnson County, Kansas
Weekly collected periphyton chlorophyll concentrations were related to average water-quality conditions during the 7 days before sample collection using available continuous streamflow and water-quality data. Nonparametric Spearman rank-correlation analysis was used to test for monotonic rela-tions between chlorophyll concentrations and environmental variables. Spearman rank-correlation coefficients (rho values) were considered significant when p-values were less than 0.01.
Macroinvertebrate Data
A total of 194 macroinvertebrate community metrics were calculated using the Invertebrate Data Analysis System v. 5.0.28 (IDAS) developed for NAWQA (Cuffney, 2003). During analysis with IDAS, rare taxa were not deleted, lowest taxonomic levels were used, and taxonomic ambiguities were resolved by retaining ambiguous taxa. Shannon Diversity Index values were converted as described for periphyton. Five metrics not included in the IDAS program (Macroinvertebrate Biotic Index, Kansas Biotic Index, Percentage of Intoler-ant Organisms, Clinger Richness, and Percentage of Cling-ers) also were calculated as described in Barbour and others (1999) and Poulton and others (2007). A subset of 34 metrics was selected for additional analyses to determine among-site differences. Selected metrics included the 4 KDHE aquatic life support status metrics (Kansas Department of Health and Environment, 2008), 7 metrics that were used for multimetric site scoring in Poulton and others (2007) and Rasmussen and others (2009b), and an additional 23 metrics selected from the EPA Rapid Bioassessment Protocols (RBP; Barbour and oth-ers, 1999). These metrics represent core metrics used in many State evaluation programs, those known to be sensitive and reliable for measuring degradation of stream assemblages, and those that allow determination of stream impairment status and comparisons with data from previous Johnson County studies. The four KDHE aquatic life support metrics (Macroinverte-brate Biotic Index, Davenport and Kelly, 1983; Kansas Biotic Index, Huggins and Moffet, 1988; Ephemeroptera, Plecoptera, and Trichoptera (EPT) taxa richness; and relative abundance of EPT taxa) were used to calculate multimetric aquatic life support scores for each site (Kansas Department of Health and Environment, 2008; Graham and others, 2010). Statistical dif-ferences in macroinvertebrate community composition among sites were determined as described for periphyton.
Stream Metabolism Data
Stream metabolism was determined using the whole stream metabolism program developed for the USGS NAWQA Nutrient Enrichment Effects Team (NEET; Bales and Nardi, 2007). The calculations and assumptions in the stream metabo-lism program are described in detail in Bales and Nardi (2007) and are based on standard approaches (Odum, 1956; Mar-zolf and others, 1994; Mulholland and others, 2001). Stream metabolism was calculated as described in Graham and others
(2010) using the one-monitor method, modified to simulate a two-monitor method by entering the continuous data from each site into the program twice, with the second entry offset by 15 minutes (Bales and Nardi, 2007; Graham and others, 2010).
Daily estimates of gross primary production (GPP), com-munity respiration (CR), net ecosystem production (NEP), and the production to respiration ratio (P/R) were calculated for the period July 1, 2011, through June 30, 2013, for each site. Because stream metabolism variables should only be calculated during stable flow conditions, 24-hour periods with flow that varied by more than 25 ft3/s were excluded from the analysis. Mean daily discharge and 15-minute dissolved oxy-gen, specific conductance, and water temperature data were used in stream metabolism calculations. Estimates of several physical variables required by the program, including velocity, wetted width, depth, reach length, channel slope, and a reaera-tion coefficient, were determined as described in Graham and others (2010). Conditions for each of these variables during the study period are presented in appendix 3.
Among-site differences in stream metabolism variables were determined for the entire study period (July 2011 through June 2013) and seasonally. Seasons were defined as spring (April through June), summer (July through September), fall (October through December), and winter (January through March) and were combined across all years. Spearman rank-correlation analysis was used to determine monotonic rela-tions between GPP, CR, and daily mean values of available continuous streamflow and water-quality data as described for periphyton data.
Quality Assurance and Quality Control
Stream-Water Chemistry Data
Quality-assurance and quality-control data for discrete and continuously measured water chemistry data are described in detail in Stone and Graham (2014). Discrete quality-assurance and quality-control samples were collected within a range of streamflow conditions during July 2011 through June 2013. Replicate samples were analyzed for suspended sediment, dissolved solids, major ions, nutrients, organic carbon, BOD, COD, and indicator bacteria; between 18 and 43 replicate samples were collected depending on the con-stituent (median=20). Two concurrent replicate samples were analyzed for organic wastewater-indicator compounds. RPD was used to evaluate differences in analyte concentrations detected in replicate water samples. The RPD was calculated by dividing the difference between replicate pairs by the mean and multiplying that value by 100, creating a value that represents the percent difference between replicate samples (Zar, 1999). Median RPDs between replicate pairs were within acceptable limits for inorganic, organic, nutrient, and bacterial constituents. For organic wastewater-indicator compounds, the median RPD between replicate pairs was less than 20 percent

Environmental Conditions in Indian Creek 13
for all constituents except N, N-Diethyl-m-toluamide (DEET, median=66 percent).
Comparison with cross-section measurements provided verification that bias in continuous data because of monitor location within the stream cross-section was minimal. Con-tinuous data during the study period generally required correc-tions of less than 10 percent, which classifies the data-quality rating as good according to established guidelines (Wagner and others, 2006). During July 2011 through June 2013, 0 per-cent of the streamflow records; 5 percent or less of the specific conductance, pH, water temperature, dissolved oxygen, and turbidity records; and 10 percent or less of the nitrate records were missing or deleted at each site because of equipment malfunction or excessive sensor fouling.
Streambed-Sediment Chemistry Data
Two concurrent replicate streambed-sediment samples from the College and Tomahawk sites were analyzed for nutrients, trace elements, carbon, and organic wastewater-indicator compounds. The RPD values for phosphorus, carbon, and most trace elements generally were less than or equal to 25 percent. At the College site, organic carbon, bismuth, molybdenum, and silver had RPDs of 26, 35, 45, and 38 per-cent, respectively. The RPD values for ammonia plus organic nitrogen and nitrate were high (between 40 and 78 percent) at both sites. The RPDs for nitrate likely were high because most values were above the laboratory reporting level but still left censored; high RPDs for ammonia plus organic nitrogen may have been due to spatial heterogeneity in the streambed, or variability in sample collection or laboratory analyses. Most organic wastewater-indicator compound data were below either the laboratory reporting level or reported as estimated concentrations. Where concentrations were measured or estimated, the RPD ranged from 0 to 37 percent for both sites (median=5.1). Poor replication and large RPD values are likely because of the low detection levels for these compounds and matrix interference conditions.
Periphyton Data
Concurrent replicate samples for periphyton community and chlorophyll analyses were collected in duplicate or trip-licate during August 2012 and April 2013. Triplicate samples were collected at the College and Tomahawk sites; duplicate samples were collected at all other sites. The coefficient of variation (CV) was used to evaluate differences in periphyton community metrics and chlorophyll concentrations because more than two samples can be included in the calculations. The CV was calculated by dividing the standard deviation by the mean and multiplying that value by 100, creating a value that represents the percent variation between replicate samples (Zar, 1999). Chlorophyll and algal abundance had smaller CVs (medians=20 and 25 percent, respectively; both n=12) than biovolume (median=38 percent; n=12). The CVs
for the 24 individual periphyton community metrics ranged from 0 to 173 percent (median=28 percent; n=288); 63 percent of metric comparisons had CVs less than 40 percent. Metric comparisons with CVs greater than 75 percent (20 percent of metric comparisons) were caused by rare taxa (comprising less than 10 percent of the overall periphyton community) pres-ent in some of the replicate samples but not others. Metrics affected by rare taxa included autotrophs of low and high tolerance, very low and nearly 100 percent oxygen saturation, and oligosaprobic and polysaprobic taxa. Large CV values in metrics not affected by rare taxa were likely caused by natural variation of the periphyton community at each site (Stevenson, 1997). Large variance in some metrics because of the natural spatial variation in periphyton communities precludes statis-tical detection of small differences among sites (Morin and Cattaneo, 1992).
Macroinvertebrate Data
Concurrent replicate samples for macroinvertebrate community analyses were collected in duplicate or tripli-cate during August 2012 and April 2013. Triplicate samples were collected at the College and Tomahawk sites; duplicate samples were collected at all other sites. The CV was used to evaluate differences in macroinvertebrate community metrics as described for periphyton. The CVs for the 34 individual macroinvertebrate community metrics ranged from 0 to 173 percent (median=15 percent; n=408); however, 71 percent of metric comparisons had CVs less than 40 percent. Metric comparisons with CVs greater than 75 percent (5 percent of metric comparisons) were caused by rare taxa (comprising less than 10 percent of the overall community) present in some of the replicate samples but not others. Metrics affected by rare taxa included clinger richness, percent clingers, Trichoptera richness, percent Trichoptera, percent Ephemeroptera, percent Ephemeroptera and Plecoptera, percent Oligochaeta, percent Hydropsychidae Trichoptera, and percent Tanytarsini midges Additional sources of variability likely were differences in habitat among the three riffle-pool sampling locations at each site. Large variance in some metrics because of natural spatial variation in macroinvertebrate communities precludes statisti-cal detection of small differences among sites (Miller and others, 2008).
Environmental Conditions in Indian Creek
Evaluated environmental conditions included stream-flow, stream-water chemistry, streambed sediment chemistry, and habitat. Conditions were evaluated at two sites located upstream from WWTF effluent discharges (119th and Toma-hawk), three sites located downstream from the Middle Basin WWTF (College, Marty, and Mission Farms), and one site

14 Effects of Wastewater Effluent Discharge on Indian Creek, Johnson County, Kansas
located downstream from the Middle Basin and Tomahawk Creek WWTFs (State Line) (fig. 1, table 1). Data collected from the State Line site during June 2004 through June 2013 were used to evaluate environmental conditions during the before-upgrade, transitional, and after-upgrade periods at the Middle Basin WWTF and the addition of CEPT at the Toma-hawk Creek WWTF. Data collected from all six sites during June 2011 through June 2013 were used to evaluate environ-mental conditions upstream and downstream from the Middle Basin and Tomahawk Creek WWTFs.
Streamflow
The structure and function in stream ecosystems are largely affected by streamflow. Alterations to the natural streamflow regime may affect water quality, physical habitat, biological communities, and ecosystem function (Poff and others, 1997; Poff and Zimmerman, 2010; Carlisle and others, 2014). Wastewater effluent discharge may substantially alter natural streamflow regimes, especially during periods when streamflow is naturally low.
Duration curves, which graphically represent the relation between the magnitude and frequency of streamflow dur-ing a period of time, were computed for all six Indian Creek study sites from July 2011 through June 2013 (fig. 3). The drainage area of the upstream 119th site (36.9 km2) was about 40 percent smaller than the drainage area of the upstream Tomahawk site (61.9 km2) (fig. 1, table 1). Consistent with
a smaller drainage area, normal streamflows at the 119th site were about 3 times lower than at the Tomahawk site. By comparison, normal streamflows at the 119th and Tomahawk sites were about 10 and 4 times lower, respectively, than at sites located downstream from the Middle Basin and Toma-hawk Creek WWTFs regardless of differences in drainage area. Upstream sites transported between 52 and 43 percent (119th and Tomahawk, respectively) of their total streamflow during less than 1 percent of the study period, compared to an average of 32 percent of total streamflows at the downstream sites where streamflow is augmented by wastewater effluent discharge. Streamflows were generally similar at the College, Marty, and Mission Farms sites during below-normal and nor-mal streamflow conditions (fig. 3); below-normal streamflows (exceeded more than 75 percent of the time on fig. 3) were less than 13 to 14 ft3/s and normal streamflows were less than 22 to 29 ft3/s (exceeded 25 to 75 percent of the time on fig. 3). Dif-ferences among these sites were larger during above-normal streamflows, likely due to several ephemeral tributaries (fig. 1) downstream from the College site that do not contribute flow during below-normal and normal streamflows. Wastewater contributed between 24 and 100 percent to streamflows during below-normal and normal streamflow conditions at the down-stream Indian Creek study sites during July 2011 through June 2013. Wastewater contributions to streamflow were highest at the College site and decreased in the downstream direction. Over the range of streamflow conditions, wastewater contrib-uted, on average, about 84 percent of the flow at the College
Figure 3. Streamflow duration curves at the Indian Creek study sites during July 2011 through June 2013.
0
1
10
100
1,000
10,000
100,000
Stre
amflo
w, i
n cu
bic
feet
per
sec
ond
0 10 20 30 40 50 60 70 80 90 100
Streamflow at 25 percent,in foot per second
Streamflow at 50 percent,in foot per second
119th, 1.8 College, 16 Marty, 18 Mission Farms, 18 Tomahawk, 4.6 State line, 29
Streamflow at 75 percent,in foot per second
119th, 0.8College, 13 Marty, 14 Mission Farms, 14 Tomahawk, 2.4 State line, 22
119th, 4.3College, 22 Marty, 27 Mission Farms, 29Tomahawk, 12 State line, 53
Frequency of exceedance, in percent
Upstream sites
Downstream sites
Normal: 25 to 75 percentAbove normal:0 to 25 percent
Below normal:75 to 100 percent
EXPLANATION119th
College
Marty
Mission Farms
Tomahawk
State line

Environmental Conditions in Indian Creek 15
site, 76 percent at the Marty site, 73 percent at the Mission Farms site, and 52 percent at the State Line site.
Streamflows at the Marty site (fig. 1) were lowest during 2012, with annual mean streamflow about 1.1 times smaller than the period-of-record (March 1963 through December 2013) mean, and highest during 2010, with annual mean streamflow about 1.7 times greater than the period-of-record mean (table 2). Mean streamflow at the Marty site during 2010 was the highest on record. The State Line site had the lowest annual mean streamflow during 2012 and the highest during 2008 and 2010 during the period of record (table 2). Mean streamflow at the State Line site (99.1 ft3/s ) was about 2 times higher than at the Marty site (48.0 ft3/s ) during the study period (January 2004 through December 2013; table 2).
During 2004 through 2013, wastewater effluent contribu-tion to total annual streamflow volume at the Marty site below the Middle Basin WWTF ranged from 26 percent during wet years to 46 percent during dry years (table 2). Wastewater effluent contribution to total annual streamflow volume at the State Line site below the Middle Basin and Tomahawk Creek WWTFs ranged from 17 to 36 percent. Overall, wastewater effluent contributed about 34 percent to total streamflow vol-ume at the Marty site and 23 percent at the State Line site.
The contribution of wastewater effluent to streamflow at the Marty and State Line sites ranged from negligible (less than 1 percent) during large runoff events to nearly 100 per-cent during the lowest streamflows (fig. 4). On average, waste-water effluent contributed nearly 100 percent to total stream-flow during below-normal streamflows (25 percent of the time) during 2004 through 2013 at the Marty and State Line sites. More than 90 percent of total streamflow was contrib-uted by wastewater effluent about 38 percent and 19 percent of the time at the Marty and State Line sites, respectively.
Wastewater effluent contributions to streamflow did not change substantially before (January 2004 through May 2008) and after (June 2010 through 2013) capacity upgrades at the Middle Basin WWTF. At the Marty site, wastewater effluent contributions during normal streamflows ranged between 40 to nearly 100 percent during both periods; mean values decreased slightly from 84 percent before upgrades to 81 percent after (fig. 4A). At the State Line site, wastewater effluent contribu-tions during normal streamflows ranged between 28 to nearly 100 percent during both periods; mean values increased from 70 percent before upgrades to 78 percent after (fig. 4B). The increase in wastewater contribution at the State Line site likely was caused by increased wastewater effluent discharge from the Tomahawk Creek WWTF rather than capacity upgrades at the Middle Basin WWTF (table 2). Upgrades increased the permitted design capacity of the Middle Basin WWTF by about 20 percent (from 18.6 to 22.4 ft3/s); however, on average, effluent discharge post-upgrade was 16.9 ft3/s, an increase of about 11 percent relative to the pre-upgrade period (15.2 ft3/s). Continued increases in wastewater effluent dis-charge approaching permitted design capacity (22.4 ft3/s) will change the contribution of wastewater effluent to streamflow in Indian Creek.
Stream-Water Chemistry
Discrete and continuous water-quality data collected at the State Line site during June 2004 through June 2013 were used to evaluate stream-water chemistry during the before-upgrade (June 2004 through May 2008), transitional (June 2008 through May 2010), and after-upgrade (June 2010 through June 2013) periods at the Middle Basin WWTF. Stream-water chemistry upstream and downstream from the Middle Basin and Tomahawk Creek WWTFs was evaluated using discrete and continuous water-quality data from all six sites; discrete data were collected during June 2011 through June 2013 and continuous data were collected during July 2011 through June 2013. Discrete samples were analyzed for suspended solids and sediment, dissolved solids, major ions, organic carbon, BOD and COD, and indicator bacteria. Samples collected concurrent with periphyton and macroin-vertebrate samples during April 2013 also were analyzed for organic wastewater-effluent compounds. Continuous water-quality data included specific conductance, pH, water tem-perature, turbidity, dissolved oxygen, and nitrate (April 2012 through June 2013).
Specific Conductance, pH, Water Temperature, and Dissolved Oxygen
Specific conductance, pH, water temperature, and dissolved oxygen are described using the continuous data collected at the State Line site during June 2004 through June 2013 and at all six sites during July 2011 through June 2013. Specific conductance is an indirect measure of dissolved solids in water (Hem, 1992). Some dissolved solids, such as chlo-ride and some nutrients, may have elevated concentrations in wastewater effluent; therefore, wastewater effluent generally has larger specific conductance values than receiving stream water (Cheremisinoff, 1995). Median specific conductance values at the State Line site varied by less than 10 percent among the before-upgrade, transitional, and after-upgrade periods at the Middle Basin WWTF, even during below-normal streamflow conditions when wastewater represents the largest percentage of total flow (fig. 5A, table 3). Specific conductance was generally larger at sites located downstream from the WWTFs than at the upstream sites (fig. 6A). The difference between upstream and downstream sites occurred across the range of streamflow conditions, with median values at the downstream sites [College, Marty, Mission Farms, and State Line; 863–1,090 microsiemens per centimeter at 25 degrees Celsius (µS/cm)] about 10 to 20 percent larger than median values at the upstream sites (119th and Tomahawk; 782–948 µS/cm) (table 4); however, maximum specific con-ductance values at the upstream sites were equal to or larger than maximum values at the downstream sites (table 4). Road salt may substantially affect specific conductance in streams during winter months (Rasmussen and others, 2008). The larg-est specific conductance values at all Indian Creek study sites

16 Effects of Wastewater Effluent Discharge on Indian Creek, Johnson County, Kansas
Table 2. Streamflow statistics for the Marty and State Line sites on Indian Creek, flow statistics for the Middle Basin and Tomahawk Creek Wastewater Treatment Facilities, and the percent contribution of wastewater effluent to annual streamflow at the Marty and State Line sites during January 2004 through December 2013.
[Streamflow and flow statistics are based on mean daily values for each site; Indian Creek streamflow data are available on the U.S. Geological Survey National Water Information Web site (http://waterdata.usgs.gov/nwis); ft3/s, cubic feet per second; min, minimum; max, maximum; --, not applicable]
Time period
Indian Creek
Marty streamflow (ft3/s)
State Line streamflow (ft3/s)
Median Mean Min Max Median Mean Min Max2004 17.3 44.5 1.3 4,900 37.4 104 13.5 11,5972005 17.5 50.4 4.4 5,210 31.0 99.0 12.7 10,6462006 15.2 34.2 3.1 5,198 25.3 71.6 10.4 10,7972007 18.1 53.0 6.0 4,748 34.1 107 13.5 7,4102008 20.8 60.8 1.9 6,234 41.0 129 11.2 17,9142009 21.5 55.2 5.9 4,097 39.2 107 8.5 6,2302010 23.6 64.3 5.4 8,972 44.8 129 11.9 18,7102011 19.6 38.4 3.7 2,289 34.1 79.0 8.5 3,5262012 16.2 33.3 0.6 4,883 25.3 66.0 10.4 10,8412013 19.6 45.8 3.8 5,704 37.4 99.1 12.7 14,1222004 through 2013 18.5 48.0 0.6 8,972 34.1 99.1 8.5 18,710Period of record1,2 15.0 37.5 0.0 12,800 34.1 100 8.5 18,710
Time period
Wastewater Treatment Facilities
Middle Basin effluent flow
(ft3/s)
Percent contribution of
wastewater at Marty
Tomahawk Creek effluent flow
(ft3/s)
Percent contribution of wastewater at
State Line3
Median Mean Min Max
Contribution of wastewater
effluent to annual streamflow
Median Mean Min Max
Contribution of wastewater
effluent to annual streamflow
2004 15.4 15.2 10.4 20.0 34 6.9 7.2 0 13.6 222005 15.0 15.0 12.7 19.7 30 6.7 5.2 0 9.6 202006 15.0 14.7 9.4 17.6 43 6.1 5.3 0 8.0 282007 15.8 15.9 12.5 20.1 30 6.3 6.2 0 11.4 212008 15.5 15.6 8.2 27.9 26 6.5 5.8 0 21.5 172009 16.4 17.3 13.6 25.8 31 7.1 7.4 4.3 16.9 232010 17.2 18.7 10.8 37.6 29 8.2 8.3 4.7 19.2 212011 14.5 15.8 11.2 37.5 41 8.7 7.8 0 13.2 302012 14.1 15.5 11.3 39.4 46 8.8 8.6 0 13.8 362013 15.4 17.7 10.7 34.6 39 8.8 8.8 0 13.3 272004 through
201315.3 16.1 8.2 39.4 34 7.5 7.1 0 21.5 23
Period of record1,2
-- -- -- -- -- -- -- -- -- --
1Period of record for Marty based on daily mean with the exception of the max value, which is based on peak flow data.2Period of record for Marty March 7, 1963, through December 2013, period of record for State Line April 22, 2003, through December 2013.3Includes effluent from the Middle Basin and Tomahawk Creek Wastewater Treatment Facilities.

Environmental Conditions in Indian Creek 17
Figure 4. The percent contribution of wastewater effluent to streamflow during below-normal, normal, and above-normal streamflows at the Marty and State Line study sites on Indian Creek during the before-upgrade, transitional, and after-upgrade periods at the Middle Basin Wastewater Treatment Facility. A, Marty and B, State Line.
0
10
20
30
40
50
60
70
80
90
100
Cont
ribut
ion
of w
aste
wat
er e
fflue
nt to
stre
amflo
w, i
n pe
rcen
t
1 10 100 1,000 10,000
Streamflow, in cubic feet per second
Below normal(less than 25th percentile)
Below normal(less than 25th percentile)
Above normal(greater than 75th percentile)
Above normal(greater than 75th percentile)
Normal(25th–75th percentile)
Normal(25th–75th percentile)
0
10
20
30
40
50
60
70
80
90
100
A
B
EXPLANATIONStreamflow at Marty and effluent from MiddleBasin Wastewater Treatment Facility
Before capacity upgrade
After capacity upgrade
Transitional period
EXPLANATIONStreamflow at State line and effluent from both MiddleBasin and Tomahawk Wastewater Treatment Facilities
Before capacity upgrade
After capacity upgrade
Transitional period

18
Effects of Wastew
ater Effluent Discharge on Indian Creek, Johnson County, KansasTable 3. Summary statistics for water-quality constituents measured continuously at the State Line study site during the before-upgrade, transitional, and after-upgrade periods at the Middle Basin Wastewater Treatment Facility during below-normal, normal, and above-normal streamflow conditions, June 2004 through June 2013.
[Continuous real-time water-quality data are available on the U.S. Geological Survey National Real-Time Water-Quality Web site (http://nrtwq.usgs.gov/ks); n, number of measurements; min, minimum; max, maximum; med, median; µS/cm, microsiemens per centimeter at 25 degrees Celsius; °C, degrees Celsius; mg/L, milligrams per liter; FNU, formazin nephelometric units]
Water-quality property
Before upgrade Transitional After upgrade
n Min Max Mean Med n Min Max Mean Med n Min Max Mean Med
Below-normal streamflow conditions1
Specific conductance (µS/cm) 36,792 587 2,750 1,012 975 9,275 571 3,040 1,161 979 34,748 576 3,680 1,100 1,060
pH 37,030 6.9 9.1 7.6 7.6 9,275 7.2 9.2 7.8 7.8 34,748 7.0 9.6 7.7 7.6
Water temperature (°C) 37,035 0.20 33 18 18 9,275 0.20 33 16 19 34,748 0.30 35 17 17
Dissolved oxygen (mg/L) 34,773 0.90 20 7.8 7.6 9,275 0.50 20 8.9 10 34,748 0.50 26 8.2 8.2
Turbidity (FNU) 34,721 0.10 40 4.1 3.2 9,180 0.10 68 4.6 4.0 34,012 0.10 120 3.4 2.6
Normal streamflow conditions2
Specific conductance (µS/cm) 71,396 322 5,970 1,152 949 38,070 355 5,840 1,204 974 48,771 401 4,630 1,099 999
pH 68,504 6.9 9.0 7.7 7.7 38,070 7.1 8.9 7.8 7.7 48,924 7.0 9.7 7.7 7.6
Water temperature (°C) 71,839 0.00 33 15 15 38,070 0.10 32 15 15 48,771 0.10 32 16 17
Dissolved oxygen (mg/L) 64,171 1.5 21 8.5 8.3 37,943 1.5 18 8.7 8.5 48,770 0.90 27 8.3 8.1
Turbidity (FNU) 68,413 0.20 569 8.5 5.7 35,691 0.10 260 6.1 4.3 48,732 0.40 92 4.8 3.3
Above-normal streamflow conditions3
Specific conductance (µS/cm) 29,760 136 5,280 899 739 22,491 144 5,870 974 808 24,368 145 5,640 926 763
pH 28,672 6.9 8.5 7.7 7.7 22,491 7.2 8.8 7.8 7.7 24,424 7.1 9.1 7.7 7.7
Water temperature (°C) 30,507 0.70 30 15 16 22,491 0.90 30 15 15 24,368 1.1 32 16 17
Dissolved oxygen (mg/L) 27,718 2.4 15 8.4 7.9 21,808 0.70 18 8.7 8.5 24,368 2.1 20 8.9 8.4
Turbidity (FNU) 29,974 1.0 1,760 88 33 21,993 0.10 1,490 61 20 24,159 0.80 1,440 55 181Below-normal streamflow conditions were defined as streamflows less than the 25th percentile for the period June 1, 2004, through June 30, 2013. Below-normal streamflows were less than 24.0 cubic feet
per second.2Normal streamflow conditions were defined as streamflows between the 25th and 75th percentiles for the period June 1, 2004, through June 30, 2013. Normal streamflows were between 24.0 and 64.5 cubic
feet per second.3Above-normal streamflow conditions were defined as streamflows greater than the 75th percentile for the period June 1, 2004, through June 30, 2013. Above-normal streamflows were greater than 64.5 cubic
feet per second.

Environmental Conditions in Indian Creek 19
Figure 5. Duration curves for continuously measured water-quality constituents at the State Line site during the before-upgrade, transitional, and after-upgrade periods at the Middle Basin Wastewater Treatment Facility. A, specific conductance; B, pH; C, water temperature; D, dissolved oxygen; and E, turbidity.
0 20 40 60 80 100100
1,000
10,000
Spec
ific
cond
ucta
nce,
in m
icro
siem
ens
per
cent
imet
er a
t 25
degr
ees
Cels
ius
Wat
er te
mpe
ratu
re, i
n de
gree
s Ce
lsiu
sTu
rbid
ity, i
n fo
rmaz
in n
ephe
lom
etric
uni
ts
Dis
solv
ed o
xyge
n, in
mill
igra
ms
per l
iter
pH, i
n st
anda
rd u
nits
A
C
E
D
B
6.5
7.0
7.5
8.0
8.5
9.0
9.5
10.0
0 20 40 60 80 100
Kansas Department of Health and Environment aquatic life support criterion
0 20 40 60 80 100
0 20 40 60 80 100
0 20 40 60 80 1000
10
20
30
40
0.01
1
0.1
100
10
1,000
10,000
0
5
10
15
20
25
Frequency of exceedance, in percent
Kansas Department of Health and Environment aquatic-life-support criterion
U.S. Environmental Protection AgencyLevel III Ecoregion 40 guideline
Frequency of exceedance, in percent
EXPLANATIONBefore-upgradeTransitionalAfter-upgrade

20 Effects of Wastewater Effluent Discharge on Indian Creek, Johnson County, Kansas
Figure 6. Duration curves for continuously measured water-quality constituents at all Indian Creek study sites, July 2011 through June 2013. A, specific conductance; B, pH; C, water temperature; D, dissolved oxygen; E, turbidity; and F, nitrate plus nitrite. [TMDL, total maximum daily load]
0 20 40 60 80 100100
1,000
10,000
Spec
ific
cond
ucta
nce,
in m
icro
siem
ens
per
cent
imet
er a
t 25
degr
ees
Cels
ius
Wat
er te
mpe
ratu
re, i
n de
gree
s Ce
lsiu
sTu
rbid
ity, i
n fo
rmaz
in n
ephe
lom
etric
uni
ts
Dis
solv
ed o
xyge
n, in
mill
igra
ms
per l
iter
pH, i
n st
anda
rd u
nits
Nitr
ate
plus
nitr
ite, i
n m
illig
ram
s pe
r lite
r as
nitr
ogen
A
C
E
0 20 40 60 80 100
0 20 40 60 80 100
0 20 40 60 80 1000
10
20
30
40
0.01
1
0.1
100
10
1,000
10,000
0
5
10
15
20
25
Frequency of exceedance, in percent
Kansas Department of Health and Environment aquatic-life-support criterion
Kansas Department of Health and Environment aquatic life support criterion
Kansas Department of Health and Environment Nitrate TMDL endpoint for Indian Creek
0 20 40 60 80 1006.0
7.0
8.0
9.0
10.0B
D
F
U.S. Environmental Protection AgencyLevel III Ecoregion 40 guideline
0
2.0
4.0
6.0
8.0
10.0
12.0
14.0
16.0
0 20 40 60 80 100
EXPLANATION119thCollegeMartyMission farmsTomahawkState line

Environmental Conditions in Indian Creek
21
Table 4. Summary statistics for water-quality constituents measured continuously at all Indian Creek study sites during below-normal, normal, and above-normal streamflow conditions, July 2011 through June 2013.
[Continuous real-time water-quality data are available on the U.S. Geological Survey National Real-Time Water-Quality Web site (http://nrtwq.usgs.gov/ks); n, number of measurements; min, minimum; max, maximum; med, median; µS/cm, microsiemens per centimeter at 25 degrees Celsius; °C, degrees Celsius; mg/L, milligrams per liter; FNU, formazin nephelometric units; <, less than]
Water-quality property
119th College
n Min Max Mean Med n Min Max Mean Med
Below-normal streamflow conditions1
Specific conductance (µS/cm) 17,832 374 4,390 968 839 20,485 668 2,750 1,066 1,060
pH 16,341 7.0 8.9 7.9 7.9 20,195 7.0 8.1 7.6 7.6
Water temperature (°C) 17,832 -0.20 34.9 18.5 19.9 20,485 6.90 27.8 21.1 22.4
Dissolved oxygen (mg/L) 17,832 1.6 22 8.2 7.3 20,485 2.8 13.4 6.8 6.7
Turbidity (FNU) 17,832 0.10 90 2 1.3 19,796 0.10 41.0 2.29 1.8
Nitrate (mg/L)2 11,952 <0.1 2.2 0.20 0.15 12,719 2.3 13.7 8.8 9.0
Normal streamflow conditions3
Specific conductance (µS/cm) 34,752 261 8,110 1,081 922 32,116 530 3,060 1,069 1,020
pH 35,111 6.9 9.2 7.8 7.8 32,339 7.0 8.2 7.6 7.6
Water temperature (°C) 35,171 -0.40 35.0 13.1 11.8 32,342 3.20 28.5 18.8 19.2
Dissolved oxygen (mg/L) 35,171 0.20 22 10 10 32,340 3.4 14.0 7.9 7.7
Turbidity (FNU) 35,171 0.10 85 4 2.3 32,005 0.10 86.0 3.01 2.30
Nitrate (mg/L)2 20,351 <0.1 3.7 0.68 0.54 20,242 0.8 13.7 7.4 7.4
Above-normal streamflow conditions4
Specific conductance (µS/cm) 16,898 103 7,490 994 782 16,978 134 4,530 955 900
pH 17,169 7.0 8.9 7.8 7.9 17,163 7.0 8.2 7.5 7.6
Water temperature (°C) 17,173 -0.30 30.0 12.6 11.8 17,163 2.20 28.5 15.4 14.6
Dissolved oxygen (mg/L) 17,173 0.80 19 10 10 16,804 4.5 14.2 8.9 9.0
Turbidity (FNU) 17,173 0.40 1,260 34 9.5 16,297 1.00 1,050 33 9
Nitrate (mg/L)2 11,473 <0.1 3.3 1.4 1.3 11,739 0.3 10.3 4.0 3.9

22
Effects of Wastew
ater Effluent Discharge on Indian Creek, Johnson County, Kansas
Table 4. Summary statistics for water-quality constituents measured continuously at all Indian Creek study sites during below-normal, normal, and above-normal streamflow conditions, July 2011 through June 2013.—Continued
[Continuous real-time water-quality data are available on the U.S. Geological Survey National Real-Time Water-Quality Web site (http://nrtwq.usgs.gov/ks); n, number of measurements; min, minimum; max, maximum; med, median; µS/cm, microsiemens per centimeter at 25 degrees Celsius; °C, degrees Celsius; mg/L, milligrams per liter; FNU, formazin nephelometric units; <, less than]
Water-quality property
Marty Mission Farms
n Min Max Mean Med n Min Max Mean Med
Below-normal streamflow conditions1
Specific conductance (µS/cm) 20,765 576 4,900 1,106 1,060 22,006 545 4,660 1,130 1,090
pH 20,843 7.4 8.9 8.0 8.0 22,158 7.3 8.9 8.0 8.0
Water temperature (°C) 20,843 0.50 31.9 18.1 18.6 22,003 -0.10 32.7 16.9 17.2
Dissolved oxygen (mg/L) 20,843 2.6 18 8.5 8.2 22,158 4.0 16 9.2 8.7
Turbidity (FNU) 20,843 0.30 27 2.7 2.3 22,140 0.10 55 3.4 2.7
Nitrate (mg/L)2 11,740 2.0 10.3 7.4 7.6 13,956 1.4 10.0 6.5 6.7
Normal streamflow conditions3
Specific conductance (µS/cm) 31,814 428 4,900 1,104 1,040 29,949 393 5,460 1,130 1,050
pH 32,262 7.3 9.2 8.0 8.0 30,256 7.2 9.1 8.0 8.0
Water temperature (°C) 32,262 0.60 31.9 17.2 17.8 30,363 -0.30 32.3 16.3 17.2
Dissolved oxygen (mg/L) 32,262 1.0 18 9.1 8.9 30,411 4.0 17 9.4 8.9
Turbidity (FNU) 32,088 0.30 170 4.2 3.2 29,922 0.10 110 4.7 3.4
Nitrate (mg/L)2 16,711 1.1 10.1 6.3 6.3 17,116 0.5 10.0 5.2 5.2
Above-normal streamflow conditions4
Specific conductance (µS/cm) 16,878 122 6,010 1,051 922 16,772 126 6,740 1,052 892
pH 17,071 7.2 9.3 7.8 7.8 16,959 7.2 9.1 7.8 7.8
Water temperature (°C) 17,071 2.90 29.0 14.6 13.8 16,959 1.8 33.8 14.4 13.0
Dissolved oxygen (mg/L) 17,071 3.2 16 9.3 9.1 16,959 4.2 18 9.4 9.2
Turbidity (FNU) 16,699 1.60 1,220 44 12 16,818 1.0 860 45 14
Nitrate (mg/L)2 11,006 0.2 9.5 3.2 3.3 11,490 0.49 8.6 2.8 2.7
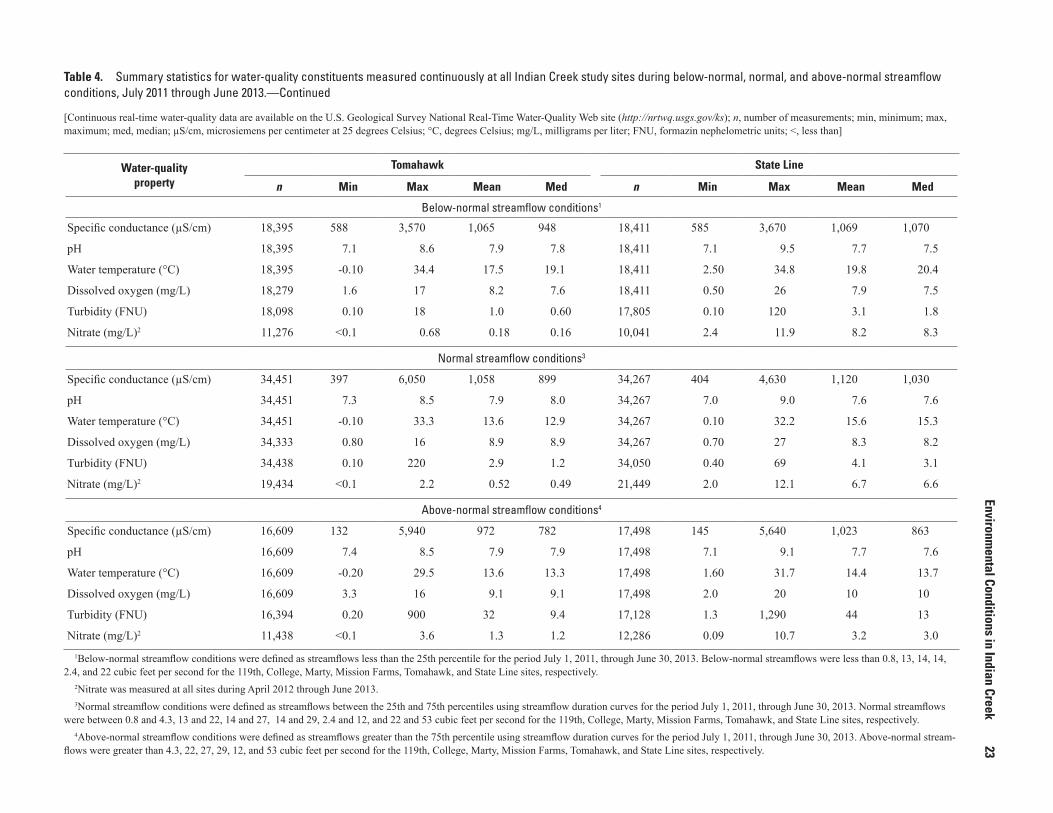
Environmental Conditions in Indian Creek
23
Table 4. Summary statistics for water-quality constituents measured continuously at all Indian Creek study sites during below-normal, normal, and above-normal streamflow conditions, July 2011 through June 2013.—Continued
[Continuous real-time water-quality data are available on the U.S. Geological Survey National Real-Time Water-Quality Web site (http://nrtwq.usgs.gov/ks); n, number of measurements; min, minimum; max, maximum; med, median; µS/cm, microsiemens per centimeter at 25 degrees Celsius; °C, degrees Celsius; mg/L, milligrams per liter; FNU, formazin nephelometric units; <, less than]
Water-quality property
Tomahawk State Line
n Min Max Mean Med n Min Max Mean Med
Below-normal streamflow conditions1
Specific conductance (µS/cm) 18,395 588 3,570 1,065 948 18,411 585 3,670 1,069 1,070
pH 18,395 7.1 8.6 7.9 7.8 18,411 7.1 9.5 7.7 7.5
Water temperature (°C) 18,395 -0.10 34.4 17.5 19.1 18,411 2.50 34.8 19.8 20.4
Dissolved oxygen (mg/L) 18,279 1.6 17 8.2 7.6 18,411 0.50 26 7.9 7.5
Turbidity (FNU) 18,098 0.10 18 1.0 0.60 17,805 0.10 120 3.1 1.8
Nitrate (mg/L)2 11,276 <0.1 0.68 0.18 0.16 10,041 2.4 11.9 8.2 8.3
Normal streamflow conditions3
Specific conductance (µS/cm) 34,451 397 6,050 1,058 899 34,267 404 4,630 1,120 1,030
pH 34,451 7.3 8.5 7.9 8.0 34,267 7.0 9.0 7.6 7.6
Water temperature (°C) 34,451 -0.10 33.3 13.6 12.9 34,267 0.10 32.2 15.6 15.3
Dissolved oxygen (mg/L) 34,333 0.80 16 8.9 8.9 34,267 0.70 27 8.3 8.2
Turbidity (FNU) 34,438 0.10 220 2.9 1.2 34,050 0.40 69 4.1 3.1
Nitrate (mg/L)2 19,434 <0.1 2.2 0.52 0.49 21,449 2.0 12.1 6.7 6.6
Above-normal streamflow conditions4
Specific conductance (µS/cm) 16,609 132 5,940 972 782 17,498 145 5,640 1,023 863
pH 16,609 7.4 8.5 7.9 7.9 17,498 7.1 9.1 7.7 7.6
Water temperature (°C) 16,609 -0.20 29.5 13.6 13.3 17,498 1.60 31.7 14.4 13.7
Dissolved oxygen (mg/L) 16,609 3.3 16 9.1 9.1 17,498 2.0 20 10 10
Turbidity (FNU) 16,394 0.20 900 32 9.4 17,128 1.3 1,290 44 13
Nitrate (mg/L)2 11,438 <0.1 3.6 1.3 1.2 12,286 0.09 10.7 3.2 3.01Below-normal streamflow conditions were defined as streamflows less than the 25th percentile for the period July 1, 2011, through June 30, 2013. Below-normal streamflows were less than 0.8, 13, 14, 14,
2.4, and 22 cubic feet per second for the 119th, College, Marty, Mission Farms, Tomahawk, and State Line sites, respectively.2Nitrate was measured at all sites during April 2012 through June 2013. 3Normal streamflow conditions were defined as streamflows between the 25th and 75th percentiles using streamflow duration curves for the period July 1, 2011, through June 30, 2013. Normal streamflows
were between 0.8 and 4.3, 13 and 22, 14 and 27, 14 and 29, 2.4 and 12, and 22 and 53 cubic feet per second for the 119th, College, Marty, Mission Farms, Tomahawk, and State Line sites, respectively.4Above-normal streamflow conditions were defined as streamflows greater than the 75th percentile using streamflow duration curves for the period July 1, 2011, through June 30, 2013. Above-normal stream-
flows were greater than 4.3, 22, 27, 29, 12, and 53 cubic feet per second for the 119th, College, Marty, Mission Farms, Tomahawk, and State Line sites, respectively.

24 Effects of Wastewater Effluent Discharge on Indian Creek, Johnson County, Kansas
occurred during February 2012 and December 2012 through March 2013, indicating that road salt likely affected specific conductance at all sites.
pH is a measure of the effective hydrogen ion concen-tration and is often used to evaluate chemical and biological reactions in water (Hem, 1992). Kansas aquatic life support criteria require that pH in streams not measure less than 6.5 or more than 8.5 standard units (Kansas Department of Health and Environment, 2005). Median pH values at the State Line site varied by 0.2 standard units or less among the before-upgrade, transitional, and after-upgrade periods at the Middle Basin WWTF (fig. 5B, table 3). Measured pH was never lower than 6.5 (minimum 6.9), but exceeded the maximum aquatic life support criterion of 8.5 standard units about 1 percent of the time during the before-upgrade and transitional peri-ods and about 2 percent of the time during the after-upgrade period (fig. 5B). Exceedances typically were in March through August during below-normal and normal streamflows. Exceedances generally were for a few hours or days rather than for extended periods of time, and likely were caused by increased algal photosynthesis.
In general, pH at the sites located immediately down-stream from the WWTFs (College and State Line) was lower than at the other sites (fig. 6B); median values were 0.3 to 0.4 standard units lower at the College and State Line (7.5–7.6) sites than the other sites (7.8–8.0) across the range of streamflow conditions (table 4). Wastewater effluent may have influenced pH at the College and State Line sites. Dur-ing July 2011 through June 2013, the median pH of effluent from the Middle Basin (n=312, median=7.2, range=6.4–7.8) and Tomahawk Creek (n=288, median=7.2, range=6.3–7.9) WWTFs was 0.3 to 0.8 standard units lower than measured at the Indian Creek study sites. Measured pH was never lower than 6.5 (minimum 6.9) during the study period, but exceeded the maximum aquatic life support criterion of 8.5 standard units at all sites except College. The criterion was only exceeded once at the Tomahawk site. With the exception of the College and Tomahawk sites, the frequency at which pH exceeded 8.5 increased along the upstream-downstream gradient. pH exceeded 8.5 less than 1 percent of the time at the 119th site, about 2 percent of the time at the Marty site, and about 3 percent of the time at the Mission Farms and State Line sites. Exceedances typically were during below-normal and normal streamflows, but the timing of exceedances varied among sites. At the 119th site, most exceedances were in April and August–September. Most exceedances at the Marty site were during January–February and August. Exceedances at the Mission Farms site were almost exclusively during January through April. By comparison, exceedances at the State Line site were during March through August. Among-site differ-ences in occurrence of pH exceedances may have been caused by differences in biological activity. Wastewater influences on pH at the downstream sites also may have influenced the occurrence of exceedances. Exceedances generally were for a few hours or days rather than for extended periods of time.
Water temperature affects the solubility of chemicals in water and biological activity. Kansas water-quality criteria require that discharges to streams not change water tem-perature more than 3 degrees Celsius (°C) or raise the water temperature above 32 °C (Kansas Department of Health and Environment, 2005). Differences in water temperature at the State Line site during the before-upgrade, transitional, and after-upgrade periods were small (fig. 5C, table 3); overall median water temperature at the State Line site varied by 1.3 °C during the before-upgrade (16 °C), transitional (15 °C), and after-upgrade (17 °C) periods. Differences in water tem-perature were observed along the upstream-downstream gradi-ent in Indian Creek across the range of streamflow conditions, and were most pronounced at the College site located imme-diately downstream from the Middle Basin WWTF (fig. 6C, table 4). Water temperature at the wastewater-influenced sites commonly was warmer in the winter and cooler in the summer than at the upstream sites. For example, on average, water temperature at the College site was 10 °C warmer than at the 119th site during November–February and 2 °C cooler during June–August. Differences were less pronounced as distance from the Middle Basin WWTF increased; however, at the Mis-sion Farms site located 9.5-km downstream, water temperature was, on average, 3 °C warmer than at the 119th site during November–February and 0.4 °C cooler during June–August. The influence of the Tomahawk Creek effluent on water temperatures at the State Line site was not as evident, likely because of the influence of Middle Basin effluent and cooler effluent temperatures (2.0 °C on average) from the Tomahawk Creek WWTF relative to the Middle Basin WWTF; how-ever, water temperatures typically were warmer at the State Line site (0.5 °C on average) than at the Mission Farms site (fig. 6C). Wastewater discharges from the Middle Basin and Tomahawk Creek WWTFs did not raise water temperatures at the downstream sites above the KDHE criterion of 32 °C. The KDHE criterion that wastewater discharges to streams not change water temperature by more than 3 °C was frequently exceeded downstream from the Middle Basin WWTF. Water temperature at the College site was more than 3 °C higher than at the 119th site about 52 percent of the time during July 2011 through June 2014. By comparison, water temperature at the State Line site was more than 3 °C higher than at the Mission Farms site less than 1 percent of the time. About 75 percent of exceedances at the College and State Line sites were during October–February.
Dissolved oxygen is an important factor for the survival of aquatic organisms, and concentrations in surface water are related primarily to photosynthesis, respiration, atmospheric reaeration, and water temperature (Lewis, 2006). Kansas aquatic life support criteria require that dissolved oxygen concentrations are not less than 5.0 mg/L (Kansas Department of Health and Environment, 2005). Dissolved oxygen con-centrations at the State Line site generally were similar across the range of streamflow conditions during the before-upgrade, transitional, and after-upgrade periods at the Middle Basin WWTF (fig. 5D, table 3). Dissolved oxygen concentrations

Environmental Conditions in Indian Creek 25
were less than the minimum aquatic- life-support criterion about 14 percent of the time during the before- and after-upgrade periods and about 8 percent of the time during the transitional period. Dissolved oxygen concentrations gener-ally were highest at the 119th site, upstream from the Middle Basin WWTF, and lowest at the College site, immediately downstream from the Middle Basin WWTF (fig. 6D, table 4). Dissolved oxygen concentrations were less than the minimum aquatic life support criterion about 17 percent of the time at the State Line site, 10 percent of the time at the two upstream sites, and less than 1 percent of the time at all other sites, including College (fig. 6D). Dissolved oxygen concentrations less than 5 mg/L typically were at night in May through Octo-ber during below-normal and normal streamflows, reflecting increased water temperatures and the influence of biological activity during seasonal low flows. Lower dissolved oxygen concentrations overall at the College site are likely a result of warmer water temperatures (fig. 6C ) during winter because of the Middle Basin effluent; however, the low frequency of con-centrations less than 5 mg/L at the College, Marty, and Mis-sion Farms sites may reflect greater streamflows during sum-mer months and reaeration by the WWTF. Dissolved oxygen concentrations may have been below the Kansas aquatic life support criterion most frequently at the State Line site because of biological activity resulting in large diurnal fluctuations. Dissolved oxygen concentration varied by as much as 24 mg/L diurnally at the State Line site, compared to maximum diurnal differences of between 8 and 15 mg/L at all other sites.
Turbidity, Suspended Solids, and Suspended Sediment
Suspended solids and sediment in stream water typi-cally are from erosion and subsequent transport of surface and channel bank soils. Increased suspended sediment in streams decreases light penetration and photosynthesis, smothers benthic habitats, and interferes with feeding activities (Wetzel, 2001). In addition, suspended particulates promote sorption of nutrients, organic compounds, and other potential contami-nants. Turbidity, caused by suspended and dissolved matter such as clay, silt, fine organic matter, microscopic organisms, organic acids, and dyes (Wetzel, 2001), often is used as a sur-rogate for suspended solids and sediment.
Turbidities at the State Line site during June 2004 through June 2013 generally were similar during below-normal and normal streamflows [mean and median values within 4 formazin nephelometric units (FNU)]; however, mean turbidities during above-normal streamflows were 46 percent larger during the before-upgrade period and 10 percent larger during the transitional period than during the after-upgrade period (fig. 5E, table 3). The EPA guidelines for turbidity (based on reference conditions) list 15.5 FNUs for level III ecoregion 40 (central irregular plains) streams, which includes Indian Creek (U.S. Environmental Protection Agency, 2000a). Guidelines are nonenforceable criteria developed for the protection of water quality, aquatic life, and human health.
Turbidities exceeded 15.5 FNUs about 22 percent of the time during the before-upgrade and transitional periods and about 15 percent of the time during the after-upgrade period. Most of the exceedances were during above-normal streamflows.
Along the upstream-downstream gradient, turbidities were lower at the upstream sites than the downstream sites about 50 percent of the time (fig. 6E, table 4); however, over-all among-site differences during below-normal and normal streamflows generally were small (less than 3 FNU). During above-normal streamflows, mean and median turbidities were about 28 percent and 33 percent higher, respectively, at the three most downstream sites (Marty, Mission Farms, and State Line) than at the other sites upstream (119th, College, and Tomahawk). Turbidities exceeded 15.5 FNUs between 8 and 13 percent of the time during July 2011 through June 2013; exceedances were lowest at the College site and highest at the Mission Farms site.
Suspended solids are effectively removed by most waste-water treatment processes, and in Johnson County, turbidity, total suspended solids, and sediment concentrations typically are lower downstream from wastewater effluent discharges than upstream during below-normal streamflows (Lee and others, 2005; Wilkison and others, 2006; Rasmussen and others, 2008, 2009b, 2012, 2014; Graham and others, 2010). Higher turbidities during above-normal streamflows during the before-upgrade and transitional periods at the State Line site and at the downstream sites during July 2011 through June 2013 likely are due to larger drainage basin areas or activities, such as construction, that increased sediment runoff, rather than wastewater influences. Construction efforts are recog-nized causes of increased sediment loads (Lee and Ziegler, 2010).
Patterns in total suspended solids (TSS) and suspended-sediment concentration (SSC) at the State Line site dur-ing 2004 through 2013 match patterns in turbidity (fig. 5E, tables 3 and 5). During below-normal and normal streamflows, TSS and SSC between the before- and after-upgrade periods generally were similar (median values within 5.5 mg/L). As observed with turbidity, during above-normal streamflows, median TSS and SSC were higher (7 and 22 percent, respec-tively) during the before-upgrade period than the after-upgrade period. Patterns in TSS and SSC did not necessarily match among-site patterns in turbidity (fig. 6E, tables 4 and 6). Among-site differences in median TSS and SSC values during below-normal and normal streamflows generally were small (less than 7 mg/L); however, maximum values at the 119th, Marty, and Mission Farms sites were between 46 and 130 per-cent higher than at the College, Tomahawk, and State Line sites. During above-normal streamflows, median TSS and SSC were 56 to 148 percent higher at the sites located on Indian Creek than at the Tomahawk site. Among the sites located on Indian Creek, TSS and SSC were lowest at the 119th and Mission Farms sites (TSS medians 134 and 136 mg/L, respectively; SSC medians 173 and 182 mg/L, respectively) and highest at the College and Marty sites (TSS medians 497 and 504 mg/L, respectively; SSC medians 567 and 478 mg/L,

26
Effects of Wastew
ater Effluent Discharge on Indian Creek, Johnson County, KansasTable 5. Summary of results from discrete water-quality samples collected at the State Line study site during the before-upgrade, transitional, and after-upgrade periods at the Middle Basin Wastewater Treatment Facility, June 2004 through June 2013.
[n, number of samples; ft3/s, cubic feet per second; --, not applicable; %, percent; mg/L, milligrams per liter; µS/cm, microsiemens per centimeter at 25 degrees Celsius; NTRU, nephelometric turbidity ratio unit; <, less than; col/100 mL, colonies per 100 milliliters of sample]
Water-quality property or chemical (unit of measure)
Before upgrade Transitional After upgraden Range Median n Range Median n Range Median
Below-normal and normal streamflow conditionsPhysical properties, suspended solids, and sediment
Streamflow (ft3/s) 10 14–60 33 1 64 -- 8 19–60 28Wastewater effluent (% streamflow) 10 2.4–100 56 1 12 -- 8 43–100 78Dissolved oxygen, field (mg/L) 9 9.3–14 10 1 8.0 -- 8 4.7–15 10pH, field (standard units) 10 7.2–8.2 7.9 1 7.8 -- 8 7.3–8.4 7.8Specific conductance, field (µS/cm) 10 298–5,760 1,120 1 926 -- 8 831–3,860 1,250Water temperature, field (degrees Celsius) 10 2.80–26.7 8.90 1 16.9 -- 8 4.70–28.2 16.1Turbidity, laboratory (NTRU) 7 <2–360 4.0 1 22 -- 7 1.6–7.4 5.6Total suspended solids (mg/L) 7 <10–828 5.00 1 24.0 -- 7 all <10 7.50Suspended sediment (mg/L) 8 2.0–836 6.50 1 26.0 -- 7 3.0–50.0 12.0
Dissolved solids and major ionsDissolved solids (mg/L) 9 206–3,030 620 1 543 -- 7 575–2,190 780Calcium (mg/L) 10 26.2–138 80.2 1 67.6 -- 7 56.8–109 72.2Magnesium (mg/L) 10 3.93–23.2 15.9 1 10.0 -- 7 13.3–19.7 19.0Potassium (mg/L) 10 3.00–13.7 8.64 1 4.8 -- 7 7.00–15.9 14.7Sodium (mg/L) 10 21.5–933 99.0 1 86.0 -- 7 84.2–623 174Chloride (mg/L) 10 32.0–1,680 161 1 155 -- 7 137–1,020 225Sulfate (mg/L) 10 20.0–128 108 1 62.0 -- 7 94.0–155 139
Nutrients and carbonAmmonia plus organic, total, as nitrogen (mg/L) 10 0.89–3.60 1.70 1 1.80 -- 7 1.20–4.10 1.70Nitrite plus nitrate as nitrogen, dissolved (mg/L) 10 0.70–9.72 5.34 1 2.05 -- 8 3.56–10.2 6.92Ammonia, as nitrogen (mg/L) 10 <0.04–1.20 0.63 1 0.19 -- 7 0.08–2.56 0.50Total nitrogen (mg/L)1 10 4.30–11.4 7.24 1 3.85 -- 7 5.16–14.0 9.00Orthophosphorus, as phosphorus (mg/L) 9 0.11–2.64 1.18 1 0.28 -- 6 0.39–1.60 0.98Dissolved phosphorus (mg/L) 10 0.17–2.80 1.34 1 0.33 -- 7 0.39–1.65 0.84Total phosphorus (mg/L) 10 0.66–2.80 1.38 1 0.42 -- 7 0.43–1.75 0.90Particulate phosphorus (mg/L)2 10 <0.05–0.85 0.06 1 0.09 -- 7 <0.05–0.12 0.06Dissolved organic carbon (mg/L) 1 7.12 -- 1 6.43 -- 7 3.53–8.32 7.58Total organic carbon (mg/L) 1 19.8 -- 1 7.60 -- 7 6.70–11.2 9.30
Biochemical and bacteriaBiochemical oxygen demand (mg/L) 1 11 -- 1 7.0 -- 6 4.0–8.0 4.0Chemical oxygen demand (mg/L) 1 126 -- 1 20 -- 7 24–56 33Enterococci (col/100 mL) 6 <10–9,700 28 1 200 -- 6 10–360 330Escherichia coli (col/100 mL) 6 20–20,000 590 1 1,100 -- 6 <10–260 800Fecal coliform (col/100 mL) 7 30–23,000 30 1 104 -- 7 <10–330 86

Environmental Conditions in Indian Creek
27
Water-quality property or chemical (unit of measure)
Before upgrade Transitional After upgraden Range Median n Range Median n Range Median
Above-normal streamflow conditionsPhysical properties, suspended solids, and sediment
Streamflow (ft3/s) 18 71–9,660 1,460 5 468–9,220 2,180 13 151–2,190 1,140Wastewater effluent (% streamflow) 18 0.39–39 2.8 5 0.30–16 3.1 13 3.5–39 7.7Dissolved oxygen, field (mg/L) 18 6.4–13 8.8 5 7.2–8.4 7.6 13 6.5–11 8.2pH, field (standard units) 18 7.5–8.2 7.7 5 7.6–8.0 7.8 13 6.8–8.0 7.8Specific conductance, field (µS/cm) 18 211–3,330 336 5 185–728 239 13 224–1,260 523Water temperature, field (degrees Celsius) 18 3.80–24.3 17.6 5 15.9–22.6 19.2 13 8.40–25.1 15.0Turbidity, laboratory (NTRU) 17 18–750 270 5 140–490 330 13 30–400 200Total suspended solids (mg/L) 17 26.0–1,900 538 5 132–1,280 668 13 55–1,370 502Suspended sediment (mg/L) 17 21.0–1,880 672 5 147–1,730 749 13 63.0–1,480 537
Dissolved solids and major ionsDissolved solids (mg/L) 18 102–1,780 206 5 136–604 187 13 112–724 294Calcium (mg/L) 18 15.3–128 28.5 5 19.3–74.6 20.0 13 19.3–63.0 39.9Magnesium (mg/L) 18 2.00–18.9 4.17 5 2.70–12.0 3.30 13 2.50–10.9 6.00Potassium (mg/L) 18 2.30–6.69 3.50 5 2.60–4.10 3.60 13 2.70–7.74 4.20Sodium (mg/L) 18 8.20–524 26.7 5 9.90–54.0 16.1 13 13.8–200 51.2Chloride (mg/L) 18 9.00–857 32.9 5 12.0–89.0 25.0 13 17.0–304 63.6Sulfate (mg/L) 18 11.5–93.7 26.0 5 16.0–63.0 18.0 13 17.0–62.0 40.0
Nutrients and carbonAmmonia plus organic, total, as nitrogen (mg/L) 18 1.20–8.00 2.40 5 1.30–4.30 1.90 13 1.30–4.20 2.80Nitrite plus nitrate as nitrogen, dissolved (mg/L) 18 0.43–4.44 1.06 5 0.51–1.70 0.82 13 0.70–2.77 1.43Ammonia, as nitrogen (mg/L) 18 0.07–1.00 0.20 5 0.11–0.20 0.17 13 <0.04–0.33 0.20Total nitrogen (mg/L)1 18 2.30–10.8 3.28 5 1.87–4.81 3.50 13 2.63–5.66 4.10Orthophosphorus, as phosphorus (mg/L) 17 0.09–0.77 0.16 5 0.06–0.21 0.10 12 <0.05–0.48 0.26Dissolved phosphorus (mg/L) 18 0.11–0.86 0.18 5 0.11–0.25 0.15 13 <0.05–0.57 0.33Total phosphorus (mg/L) 18 0.32–2.67 0.76 5 0.36–1.48 0.64 13 0.17–1.45 0.68Particulate phosphorus (mg/L)2 18 <0.05–2.13 0.60 5 0.19–1.33 0.53 13 0.08–1.10 0.52Dissolved organic carbon (mg/L) 2 4.25–6.67 5.46 5 2.72–8.51 5.64 12 4.86–15.8 6.11Total organic carbon (mg/L) 2 12.8–30.4 21.6 5 11.9–25.2 18.6 12 9.3–32.5 19.8
Biochemical and bacteriaBiochemical oxygen demand (mg/L) 2 9.0–10 9.5 5 4.0–11 7.0 12 4.0–17 10Chemical oxygen demand (mg/L) 1 146 -- 5 45–216 94 12 29–137 84Enterococci (col/100 mL) 14 120–35,000 19,500 5 140–92,000 48,000 12 40–25,000 10,700Escherichia coli (col/100 mL) 14 8,500–37,000 10,800 5 13,000–36,000 29,000 12 29,000–33,000 8,000Fecal coliform (col/100 mL) 16 1,200–140,000 23,000 5 2,800–60,000 36,000 13 570–55,000 14,000
1Calculated as the sum of nitrite plus nitrate, dissolved, and ammonia plus organic, total.2Calculated as the difference between total phosphorus and dissolved phosphorus.
Table 5. Summary of results from discrete water-quality samples collected at the State Line study site during the before-upgrade, transitional, and after-upgrade periods at the Middle Basin Wastewater Treatment Facility, June 2004 through June 2013.—Continued
[n, number of samples; ft3/s, cubic feet per second; --, not applicable; %, percent; mg/L, milligrams per liter; µS/cm, microsiemens per centimeter at 25 degrees Celsius; NTRU, nephelometric turbidity ratio unit; <, less than; col/100 mL, colonies per 100 milliliters of sample]
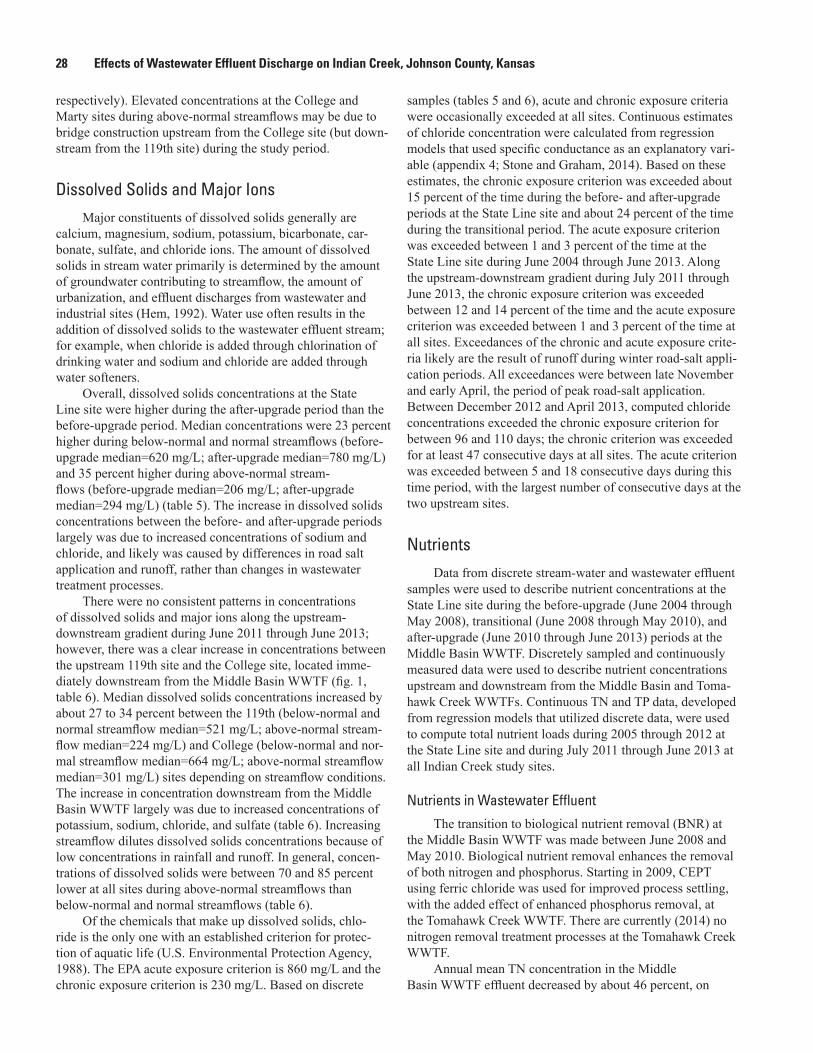
28 Effects of Wastewater Effluent Discharge on Indian Creek, Johnson County, Kansas
respectively). Elevated concentrations at the College and Marty sites during above-normal streamflows may be due to bridge construction upstream from the College site (but down-stream from the 119th site) during the study period.
Dissolved Solids and Major IonsMajor constituents of dissolved solids generally are
calcium, magnesium, sodium, potassium, bicarbonate, car-bonate, sulfate, and chloride ions. The amount of dissolved solids in stream water primarily is determined by the amount of groundwater contributing to streamflow, the amount of urbanization, and effluent discharges from wastewater and industrial sites (Hem, 1992). Water use often results in the addition of dissolved solids to the wastewater effluent stream; for example, when chloride is added through chlorination of drinking water and sodium and chloride are added through water softeners.
Overall, dissolved solids concentrations at the State Line site were higher during the after-upgrade period than the before-upgrade period. Median concentrations were 23 percent higher during below-normal and normal streamflows (before-upgrade median=620 mg/L; after-upgrade median=780 mg/L) and 35 percent higher during above-normal stream-flows (before-upgrade median=206 mg/L; after-upgrade median=294 mg/L) (table 5). The increase in dissolved solids concentrations between the before- and after-upgrade periods largely was due to increased concentrations of sodium and chloride, and likely was caused by differences in road salt application and runoff, rather than changes in wastewater treatment processes.
There were no consistent patterns in concentrations of dissolved solids and major ions along the upstream-downstream gradient during June 2011 through June 2013; however, there was a clear increase in concentrations between the upstream 119th site and the College site, located imme-diately downstream from the Middle Basin WWTF (fig. 1, table 6). Median dissolved solids concentrations increased by about 27 to 34 percent between the 119th (below-normal and normal streamflow median=521 mg/L; above-normal stream-flow median=224 mg/L) and College (below-normal and nor-mal streamflow median=664 mg/L; above-normal streamflow median=301 mg/L) sites depending on streamflow conditions. The increase in concentration downstream from the Middle Basin WWTF largely was due to increased concentrations of potassium, sodium, chloride, and sulfate (table 6). Increasing streamflow dilutes dissolved solids concentrations because of low concentrations in rainfall and runoff. In general, concen-trations of dissolved solids were between 70 and 85 percent lower at all sites during above-normal streamflows than below-normal and normal streamflows (table 6).
Of the chemicals that make up dissolved solids, chlo-ride is the only one with an established criterion for protec-tion of aquatic life (U.S. Environmental Protection Agency, 1988). The EPA acute exposure criterion is 860 mg/L and the chronic exposure criterion is 230 mg/L. Based on discrete
samples (tables 5 and 6), acute and chronic exposure criteria were occasionally exceeded at all sites. Continuous estimates of chloride concentration were calculated from regression models that used specific conductance as an explanatory vari-able (appendix 4; Stone and Graham, 2014). Based on these estimates, the chronic exposure criterion was exceeded about 15 percent of the time during the before- and after-upgrade periods at the State Line site and about 24 percent of the time during the transitional period. The acute exposure criterion was exceeded between 1 and 3 percent of the time at the State Line site during June 2004 through June 2013. Along the upstream-downstream gradient during July 2011 through June 2013, the chronic exposure criterion was exceeded between 12 and 14 percent of the time and the acute exposure criterion was exceeded between 1 and 3 percent of the time at all sites. Exceedances of the chronic and acute exposure crite-ria likely are the result of runoff during winter road-salt appli-cation periods. All exceedances were between late November and early April, the period of peak road-salt application. Between December 2012 and April 2013, computed chloride concentrations exceeded the chronic exposure criterion for between 96 and 110 days; the chronic criterion was exceeded for at least 47 consecutive days at all sites. The acute criterion was exceeded between 5 and 18 consecutive days during this time period, with the largest number of consecutive days at the two upstream sites.
NutrientsData from discrete stream-water and wastewater effluent
samples were used to describe nutrient concentrations at the State Line site during the before-upgrade (June 2004 through May 2008), transitional (June 2008 through May 2010), and after-upgrade (June 2010 through June 2013) periods at the Middle Basin WWTF. Discretely sampled and continuously measured data were used to describe nutrient concentrations upstream and downstream from the Middle Basin and Toma-hawk Creek WWTFs. Continuous TN and TP data, developed from regression models that utilized discrete data, were used to compute total nutrient loads during 2005 through 2012 at the State Line site and during July 2011 through June 2013 at all Indian Creek study sites.
Nutrients in Wastewater Effluent
The transition to biological nutrient removal (BNR) at the Middle Basin WWTF was made between June 2008 and May 2010. Biological nutrient removal enhances the removal of both nitrogen and phosphorus. Starting in 2009, CEPT using ferric chloride was used for improved process settling, with the added effect of enhanced phosphorus removal, at the Tomahawk Creek WWTF. There are currently (2014) no nitrogen removal treatment processes at the Tomahawk Creek WWTF.
Annual mean TN concentration in the Middle Basin WWTF effluent decreased by about 46 percent, on

Environmental Conditions in Indian Creek
29
Table 6. Summary of results from discrete water-quality samples collected at all Indian Creek study sites, June 2011 through June 2013.
[n, number of samples; ft3/s, cubic feet per second; --, not applicable; %, percent; mg/L, milligrams per liter; µS/cm, microsiemens per centimeter at 25 degrees Celsius; NTRU, nephelometric turbidity ratio unit; <, less than; col/100 mL, colonies per 100 milliliters of sample]
Water-quality property or chemical (unit of measure)
119th College Martyn Range Median n Range Median n Range Median
Below-normal and normal streamflow conditionsPhysical properties, suspended solids, and sediment
Streamflow (ft3/s) 5 0.43–1.1 0.76 5 10–17 14 5 4.4–20 14Wastewater effluent (% streamflow) -- -- -- 5 80–100 100 5 74–100 100Dissolved oxygen, field (mg/L) 6 6.2–14 9.5 5 6.4–10 7.4 5 7.9–15 9.3pH, field (standard units) 6 7.4–8.3 7.8 5 6.7–7.9 7.5 5 6.8–8.4 8.1Specific conductance, field (µS/cm) 6 699–1,190 806 5 930–1,440 1,090 5 905–1,310 1,100Water temperature, field (degrees Celsius) 6 0.00–26.3 21.0 5 11.9–23.9 22.2 5 6.10–26.9 21.8Turbidity, laboratory (NTRU) 6 1.3–80 3.1 5 1.1–4.8 2.0 5 2.5–8.1 3.9Total suspended solids (mg/L) 6 <15.0–75.0 <15.0 5 <15.0–7.50 <15.0 5 <15.0–26.0 <15.0Suspended sediment (mg/L) 6 2.00–100 9.00 5 3.00–26.0 9.00 5 4.00–94.0 13.0
Dissolved solids and major ionsDissolved solids (mg/L) 6 448–653 521 5 611–831 664 5 585–770 643Calcium (mg/L) 6 68.4–119 80.5 5 55.4–65.9 62.8 5 59.3–68.8 63.2Magnesium (mg/L) 6 11.4–20.8 13.7 5 12.9–19.1 15.8 5 11.4–19.7 17.0Potassium (mg/L) 6 2.90–4.50 3.80 5 15.4–18.4 16.9 5 13.3–19.1 17.3Sodium (mg/L) 6 59.2–101 65.4 5 95.9–186 128 5 91.2–164 127Chloride (mg/L) 6 79.0–187 110 5 121–264 139 5 125–217 150Sulfate (mg/L) 6 54.0–102 80.0 5 100–144 135 5 92.0–142 134
Nutrients and carbonAmmonia plus organic, total, as nitrogen (mg/L) 6 <0.50–0.80 0.70 5 1.00–1.40 1.30 5 1.00–1.20 1.20Nitrite plus nitrate as nitrogen, dissolved (mg/L) 6 <0.02–0.40 0.12 5 5.87–11.1 9.96 5 7.05–9.70 7.40Ammonia, as nitrogen (mg/L) 6 <0.04–0.06 <0.04 5 <0.04–0.13 0.07 5 <0.04–0.07 <0.04Total nitrogen (mg/L)1 6 0.26–1.20 0.75 5 7.17–12.4 11.1 5 8.25–10.7 8.60Orthophosphorus, as phosphorus (mg/L) 6 all <0.05 <0.05 5 <0.05–4.97 2.08 5 <0.05–5.08 1.56Dissolved phosphorus (mg/L) 6 all <0.05 <0.05 5 0.10–4.97 2.08 5 0.10–5.08 1.59Total phosphorus (mg/L) 6 <0.05–0.06 <0.05 5 0.12–4.97 2.12 5 0.11–5.08 2.13Particulate phosphorus (mg/L)2 6 all <0.05 <0.05 5 <0.05–0.07 <0.05 5 <0.05–0.58 <0.05Dissolved organic carbon (mg/L) 6 3.18–7.84 3.94 5 3.94–7.03 6.32 5 4.88–6.52 5.80Total organic carbon (mg/L) 6 3.30–7.30 5.50 5 7.10–8.80 7.40 5 6.60–8.40 6.90
Biochemical and bacteriaBiochemical oxygen demand (mg/L) 6 all <2.0 <2.0 4 all <2.0 <2.0 4 <2.0–2.0 <2.0Chemical oxygen demand (mg/L) 6 5–29 16 5 17–31 24 5 15–33 24Enterococci (col/100 mL) 6 <10–300 68 4 160–240 185 4 20–200 38Escherichia coli (col/100 mL) 6 <10–200 130 4 140–360 260 4 41–360 220Fecal coliform (col/100 mL) 6 10–890 155 5 80–260 210 5 52–560 309

30
Effects of Wastew
ater Effluent Discharge on Indian Creek, Johnson County, KansasTable 6. Summary of results from discrete water-quality samples collected at all Indian Creek study sites, June 2011 through June 2013.—Continued
[n, number of samples; ft3/s, cubic feet per second; --, not applicable; %, percent; mg/L, milligrams per liter; µS/cm, microsiemens per centimeter at 25 degrees Celsius; NTRU, nephelometric turbidity ratio unit; <, less than; col/100 mL, colonies per 100 milliliters of sample]
Water-quality property or chemical (unit of measure)
119th College Martyn Range Median n Range Median n Range Median
Above-normal streamflow conditionsPhysical properties, suspended solids, and sediment
Streamflow (ft3/s) 14 4.6–1,510 141 12 25–2,230 298 13 33–954 419Wastewater effluent (% streamflow) -- -- -- 12 0.75–99 5.9 13 2.1–70 4.7Dissolved oxygen, field (mg/L) 14 7.1–18 10 12 7.5–11 9.6 13 7.2–15 9.8pH, field (standard units) 14 6.5–8.5 7.9 12 7.2–8.1 7.7 13 6.9–8.5 7.9Specific conductance, field (µS/cm) 14 109–4,020 410 12 138–2,490 497 13 162–3,420 418Water temperature, field (degrees Celsius) 14 1.60–23.7 9.50 12 7.20–22.7 12.6 13 6.90–23.8 12.3Turbidity, laboratory (NTRU) 14 2.9–480 60 12 3.5–800 190 13 3.0–560 97Total suspended solids (mg/L) 14 <15.0–1,440 134 12 <15.0–1,920 497 13 <15.0–1,640 504Suspended sediment (mg/L) 14 5.00–1,790 173 12 6.00–2,580 567 13 6.00–1,950 478
Dissolved solids and major ionsDissolved solids (mg/L) 14 58.0–2,260 224 12 68.0–1,420 301 13 93.0–1,940 262Calcium (mg/L) 14 11.7–120 28.5 12 14.1–94.6 36.4 13 16.4–108 32.6Magnesium (mg/L) 14 1.30–18.4 3.90 12 1.70–18.1 7.00 13 2.10–19.8 5.20Potassium (mg/L) 14 1.60–4.00 2.90 12 2.00–10.2 3.40 13 2.50–9.40 4.00Sodium (mg/L) 14 6.50–676 39.1 12 8.80–398 46.8 13 12.4–570 37.3Chloride (mg/L) 14 8.00–1,100 54.0 12 10.0–643 59.5 13 15.0–931 50.0Sulfate (mg/L) 14 <5.00–94.0 26.0 12 12.0–118 38.0 13 15.0–117 38.0
Nutrients and carbonAmmonia plus organic, total, as nitrogen (mg/L) 14 0.40–3.20 1.50 12 1.10–5.50 2.40 13 1.00–5.10 2.40Nitrite plus nitrate as nitrogen, dissolved (mg/L) 14 0.04–1.85 0.76 12 0.53–4.41 1.46 13 0.63–4.50 1.39Ammonia, as nitrogen (mg/L) 14 <0.02–0.30 0.11 12 0.02–0.24 0.12 13 0.02–1.03 0.20Total nitrogen (mg/L)1 14 0.44–4.15 2.20 12 2.88–6.03 4.22 13 2.20–6.74 3.79Orthophosphorus, as phosphorus (mg/L) 14 <0.05–0.15 <0.05 12 <0.05–1.23 0.13 13 0.05–1.24 0.19Dissolved phosphorus (mg/L) 14 <0.05–0.21 0.06 12 <0.05–1.31 0.18 13 0.05–1.27 0.20Total phosphorus (mg/L) 14 <0.05–1.00 0.30 12 0.06–1.81 0.98 13 0.05–2.22 0.73Particulate phosphorus (mg/L)2 14 <0.05–0.95 0.18 12 <0.05–1.71 0.63 13 <0.05–1.69 0.53Dissolved organic carbon (mg/L) 14 3.13–9.01 4.85 12 4.24–7.72 4.97 13 4.02–9.82 5.62Total organic carbon (mg/L) 14 4.40–27.9 10.6 12 6.80–48.6 19.1 13 6.10–44.1 19.6
Biochemical and bacteriaBiochemical oxygen demand (mg/L) 12 <2.0–9.0 6.0 12 4.0–15 8.0 12 <2.0–19 7.0Chemical oxygen demand (mg/L) 14 20–110 41 12 26–192 53 13 26–178 63Enterococci (col/100 mL) 12 10–110,000 7,400 12 100–69,000 8,400 12 10–82,000 6,000Escherichia coli (col/100 mL) 12 41–69,000 5,800 12 320–310,000 5,200 12 410–31,000 5,400Fecal coliform (col/100 mL) 14 30–52,000 3,000 12 130–100,000 3,000 13 240–60,000 5,800

Environmental Conditions in Indian Creek
31
Table 6. Summary of results from discrete water-quality samples collected at all Indian Creek study sites, June 2011 through June 2013.—Continued
[n, number of samples; ft3/s, cubic feet per second; %, percent; --, not applicable; mg/L, milligrams per liter; µS/cm, microsiemens per centimeter at 25 degrees Celsius; NTRU, nephelometric turbidity ratio unit; <, less than; col/100 mL, colonies per 100 milliliters of sample]
Water-quality property or chemical (unit of measure)
Mission Farms Tomahawk State Linen Range Median n Range Median n Range Median
Below-normal and normal streamflow conditionsPhysical properties, suspended solids, and sediment
Streamflow (ft3/s) 7 9.5–26 14 6 0.64–12 2.7 5 19–34 22Wastewater effluent (% streamflow) 7 72–100 99 -- -- -- 5 44–67 64Dissolved oxygen, field (mg/L) 7 6.2–13 9.1 6 4.6–14 8.0 5 5.8–12 9.7pH, field (standard units) 7 7.8–8.7 8.1 6 7.0–8.1 7.6 5 7.3–8.3 7.8Specific conductance, field (µS/cm) 7 919–4,120 1,140 6 827–1,940 1,120 5 894–1,460 1,130Water temperature, field (degrees Celsius) 7 3.80–28.6 17.4 6 0.70–27.2 14.5 5 4.80–28.2 21.4Turbidity, laboratory (NTRU) 7 3.5–11 5.5 6 1.4–7.6 2.8 5 1.6–6.1 3.2Total suspended solids (mg/L) 7 <15.0–24.0 <15.0 6 <15.0–7.50 <15.0 5 <15.0–8.00 <15.0Suspended sediment (mg/L) 7 5.00–66.0 14.0 6 4.00–17.0 7.00 5 3.00–50.0 12.0
Dissolved solids and major ionsDissolved solids (mg/L) 7 589–2,320 696 6 532–1,030 638 5 575–828 676Calcium (mg/L) 7 56.7–113 70.9 6 70.3–110 89.3 5 56.8–73.4 67.5Magnesium (mg/L) 7 12.6–19.4 15.5 6 15.6–21.7 18.7 5 13.3–19.4 16.0Potassium (mg/L) 7 8.70–16.8 15.0 6 2.80–4.80 3.50 5 10.6–15.9 15.0Sodium (mg/L) 7 89.7–718 137 6 69.2–262 104 5 84.2–191 142Chloride (mg/L) 7 126–1,080 152 6 80.0–429 144 5 137–258 142Sulfate (mg/L) 7 84.0–144 123 6 96.0–148 112 5 94.0–155 149
Nutrients and CarbonAmmonia plus organic, total, as nitrogen (mg/L) 7 0.90–1.20 1.00 6 <0.50–0.90 0.50 5 1.20–4.10 1.80Nitrite plus nitrate as nitrogen, dissolved (mg/L) 7 2.40–8.46 6.40 6 0.02–1.16 0.10 5 6.91–10.2 7.80Ammonia, as nitrogen (mg/L) 7 <0.04–0.08 0.04 6 <0.04–0.04 <0.04 5 0.08–2.56 0.55Total nitrogen (mg/L)1 7 3.40–9.46 7.50 6 0.27–2.06 0.56 5 8.71–14.0 10.3Orthophosphorus, as phosphorus (mg/L) 7 0.10–2.96 0.50 6 all <0.05 <0.05 5 0.51–1.60 1.24Dissolved phosphorus (mg/L) 7 0.17–2.98 0.58 6 all <0.05 <0.05 5 0.52–1.65 1.33Total phosphorus (mg/L) 7 0.17–2.99 0.64 6 <0.05–0.05 <0.05 5 0.56–1.75 1.36Particulate phosphorus (mg/L)2 7 <0.05–0.08 <0.05 6 all <0.05 <0.05 5 <0.05–0.12 0.06Dissolved organic carbon (mg/L) 7 4.30–7.28 6.20 6 3.09–8.64 4.12 5 3.53–8.32 7.83Total organic carbon (mg/L) 7 6.00–8.60 6.90 6 3.50–7.80 5.45 5 8.10–11.2 10.0
Biochemical and bacteriaBiochemical oxygen demand (mg/L) 5 <2.0–3.0 <2.0 5 <2.0–3.0 <2.0 4 4.0–8.0 4.5Chemical oxygen demand (mg/L) 7 18–54 22 6 15–35 20 5 24–42 31Enterococci (col/100 mL) 5 10–380 20 5 20–600 41 4 10–360 30Escherichia coli (col/100 mL) 5 20–340 110 5 <10–220 74 4 20–260 104Fecal coliform (col/100 mL) 7 10–810 70 6 <10–3,900 52 5 <10–330 130
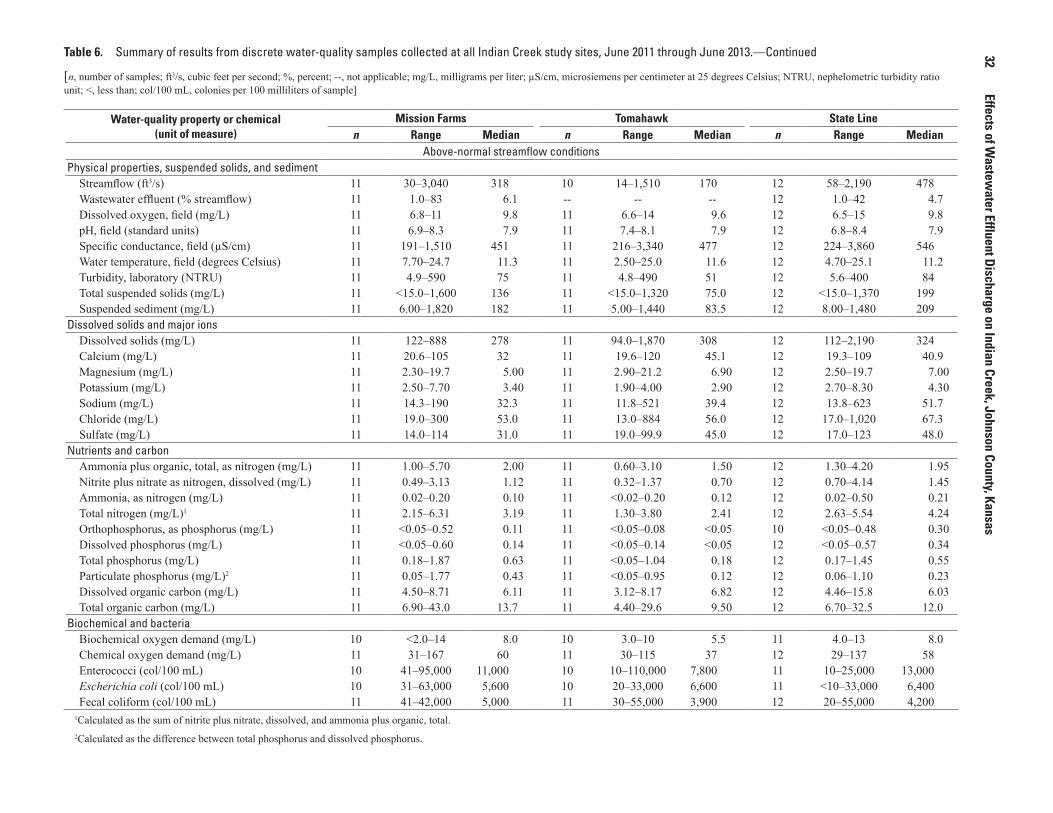
32
Effects of Wastew
ater Effluent Discharge on Indian Creek, Johnson County, KansasTable 6. Summary of results from discrete water-quality samples collected at all Indian Creek study sites, June 2011 through June 2013.—Continued
[n, number of samples; ft3/s, cubic feet per second; %, percent; --, not applicable; mg/L, milligrams per liter; µS/cm, microsiemens per centimeter at 25 degrees Celsius; NTRU, nephelometric turbidity ratio unit; <, less than; col/100 mL, colonies per 100 milliliters of sample]
Water-quality property or chemical (unit of measure)
Mission Farms Tomahawk State Linen Range Median n Range Median n Range Median
Above-normal streamflow conditionsPhysical properties, suspended solids, and sediment
Streamflow (ft3/s) 11 30–3,040 318 10 14–1,510 170 12 58–2,190 478Wastewater effluent (% streamflow) 11 1.0–83 6.1 -- -- -- 12 1.0–42 4.7Dissolved oxygen, field (mg/L) 11 6.8–11 9.8 11 6.6–14 9.6 12 6.5–15 9.8pH, field (standard units) 11 6.9–8.3 7.9 11 7.4–8.1 7.9 12 6.8–8.4 7.9Specific conductance, field (µS/cm) 11 191–1,510 451 11 216–3,340 477 12 224–3,860 546Water temperature, field (degrees Celsius) 11 7.70–24.7 11.3 11 2.50–25.0 11.6 12 4.70–25.1 11.2Turbidity, laboratory (NTRU) 11 4.9–590 75 11 4.8–490 51 12 5.6–400 84Total suspended solids (mg/L) 11 <15.0–1,600 136 11 <15.0–1,320 75.0 12 <15.0–1,370 199Suspended sediment (mg/L) 11 6.00–1,820 182 11 5.00–1,440 83.5 12 8.00–1,480 209
Dissolved solids and major ionsDissolved solids (mg/L) 11 122–888 278 11 94.0–1,870 308 12 112–2,190 324Calcium (mg/L) 11 20.6–105 32 11 19.6–120 45.1 12 19.3–109 40.9Magnesium (mg/L) 11 2.30–19.7 5.00 11 2.90–21.2 6.90 12 2.50–19.7 7.00Potassium (mg/L) 11 2.50–7.70 3.40 11 1.90–4.00 2.90 12 2.70–8.30 4.30Sodium (mg/L) 11 14.3–190 32.3 11 11.8–521 39.4 12 13.8–623 51.7Chloride (mg/L) 11 19.0–300 53.0 11 13.0–884 56.0 12 17.0–1,020 67.3Sulfate (mg/L) 11 14.0–114 31.0 11 19.0–99.9 45.0 12 17.0–123 48.0
Nutrients and carbonAmmonia plus organic, total, as nitrogen (mg/L) 11 1.00–5.70 2.00 11 0.60–3.10 1.50 12 1.30–4.20 1.95Nitrite plus nitrate as nitrogen, dissolved (mg/L) 11 0.49–3.13 1.12 11 0.32–1.37 0.70 12 0.70–4.14 1.45Ammonia, as nitrogen (mg/L) 11 0.02–0.20 0.10 11 <0.02–0.20 0.12 12 0.02–0.50 0.21Total nitrogen (mg/L)1 11 2.15–6.31 3.19 11 1.30–3.80 2.41 12 2.63–5.54 4.24Orthophosphorus, as phosphorus (mg/L) 11 <0.05–0.52 0.11 11 <0.05–0.08 <0.05 10 <0.05–0.48 0.30Dissolved phosphorus (mg/L) 11 <0.05–0.60 0.14 11 <0.05–0.14 <0.05 12 <0.05–0.57 0.34Total phosphorus (mg/L) 11 0.18–1.87 0.63 11 <0.05–1.04 0.18 12 0.17–1.45 0.55Particulate phosphorus (mg/L)2 11 0.05–1.77 0.43 11 <0.05–0.95 0.12 12 0.06–1.10 0.23Dissolved organic carbon (mg/L) 11 4.50–8.71 6.11 11 3.12–8.17 6.82 12 4.46–15.8 6.03Total organic carbon (mg/L) 11 6.90–43.0 13.7 11 4.40–29.6 9.50 12 6.70–32.5 12.0
Biochemical and bacteriaBiochemical oxygen demand (mg/L) 10 <2.0–14 8.0 10 3.0–10 5.5 11 4.0–13 8.0Chemical oxygen demand (mg/L) 11 31–167 60 11 30–115 37 12 29–137 58Enterococci (col/100 mL) 10 41–95,000 11,000 10 10–110,000 7,800 11 10–25,000 13,000Escherichia coli (col/100 mL) 10 31–63,000 5,600 10 20–33,000 6,600 11 <10–33,000 6,400Fecal coliform (col/100 mL) 11 41–42,000 5,000 11 30–55,000 3,900 12 20–55,000 4,200
1Calculated as the sum of nitrite plus nitrate, dissolved, and ammonia plus organic, total.2Calculated as the difference between total phosphorus and dissolved phosphorus.

Environmental Conditions in Indian Creek 33
average, between the before-upgrade (2004 through 2007; mean=15.4 mg/L; range=14.7–16.8 mg/L) and after-upgrade (2010 through 2013; mean=8.4 mg/L; range=6.2–9.2 mg/L) periods. Annual mean wastewater effluent TN concentra-tions were below the NPDES permit goal (less than or equal to 8.0 mg/L) in 2010; during 2011 through 2013, annual mean TN concentrations exceeded the goal concentration by 11 to 14 percent (fig. 7A). Annual mean TN concentration in the Tomahawk Creek WWTF effluent, where nitrogen is not removed by treatment processes, generally were similar during 2004 through 2013 and ranged from 15.0 to 18.2 mg/L (mean=16.3 mg/L) (fig. 7B).
Effluent TP concentrations at the Middle Basin WWTF decreased by about 59 percent, on average, between the before-upgrade (mean=3.2 mg/L; range=2.9–3.6 mg/L) and after-upgrade periods (mean=1.3 mg/L; range=1.3–1.6 mg/L). Annual mean wastewater effluent TP concentrations were below the NPDES permit goal (less than or equal to 1.5 mg/L)
during 2010, 2012, and 2013; TP concentrations exceeded the goal concentration by about 38 percent in 2011 (fig. 7A). During 2011, there was no means of TP removal at the Middle Basin WWTF, in part because of mechanical failure with the fermenter that runs the BNR process (Johnson County Wastewater, written commun., 2014). Annual mean TP con-centration in the Tomahawk Creek WWTF effluent decreased by about 65 percent, on average, between the before-CEPT (2004 through 2008; mean=4.0 mg/L; range=3.9–4.4 mg/L) and after-CEPT (2010 through 2013; mean=1.4 mg/L; range=1.3–1.6 mg/L) periods. The NPDES permit for the Tomahawk Creek WWTF does not include nutrient concentra-tion goals; however, annual mean TP concentrations did not exceed 1.5 mg/L during 2011 through 2013 (fig. 7B).
Annual TN and TP loads from the WWTFs reflected pat-terns in discharge volume and nutrient concentration (fig. 7, table 2). In general, nutrient loads from the Middle Basin WWTF were larger than loads from the Tomahawk Creek
Figure 7. Annual mean wastewater effluent total nitrogen and phosphorus concentrations and loads at the Middle Basin and Tomahawk Creek Wastewater Treatment Facilities during 2004 through 2013. A, Middle Basin nutrient concentrations; B, Tomahawk Creek nutrient concentrations; C, Middle Basin nutrient loads; and D, Tomahawk Creek nutrient loads. [NPDES, National Pollutant Discharge Elimination System]
Total nitrogen (TN)
A. Middle Basin B. Tomahawk
C. Middle Basin D. Tomahawk
NPDES permit TN goalNPDES permit TN goal
Annu
al m
ean
tota
l con
cent
ratio
n,
in m
illig
ram
s pe
r lite
rAn
nual
tota
l loa
d, in
tons
0
2004 20
05 2006
2007
2008
2009
2010 20
1120
12 2013
2004 20
05 2006
2007
2008
2009
2010 20
1120
12 2013
5
10
15
20
Potential Middle Basin TN load at permitted design capacity
Potential Middle Basin TN load at permitted design capacity
0
2
4
6
8
10
12
14
16
18
20
0
50
100
150
200
250
300
Before chemically enhanced primary
treatment (2004−08)
After chemically enhanced primary
treatment (2010−13)
Before MiddleBasin upgrade
(2004−07)
After Middle Basin upgrade
(2010−13)
0
50
100
150
200
250
300
NPDES permit TP goalNPDES permit TP goal
Total phosphorus (TP)
Potential Middle Basin TP load at permitted design capacity
Potential Middle Basin TP load at permitted design capacity

34 Effects of Wastewater Effluent Discharge on Indian Creek, Johnson County, Kansas
WWTF because of the higher volume of effluent processed; however, differences in load between the two facilities were less pronounced during the after-upgrade period because of the changes in treatment processes. Total nitrogen loads from the Middle Basin WWTF decreased by about 42 percent between the before- and after-upgrade periods (fig. 7C). In contrast, TN loads from the Tomahawk Creek WWTF increased by about 42 percent during the same time period (fig. 7D). Efflu-ent discharge volume increased at both facilities by about 2 ft3/s between the before- and after-upgrade periods (table 2). Substantial decreases in TN loads at the Middle Basin WWTF, despite increases in wastewater effluent discharge volume, reflect the addition of BNR at the facility. Total phospho-rus loads from both WWTFs decreased by about 54 percent between the before- and after-upgrade periods (fig. 7C, D), indicating that BNR and CEPT were effective at reducing phosphorus in the effluent from these facilities.
During 2010 through 2013, annual wastewater efflu-ent discharge from the upgraded Middle Basin WWTF was about 75 percent of the permitted design capacity (22.4 ft3/s) (table 2). Potential maximum loads were calculated using the permitted design capacity of the upgraded WWTF and the NPDES permit TN and TP concentration goals (8.0 and 1.5 mg/L, respectively). These are theoretical maxima and assume the WWTF is continuously operated at permitted design capacity and that nutrient concentrations in effluent remain similar to permit goal concentrations. Potential maxi-mum TN and TP loads are about 27 percent and 38 percent lower on average, respectively, than the annual loads before capacity upgrades; therefore, the addition of BNR to the Middle Basin WWTF will decrease overall nutrient loads from the facility relative to pre-capacity upgrade loads even if the facility is continuously operated at 22.4 ft3/s.
Nutrient Concentrations Upstream and Downstream from Wastewater Treatment Facilities
Nutrients in wastewater effluent typically are inorganic (for example, nitrate and orthophosphorus) and dissolved. At stream sites influenced by wastewater effluent, concentrations of dissolved constituents typically decrease as streamflow increases because of dilution, and concentrations of suspended constituents increase with streamflow because of transport. At stream sites affected by nonpoint or urban sources, con-centrations of all constituents tend to increase with increased streamflow (Welch and Lindell, 1992). Changes in nutrient concentrations with streamflow at the Indian Creek study sites reflect the effect of dominant sources. At the upstream sites (119th and Tomahawk), nutrient concentrations generally increased with increasing streamflow, indicating the relative contribution of urban sources to overall nutrient loads (fig. 8). In contrast, at the sites located downstream from WWTFs, dissolved nutrient concentrations decreased and suspended organic nutrient concentrations (total ammonia plus organic nitrogen and particulate phosphorus) increased with increasing streamflow. Total nutrient concentrations initially decreased
with streamflow as the nutrient contribution from wastewater effluent was diluted, and then increased as the proportion of nutrients contributed by urban sources during runoff increased (fig. 8). These patterns were consistent at all WWTF influ-enced sites, regardless of distance downstream from waste-water effluent discharges.
In general, nitrogen concentrations increased and phos-phorus concentrations decreased between the before- and after-upgrade periods at the State Line site (table 5). During below-normal streamflows, median TN during the after-upgrade period (9.0 mg/L) was about 22 percent higher than during the before-upgrade period (7.24 mg/L). In contrast, median TP concentration was about 43 percent lower during the after-upgrade period (0.90 mg/L) than the before-upgrade period (1.38 mg/L). Differences in nutrient concentrations at the State Line site likely reflect streamflow conditions when discrete samples were collected. Wastewater contributed about 22 percent more to streamflow during after-upgrade discrete sample collection than before-upgrade discrete sample col-lection (table 5), likely contributing to the higher nitrogen concentrations observed during the after-upgrade period. In addition, TN concentrations only decreased in effluent from the Middle Basin WWTF. Total phosphorus concentrations in effluent from the Middle Basin and Tomahawk Creek WWTFs substantially decreased between the before- and after-upgrade periods (fig. 7A, B); this decrease is reflected in lower TP concentrations at the State Line site during the after-upgrade period despite larger wastewater contributions to streamflow.
Total and dissolved nutrient concentrations downstream from the WWTFs were 10 to 100 times higher than at the upstream sites during below-normal and normal streamflows (fig. 8, table 6). At the downstream sites, nitrate comprised about 80 to 90 percent of the total nitrogen concentrations dur-ing below-normal and normal streamflows, compared to about 15 to 20 percent at the upstream sites (fig. 9). Differences in the relative contribution of orthophosphorus to total phospho-rus were not as pronounced (median range=75–100 percent), likely due in part to the large number of phosphorus concen-trations at or below the laboratory reporting level (0.05 mg/L) at the upstream sites (table 6). Nutrient concentrations also were higher downstream from the WWTFs than at the upstream sites during above-normal streamflows, but differ-ences were less pronounced (as much as 7 times higher). In general, nitrate and orthophosphorus comprised less than half of the total nutrient concentrations at all sites during above-normal streamflows.
There was a clear pattern in total and dissolved nutri-ent concentrations along the upstream-downstream gradi-ent in Indian Creek, particularly during below-normal and normal streamflow conditions (figs. 6F and 8, table 6). In general, nutrient concentrations were elevated immediately downstream from the Middle Basin WWTF discharge, then decreased with increasing downstream distance until reach-ing the Tomahawk Creek WWTF discharge into Indian Creek. Nutrient concentrations generally increased by an order of magnitude or more between the upstream 119th site

Environmental Conditions in Indian Creek 35
Figure 8. Relations between nutrient concentrations and streamflow at all Indian Creek study sites, June 2011 through June 2013. A, total nitrogen; B, total phosphorus; C, nitrate plus nitrite; D, orthophosphorus; E, total ammonia plus organic nitrogen; and F, particulate phosphorus. [TMDL, total maximum daily load]
0.1
1
10
100
Tota
l nitr
ogen
, in
mill
igra
ms
per l
iter
Nitr
ate
plus
nitr
ite,
in m
illig
ram
s pe
r lite
r as
nitro
gen
Tota
l am
mon
ia p
lus
orga
nic
nitro
gen,
in
mill
igra
ms
per l
iter
Orth
opho
spho
rus,
in m
illig
ram
s pe
r lite
r as
phos
phor
usTo
tal p
hosp
horu
s, in
mill
igra
ms
per l
iter
0.01
0.10
1
10
0.01
0.10
1
10
100
0.1 1 10 100 1,000 10,000
0.1 1 10 100 1,000 10,000 0.1 1 10 100 1,000 10,000
0.1 1 10 100 1,000 10,000
Streamflow, in cubic feet per second
U.S. Environmental ProtectionAgency Level III Ecoregion 40Reference Conditions
0.1 1 10 100 1,000 10,000
0.1 1 10 100 1,000 10,000
0.01
0.10
1
10
0.10
1
10
Parti
cula
teph
osph
orus
,in
mill
igra
ms
perl
iter
0.01
0.10
1
10
A
C D
E F
B
Kansas Departmentof Health and Environmentalmedian value for 303(d) listing
Kansas Departmentof Health and Environmentalnitrate TMDL endpoint for Indian Creek
U.S. Environmental Protection Agency Level III Ecoregion 40 Reference Conditions
EXPLANATION
119th
College
Marty
Mission Farms
Tomahawk
State Line
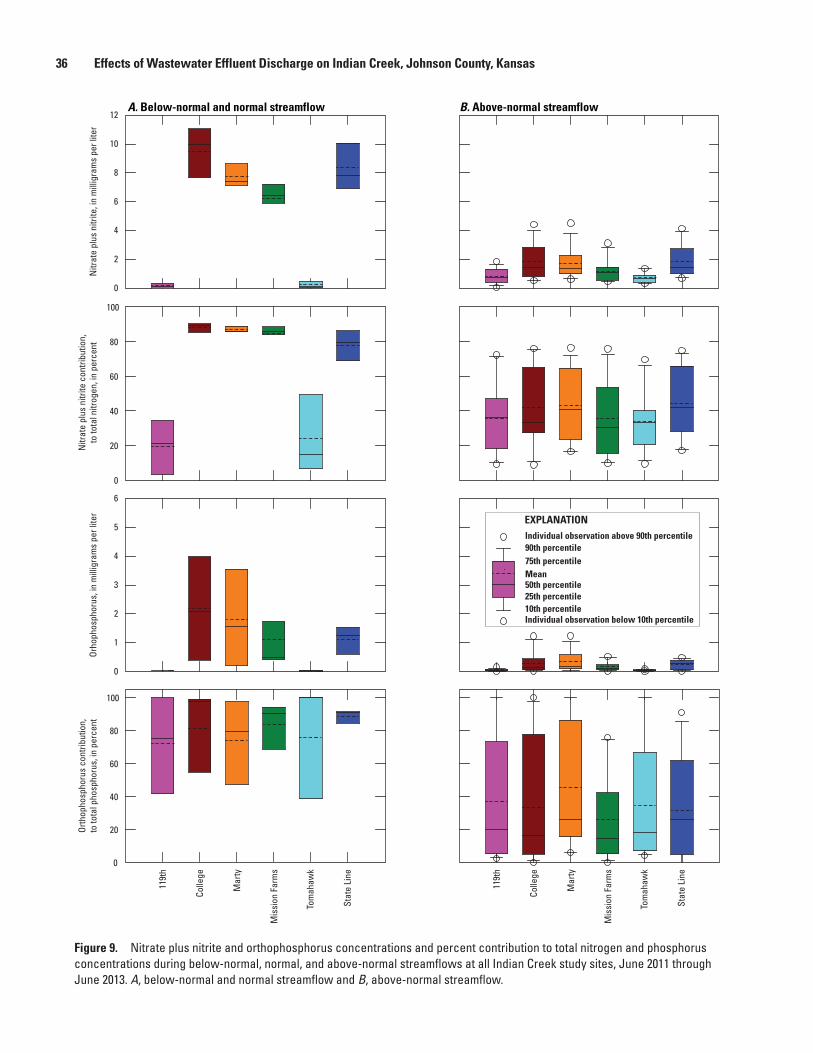
36 Effects of Wastewater Effluent Discharge on Indian Creek, Johnson County, Kansas
Figure 9. Nitrate plus nitrite and orthophosphorus concentrations and percent contribution to total nitrogen and phosphorus concentrations during below-normal, normal, and above-normal streamflows at all Indian Creek study sites, June 2011 through June 2013. A, below-normal and normal streamflow and B, above-normal streamflow.
A. Below-normal and normal streamflow B. Above-normal streamflow
0
20
40
60
80
100
0
2
4
6
8
10
12
0
1
2
3
4
5
6
0
20
40
60
80
100
Nitr
ate
plus
nitr
ite, i
n m
illig
ram
s pe
r lite
rOr
hoph
osph
orus
, in
mill
igra
ms
per l
iter
Nitr
ate
plus
nitr
ite c
ontri
butio
n,
to to
tal n
itrog
en, i
n pe
rcen
tOr
thop
hosp
horu
s co
ntrib
utio
n,
to to
tal p
hosp
horu
s, in
per
cent
119t
h
Colle
ge
Mar
ty
Mis
sion
Far
ms
Tom
ahaw
k
Stat
e Li
ne
119t
h
Colle
ge
Mar
ty
Mis
sion
Far
ms
Tom
ahaw
k
Stat
e Li
ne
EXPLANATIONIndividual observation above 90th percentile90th percentile75th percentile
50th percentile25th percentile10th percentileIndividual observation below 10th percentile
Mean
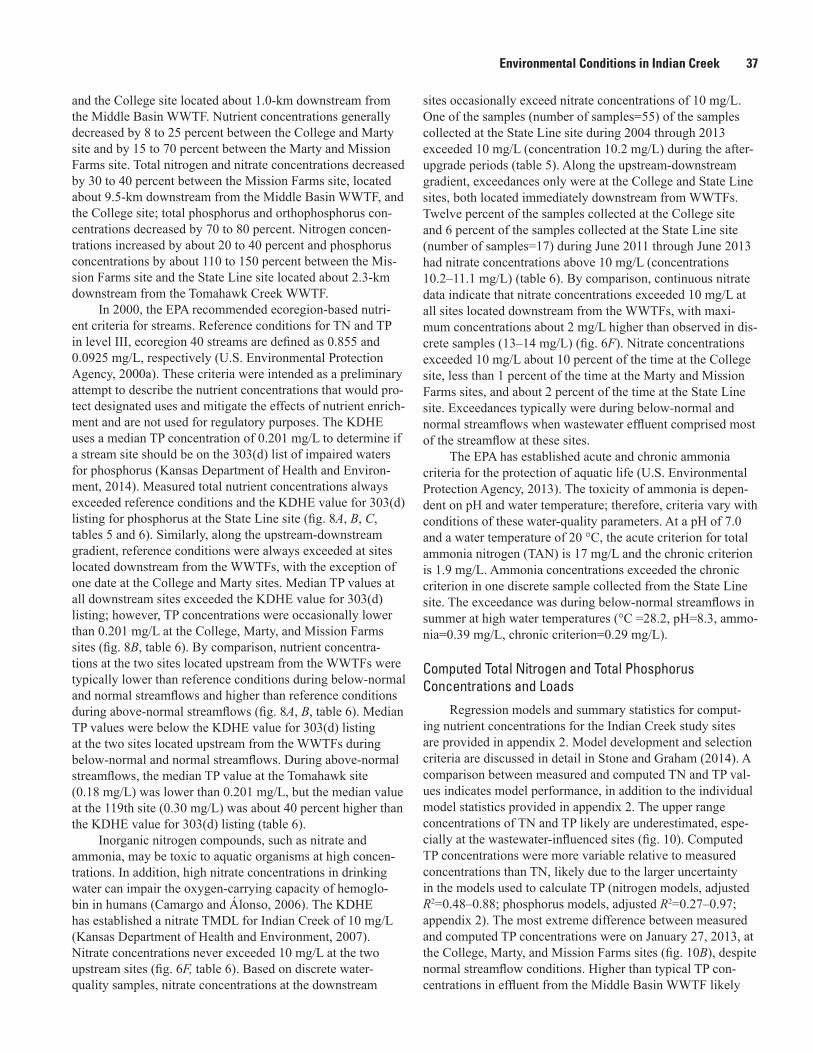
Environmental Conditions in Indian Creek 37
and the College site located about 1.0-km downstream from the Middle Basin WWTF. Nutrient concentrations generally decreased by 8 to 25 percent between the College and Marty site and by 15 to 70 percent between the Marty and Mission Farms site. Total nitrogen and nitrate concentrations decreased by 30 to 40 percent between the Mission Farms site, located about 9.5-km downstream from the Middle Basin WWTF, and the College site; total phosphorus and orthophosphorus con-centrations decreased by 70 to 80 percent. Nitrogen concen-trations increased by about 20 to 40 percent and phosphorus concentrations by about 110 to 150 percent between the Mis-sion Farms site and the State Line site located about 2.3-km downstream from the Tomahawk Creek WWTF.
In 2000, the EPA recommended ecoregion-based nutri-ent criteria for streams. Reference conditions for TN and TP in level III, ecoregion 40 streams are defined as 0.855 and 0.0925 mg/L, respectively (U.S. Environmental Protection Agency, 2000a). These criteria were intended as a preliminary attempt to describe the nutrient concentrations that would pro-tect designated uses and mitigate the effects of nutrient enrich-ment and are not used for regulatory purposes. The KDHE uses a median TP concentration of 0.201 mg/L to determine if a stream site should be on the 303(d) list of impaired waters for phosphorus (Kansas Department of Health and Environ-ment, 2014). Measured total nutrient concentrations always exceeded reference conditions and the KDHE value for 303(d) listing for phosphorus at the State Line site (fig. 8A, B, C, tables 5 and 6). Similarly, along the upstream-downstream gradient, reference conditions were always exceeded at sites located downstream from the WWTFs, with the exception of one date at the College and Marty sites. Median TP values at all downstream sites exceeded the KDHE value for 303(d) listing; however, TP concentrations were occasionally lower than 0.201 mg/L at the College, Marty, and Mission Farms sites (fig. 8B, table 6). By comparison, nutrient concentra-tions at the two sites located upstream from the WWTFs were typically lower than reference conditions during below-normal and normal streamflows and higher than reference conditions during above-normal streamflows (fig. 8A, B, table 6). Median TP values were below the KDHE value for 303(d) listing at the two sites located upstream from the WWTFs during below-normal and normal streamflows. During above-normal streamflows, the median TP value at the Tomahawk site (0.18 mg/L) was lower than 0.201 mg/L, but the median value at the 119th site (0.30 mg/L) was about 40 percent higher than the KDHE value for 303(d) listing (table 6).
Inorganic nitrogen compounds, such as nitrate and ammonia, may be toxic to aquatic organisms at high concen-trations. In addition, high nitrate concentrations in drinking water can impair the oxygen-carrying capacity of hemoglo-bin in humans (Camargo and Álonso, 2006). The KDHE has established a nitrate TMDL for Indian Creek of 10 mg/L (Kansas Department of Health and Environment, 2007). Nitrate concentrations never exceeded 10 mg/L at the two upstream sites (fig. 6F, table 6). Based on discrete water-quality samples, nitrate concentrations at the downstream
sites occasionally exceed nitrate concentrations of 10 mg/L. One of the samples (number of samples=55) of the samples collected at the State Line site during 2004 through 2013 exceeded 10 mg/L (concentration 10.2 mg/L) during the after-upgrade periods (table 5). Along the upstream-downstream gradient, exceedances only were at the College and State Line sites, both located immediately downstream from WWTFs. Twelve percent of the samples collected at the College site and 6 percent of the samples collected at the State Line site (number of samples=17) during June 2011 through June 2013 had nitrate concentrations above 10 mg/L (concentrations 10.2–11.1 mg/L) (table 6). By comparison, continuous nitrate data indicate that nitrate concentrations exceeded 10 mg/L at all sites located downstream from the WWTFs, with maxi-mum concentrations about 2 mg/L higher than observed in dis-crete samples (13–14 mg/L) (fig. 6F). Nitrate concentrations exceeded 10 mg/L about 10 percent of the time at the College site, less than 1 percent of the time at the Marty and Mission Farms sites, and about 2 percent of the time at the State Line site. Exceedances typically were during below-normal and normal streamflows when wastewater effluent comprised most of the streamflow at these sites.
The EPA has established acute and chronic ammonia criteria for the protection of aquatic life (U.S. Environmental Protection Agency, 2013). The toxicity of ammonia is depen-dent on pH and water temperature; therefore, criteria vary with conditions of these water-quality parameters. At a pH of 7.0 and a water temperature of 20 °C, the acute criterion for total ammonia nitrogen (TAN) is 17 mg/L and the chronic criterion is 1.9 mg/L. Ammonia concentrations exceeded the chronic criterion in one discrete sample collected from the State Line site. The exceedance was during below-normal streamflows in summer at high water temperatures (°C =28.2, pH=8.3, ammo-nia=0.39 mg/L, chronic criterion=0.29 mg/L).
Computed Total Nitrogen and Total Phosphorus Concentrations and Loads
Regression models and summary statistics for comput-ing nutrient concentrations for the Indian Creek study sites are provided in appendix 2. Model development and selection criteria are discussed in detail in Stone and Graham (2014). A comparison between measured and computed TN and TP val-ues indicates model performance, in addition to the individual model statistics provided in appendix 2. The upper range concentrations of TN and TP likely are underestimated, espe-cially at the wastewater-influenced sites (fig. 10). Computed TP concentrations were more variable relative to measured concentrations than TN, likely due to the larger uncertainty in the models used to calculate TP (nitrogen models, adjusted R2=0.48–0.88; phosphorus models, adjusted R2=0.27–0.97; appendix 2). The most extreme difference between measured and computed TP concentrations were on January 27, 2013, at the College, Marty, and Mission Farms sites (fig. 10B), despite normal streamflow conditions. Higher than typical TP con-centrations in effluent from the Middle Basin WWTF likely

38 Effects of Wastewater Effluent Discharge on Indian Creek, Johnson County, Kansas
resulted in higher in-stream concentrations during this time period. Computed TP values for this date are more typical of the values observed under normal flow conditions.
Computed nutrient concentrations during July 2011 through June 2013 were highest at the sites located down-stream from the WWTFs (fig. 11). Median TN concentrations at the downstream sites (6.1–9.2 mg/L) were 6 to 9 times higher than at the upstream sites (0.98–1.0 mg/L) (fig. 11A). The TN concentrations at the College site, immediately downstream from the Middle Basin WWTF, exceeded all other sites approximately 20 percent of the time and concentrations at the State Line site exceeded all other sites approximately 80 percent of the time throughout the study period. Similar to the pattern observed in continuously measured nitrate data and discretely collected nitrogen samples (fig. 6F, table 6), total nitrogen concentrations typically were highest at the sites located immediately downstream from the WWTFs and decreased as distance from the WWTFs increased. Median TP concentrations at the downstream sites (0.78–1.1 mg/L) were 13 to 28 times higher than at the upstream sites (0.04 to 0.06 mg/L). Patterns in TP along the upstream-downstream gradient were not as clear as for TN. In contrast to discretely measured phosphorus concentrations, which followed a simi-lar pattern to nitrogen (table 6), median computed TP con-centrations generally increased in the downstream direction. Computed TP concentrations at the Mission Farms and State Line sites exceeded concentrations at all other sites nearly 100 percent of the time, with State Line exceeding Mission Farms approximately 50 percent of the time throughout the study period. Differences in nitrogen and phosphorus pat-terns along the upstream-downstream gradient may be due to uncertainties in computed TP concentrations or differences in dynamics of transport and uptake.
Nutrient loads at the State Line site were calculated for all years with a complete continuous record (2005 through 2012). Calculated TN and TP loads for the State Line site generally were similar to those estimated by Rasmussen and others (2014) using regression models developed for the site in 2008 (Rasmussen and others, 2008). Total nitrogen loads at the State Line site ranged from 354 tons in 2006 to 683 tons in 2010 (fig. 12A). The upstream WWTFs contrib-uted between 33 (2010) and 97 (2006) percent to TN loads. In general, wastewater contributed a larger percentage to TN loads in years with lower streamflows and other urban sources contributed a larger percentage in years with higher streamflows. Annual mean streamflow in 2010 was one of the highest recorded during 2005 through 2012, and the 2010 TN load was the highest observed during the study period. During 2010, about 67 percent of the TN load was from other urban sources. In contrast, during 2006, annual mean stream-flow was one of the lowest recorded, TN load was the lowest observed, and nearly 100 percent of the TN load was from WWTFs (fig. 12A, table 2). Despite substantial decreases in TN loads from the Middle Basin WWTF (fig. 7C), there were no clear patterns in annual TN loads with respect to changes in treatment processes at the WWTFs, likely due in part because
of high among-year variability in streamflow; however, note that despite generally similar streamflows during 2006 (before upgrade) and 2011 and 2012 (after upgrade), the WWTFs contributed substantially less (58 to 65 percent) to TN loads in 2011 and 2012 than during 2006 (97 percent) (fig. 12A, table 2).
Total phosphorus loads at the State Line site ranged from 68 tons in 2012 to 127 tons in 2008 (fig. 12B). Cor-respondingly, 2012 had the lowest annual mean streamflow and 2008 had the highest streamflow during 2005 through 2012 (table 2). The upstream WWTFs contributed between 29 (2010) and about 100 (2006) percent to TP loads. As observed with TN, despite substantial decreases in TP loads from the Middle Basin and Tomahawk Creek WWTFs (fig. 7C, D), there were no clear patterns in annual TP loads with respect to changes in treatment processes, likely due in part because of high among-year variability in streamflow; however, like TN, despite generally similar streamflows and annual TP loads dur-ing 2006 (before upgrade) and 2011 and 2012 (after upgrade), the WWTFs contributed substantially less (35 to 57 percent) to TP loads in 2011 and 2012 than during 2006 (100 percent) (fig. 12B, table 2).
Nutrient loads for all sites were calculated for the periods July 2011 through June 2012 (Year 1) and July 2012 through June 2013 (Year 2). Overall, total nutrient loads were about 20 percent larger during Year 2 than Year 1 (fig. 13, table 7). This increase corresponded with an approximately 22 percent increase in streamflow between the 2 years. Total nutrient loads increased along the upstream-downstream gradient; the largest increases were between sites located immediately upstream and downstream from the WWTFs (between the 119th and College sites and the Mission Farms and State Line sites).
Total nitrogen loads were about 1.8 times higher at the Tomahawk site (58–78 tons) than the 119th site (33–43 tons) (fig. 13A, table 7), a difference that corresponds with the larger drainage area and higher streamflows at the Tomahawk site (fig. 3, table 1). Total nitrogen loads at the College site (191–203 tons), downstream from the Middle Basin WWTF, were between 3 and 6 times higher than at the upstream sites. Total nitrogen loads at the State Line site (448–539 tons), located downstream from both WWTFs, were between 7 and 13 times higher than at the upstream sites. Along the upstream-downstream gradient, TN loads increased by about 5 to 6 times between the 119th and College sites, about 1.2 times between the College and Mission Farms sites, and about 2 times between the Mission Farms and State Line sites (fig. 13A, table 7). The contribution of wastewater to TN loads decreased in the downstream direction, with the high-est percentages at the College site (63–74 percent) and the lowest at the State Line site (50–62 percent) (fig. 13A). During Year 1, the largest TN loads originated from the WWTFs rather than from other urban sources during stormwater runoff. About 278 tons (62 percent) of the TN at the State Line site originated from the WWTFs. During Year 2, about one-half of the TN load at the State Line site (539 tons) originated from
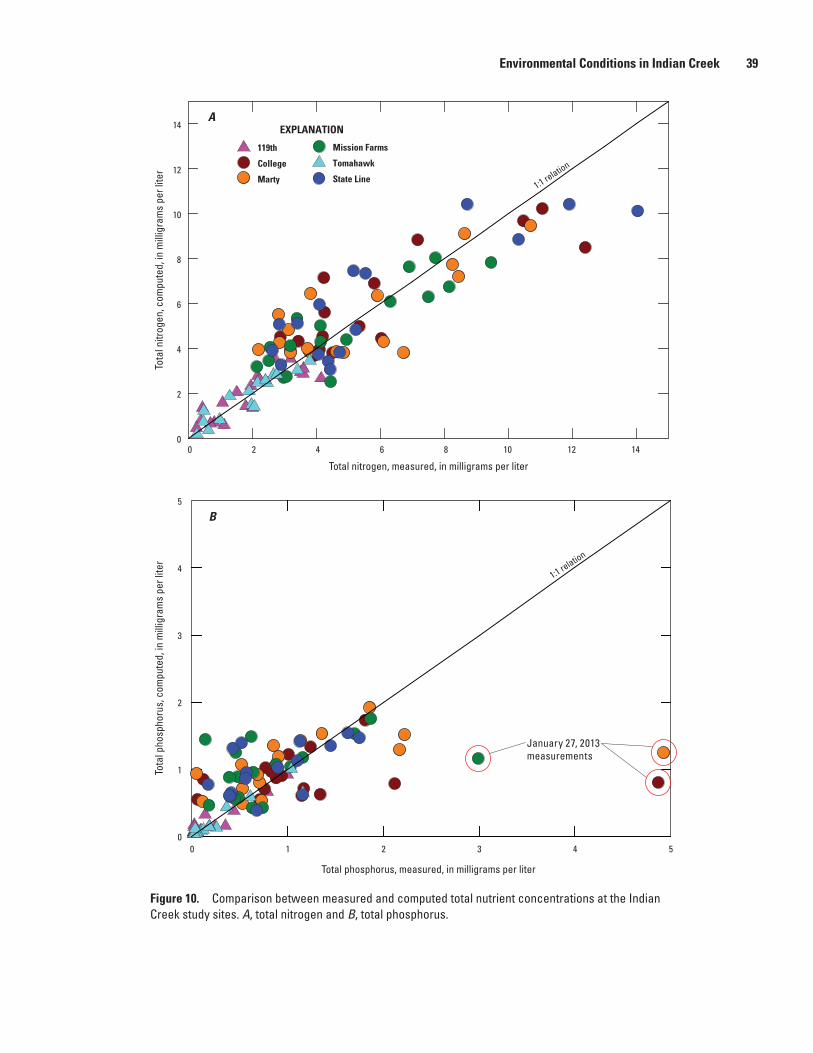
Environmental Conditions in Indian Creek 39
Figure 10. Comparison between measured and computed total nutrient concentrations at the Indian Creek study sites. A, total nitrogen and B, total phosphorus.
0
2
4
6
8
10
12
14
0 2 4 6 8 10 12 14
Total nitrogen, measured, in milligrams per liter
Total phosphorus, measured, in milligrams per liter
Tota
l nitr
ogen
, com
pute
d, in
mill
igra
ms
per l
iter
Tota
l pho
spho
rus,
com
pute
d, in
mill
igra
ms
per l
iter
0 1 2 3 4 50
1
2
3
4
5
A
B
1:1 relation
1:1 relation
EXPLANATION
119th
College
Marty
Mission Farms
Tomahawk
State Line
January 27, 2013measurements

40 Effects of Wastewater Effluent Discharge on Indian Creek, Johnson County, Kansas
Figure 11. Duration curves for computed total nutrient concentrations at the Indian Creek study sites, July 2011 through June 2013. A, computed total nitrogen and B, computed total phosphorus.
0 20 40 60 80 1000
5
10
15
20
25
30
EXPLANATION119thCollegeMartyMission FarmsTomahawkState line
Com
pute
d to
tal n
itrog
en, i
n m
illig
ram
s pe
r lite
rCo
mpu
ted
tota
l pho
spho
rus,
in m
illig
ram
s pe
r lite
r
Frequency of exceedence, in percent
Frequency of exceedence, in percent
A
B
0
0.5
1.0
1.5
2.0
2.5
3.0
0 20 40 60 80 100
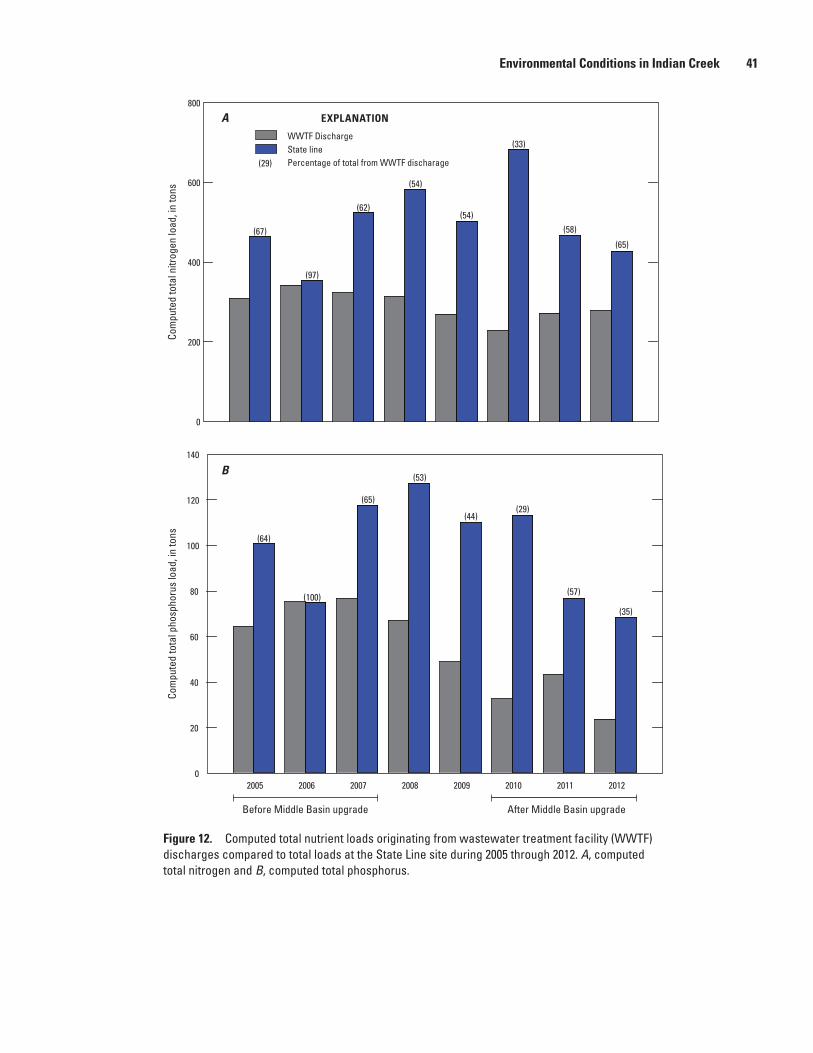
Environmental Conditions in Indian Creek 41
Figure 12. Computed total nutrient loads originating from wastewater treatment facility (WWTF) discharges compared to total loads at the State Line site during 2005 through 2012. A, computed total nitrogen and B, computed total phosphorus.
A
B
(67)
(97)
(62)
(54)
(54)
(33)
(58)
(65)
0
200
400
600
800
Com
pute
d to
tal n
itrog
en lo
ad, i
n to
nsCo
mpu
ted
tota
l pho
spho
rus
load
, in
tons (64)
(100)
(65)
(53)
(44)(29)
(57)
(35)
0
20
40
60
80
100
120
140
Before Middle Basin upgrade After Middle Basin upgrade
2005 2006 2007 2008 2009 2010 2011 2012
(29)
EXPLANATION
WWTF DischargeState linePercentage of total from WWTF discharage

42 Effects of Wastewater Effluent Discharge on Indian Creek, Johnson County, Kansas
Figure 13. Computed total nutrient loads originating from wastewater treatment facility (WWTF) discharges compared to total loads at the Indian Creek study sites during July 2011 through June 2012 and July 2012 through June 2013. A, computed total nitrogen and B, computed total phosphorus.
Cross-hatch pattern indicates upstream site. All others are downstream sites.
0
100
200
300
400
500
600
Com
pute
d to
tal n
itrog
en lo
ad, i
n to
nsCo
mpu
ted
tota
l pho
spho
rus
load
, in
tons
(74)(67) (65)
(62)
(63)
(55) (53)
(50)
July 2011 to June 2012 July 2012 to June 2013
(84)
(57)
(48)
(41)
(55)
(34)
(30)
(29)
0
20
40
60
80
100
A
B
119th (other urban sources)Middle Basin WWTFCollegeMartyMission Farms
(29)
Tomahawk Creek WWTFTomahawk (other urban sources)State line
EXPLANATION
Percentage of total from WWTF discharage

Environmental Conditions in Indian Creek 43
Table 7. Computed loads for total nitrogen and phosphorus at the Indian Creek study sites, July 2011 through June 2013.
[WWTF, wastewater treatment facility]
119thMiddle Basin WWTF
College MartyMission Farms
Tomahawk Creek WWTF
TomahawkState Line
July 1, 2011–June 30, 2012
Total nitrogen load, tons 33 141 191 211 218 137 58 448
Total phosphorus load, tons 6.3 22 26 38 46 9.6 9.2 76
July 1, 2012–June 30, 2013
Total nitrogen load, tons 43 129 203 234 244 139 78 539
Total phosphorus load, tons 8.0 16 28 46 52 11 11 92
the WWTFs and about one-half originated from other urban sources. Based on the 2005 to 2012 loads for the State Line site, most of the TN loads in the Indian Creek Basin typi-cally originate from the WWTFs, except during years with high streamflows (fig. 12A, table 2). The largest TN loads in Year 1 and Year 2 were in May and were associated with two large runoff events each year. May loads accounted for about 26 percent of the annual load at the upstream sites during Year 1 and about 40 percent during Year 2 (appendix 5). At the downstream sites, May loads accounted for about 17 per-cent of total loads in Year 1 and about 40 percent in Year 2. Monthly nitrogen loads originating from the WWTFs ranged from about 20 percent during months when streamflow was dominated by stormwater runoff (typically spring and early summer) to nearly 100 percent during drier months (typically late summer) (appendix 5).
Like TN, TP loads were about 1.5 times higher at the Tomahawk site (9 to 11 tons) than the 119th site (6–8 tons) (fig. 13B, table 7). Total phosphorus loads at the College site (26–28 tons) were between 2 and 5 times higher than at the upstream sites and loads at the State Line site (76–92 tons) were between 7 and 15 times higher. Along the upstream-downstream gradient, TP loads increased by about 4 to 5 times between the 119th and College sites, about 1.8 times between the College and Mission Farms sites, and about 1.8 times between the Mission Farms and State Line sites. The contribution of wastewater to TP loads decreased in the downstream direction, with the highest percentages at the Col-lege site (55–84 percent) and the lowest at the State Line site (29–41 percent) (fig. 13B). During Year 1, the largest TP loads at the College and Marty sites originated from the Middle Basin WWTFs, and about half the load at the Mission Farms site originated from the WWTF. By comparison, the largest TP load at the State Line site originated from other urban sources; about 31 tons (41 percent) of the phosphorus at the State Line site originated from the WWTFs. During Year 2, the College site was the only site where the largest TP load was derived from the WWTF; the largest loads at all other downstream sites originated from other urban sources. About 27 tons (29 percent) of the phosphorus at the State Line site originated
from the WWTFs during Year 2 (fig. 13B, table 7). Based on the 2005 to 2012 loads for the State Line site, most of the phosphorus load may originate from either WWTFs or other urban sources depending on streamflow conditions (fig. 12B, table 2). In general, the largest TP loads in Year 1 and Year 2 were in May and were associated with two large runoff events each year. May loads accounted for about 36 percent of the annual load at the upstream sites during Year 1 and about 53 percent during Year 2 (appendix 6). At the downstream sites, May loads accounted for about 20 percent of total loads in Year 1 and about 40 percent in Year 2. Monthly phospho-rus loads originating from the WWTFs ranged from about 4 percent during months when streamflow was dominated by stormwater runoff (typically spring and early summer) to nearly 100 percent during drier months (typically late summer) (appendix 6).
Biochemical Oxygen DemandBiochemical oxygen demand (BOD) measures organic
matter, which can support the growth of aquatic microor-ganisms and commonly is used to describe water-quality conditions (Cheremisinoff, 1995). Large concentrations of oxygen-demanding substances can substantially decrease oxygen concentrations in streams, thereby adversely affect-ing aquatic organisms. Pristine streams typically have a low BOD (less than 2.0 mg/L) and streams polluted by organic matter have increased BOD (greater than 13 mg/L; Van Dam and others, 1994; Porter, 2008). The BOD was not commonly measured during the before-upgrade and transitional periods at the State Line site, so data are not available to make mean-ingful comparisons with the after-upgrade period (table 5). Along the upstream-downstream gradient, BOD was less than 2 mg/L at all sites during below-normal and normal stream-flows, with the exception of State Line (range=4.0–8 mg/L; median=4.5 mg/L) (table 6). The BOD was higher (medi-ans=5.5–8 mg/L) at all sites during above-normal streamflows, and concentrations occasionally exceeded 13 mg/L at the Col-lege (maximum=15 mg/L), Marty (maximum=19 mg/L), and Mission Farms (maximum=14 mg/L) sites (table 6).

44 Effects of Wastewater Effluent Discharge on Indian Creek, Johnson County, Kansas
Indicator BacteriaFecal coliform, Escherichia coli, and enterococci are
the three most common types of bacteria used as indicators of pathogens in surface water. Indicator bacteria are used to evaluate the sanitary quality of water and its use as a public water supply and for recreational activities (American Public Health Association and others, 2005). Reducing the number of fecal indicator and other potentially pathogenic bacteria and microorganisms in wastewater effluent requires disinfec-tion. Many modern WWTFs include disinfection as part of the treatment process. The Middle Basin WWTF uses ultraviolet radiation (UV) for disinfection and the Tomahawk Creek WWTF uses chlorine. The UV disinfection is a physical, rather than chemical, process and there is no residual effect that can be harmful to humans or aquatic life (U.S. Environ-mental Protection Agency, 1999a). Chlorine disinfection is a chemical process that destroys bacteria and pathogens; how-ever, the chlorine residual may be toxic to aquatic life and the total dissolved solids and chloride content of wastewater may be increased (U.S. Environmental Protection Agency, 1999b). Total dissolved solids and chloride concentrations at the State Line site, downstream from the Middle Basin and Tomahawk Creek WWTFs, were not appreciably higher than the Indian Creek study sites downstream from the Middle Basin WWTF (tables 5 and 6), indicating chlorine disinfection did not have a substantial effect on these water-quality constituents. As a result of the disinfection process, most of the fecal indica-tor bacteria and other pathogenic microorganisms in Johnson County streams usually come from nonpoint or urban sources and concentrations are orders of magnitude greater dur-ing runoff events than below-normal or normal streamflows (Rasmussen and others, 2009b, 2014; Wilkison and others, 2009; Graham and others, 2010). Urban sources are likely the primary source of fecal indicator bacteria at all Indian Creek study sites. Median concentrations of fecal indicator bacteria were 1 to 3 orders of magnitude higher during above-normal streamflows than below-normal and normal streamflows dur-ing the before-upgrade and after-upgrade periods at the State Line site (table 5), and along the upstream-downstream gradi-ent in Indian Creek (table 6).
Organic Wastewater-Indicator CompoundsOrganic wastewater-indicator compounds (OWCs)
include a variety of synthetically and naturally derived com-pounds from sources such as industry, agriculture, and residen-tial activities (Kolpin and others, 2002). These compounds represent a diverse array of chemicals, including pesticides, steroids, and solvents (Focazio and others, 2008; Wilkison and others, 2009). Organic wastewater-indicator compounds are present in trace concentrations (generally less than 1 µg/L), but may have negative effects on aquatic life and humans through chronic exposure or the additive effects of exposure to multiple compounds (Kolpin and others, 2002; Kolpin and
others, 2004). Although regulatory standards do not exist for many OWCs (Focazio and others, 2008), they are com-pounds of concern because of their connection, albeit poorly understood, with abnormal physiology, impaired reproduc-tion, increased cancer rates, and general toxicity (Daughton and Ternes, 1999; Kolpin and others, 2002). Many OWCs are incompletely removed during the wastewater treatment pro-cess, and wastewater effluent is one of the main pathways for OWCs to enter the environment (Daughton and Ternes, 1999; Kolpin and others, 2002; Focazio and others, 2008). Organic wastewater-indicator compounds may be transported for long distances downstream from a source because of sorption, incomplete dilution, and slow degradation processes (Kolpin and others, 2002; Focazio and others, 2008).
Discrete stream-water samples collected from all six sites in April 2013 during normal to slightly above-normal stream-flow conditions were analyzed for a total of 60 OWCs. Of the compounds analyzed, 28 were detected at the Indian Creek sites, including pesticides, flavorings and fragrances, polyaro-matic hydrocarbons (PAHs), detergents, stimulants, solvents, disinfectants, plastics, and fire retardants (appendix 7). Ten compounds were detected at all six sites, and were pre-dominantly pesticides, PAHs, and fire retardants. Caffeine, a stimulant, was also detected at all sites; concentrations were small (less than or equal to 0.15 µg/L) except at the State Line site (1.1 µg/L). Eleven compounds (fragrances, pesticides, plastics, and disinfectants) were detected at only the four downstream sites; of these compounds, five had clear patterns with respect to the WWTFs. For example, triclosan, a disinfec-tant, was detected at the College site (0.1 µg/L), downstream from the Middle Basin WWTF. Triclosan concentrations decreased in the downstream direction with increased distance from the Middle Basin WWTF (Marty=0.06 µg/L, Mission Farms=0.02 µg/L) and then increased at the State Line site (0.19 µg/L), downstream from the Tomahawk Creek WWTF.
Streambed-Sediment Chemistry
Concentrations of some compounds are greater in sedi-ment than in the overlying water column (Horowitz, 1991). Contaminated sediment can be toxic to benthic organisms, including periphyton and macroinvertebrates, and contami-nants may bioaccumulate in fish and mammals (U.S. Envi-ronmental Protection Agency, 2000b). Streambed-sediment samples were collected for all Indian Creek sites during April 2013. All samples were analyzed for carbon, nutrients, trace elements, and organic wastewater-indicator compounds (appendixes 9 and 10). Because there are no set criteria for trace elements or OWCs in sediments, probable effect con-centrations (PECs) have been developed for some compounds (MacDonald and others, 2000). The PEC represents the concentration of a contaminant in streambed sediment that is expected to adversely affect benthic biota.

Environmental Conditions in Indian Creek 45
Nutrient concentrations in sediment were higher down-stream from the WWTFs. Total phosphorus concentration in the sediment was highest at the College site [1,800 milligrams per kilogram, (mg/kg)], decreased in the downstream direc-tion to Mission Farms (830 mg/kg), then increased at the State Line site (1,000 mg/kg). Sediment TP concentration at the Mission Farms site was similar to concentrations at the upstream sites (119th=750 mg/kg; Tomahawk=700 mg/kg). Total phosphorus concentrations in sediment exceeded mean background levels for the conterminous United States (1,000 mg/kg) at the College, Marty, and State Line sites (Horowitz and Stephens, 2008). Patterns in nitrogen along the upstream-downstream gradient were not as clear as phos-phorus, but ammonia plus organic nitrogen concentrations were three orders of magnitude larger downstream from the WWTFs than at the 119th site and 2–7 times larger than at the Tomahawk site (appendix 8). Background concentrations for nitrogen in sediment are not available for comparison. In general, sediment nutrient concentrations and patterns along the upstream-downstream gradient at the Indian Creek study sites match data previously collected in the drainage basin (Rasmussen and others, 2009b, 2012).
There were no clear patterns in concentrations of trace elements in sediment along the upstream-downstream gradi-ent in Indian Creek. Some elements, such as copper, had the highest concentrations at the College and State Line sites, immediately downstream from the WWTFs, whereas others, such as arsenic, cobalt, and nickel had the highest concentra-tions at the 119th and Tomahawk sites, upstream from the WWTFs (appendix 8). None of the measured trace elements exceeded the PECs for aquatic life; however, several elements (for example, cadmium, lead, copper, and zinc) had sedi-ment concentrations about 1.5 to 2 times higher than mean background levels for the conterminous United States at most sites (Horowitz and Stephens, 2008). Concentrations of trace elements above mean background levels in the Indian Creek Basin may be due to natural variability, local geology, or urbanization. Trace element concentrations were within the range of previously collected data in the drainage basin (Ras-mussen and others, 2009b, 2012).
Streambed-sediment samples were analyzed for 57 OWCs, 31 of which were detected (appendix 9). Detected compounds included pesticides, PAHs, sterols or stanols, detergents, plastics, disinfectants, and flavorings or fragrances. Sediment concentrations of most compounds were within the range of previously collected data in the drainage basin (Rasmussen and others, 2009b, 2012). The most frequently detected compounds at all sites were PAHs, which gener-ally are used in pavement sealants and indicate increased urbanization (Van Metre and others, 2008). Four PAHs [benzo(a)pyrene, fluoranthene, phenanthrene, and pyrene] were detected at concentrations above the PEC at the Marty, Mission Farms, and State Line sites, the three most down-stream sites (fig. 1). In Johnson County, PAHs in streambed sediment were highly negatively correlated with habitat scores
and benthic community diversity metrics and positively cor-related with urbanization and stormwater (Rasmussen and others, 2012).
Eleven compounds (fragrances, plastics, disinfectants, detergents, and sterols/stanols) were detected only at the four downstream sites; of these compounds, five had clear pat-terns with respect to the WWTFs (appendix 9). For example, 3-beta-coprostanol, a sterol/stanol that is frequently used as a biomarker for increased human fecal matter in the envi-ronment, was detected at the College site (3,600 µg/kg), downstream from the Middle Basin WWTF. Concentrations of 3-beta-coprostanol decreased in the downstream direc-tion with increased distance from the Middle Basin WWTF (Marty=2,500 µg/kg, Mission Farms=740 µg/kg) and then increased at the State Line site (2,000 µg/kg), downstream from the Tomahawk Creek WWTF.
Habitat
Habitat-quality evaluations integrate several factors that directly or indirectly affect the water-quality and biologi-cal condition of streams, and are a critical part of assessing ecological integrity (Barbour and others, 1996; Barbour and others, 1999). Degraded habitat conditions are one of the pri-mary stressors affecting the diversity and abundance of aquatic organisms in streams (Karr and others, 1986). Light intensity was evaluated using data collected continuously during Octo-ber 2011 through June 2013. Riparian and in-stream habitat characteristics were evaluated during July 2012.
Light Intensity
Light intensity at all sites followed typical seasonal pat-terns, with the highest intensity values in spring and summer and the lowest intensity values in fall and winter (fig. 14). Among-site differences in light intensity were most pro-nounced during spring and summer, when days are longer and streamside trees are fully leafed out. Patterns in light intensity along the upstream-downstream gradient varied seasonally, but in general intensity was lowest at the 119th site and highest at the State Line site. Overall, median light intensity at the State Line site [3,692 lumens per square meter; (lm/m2)] was about 62 percent higher than median light intensity at the 119th site (1,948 lm/m2); differences among other sites were less pronounced (medians 2,734–3,520 lm/m2) and ranged from 5 to 30 percent higher than at the 119th site. The difference in light conditions between the 119th and State Line sites reflect differences in canopy cover between sites (appendix 10). The relative canopy cover score decreased by about 33 percent between the 119th and State Line sites, indicating there was much less overhanging vegetation at the terminal downstream site than at the upstream site. Overall among-site differences in light intensity likely reflect canopy cover and possibly placement of the light sensors in the stream.

46 Effects of Wastewater Effluent Discharge on Indian Creek, Johnson County, Kansas
Physical-Habitat CharacteristicsTotal habitat scores at all sites indicated marginal and
suboptimal conditions. The variability in total habitat scores among sites was fairly small, with the lowest score recorded at the State Line site, located furthest downstream (fig. 1, fig. 15A). Total habitat scores decreased in the downstream direction from College to State Line. But the site furthest upstream, 119th, did not follow that trend by scoring high-est, partly because of low scores related to bank instability and lack of riparian protection, in spite of having the highest scores for canopy cover, buffer width, and unaltered stream banks (appendix 10). The sites with the best total scores (Col-lege, Marty, and Tomahawk, fig. 15A) also had high scores for riffle frequency, canopy cover, sediment deposition, and favor-able riffle-substrate composition (appendix 10).
Although variability in total habitat scores among sites was fairly small, much larger differences among sites were recorded in individual habitat variables. Streambank altera-tions generally increased in the downstream direction, leading to lower percent altered bank scores. The percentage of altered banks was substantially lower at the 119th site (optimal condi-tions) than the State Line site (marginal conditions) (fig. 15B). Streambanks at the State Line site are altered because of bridge armor, retaining walls, and artificial riprap. Streams that have been altered generally have far fewer natural habitats for fish, macroinvertebrates, and plants than naturally meandering streams (Barbour and others, 1999). Riffle substrate fouling
also varied among sites, with the poorest conditions at the downstream State Line site (fig. 15C). Riffle substrate fouling is a measure of periphyton growth and accumulation of fine materials covering substrate. Excessive amounts of accumula-tion can clog interstitial spaces in gravel and cobble substrates and lead to a decline in living space for macroinvertebrates and riffle-dwelling fishes. Substrate and cover diversity also varied among sites (fig. 15D). A large variety of in-stream habitats and cover types such as leaf packs, woody debris, root mats, overhanging and inundated vegetation, and undercut banks provide protection and feeding sites for macroinverte-brates and other aquatic organisms (Barbour and others, 1999). The State Line site scored in the lower marginal range for this variable, and all of the other sites scored in the suboptimal or optimal range (fig. 15D).
Habitat quality at all of the sites likely benefits from the presence of streamway parks that extend along the creeks and provide extra buffer areas and natural vegetation (Johnson County Parks and Recreation District, 2014). Most of the streamway parks are undeveloped except for paved pedestrian and biking trails. The park land provides stream buffer zones with vegetation including forest, shrubs, and grasses that help protect the streams from urban encroachment. The streamway parks contributed directly to improved habitat scores related to buffer width, buffer length, and canopy cover, and likely contributed indirectly to improvements in the other habitat variables.
Figure 14. Monthly mean light intensity at the Indian Creek study sites during October 2011 through June 2013.
0
200
400
600
800
1,000
1,200
1,400
Ligh
t int
ensi
ty, i
n lu
men
s pe
r squ
are
met
er
2011
Oct.
Nov
.
Dec.
Dec.
Sept
.
Oct.
Nov
.
Jan.
Feb.
Mar
.
Apr.
May
June
July
Aug.
Jan.
Feb.
Mar
.
Apr.
May
June
2012 2013
EXPLANATION119thCollegeMartyMission FarmsTomahawkState line

Environmental Conditions in Indian Creek 47
Figure 15. Normalized total habitat and selected individual habitat variable scores at the Indian Creek study sites during July 2012. A, total habitat score; B, percent altered banks; C, riffle substrate fouling; and D, substrate and cover diversity.
A
B
C
D
SuboptimalSuboptimal
MarginalMarginal
PoorPoor
OptimalOptimal
0
10
20
30
40
50
60
70
80
90
100
Tota
l hab
itat s
core
0
10
20
30
40
50
60
70
80
90
100
0
10
20
30
40
50
60
70
80
90
100
0
10
20
30
40
50
60
70
80
90
100
Perc
ent a
ltere
d ba
nks
Riffl
e su
bstra
te fo
ulin
gSu
bstra
te a
nd c
over
div
ersi
ty
119th College Marty Mission Farms Tomahawk State Line
SuboptimalSuboptimal
MarginalMarginal
PoorPoor
OptimalOptimal
SuboptimalSuboptimal
MarginalMarginal
PoorPoor
OptimalOptimal
SuboptimalSuboptimal
MarginalMarginal
PoorPoor
OptimalOptimal

48 Effects of Wastewater Effluent Discharge on Indian Creek, Johnson County, Kansas
Biological Conditions of Indian CreekBiological conditions evaluated were periphyton and
macroinvertebrate communities and stream metabolism. Stream metabolism data were used to calculate a functional stream health metric. Periphyton and macroinvertebrate sam-ples were collected during below-normal (August 2012) and normal to slightly above-normal (April 2013) streamflows. In addition, periphyton samples for chlorophyll (algal biomass) analysis were collected weekly from August 2011 through September 2012. Stream metabolism was calculated for the 2-year period July 2011 through June 2013 using continuously measured water-quality data.
Periphyton
The attached algae that grow on submerged surfaces in streams, such as rocks and woody debris, commonly are referred to as periphyton. Periphyton are at the base of the food web in stream ecosystems and serve as a primary link between abiotic (nonliving) factors, such as nutrients, and higher trophic levels (higher place in the food web), such as macroinvertebrates. Algae have short life cycles and respond rapidly to changes in environmental conditions; therefore, periphyton communities often are the first to respond to and recover from floods or contaminant pulses (Allan, 1995; Rosen, 1995; Lowe and Pan, 1996; Lowe and LaLiberte, 2007). Physical, chemical, and pollution tolerances and growth optima (autecological data) have been described for many periphytic algal species, which allows periphytic communi-ties to be used as indicators of ecological conditions. Several States, including Florida (Florida Department of Environ-mental Protection, 2008), Kentucky (Kentucky Division of Water, 1993), Montana (Bahls, 1993), New Jersey (Ponader and Charles, 2005), and Oklahoma (Oklahoma Conservation Commission, 1993) use periphyton community composition in their bioassessment programs, but Kansas currently (2014) does not.
Periphyton Community CompositionAt the 6 Indian Creek sites, 152 periphyton taxa were
identified in August 2012 and April 2013 (appendix 11). Bacillariophyta (diatoms) represented 82 percent of the taxa identified. Chlorophyta (green algae) and Cyanophyta (cyano-bacteria) represented 11 and 5 percent, respectively. About 60 percent of the taxa identified were rare (contributing less than 1 percent to total algal abundance, biovolume, or both) and 11 percent (16 of 152) of the taxa identified contributed 10 per-cent or more to total abundance and/or biovolume. Diverse communities dominated by few taxa are a common occurrence in Johnson County streams and streams throughout the nation (Graham and others, 2010; Rasmussen and others, 2012).
Diatoms represented between 81 and 95 percent of abundance at the six sites during August 2012 and between 92
and nearly 100 percent of abundance in April 2013 (table 8). Although diatoms always dominated (greater than 50 percent) algal abundance, they did not always dominate algal biovol-ume. Green algae dominated algal biovolume at the upstream 119th site (67 percent of total biovolume) and the downstream State Line site (82 percent) in August 2012. Green algae contributed between 3.4 and 34 percent to total biovolume at the other Indian Creek study sites in August. In April 2013, green algae were not dominant, but contributed as much as 35 percent to total biovolume. Cyanobacteria occurred only at the Tomahawk site during August 2012 (6.4 percent or less of abundance and biovolume), and were present in low amounts (less than 5 percent of abundance and biovolume) at the 119th, College, Marty, and Tomahawk sites in April 2013.
Green algae and cyanobacteria are most likely to domi-nate stream periphyton communities when water temperatures are warm and streamflows are at seasonal lows (Allan, 1995; Stevenson and Rollins, 2007). Filamentous green algae, such as Cladophora, Stigeoclonium, Ulothrix, and Mougeotia, become a nuisance in nutrient rich conditions because of excessive growth (Dodds and Gudder, 1992). Filamentous green algae occurred at all Indian Creek study sites during August 2012 (appendix 11), when conditions were ideal for their growth. Occurrence was less common in April 2013, but filamentous green algae were present at all sites except 119th. Because cyanobacteria have the ability to produce toxins and taste-and-odor compounds, they are generally considered a nuisance when present (Graham and others, 2008). Cyanobac-teria were uncommon at the Indian Creek study sites (table 8, appendix 11); however, numerous cyanobacterial taxa were observed at the Tomahawk site in August 2012. Tomahawk Creek is the only Johnson County stream that has occasionally had cyanobacteria as a dominant component of the periphyton community (Rasmussen and others, 2009b, 2012).
The four most dominant taxa at each site represented between 48 and 87 percent of the abundance and biovolume at the six sites in August 2012 and April 2013 (appendix 12). The diatom Achnanthidium minutissimum was the most dominant taxa by abundance at all sites in August 2012, with the excep-tion of the Mission Farms site, which was dominated by the diatom Nitzschia inconspicua. Based on biovolume, filamen-tous green algae were the dominant taxa at the 119th, College, Marty, and State Line sites in August 2012 (Stigeoclonium sp. at Marty and Cladophora glomerata at the other three sites; appendix 12). The dominant taxa were more variable among sites during April 2013 and included only diatoms. In general, Surirella brebissonii and Gomphoneis olivacea were among the four most dominant taxa at all sites during April 2013 (appendix 12). The dominant diatoms at the Indian Creek sites generally are indicative of somewhat degraded, eutrophic con-ditions with small to moderate amounts of organic enrichment. The dominant green algae are considered nuisance taxa (Por-ter, 2008). In Johnson County streams, Sururella brebissonii and Gomphoneis olivacea commonly are dominant in spring and Stigeoclonium sp. and Cladophora glomerata commonly

Biological Conditions of Indian Creek 49
Table 8. Percent contributions of each algal periphyton division to total abundance and biovolume at the Indian Creek study sites during August 2012 and April 2013.
[Percentages based on the mean of three samples at Tomahawk and College and two samples at the other four sites; ±1 standard deviation in parentheses; ±, plus or minus; Bacillariophyta, diatoms; Chlorophyta, green algae; Cryptophyta, cryptophytes; Cyanophyta, blue-green algae or cyanobacteria; Other, Euglenophyta, Chrysophyta, and Pyrrophyta combined; <, less than]
MonthSite
(fig. 1)
Percentage contributions to abundance1
Bacillariophyta Chlorophyta Cryptophyta Cyanophyta Other
August 2012 119th 90 (1.9) 5.8 (1.5) 4.2 (3.4) 0 (0) 0 (0)
College 95 (0.84) 3.1 (0.83) 2.0 (1.2) 0 (0) 0 (0)
Marty 93 (5.7) 2.7 (2.3) 3.8 (3.4) 0 (0) 0 (0)
Mission Farms 84 (5.9) 11 (5.5) 4.2 (0.42) 0 (0) 0 (0)
Tomahawk 90 (5.5) 2.1 (0.84) 1.9 (0.64) 6.4 (6.1) 0 (0)
State Line 81 (0.30) 14 (1.9) 4.9 (1.5) 0 (0) 0.11 (0.11)
April 2013 119th 98 (3.2) 0 (0) 0 (0) 2.3 (3.2) <0.01 (<0.01)
College 95 (6.8) 0.52 (0.40) 0 (0) 4.5 (6.6) <0.01 (<0.01)
Marty 98 (1.6) 1.2 (1.7) 0 (0) 0.48 (0.69) 0 (0)
Mission Farms 99 (0.29) 0.20 (0.29) 0 (0) 0 (0) 0 (0)
Tomahawk 95 (5.8) 1.4 (1.1) 0 (0) 0.78 (1.1) 0 (0)
State Line 92 (6.8) 6.6 (9.3) 0 (0) 0 (0) 0 (0)
MonthSite
(fig. 1)
Percentage contributions to biovolume1
Bacillariophyta Chlorophyta Cryptophyta Cyanophyta Other
August 2012 119th 33 (35) 67 (35) 0.32 (0.15) 0 (0) 0 (0)
College 65 (43) 34 (43) 0.44 (0.36) 0 (0) 0 (0)
Marty 96 (3.0) 3.4 (2.1) 0.76 (0.91) 0 (0) 0 (0)
Mission Farms 72 (15) 27 (15) 1.2 (0.24) 0 (0) 0 (0)
Tomahawk 64 (14) 33 (16) 0.58 (0.26) 2.8 (2.7) 0 (0)
State Line 16 (10) 82 (8.3) 0.43 (0.22) 0 (0) 1.2 (1.8)
April 2013 119th 100 (0.11) 0.11 (0.11) 0 (0) 0 (0) <0.01 (<0.01)
College 99 (1.0) 0.62 (0.52) 0 (0) 0.57 (0.54) 0.09 (0.09)
Marty 65 (35) 35 (35) 0 (0) <0.01 (<0.01) 0 (0)
Mission Farms 100 (0.04) 0.04 (0.04) 0 (0) 0 (0) 0 (0)
Tomahawk 80 (12) 20 (12) 0 (0) 0.10 (0.01) 0 (0)
State Line 73 (23) 27 (23) 0 (0) 0 (0) 0 (0)1Total percentages may not sum to 100 because of rounding.

50 Effects of Wastewater Effluent Discharge on Indian Creek, Johnson County, Kansas
are dominant in summer (Rasmussen and others, 2009b, 2014; Graham and others, 2010).
Periphyton MetricsAutecological data define physical, chemical, and pollu-
tion tolerances and provide information about how organisms may respond to changing environmental conditions (Rosen, 1995; Van Dam and others, 1994). Metrics based on auteco-logical information can provide insight into the environmental stresses experienced by organisms or be used to define organ-ism response along an environmental gradient (Stevenson and Bahls, 1999). Among the algal periphyton, diatoms frequently are used as indicators of environmental change because they are known to be sensitive to many factors (for example, light, nutrients, oxygen, and organic carbon) (Porter, 2008). Among-site differences in periphyton community metrics were evalu-ated for 24 metrics in 5 categories (oxygen tolerance, sapro-bity, trophic condition, nitrogen-uptake metabolism, and other indices). Either a single metric or a combination of two or three metrics from each category except oxygen tolerance are discussed in this section. Oxygen tolerance metrics were omit-ted because results and interpretation are similar to saprobity. All 24 metric scores, the environmental conditions associated with each metric, and statistical comparisons among sites are presented in appendix 13.
Saprobity
Saprobes are organisms that live in and derive nourish-ment from decaying organic matter. The saprobien index, a measure of saprobity, was developed to evaluate diatom com-munities with respect to sensitivity to organic pollution and is based on organism tolerance to the presence of biodegradable organic matter and oxygen concentrations (Van Dam and oth-ers, 1994). The five saprobity categories calculated by ADAS are oligosaprobic, beta-mesosaprobic, alpha-mesosaprobic, alpha-mesosaprobic/polysaprobic, and polysaprobic. These categories represent a gradient of conditions ranging from pristine, with increased oxygen and decreased concentrations of biodegradable organic matter (oligosaprobic), to highly polluted, with decreased oxygen and increased concentrations of organic matter (polysaprobic; Van Dam and others, 1994; Porter, 2008). The percentage of diatoms in the oligosapro-bic and beta-mesosaprobic categories were summed, treated as one category, and are discussed in this section. These two categories are indicative of unpolluted conditions, with BOD less than 4 mg/L and percent oxygen saturation greater than 70 (appendix 13).
During August 2012, the percentage of diatoms in the oligosaprobic and beta-mesosaprobic categories ranged from 46 to 78 percent. The percentage of diatoms in the oligosap-robic and beta-mesosaprobic categories was lower in April 2013 compared to August 2012 and ranged from 28 to 53 percent (fig. 16A). Among-site differences along the upstream-downstream gradient were not statistically significant
(August 2012 ANOVA: F=2.76, p-value=0.10; April 2013 ANOVA: F=3.24, p-value=0.07); however, during August 2012 the two upstream sites had between 12 and 33 percent (119th=71 percent; Tomahawk=78 percent) more oligosapro-bic and beta-mesosaprobic diatoms than the downstream sites (45 to 59 percent) (fig. 16A). In April 2013, the percentage of oligosaprobic and beta-mesosaprobic diatoms decreased in the downstream direction by 22 percent from the 119th (53 percent) site to the Marty (31 percent) site, increased by 13 percent between the Marty and Mission Farms site (44 per-cent), and then decreased to a minimum of 28 percent at the State Line site. These patterns along the upstream-downstream gradient, with larger percentages of diatoms indicative of less degraded conditions at the upstream sites and the site located the farthest downstream from the WWTFs, are indicative of wastewater influences on diatom community composition in Indian Creek.
Overall, the large percentage of oligosaprobic and beta-mesosaprobic diatoms during August 2012 generally reflected water-quality conditions when samples were collected. The BOD was low (less than or equal to 4 mg/L) and dissolved oxygen was moderate at all sites (greater than 6 mg/L) except Tomahawk (dissolved oxygen=4.6 mg/L) (appendix 14). The lower percentage of oligosaprobic and beta-mesosaprobic diatoms in April 2013 suggests that water-quality conditions were poorer at all sites during this time period; however, BOD was similar to August 2012 at all sites and dissolved oxygen was high (greater than 10 mg/L). The low abundance of these diatoms in Indian Creek during April 2013 is in direct contrast to spring diatom communities in the Blue River during 2008. Oligosaprobic and beta-mesosaprobic diatoms dominated (greater than 60 percent of total) the spring periphyton com-munities in the Blue River at all sites, regardless of wastewater influences (Graham and others, 2010). Wastewater contributed between 20 to 81 percent more to streamflow at Indian Creek than the Blue River during spring, and among-stream differ-ences may have been due to wastewater influences; however, wastewater contributed more to streamflow at most Indian Creek sites in August 2012 (64 to 100 percent) than April 2013 (42 to 99 percent) (appendix 14). Other urban influ-ences that affect environmental conditions may have affected Indian Creek diatom community composition in April 2013. For example, dissolved solids concentrations were between 20 and 46 percent higher at all sites during April 2013 than August 2012, primarily because of higher concentrations of sodium and chloride (appendix 14). Road salt can persist in the environment and cause elevated chloride concentrations for extended periods after applications (Kaushal and oth-ers, 2005). The chronic exposure criterion of 230 mg/L for chloride (U.S. Environmental Protection Agency, 1988) was exceeded at all sites during the collection of biological sam-ples in April 2013, and was exceeded for extended periods of time in the 4 months before sample collection. Chronic expo-sure to elevated chloride concentrations may have decreased the abundance of diatoms indicative of unpolluted conditions in Indian Creek during April 2013 (Corsi and others, 2010).

Biological Conditions of Indian Creek 51
Trophic Condition
Trophic condition indicates productivity of aquatic ecosystems with respect to concentrations of nitrogen and phosphorus and associated levels of primary productivity. Oligotrophic ecosystems have low levels of nutrients and pro-ductivity, mesotrophic systems have moderate levels of nutri-ents and productivity, and eutrophic systems have high levels of nutrients and productivity (Graham and others, 2008). The seven trophic condition categories that ADAS uses to classify diatoms are oligotrophic, oligo-mesotrophic, mesotrophic,
meso-eutrophic, eutrophic, hypereutrophic, and ubiquitous. With the exception of ubiquitous, these categories represent a gradient in tolerance to trophic conditions. Ubiquitous diatoms have a wide range of nutrient tolerance and may be present under a range of trophic conditions. The eutrophic and hyper-eutrophic categories were summed, treated as one category, and are discussed in this section.
The percentage of diatoms in the eutrophic and hyper-eutrophic categories ranged from 39 to 76 percent in August 2012 and 57 to 80 percent in April 2013. The percentage of
Figure 16. Selected periphyton metric scores at the Indian Creek study sites during August 2012 and April 2013. A, percent oligosaprobic and beta-mesosaprobic diatoms; B, percent eutrophic and hypereutrophic diatoms; C, percent nitrogen-heterotrophic diatoms; and D, Bahls Index values.
a
August 2012 April 2013 August 2012 April 2013
0
20
40
60
80
100
0
20
40
60
80
100
b bab
aba
ab
ab
ab ab
ab
a
b aa
bab
ab
ab
0
0.5
1.0
1.5
2.0
2.5
3.0
ab ababcabc
cc
0
20
40
60
80
100
Perc
ent o
ligos
apro
bic
and
beta
-mes
o sa
prob
ic d
iato
ms
Perc
ent e
utro
phic
and
hyp
ereu
trop
hic
diat
oms
Bah
ls in
dex
Perc
ent n
itrog
en-h
eter
otop
hic
diat
oms
A B
C D
b 119thCollegeMarty
Standard deviationMean
Mission FarmsTomahawkState Line
EXPLANATION
Different letters indicate statistically significant differences (p less than 0.05) in mean values between sites
Cross-hatch pattern indicates upstream site. All others are downstream sites.

52 Effects of Wastewater Effluent Discharge on Indian Creek, Johnson County, Kansas
eutrophic and hypereutrophic diatoms was 12 to 26 percent higher in April 2013 than August 2012 at all sites except Marty. At the Marty site, the percentage of eutrophic and hypereutrophic diatoms was similar between August 2012 and April 2013 (fig. 16B). The higher abundance of eutrophic and hypereutrophic diatoms in Indian Creek during spring, rather than summer, is in direct contrast to the seasonal pattern observed in the Blue River during 2008 (Graham and others, 2010). The relative abundance of eutrophic diatoms increased by about 20 percent at all Blue River sites between spring and summer. The difference in the seasonal pattern between the two studies may be caused by the influence of other urban fac-tors on diatom communities in Indian Creek as described for the saprobidity metrics.
Diatom community composition generally was indicative of eutrophic conditions at all sites, despite the large differ-ences in total and inorganic nutrient concentrations between the upstream sites (119th and Tomahawk) and the sites located downstream from the WWTFs during below-normal and nor-mal streamflows (fig. 8, table 6). Eutrophic and hypereutrophic diatoms dominated the periphyton community (greater than 50 percent of total) at all sites, except 119th and Tomahawk (45 and 39 percent, respectively) in August 2012. There were no clear patterns along the upstream-downstream gradient in August 2012 or April 2013; however, diatom communities at the wastewater-influenced sites had between 9 and 37 percent more eutrophic and hypereutrophic diatoms than the upstream sites (fig. 16B). During August 2012, the Marty site had the highest percentage of eutrophic and hypereutrophic diatoms (76 percent). In April 2013, the College, Marty, and State Line sites had the largest percentage of eutrophic and hyper-eutrophic diatoms (77 to 80 percent). Among-site differences were statistically significant (August 2012 ANOVA: F=4.42, p-value=0.03; April 2013 ANOVA: F=4.89, p-value=0.02). The pattern in eutrophic and hypereutrophic diatoms along the upstream-downstream gradient generally reflects the patterns observed in nutrient concentrations (fig. 8, table 6), with sub-stantial increases immediately downstream from the WWTFs, followed by decreases as distance from WWTF effluent dis-charge increase. However, substantial decreases did not occur until the Mission Farms site, located 9.5-km downstream from the Middle Basin WWTF, indicating that environmental vari-ables such as nutrient transport and uptake dynamics, stream-flow, habitat conditions, and adjacent land use such as road density, rather than just nutrient concentrations, affect diatom community composition.
Nitrogen-Uptake Metabolism
Nitrogen-uptake metabolism refers to the source of nitrogen that diatoms require for growth. Nitrogen-autotrophic diatoms require inorganic nitrogen sources (such as nitrate or ammonia) for growth and nitrogen-heterotrophic dia-toms require organic nitrogen sources (such as amino acids; Werner, 1977). Obligate nitrogen heterotrophs require organic sources of nitrogen, whereas facultative nitrogen heterotrophs
may utilize inorganic and organic sources of nitrogen. The four categories of nitrogen-uptake metabolism calculated by ADAS are nitrogen autotrophs with a low tolerance for organic nitrogen, nitrogen autotrophs with a high tolerance for organic nitrogen, facultative heterotrophs, and obligate heterotrophs. In general, nitrogen autotrophs with a low toler-ance for organic nitrogen develop optimally in oligotrophic waters and obligate nitrogen heterotrophs develop optimally in eutrophic waters (Werner, 1977). The percentage of diatoms in the facultative and obligate nitrogen-heterotroph categories were summed, treated as one category, and are discussed in this section.
The percentage of diatoms in the facultative and obligate nitrogen heterotroph categories ranged from 21 to 52 per-cent in August 2012 and 17 to 54 percent in April 2013 and matched patterns in eutrophic and hypereutrophic diatoms. In general, patterns along the upstream-downstream gradient were similar in August 2012 and April 2013. Facultative and obligate nitrogen heterotrophs represented a higher percentage of the diatom communities at the wastewater-influenced sites than the upstream sites (fig. 16C). There were 11 to 36 per-cent more of these diatoms at the wastewater-influenced sites (38 to 52 percent) than at the upstream sites (21 to 24 per-cent). Between the upstream 119th site and the Marty site, located 5.1-km downstream from the Middle Basin WWTF, the percentage of facultative and obligate nitrogen heterotro-phic diatoms increased by 29 and 36 percent in August 2012 and April 2013, respectively. As discussed for the trophic metrics, numerous environmental variables, rather than just nutrient concentrations, likely influence diatom community composition in Indian Creek. Among-site differences were not statistically significant in August 2012 (ANOVA: F=3.20, p-value=0.07) but were in April 2013 [ANOVA: F=6.86, p-value less than (<) 0.01]. The pattern in facultative and obligate nitrogen heterotrophs along the upstream-downstream gradient reflects the substantial increase (orders of magnitude during below-normal and normal streamflow conditions) in nitrogen concentrations at sites located downstream from the WWTFs (fig. 8A, C, E, table 6).
Bahls Index
Bahls index is a multimetric score based on the relative abundance of diatoms in three categories: sensitive, somewhat tolerant, and tolerant. For this metric, diatom tolerance is based on nutrients, organics, salts, water temperature, toxics, substrate stability, and suspended solids. The resulting score is a scaled value ranging from 1 to 3, with 3 representing a community composed of sensitive taxa and 1 representing a community composed of tolerant taxa; therefore, values of 3 indicate good water-quality conditions and values of 1 repre-sent poor water-quality conditions (Porter, 2008; Bahls, 1993).
Bahls Index values ranged from 2.30 to 2.72 in August 2012 and from 2.03 to 2.42 in April 2013 (fig. 16D), and were similar to the index values observed for periphyton communi-ties in the Blue River (2.0–2.5) (Graham and others, 2010).
Biological Conditions of Indian Creek 53
Bahls index values decreased at all sites between August 2012 and April 2013, indicating a shift to more tolerant diatom com-munities. The 119th and Tomahawk sites had among the high-est Bahls index scores in August 2012 (2.56 and 2.72, respec-tively) and April 2013 (2.42 and 2.36, respectively). Lower index scores at the sites located downstream from the WWTFs relative to the upstream sites may reflect the influence of wastewater effluent discharge on the diatom communities in August 2012, but among-site differences were not statistically significant (ANOVA: F=3.5, p-value=0.06). Among-site dif-ferences were statistically significant in April 2013 (ANOVA: F=7.35, p-value<0.01; fig. 16D), but do not reflect the influ-ence of wastewater effluent discharge. Bahls index values were significantly lower at the Marty and State Line sites (2.03–2.04) in April 2013 than at the other sites (2.28–2.42). Despite these patterns, Bahls index values spanned a narrow range (2.0–2.7), indicative of somewhat tolerant diatom com-munities at all sites during August 2012 and April 2013.
Periphyton Chlorophyll, Abundance, and Biovolume
Chlorophyll, a light-gathering pigment present in all photosynthetic organisms, often is used to describe algal com-munities because analysis is simpler and less time consum-ing than identifying, counting, and measuring algal cells. Periphytic algal abundance reflects the total number of cells present, whereas chlorophyll concentrations and biovolume
are indicators of biomass. Periphytic chlorophyll concentra-tions exceeding 150 mg/m2 are indicative of undesirable algal conditions (Suplee and others, 2009), and KDHE uses the 150 mg/m2 threshold as an endpoint for TMDLs (Kansas Department of Health and Environment, 2010). Similar thresh-old concentrations have not been established for periphytic algal abundance and biovolume.
Periphyton chlorophyll concentrations ranged from 14.4 to 195 mg/m2 in August 2012 and exceeded the KDHE threshold of 150 mg/m2 at the College site (table 9), located immediately downstream from the Middle Basin WWTF. Con-centrations were between 4 and 21 times larger in April 2013 than August 2012 and exceeded the KDHE threshold at all sites (range=301–846 mg/m2). Substantially higher periphy-ton chlorophyll concentrations in spring are typical in John-son County streams and likely are caused by increased light availability before leaf out of streamside trees (Rasmussen and others, 2009b; Graham and others, 2010; Rasmussen and others, 2012). During August 2012 and April 2013, chloro-phyll concentrations were lowest at the 119th site upstream from the Middle Basin WWTF and highest at the College site, immediately downstream from the Middle Basin WWTF (table 9). Chlorophyll concentrations increased by an order of magnitude between the 119th (14.4 mg/m2) and College (195 mg/m2) sites in August 2012 and nearly tripled between the two sites in April 2013 (301 and 846 mg/m2); these differ-ences were statistically significant in August 2012 (ANOVA: F=62.4, p-value<0.01), but not April 2013(ANOVA: F=1.51,
Table 9. Mean and standard deviation of periphytic chlorophyll concentration and periphytic algal abundance and biovolume at the Indian Creek study sites during August 2012 and April 2013.
[For each variable, means with either no superscript letters or the same superscript letter across sites are not significantly different. Means and standard devia-tions are based on three replicate samples at the College and Tomahawk sites and two replicate samples at all other study sites; mg/m2, milligrams per square meter; billion cells/m2, billion cells per square meter; mm3/m2, cubic millimeters per square meter]
Month Site
Chlorophyll (mg/m2)
Abundance (billion cells/m2)
Biovolume (mm3/m2)
MeanStandard deviation
MeanStandard deviation
MeanStandard deviation
August 2012 119th abc14.4 7.00 2.51 1.53 8,130 10,800College 195 7.11 23.9 5.55 12,300 3,600Marty ab36.3 3.93 30.6 40.3 8,580 11,030Mission Farms a51.7 12.7 3.85 0.46 1,250 142Tomahawk abc48.9 17.4 8.89 1.65 2,530 643State Line 117 24.0 7.15 1.49 9,170 768
April 2013 119th 301 41.1 15.3 4.12 5,160 2,240College 846 446 56.8 6.02 19,900 3,550Marty 599 122 31.1 6.53 21,200 13,600Mission Farms 522 104 34.4 19.3 13,400 8,710Tomahawk 448 88.1 46.9 21.3 28,300 28,900State Line 570 78.7 106 93.0 45,800 15,400

54 Effects of Wastewater Effluent Discharge on Indian Creek, Johnson County, Kansas
p-value=0.29). Differences along the upstream-downstream gradient were less pronounced among the other sites. During August 2012, chlorophyll concentrations at the State Line site (117 mg/m2), immediately downstream from the Toma-hawk Creek WWTF, were 2 to 3 times higher than at the upstream Tomahawk site and the Marty and Mission Farms sites (36.3–51.7 mg/m2). During April 2013, chlorophyll concentrations generally were lower at the upstream sites (301–448), decreased in the downstream direction from the College site (846 mg/m2), and increased again at the State Line site (570 mg/m2) (table 9). The pattern in chlorophyll concentrations along the upstream-downstream gradient in Indian Creek generally reflects the patterns observed in nutri-ent concentrations (fig. 8, table 6), with the highest concentra-tions downstream from the WWTFs; however, the upstream Tomahawk site had chlorophyll concentrations similar to some of the downstream sites in August 2012 and concentrations at all sites exceeded the KDHE threshold of 150 mg/m2 in April 2013, suggesting factors other than nutrients also may influence algal biomass in Indian Creek, including stream-flow, light conditions, and grazer abundance and community composition (Welch and Lindell, 1992; Allan, 1995; Young and others, 2008).
Periphytic algal abundance and biovolume were 2 to 15 times higher in April 2013 than August 2012 at most sites (table 9). Among-site patterns along the upstream-downstream gradient were not as clear as patterns in chloro-phyll, though there were similarities. Periphytic algal abun-dance was consistently lowest at the 119th site [2.51 billion cells per square meter (billion cells/m2)], increased by an order of magnitude between the 119th and College sites (23.9 billion cells/m2) in August 2012, and nearly quadrupled between the two sites in April 2013 (15.3 and 56.8 billion cells/m2, respec-tively). During August 2012, periphytic algal abundance was 3 to 10 times higher at the College and Marty sites than any of the other sites. In April 2013, periphytic algal abundance was lowest at the 119th site (15.3 billion cells/m2), highest at the State Line site (106 billion cells/m2) and generally similar among the other sites (31.1 to 56.8 billion cells/m2). Peri-phytic algal biovolume in August 2012 did not match patterns in chlorophyll and abundance. Biovolume was 3 to 10 times lower at the Mission Farms and Tomahawk sites than the other sites (table 9). April 2013 patterns in biovolume were more consistent. Periphytic algal biovolume was lowest at the 119th site and was nearly 4 times higher at the College site. Among-site differences in periphytic algal abundance and biovolume were not statistically significant [ANOVA: all F<1.60, p-value greater than (>) 0.08]. The discrepancy in among-site patterns in August 2012 likely is because of the presence of green algae at some sites. The green algae taxa present were large species, and though not numerically abundant, contributed substan-tially to periphytic algal biovolume (table 8, appendixes 12 and 13).
Seasonal Periphyton Biomass
Periphytic algal biomass in streams may change rapidly in response to runoff events or changing environmental condi-tions (Stienmann and others, 2006; Lohman and others, 1992; Murdock and others, 2004). Because of these rapid changes, drawing conclusions about differences in algal biomass among sites based only on a few samples can be misleading (Stienmann and others, 2006); therefore, during August 2011 through September 2012, weekly chlorophyll samples were collected at the Indian Creek sites to determine longer-term patterns in algal biomass in a range of streamflow conditions.
Overall, mean periphyton chlorophyll concentrations ranged from 39 mg/m2 at the 119th site to 122 mg/m2 at the College site (fig. 17A). Along the upstream-downstream gradi-ent, periphyton chlorophyll concentrations generally were lower at the upstream sites than at the wastewater-influenced sites. This difference was most pronounced at the 119th site (fig. 17); mean periphyton chlorophyll concentration at the 119th site was significantly lower than at the other sites (ANOVA: F=8.4, p-value<0.01). The KDHE threshold of 150 mg/m2 (Kansas Department of Health and Environment, 2010) was occasionally exceeded at all sites. About 2 percent of the samples collected at the 119th site (n=57) exceeded 150 mg/m2. By comparison, 28 percent of the samples col-lected at the College site (n=58) exceeded the KDHE thresh-old. Exceedance of the KDHE threshold at the other sites ranged from 18 to 21 percent.
Maximum periphyton chlorophyll concentrations at most sites were during winter months (December–March), though high concentrations also occurred in late summer (August–September) (fig. 17B). Periphytic chlorophyll concentra-tions (algal biomass) typically peak in early spring because of increased light availability before leaf emergence (Allan, 1995; Hill and others, 2001). April 2012 chlorophyll con-centrations were 6 to 13 times lower than April 2013 con-centrations and maximum concentrations during September 2011 through September 2012 were 1.2 to 2.2 times lower than April 2013 concentrations (fig. 17B, table 9). Periphytic chlorophyll concentrations in April 2013 were more typical of Johnson County streams than April 2012 concentrations (Rasmussen and others, 2009b; Graham and others, 2010; Ras-mussen and others, 2012). Winter data are not available for a similar comparison. Many environmental conditions influence periphytic algal biomass including nutrients, streamflow, water temperature, and grazer abundance and community composi-tion. Based on the continuous water-quality data collected at the State Line site during 2004 through 2013, streamflow dur-ing January–April 2012 (67 ft3/s)was about 23 ft3/s lower than the period of record mean for those months (90 ft3/s) and water temperature was about 3 °C higher than the period of record mean for those months (9.3 °C). Generally, lower streamflows and warmer water temperatures would be expected to stimu-late algal growth; however, these conditions also may have increased macroinvertebrate grazing (Allan, 1995), possibly

Biological Conditions of Indian Creek 55
Figure 17. Periphyton chlorophyll concentrations at the Indian Creek study sites during August 2011 through September 2012. A, overall mean and B, monthly mean. [TMDL, total maximum daily load]
*
*
2011
Dec.
Oct.
Nov
.
Sept
.
Sept
.
Jan.
Feb.
Mar
.
Apr.
May
June
July
Aug.
2012
119th College Marty MissionFarms
Tomahawk State Line
Kansas Department of Health and Environment Periphyton Chlorophyll TMDL Endpoint
0
50
100
150
200
Perip
hyto
n ch
loro
phyl
l con
cent
ratio
n,
in m
illig
ram
s pe
r met
er s
quar
ed (m
g/m
2 )Av
erag
e m
onth
ly p
erip
hyto
n ch
loro
phyl
l con
cent
ratio
n,in
mill
igra
ms
per m
eter
squ
ared
(m
g/m
2 )
A
B
0
100
200
300
400
Kansas Department of Health and Environment Periphyton Chlorophyll TMDL Endpoint
EXPLANATION
EXPLANATION
119thCollegeMartyMission farmsTomahawkState line
Site means are significantly differentStandard deviationMean

56 Effects of Wastewater Effluent Discharge on Indian Creek, Johnson County, Kansas
resulting in lower than normal chlorophyll concentrations dur-ing April 2012.
Overall, correlations between periphyton chlorophyll concentrations and environmental variables in Indian Creek were weak, but several were statistically significant. Flow regime has a substantial effect on algal biomass because the period between floods dictates the amount of time available for algal accumulation; however, algal biomass may recover rapidly (within days) after flooding (Lohman and others, 1992; Murdock and others, 2004). Periphyton chlorophyll (algal biomass) concentrations were positively related to streamflow conditions during the week before sample collection [Spear-man rank-correlation coefficient (rho)=0.33, p-value<0.01]. Although the overall correlation with streamflow was posi-tive, chlorophyll concentrations generally were lower when average streamflow during the week before sample collection was higher than 50 ft3/s (fig. 18), which suggests that stream-flows higher than 50 ft3/s are strong enough to scour attached periphyton from cobbles and may have a substantial influ-ence in observed seasonal and among-site patterns. Nitrate also was positively correlated with periphyton chlorophyll concentrations (rho=0.35, p-value<0.01), and reflects the increase in nutrients and algal biomass at sites located down-stream from the WWTFs (fig. 17, table 6). Other measured environmental variables that were significantly correlated
with periphyton chlorophyll concentrations included water temperature (rho=-0.40, p-value<0.01), dissolved oxygen (rho=0.35, p-value<0.01), and specific conductance (rho=0.24, p-value<0.01).
Macroinvertebrate Communities
Macroinvertebrate community-level responses com-monly are used for evaluating biological conditions, long-term monitoring, diagnosis of specific sources and causes of stream impairment, measuring the success of restoration activities, and developing biological criteria in support of water-quality compliance and regulation (Rosenberg and Resh, 1993; South-erland and Stribling, 1995). Macroinvertebrate communities have also been widely used as an indicator of stream quality in urban drainage basins (Paul and Meyer, 2001). Macroin-vertebrate community evaluations include examination of changes in dominance or abundance of ecologically important taxa and sensitive taxa that have been eliminated or decreased as a result of changes in stream conditions. Abundance and diversity are used to calculate specific indicator metrics. These metrics provide diagnostic information related to stressor responses and effects on community function.
Figure 18. Relation between periphyton chlorophyll concentration and streamflow at the Indian Creek study sites during August 2011 through September 2012. [TMDL, total maximum daily load]
0
100
200
300
400
500
600
0.1 1 10 100 1,000 10,000
Perip
hyto
n ch
loro
phyl
l con
cent
ratio
n, in
mill
igra
ms
per m
eter
squ
ared
(mg/
m2 )
Weekly average streamflow, in cubic feet per second (ft3/s)
Kansas Department of Health and EnvironmentPeriphyton Chlorophyll TMDL Endpoint
50 ft3/sEXPLANATION
119th
College
Marty
Mission Farms
Tomahawk
State Line
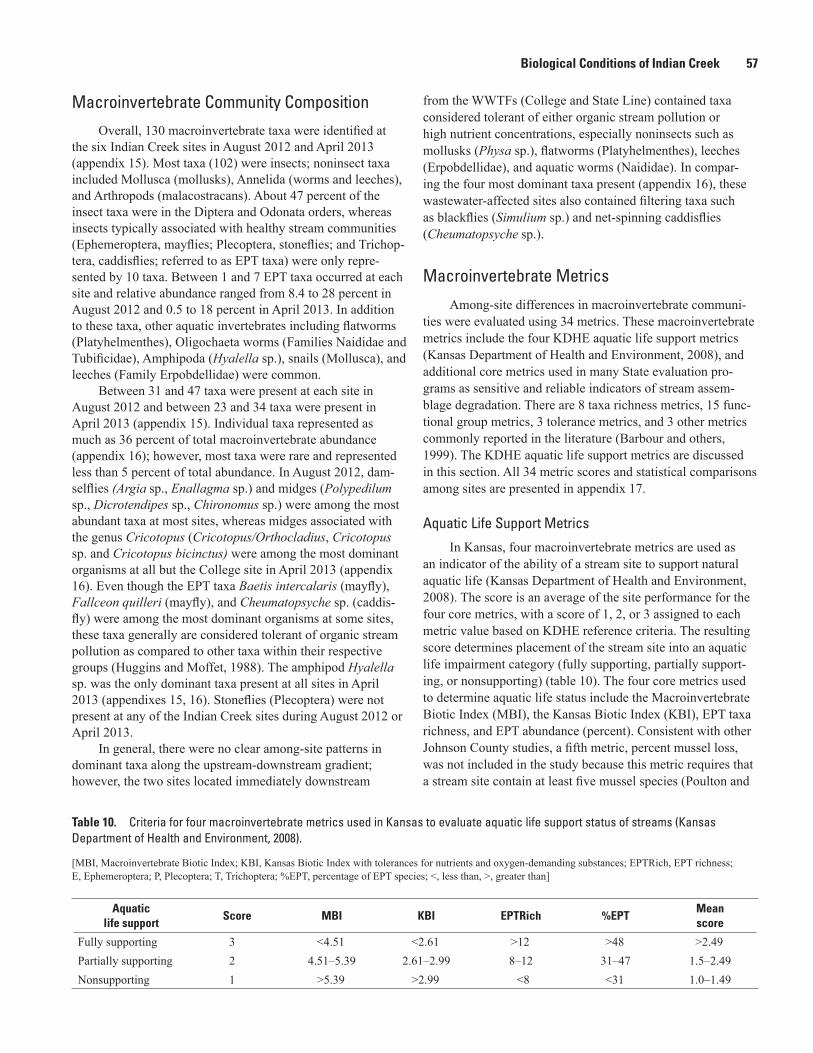
Biological Conditions of Indian Creek 57
Macroinvertebrate Community Composition
Overall, 130 macroinvertebrate taxa were identified at the six Indian Creek sites in August 2012 and April 2013 (appendix 15). Most taxa (102) were insects; noninsect taxa included Mollusca (mollusks), Annelida (worms and leeches), and Arthropods (malacostracans). About 47 percent of the insect taxa were in the Diptera and Odonata orders, whereas insects typically associated with healthy stream communities (Ephemeroptera, mayflies; Plecoptera, stoneflies; and Trichop-tera, caddisflies; referred to as EPT taxa) were only repre-sented by 10 taxa. Between 1 and 7 EPT taxa occurred at each site and relative abundance ranged from 8.4 to 28 percent in August 2012 and 0.5 to 18 percent in April 2013. In addition to these taxa, other aquatic invertebrates including flatworms (Platyhelmenthes), Oligochaeta worms (Families Naididae and Tubificidae), Amphipoda (Hyalella sp.), snails (Mollusca), and leeches (Family Erpobdellidae) were common.
Between 31 and 47 taxa were present at each site in August 2012 and between 23 and 34 taxa were present in April 2013 (appendix 15). Individual taxa represented as much as 36 percent of total macroinvertebrate abundance (appendix 16); however, most taxa were rare and represented less than 5 percent of total abundance. In August 2012, dam-selflies (Argia sp., Enallagma sp.) and midges (Polypedilum sp., Dicrotendipes sp., Chironomus sp.) were among the most abundant taxa at most sites, whereas midges associated with the genus Cricotopus (Cricotopus/Orthocladius, Cricotopus sp. and Cricotopus bicinctus) were among the most dominant organisms at all but the College site in April 2013 (appendix 16). Even though the EPT taxa Baetis intercalaris (mayfly), Fallceon quilleri (mayfly), and Cheumatopsyche sp. (caddis-fly) were among the most dominant organisms at some sites, these taxa generally are considered tolerant of organic stream pollution as compared to other taxa within their respective groups (Huggins and Moffet, 1988). The amphipod Hyalella sp. was the only dominant taxa present at all sites in April 2013 (appendixes 15, 16). Stoneflies (Plecoptera) were not present at any of the Indian Creek sites during August 2012 or April 2013.
In general, there were no clear among-site patterns in dominant taxa along the upstream-downstream gradient; however, the two sites located immediately downstream
from the WWTFs (College and State Line) contained taxa considered tolerant of either organic stream pollution or high nutrient concentrations, especially noninsects such as mollusks (Physa sp.), flatworms (Platyhelmenthes), leeches (Erpobdellidae), and aquatic worms (Naididae). In compar-ing the four most dominant taxa present (appendix 16), these wastewater-affected sites also contained filtering taxa such as blackflies (Simulium sp.) and net-spinning caddisflies (Cheumatopsyche sp.).
Macroinvertebrate Metrics
Among-site differences in macroinvertebrate communi-ties were evaluated using 34 metrics. These macroinvertebrate metrics include the four KDHE aquatic life support metrics (Kansas Department of Health and Environment, 2008), and additional core metrics used in many State evaluation pro-grams as sensitive and reliable indicators of stream assem-blage degradation. There are 8 taxa richness metrics, 15 func-tional group metrics, 3 tolerance metrics, and 3 other metrics commonly reported in the literature (Barbour and others, 1999). The KDHE aquatic life support metrics are discussed in this section. All 34 metric scores and statistical comparisons among sites are presented in appendix 17.
Aquatic Life Support Metrics
In Kansas, four macroinvertebrate metrics are used as an indicator of the ability of a stream site to support natural aquatic life (Kansas Department of Health and Environment, 2008). The score is an average of the site performance for the four core metrics, with a score of 1, 2, or 3 assigned to each metric value based on KDHE reference criteria. The resulting score determines placement of the stream site into an aquatic life impairment category (fully supporting, partially support-ing, or nonsupporting) (table 10). The four core metrics used to determine aquatic life status include the Macroinvertebrate Biotic Index (MBI), the Kansas Biotic Index (KBI), EPT taxa richness, and EPT abundance (percent). Consistent with other Johnson County studies, a fifth metric, percent mussel loss, was not included in the study because this metric requires that a stream site contain at least five mussel species (Poulton and
Table 10. Criteria for four macroinvertebrate metrics used in Kansas to evaluate aquatic life support status of streams (Kansas Department of Health and Environment, 2008).
[MBI, Macroinvertebrate Biotic Index; KBI, Kansas Biotic Index with tolerances for nutrients and oxygen-demanding substances; EPTRich, EPT richness; E, Ephemeroptera; P, Plecoptera; T, Trichoptera; %EPT, percentage of EPT species; <, less than, >, greater than]
Aquatic life support
Score MBI KBI EPTRich %EPTMean score
Fully supporting 3 <4.51 <2.61 >12 >48 >2.49Partially supporting 2 4.51–5.39 2.61–2.99 8–12 31–47 1.5–2.49Nonsupporting 1 >5.39 >2.99 <8 <31 1.0–1.49

58 Effects of Wastewater Effluent Discharge on Indian Creek, Johnson County, Kansas
others, 2007; Rasmussen and others, 2009b; Graham and oth-ers, 2010; Rasmussen and others, 2012).
Macroinvertebrate Biotic Index
The MBI is used to evaluate the effects of oxygen-demanding substances, nutrients, and organic enrichment on macroinvertebrate populations. It is a family-level biotic index that uses tolerance values ranging from 1 to 11 for insect and mollusk taxa, with smaller values corresponding to less tolerance and a lesser degree of stream degradation (Daven-port and Kelly, 1983). There were no clear patterns in MBI values along the upstream-downstream gradient (fig. 19A; appendix 17). The State Line site, located downstream from the Middle Basin and Tomahawk Creek WWTFs (fig. 1), had significantly higher MBI values (6.41 to 6.46) than most other sites in August 2012 (p-value<0.01) and April 2013 (p-value=0.04); however, in August 2012, the MBI at the upstream 119th site (5.92) also was significantly higher than all other sites except State Line (p-value<0.01). The MBI val-ues were similar among the other sites and ranged from 5.30 to 5.92. Based on the MBI, none of the sites were fully support-ing of aquatic life and most were nonsupporting (table 10).
Kansas Biotic Index
The KBI was specifically developed for Kansas and uses aquatic organism tolerances to nutrients and oxygen-demand-ing substances (Huggins and Moffet, 1988). It is a genus-level biotic index calculated in a similar manner as the MBI, with a scoring range of 0 to 10. Small values indicate less tolerance and minimal biological degradation. The KBI values ranged from 2.55 to 3.01 in August 2012 and were generally smaller than in April 2013 when KBI values ranged from 3.14 to 3.46 (appendix 17). There were no clear patterns in KBI values along the upstream-downstream gradient (fig. 19B), though in August 2012, the KBI was lower at the upstream 119th site than at the downstream State Line site. In April 2013, the Col-lege and Marty sites had significantly higher (p-value=0.01) KBI values than either the Mission Farms site or the upstream Tomahawk site. Based on the KBI, only the 119th site in August 2012 was fully supporting of aquatic life (fig. 19B).
Ephemeroptera, Plecoptera, and Trichoptera Taxa Richness
The EPT taxa richness is the number of distinct taxa belonging to the orders Ephemeroptera (mayflies), Plecop-tera (stoneflies), and Trichoptera (caddisflies). Most species belonging to each of these orders are considered to be intol-erant of stressors and generally larger numbers of species in these groups indicate higher water quality (Barbour and others, 1999). In August 2012, EPT richness was lower at the College and State Line sites, immediately downstream from the WWTFs, though among-site differences were not statisti-cally significant (p-value=0.07); there were two to four more EPT taxa at the sites located either upstream or farther down-stream from the WWTFs (fig. 19C, appendix 17). The EPT
richness in April 2013 was lower than in August 2012 and there were no clear patterns along the upstream-downstream gradient. In April 2013, EPT richness was significantly higher (p-value<0.01) at the Tomahawk, Mission Farms, and Marty sites; however, there were generally only 1 to 3 taxa present at all sites (fig. 19C, appendix 17). Based on EPT richness, all of the study sites were nonsupporting of aquatic life during August 2012 and April 2013 (fig. 19C).
Percentage of Ephemeroptera, Plecoptera, and Trichoptera
The percent EPT metric is the relative abundance of organisms belonging to the orders Ephemeroptera (may-flies), Plecoptera (stoneflies), and Trichoptera (caddisflies) expressed as a percentage of the total number in each sample. It provides information about relative abundance of the three sensitive (stressor intolerant) orders of aquatic insects without information about their richness, so abundant populations of a few species can result in high values. The percentage of EPT ranged from 9.2 to 26 in August 2012. Percentage EPT was lower at all sites in April 2013 and ranged from 0.45 to 13 (fig. 19D, appendix 17). There were no clear patterns in percentage EPT along the upstream-downstream gradient. In August 2012, the two upstream sites (119th and Tomahawk) and the State Line site were significantly lower (p-value=0.03) than other sites, whereas in April 2013, the Tomahawk site had significantly higher (p-value<0.01) values than other sites. Similar to the EPT richness metric, percentage EPT values indicated conditions nonsupporting of aquatic life at all sites in August 2012 and April 2013 (fig. 19D).
Aquatic Life Support Status
Kansas Department of Health and Environment aquatic life support scores ranged from 1.0 to 1.5 and indicated condi-tions nonsupporting of aquatic life at all sites, with the excep-tion of Mission Farms in August 2012, which was partially supporting (fig. 19E). In previous assessments, Indian Creek study sites always had nonsupporting aquatic life support scores, regardless of location relative to WWTFs (Poulton and others, 2007; Rasmussen and others, 2009b, 2012). By comparison, sites in the nearby upper Blue River Basin, which is influenced by wastewater but has less urban development, typically are partially supporting of aquatic life (Graham and others, 2010). The small range of scores and conditions nonsupporting of aquatic life at all sites indicates factors other than wastewater are affecting macroinvertebrate communities in Indian Creek.
Other urban influences that affect environmental condi-tions may negatively affect macroinvertebrates. For example, Rasmussen and others (2009b and 2012) determined that in Johnson County, the density of stormwater outfall points adjacent to streams, specific conductance of water, and PAH concentrations in streambed sediment were negatively cor-related with biological conditions. The PAHs occurred at all Indian Creek study sites at concentrations large enough to cause adverse effects on aquatic biota (appendix 9). Chloride

Biological Conditions of Indian Creek 59
Figure 19. Macroinvertebrate aquatic life support metrics at the Indian Creek study sites during August 2012 and April 2013. A, Macroinvertebrate Biotic Index; B, Kansas Biotic Index; C, Ephemeroptera, Plecoptera, Trichoptera Taxa Richness; D, Percent of Ephemeroptera, Plecoptera, Trichoptera; and E, Kansas Department of Health and Environment Aquatic Life Support Score.
A B
C
E
D
August 2012 April 2013
August 2012 April 2013
Perc
ent o
f Eph
emer
opte
ra,P
leco
pter
a,Tr
icho
pter
aKa
nsas
Bio
tic In
dex
Mac
roin
vert
ebra
te B
iotic
Inde
xEp
hem
erop
tera
, Ple
copt
era,
Tric
hopt
era
Taxa
Ric
hnes
sKa
nsas
Dep
artm
ent o
f Hea
lth a
nd E
nviro
nmen
t A
quat
ic L
ife S
uppo
rt S
core
10
0
20
30
40
50
60
Fullysupporting
Fullysupporting
Fullysupporting
Fullysupporting
Partiallysupporting
Partiallysupporting
Partiallysupporting
Partiallysupporting
NonsupportingNonsupporting
Nonsupporting
Nonsupporting
Fullysupporting
Partiallysupporting
Nonsupporting
aa
a
bb
b
c c
bab
c
a
0
1
2
3
4
ab
c c
a abc
2
4
6
8
b
c
a a a
ab a
aab
aa
b
0
2
4
6
8
10
12
14
a a a
b b b
1.0
1.5
2.0
2.5
3.0
b
119thCollegeMarty
Standard deviationMean
Mission FarmsTomahawkState Line
EXPLANATION
Different letters indicate statistically significant differences (p less than 0.05) in mean values between sites

60 Effects of Wastewater Effluent Discharge on Indian Creek, Johnson County, Kansas
may also have adverse effects on aquatic biota (Corsi and oth-ers, 2010). As discussed for the periphyton saprobidity indices, chloride concentrations were elevated during the months before sample collection in April 2013, likely because of road salt applications for de-icing. Chloride at concentrations above the acute and chronic thresholds may have contributed to the loss of richness and abundance of EPT taxa between the August 2012 and April 2013. Elevated chloride concentrations may persist for extended periods of time after road salt appli-cations (Kaushal and others, 2005), and may also influence macroinvertebrate communities at other times of the year.
Stream Metabolism
Stream metabolism, a measure of ecosystem function, can be an indicator of stream health because function is affected by a combination of physical, chemical, and biologi-cal characteristics, all of which are embedded in metabolism rates (Mulholland and others, 2005; Fellows and others, 2006; Young and others, 2008). Stream metabolism is an estimate of how much carbon is produced and/or consumed during a period of time. Diel variation in dissolved oxygen concentra-tion commonly is used to estimate stream metabolism. During steady streamflow conditions, changes in dissolved oxygen concentration result from photosynthesis (primary production), aerobic respiration (cellular processes that require oxygen to generate energy), and gas exchange with the atmosphere (reaeration; Lewis, 2006). Calculated stream metabolism vari-ables include GPP, CR, NEP, and P/R (Bales and Nardi, 2007). Combined, these variables can indicate an ecosystem-level response to changing environmental conditions. The GPP, CR, and NEP are expressed as grams of oxygen per meter squared per day (g O2/m
2/d). There is some uncertainty associated with reaeration coefficient estimation; therefore, relative differences in metabolism rates among sites should be emphasized rather than absolute values of GPP, CR, and NEP. The GPP and CR are discussed in this section. Data for all four calculated vari-ables are presented in appendix 18.
There currently (2014) are no established procedures or criteria for using stream metabolism estimates to assess stream health; however, Young and others (2008) proposed a prelimi-nary framework for assessing functional stream health using GPP and CR (table 11) based on meta-analysis of published available data. This framework proposes criteria-based ratios describing relative differences in GPP or CR between a test site and a reference site. Young and others (2008) define a test site as a site that is potentially affected and a reference site as a site that is more pristine. The downstream College, Marty, Mission Farms, and State Line sites were considered the test sites and the upstream 119th site was considered the refer-ence site for the Indian Creek study. Use of the 119th site as a reference site for this analysis does not imply that functional stream health is not impaired at this urban site relative to more pristine sites in Johnson County or elsewhere. Rather, all comparisons of functional stream health are relative to the
upstream 119th site and reflect changes along the upstream-downstream gradient. The preliminary criteria proposed by the framework are based on a global range of data and unimpaired reference sites. Additional research is required to develop more region-specific criteria and more specific criteria for comparing relative differences among impaired sites; however, this framework provides a useful method of comparing rela-tive functional stream health upstream and downstream from the WWTFs that discharge to Indian Creek.
Gross Primary ProductionGross primary production (GPP) is net primary pro-
ductivity by autotrophs minus respiration losses. Median GPP for all sites was 0.70 g O2/m
2/d and ranged from 0 to 10.0 g O2/m
2/d (appendix 18). This overall GPP range falls within ranges reported for urban streams in eight regions, including Kansas (0.1–11.9 g O2/m
2/d; Bernot and others, 2010) and a continuously monitored suburban stream in Ohio (0.001–12.5 g O2/m
2/d; Beaulieu and others, 2013), but exceeds the range reported in the upper Blue River at all sites, regardless of urbanization or wastewater influences, by a fac-tor of about 2 (Graham and others, 2010).
The GPP is influenced by light availability, hydrology, water temperature, turbidity, and nutrients (Young and Huryn, 1996; Lamberti and Steinman, 1997; Mulholland and oth-ers, 2001; Uehlinger, 2006; Roberts and others, 2007; Ber-not and others, 2010). In Indian Creek, GPP was positively correlated with nitrate (rho=0.55, p-value<0.01), streamflow (rho=0.37, p-value<0.01), and water temperature (rho=0.30, p-value<0.01,). Light, specific conductance, and turbidity also were significantly (p-value<0.01), and positively, correlated with GPP in Indian Creek, but relations were not as strong (all rho<0.20). These correlations are similar to those variables that were significantly correlated with algal biomass (periphy-ton chlorophyll concentrations) in Indian Creek, demonstrat-ing the inter-relationship between the standing crop of algal biomass and primary production.
Overall, seasonal median GPP was approximately 4.3 times larger in spring (1.30 g O2/m
2/d) than in fall (0.30 g O2/m
2/d) (appendix 18). Median summer and winter
Table 11. Framework and ratio criteria proposed by Young and others (2008) for assessing functional stream health using stream metabolism data.
[GPP, gross primary production; t, test site; r, reference site; CR, community respiration; <, less than; >, greater than]
Ecosystem function
GPPt/GPPr CRt/CRr
No impairment <2.5 0.4–1.6
Mildly impaired 2.5–5.0 0.2–0.4 or 1.6–2.7
Severly impaired >5.0 <0.2 or >2.7

Biological Conditions of Indian Creek 61
GPP estimates were similar (0.80 and 0.90 g O2/m2/d, respec-
tively). Among sites, seasonal GPP maxima were during spring at most sites except College, which was highest in winter, and State Line, which was highest in summer (fig. 20A, appendix 18). Seasonal minima at all sites were in the fall. Other studies have documented similar results, with GPP typi-cally reaching annual maxima in spring (Acuna and others, 2004; Houser and others, 2005; Uehlinger, 2006; Graham and others, 2010; Beaulieu and others, 2013). Seasonal spring maxima in GPP likely are because of longer day length and associated increases in light and water temperature. Light limi-tation because of leaf litter inputs and low water temperatures may contribute to decreased GPP during fall months.
Overall median GPP was highest at the College site (4.25 g O2/m
2/d), located immediately downstream from the Middle Basin WWTF, and lowest at the 119th, Tomahawk, and Mission Farms sites (0.20 to 0.40 g O2/m
2/d) (appendix 18). Seasonally, median GPP at the College site was always at least 2 times higher than any of the other sites (fig. 20A; appen-dix 18). The GPP at the State Line site also was always higher than at the other sites, with the exception of Marty in winter. Patterns along the upstream-downstream gradient were gener-ally consistent among seasons. The GPP increased by a factor of about 10 between the 119th and College sites and then decreased in the downstream direction. By the Mission Farms site, GPP was similar to the two upstream sites. The GPP increased by a factor of about 6 between the Mission Farms and State Line sites. Similarly, in the upper Blue River, GPP downstream from the WWTF was about 2.5 times higher than at the upstream site (Graham and others, 2010). Other studies have also documented higher GPP at wastewater-influenced sites (Bott and others, 2006; Gücker and others, 2006; Yates and others, 2012), likely because of increased growth of aquatic plants and algae stimulated by elevated nutrient con-centrations. Patterns in GPP along the upstream-downstream gradient correspond to patterns in nutrient concentrations (fig. 6F, 8, table 5) and algal biomass (fig. 17, table 9).
Overall median GPP ratios indicated severe impairment of functional stream health at the College site, immediately downstream from the Middle Basin WWTF, and no impair-ment at the other downstream sites relative to the upstream 119th site (table 12). Seasonally, median GPP ratios at the College site were always indicative of severe impairment rela-tive to the upstream 119th site, except for spring, which had ratios indicative of mild impairment. By comparison, median seasonal GPP ratios at the Mission Farms site were always indicative of no impairment relative to the upstream 119th site. Median seasonal GPP ratios at the Marty and State Line sites indicated mild impairment in summer and fall and no impairment relative to the upstream 119th site in spring and winter. In the upper Blue River, annual and seasonal median GPP ratios at the wastewater-influenced site indicated normal functional stream health relative to the upstream 119th site, except during summer when the GPP ratio was indicative of mild impairment (Graham and others, 2010). Indian Creek demonstrates more severe impairment than the upper Blue
River downstream from the WWTF, possibly because the effluent flow from the Middle Basin WWTF (about 15 ft3/s) was about double the flow from the Blue River Main WWTF (about 8 ft3/s) during the study period. The Indian Creek Basin also is substantially more urban (greater than 80 percent urban at all sites) than the upper Blue River Basin (less than 40 percent urban at all sites) and other urban influences may have affected stream health at the downstream sites relative to the upstream 119th site, though patterns along the upstream-downstream gradient indicated wastewater influence. Severe impairment at the College site and mild or no impairment relative to the upstream 119th site at the other downstream sites indicated that wastewater influence on functional stream health in Indian Creek decreases as distance from the WWTFs increases. For example, GPP at the Mission Farms site, located about 9.5-km downstream from the Middle Basin WWTF, was similar to GPP at the two upstream study sites.
Community Respiration
Community respiration (CR) includes respiration by autotrophs (photosynthetic organisms such as algae) and heterotrophs (non-photosynthetic organisms such as bacte-ria, macroinvertebrates, and fish). Median CR for all sites was 2.19 g O2/m
2/d and ranged from 0 to 28.5 g O2/m2/d
(appendix 18). This overall CR range exceeds the range reported for urban streams in eight regions, including Kansas (0.5–17.9 g O2/m
2/d; Bernot and others, 2010) and a continuously monitored suburban stream in Ohio (0.39–12.96 g O2/m
2/d; Beaulieu and others, 2013), as well as the range reported in the upper Blue River by a factor of about 6 (Graham and others, 2010). The range in CR estimates also exceeds the top 5 percent of CR values in a recent synthesis of ecosystem metabolism (22.7 g O2/m
2/d; Hoellein and others, 2013); however, the upper CR range does fall within the range reported for 1 year of continuous monitoring of a midwestern agricultural stream (0.9–34.8 g O2/m
2/d; Griffiths and others, 2013), and approximately 1 year of continuous monitoring of streams in northern Spain (6.3–42.6 g O2/m
2/d; Izagirre and others, 2008). High respiration rates in streams receiving untreated or partially treated wastewater discharges may be due to nutrient inputs (Izagirre and others, 2008).
Like GPP, CR is influenced by hydrology, water tem-perature, turbidity, and nutrients (Mulholland and others, 2001; Hill and others, 2000; Uehlinger, 2000; Roberts and others, 2007; Izagirre and others, 2008; Bernot and others, 2010). The CR was positively correlated with GPP (rho=0.65, p-value<0.01) and relations with environmental variables were similar. The CR in Indian Creek was positively cor-related with nitrate (rho=0.53, p-value<0.01), streamflow (rho=0.38, p-value<0.01), and water temperature (rho=0.32, p-value<0.01) and significantly (p-value<0.01), but less strongly correlated with light, specific conductance, and turbidity (all rho<0.20). Positive correlations between CR, water temperature, and nitrate have been documented in other

62 Effects of Wastewater Effluent Discharge on Indian Creek, Johnson County, Kansas
Figure 20. Seasonal patterns in mean gross primary production and community respiration at the Indian Creek study sites during July 2011 through June 2013. A, gross primary production and B, community respiration.
A
B
0
2
4
6
8
Gros
s pr
imar
y pr
oduc
tion,
in g
ram
s of
oxy
gen
per m
eter
squ
ared
per
dy
Com
mun
ity re
spira
tion,
in g
ram
s of
oxy
gen
per m
eter
squ
ared
per
dy
0
5
10
15
20
25
Spring Summer Fall Winter
119thCollegeMarty
Standard deviationMean
Mission FarmsTomahawkState Line
EXPLANATION

Biological Conditions of Indian Creek
63
Table 12. Seasonal and overall summary of functional stream health ratios at the Indian Creek study sites during July 2011 through June 2013.
[Impact assessment based on Young and others (2008) proposed ratio criteria; n, number of observations]
Time period
College Marty Mission Farms State Line
College:119th ratio Ecosystem function
Marty:119th ratio Ecosystem function
Mission Farms:119th ratio Ecosystem function
State Line:119th ratio Ecosystem functionn Range Median n Range Median n Range Median n Range Median
Gross primary production
Summer 156 0–62.0 9.18 Severly impaired
156 0–22.0 2.92 Mildly impaired
156 0–8.00 0.61 No impair-ment
156 0–91.0 4.00 Mildly impaired
Fall 90 0–66.0 27.2 Severly impaired
90 0–19.0 4.50 Mildly impaired
90 0–7.00 1.00 No impair-ment
90 0–80.0 5.00 Mildly impaired
Winter 146 0–92.0 6.17 Severly impaired
146 0–16.0 2.09 No impair-ment
146 0–7.00 0.25 No impair-ment
146 0–10.0 1.69 No impair-ment
Spring 141 0–23.5 2.82 Mildly impaired
141 0–9.00 1.32 No impair-ment
141 0–2.33 0.16 No impair-ment
141 0–7.33 1.53 No impair-ment
July 2011–June 2013
533 0–92.0 7.14 Severly impaired
533 0–22.0 2.33 No impair-ment
533 0–8.00 0.33 No impair-ment
533 0–91.0 2.00 No impair-ment
Community respiration
Summer 159 0–835 20.4 Severly impaired
159 0–120 3.59 Severly impaired
159 0–60.0 2.38 Mildly impaired
159 0–432 3.77 Severly impaired
Fall 165 0–812 18.5 Severly impaired
165 0–116 3.26 Severly impaired
165 0–50.5 1.36 No impair-ment
165 0–207 2.49 Mildly impaired
Winter 150 0–294 16.7 Severly impaired
150 0–67.7 2.51 Mildly impaired
150 0–25.7 0.64 No impair-ment
150 0–52.6 1.90 Mildly impaired
Spring 142 0–206 6.56 Severly impaired
142 0–109 1.50 No impair-ment
142 0–62.0 0.73 No impair-ment
142 0–154 1.51 No impair-ment
July 2011–June 2013
616 0–835 15.7 Severly impaired
616 0–120 2.65 Mildly impaired
616 0–62.0 1.17 No impair-ment
616 0–432 2.15 Mildly impaired
64 Effects of Wastewater Effluent Discharge on Indian Creek, Johnson County, Kansas
streams across a range of land uses (Bernot and others, 2010; Beaulieu and others, 2013).
Overall seasonal median CR was highest in spring (3.15 g O2/m
2/d) and lowest in winter (1.41 g O2/m2/d; appen-
dix 18). Median summer and fall CR estimates were similar (2.27 g and 2.06 g O2/m
2/d, respectively). Other studies have documented similar results, with CR typically reaching annual maxima in the spring and minima in winter (Uehlinger, 2006; Graham and others, 2010). Seasonal patterns in CR are closely related to water temperatures because metabolic activity generally increases with increasing water temperature, though seasonal water temperature maxima may stress some aquatic organisms (Sinsabaugh, 1997; Hill and others, 2000).
The College site had the highest median CR value (16.2 g O2/m
2/d) and the 119th, Tomahawk, and Mission Farms sites had the lowest CR values (0.94 to 1.38 g O2/m
2/d) (appendix 18). Seasonally, median CR at the College site was always at least 3.6 times higher than at any of the other sites (fig. 20B, appendix 18). The CR at the Marty and State Line sites also was consistently higher than at the other sites. Pat-terns along the upstream-downstream gradient were consistent among seasons and matched patterns observed in GPP. The CR increased by a factor of about 17 between the 119th and College sites and then decreased in the downstream direc-tion before increasing again at the State Line site (fig. 20B). A similar pattern was observed in the upper Blue River, though the magnitude of the increase between the upstream and downstream sites was not as large; CR was about 1.3 times higher downstream from the WWTF than at the upstream site (Graham and others, 2010).
Overall median CR ratios indicated severe impairment of functional stream health at the College site, immediately downstream from the Middle Basin WWTF, mild impair-ment at the Marty and State Line sites, and no impairment at the Mission Farms site relative to the upstream 119th site (table 12). Seasonally, median CR ratios at the College site were always indicative of severe impairment relative to the upstream 119th site. At the Marty and State Line sites, CR ratios indicated severe impairment during summer and either mild or severe impairment during all other seasons except spring, which had ratios indicative of no impairment relative to the upstream 119th site. With the exception of summer, which had CR ratios indicative of mild impairment relative to the upstream 119th site, ratios at the Mission Farms site indicated no impairment. Like GPP, CR ratios indicated more severe impairment in Indian Creek than the upper Blue River, where the downstream site was only mildly impaired rela-tive to the upstream site during summer (Graham and others, 2010). Patterns in CR ratios along the upstream-downstream gradient indicate less severe impairment relative to the 119th site as distance from the Middle Basin WWTF increases.
Effects of Wastewater Effluent Discharge on Environmental and Biological Conditions of Indian Creek
Indian Creek is one of the most urban drainage basins in Johnson County, Kans., and environmental and biological conditions are affected by contaminants from point and other urban sources (Rasmussen and others, 2009b, 2012; Rasmus-sen and Gatotho, 2014). Contaminants from point and other urban sources affect streams by altering hydrology, stream habitat, water chemistry, and biological communities (Welch and Lindell, 1992; U.S. Environmental Protection Agency, 1997; Paul and Meyer, 2001; Cuffney and others, 2010; Poff and others, 2010). The complexity of altered stream systems, biological processes, contaminant sources and transport, and biological responses in urban drainage basins can make it difficult to separate the influence of point and other urban contaminants on environmental and biological conditions. For this study, two urban sites without wastewater influences were compared to four sites located downstream from wastewater effluent discharges. Land use in the entire Indian Creek Basin is primarily urban, allowing a comparison of environmental and biological conditions along an upstream-downstream gra-dient with varying degrees of wastewater influence but little change in urban land use.
A key goal of the Kansas nutrient reduction plan is a 30-percent reduction in annual total nitrogen and phosphorus loads exported from the State (Kansas Department of Health and Environment, 2004); therefore, KDHE established nutrient concentration goals in wastewater effluent as part of the Kan-sas Surface Water Nutrient Reduction Plan. After the addition of biological nutrient removal to the Middle Basin WWTF in 2010, annual mean total nitrogen concentrations in effluent decreased by about 46 percent, but the goal concentration of 8.0 mg/L was still exceeded. Total phosphorus goal concentra-tions of 1.5 mg/L were achieved at the Middle Basin WWTF after the addition of biological nutrient removal to treat-ment processes and at the Tomahawk Creek WWTF after the addition of chemically enhanced primary treatment in 2009. Annual total nitrogen and phosphorus loads from the Middle Basin WWTF decreased by 42 and 54 percent, respectively, even though effluent volume increased by 11 percent. Simi-larly, annual total phosphorus loads from the Tomahawk Creek WWTF also decreased by 54 percent despite a 33-percent increase in effluent volume. During 2010 through 2013, annual discharge from the Middle Basin WWTF was about 75 percent of permitted design capacity. Annual nutrient loads likely will increase when the facility is operated at design capacity; however, estimated potential maximum nutrient loads were 27 to 38 percent lower than before capacity upgrades and the addition of biological nutrient removal to treatment processes.

Effects of Wastewater Effluent Discharge on Environmental and Biological Conditions of Indian Creek 65
Water-quality data have been collected at the State Line site, located about 13 kilometers downstream from the Middle Basin WWTF and 2.3 kilometers downstream from the Toma-hawk Creek WWTF, since 2004, allowing a comparison of water-quality conditions at the site before and after changes in treatment processes at the WWTFs. Water-quality differences at the State Line site were small between the before- and after-upgrade periods, and many observed differences likely were because of among-year variability in weather and streamflow conditions. The most notable difference was in total phospho-rus concentrations. Median total phosphorus concentrations during below-normal and normal streamflow conditions were about 43 percent lower after changes in treatment processes were implemented, reflecting decreases in effluent phosphorus concentrations at both WWTFs. A similar decrease in total nitrogen concentrations was not observed, likely because total nitrogen concentrations only decreased in Middle Basin effluent, and wastewater contributed a higher percentage of streamflow when nutrient samples were collected during the after-upgrade period.
The effects of wastewater effluent on the water quality of Indian Creek were most evident during below-normal and nor-mal streamflows (about 75 percent of the time), when waste-water effluent represented about 24 percent or more of total streamflow. Effluent from the two WWTFs caused changes in stream-water quality that may affect biological community structure and ecosystem processes, including higher concen-trations of bioavailable nutrients (nitrate and orthophosphorus) and warmer water temperatures during winter months. Con-centrations of nutrients downstream from the Middle Basin and Tomahawk Creek WWTFs always exceeded ecoregion-based criteria, even after changes in treatment processes decreased wastewater effluent total nutrient concentrations. Concentrations of nutrients and other water-quality constitu-ents at the downstream sites in Indian Creek are among the highest reported from other stream sites in Johnson County. By comparison, nutrient concentrations at the upstream sites during below-normal and normal streamflows are among the lowest reported from other stream sites in Johnson County, regardless of the urbanization in the Indian Creek Basin (Lee and others, 2005; Poulton and others, 2007; Graham and oth-ers, 2010; Rasmussen and others, 2008, 2009b, 2012, 2014).
The influence of other urban activities also caused changes in stream-water quality that may affect biological community structure and ecosystem processes, including higher turbidities downstream from construction areas and higher specific conductance and chloride concentrations dur-ing winter months. Wastewater effluent discharge increased specific conductance and chloride concentrations in Indian Creek; however, the largest increases were during winter months and likely are linked to road salt applications for de-icing. At concentrations in excess of the EPA acute criterion (860 mg/L), chloride may be toxic to aquatic organisms and cause loss of sensitive taxa in aquatic communities (U.S. Envi-ronmental Protection Agency, 1988; Corsi and others, 2010). In contrast to other studies in Johnson County (Rasmussen and
others, 2009b, 2012; Graham and others, 2010), periphyton and macroinvertebrate communities at all sites during spring 2013 indicated poorer water-quality conditions than during summer 2012. Typically, periphyton and macroinvertebrate communities are indicative of poorer water-quality conditions during summer because of the stress imposed by seasonal low-flow conditions and high water temperatures. Chloride concen-trations exceeded acute (860 mg/L) and chronic (230 mg/L) exposure criteria (U.S. Environmental Protection Agency, 1988) at all Indian Creek study sites, regardless of wastewater influence, for weeks or months during winter 2012–13, and may have had an effect on biological community structure during spring 2013.
Streambed sediment quality may influence the biological condition of Johnson County streams (Rasmussen and others, 2009b, 2012). Wastewater effluent discharge likely influenced streambed sediment quality in Indian Creek. Nutrient con-centrations were higher downstream from the WWTFs and there were several organic wastewater-indicator compounds that were only detected at the downstream sites. Urban factors associated with runoff also likely influenced streambed sedi-ment quality. The PAHs are of particular concern for benthic community diversity, and were detected at all Indian Creek study sites. The PAH concentrations in streambed sediment exceeded probable effects concentrations at the three most downstream sites in the drainage basin.
Habitat conditions in Indian Creek generally declined along the upstream-downstream gradient; however, with the possible exception of riffle-substrate fouling, wastewater effluent did not have a measurable effect on in-stream habi-tat conditions at the downstream sites. General decline in habitat conditions along the upstream-downstream gradient likely was caused by the cumulative effects of urbanization with increasing drainage basin size. Riffle-substrate fouling generally was higher at the sites located downstream from the WWTFs. Increased periphytic algal biomass and the occur-rence of nuisance filamentous algae at the downstream sites likely contributed to increased riffle-substrate fouling, but patterns in riffle substrate fouling scores along the upstream-downstream gradient did not reflect patterns in algal biomass. Other factors, such as accumulation of sediment, likely also contributed to riffle-substrate fouling at the downstream sites. Canopy cover, which influences in-stream light conditions, also decreased along the upstream-downstream gradient, likely because of the natural widening of the stream channel as more tributaries flow into Indian Creek (Vannote and others, 1980; Allan, 1995).
Periphyton community composition at all sites was indicative of somewhat degraded, eutrophic conditions with small to moderate amounts of organic enrichment (Bahls, 1993; Porter, 2008). Despite this overall similarity, periphy-ton community composition was influenced by wastewater effluent discharges into Indian Creek. The relative abundance of eutrophic and nitrogen-heterotrophic diatoms, indicative of nutrient enrichment, was higher at the downstream sites than the upstream sites. Conversely, the relative abundance of

66 Effects of Wastewater Effluent Discharge on Indian Creek, Johnson County, Kansas
oligosaprobic and beta-meso saprobic diatoms, indicative of unpolluted conditions, was higher at the upstream sites than the downstream sites.
Algal biomass, as estimated by chlorophyll, and primary production were lowest at the upstream sites and highest immediately downstream from the WWTFs, indicating condi-tions for algal growth were more favorable at the downstream sites. Algal biomass occasionally exceeded the KDHE thresh-old of 150 mg/m2 at all sites, but at the College site, located immediately downstream from the Middle Basin WWTF, the threshold was exceeded about 28 percent of the time dur-ing August 2011 through September 2012. The increase in primary production was substantial enough to indicate mild to severe impairment at the College site relative to the upstream 119th site year-round and mild impairment at the State Line site during summer and fall. Algal growth and primary produc-tion commonly increase downstream from WWTFs because of the constant source of bioavailable nutrients (Welch and others, 1992; Lewis and others, 2002; Dyer and others, 2003; Bott and others, 2006; Gücker and others, 2006; Yates and others, 2012). Increased periphytic algal biomass and primary production at the downstream sites may be a direct response to nutrient enrichment, as indicated by the positive correlation with nitrate. There are other factors that affect algal biomass and primary production in streams that may have affected algal growth in Indian Creek, including light, water tempera-ture, streamflow, and grazer abundance (Welch and Lindell, 1992; Allan, 1995; Young and others, 2008).
Light is a key factor limiting algal growth and primary production in temperate streams (Allan, 1995; Hill and others, 2001; Young and others, 2008). Algal biomass at the 119th site was substantially lower than any of the other Indian Creek study sites, including the upstream Tomahawk site. Decreased light conditions may have limited algal biomass at the 119th site; light intensity was lower at the 119th site than at the other Indian Creek sites, likely because of increased canopy cover. By comparison, algal biomass at the upstream Tomahawk site, which had similar water-quality conditions to the 119th site but higher light intensity, was 2 times higher than at the 119th site. Despite differences in algal biomass, primary production was similar between the two upstream sites.
Water temperature affects the growth and metabolic rates of aquatic organisms, with higher water temperatures causing higher rates (Welch and Lindell, 1992). Primary production was positively correlated with water temperature in Indian Creek, but algal biomass had a negative correlation. This dif-ference may be caused by consumption by grazers that reduce the standing crop of algal biomass but not the amount of biomass being produced. Peak primary production was during spring at all sites except College, where peak production was during winter. Water temperatures at the College site were substantially higher than other sites during winter because of the WWTF effluent discharge. Warmer winter water tempera-tures at this site may have stimulated production.
During low-flow conditions, increases in streamflow may enhance nutrient uptake and growth of algal periphyton
(Welch and Lindell, 1992). Streamflow at the downstream sites was always higher than the upstream sites because of wastewater effluent contributions and may have been suf-ficient to enhance uptake and stimulate algal growth. At all Indian Creek study sites, algal biomass, represented by periphyton chlorophyll concentration, generally increased with streamflows until around 50 ft3/s; at higher streamflows, algal biomass decreased.
Macroinvertebrate grazers may effectively decrease algal biomass in streams, even under nutrient enriched conditions (Welch and Lindell, 1992). Some macroinvertebrates have developed a specific feeding strategy to remove algae and other periphyton from surfaces by scraping (Cummins, 1974; Barbour and others, 1999). The relative abundance of scrapers did not indicate clear patterns along the upstream-downstream gradient in Indian Creek (appendix 17); however, the approach used to evaluate macroinvertebrate communities in this study was semiquantitative, and does not allow a meaningful com-parison of the number of organisms present at each site. More scrapers may have been present at the upstream sites even though relative abundance did not indicate clear among-site patterns.
Macroinvertebrate communities indicated impairment at all sites in Indian Creek. The KDHE aquatic life support scores indicated conditions nonsupporting of aquatic life, regardless of wastewater influences. The Mission Farms site, located about 9.5 kilometers downstream from the Middle Basin WWTF, was partially supporting of aquatic life in August 2012. Although macroinvertebrate communities indi-cated degraded conditions at all sites, a few metrics indicated some patterns along the upstream-downstream gradient. For example, in August 2012, EPT richness was highest at the upstream sites and lowest at the sites located immediately downstream from the WWTFs. Common wastewater efflu-ent constituents such as nutrients, chloride, trace metals, and organic wastewater-indicator compounds in water and sedi-ments may be important in structuring macroinvertebrate com-munity composition downstream from WWTFs (Birge and others, 1989; Dickson and others, 1992; Diamond and Daley, 2000; Dyer and Wang, 2002; Camargo and Álonso, 2006). However, macroinvertebrate communities also are sensitive to the effects from urbanization and contaminants from other urban sources, and loss of sensitive taxa begin to occur at low levels of urban land use (Booth and Jackson, 1997; Richards and others, 1996; Roth and others, 1996; Roy and others, 2003; Brown and others, 2009). Several environmental condi-tions associated with urbanization were documented at all Indian Creek study sites including degraded habitat conditions, elevated chloride concentrations, and PAHs in streambed sediment. Because macroinvertebrate communities indicated severe impairment at all Indian Creek sites, wastewater and other urban factors that influence hydrology, water quality, and habitat quality likely had a substantial influence on the biological conditions of Indian Creek.
Evaluation of functional stream health is complemen-tary to traditional water-quality and biological monitoring

Effects of Wastewater Effluent Discharge on Environmental and Biological Conditions of Indian Creek 67
approaches, because measures of ecosystem function, such as stream metabolism, integrate the influence of physical, chemical, and biological stressors. Environmental stressors may affect habitat, water quality, and/or biological communi-ties (ecosystem structure) but not overall ecosystem func-tion, ecosystem function but not structure, or both; therefore, comprehensive assessments of stream impairment need to include measures of ecosystem structure and function (Mull-holland and others, 2005; Fellows and others, 2006; Young and others, 2008). Stream metabolism was calculated for most days during July 2011 through June 2013, allowing the evalu-ation of primary production and community respiration along the upstream-downstream gradient at a temporal resolution that is not feasible for more traditional biological monitoring approaches.
Overall, functional stream health at the College site was severely impaired and the Marty and State Line sites were mildly impaired relative to the upstream 119th site. Col-lege was the only site that was impaired during all seasons; the Marty and State Line sites were not impaired relative to the upstream 119th site during spring. The College site was located about 1.0 km downstream from the Middle Basin WWTF, and wastewater effluent contributed a larger part of streamflow at the College site than at any other downstream site. The State Line site was located further downstream (about 2.4 km) from a WWTF than the College site, and wastewater contributions to streamflow were about 32 percent less; therefore, wastewater-associated effects on environmen-tal and biological conditions and on functional stream health were highest at the College site.
Seasonally, all sites except Mission Farms were impaired relative to the upstream 119th site during summer and fall based on primary production ratios. Based on community respiration ratios, all sites were severely impaired during sum-mer, except for Mission Farms, which was mildly impaired relative to the upstream 119th site during summer. Biological communities typically experience increased stress during sum-mer because of seasonal low-flow conditions and high water temperatures. Wastewater effluent likely represented more than one-half of the streamflow at the downstream Indian Creek study sites during most of the summer, thereby having a substantial influence on water-quality conditions and causing additional stress on biological communities. Differences in environmental and biological conditions along the upstream-downstream gradient likely were more extreme during sum-mer than other times of the year, resulting in seasonal impair-ment of functional stream health at some sites.
Streams may recover downstream from WWTF effluent discharges through natural dilution and biological uptake and degradation processes. The distance a stream takes to recover depends on a variety of factors including streamflow, effluent volume and composition, water temperature, and pH (Miller, 1991). Patterns in several environmental and biological vari-ables along the upstream-downstream gradient in Indian Creek indicated some stream recovery.
Nutrient concentrations were highest immediately down-stream from the Middle Basin WWTF and decreased in the downstream direction until effluent from the Tomahawk Creek WWTF entered the stream and concentrations increased again. The decrease in nutrient concentrations along the upstream-downstream gradient between the College site, located about 1.0 km downstream from the Middle Basin WWTF, and the Mission Farms site, located about 9.5 km downstream, indicates that nutrients are being diluted and/or utilized by biological processes in Indian Creek; however, the distance between the Middle Basin and Tomahawk Creek WWTFs is not sufficient to allow dilution and biological processes to decrease nutrients to the more natural concentrations observed at the upstream sites. Streambed sediment phosphorus concen-trations were highest at the sites located immediately down-stream from the WWTFs. At the Mission Farms site, sedi-ment phosphorus concentration was similar to the upstream sites, indicating that nutrient cycling along the 8.5-km reach between the College and Mission Farms sites may have been sufficient to decrease sediment phosphorus concentrations to levels observed at the upstream sites. Several organic waste-water-indicator compounds also indicated similar increases and decreases along the upstream-downstream gradient with respect to the WWTFs.
Algal periphyton biomass and community metrics and a few macroinvertebrate community metrics also indicated patterns along the upstream-downstream gradient. Generally, the largest differences were between the upstream sites and the sites located immediately downstream from the WWTFs and some metrics indicated improvement in condition as distance from the Middle Basin WWTF increased. Primary production, community respiration, and functional stream health ratios provide the clearest indication of some stream recovery from wastewater influences along the upstream-downstream gradi-ent. Primary production and community respiration followed the same pattern as nutrients; values increased between the 119th and College sites, decreased in the downstream direction to the Mission Farms site, and then increased again at the State Line site. Estimates of primary production and community respiration at the downstream Mission Farms site generally were similar to estimates at the upstream sites. Overall, func-tional stream health ratios reflected this pattern, with severe impairment at the College site relative to the upstream 119th site, mild impairment at the Marty site, no impairment at the Mission Farms site, and mild impairment at the State Line site. The overall similarity in stream metabolism metrics and lack of impairment relative to the upstream 119th site at the Mis-sion Farms site indicates that ecosystem processes along the 8.5-km reach of Indian Creek between the College and Mis-sion Farms sites may have been sufficient to restore functional stream health to conditions similar to those at the urban 119th site located upstream from the WWTFs.
A complex range of physical, chemical, and biological factors may potentially affect biological community compo-sition and ecosystem processes, and these factors may vary seasonally (Robinson and Minshall, 1986; Welch and Lindell,
68 Effects of Wastewater Effluent Discharge on Indian Creek, Johnson County, Kansas
1992; Allan, 1995; Linke and others, 1999; Hill and others, 2001). Cause-and-effect relations are difficult to determine without conducting manipulative field and/or laboratory experiments through a range of spatial and temporal condi-tions. This complexity makes it difficult to determine which environmental factors most affect biological conditions and ecosystem function in Indian Creek; however, results from this study indicate that wastewater effluent likely influenced algal periphyton biomass and community composition, primary production, and community respiration in Indian Creek. The mechanisms causing the changes in these biological variables are unclear, though elevated nutrient concentrations were positively correlated with algal biomass, primary produc-tion, and community respiration. Results from this study also indicate that urban influences, other than wastewater effluent discharge, control macroinvertebrate community structure in Indian Creek.
Changes in treatment processes at the Middle Basin and Tomahawk Creek WWTFs improved wastewater efflu-ent quality and decreased nutrient loads, but the wastewater effluent discharges still had negative effects on the environ-mental and biological conditions at downstream Indian Creek sites. Wastewater effluent discharge into Indian Creek likely contributed to changes in measures of ecosystem structure (streamflow, water and streambed-sediment chemistry, algal biomass, and algal periphyton community composition) and function (primary production and community respiration) along the upstream-downstream gradient. Wastewater efflu-ent discharges maintained streamflows and increased nutrient concentrations, algal biomass, primary production, and com-munity respiration at the downstream sites. Functional stream health was severely impaired downstream from the Middle Basin WWTF and mildly impaired downstream from the Tomahawk Creek WWTF relative to the urban 119th upstream site. As distance from the Middle Basin WWTF increased, nutrient concentrations, algal biomass, primary production, and community respiration decreased, and by 9.5 km down-stream from the discharge, functional stream health was no longer impaired relative to the urban upstream site. Therefore, although wastewater effluent caused persistent changes in environmental and biological conditions and functional stream health at sites located immediately downstream from WWTF effluent discharges, some recovery to conditions more similar to the urban upstream site occurred within a relatively short distance.
SummaryIndian Creek is one of the most urban drainage basins in
Johnson County, Kansas, and environmental and biological conditions are affected by contaminants from point and other urban sources. The Johnson County Douglas L. Smith Middle Basin Wastewater Treatment Facility (WWTF) (hereafter referred to as the “Middle Basin”) is the largest point-source
discharge on Indian Creek. A second WWTF, the Tomahawk Creek WWTF, discharges into Indian Creek about 11 kilo-meters (km) downstream from the Middle Basin WWTF. In summer 2010, upgrades to increase capacity from 18.6 to 22.4 cubic feet per second (ft3/s) and include biological nutrient removal at the Middle Basin WWTF were com-pleted. There have been no recent infrastructure changes at the Tomahawk Creek WWTF; however, during 2009, chemi-cally enhanced primary treatment was added to the treatment process for better process settling before disinfection and dis-charge with the added effect of enhanced phosphorus removal. The U.S. Geological Survey, in cooperation with Johnson County Wastewater, assessed the effects of wastewater effluent on environmental and biological conditions of Indian Creek by comparing two upstream sites to four sites located down-stream from the WWTFs using data collected during June 2004 through June 2013.
The purpose of this report is to describe the effects of wastewater effluent discharge and facility upgrades on the environmental and biological conditions in Indian Creek, downstream from the Middle Basin and Tomahawk Creek WWTFs. This report includes (1) an evaluation of streamflow and water-quality conditions before and after upgrades and upstream and downstream from the WWTFs using previously and newly collected discrete and continuous data, (2) esti-mates of total nutrient concentrations and loads upstream and downstream from the WWTFs using regression models developed using discrete and continuous data, (3) evaluation of streambed-sediment chemistry, (4) habitat assessment, and (5) a comparison of algal periphyton and macroinvertebrate community metrics and ecosystem function (primary produc-tion and community respiration) along the upstream-down-stream gradient. Evaluation of environmental and biological data allows assessment of the physical, chemical, and result-ing ecological effects of wastewater effluent discharges in an urban area.
Five sites along a 15.4-km reach of Indian Creek and one site on Tomahawk Creek, the largest tributary to Indian Creek, were included in the study. The 119th and Tomahawk sites are located upstream from WWTF effluent discharges. The College, Marty, and Mission Farms sites are located 1.0, 5.1, and 9.5-km, respectively, downstream from the Middle Basin WWTF effluent discharge. The State Line site is located 13-km downstream from the Middle Basin WWTF effluent discharge and 2.3-km downstream from the Tomahawk Creek WWTF effluent discharge. Previously collected streamflow data were available for the Marty and State Line sites and previously collected water-quality (discrete and continu-ous) data were available for the State Line site. Continuous water-quality monitors were operated at all six sites from July 1, 2011, through June 30, 2013 and discrete water-quality samples were collected at all six sites from June 1, 2011, through June 30, 2013. Water-quality, algal periphyton, and macroinvertebrate samples were collected from all six sites during below-normal streamflow conditions in August 2012 and normal to slightly above-normal streamflow conditions

Summary 69
in April 2013. In addition, habitat conditions were assessed in July 2012 and sediment-quality samples were collected in April 2013.
The contribution of wastewater effluent to streamflow at the downstream sites ranged from negligible (less than 1 per-cent) during large runoff events to nearly 100 percent dur-ing the lowest streamflows. Wastewater effluent represented more than 90 percent of total streamflow about 38 percent and 19 percent of the time at the Marty and State Line sites, respectively, during the study period (January 2004 through December 2013). Capacity upgrades from 18.6 to 22.4 ft3/s at the Middle Basin WWTF did not have a substantial influ-ence on the wastewater effluent contribution to streamflows in Indian Creek.
The Middle Basin and Tomahawk Creek wastewater effluent discharges caused changes in water temperature and the concentration of some water-quality constituents that may affect biological community structure and function, including higher concentrations of bioavailable nutrients (nitrate and orthophosphorus). Other urban sources of contaminants also caused changes in the concentration of some water-quality constituents, including specific conductance and chloride concentrations. Wastewater effluent caused downstream sites to be warmer during the winter and cooler during the summer than upstream sites; the influence of effluent on stream-water temperature was most pronounced during the winter and at the College site, immediately downstream from the Middle Basin WWTF. The effects of wastewater effluent on the water quality of Indian Creek were most evident during below-normal and normal streamflows (about 75 percent of the time), when wastewater effluent contributed more than 24 percent to total streamflow. Nutrient concentrations changed more than other measures of water chemistry as a result of the effect of wastewater effluent. Total and inorganic nutrient concentra-tions at the downstream sites during below-normal and normal streamflows were 10 to 100 times higher than at the upstream sites, and were highest at the sites located immediately downstream from the WWTFs. Wastewater effluent discharge increased specific conductance and chloride concentrations of Indian Creek; however, the largest increases were during win-ter months and likely were caused by road salt applications for de-icing. Chloride concentrations exceeded acute and chronic exposure criteria at all Indian Creek study sites, regardless of wastewater influence, for weeks or months during winter.
After the addition of biological nutrient removal to the Middle Basin WWTF in 2010, annual mean total nitrogen concentrations in effluent decreased by 46 percent, but the National Pollutant Discharge Elimination System (NPDES) wastewater effluent permit goal concentration of 8.0 mil-ligrams per liter (mg/L) was still exceeded. The NPDES wastewater effluent permit goal total phosphorus concentra-tion of 1.5 mg/L was achieved at the Middle Basin WWTF after the addition of biological nutrient removal in 2010 and at the Tomahawk Creek WWTF after the addition of chemically enhanced primary treatment in 2009. Annual total nitrogen and phosphorus loads from the Middle Basin WWTF decreased by
42 and 54 percent, respectively, even though effluent volume increased by 11 percent. Annual total phosphorus loads from the Tomahawk Creek WWTF decreased by 54 percent despite a 33-percent increase in effluent volume. During 2010 through 2013, annual discharge from the Middle Basin WWTF was about 75 percent of permitted design capacity. Annual nutri-ent loads likely will increase when the facility is operated at design capacity; however, estimated potential maximum nutrient loads were 27 to 38 percent lower than before capac-ity upgrades and the addition of biological nutrient removal to treatment processes.
Water-quality differences at the State Line site were small between the before- and after-upgrade periods. The most nota-ble difference was in total phosphorus concentrations. Median total phosphorus concentrations during below-normal and nor-mal streamflow conditions were about 43 percent lower after changes in treatment processes were implemented, reflect-ing decreases in effluent phosphorus concentrations at both WWTFs. A similar decrease in total nitrogen concentrations was not observed, likely because total nitrogen concentra-tions only decreased in Middle Basin effluent, and wastewater contributed a higher percentage of streamflow when nutrient samples were collected during the after-upgrade period.
Nutrient loads at the downstream State Line site were estimated during 2005 through 2012 and nutrient loads at all sites were estimated during July 2011 through June 2013 based on regression models developed using discrete and continuous data. During 2005 through 2012, total nitrogen and total phosphorus from the WWTFs contributed between about 30 and nearly 100 percent to annual nutrient loads in Indian Creek depending on streamflow conditions. Most of the total nitrogen typically comes from wastewater effluent except during years with the highest streamflows; most of the total phosphorus typically comes from wastewater effluent during dry years and from other urban sources during wet years. During July 2011 through June 2013, total nutrient loads increased along the upstream-downstream gradient, with the largest increases between sites located immediately upstream and downstream from the WWTFs. The contribu-tion of wastewater to total nutrient loads was highest at the College site and lowest at the State Line site. Monthly total phosphorus and nitrogen loads from the WWTFs ranged from about 4 and 20 percent, respectively, when streamflow was dominated by stormwater runoff (typically spring and early summer), to nearly 100 percent during drier months (typically late summer).
Nutrient concentrations in streambed sediment were highest downstream from the WWTFs. Polyaromatic hydro-carbons (PAHs) were detected at all Indian Creek study sites and exceeded probable effects concentrations at the three most downstream sites in the drainage basin, indicating urban factors associated with runoff may be influencing sediment quality at these sites. Eleven organic wastewater-indicator compounds were detected only at the downstream sites; of these compounds, five had clear patterns with respect to the WWTFs.

70 Effects of Wastewater Effluent Discharge on Indian Creek, Johnson County, Kansas
Light intensity was generally lowest at the 119th site and highest at the State Line site. The difference in light conditions among sites reflects the decrease in canopy cover along the upstream-downstream gradient. Total habitat scores indicated suboptimal and marginal conditions at all sites, and generally decreased in the downstream direction. The individual habitat variables with the largest among-site differences in score were percentage of altered banks, riffle-substrate fouling, and sub-strate cover and diversity. Scores for these variables generally decreased along the upstream-downstream gradient, with the highest scores at the 119th or Tomahawk sites and the lowest at the State Line site.
Overall periphyton community composition at all sites was indicative of somewhat degraded, eutrophic conditions with small to moderate amounts of organic enrichment. Pat-terns in periphyton metrics along the upstream-downstream gradient reflected the patterns observed in nutrient concen-trations. The relative abundance of eutrophic and nitrogen-heterotrophic diatoms, indicative of nutrient enrichment, increased immediately downstream from the WWTFs and generally decreased as distance from WWTF effluent dis-charge increased. The relative abundance of oligosaprobic and beta-mesosaprobic diatoms, indicative of unpolluted condi-tions, followed the opposite pattern with decreases immedi-ately downstream from the WWTFs and increases as distance from WWTF effluent discharge increased.
Periphytic algal biomass, as estimated by chlorophyll, and primary production were lowest at the upstream sites and highest immediately downstream from the WWTFs, indi-cating conditions for algal growth were more favorable at the downstream sites. Increased algal biomass and primary production at the downstream sites may be a direct response to nutrient enrichment at these sites. Patterns along the upstream-downstream gradient generally matched patterns in nutrient concentration, and algal biomass and primary production were positively correlated with nitrate. Many other factors also affect algal growth. Increased light because of decreased canopy cover, increased streamflow, increased water tempera-tures during winter, and changes in scraper abundance at the downstream sites all may have contributed to the increases in algal biomass and primary production at the downstream sites.
Macroinvertebrate communities indicated impairment at all Indian Creek sites. The Kansas Department of Health and Environment (KDHE) aquatic life support scores indi-cated conditions nonsupporting of aquatic life, regardless of wastewater influences. Macroinvertebrate communities also are sensitive to the effects of urbanization and contaminants from other urban sources on streams, and loss of sensitive taxa begins to occur at low levels of urban land use. Because macroinvertebrate communities indicated severe impairment at all Indian Creek sites, wastewater and other urban factors that influence hydrology, water quality, and habitat quality likely had a substantial influence on the biological conditions of Indian Creek.
Primary production and community respiration were con-sistently higher at the sites located immediately downstream
from the WWTFs than the upstream sites, regardless of season. There were clear patterns along the upstream gradi-ent; primary production and community respiration increased between the 119th and College sites, decreased in the down-stream direction to the Mission Farms site, and then increased again at the State Line site. Estimates of primary production and community respiration at the downstream Mission Farms site were generally similar to estimates at the upstream sites. Functional stream health was evaluated using a preliminary framework based on primary production and community respiration. Overall functional stream health ratios indicated severe impairment at the College site, mild impairment at the Marty site, no impairment at the Mission Farms site, and mild impairment at the State Line site relative to the upstream 119th site. Seasonally, all sites except Mission Farms were impaired relative to the upstream 119th site during summer and fall based on primary production ratios. Based on community res-piration ratios, all sites were severely impaired relative to the upstream 119th site during summer, except for Mission Farms, which was mildly impaired. Differences in environmental and biological conditions along the upstream-downstream gradient likely were more extreme during summer than other times of the year, resulting in seasonal or more severe impairment of functional stream health relative to the urban upstream site.
A complex range of physical, chemical, and biological factors may potentially affect biological community compo-sition and ecosystem processes, and these factors may vary seasonally. Cause-and-effect relations are difficult to deter-mine without conducting manipulative field and/or laboratory experiments through a range of spatial and temporal condi-tions. This complexity makes it difficult to determine which environmental factors most affect biological conditions and ecosystem function in Indian Creek; however, results from this study indicate that wastewater effluent likely influenced algal periphyton biomass and community composition, primary production, and community respiration in Indian Creek. The mechanisms causing the changes in these biological variables are unclear, though elevated nutrient concentrations were positively correlated with algal biomass, primary produc-tion, and community respiration. Results from this study also indicate that urban influences, other than wastewater effluent discharge, control macroinvertebrate community structure in Indian Creek.
Changes in treatment processes at the Middle Basin and Tomahawk Creek WWTFs improved wastewater effluent qual-ity and decreased nutrient loads, but the wastewater effluent discharges still had negative effects on the environmental and biological conditions at downstream Indian Creek sites. Waste-water effluent discharge into Indian Creek likely contributed to changes in measures of ecosystem structure (streamflow, water and streambed-sediment chemistry, algal biomass, and algal periphyton community composition) and function (primary production and community respiration) along the upstream-downstream gradient. Wastewater effluent discharges main-tained streamflows and increased nutrient concentrations, algal biomass, primary production, and community respiration at

References Cited 71
the downstream sites. Functional stream health was severely impaired downstream from the Middle Basin WWTF and mildly impaired downstream from the Tomahawk Creek WWTF relative to the urban upstream site. As distance from the Middle Basin WWTF increased, nutrient concentrations, algal biomass, primary production, and community respira-tion decreased, and by 9.5 km downstream from the discharge, functional stream health was no longer impaired relative to the urban upstream site. Therefore, although wastewater effluent caused persistent changes in environmental and biological conditions and functional stream health at sites located imme-diately downstream from WWTF effluent discharges, some recovery to conditions more similar to the urban upstream site occurred within a relatively short distance.
References Cited
Acuna, V., Giorgi, A., Munoz, I., Uehlinger, U., and Sabater, S., 2004, Flow extremes and benthic organic matter shape the metabolism of a headwater Mediterranean stream: Freshwater Biology, v. 49, p. 960–971.
Allan, J.D., 1995, Stream ecology—Structure and function of running waters: Boston, Mass., Kluwer Academic Publish-ers, 388 p.
American Public Health Association, American Water Works Association, and Water Environment Federation, 2005, Standard methods for the examination of water and waste-water (21st ed.): Washington D.C., American Public Health Association, 1,368 p.
Arar, E.J., and Collins, G.B., 1997, U.S. Environmental Protection Agency Method 445.0, In vitro determination of chlorophyll-a and pheophytin a in marine and freshwater algae by fluorescence, Revision 1.2: Office of Research and Development, 22 p.
Bahls, L.L., 1993, Periphyton bioassessment methods for Montana streams: Water Quality Bureau, Department of Health and Environmental Sciences, 69 p.
Bales, J.D., and Nardi, M.R., 2007, Automated routines for calculation of whole-stream metabolism—Theoretical background and user’s guide: U.S. Geological Survey Tech-niques and Methods, book 4, chap. C2, 33 p.
Barbour, M.T., Gerritsen, J., Snyder, B.D., and Stribling, J.B., 1999, Rapid bioassessment protocols for use in streams and wadeable rivers—Periphyton, benthic macroinvertebrates, and fish (2d ed.): U.S. Environmental Protection Agency Report, EPA 841/B-99/002, 18 p.
Barbour, M.T., Diamond, J.M., and Yoder, C.O., 1996, Biolog-ical assessment strategies—Applications and limitations, in Grothe, D.R., Dickson, K.L, and Reed-Judkins, D.K., eds., Whole effluent toxicity testing—An evaluation of methods and prediction of receiving system impacts: Pensacola, Florida, SETAC Press, p. 245–270.
Beaulieu, J.J., Arango, C.P., Balz, D.A., and Shuster, W.D., 2013, Continuous monitoring reveals multiple controls on ecosystem metabolism in a suburban stream: Freshwater Biology, v. 58, p. 918–937.
Bernot, M.J., Sobota, D.J., Hall, R.O., Mulholland, P.J., Dodds, W.K., Webster, J.R., Tank, J.L., Ashkenas, L.R., Cooper, L.W., Dahm, C.N., Gregory, S.V., Grimm, N.B., Hamilton, S.K., Johnson, S.L., McDowell, W.H., Meyer, J.L., Peterson, B., Poole, G.C., Valett, H.M., Arango, C., Beaulieu, J.J., Burgin, A.J., Crenshaw, C., Helton, A.M., Johnson, L., Merriam, J., Niederlehner, B.R., O’Brien, J.M., Potter, J.D., Sheibley, R.W., Thomas, S.M., and Wilson, K., 2010, Inter-regional comparison of land-use effects of stream metabolism: Freshwater Biology, v. 55, p. 1874–1890.
Birge, W., Black, J., Short, T., and Westerman, A., 1989, A comparative ecological and toxicological investigation of a secondary wastewater treatment plant effluent and its receiving stream: Environmental Toxicology and Chemistry, v. 8, p. 437–450.
Booth, D.B., and Jackson, C.R., 1997, Urbanization of aquatic systems—Impacts, solutions, and prognoses: Northwest Environmental Journal, v. 7, p. 93–118.
Bott, T.L., Montgomery, D.S., Newbold, J.D., Arscott, D.B., Dow, C.L., Aufdenkampe, A.K., Jackson, J.K., and Kaplan, L.A., 2006, Ecosystem metabolism in streams of the Catskill Mountains (Delaware and Hudson River basins) and Lower Hudson Valley: Journal of the North American Benthological Society, v. 25, p. 1018–1044.
Brenton, R.W., and Arnett, T.L., 1993, Methods of analysis by the U.S. Geological Survey National Water Quality Laboratory—Determination of dissolved organic carbon by uv-promoted persulfate oxidation and infared spectrometry: U.S. Geological Survey Open-File Report 92–480, 12 p.
Brower, J.E., Zar, J.H., and von Ende, C.N., 1990, Field and laboratory methods for general ecology (3d ed.): Dubuque, Iowa, Wm. C. Brown Publishers, 237 p.
Brown, Z.A., and Curry, K.J., 2002a, Total carbon by combus-tion, chap. R of Taggart, J.E., Jr., 2002, Analytical meth-ods for chemical analysis of geologic and other materials, U.S. Geological Survey: U.S. Geological Survey Open-File Report 2002–223, p. R1–R4.

72 Effects of Wastewater Effluent Discharge on Indian Creek, Johnson County, Kansas
Brown, Z.A., and Curry, K.J., 2002b, Total sulfur by combus-tion, chap. Q of Taggart, J.E., Jr., 2002, Analytical meth-ods for chemical analysis of geologic and other materials, U.S. Geological Survey: U.S. Geological Survey Open-File Report 2002–223, p. Q1–Q4.
Brown, Z.A., Papp, C., Brandt, E., and Aruscavage, P., 2002, Carbonate carbon by coulometric titration, chap. S of Tag-gart, J.E., Jr., 2002, Analytical methods for chemical analy-sis of geologic and other materials, U.S. Geological Survey: U.S. Geological Survey Open-File Report 2002–223, p. S1–S6.
Brown, L.R., Cuffney, T.E., Coles, J.F., Fitzpatrick, F., McMa-hon, G., Steuer, J., Bell, A.H., and May, J.T., 2009, Urban streams across the USA—Lessons learned from studies in 9 metropolitan areas: Journal of the North American Ben-thological Society, v. 28, no. 4, p. 1051–1069.
Burkhardt, M.R., Zaugg, S.D., Smith, S.G., and ReVello, R.C., 2006, Determination of wastewater compounds in sedi-ment and soil by pressurized solvent extraction, solid-phase extraction, and capillary-column gas chromatography/mass spectrometry: U.S. Geological Survey Techniques and Methods, book 5, chap. B2, 33 p.
Camargo, J.A., and Alonso, Á., 2006, Ecological and toxi-cological effects of inorganic nitrogen pollution in aquatic ecosystems—A global assessment: Environment Interna-tional, v. 32, p. 831–849.
Carlisle, D.M., Nelson, S.M., and Eng, K., 2014, Macroinver-tebrate community condition associated with the severity of streamflow alteration: River Research and Applications, v. 30, p. 29–39.
Cheremisinoff, P.N., 1995, Handbook of water and waste-water treatment technology: New York Marcell Dekker, Inc., 833 p.
Childress, C.J.O., Foreman, W.T., Connor, B.F., and Malo-ney, T.J., 1999, New reporting procedures based on long-term method detection levels and some considerations for interpretations of water-quality data provided by the U.S. Geological Survey National Water-Quality Laboratory: U.S. Geological Survey Open-File Report 99–193, 19 p.
Corsi, S.R., Graczyk, D.J., Geis, S.W., Booth, N.L., and Rich-ards, K.D., 2010, A fresh look at road salt—Aquatic toxicity and water-quality impacts on local, regional and national scales: Environmental Science and Technology, v. 44, no. 19, p. 7376–7382.
Cuffney, T.F., 2003, User’s manual for the National Water-Quality Assessment Program Invertebrate Data Analysis System (IDAS) software—Version 3: U.S. Geological Survey Open-File Report 03–172, 103 p.
Cuffney, T.F., Brightbill, R.A., May, J.T., and Waite, I.R., 2010, Responses of benthic macroinvertebrates to envi-ronmental changes associated with urbanization in nine metropolitan areas: Ecological Applications, v. 20, no. 5, p. 1384–1401.
Cummins, K.W., 1974, The structure and function of stream ecosystems: Bioscience, v. 24, p. 631–641.
Daughton, C.G., and Ternes, T.A., 1999, Pharmaceuticals and personal care products in the environment—Agents of subtle change: Environmental Health Perspectives, v. 107 (supplement 6), p. 907–938.
Davenport, T.E., and Kelly, M.H., 1983, Water resource data and preliminary trend analysis for the Highland Silver Lake Monitoring and Evaluation Project, Madison County, Ill., phase II: Springfield, Illinois Environmental Protection Agency, Report No. IEPA/WPC/83-013, [variously paged].
Dickson, K., Waller, W., Kennedy, J., and Amman, L., 1992, Assessing the relationship between ambient toxicity and instream biological response: Environmental Toxicology and Chemistry, v. 11, p. 1307–1322.
Diamond, J., and Daley, C., 2000, What is the relationship between whole effluent toxicity and instream biological condition?: Environmental Toxicology and Chemistry, v. 19, p. 158–168.
Dodds, W.K., and Gudder, D.A., 1992, The ecology of Cladophora: Journal of Phycology, v. 28, p. 415–427.
Duan, N., 1983, Smearing estimate—A nonparametric retrans-formation method: Journal of the American Statistical Association, v. 78, p. 605–610.
Dyer, S.D., and Wang, X., 2002, A comparison of stream biological responses to discharge from wastewater treatment plants in high and low population density areas: Environ-mental Toxicology and Chemistry, v. 21, p. 1065–1075.
Dyer, S.D., Peng, C., McAvoy, D.C., Fendinger, N.J., Mass-cheleyn, P., Castillo, L.V., and Lim, J.M.U., 2003, The influ-ence of untreated wastewater to aquatic communities in the Balatuin River, the Philippines: Chemosphere, v. 52, p. 43–53.
Fellows, C.S., Clapcott, J.E., Udy, J.W., Bunn, S.E., Harch, B.D., Smith, M.J., and Davies, P.M., 2006, Benthic metabo-lism as an indicator of stream ecosystem health: Hydrobio-logia, v. 572, p. 71–87.
Fishman, M.J., and Friedman, L.C., 1989, Methods for determination of inorganic substances in water and fluvial sediments: U.S. Geological Survey Techniques of Water-Resources Investigations, book 5, chap. A1, 545 p.

References Cited 73
Florida Department of Environmental Protection, 2008, Deter-mination of biological indices: accessed March 2014 at http://publicfiles.dep.state.fl.us/dear/sas/sopdoc/2008sops/lt7000.pdf.
Focazio, M.J., Kolpin, D.W., Barnes, K.K., Furlong, E.T., Meyer, M.T., Zaugg, S.D., Barber, L.B., and Thurman, M.E., 2008, A national reconnaissance for pharmaceuticals and other organic wastewater contaminants in the United States—II) untreated drinking water sources: Science of the Total Environment, v. 402, p. 201–216.
Fry, J., Xian, G., Jin, S., Dewitz, J., Homer, C., Yang, L., Barnes, C., Herold, N., and Wickham, J., 2011, National land cover database for the conterminous United States: Photogrammetric Engineering and Remote Sensing, v. 77, p. 858–864.
Graham, J.L., Loftin, K.A., Ziegler, A.C., and Meyer, M.T., 2008, Cyanobacteria in lakes and reservoirs—Toxin and taste-and-odor sampling guidelines (ver. 1.0): U.S. Geo-logical Survey Techniques of Water-Resources Investiga-tions, book 9, chap. A7, section 7.5, 65 p., accessed Sep-tember 2014 at http://water.usgs.gov/owq/FieldManual/Chapter7/7.5.pdf.
Graham, J.L., Stone, M.L., Rasmussen, T.J., and Poulton, B.C., 2010, Effects of wastewater effluent discharge and treatment facility upgrades on environmental and biological conditions of the Upper Blue River, Johnson County, Kan-sas and Jackson County, Missouri, January 2003 through March 2009: U.S. Geological Survey Scientific Investiga-tions Report 2010–5248, 85 p.
Griffiths, N.A., Tank, J.L., Royer, T.V., Roley, S.S., Rosi-Marshall, E.J., Whiles, M.R., Beaulier, J.J., and Johnson, L.T., 2013, Agricultural land use alters the seasonality and magnitude of stream metabolism: Limnology and Oceanog-raphy, v. 58, p. 1513–1529.
Gücker, B., Brauns, M., and Pusch, M.T., 2006, Effects of wastewater treatment plant discharge on ecosystem struc-ture and function of lowland streams: Journal of the North American Benthological Society, v. 25, p. 313–329.
Guy, H.P., 1969, Laboratory theory and methods for sediment analysis: U.S. Geological Survey Techniques of Water-Resources Investigations, book 5, chap. C1, 58 p.
Hageman, P.L., Brown, Z.A., and Welsch, E., 2002, Arsenic and selenium by flow injection or continuous flow-hydride generation-atomic absorption spectrometry, chap. L of Tag-gart, J.E., Jr., 2002, Analytical methods for chemical analy-sis of geologic and other materials, U.S. Geological Survey: U.S. Geological Survey Open-File Report 2002–223, p. L1–L7.
Hambrook-Berkman, J.A., and Canova, M.G., 2007, Algal biomass indicators (ver. 1.0): U.S. Geological Survey Tech-niques of Water-Resources Investigations, book 9, chap. A7, section 7.4,86 p., accessed September 2014 at http://pubs.water.usgs.gov/twri9A/.
Helsel, D.R., and Hirsch, R.M., 2002, Statistical methods in water resources—Hydrologic analysis and interpretation: U.S. Geological Survey Techniques of Water-Resources Investigations, book 4, chap. A3, 510 p.
Hem, J.D., 1992, Study and interpretation of chemical charac-teristics of natural water (3d ed.): U.S. Geological Survey Water-Supply Paper 2254, 263 p.
Hill, B.H., Hall, R.K., Husby, P., Herlihy, A.T., and Dunne, M., 2000, Interregional comparisons of sediment micro-bial respiration in streams: Freshwater Biology, v. 44, p. 213–222.
Hill, W.R., Mulholland, P.J., and Marzolf, E.R., 2001, Stream ecosystem responses to forest leaf emergence in spring: Ecology, v. 82, p. 2306–2319.
Hoellein, T.J., Bruesewitz, D.A., and Richardson, D.C., 2013, Revisiting Odum (1956)—A synthesis of aquatic ecosys-tem metabolism: Limnology and Oceanography, v. 58, p. 2089–2100.
Horowitz, A.J., 1991, A primer on trace-metal sediment chemistry (2d ed.): Ann Arbor, Michigan, Lewis Publishing Company, 136 p.
Horowitz, A.J., and Stephens, V.C., 2008, The effects of land use on fluvial sediment chemistry for the conterminous U.S., Results from the first cycle of the NAWQA Pro-gram—Trace and major elements, phosphorus, carbon, and sulfur: Science of the Total Environment, v. 400, p. 290–314.
Houser, J.N., Mulholland, P.J., and Maloney, K.O., 2005, Catchment disturbance and stream metabolism—Patterns in ecosystem respiration and gross primary production along a gradient of upland soil and vegetation disturbance: Journal of the North American Benthological Society, v. 24, p. 538–552.
Huggins, D.G., and Moffett, M.F., 1988, Proposed biotic and habitat indices for use in Kansas streams: Lawrence, Kan-sas, Kansas Biological Survey, Report 35, 183 p.
Izagirre, O., Agirre, U., Bermejo, M., Pozo, J., and Elosegi, A., 2008, Environmental controls of whole-stream metabolism identified from continuous monitoring of Basque streams: Journal of the North American Benthological Society, v. 27, p. 252–268.
Johnson County Parks and Recreation District, 2014, Trail guides, accessed September 2014 at http://www.jcprd.com/parks_facilities/trailguide.cfm.

74 Effects of Wastewater Effluent Discharge on Indian Creek, Johnson County, Kansas
Johnson County Wastewater, 2012, 2011 Annual report: 20 p. accessed April 2013 at http://www.jcw.org/aupublications.htm.
Johnson County Wastewater, 2013, 2012 Annual report: 20 p., accessed November 2013 at http://www.jcw.org/aupublications.htm.
Kansas Department of Health and Environment, 2000, Divi-sion of Environment, quality management plan, Part III—Stream biological monitoring program, quality assurance management plan: Topeka, Kansas, Bureau of Environmen-tal Field Services, Technical Services section, 42 p.
Kansas Department of Health and Environment, 2004, Surface water nutrient reduction plan: Topeka, Kansas, Bureau of Water, 47 p.
Kansas Department of Health and Environment, 2005, Kansas Administrative Regulations (KAR), Title 28, Article 16, Surface water quality standards: Topeka, Kansas, accessed April 2013 at http://www.kdheks.gov/water/download/kwqs_plus_supporting.pdf.
Kansas Department of Health and Environment, 2007, Mis-souri Basin total maximum daily load, waterbody, Indian Creek, water quality impairment—Nitrate: accessed March 2014 at http://www.kdheks.gov/tmdl/mo/IndianCr_Nitrate_2007.pdf.
Kansas Department of Health and Environment, 2008, Kansas integrated water quality assessment: accessed April 2013 at http://www.kdheks.gov/befs/download/2008IR_040108FINAL.pdf.
Kansas Department of Health and Environment, 2010, Smoky Hill-Saline Baslin total maximum daily load, waterbody, Big Creek, water quality impairment—Total phosphorus: accessed July 2014 at http://www.kdheks.gov/tmdl/2010/Big_TP.pdf.
Kansas Department of Health and Environment, 2012, 2012 Kansas 303(d) list of impaired waters: accessed April 2013 at http://www.kdheks.gov/tmdl/methodology.htm.
Kansas Department of Health and Environment, 2014, Methodology for the evaluation and development of the 2014 section 303(d) list of impaired water bodies for Kansas: accessed March 2014, at http://www.kdheks.gov/tmdl/2014/2014_303_d_Methodology.pdf.
Karr, J.R., Fausch, K.D., Angermeier, P.L., Yant, P.R., and Schlosser, L.J., 1986, Assessing biological integrity in run-ning waters—A method and its rationale: Illinois Natural History Survey, Special Publication 5, 28 p.
Kaushal, S.S., Groffman, P.M., Likens, G.E., Belt, K.T., Stack, W.P., Kelly, W.K., Band, L.E., and Fisher, G.T., 2005, Increased salinization of fresh water in the northeastern United States: Proceedings of National Academy of Sci-ences, v. 102, p. 13517–13520.
Kentucky Division of Water, 1993, Methods for assessing biological integrity of surface waters: Frankfurt, Kentucky, Kentucky Department of Environmental Protection, 182 p.
Knowlton, M.F., 1984, Flow-through microcuvette for fluo-rometric determination of chlorophyll: Water Resources Bulletin, v. 20, p. 1198–1205.
Kolpin, D.W., Furlong, E.T., Meyer, M.T., Thurman, E.M., Zaugg, S.D., Barber, L.B., and Buxton, H.T., 2002, Pharma-ceuticals, hormones, and other organic wastewater con-taminants in U.S. streams, 1999–2000—A national recon-naissance: Environmental Science and Technology, v. 36, p. 1202–1211.
Kolpin, D.W., Skopec, M., Meyer, M.T., Furlong, E.T., and Zaugg, S.D., 2004. Urban contribution of pharmaceuticals and other organic wastewater contaminants to streams dur-ing differing flow conditions: Science of the Total Environ-ment, v. 328, p. 119–130.
Lamberti, G.A., and Steinman, A.D., 1997, A comparison of primary production in stream ecosystems: Journal of the North American Benthological Society, v. 16, p. 95–104.
Lee, C.J., Mau, D.P., and Rasmussen, T.J., 2005, Effects of nonpoint and selected point contaminant sources on stream-water quality and relation to land use in Johnson County, northeastern Kansas, October 2002 through June 2004: U.S. Geological Survey Scientific Investigations Report 2005–5144, 104 p.
Lee, C.J., and Ziegler, A.C., 2010, Effects of urbanization, construction activity, management practices, and impound-ments on suspended-sediment transport in Johnson County, northeast Kansas, February 2006 through November 2008: U.S. Geological Survey Scientific Investigations Report 2010–5128, 54 p.
Lewis, M.A., Weber, D.L., and Moore, J.C., 2002, An evalu-ation of the use of colonized periphyton as an indicator of wastewater impact in near-coastal areas of the Gulf of Mexico: Archives of Environmental Contamination and Toxicology, v. 43, p. 11–18.
Lewis, M.E., 2006, Dissolved oxygen: U.S. Geological Survey Techniques of Water-Resources Investigations, book 9, chap. A6, section 6.2, 59 p., accessed April 2013 at http://pubs.water.usgs.gov/twri9A6.
Linke, S., Bailey, R.C., and Schwindt, J., 1999, Temporal vari-ability of stream bioassessments using benthic macroinver-tebrates: Freshwater Biology, v. 42, p. 575–584.
Lohman, K., Jones, J.R., and Perkins, B.D., 1992, Effects of nutrient enrichment and flood frequency on periphyton biomass in northern Ozark streams: Canadian Journal of Fisheries and Aquatic Sciences, v. 49, no. 6, p. 1198–1205.

References Cited 75
Lowe, R.L., and LaLiberte, G.D., 2007, Benthic stream algae—Distribution and structure, in Hauer, F.R., and Lamberti, G.A., eds., Methods in Stream Ecology (2d ed.): Boston, Mass., Academic Press, p. 327–380.
Lowe, R.L., and Pan, Y., 1996, Benthic algal communities as biological monitors, in Stevenson, R.J., Bothwell, M.L., and Lowe, R.L., eds., Algal ecology: San Diego, Academic Press, p. 705–739.
MacDonald, D.D., Ingersoll, C.G., and Berger, T.A., 2000, Development and evaluation of consensus-based sediment quality guidelines for freshwater ecosystems: Archives of Environmental Conaminants, v. 30, p. 20–31.
Maidment, D.R., 1993, Handbook of hydrology: New York, McGraw-Hill, Inc. [variously paged].
Marzolf, E.R., Mulholland, P.J., and Steinman, A.D., 1994, Improvements to the diurnal upstream-downstream dis-solved oxygen change technique for determining whole-stream metabolism in small streams: Canadian Journal of Fisheries and Aquatic Sciences, v. 51, p. 1591–1599.
Mid-America Regional Council, 2013, National resources inventory layer, accessed September, 2014 at http://www.marc.org/Environment/Natural-Resources/Natural-Resources-Inventory/Natural-Resource-Inventory.
Miller, G.T., Jr., 1991, Environmental Science: Belmont, Cali-fornia, Wadsworth Publishing Company, 465 p.
Miller, A.T., Hanson, M.A., Church, J.O., Palik, B., Bowe, S.E., and Butler, M.G., 2008, Invertebrate community varia-tion in seasonal forest wetlands—Implications for sampling and analyses: Wetlands, v. 28, p. 874–881.
Morin, A., and Cattaneo, A., 1992, Factors affecting sam-pling variability of freshwater periphyton and the power of periphyton studies: Canadian Journal of Fisheries and Aquatic Sciences, v. 49, p. 1695–1703.
Moulton, S.R., II, Carter, J.L., Grotheer, S.A., Cuffney, T.F., and Short, T.M., 2000, Methods of analysis by the U.S. Geological Survey National Water Quality Laboratory—Processing, taxonomy, and quality control of benthic mac-roinvertebrate samples: U.S. Geological Survey Open-File Report 2000–212, 49 p.
Moulton, S.R., II, Kennen, J.G., Goldstein, R.M., Hambrook, J.A., 2002, Revised protocols for sampling algal, inverte-brate, and fish communities as part of the National Water-Quality Assessment Program: U.S. Geological Survey Open File Report 02–150, 75 p.
Mulholland, P.J., Fellows, C.S., Tank, J.L., Grimm, N.B., Webster, J.R., Hamilton, S.K., Marti, E., Ashkenas, L., Bowden, W.B., Dodds, W.K., McDowell, W.H., Paul, M.J., and Peterson, B.J., 2001, Inter-biome comparison of factors controlling stream metabolism: Freshwater Biology, v. 46, p. 1503–1517.
Mullholland, P.J., Houser, J.N., and Maloney, K.O., 2005, Stream diurnal dissolved oxygen profiles as indicators of in-stream metabolism and disturbance effects—Fort Benning as a case study: Ecological Indicators, v. 5, p. 243–252.
Murdock, J., Roelke, D., and Gelwick, F., 2004, Interac-tions between flow, periphyton, and nutrients in a heavily impacted urban stream—Implications for stream restoration effectiveness: Ecological Engineering, v. 22, p. 197–207.
O’Dell, J.W., 1993a, Determination of nitrate-nitrite nitrogen by automated colorimetry: U.S. Environmental Protection Agency, Office of Water, Office of Research and Develop-ment, 14 p. [Also available at http://www.caslab.com/EPA-Methods/PDF/EPA-Method-3532.pdf.]
O’Dell, J.W., 1993b, Determination of total Kjeldahl nitro-gen by semi-automated colorimetry: U.S. Environmental Protection Agency, Office of Water, Office of Research and Development, 15 p. [Also available at http://www.caslab.com/EPA-Methods/PDF/EPA-Method-3512.pdf.]
Odum, H.T., 1956, Primary production in flowing waters: Limnology and Oceanography, v. 1, p. 102–117.
Oklahoma Conservation Commission, 1993, Development of rapid bioassessment protocols for Oklahoma utilizing characteristics of the diatom community: Oklahoma City, Oklahoma Conservation Commission, 104 p.
Paul, M.J., and Meyer, J.L., 2001, Streams in the urban land-scape: Annual Review of Ecology and Systematics, v. 32, p. 333–365.
Pellerin, B.A., Bergamaschi, B.A., Downing, B.D., Saraceno, J.F., Garrett, J.A., and Olsen, L.D., 2013, Optical techniques for the determination of nitrate in environmental waters—Guidelines for instrument selection, operation, deploy-ment, maintenance, quality assurance, and data reporting: U.S. Geological Survey Techniques and Methods, book 1, chap. D5, 37 p.
Poff, N.L., Allan, J.D., Bain, M.B., Karr, J.R., Prestegaard, K.L., Richter, B.D., Sparks, R.E., and Stromberg, J.C., 1997, The natural flow regime: BioScience, v. 47, p. 769–784.
Poff, N.L., Richter, B.D., Arthington, A.H., Bunn, S.E., Naiman, R.J., Kendy, E., Acreman, M., Apse, C., Bledsloe, B.D., Freeman, M.C., Henriksen, J.A., Jacobson, R.B., Ken-nen, J.G., Merritt, D.M., O’Keeffe, J.H., Olden, J.D., Rog-ers, K., Tharme, R.E., and Warner, A., 2010, The ecological limits of hydrologic alteration (ELOHA): A new framework for developing regional environmental flow standards: Freshwater Biology, v. 55, no. 1, p. 147–170.
Poff, N.L., and Zimmerman, J.K.H., 2010, Ecological responses to altered flow regimes—A literature review to inform the science and management of environmental flows: Freshwater Biology, v. 55, p. 194–205.

76 Effects of Wastewater Effluent Discharge on Indian Creek, Johnson County, Kansas
Ponader, K., and Charles, D., 2005, New Jersey periphyton bioassessment protocol manual: accessed March 2014 at http://www.state.nj.us/dep/dsr/periphyton/protocols_njalgae.pdf.
Porter, S.D., 2008, Algal attributes—An autecological clas-sification of taxa collected by the National Water-Quality Assessment Program: U.S. Geological Survey Data Series 329, 18 p., accessed March 2014 at http://pubs.usgs.gov/ds/ds329.
Poulton, B.C., Rasmussen, T.J., and Lee, C.J., 2007, Assess-ment of biological conditions at selected stream sites in Johnson County, Kansas and Cass and Jackson Counties, Missouri, 2003 and 2004: U.S. Geological Survey Scientific Investigations Report 2007–5108, 68 p.
Radtke, D.B., 2005, Bottom-material samples—Version 1.1: U.S. Geological Survey Techniques of Water-Resources Investigations, book 9, chap. A8, accessed April 2013 at http://pubs.water.usgs.gov/twri9A8/.
Rasmussen, P.P., and Ziegler, A.C., 2003, Comparison and continuous estimates of fecal coliform and Escherichia coli bacteria in selected Kansas streams, May 1999 through April 2002: U.S. Geological Survey Water-Resources Inves-tigations Report 03–4056, 80 p.
Rasmussen, P.P., Gray, J.R., Glysson, G.D., and Ziegler, A.C., 2009a, Guidelines and procedures for computing time-series suspended-sediment concentrations and loads from in-stream turbidity-sensor and streamflow data: U.S. Geo-logical Survey Techniques and Methods, book 3, chap. C4, 53 p.
Rasmussen, T.J., Ziegler, A.C., and Rasmussen, P.P., 2005, Estimation of constituent concentrations, densities, loads, and yields in lower Kansas River, northeast Kansas, using regression models and continuous water-quality monitor-ing, January 2000 through December 2003: U.S. Geological Survey Scientific Investigations Report 2005–5165, 117 p.
Rasmussen, T.J., Lee, C.J., and Ziegler, A.C., 2008, Estimation of constituent concentrations, loads, and yields in streams of Johnson County, northeast Kansas, using continuous water-quality monitoring and regression models, October 2002 through December 2006: U.S. Geological Survey Scientific Investigations Report 2008–5014, 103 p.
Rasmussen, T.J., Poulton, B.C., and Graham, J.L., 2009b, Quality of streams in Johnson County, Kansas, and rela-tions to environmental variables, 2003–07: U.S. Geological Survey Scientific Investigations Report 2009–5235, 95 p.
Rasmussen, T.J., Stone, M.L., Poulton, B.C., and Graham, J.L., 2012, Quality of streams in Johnson County, Kansas, 2002–10: U.S. Geological Survey Scientific Investigations Report 2012–5279, 103 p.
Rasmussen, T.J., and Gatotho, J., 2014, Water-quality vari-ability and constituent transport and processes in streams of Johnson County, Kansas, using continuous monitoring and regression models, 2003–11: U.S. Geological Survey Scientific Investigations Report 2013–5221, 64 p.
Richards, C., Johnson, L.B., and Host, G.E., 1996, Land-scape-scale influences on stream habitats and biota: Canadian Journal of Fisheries and Aquatic Sciences, v. 53, p. 295–311.
Roberts, B.J., Mulholland, P.J., and Hill, W.R., 2007, Multiple scales of temporal variability in ecosystem metabolism rates: results from 2 years of continuous monitoring in a forested headwater stream: Ecosystems, v. 10, p. 588–606.
Robinson, C.T., and Minshall, G.W., 1986, Effects of distur-bance frequency on stream benthic community structure in relation to canopy cover and season: Journal of the North American Benthological Society, v. 5, p. 237–248.
Rosen, B.H., 1995, Use of periphyton in the development of biocriteria, in Davis, W.S., and Simon, T.P., eds., Biologi-cal assessment and criteria: Boca Raton, Florida, Lewis Publishers, p. 209–215.
Rosenberg, D.M., and Resh, V.H., 1993, Introduction to fresh-water biomonitoring and benthic macroinvertebrates, in Rosenberg, D.M, and Resh, V.H., eds., Freshwater biomoni-toring and benthic macroinvertebrates: New York, Chapman and Hall, Inc., p. 1–9.
Roth, N.E., Allen, J.D., and Erickson, D.L., 1996, Landscape influences on stream biotic integrity assessed at multiple spatial scales: Landscape Ecology, v. 11, p. 141–156.
Roy, A.H., Rosemond, A.D., Paul, M.J., Leigh, D.S., and Wallace, J.B., 2003, Stream macroinvertebrate response to catchment urbanization (Georgia, USA): Freshwater Biol-ogy, v. 48, p. 329–346.
Sartory, D.P., and Grobbelar, J.U., 1986, Extraction of chlo-rophyll-a from freshwater phytoplankton for spectrophoto-metric analysis: Hydrobiologia, v. 114, p. 117–187.
Sauer, V.B., and Turnipseed, D.P., 2010, Stage measurement at gaging stations: U.S. Geological Survey Techniques and Methods, book 3, chap. A7, 45 p. [Also available at http://pubs.usgs.gov/tm/tm3-a7/.]
Shelton, L.R., and Capel, P.D., 1994, Guidelines for collected and processing samples of stream bed sediment for analysis of trace elements and organic contaminants for the National Water-Quality Assessment Program: U.S. Geological Sur-vey Open-File Report 94–458, 31 p.
Sinsabaugh, R.L., 1997, Large-scale trends for stream ben-thic respiration, in Webster, J.R., Meyer, J.L., eds., Stream organic matter budgets: Journal of the North American Benthological Society, v. 16, p. 119–122.

References Cited 77
Sokal, R.R., and Rohlf, F.J., 1995, Biometry—The principles and practice of statistics in biological research (3d ed.): New York, W.H. Freeman and Company, 887 p.
Southerland, M.T., and Stribling, J.B., 1995, Status of bio-logical criteria development and implementation, in Davis, W.S., and Simon, T.P., eds., Biological assessment and criteria—Tools for water resource planning and decision making: Boca Raton, Florida, Lewis Publishers, p. 81–96.
Stevenson, R.J., 1997, Scale-dependent determinants and consequences of benthic algal heterogeneity: Journal of the North American Benthological Society, v. 16, no. 1, p. 248–262.
Stevenson, R.J., and Bahls, L.L., 1999, Periphyton protocols, in Barbour, M.T., Gerritson, J., Snyder, B.D., and Stribling, J.B., eds., Rapid bioassessment protocols for use in streams and wadeable rivers—Periphyton, benthic macroinverte-brates, and fish (2d ed.): Washington, D.C., U.S. Environ-mental Protection Agency, Office of Water, 841-B-99-002, p. 6/1–6/23.
Stevenson, R.J., and Rollins, S.L., 2007, Ecological Assess-ments with Benthic Algae, in Hauer, F.R., and Lamberti, G.A., eds., Methods in Stream Ecology (2d ed.): Burlington, Mass., Academic Press, p. 785–804.
Stienmann, A.D., Lamberti, G.A., and Leavitt, P.R., 2006, Biomass and pigments of benthic algae, in Haver, F.R., and Lamberti, G.A., eds., Methods in stream ecology (2d ed.): Burlington, Mass., Academic Press, p. 357–379.
Stone, M.L., and Graham, J.L., 2014, Model documentation for relations between continuous real-time and discrete water-quality constituents in Indian Creek, Johnson County, Kansas, June 2004– May 2013: U.S. Geological Survey Open-File Report 2014–1170, 70 p.
Suplee, M.W., Watson, V., Teply, M., and McKee, H., 2009, How green is too green? Public opinion of what constitutes undesirable algae levels in streams: Journal of the American Water Resources Association, v. 45, no. 1, p. 123–140.
Taggart, J.E., Jr., ed., 2002, Analytical methods for chemical analysis of geologic and other materials, U.S. Geological Survey: U.S. Geological Survey Open-File Report 2002–223, [variously paged].
Tchobanoglous, G., Burton, F.L., and Stensel, H.D., 2003, Wastewater engineering, treatment and reuse (4th ed.): Bos-ton, McGraw-Hill, 1,819 p.
Turnipseed, D.P., and Sauer, V.B., 2010, Discharge measure-ments at gaging stations: U.S. Geological Survey Tech-niques and Methods, book 3, chap. A8, 87 p. [Also available at http://pubs.usgs.gov/tm/tm3-a8/.]
Uehlinger, U., 2000, Resistance and resilience of ecosystem metabolism in a flood-prone river system: Freshwater Biol-ogy, v. 45, p. 319–332.
Uehlinger, U., 2006, Annual cycle and inter-annual variability of gross primary production and ecosystem respiration in a floodprone river during a 15-year period: Freshwater Biol-ogy, v. 51, p. 938–950.
U.S. Census Bureau, 2013, State and county quickfacts: accessed April 2013 at http://quickfacts.census.gov/qfd/states/20/20091.html.
U.S. Environmental Protection Agency, 1983, Methods for chemical analysis of water and wastes: U.S. Environmental Protection Agency Report 600/4-79/020, [variously paged].
U.S. Environmental Protection Agency, 1988, Ambient water quality criteria for chloride—1988: Washington, D.C., Office of Water, Regulations and Standards Criteria and Standards Division, 39 p.
U.S. Environmental Protection Agency, 1997, National water quality inventory—1996 Report to Congress: U.S. Envi-ronmental Protection Agency, EPA 841-R-97-008, 527 p., accessed March 2014 at http://www.epa.gov/305b/96report/index.html.
U.S. Environmental Protection Agency, 1999a, Wastewater technology fact sheet—Ultraviolet disinfection: Washing-ton, D.C., U.S. Environmental Protection Agency, Office of Water, EPA 832-F-99-064, 7 p.
U.S. Environmental Protection Agency, 1999b, Wastewater technology fact sheet—Chlorine disinfection: Washington, D.C., U.S. Environmental Protection Agency, Office of Water, EPA 832-F-99-062, 7 p.
U.S. Environmental Protection Agency, 2000a, Ambient water quality criteria recommendations—Information supporting the development of state and tribal nutrient criteria, rivers and streams in nutrient ecoregion IX: Washington, D.C., U.S. Environmental Protection Agency, Office of Water, EPA/822/B-00-019, 108 p.
U.S. Environmental Protection Agency, 2000b, Methods for measuring the toxicity and bioaccumulation of sediment-associated contaminants with freshwater invertebrates (2d ed.), 212 p., accessed September 2014 at http://water.epa.gov/polwaste/sediments/cs/freshfact.cfm.
U.S. Environmental Protection Agency, 2009, National water quality inventory: Report to Congress, Washington, D.C., U.S. Environmental Protection Agency, Office of Water, EPA 841-R-08-001 [variously paged], accessed July 2013 at http://water.epa.gov/lawsregs/guidance/cwa/305b/2004report_index.cfm.
78 Effects of Wastewater Effluent Discharge on Indian Creek, Johnson County, Kansas
U.S. Environmental Protection Agency, 2013, Aquatic life ambient water quality criteria for ammonia-freshwater 2013: Washington, D.C., U.S. Environmental Protection Agency, Office of Water, Office of Science and Technol-ogy, EPA 822-R-13-001, 242 p., accessed February 2014 at http://water.epa.gov/scitech/swguidance/standards/criteria/aqlife/ammonia/upload/AQUATIC-LIFE-AMBIENT-WATER-QUALITY-CRITERIA-FOR-AMMONIA-FRESHWATER-2013.pdf.
U.S. Geological Survey, 2006, Collection of water samples (ver. 2.0): U.S. Geological Survey Techniques of Water-Resources Investigations, book 9, chap. A4, accessed April 2013 at http://pubs.water.usgs.gov/twri9A4/.
U.S. Geological Survey, 2014, USGS WaterWatch, accessed September 2014 at http://waterwatch..usgs.gov.
Van Dam, H., Mertens, A., and Sinkeldam, J., 1994, A coded checklist and ecological indicator values of freshwater dia-toms from the Netherlands: Netherlands Journal of Aquatic Ecology, v. 28, no. 1, p. 117–133.
Van Metre, P.C., Mahler, B.J., and Wilson, J.T., 2008, PAHs underfoot—Contaminated dust from coal-tar sealcoated pavement is widespread in the United States: Environmental Science and Technology, v. 43, p. 20–25.
Vannote, R.L., Minshall, G.W., Cummins, K.W., Sedell, J.R., Cushing, C.E., 1980, The river continuum concept: Canadian Journal of Fisheries and Aquatic Sciences, v. 37, p. 130–137.
Wagner, R.J., Boulger, R.W., Jr., Oblinger, C.J., and Smith, B.A., 2006, Guidelines and standard procedures for con-tinuous water-quality monitors—Station operation, record computation, and data reporting: U.S. Geological Survey Techniques and Methods, book 1, chap. D3, 96 p.
Walsh, C.R., Roy, A.H., Feminella, J.W., Cottingham, P.D., Groffman, P.M., and Morgan, R.P., II, 2005, The urban stream syndrome—Current knowledge and a search for a cure: Journal of the North American Benthological Society, v. 24, p. 706–723.
Welch, E.B., and Lindell, T., 1992, Ecological effects of wastewater (2d ed.): London, Spon Press, 425 p.
Welch, E.B., Quinn, J.M., and Hickey, C.W., 1992, Periphyton biomass related to point-source nutrient enrichment in seven New Zealand streams: Water Research, v. 26, p. 669–675.
Werner, D., ed., 1977, The biology of diatoms: Berkeley, Uni-versity of California Press, v. 13, 498 p.
Wetzel, R.G., 2001, Limnology of lake and river ecosystems: New York, Academic Press, 1,006 p.
Wilkison, D.H., Armstrong, D.J., and Blevins, D.B., 2002, Effects of wastewater and combined sewer overflows on water quality in the Blue River Basin, Kansas City, Mis-souri and Kansas, July 1998–October 2000: U.S. Geological Survey Water-Resources Investigations Report 02–4107, 162 p.
Wilkison, D.H., Armstrong, D.J., Norman, R.D., Poulton, B.C., Furlong, E.T., and Zaugg, S.D., 2006, Water quality in the Blue River Basin, Kansas City Metropolitan Area, Missouri and Kansas, July 1998 to October 2004: U.S. Geo-logical Survey Scientific Investigations Report 2006–5147, 170 p.
Wilkison, D.H., Armstrong, D.J., and Hampton, S.A., 2009, Character and trends of water quality in the Blue River Basin, Kansas City Metropolitan Area, Missouri and Kan-sas, 1998 through 2007: U.S. Geological Survey Scientific Investigations Report 2009–5169, 211 p.
Yates, A.G., Brua, R.B., Culp, J.M., and Chambers, P.A., 2012, Multi-scaled drivers of rural prairie stream metabo-lism along human activity gradients: Freshwater Biology, v. 58, p. 675–689.
Young, R.G., and Huryn, A.D., 1996, Interannual variation in discharge controls ecosystem metabolism along a grassland river continuum, Canadian Journal of Fisheries and Aquatic Sciences, v. 53, p. 2199–2211.
Young, R.G., Matthaei, C.D., and Townsend, C.R., 2008, Organic matter breakdown and ecosystem metabolism—Functional indicators for assessing river ecosystem health: Journal of the North American Benthological Society, v. 27, p. 605–625.
Zar, J.H., 1999, Biostatistical analysis (4th ed): New Jersey, Prentice-Hall Inc., 663 p..
Zaugg, S.D., Smith, S.G., Schroeder, M.P., Barber, L.B., and Burkhardt, M.R., 2006, Methods of analysis by the U.S. Geological Survey National Water Quality Laboratory—Determination of wastewater compounds by polystyrene-divinylbenzene solid-phase extraction and capillary-column gas chromatography/mass spectrometry: U.S. Geological Survey Water-Resources Investigations Report 01–4186, 37 p.

Publishing support provided by: Rolla Publishing Service Center
For additional information concerning this publication, contact: Director, USGS Kansas Water Science Center 4821 Quail Crest Place Lawrence, KS 66049 (785) 842–9909
Or visit the Kansas Water Science Center Web site at: http://ks.water.usgs.gov

Graham and others—
Effects of Wastew
ater Effluent Discharge on Indian Creek, Johnson County, Kansas—
Scientific Investigations Report 2014–5187
ISSN 2328-0328 (online)
http://dx.doi.org/10.3133/sir20145187