Embed Size (px)
Citation preview
IIIIII IIIIIII -
NASA Technical Paper 1365 -
Simulation Cueing Systems on Pilot Performance During Takeoffs With Engine Failures
Benton L. Parris and Anthony M. Cook
DECEMBER 1978
NASA
https://ntrs.nasa.gov/search.jsp?R=19790005911 2018-06-12T11:02:08+00:00Z

NASA Technical Paper 1365
Effects of Visual and Motion Simulation Cueing Systems on Pilot Performance During Takeoffs With Engine Failures
Benton L. Parris and Anthony M. Cook A m e s Research Ceiiter
Moflett Field, California
National Aeronautics and Space Administration
Scientific and Technical Information Office
1978

TABLE OF CONTENTS
Page
NOMENCLATURE . . . . . . . . . . . . . . . . . . . . . . . . . . . . v
SUMMARY . . . . . . . . . . . . . . . . . . . . . . . . . . . . . . . i
INTRODUCTION . . . . . . . . . . . . . . . . . . . . . . . . . . . . . 1
SIMULATION EQUIPMENT . . . . . . . . . . . . . . . . . . . . . . . . 2 Motion System . . . . . . . . . . . . . . . . . . . . . . . . . . . . 2 Visual System . . . . . . . . . . . . . . . . . . . . . . . . . . . . 2 Cockpit Instruments and Controls . . . . . . . . . . . . . . . . . . . . . 3 Sound System . . . . . . . . . . . . . . . . . . . . . . . . . . . . 3 Aircraft and Flight Dynamics Model . . . . . . . . . . . . . . . . . . . . 3
TEST SUBJECTS . . . . . . . . . . . . . . . . . . . . . . . . . . . . . 4
TEST PROCEDURE . . . . . . . . . . . . . . . . . . . . . . . . . . . . 4 Phase I .Orientation . . . . . . . . . . . . . . . . . . . . . . . . . . 4 Phase I1 .Training . . . . . . . . . . . . . . . . . . . . . . . . . . 4 Phase 111 .Evaluation . . . . . . . . . . . . . . . . . . ' . . . . . . . 5 Subject Questionnaire . . . . . . . . . . . . . . . . . . . . . . . . . 5 Data Collection and Analysis . . . . . . . . . . . . . . . . . . . . . . . 5
RESULTS AND DISCUSSION . . . . . . . . . . . . . . . . . . . . . . . 5 Analysis of Subjective Data . . . . . . . . . . . . . . . . . . . . . . . 5 Analysis of Performance . . . . . . . . . . . . . . . . . . . . . . . . 9
SUMMARY OF RESULTS . . . . . . . . . . . . . . . . . . . . . . . . . 15
APPENDIX A. Sample Subject Questionnaires . . . . . . . . . . . . . . . . . . 17
APPENDIX B. Phase 11 Analysis of Variance . . . . . . . . . . . . . . . . 23
REFERENCES . . . . . . . . . . . . . . . . . . . . . . . . . . . . . . 26
FIGURES . . . . . . . . . . . . . . . . . . . . . . . . . . . . . . . . 27
... 111


NOMENCLATURE
CSF CSV + full FSAA motion capability
CSI baseline cueing system which includes flight instruments, controls, and sound simulation
CSM CSI + restrained motion simulation
CSM V CSM + visual scene simulation
csv CSI + visual scene simulation
F standard statistical ratio of mean squares
NCOL number of column control reversals; defined as movement out of a local deadband of 1.27 cm
NCR sum of control reversals N C O ~ ,NWHL, and NPED
NPED number of rudder pedal control reversals; defined as movement out of a local deadband of 1.27 cm
NWHL number of wheel control reversals; defined as movement out of a local deadband of 0.25"
PRI total integrated roll and yaw activity, deg
PB aircraft body-axis roll rate, deg/sec
rB aircraft body-axis yaw rate, deg/sec
t time from the beginning of a run, sec
tf time of engine failure, sec
IR initial reaction time ( t s - tf ), sec
r
tLO time at which "lift-off" occurred, sec
Qr time at which the rudder deflection exceeded 5" following an engine failure, sec
t 5 0 0 time of attaining 152.4 m altitude, sec
V
I I l l l111l1lllll
YLO "lift-off" point ( l ~ I a t tLO) , m, ~
-V c'g location of the aircraft center of gravity with respect to the runway centerline (positive right), m
*max maximum yaw angle for t f < t < t , o o , deg
vi
... . . . . .
EFFECTS OF VISUAL AND MOTION SIMULATION CUEING SYSTEMS ON
PILOT PERFORMANCE DURING TAKEOFFS WITH ENGINE FAILURES
Benton L. Parris and Anthony M. Cook
Ames Research Center
SUMMARY
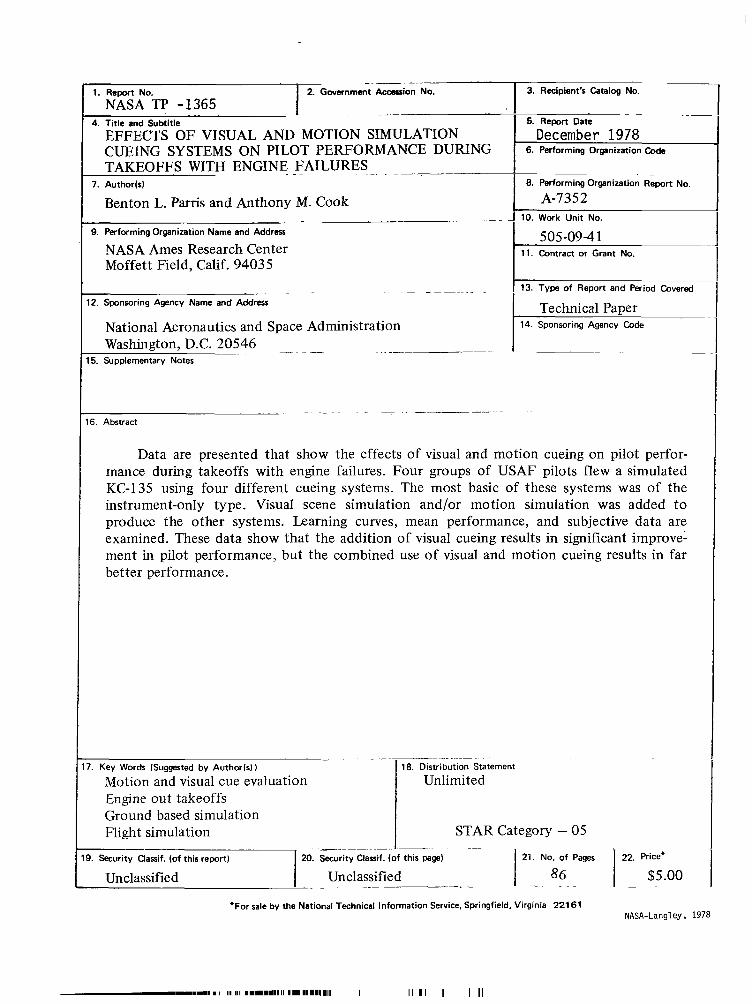
Data are presented that show the effects of visual and motion cueing on pilot performance during takeoffs with engine failures. Four groups of USAF pilots flew a simulated KC-135 using four different cueing systems. The most basic of these systems was of the instrument-only type. Visual scene simulation and/or motion simulation was added to produce the other systems. Leaming curves, mean performance, and subjective data are examined. These data show that the addition of visual cueing results in significant improvement in pilot performance, but the combined use of visual and motion cueing results in far better performance.
INTRODUCTION
The purpose of this investigation was to determine the relative values of visual and motion cueing systems for application in flight training simulators. The study is part of a joint NASAlUSAF program to evaluate the possible modification of existing USAF KC-1 35 simulators. Concern had been expressed within the Air Force as to the adequacy of pilot training for hazardous flight conditions. One such condition is the failure of an engine during or immediately following takeoff. Engine failures, simulated in the aircraft while on the runway, are not permitted in the SAC Manual for KC-1 35 Aircrew Training. This type of training is, however, conducted in the existing KC-1 35 simulators which have no visual scene or motion systems.
The investigation was conducted using the NASA/Ames Flight Simulator for Advanced Aircraft (FSAA), a six-degree-of-freedom motion system, complete with visual scene and audio cueing. The potential value of a motion system and a comparison of the effects of visual and motion cueing on pilot performance during engine failure conditions were considered as additional objectives of the study.
The authors wish to acknowledge the contributions of those United States Air Force personnel whose collaboration and wholehearted cooperation made this investigation possible. Major Oak H. Deberg and Capt. Thomas W. Showalter, of the Aeronautical Systems Division of the Air Force Systems Command, were responsible for test development and planning. Lt. Col. Jonathan Dayton, Maj. Richard K . Runkle, and Capt. Harold Fiedler, all SAC KC-I35 instructor pilots, were responsible for evaluating and refining the validity of the simulation; they also participated as observer pilots throughout the investigation.
SIMULATION EQUIPMENT
Motion System
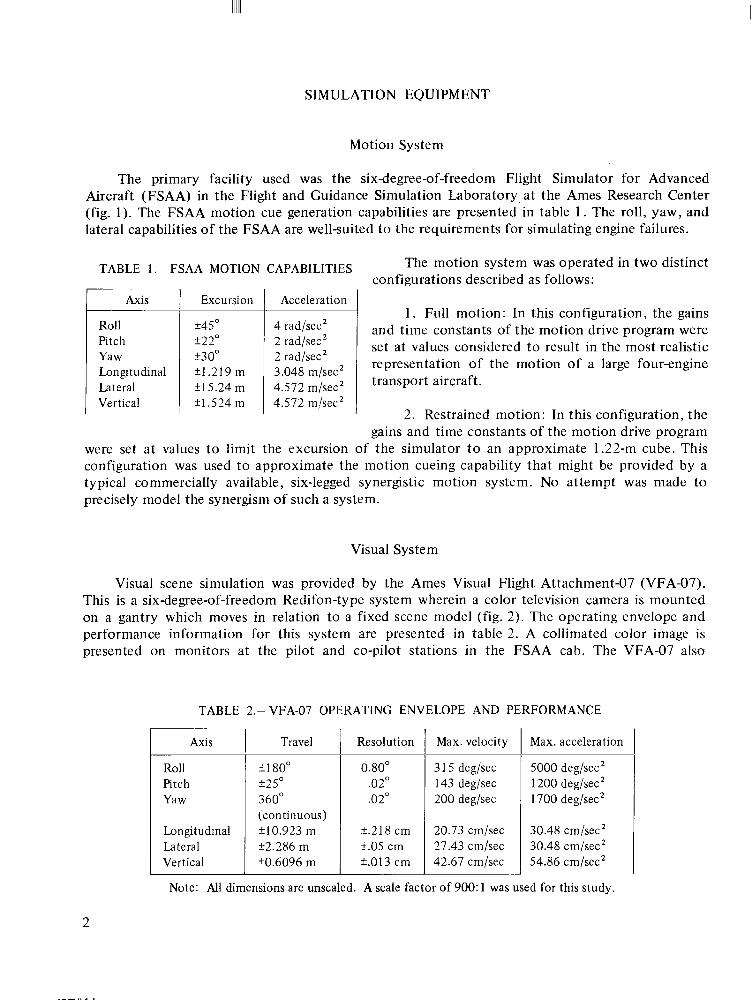
The primary facility used was the sixdegree-of-freedom Flight Simulator for Advanced Aircraft (FSAA) in the Flight and Guidance Simulation Laboratory, a t the Ames Research Center (fig. 1). The FSAA motion cue generation capabilities are presented in table 1 . The roll, yaw, and lateral capabilities of the FSAA are wellsuited to the requirements for simulating engine failures.
TABLE 1.- FSAA MOTION CAPABILITIES
Excursion Acceleration
a45" 4 rad/sec2 Pitch k22" 2 rad/sec2
+30" 2 rad/sec2 Longitudinal f1.219 m 3.048 ni/sec2 Lateral f15.24 m 4.572 m/sec2 Vertical k1.524 m 4.572 m/sec2
The motion system was operated in two distinct configurations described as follows:
1. Full motion: In this configuration, the gains and time constants of the motion drive program were set at values considered t o result in the most realistic representation of the motion of a large four-engine transport aircraft.
2. Restrained motion: In this configuration, the gains and time constants of the motion drive program
were set at values t o limit the excursion of the simulator t o an approximate 1.22-m cube. This configuration was used t o approximate the motion cueing capability that might be provided by a typical commercially available, six-legged synergistic motion system. No attempt was made to precisely model the synergism of such a system.
Visual System
Visual scene simulation was provided by the Ames Visual Flight Attachment-07 (VFA-07). This is a six-degree-of-freedom Redifon-type system wherein a color television camera is mounted on a gantry which moves in relation to a fixed scene model (fig. 2). The operating envelope and performance information for this system are presented in table 2. A collimated color image is presented on monitors at the pilot and co-pilot stations in the FSAA cab. The VFA-07 also
TABLE 2.- VFA-07 OPERATING ENVELOPE AND PERFORMANCE
Axis Travel Resolution Max. velocity
Roll *I 80" 0.80" 3 15 deg/sec Pitch 225" .02" 143 deg/sec Yaw 360" .02" 200 deg/sec
(continuous) Longitudinal k10.923 m a.218 cm 20.73 cm/sec Lateral k2.286 m i.05 cm 27.43 cm/sec Vertical a0.6096 m k.013 cm 42.67 cm/sec
Max. acceleration
5000 deg/sec2 1200 deg/sec2 1700 deg/sec2
30.48 cm/secZ 30.48 cm/sec2 54.86 cm/sec2
~~
2
..
incorporated a fog-generation system within the television signal link to simulate various cloud base conditions.
Cockpit Instruments and Controls
The FSAA cab was configured with representative flight instruments and controls (fig. 3), including wheel, column, and rudder pedals with programmed force-feel Characteristics designed to resemble those of the KC-1 35A.
Sound System
The sound simulator at Ames Research Center, manufactured by Conductron-Missouri Company, was used to provide audio cues to the pilot through stereo speakers located at the right and left rear of the simulator cab. The sound generation was based on real-time information from the digital computer; it included thrust levels for each of the four engines, airspeed, and landing gear discrete event information. The sound system simulated turbojet engine sound for each of the four engines which, in the engine failure event, provided the pilot with an engine spool-down cue. Additional audio cueing included airspeed sound, gear up/down thumps, and weight-on-wheels thump.
Aircraft and Flight Dynamics Model
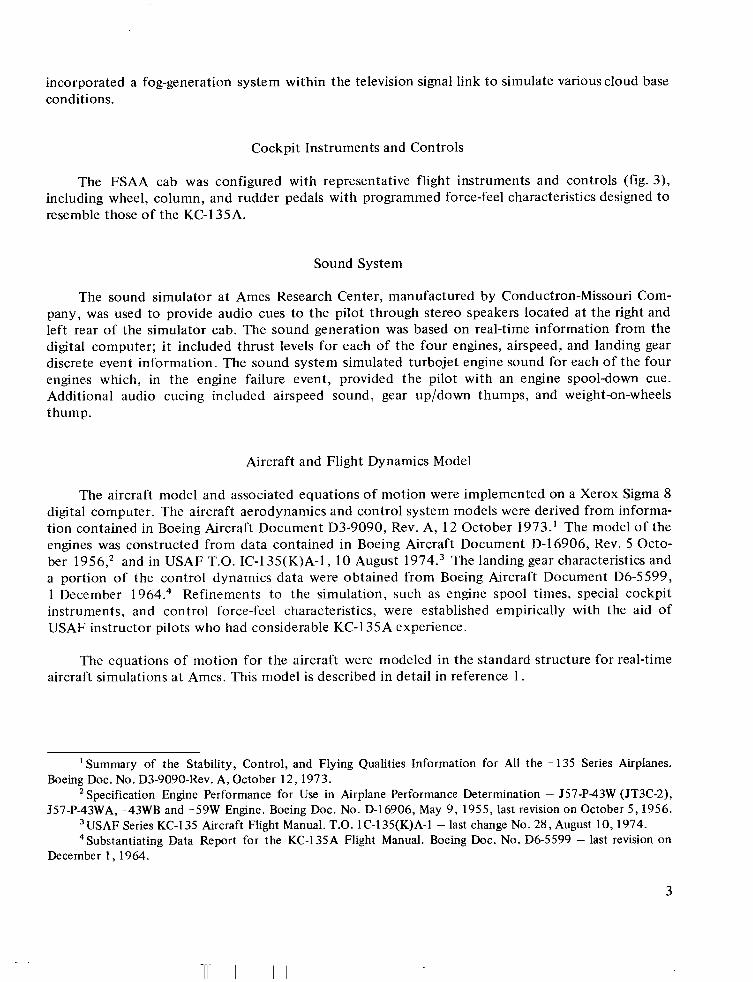
The aircraft model and associated equations of motion were implemented on a Xerox Sigma 8 digital computer. The aircraft aerodynamics and control system models were derived from information contained in Boeing Aircraft Document D3-9090, Rev. A, 12 October 1973.' The model of the engines was constructed from data contained in Boeing Aircraft Document D-16906, Rev. 5 October 1956,2 and in USAF T.O. IC-1 35(K)A-l, 10 August 1974.3 The landing gear characteristics and a portion of the control dynamics data were obtained from Boeing Aircraft Document D6-5599, 1 December 1964.4 Refinements to the simulation, such as engine spool times, special cockpit instruments, and control force-feel characteristics, were established empirically with the aid of USAF instructor pilots who had considerable KC-1 35A experience.
The equations of motion for the aircraft were modeled in the standard structure for real-time aircraft simulations a t Ames. This model is described in detail in reference 1 .
' Summary of the Stability, Control, and Flying Qualities Information for All the - 135 Series Airplanes. Boeing Doc. No. D3-9090-Rev. A, October 12, 1973.
Specification Engine Performance for Use in Airplane Performance Determination - J57-P-43W (JT3C-2), J57-P-43WA, -43WB and -59W Engine. Boeing Doc. No. D-16906, May 9 , 1955, last revision on October 5 ,1956.
USAF Series KC-1 35 Aircraft Flight Manual. T.O. 1C-l35(K)A-1 - last change No. 28, August 10,1974. 4Sub~tantiatingData Report for the KC-135A Flight Manual. Boeing Doc. No. D6-5599 - last revision on
December 1 , 1964.
3
TEST SUBJECTS
Thirty-six SAC aircraft commanders served as test subjects; approximately one-quarter of them were instructor pilots. On the average, these pilots had 1500 hr of KC-135A flight experience of which 680 hr was as aircraft commander; 45 hr of the experience was gained during the 2 months prior t o this experiment. These pilots also had an average of 170 hr experience in the standard KC-1 35A instrument-only flight simulators.
TEST PROCEDURE
The investigation required 12 days of testing in which various combinations of cueing systems were used to quantitatively determine what amount of training would transfer t o a real engine failure situation. Three pilots were tested each day and all subjects progressed through the following three phases of testing.
Phase I - Orientation
This phase began with a briefing on the experiment and on the operating procedures of the FSAA. Then each subject pilot flew a series of eight landings with full FSAA motion and visual capability (CSF) and varying visibility and wind conditions. Each subject pilot was rated on his general ability to handle the aircraft. This assessment was used as the basis for assigning the subject t o one of four groups with the object of producing groups with similar mean ability.
Phase I1 - Training
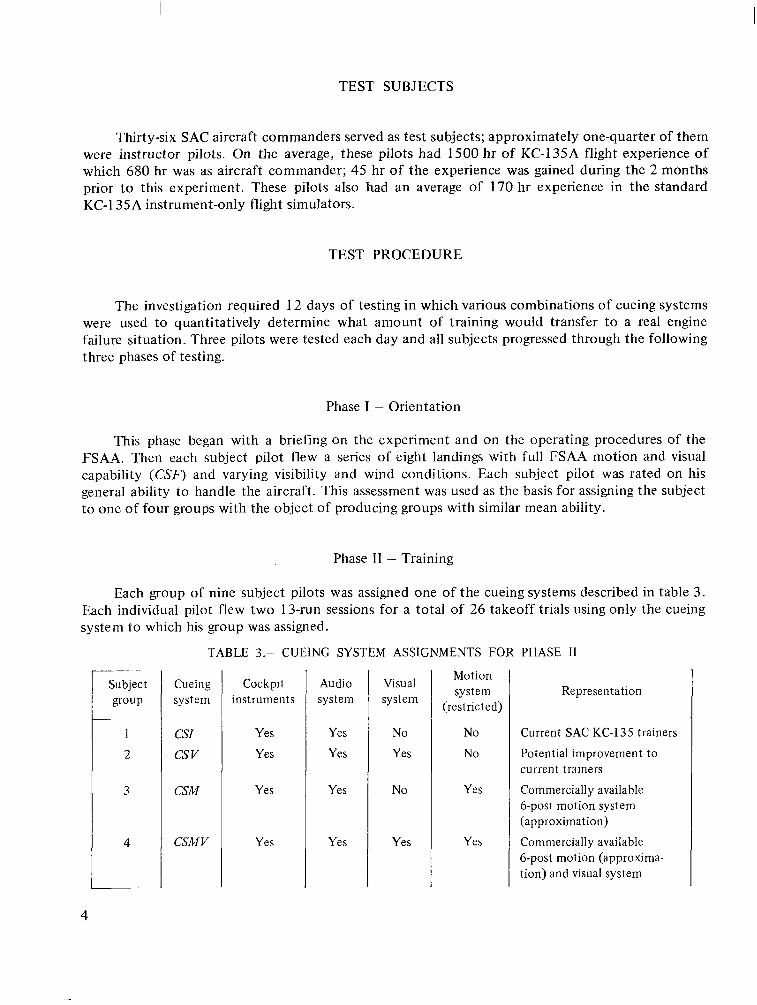
Each group of nine subject pilots was assigned one of the cueing systems described in table 3. Each individual pilot flew two 13-run sessions for a total of 26 takeoff trials using only the cueing system to which his group was assigned.
TABLE 3.- CUEING SYSTEM ASSIGNMENTS FOR PHASE I1
MotionSubject Cueing Cockpit Audio Visual
system Representation group system instruments system system (restricted)
CSI Yes Yes No No
csv Yes Yes Yes No
CSM Yes Yes No Yes
CSM V Yes Yes Yes Yes
Current SAC KC-1 35 trainers
Potential improvement t o current trainers
Commercially available 6-post motion system (approximation)
Commercially available 6-post motion (approximation) and visual system
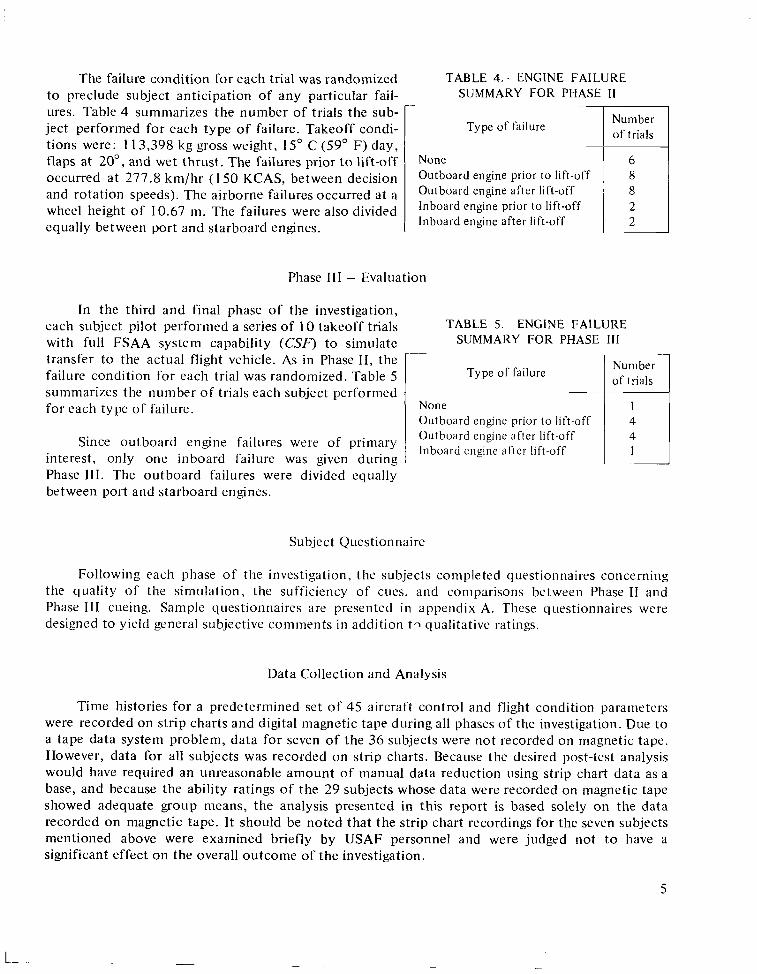
The failure condition for each trial was randomized TABLE 4. - ENGINE FAILURE to preclude subject anticipation of any particular fail- SUMMARY FOR PHASE-I1 ures. Table 4 summarizes the number of trials the sub- r-
Numberject performed for each type of failure. Takeoff condi- Type of failure of trials tions were: 113,398 kg gross weight, 15" C (59" F) day, ~
tlaps at 20", and wet thrust. The failures prior to lift-off None occurred at 277.8 km/hr ( 1 50 KCAS, between decision Outboard engine prior to lift-off
and rotation speeds). The airborne failures occurred at ;I Outboard engine after lift-off
wheel height of 10.67 In. The failures were also divided Inboard engine prior to lift-off
equally between port and starboard engines. Inboard engine after lift-off
Phase 111 - Evaluation
In the third and final phase of the investigation, each subject pilot performed a series of IO takeoff trials with full FSAA system capability (CSF) to simulate transfer to the actual flight vehicle. As in Phase 11, the failure condition for each trial was randomized. Table 5 summarizes the number of trials each subject performed for each type of failure.
Since outboard engine failures were of primary interest, only one inboard failure was given during Phase 111. The outboard failures were divided equally between port and starboard engines.
TABLE 5.- ENGINE FAILURE SUMMARY FOR PHASE 111
NumberType of failure of trials
None Outboard engine prior to lift-off Outboard engine after lift-off Inboard engine after lift-off
Subject Questionnaire
Following each phase of the investigation, the subjects completed questionnaires concerning the quality of the simulation, the sufficiency of cues, and comparisons between Phase I 1 and Phase Il l cueing. Sample questionnaires are presented in appendix A. These questionnaires were designed to yield general subjective comments in addition tq qualitative ratings.
Data Collection and Analysis
Time histories for a predetermined set of 45 aircraft control and flight condition parameters were recorded on strip charts and digital magnetic tape during all phases of the investigation. Due to a tape data system problem, data for seven of the 36 subjects were not recorded on magnetic tape. However, data for all subjects was recorded on strip charts. Because the desired post-test analysis would have required an unreasonable amount of nianual data reduction using strip chart data as a base, and because the ability ratings of the 29 subjects whose data were recorded on magnetic tape showed adequate group means, the analysis presented in this report is based solely on the data recorded on magnetic tape. It should be noted that the strip chart recordings for the seven subjects mentioned above were examined briefly by USAF personnel and were judged not t o have a significant effect on the overall outcome of the investigation.
5
- -
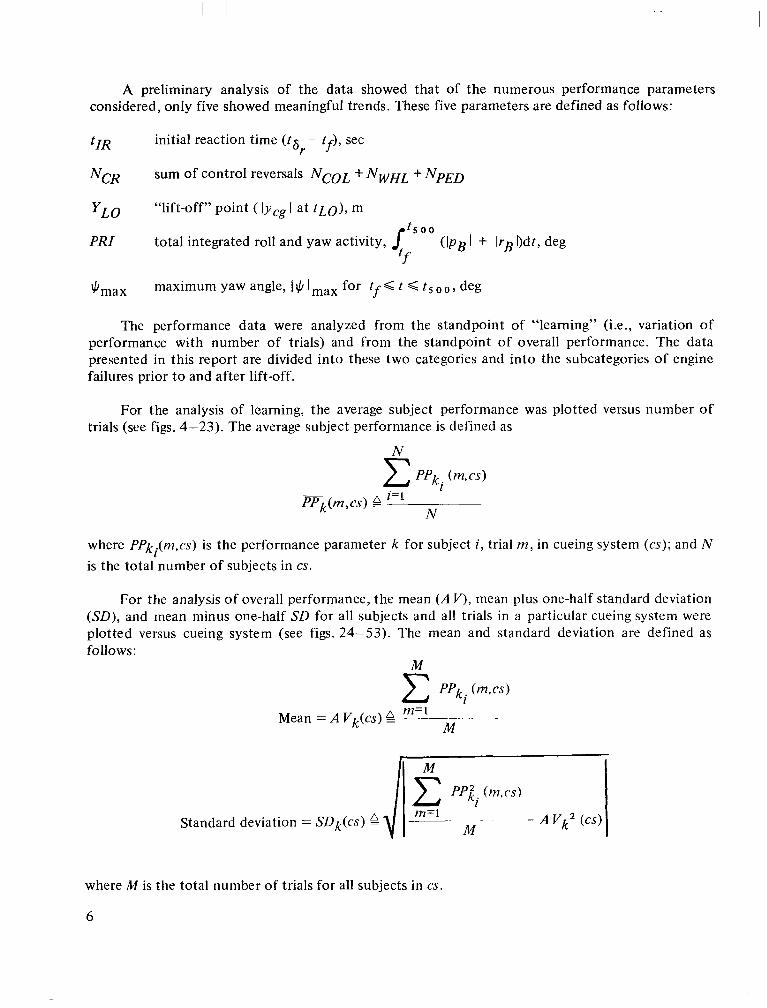
A preliminary analysis of the data showed that of the numerous performance parameters considered, only five showed meaningful trends. These five parameters are defined as follows:
~ I R initial reaction time ( ts - t
f ), sec
r
N c R sum of control reversals NCOL + NWHL+ NPED
YLO “lift-off” point ( lycgI at t L O ) , m
PRI total integrated roll and yaw activity, f t ’ (IpB I + IrB I)&, deg t f
$ma, maximum yaw angle, I$ I for t f < t < t , o , deg
The performance data were analyzed from the standpoint of “leaming” (ix., variation of performance with number of trials) and from the standpoint of overall performance. The data presented in this report are divided into these two categories and into the subcategories of engine failures prior to and after lift-off.
For the analysis of learning, the average subject performance was plotted versus number of trials (see figs. 4-23). The average subject performance is defined as
5Ppki (m,cs)
PP&n,cs) G i= I N
where PPk I.(m,cs) is the performance parameter k for subject i , trial nz, in cueing system (cs); and N
is the total number of subjects in cs.
For the analysis of overall performance, the mean ( A V), mean plus one-half standard deviation (SD),and mean minus one-half SD for all subjects and all trials in a particular cueing system were plotted versus cueing system (see figs. 24-53). The mean and standard deviation are defined as follows :
M
Ppki (m,cs) m=1Mean = A vk(cs)= ___-.
M -
where M is the total number of trials for all subjects in cs.
6
To determine the statistical significance of cueing system effects for outboard engine failures during Phase I1 (training), two analyses of variance were performed for each of the five performance parameters, one for failures prior to lift-off and one for failures after lift-off. These analyses were based on the average subject performance @k(m,cs) data, defined above, regarding cueing systems (cs) as treatments and trials ( m ) as samples within treatments. The results of these analyses are presented in appendix B.
RESULTS AND DISCUSSION
Analysis of Subjective Data
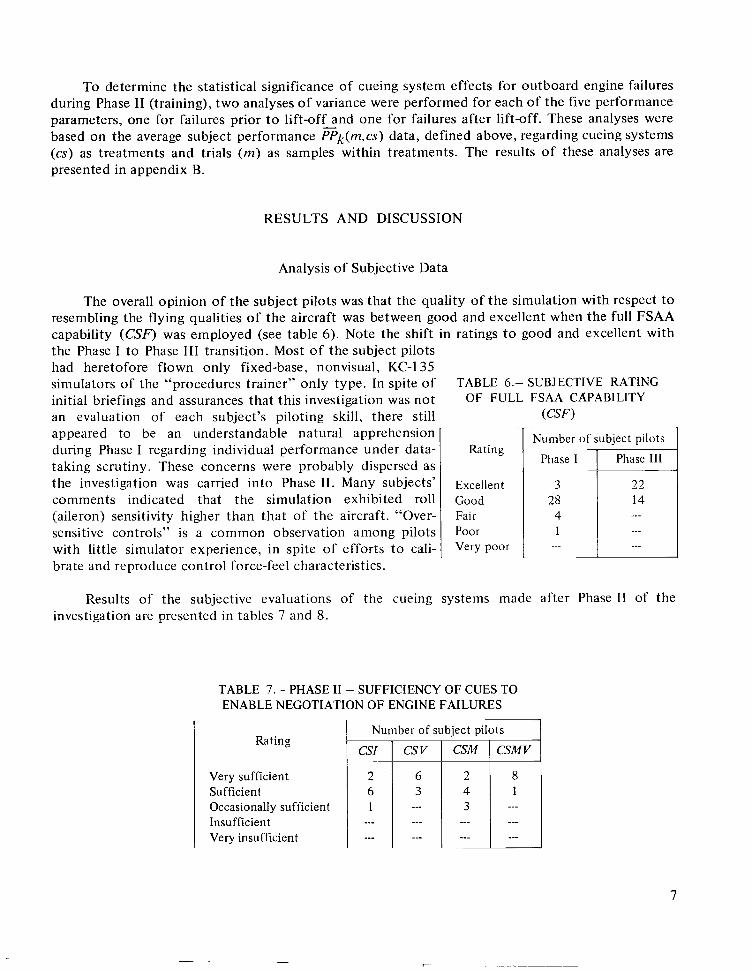
The overall opinion of the subject pilots was that the quality of the simulation with respect t o resembling the flying qualities of the aircraft was between good and excellent when the full FSAA capability (CSF) was employed (see table 6). Note the shift in ratings to good and excellent with the Phase I t o Phase 111 transition. Most of the subject pilots had heretofore flown only fixed-base, nonvisual, KC-1 35 simulators of the “procedures trainer” only type. In spite of TABLE 6.- SUBJECTIVE RATING initial briefings and assurances that this investigation was not OF FULL FSAA CAPABILITY an evaluation of each subject’s piloting skill, there still (CSF)
-appeared to be an understandable natural apprehension Number of subject pilotsduring Phase I regarding individual performance under data- Rating
Phase Itaking scrutiny. These concerns were probably dispersed as the investigation was carried into Phase 11. Many subjects’ Excellent 3 comments indicated that the simulation exhibited roll Good 28 (aileron) sensitivity higher than that of the aircraft. “Over- Fair 4 sensitive controls” is a common observation among pilots Poor 1 with little simulator experience, in spite of efforts t o cali- Very poor _ _ _ brate and reproduce control force-feel characteristics.
Results of the subjective evaluations of the cueing systems made after Phase I1 of the investigation are presented in tables 7 and 8.
TABLE 7.- PHASE I1 - SUFFICIENCY O F CUES TO ENABLE NEGOTIATION OF ENGINE FAILURES
Number of subject pilotsRating
CSM I CSMV
Very sufficient Sufficient Occasionally sufficient Insufficient Very insufficient
7
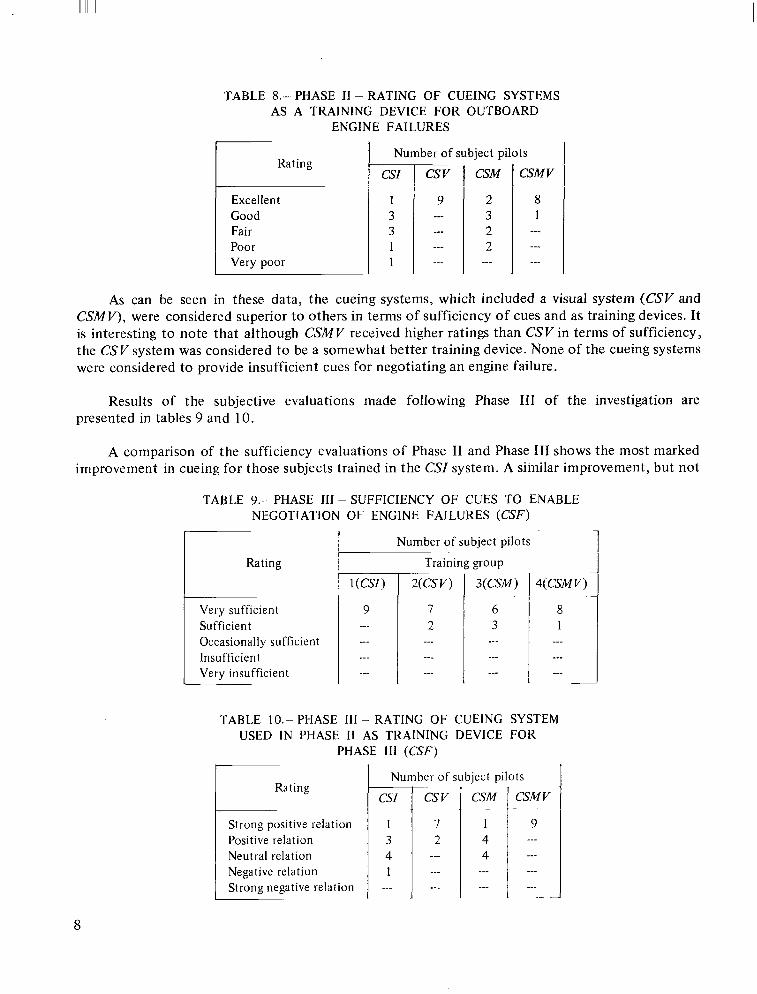
TABLE 8.- PHASE 11 - RATING O F CUEING SYSTEMS AS A TRAINING DEVICE FOR OUTBOARD
ENGINE FAILURES r
Excellent
Fair
Very poor
As can be seen in these data, the cueing systems, which included a visual system (CSV and CSMV), were considered superior to others in terms of sufficiency of cues and as training devices. It is interesting t o note that although CSMV received higher ratings than CSV in terms of sufficiency, the CSV system was considered t o be a somewhat better training device. None of the cueing systems were considered t o provide insufficient cues for negotiating an engine failure.
Results of the subjective evaluations made following Phase 111 of the investigation are presented in tables 9 and 10.
A comparison of the sufficiency evaluations of Phase I1 and Phase 111 shows the most marked improvement in cueing for those subjects trained in the CSI system. A similar improvement, but not
TABLE 9.- PHASE Ill - SUFFICIENCY O F CUES TO ENABLE NEGOTIATION O F ENGINE FAILURES (CSF)
Very sufficient Sufficient Occasionally sufficient Insufficient Very insufficient
TABLE 10.- PHASE USED I N PHASE
Number of subject pilots
Training group
111 - RATING OF CUEING SYSTEM I1 AS TRAINING DEVICE FOR
PHASE 111 (CSF)
Number of subject pilotsRating
Strong positive relation Positive relation Neutral relation Negative relation Strong negative relation
8
as significant, was that shown for the subjects trained in the CSM system. There was only a slight improvement for the subjects trained in the CSV system and n o difference in terms of sufficiency for the CSMV group of subjects. These data appear t o indicate that the addition of visual cues (with CSF) was the primary improvement in cueing and that motion cueing was an improvement but t o a lesser degree.
The evaluations of the Phase I1 systems as training devices for Phase I11 indicate the best training to have occurred in the system with both visual and motion cueing (CSMV). However, the CSV system was rated as having positive to strong positive relation (good to excellent training) to Phase III.
The subjective comments secured from the questionnaires may be summarized by the following general statements. The visual scene simulation was considered t o be the most useful cue in that it evoked the quickest and most consistently accurate response to an engine failure. The motion cues, when used in conjunction with the visual system, were considered to be quite useful in reinforcing the subject’s judgment as to whether or not his response to the engine failure was adequate. Use of motion cues, without accompanying outside visual reference, often led t o confusion as to direction and amount of control response required to recover from an engine failure and forced a heavier reliance on cockpit instruments. The use of cockpit instruments alone was considered to be inadequate for negotiating engine failures during takeoff. The cockpit instruments were believed to be better suited as backup and cross-check references once initial corrective measures had been taken.
Review of the comments.of the subjects trained in the CSMV system revealed no shortcomings of the restrained motion as compared to full motion. Interestingly, many of these subjects stated that they could not detect significant differences between the two motion systems.
Analysis of Performance
Phase / I learning curves for engine failures prior to lift-off- The average learning curves of subjects tested during Phase I1 for outboard engine failures prior t o lift-off are presented in figures 4 through 8. The average learning curves of all subjects in CSF during Phase I11 are included for comparison as assumed task asymptotes. It should be noted that the jump in the curves after the fourth run is probably due to the two-session method used for testing in Phase 11. However, this jump is evident only for subjects in CSI and CSM and primarily for those in CSI.
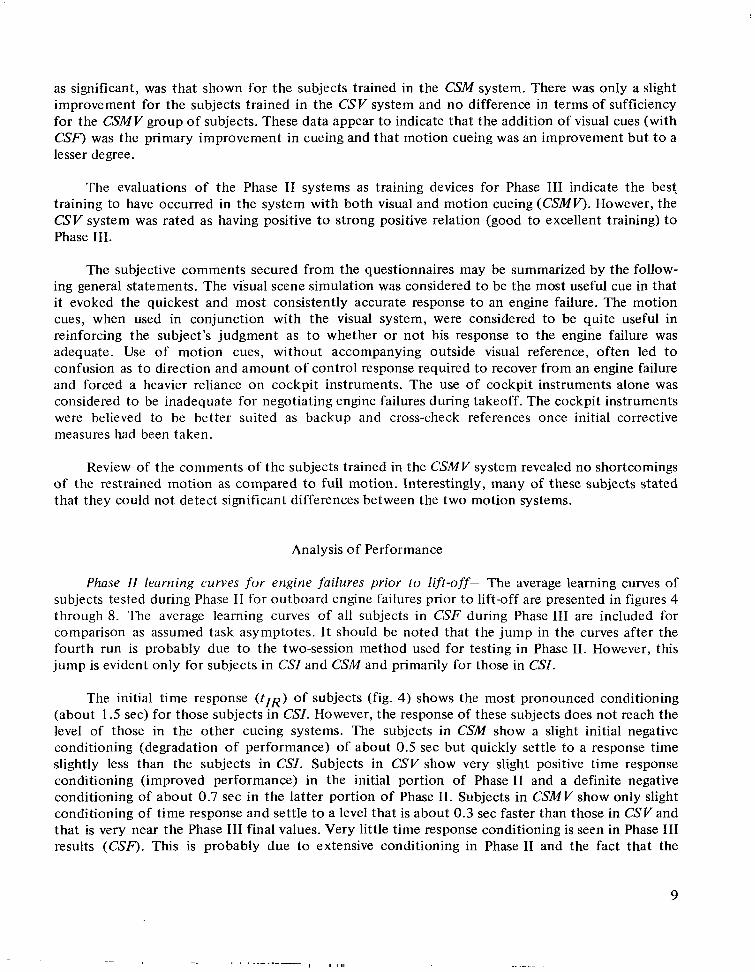
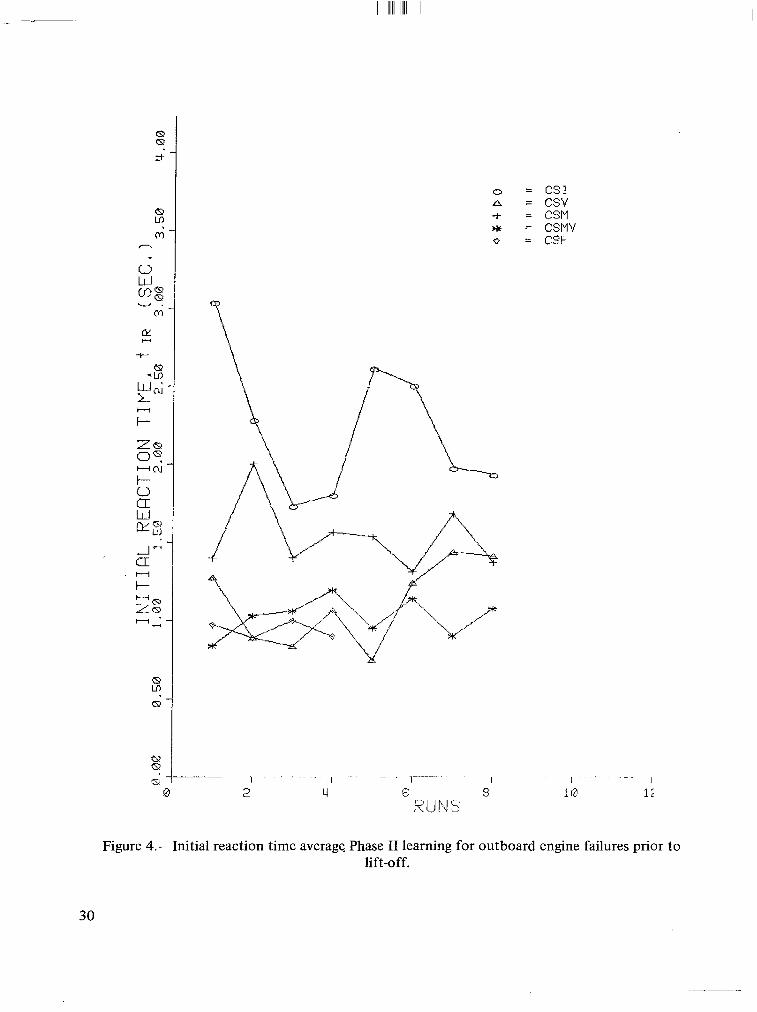
The initial time response ( t l ~ )of subjects (fig. 4) shows the most pronounced conditioning (about 1.5 sec) for those subjects in CSI. However, the response of these subjects does not reach the level of those in the other cueing systems. The subjects in CSM show a slight initial negative conditioning (degradation of performance) of about 0.5 sec but quickly settle to a response time slightly less than the subjects in CSI. Subjects in CSV show very slight positive time response conditioning (improved performance) in the initial portion of Phase I1 and a definite negative conditioning of about 0.7 sec in the latter portion of Phase 11. Subjects in CSMV show only slight conditioning of time response and settle t o a level that is about 0.3 sec faster than those in CSV and that is very near the Phase I11 final values. Very little time response conditioning is seen in Phase I11 results (CSF). This is probably due to extensive conditioning in Phase I1 and the fact that the
9
subjects knew they would receive mostly outboard engine failures during Phase 111. It should be noted that the resolution of time response is k0.048 sec.
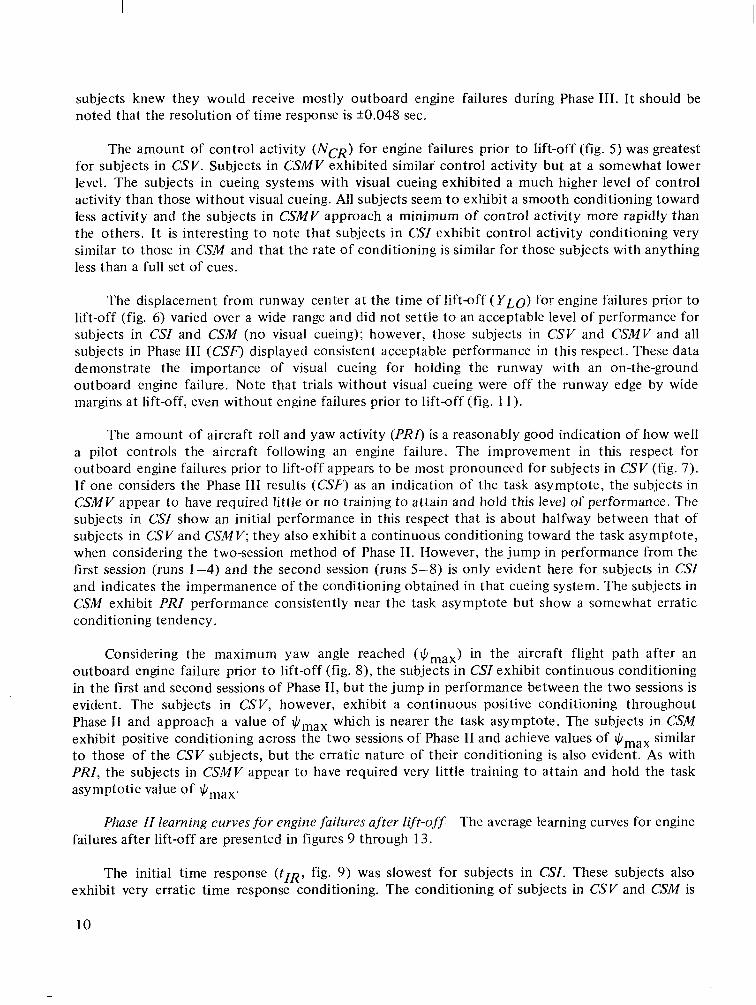
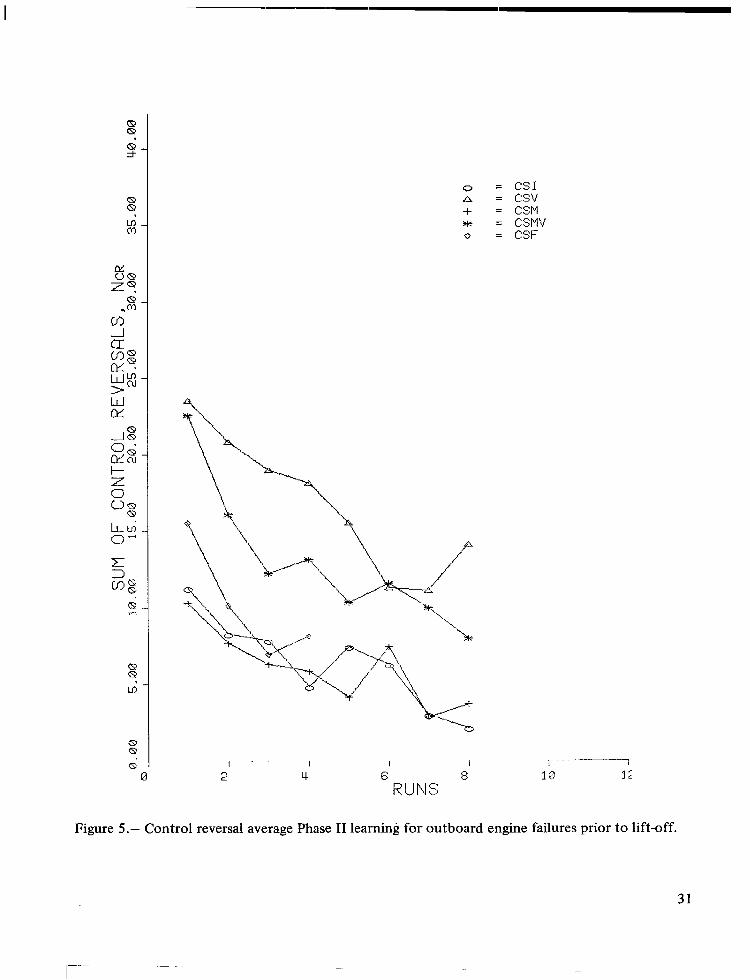
The amount of control activity (NcR) for engine failures prior to lift-off (fig. 5 ) was greatest for subjects in CSV. Subjects in CSMV exhibited similar control activity but a t a somewhat lower level. The subjects in cueing systems with visual cueing exhibited a much higher level of control activity than those without visual cueing. All subjects seem to exhibit a smooth conditioning toward less activity and the subjects in CSMV approach a minimum of control activity more rapidly than the others. It is interesting t o note that subjects in CSI exhibit control activity conditioning very similar t o those in CSM and that the rate of conditioning is similar for those subjects with anything less than a full set of cues.
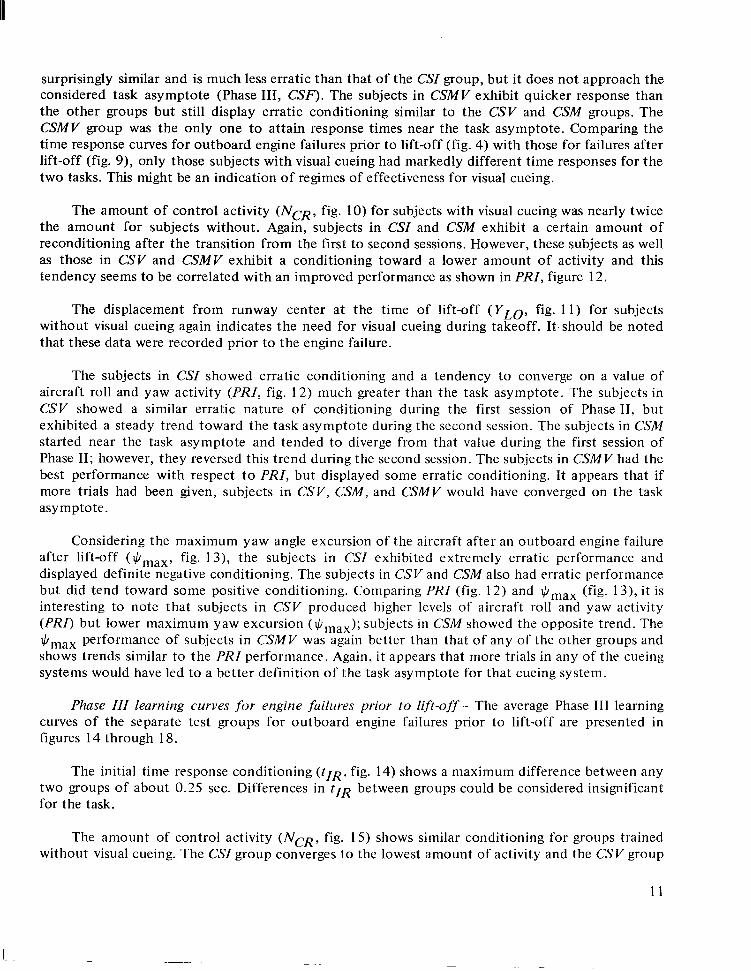
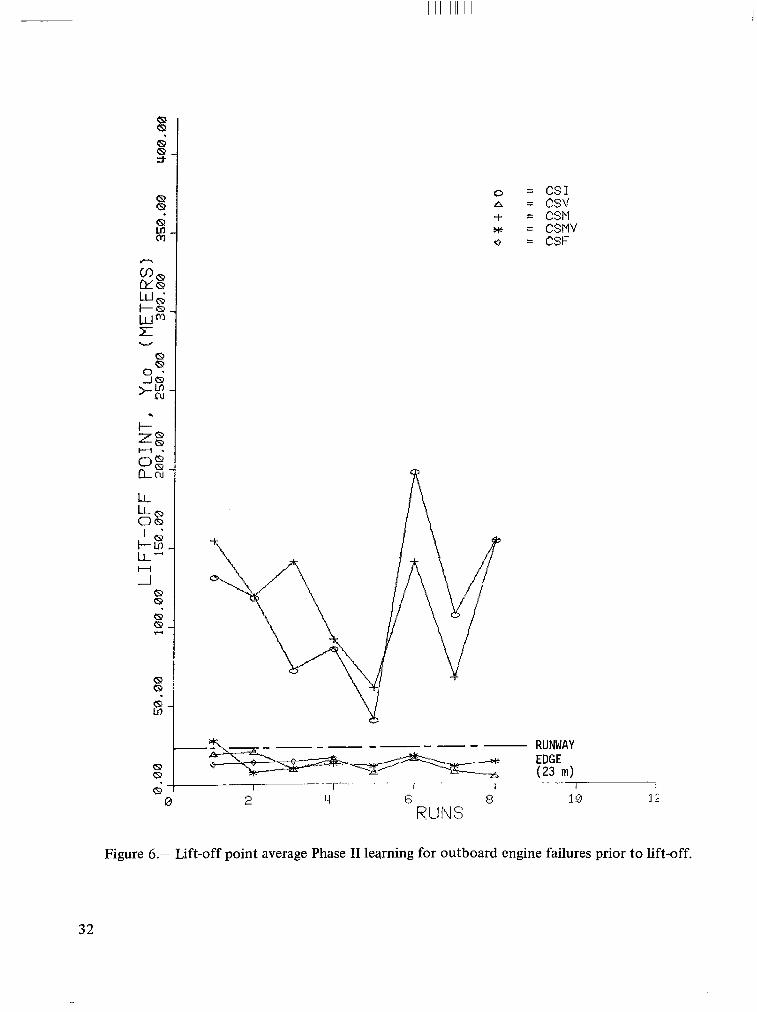
The displacement from runway center at the time of lift-off ( Y L O ) for engine failures prior to lift-off (fig. 6) varied over a wide range and did not settle to an acceptable level of performance for subjects in CSI and CSM (no visual cueing); however, those subjects in CSV and CSMV and all subjects in Phase 111 (CSF) displayed consistent acceptable performance in this respect. These data demonstrate the importance of visual cueing for holding the runway with an on-the-ground outboard engine failure. Note that trials without visual cueing were off the runway edge by wide margins at lift-off, even without engine failures prior to lift-off(fig. 11).
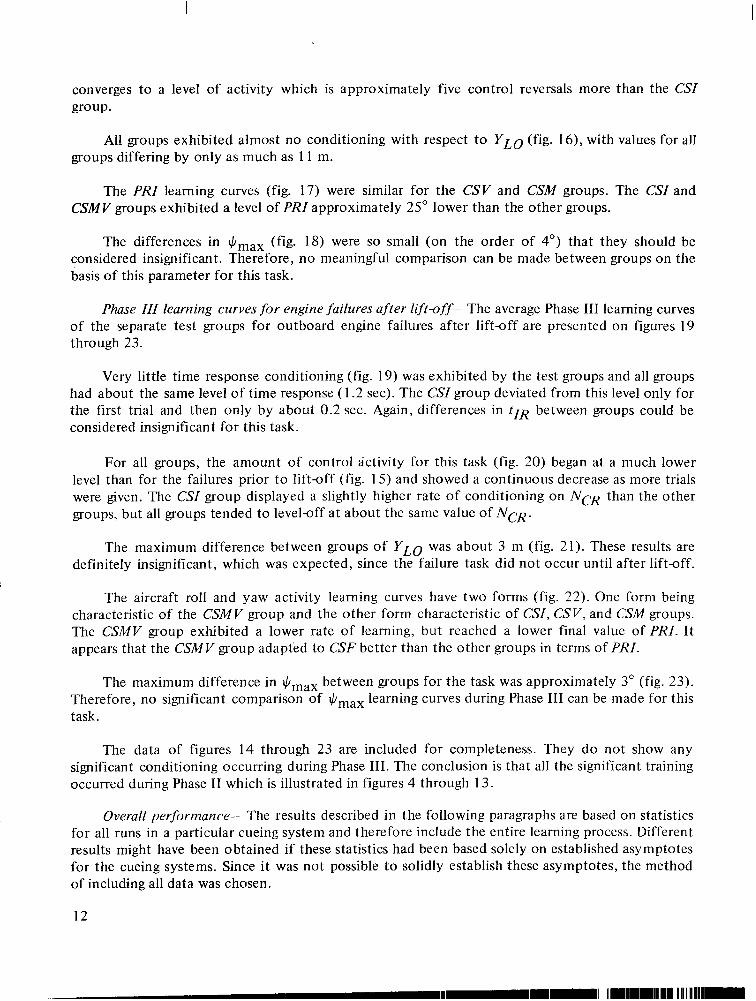
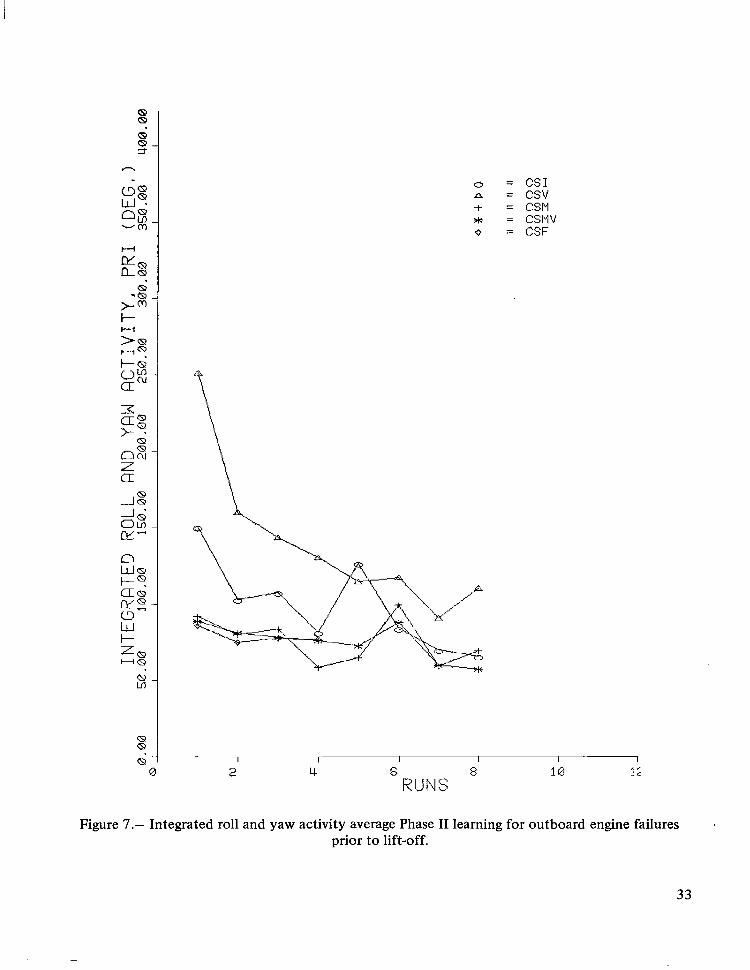
The amount of aircraft roll and yaw activity (PRO is a reasonably good indication of how well a pilot controls the aircraft following an engine failure. The improvement in this respect for outboard engine failures prior to lift-off appears t o be most pronounced for subjects in CSV (fig. 7). If one considers the Phase 111 results (CSF) as an indication of the task asymptote, the subjects in CSMV appear t o have required little or no training to attain and hold this level of performance. The subjects in CSI show an initial performance in this respect that is about halfway between that of subjects in CSV and CSMV;they also exhibit a continuous conditioning toward the task asymptote, when considering the two-session method of Phase 11. However, the jump in performance from the first session (runs 1-4) and the second session (runs 5-8) is only evident here for subjects in CSI and indicates the impermanence of the conditioning obtained in that cueing system. The subjects in CSM exhibit PRI performance consistently near the task asymptote but show a somewhat erratic conditioning tendency.
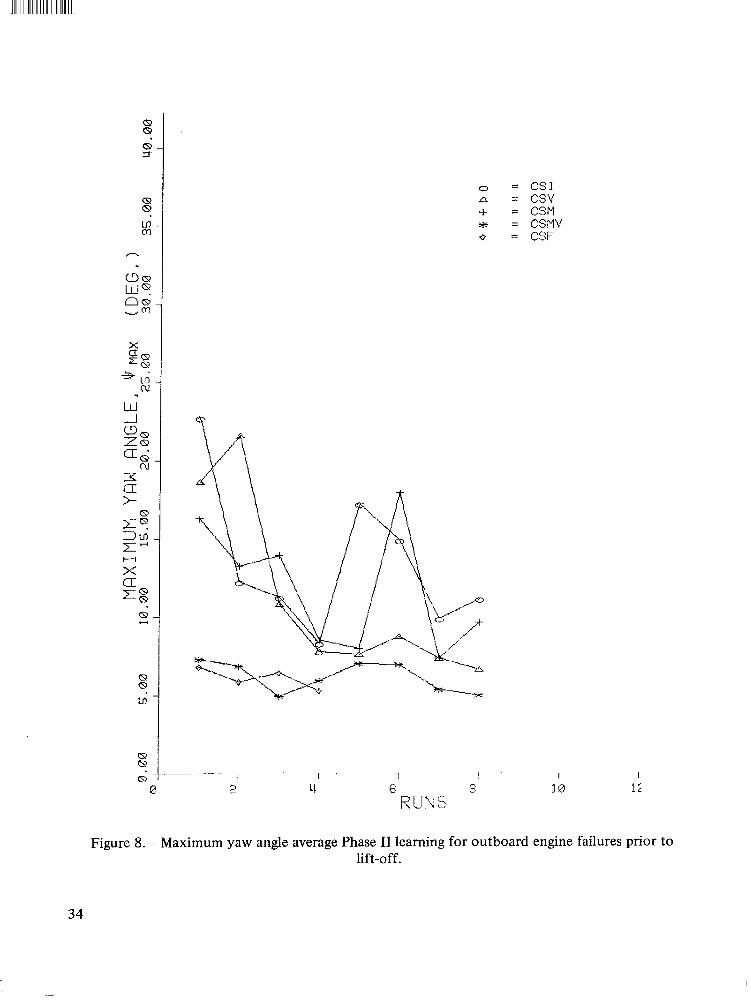
Considering the maximum yaw angle reached in the aircraft flight path after an outboard engine failure prior to lift-off (fig. 8), the subjects in CSI exhibit continuous conditioning in the first and second sessions of Phase 11, but the jump in performance between the two sessions is evident. The subjects in CSV, however, exhibit a continuous positive conditioning throughout Phase I1 and approach a value of I),,, which is nearer the task asymptote. The subjects in CSM exhibit positive conditioning across the two sessions of Phase I1 and achieve values of I),,, similar to those of the CSV subjects, but the erratic nature of their conditioning is also evident. As with PRI, the subjects in CSMV appear to have required very little training to attain and hold the task asymptotic value of qjmax.
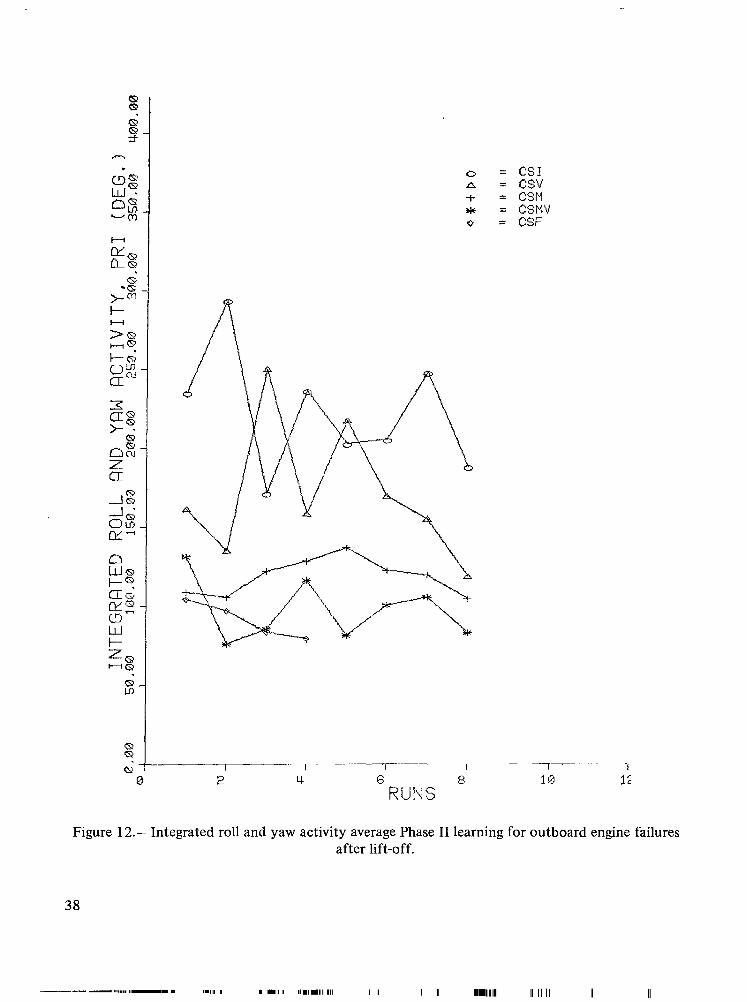
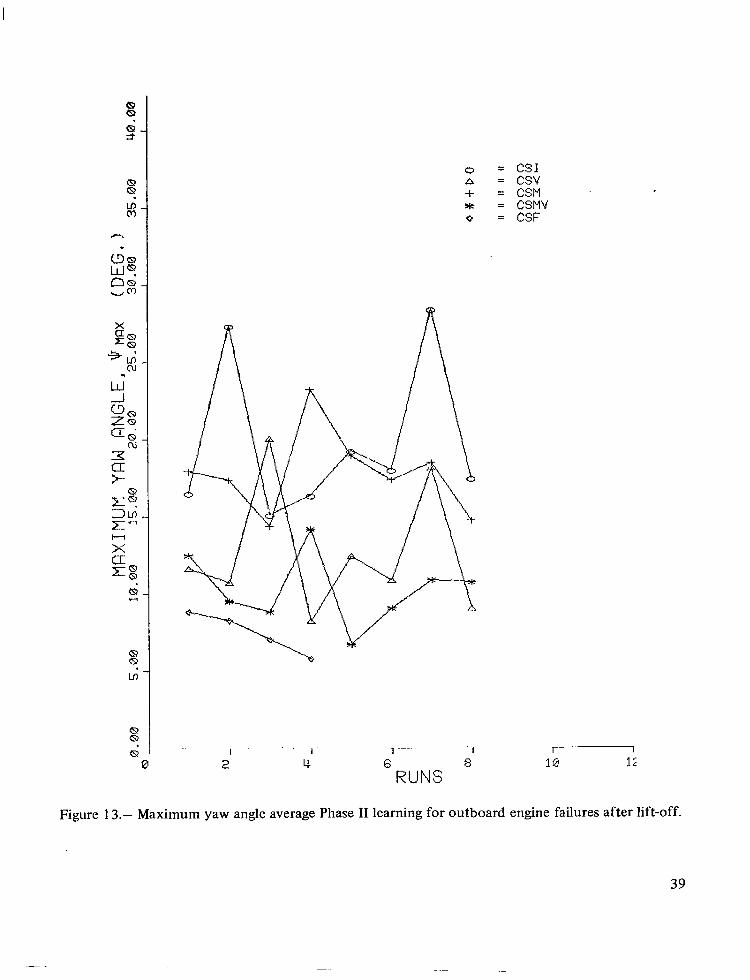
Phase II learning curves for engine failures after lift-off- The average learning curves for engine failures after lift-off are presented in figures 9 through 13.
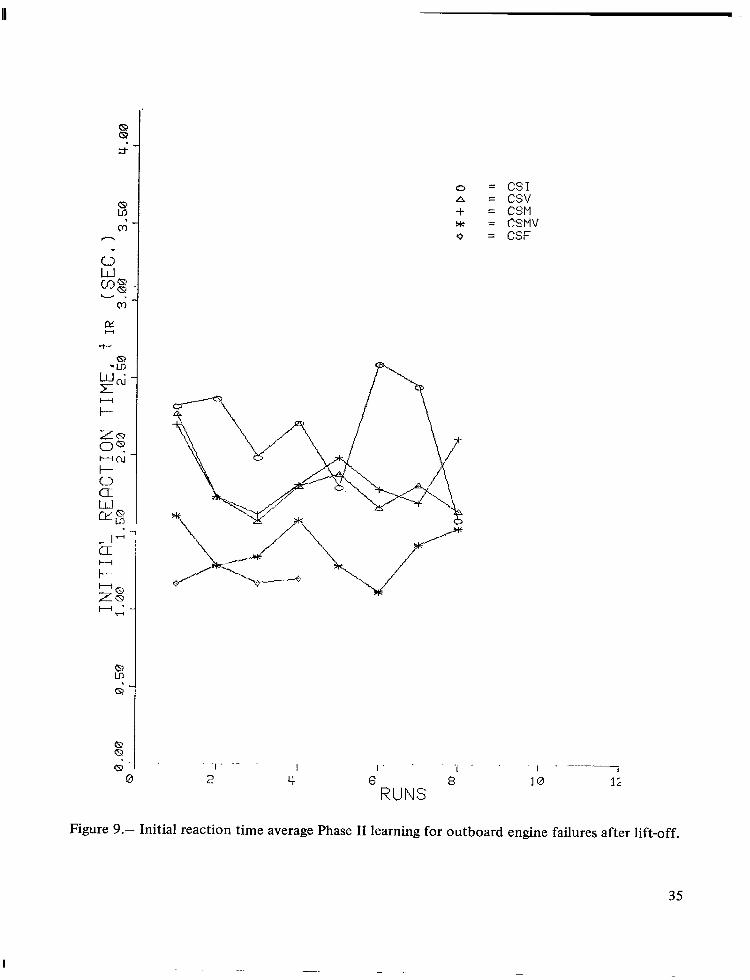
The initial time response (t lR, fig. 9) was slowest for subjects in CSI. These subjects also exhibit very erratic time response conditioning. The conditioning of subjects in CSV and CSM is
surprisingly similar and is much less erratic than that of the CSI group, but it does not approach the considered task asymptote (Phase 111, CSF'). The subjects in CSMV exhibit quicker response than the other groups but still display erratic conditioning similar to the CSV and CSM groups. The CSMV group was the only one to attain response times near the task asymptote. Comparing the time response curves for outboard engine failures prior to lift-off (fig. 4) with those for failures after lift-off (fig. 9), only those subjects with visual cueing had markedly different time responses for the two tasks. This might be an indication of regimes of effectiveness for visual cueing.
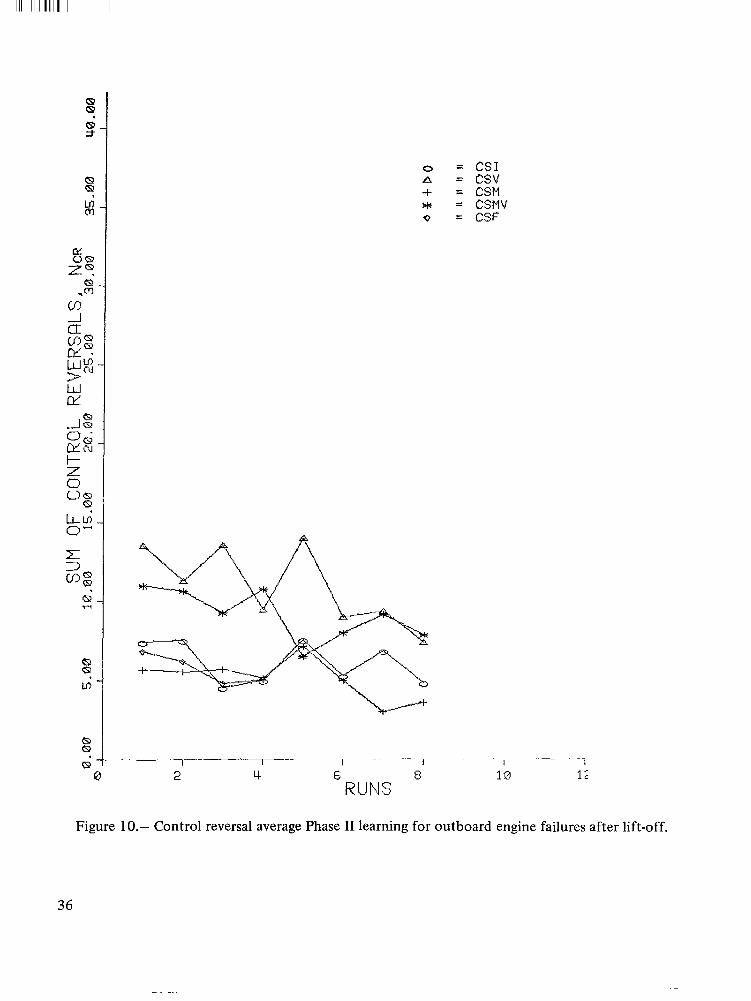
The amount of control activity (NcR, fig. 10) for subjects with visual cueing was nearly twice the amount for subjects without. Again, subjects in CSI and CSM exhibit a certain amount of reconditioning after the transition from the first to second sessions. However, these subjects as well as those in CSV and CSMV exhibit a conditioning toward a lower amount of activity and this tendency seems to be correlated with an improved performance as shown in PRI, figure 12.
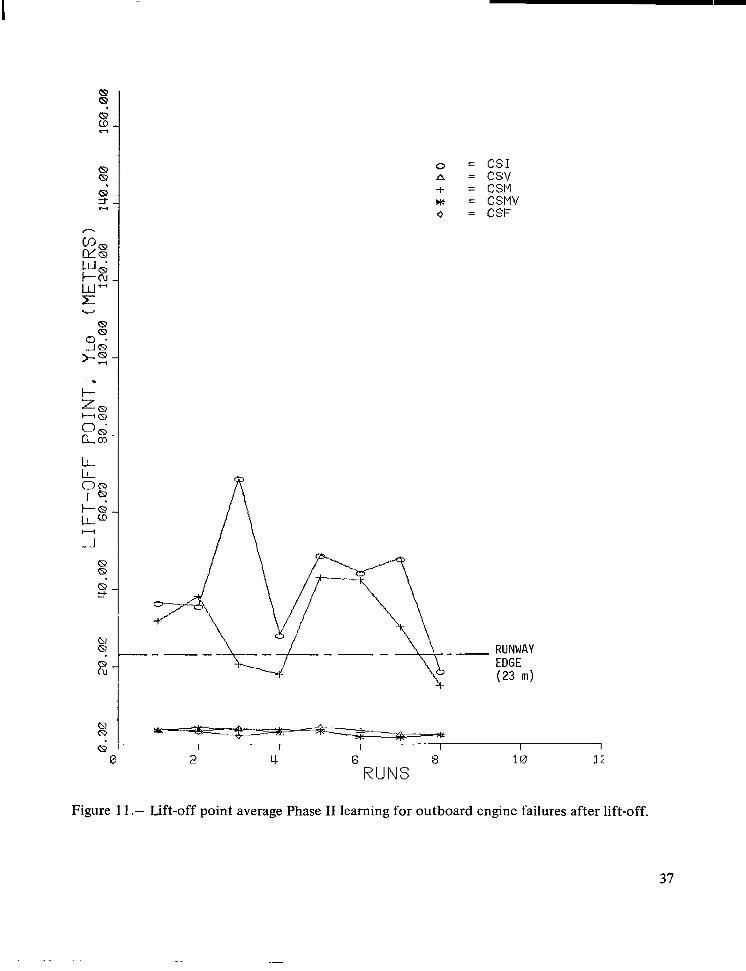
The displacement from runway center a t the time of lift-off ( Y L o , fig. 1 1 ) for subjects without visual cueing again indicates the need for visual cueing during takeoff. 1t.should be noted that these data were recorded prior to the engine failure.
The subjects in CSI showed erratic conditioning and a tendency to converge on a value of aircraft roll and yaw activity (PRI , fig. 12) much greater than the task asymptote. The subjects in CSV showed a similar erratic nature of conditioning during the first session of Phase 11, but exhibited a steady trend toward the task asymptote during the second session. The subjects in CSM started near the task asymptote and tended to diverge from that value during the first session of Phase 11; however, they reversed this trend during the second session. The subjects in CSMV had the best performance with respect to PRI, but displayed some erratic conditioning. It appears that if more trials had been given, subjects in CSV, CSM, and CSMV would have converged on the task asymptote.
Considering the maximum yaw angle excursion of the aircraft after an outboard engine failure after lift-off (J/max, fig. 13), the subjects in CSI exhibited extremely erratic performance and displayed definite negative conditioning. The subjects in CSV and CSM also had erratic performance but did tend toward some positive conditioning. Comparing PRZ (fig. 12) and I),,, (fig. 13), it is interesting to note that subjects in CSV produced higher levels of aircraft roll and yaw activity (PRO but lower maximum yaw excursion (Gmax); subjects in CSM showed the opposite trend. The J/max performance of subjects in CSMV was again better than that of any of the other groups and shows trends similar to the PRI performance. Again, it appears that more trials in any of the cueing systems would have led to a better definition of the task asymptote for that cueing system.
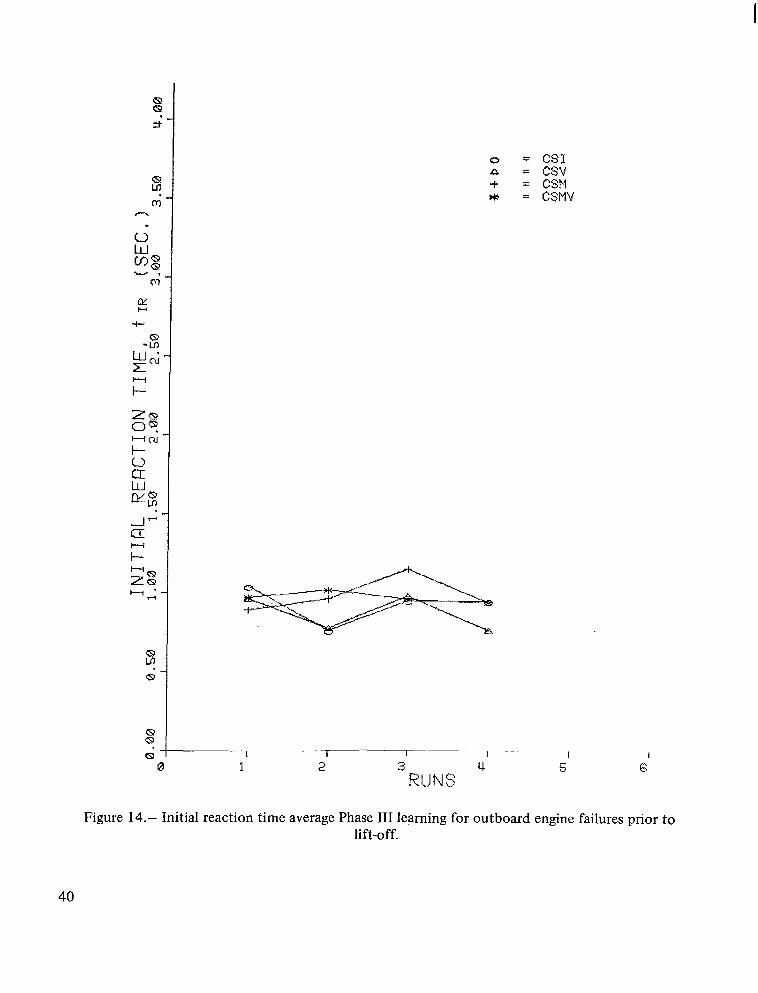
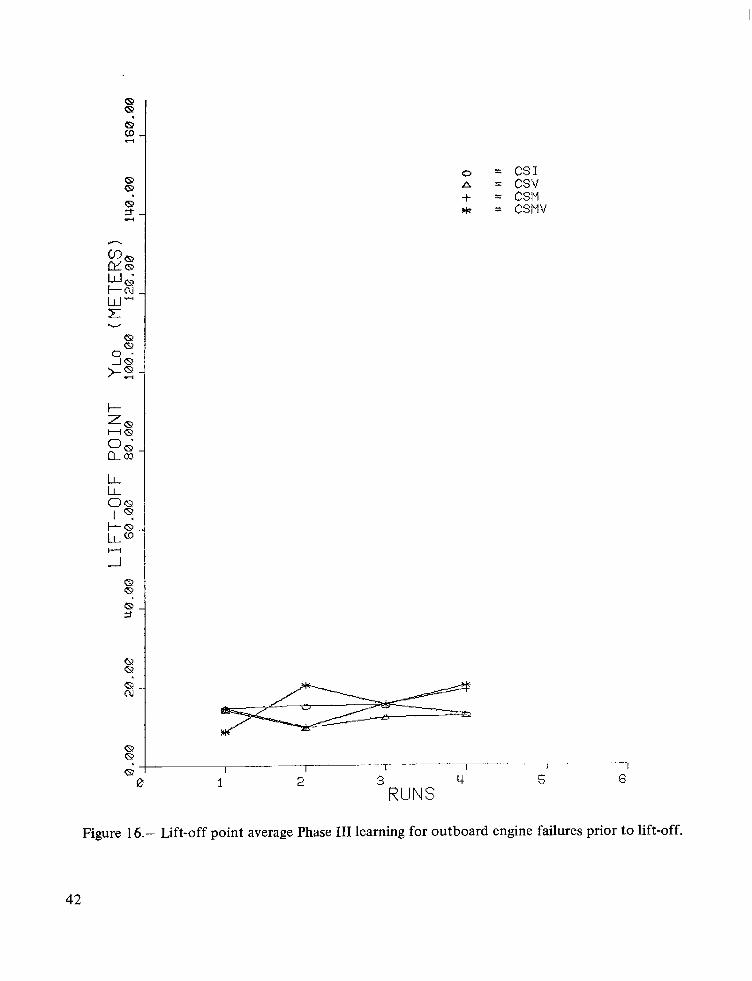
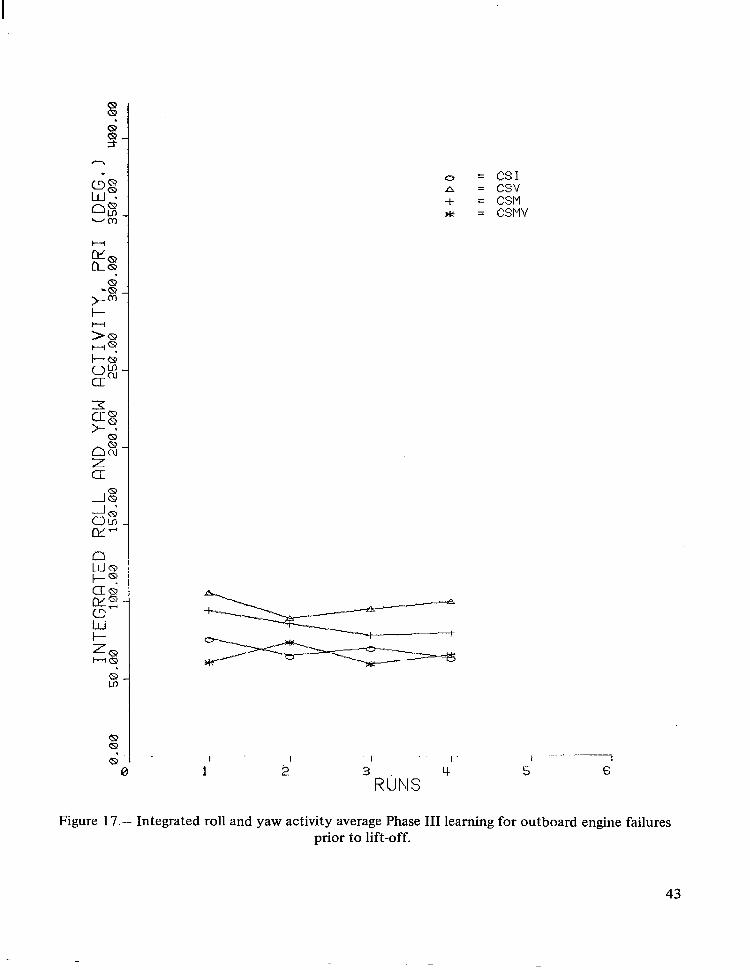
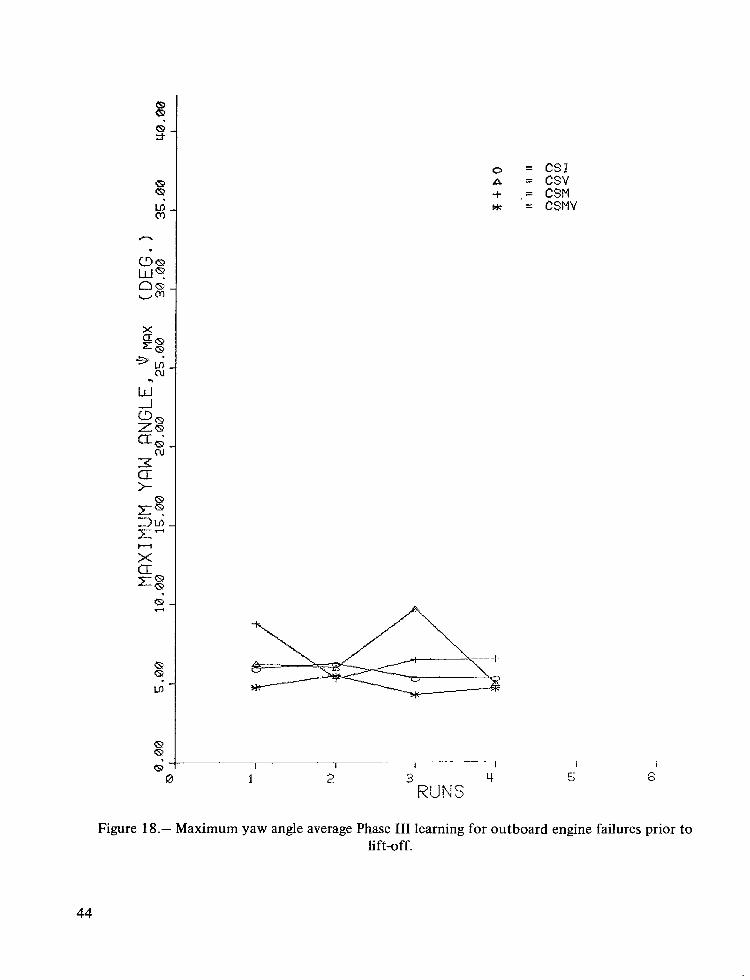
Phase III learning curves f o r engine failures prior to lift-off- The average Phase 111 learning curves of the separate test groups for outboard engine failures prior t o lift-off are presented in figures 14 through 18.
The initial time response conditioning ( t I R , fig. 14) shows a maximum difference between any two groups of about 0.25 sec. Differences in f I R between groups could be considered insignificant for the task.
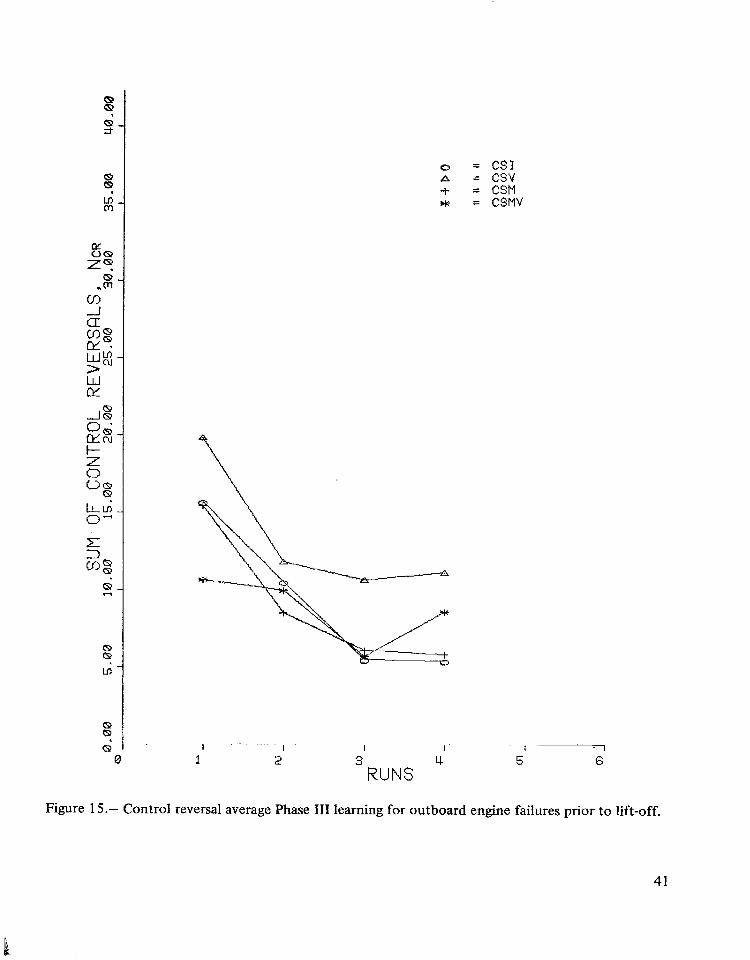
The amount of control activity (NcR, fig. 15) shows similar conditioning for groups trained without visual cueing. The CSI group converges t o the lowest amount of activity and the CSV group
1 1
I I
converges t o a level of activity which is approximately five control reversals more than the CSI group.
All groups exhibited almost no conditioning with respect t o YLO (fig. 16), with values for all groups differing by only as much as 1 1 m.
The PRI learning curves (fig. 17) were similar for the CSV and CSM groups. The CSI and CSMV groups exhibited a level of PRI approximately 25" lower than the other groups.
The differences in $max (fig. 18) were so small (on the order of 4") that they should be considered insignificant. Therefore, n o meaningful comparison can be made between groups on the basis of this parameter for this task.
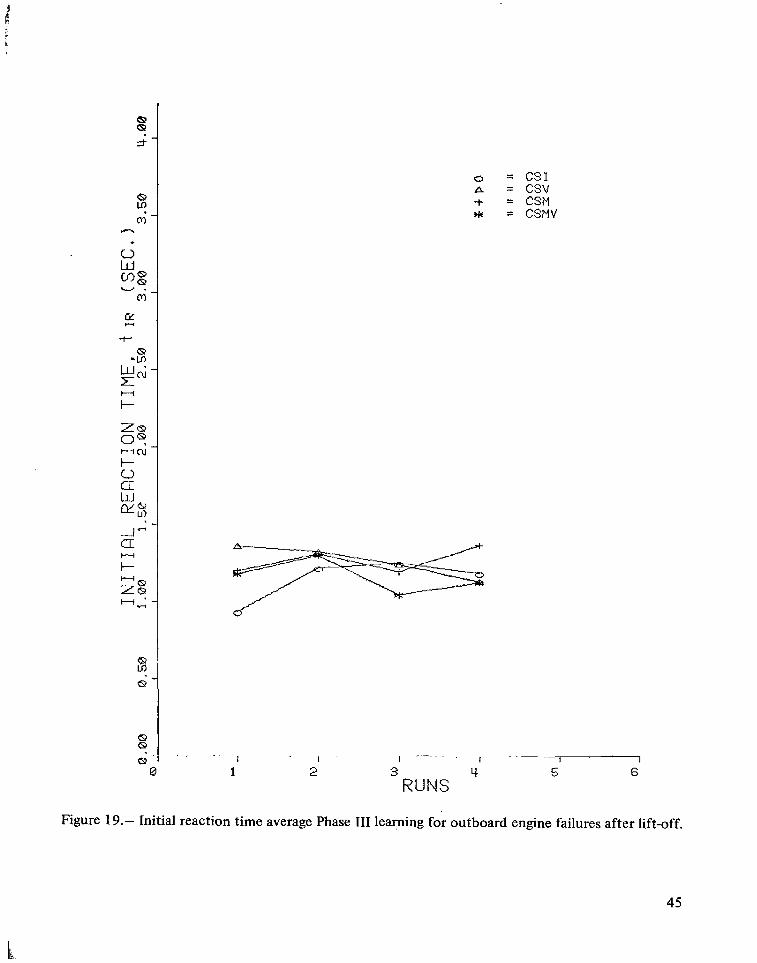
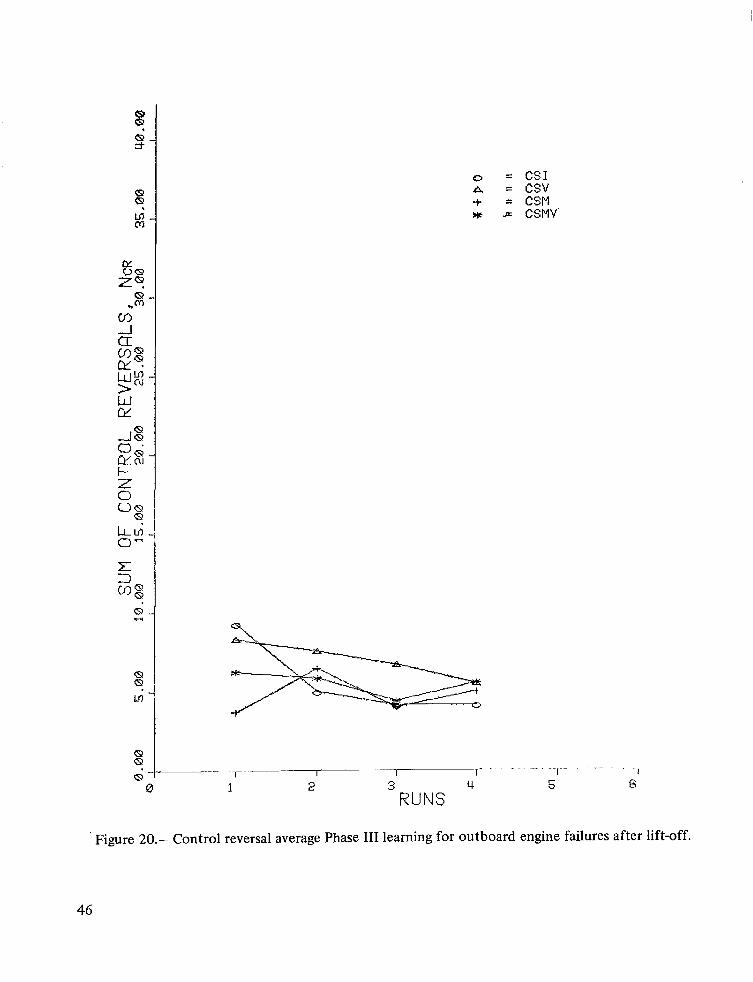
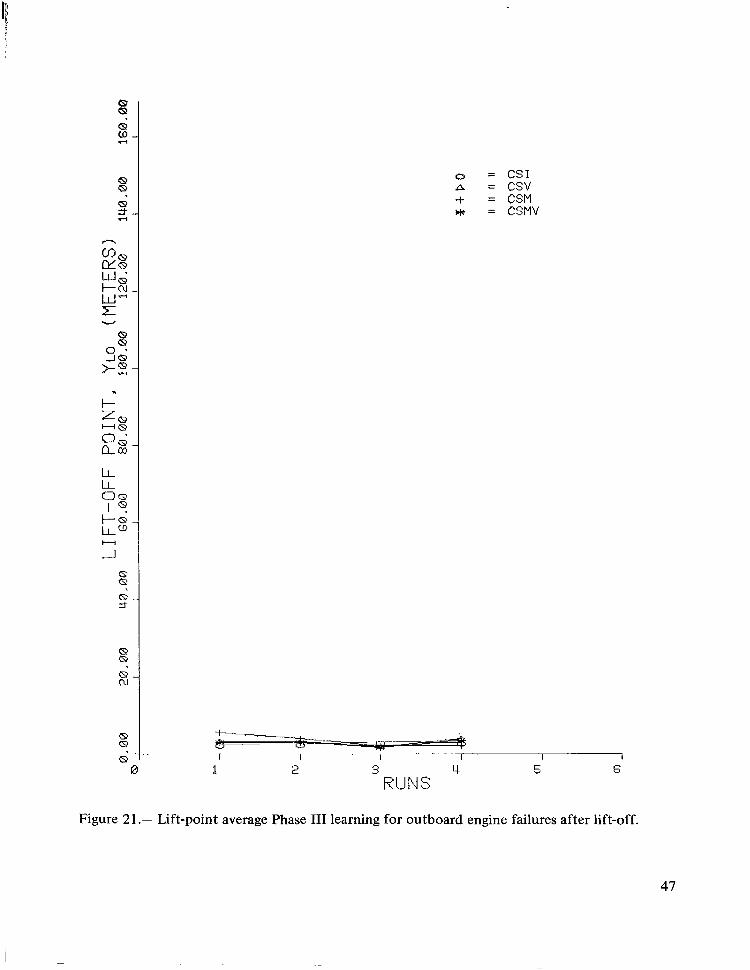
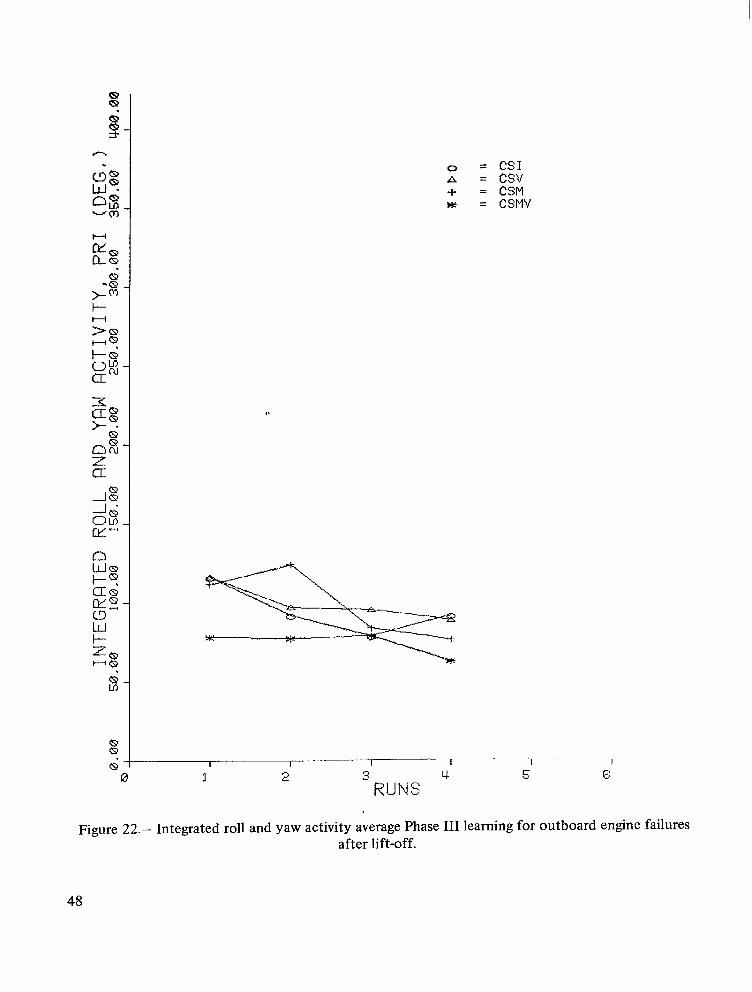
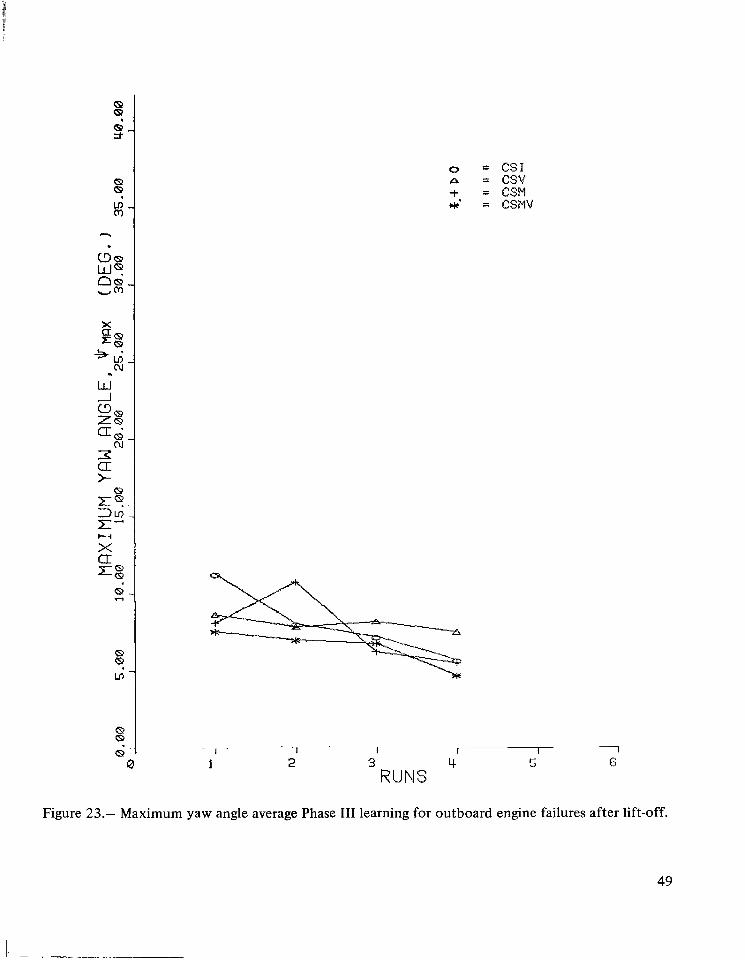
Phase III learning curves f o r engine failures after lift-off- The average Phase 111 learning curves of the separate test groups for outboard engine failures after lift-off are presented on figures 19 through 23.
Very little time response conditioning (fig. 19) was exhibited by the test groups and all groups had about the same level of time response (1 -2 sec). The CSI group deviated from this level only for the first trial and then only by about 0.2 sec. Again, differences in tlR between gxoups could be considered insignificant for this task.
For all groups, the amount of control activity for this task (fig. 20) began at a much lower level than for the failures prior t o lift-off (fig. 15) and showed a continuous decrease as more trials were given. The CSI group displayed a slightly higher rate of conditioning on NCR than the other groups, but all groups tended to level-off at about the same value of NCR.
The maximum difference between groups o f YLO was about 3 m (fig. 21). These results are definitely insignificant, which was expected, since the failure task did not occur until after lift-off.
The aircraft roll and yaw activity learning curves have two forms (fig. 22). One form being characteristic of the CSMV group and the other form characteristic of CSI, CSV, and CSM groups. The CSMV group exhibited a lower rate of learning, but reached a lower final value of PRI. It appears that the CSM V group adapted to CSF better than the other groups in terms of PRI.
The maximum difference in $max between groups for the task was approximately 3" (fig. 23). Therefore, no significant comparison of $n,ax learning curves during Phase 111 can be made for this task.
The data of figures 14 through 23 are included for completeness. They d o not show any significant conditioning occurring during Phase 111. The conclusion is that all the significant training occurred during Phase I1 which is illustrated in figures 4 through 13.
Overall performance- The results described in the following paragraphs are based on statistics for all runs in a particular cueing system and therefore include the entire learning process. Different results might have been obtained if these statistics had been based solely on established asymptotes for the cueing systems. Since it was not possible t o solidly establish these asymptotes, the method of including all data was chosen.
12
I-mmmI 11111111111111111111-
The Phase I11 (CSF) data presented on figures 2 4 through 33 are based on all subjects in Phase 111, regardless of which Phase I1 group they were in, and is included for comparison as merely another cueing system. The Phase I11 data presented in figures 34 through 53 are segregated into results for the separate test groups.
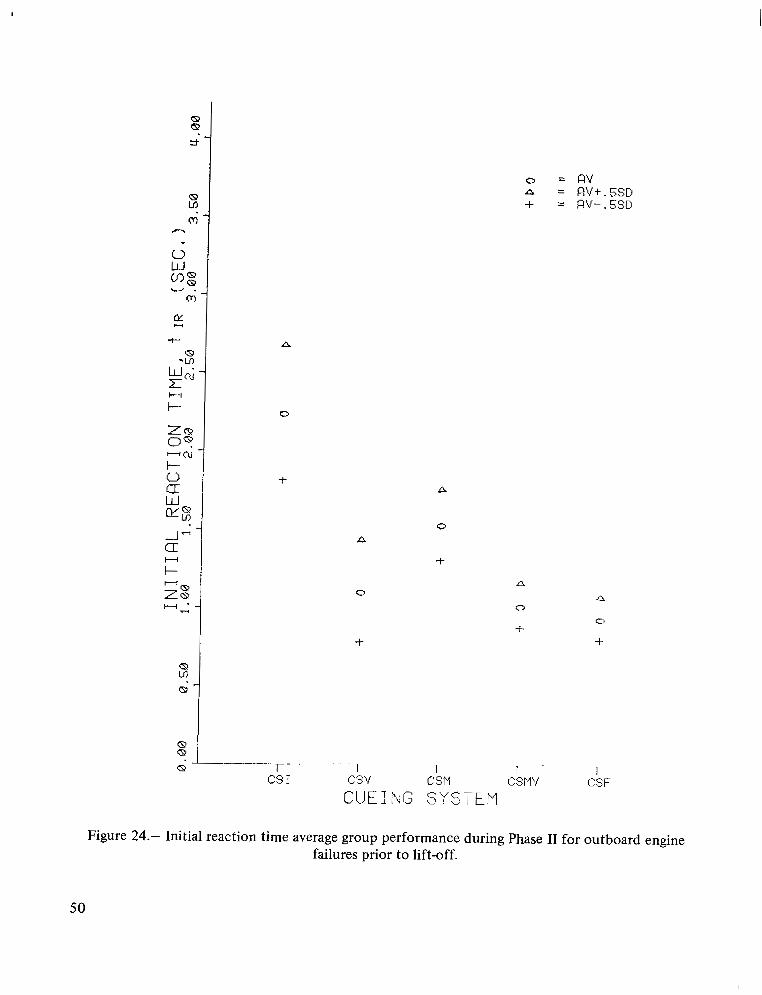
Phase II and Phase III results f o r outboard engine failures prior to lift-off- The initial time response data for this task (fig. 24) indicate that cueing systems with a visual scene induce response that is about 1.25 sec (average) faster than CSI but only 0.5 sec faster than CSM. These data also indicate a gradual improvement in response as the level of motion cueing added to the visual scene is increased. The variance, however, continuously decreases as the cueing system moves from CSI to CSMV, but is approximately the same for CSMV and CSF. These data indicate that the addition of motion achieves improvement mainly by reducing the variance rather than the mean value of time response.
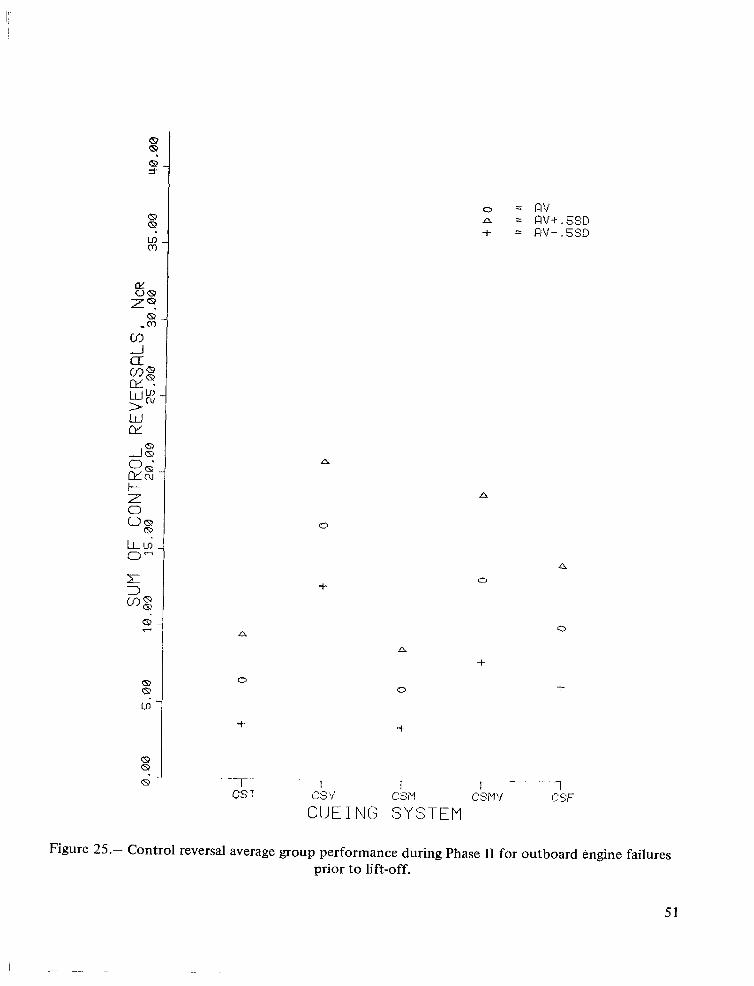
The control activity data for this task (fig. 25) indicate that, in the mean, subjects with visual cueing exert more control effort toward performance of the task than d o subjects without visual cueing, and that this effort is gradually reduced with the addition of increasing amounts of motion cueing. The variance in control activity increases sharply when visual cueing is added whether or not motion cueing was initially present. The means and variance of control activity for subjects in cueing systems without visual cueing are very nearly identical.
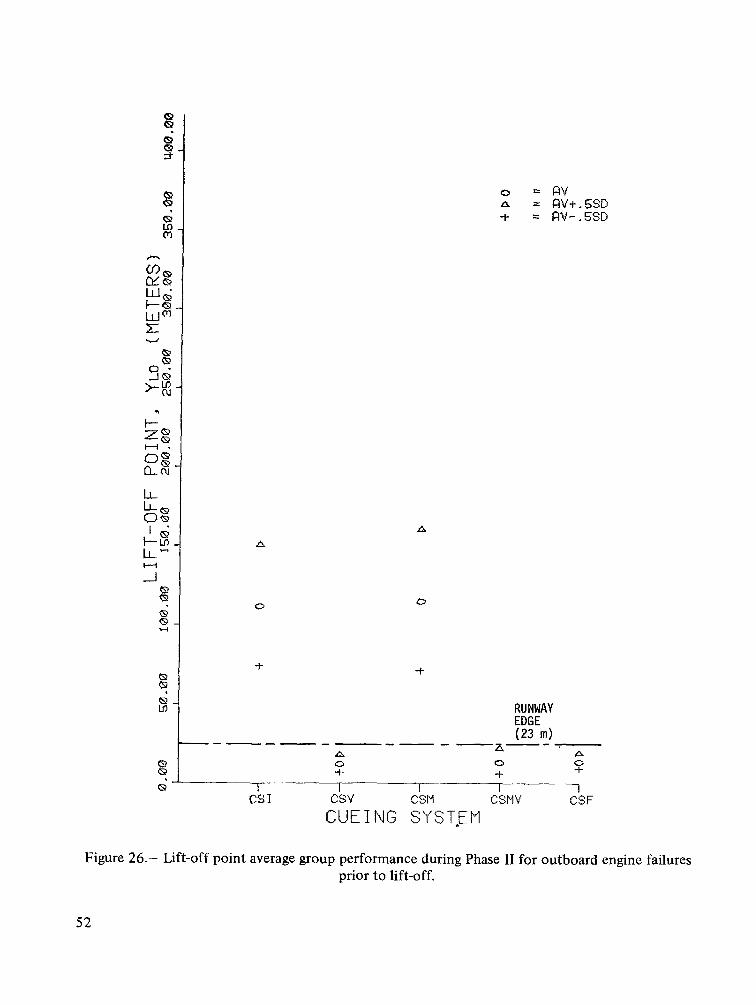
The YLo data (fig. 26) show more distinctly the obvious importance of visual cueing t o allow the subjects to hold the runway after an engine failure prior to lift-off.
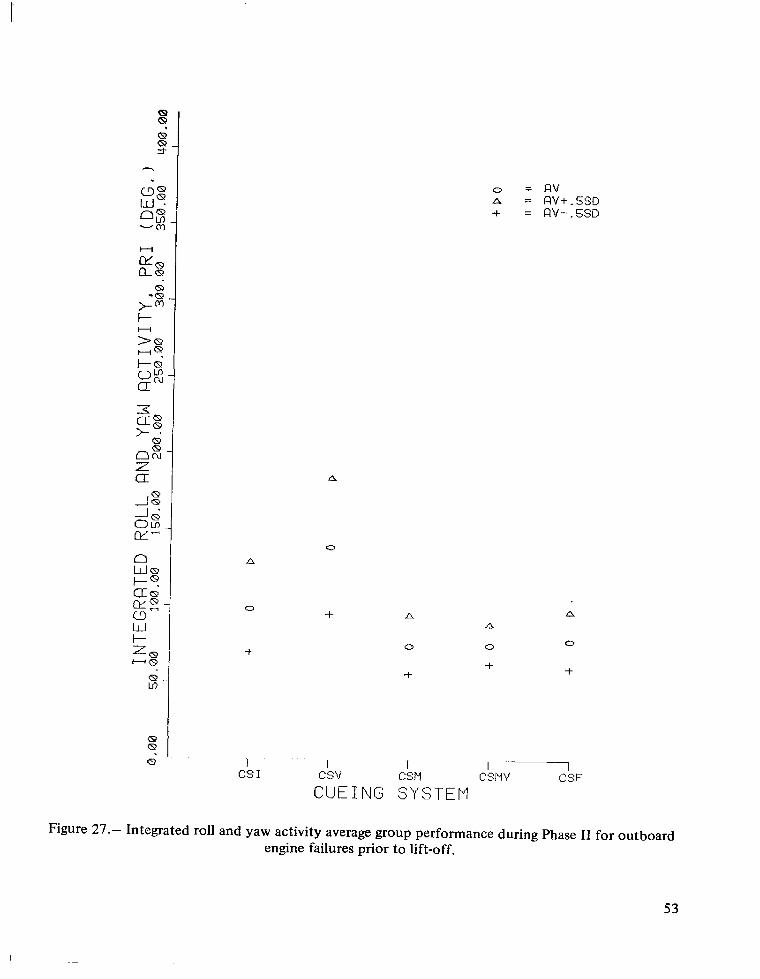
The aircraft roll and yaw activity data for this task (fig. 27) indicate that motion cueing is the primary aid to controlling the aircraft after an on-the-ground failure, It is interesting to note that CSV produced a higher mean and variance in PRI than did CSI for this task.
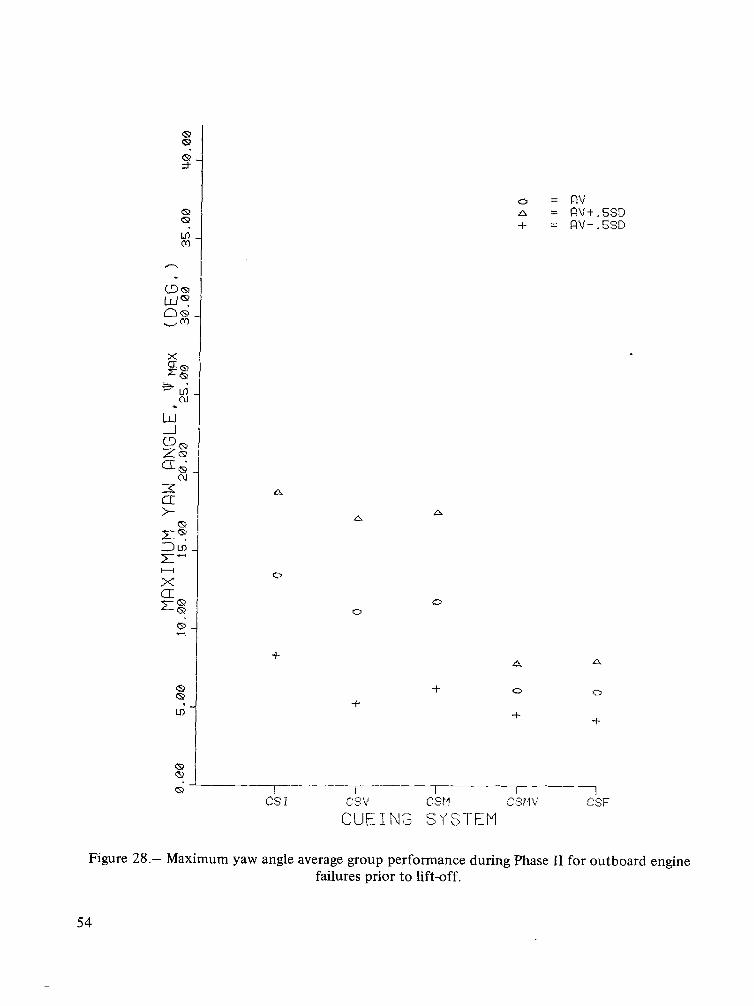
The statistics for maximum yaw angle for this task (fig. 28) indicate that both motion and visual cues are needed to hold the yaw excursion of the aircraft to a minimum.
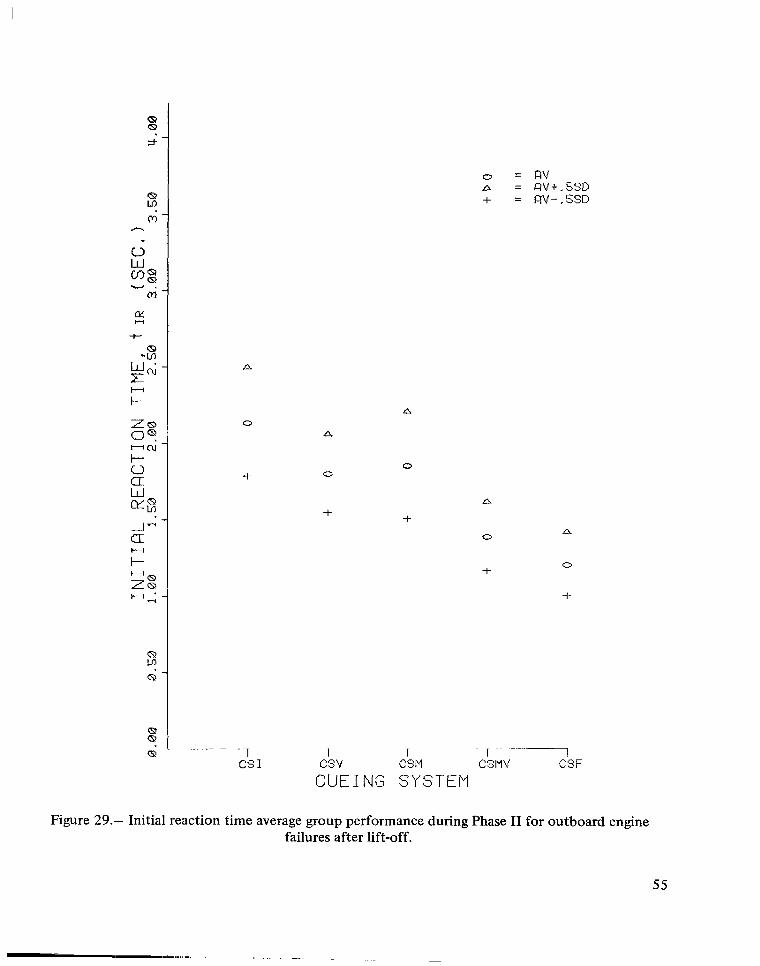
Phase / I and Phase / I I results for outboard engine failures after lift-off- The initial time response for this task (fig. 29) is not improved by the addition of visual cueing as significantly as it was for engine failures prior t o lift-off (fig. 24). However, the addition of motion-only cueing (CSM) does not improve the time response as well as the addition of visual cueing (CSV). The real improvement is seen when both motion and visual cueing are used (CSMV).Increasing the amount of motion cueing (CSF)also tends t o improve the time response. It is interesting t o note that the variance in time response for this task is nearly identical for systems with visual cueing.
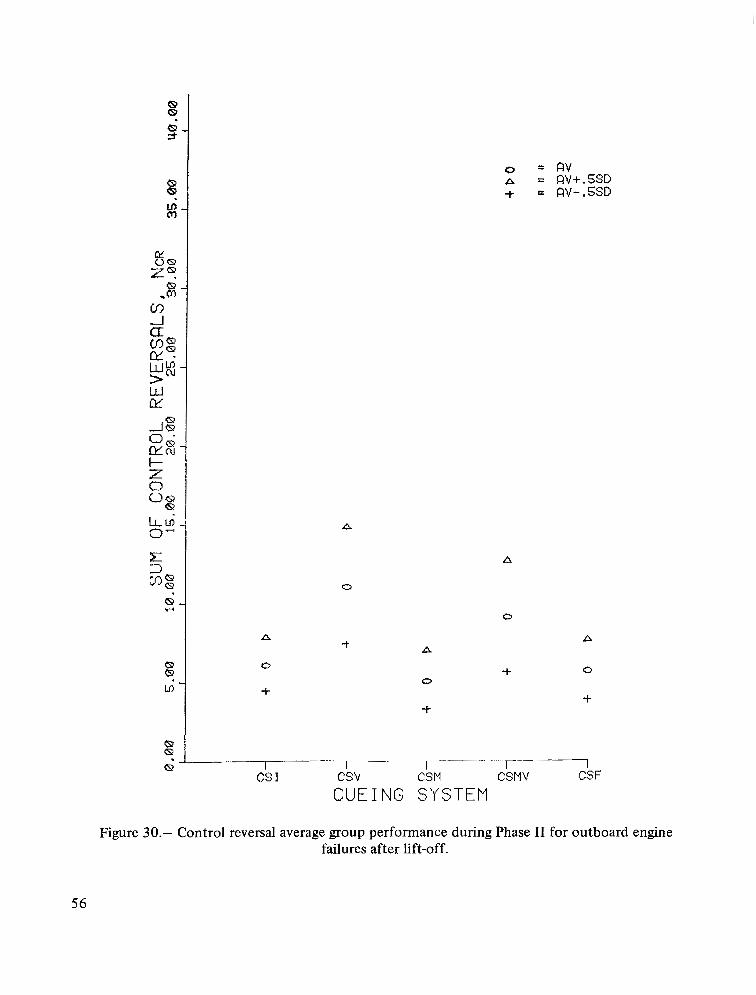
The overall level of control activity for this task (fig. 30) is slightly lower than for on-theground engine failures (fig. 25) , but the trends in effects of types of cueing are nearly identical. That is, subjects with visual cueing exhibit higher means and wider variance in control activity than subjects without visual cueing.
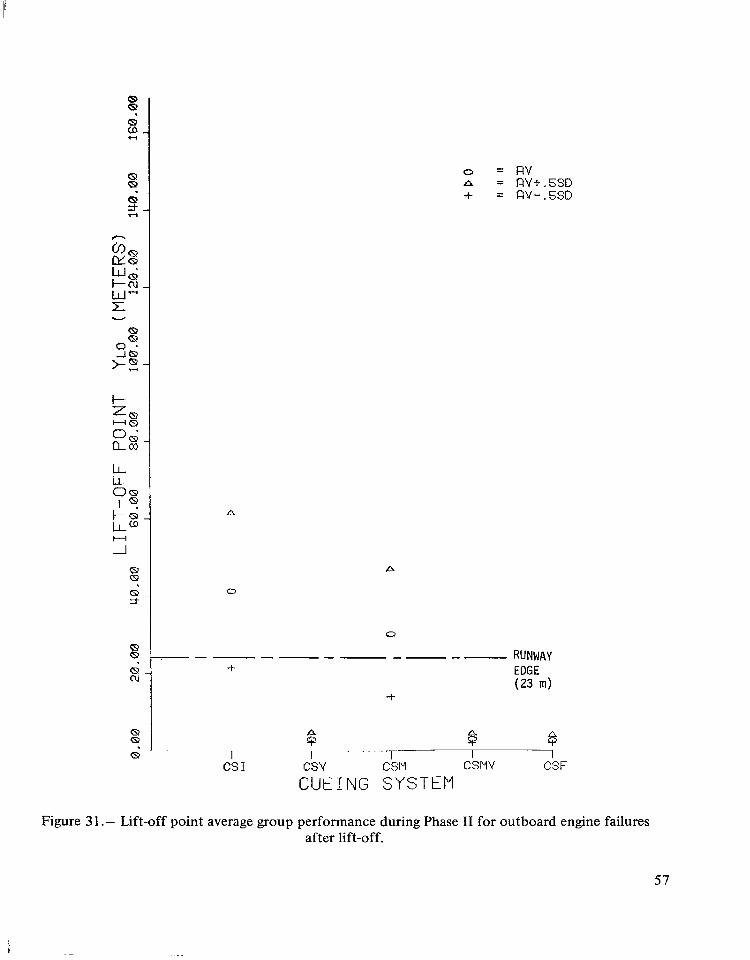
The statistics for YLO (fig. 31)merely amplify the results noted in the learning curve analysis. That is, visual cueing is obviously necessary for keeping the aircraft centered on the runway, regardless of engine failures.
13
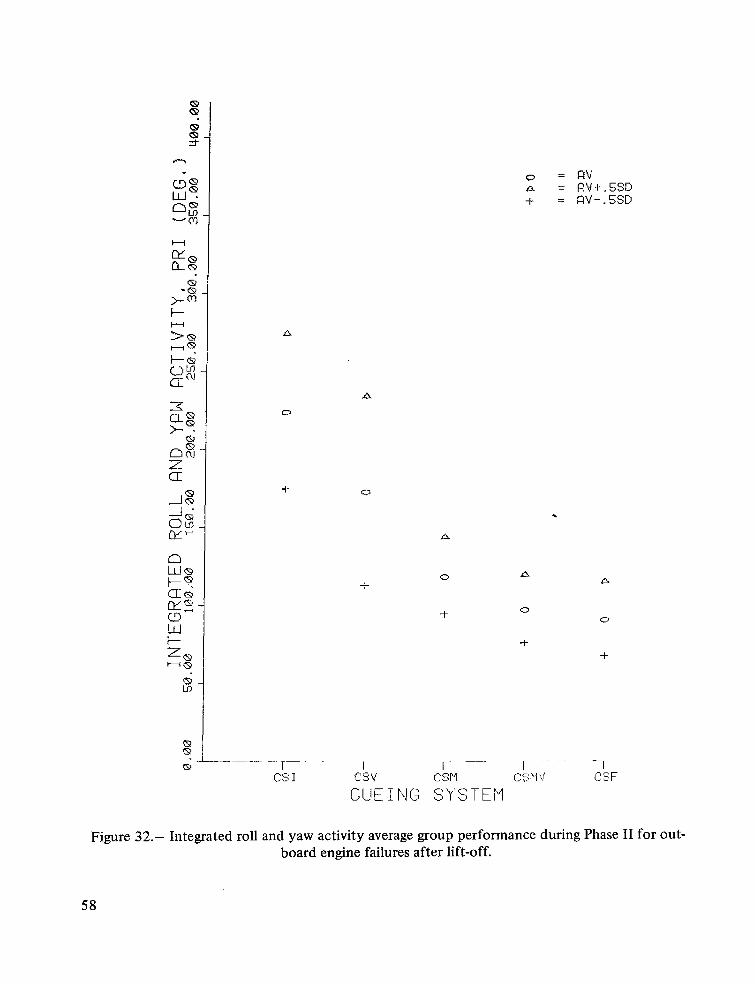
As with on-the-ground failures (fig. 27), aircraft roll and yaw activity for this task (fig. 32) is minimized primarily by motion cueing. However, the visual without motion cueing (CSV)did yield improvement in the mean PRI performance for this task as opposed to the adverse effect for on-the-gro und failures.
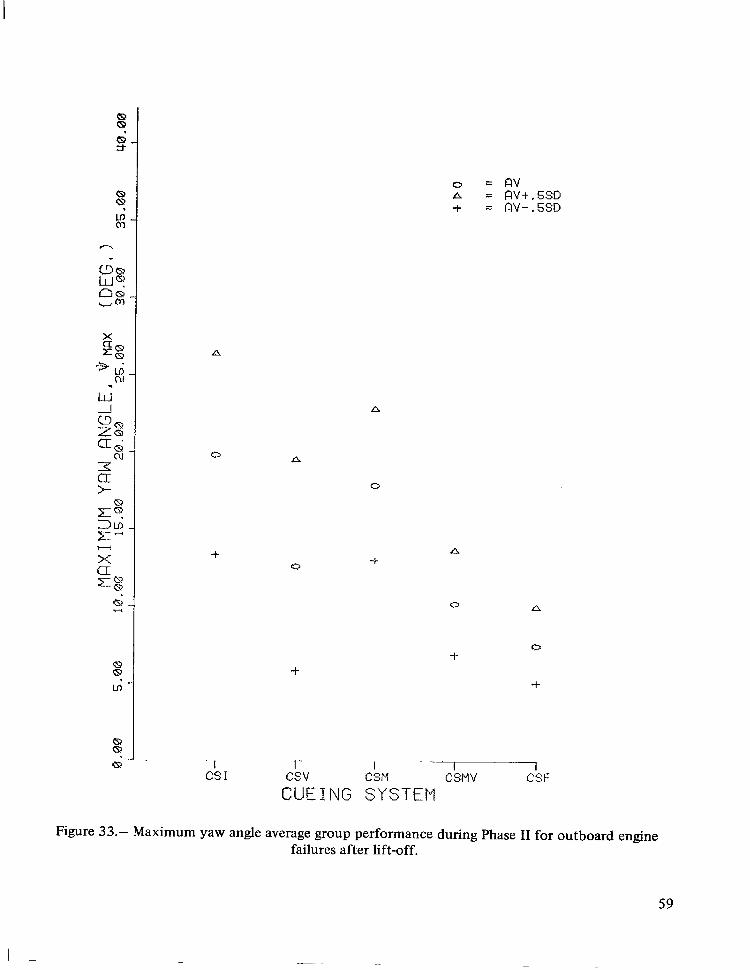
The statistics for maximum yaw angle for this task (fig. 33) again show that both motion and visual cueing are needed t o minimize However, as with PRI, CSV appears t o offer more improvement in $max performance for this task than for on-the-ground failures.
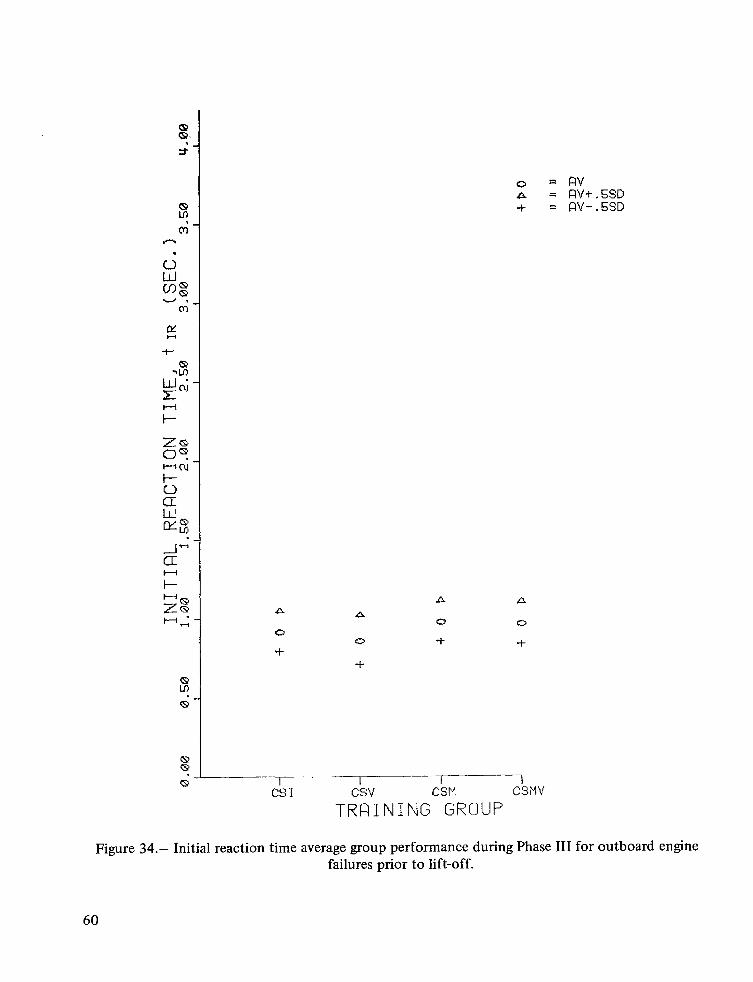
Phase III results f o r outboard engine failures prior to lift-off- During Phase 111, the maximum difference in mean time response between any of the groups was about 0.1 sec (fig. 34) and the variance was nearly the same for all groups. Therefore, no significant effects of cueing systems on time response for this task in Phase I11 are evident.
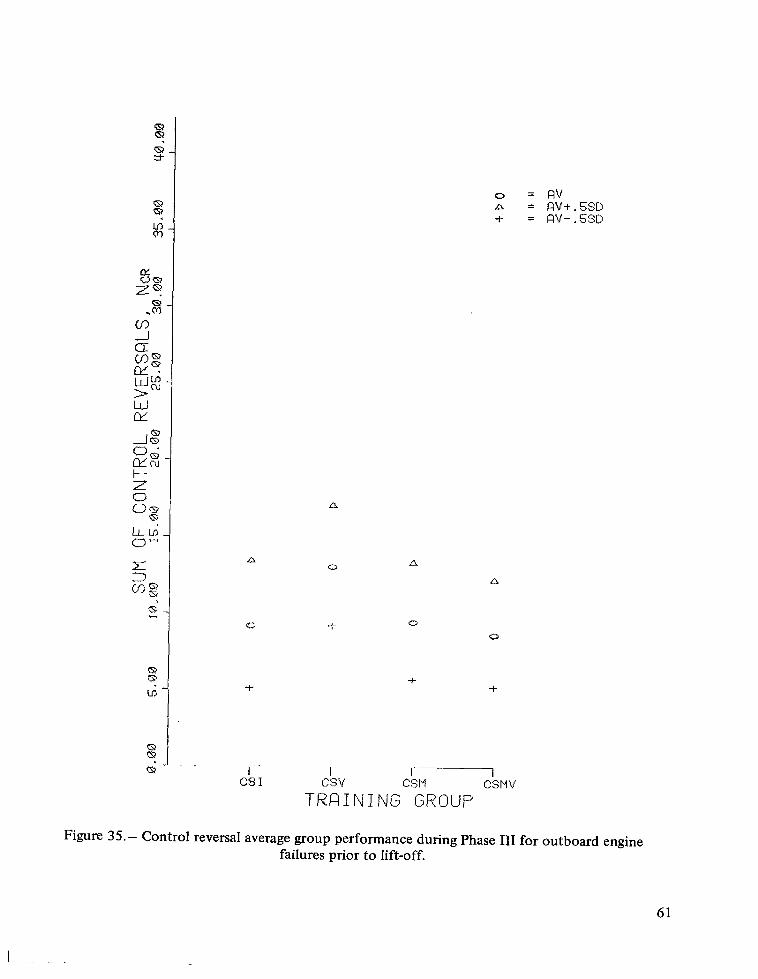
The only significant trend in the control activity data (fig. 35) is that the higher level of control activity exhibited by the CSV group seems to have carried over from Phase TI t o Phase 111.
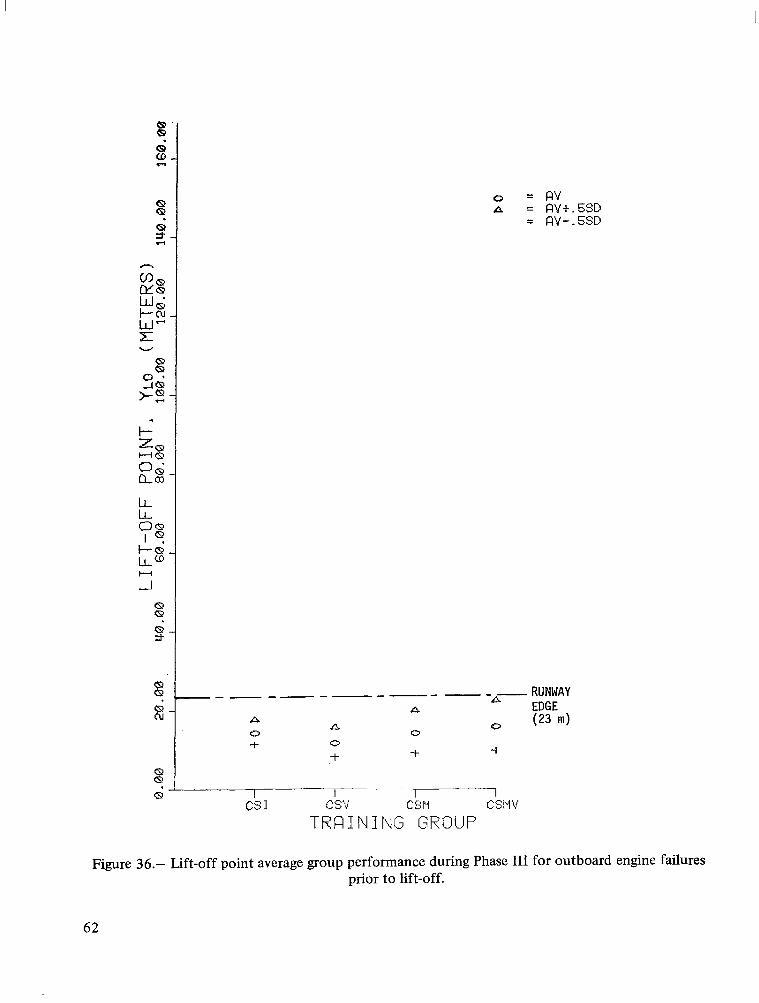
The CSM group exhibited the most difficulty in holding runway center after engine failure during Phase I11 (fig. 36). The CSV system appears t o be best for training the subjects to hold runway center for this task.
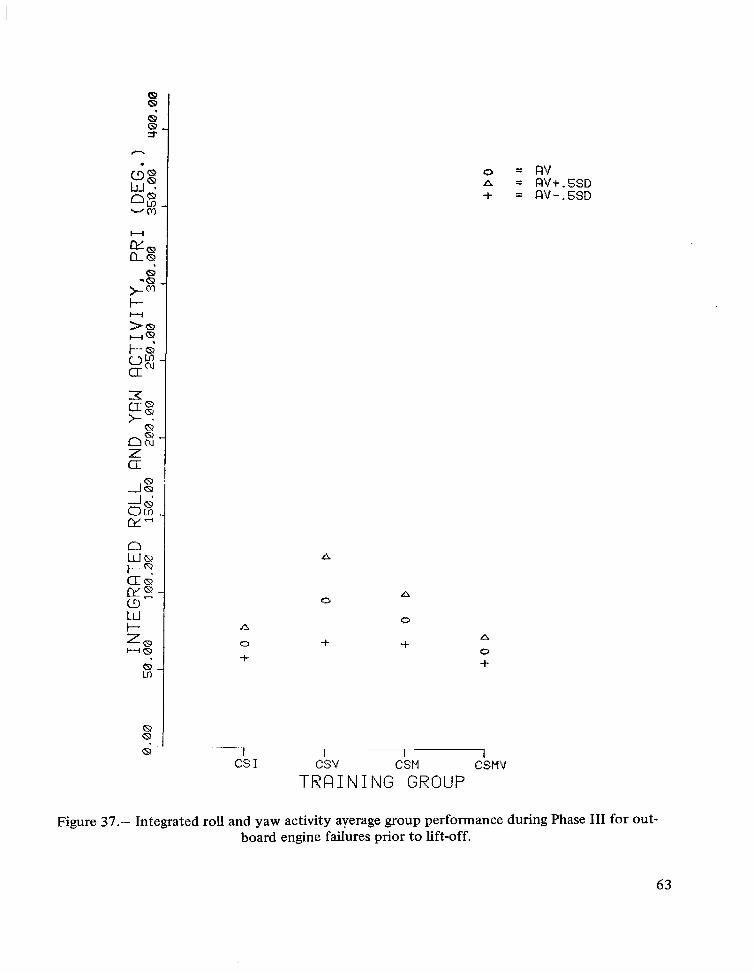
The aircraft roll and yaw activity data (fig. 37) indicate that CSMV is best for training subjects to control the aircraft after an on-the-ground failure. A surprising indication is that CSI appears t o be a better training system for this task than either CSV or CSM.
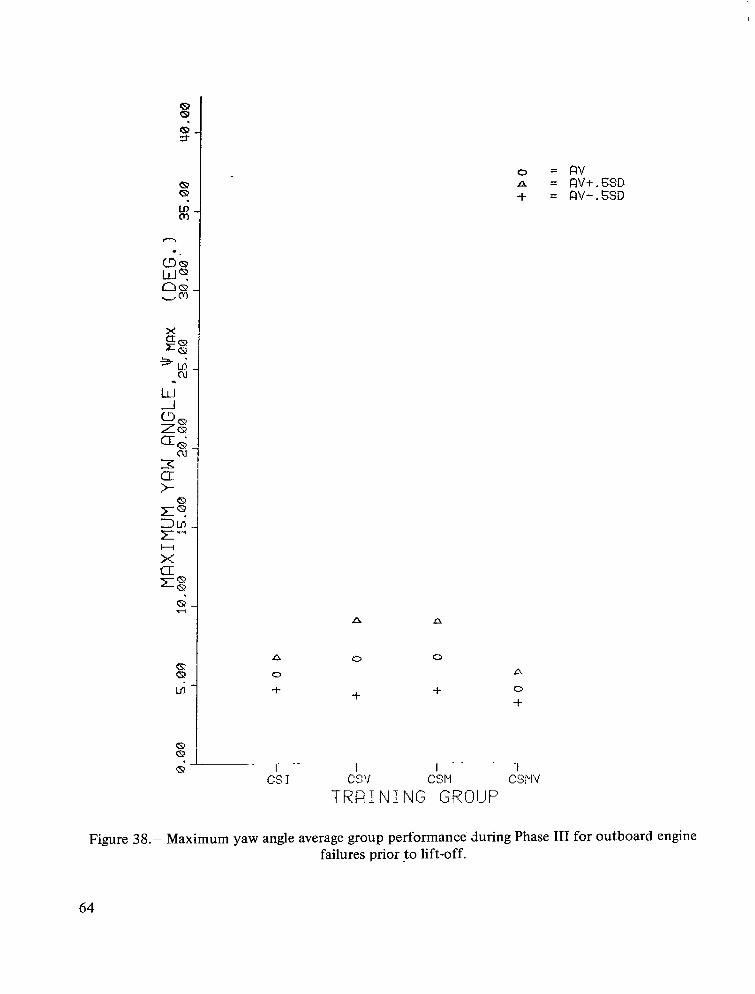
The J/max data (fig. 38) show the same trends as the PRI data for this task. However, CSV appears t o be better training for minimizing yaw excursion than CSM.
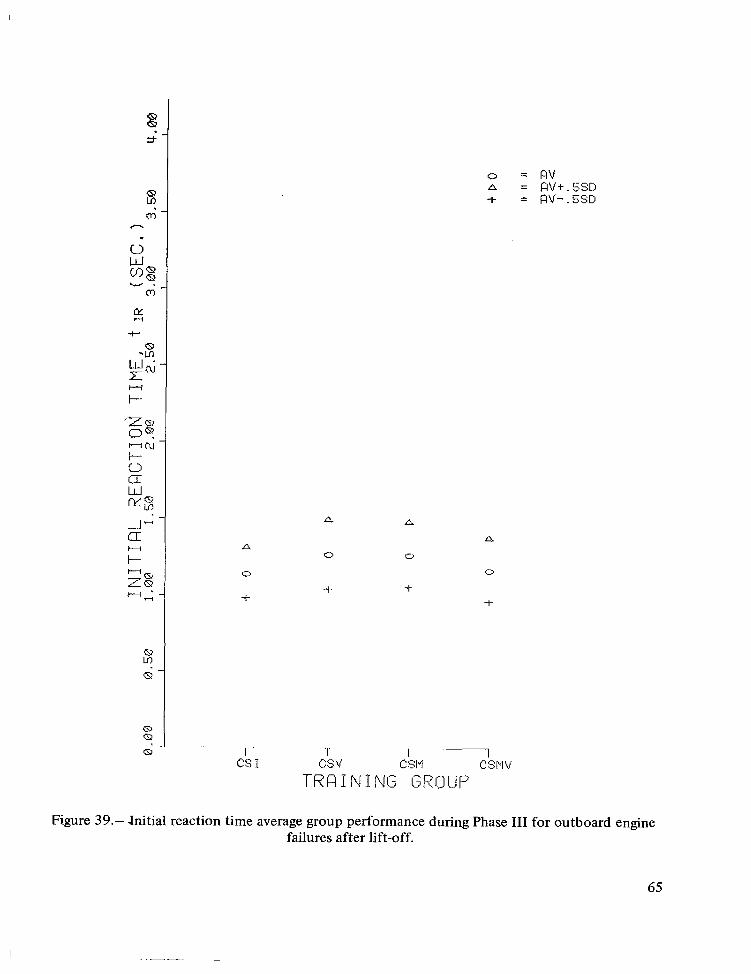
Phase III results for outboard engine failures after lift-off- Only insignificant differences in time response (maximum of 0.2 sec) are evident for this task in Phase 111 (fig. 39).
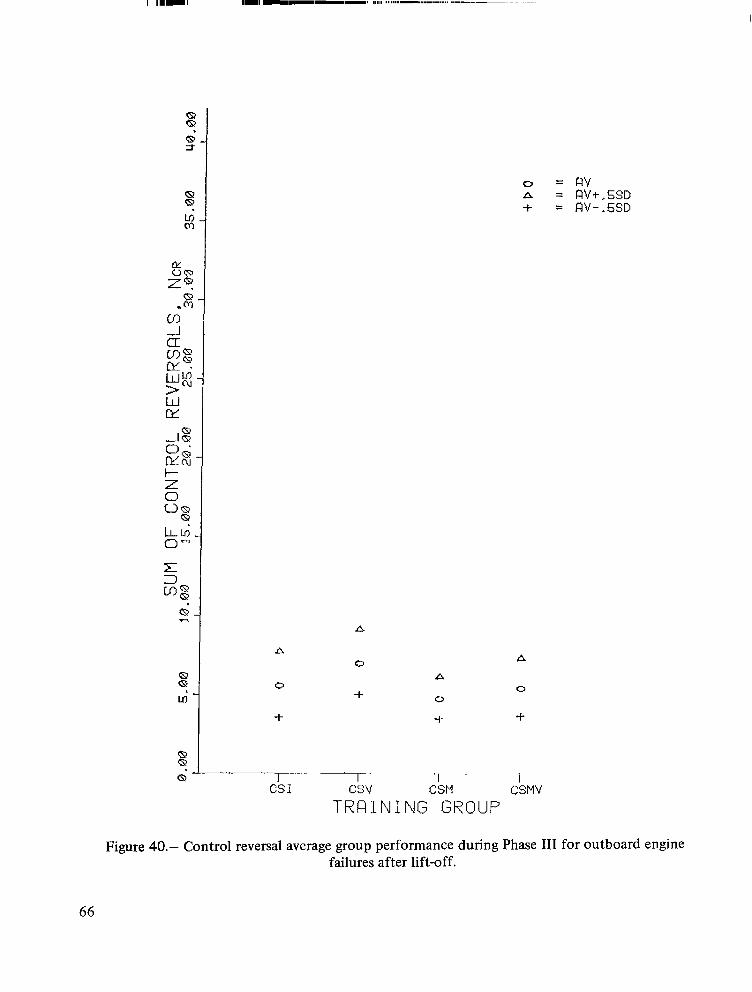
Although differences are small, the higher level of control activity exhibited by subjects with visual cueing appears to have carried over to Phase 111 for this task (fig. 40).
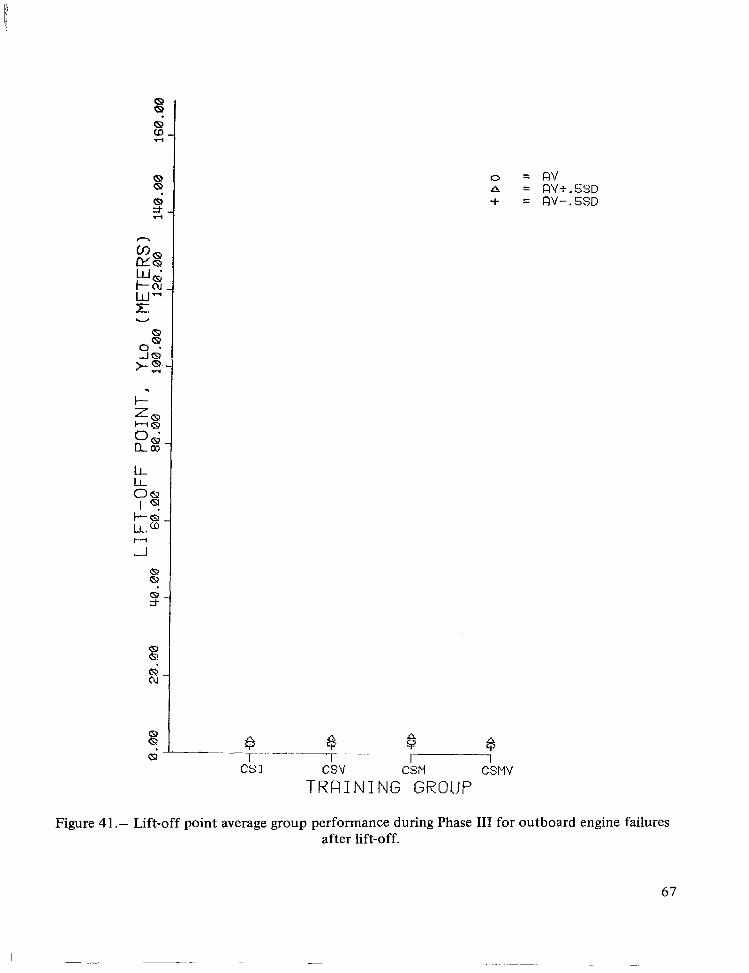
The maximum difference in Y L 0 means between any of the groups in Phase I11 was about 0.8 m (fig. 41) and the variance was nearly the same for all groups. Therefore, no significant trends are evident in the YLO data for this task during Phase 111.
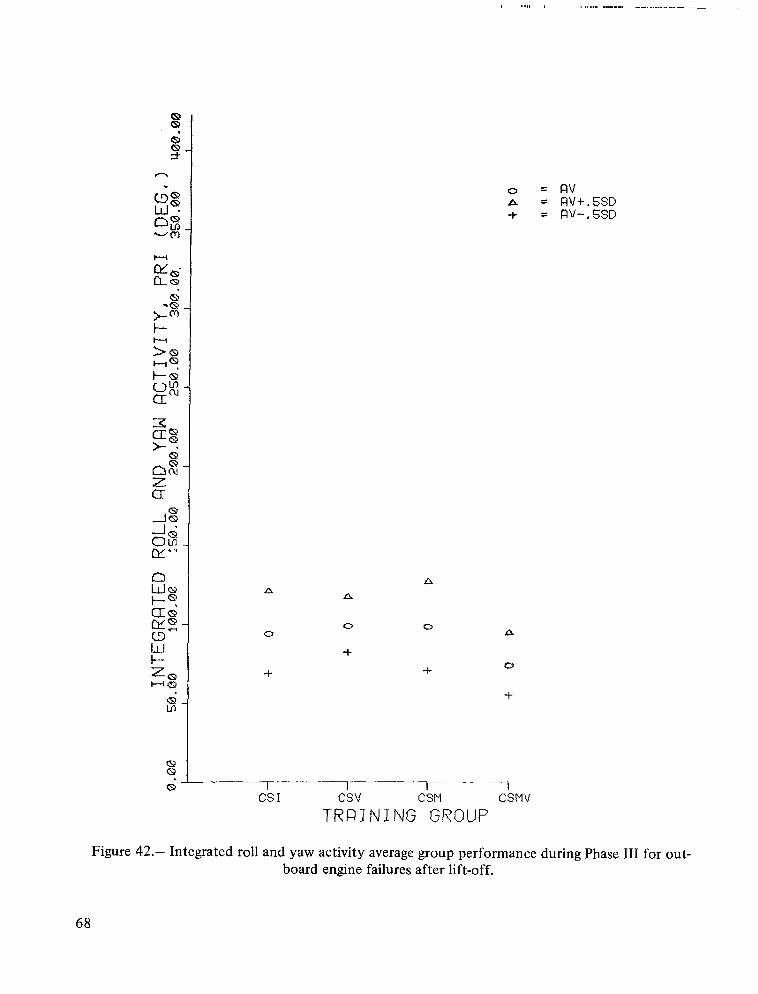
Similar to on-the-ground failures (fig. 37), the PRI data (fig. 42) indicate that CSMV is best for training subjects to control the aircraft after an engine failure following lift-off.
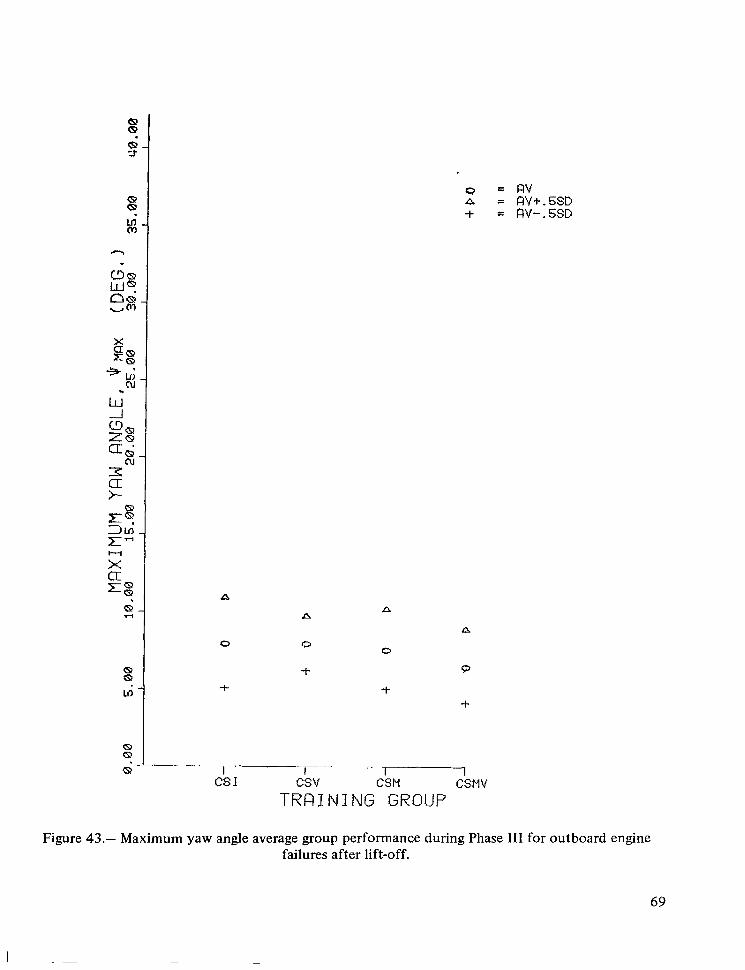
Although differences in (I,,,data are small (fig 43), these data exhibit the same trends as the PRI data (fig. 42) for this task.
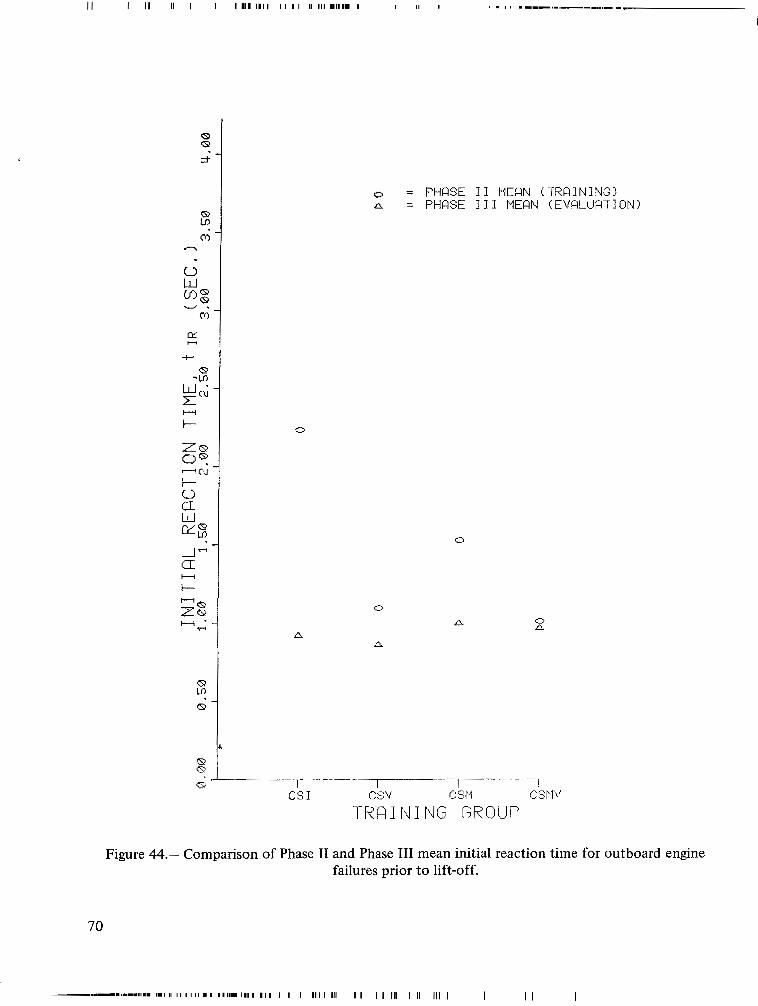
Comparison o f Phase II (Training) and Phase III (Evaluation) means for engine failures prior to lift-off- The means of time response for this task (fig. 44) more clearly indicate the significant improvement achieved by visual cueing and the marginal improvement achieved by adding motion to visual.
14
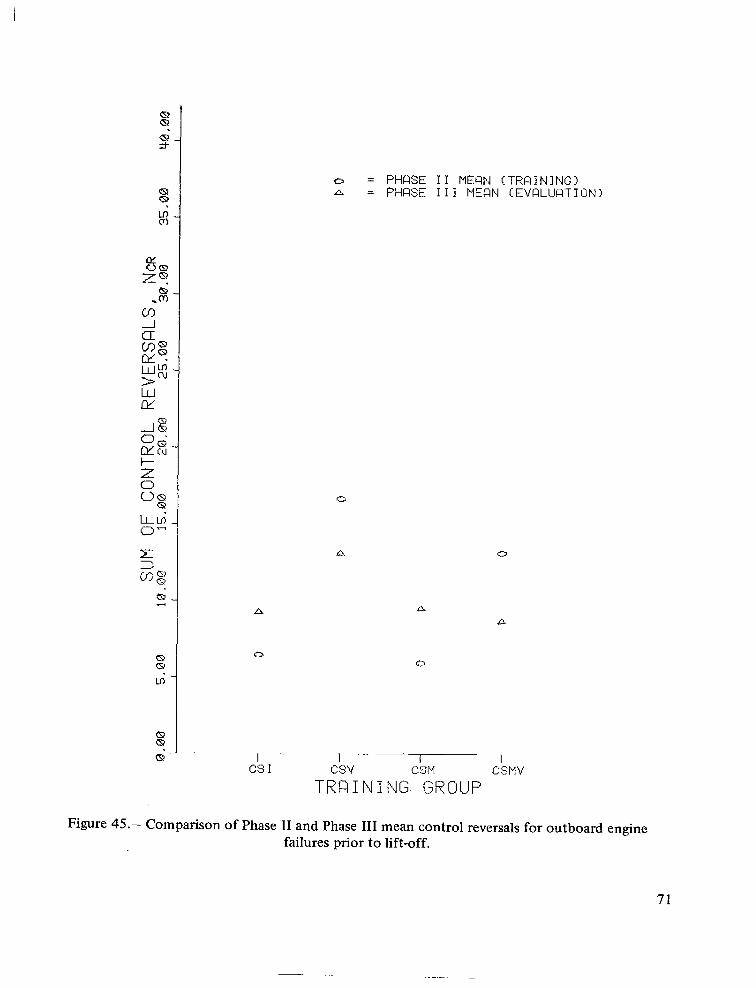
If one considers an optimum level o f control activity for this task to be near the Phase I11 mean for CSMV (fig. 45), this optimum appears to be approached from the high side by cueing system groups with visual cueing, and from the low side by groups without visual cueing.
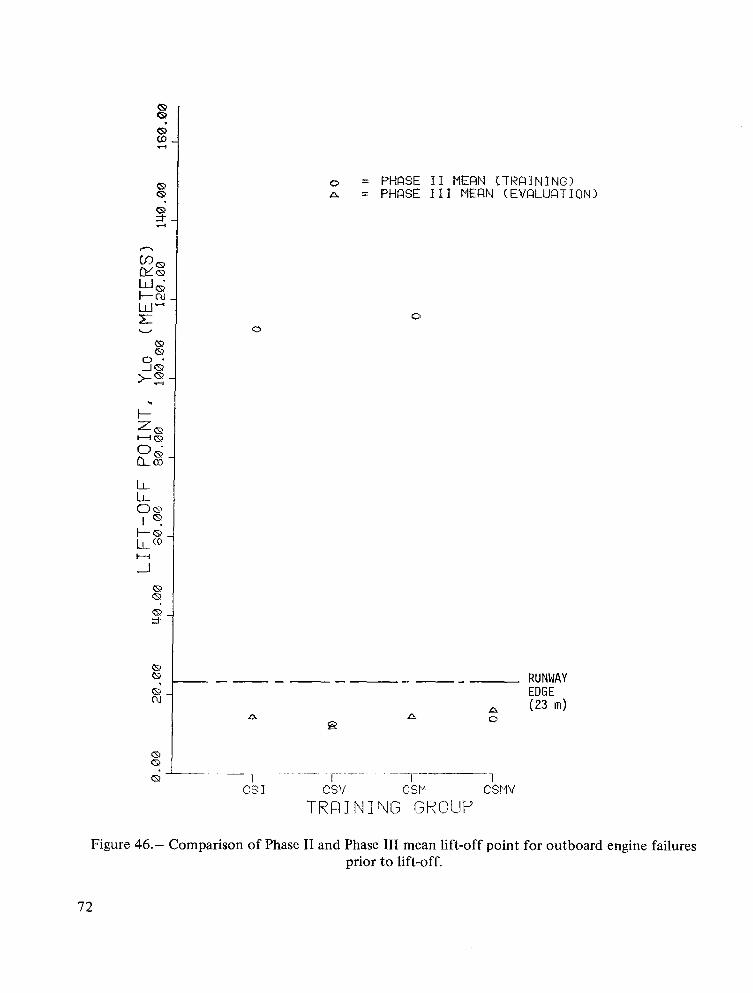
The necessity of visual cueing for holding runway center after an on-the-ground engine failure is again illustrated by the YLo means presented in figure 46.
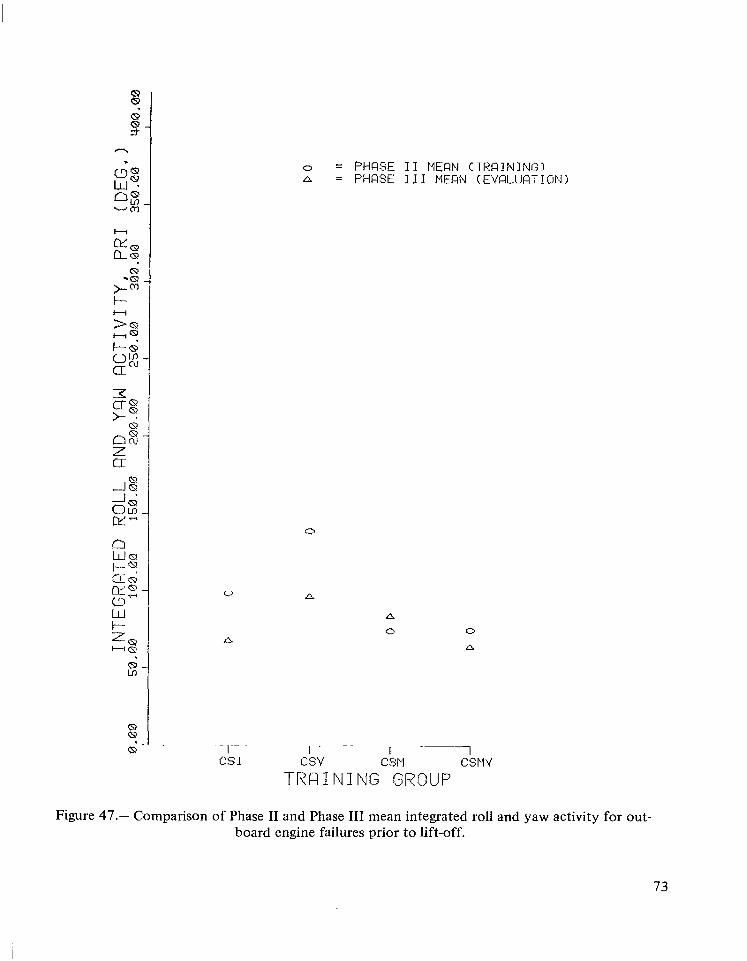
The PRI means presented in figure 47 support the view that motion with visual cueing is the primary aid to controlling the aircraft for this task.
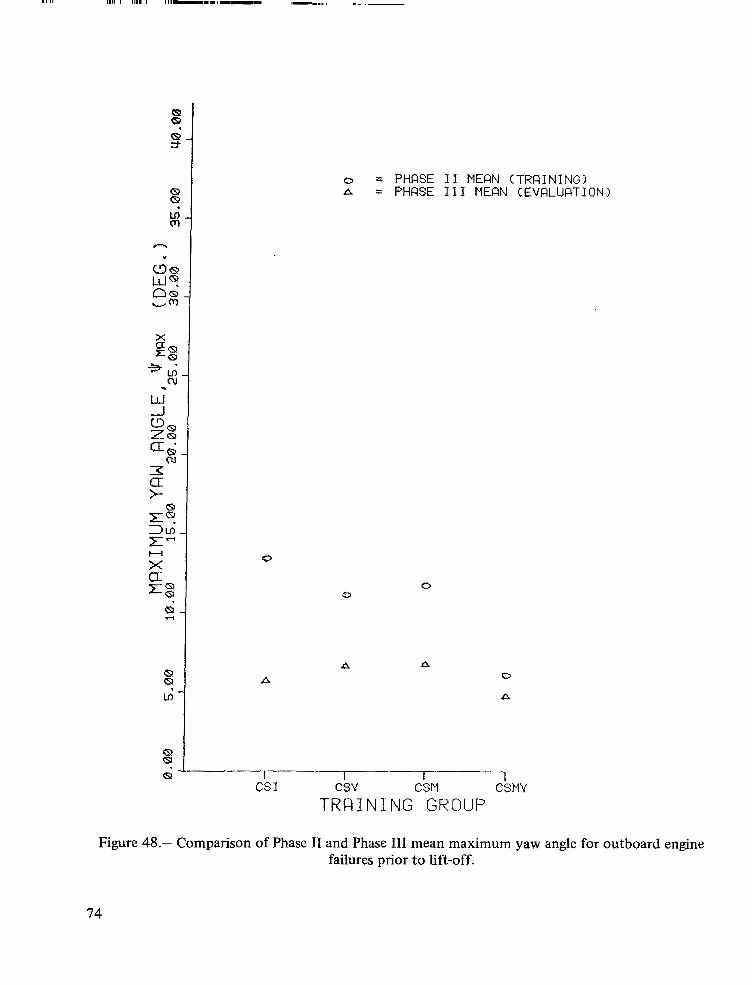
The GmaX means presented on figure 48 illustrate the value of combined motion and visual cueing with respect to keeping yaw excursion to a minimum.
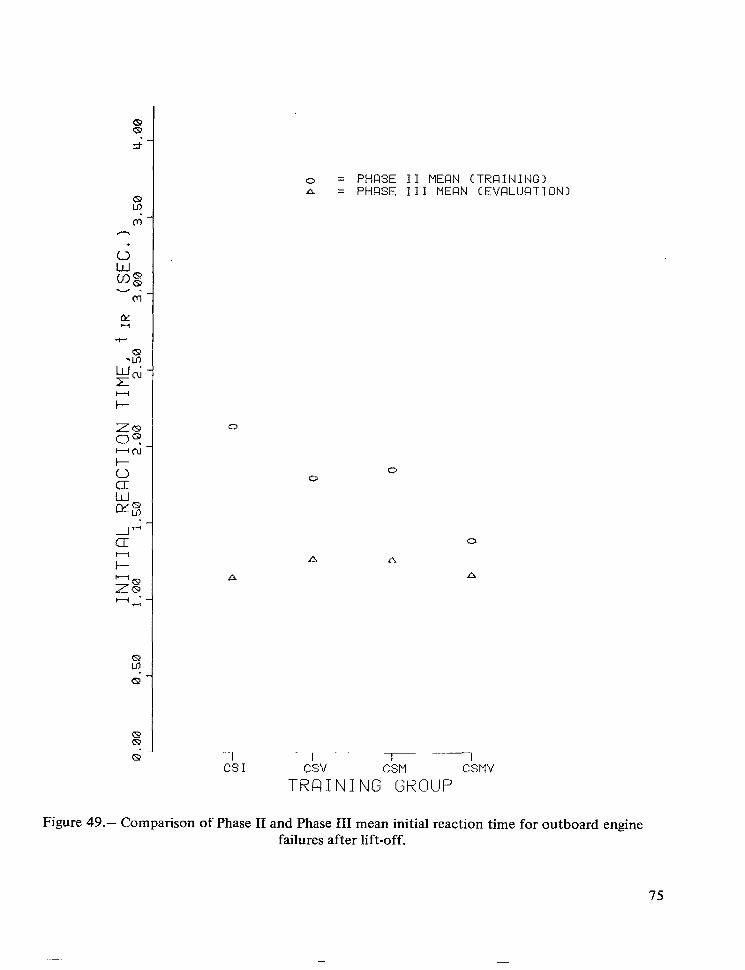
Comparison o f Phase II (Training) and Phase III (Evaluation) means for engine failures after lift-off- The t I R means presented in figure 49 clearly indicate the importance of combining visual and motion cueing to achieve minimum response times for this task.
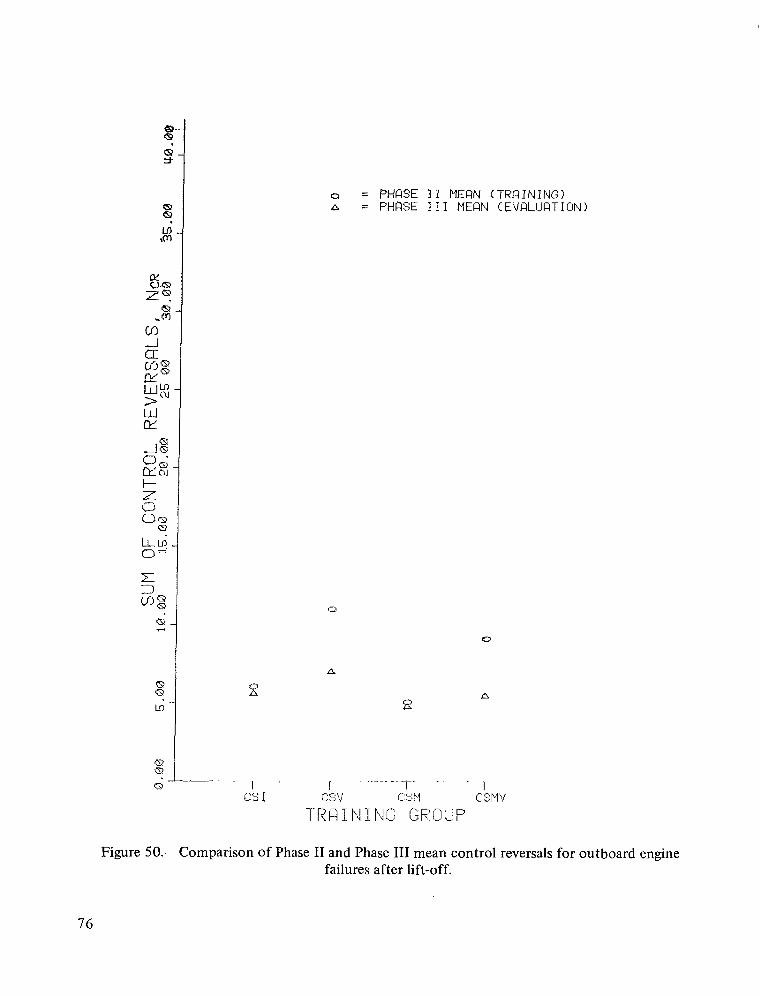
The amount of control activity f o r this task (fig. 50) shows trends similar t o the on-the-ground failures in that the groups trained in systems with visual cueing exhibit a higher level of control activity.
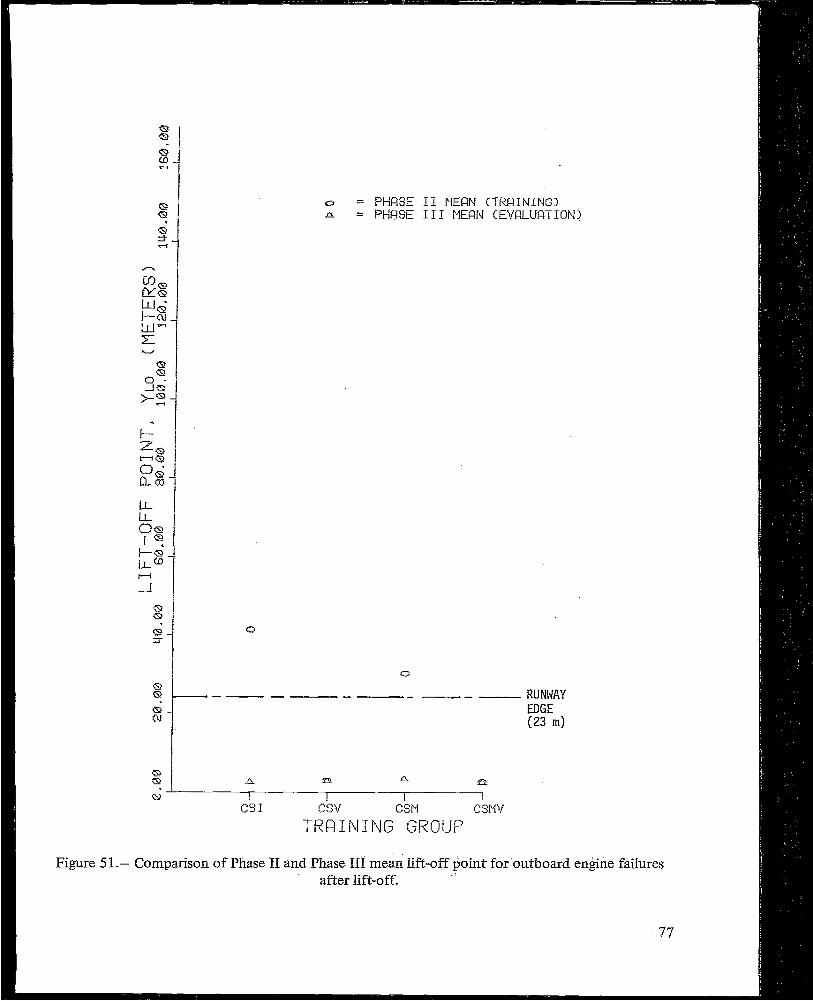
The YLO means presented in figure 51 again illustrate the need for visual cueing to hold the runway center regardless of engine failures.
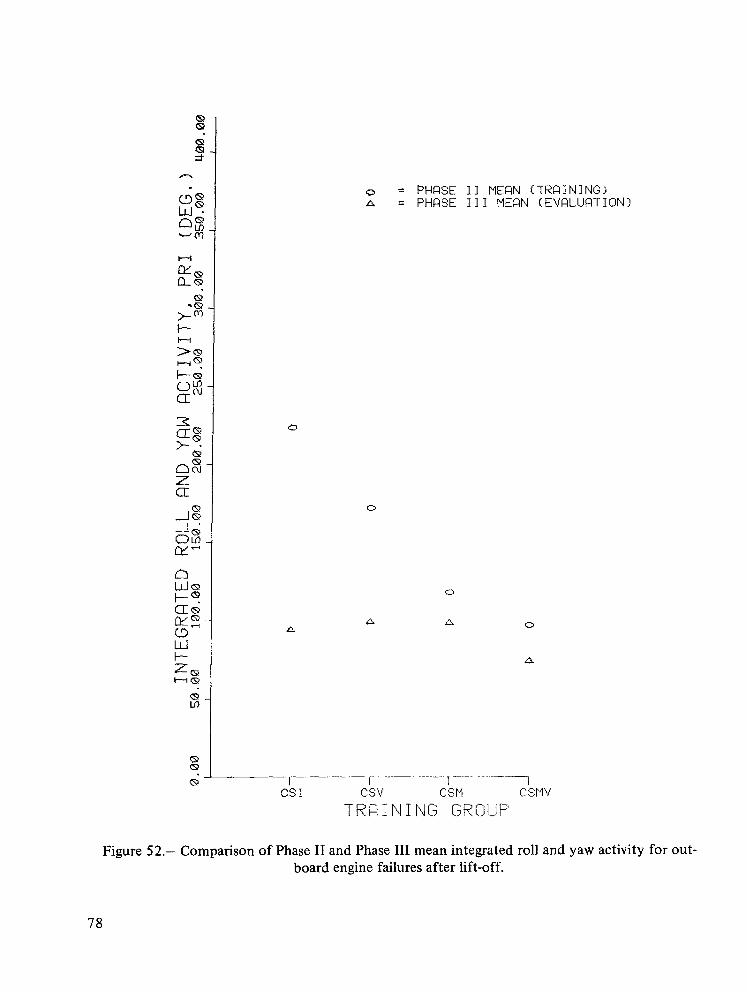
The roll and yaw activity means (fig. 52) indicate that the motion cueing is the primary aid for controlling the aircraft for this task, and that the combination of visual and motion cueing seems to provide the best training.
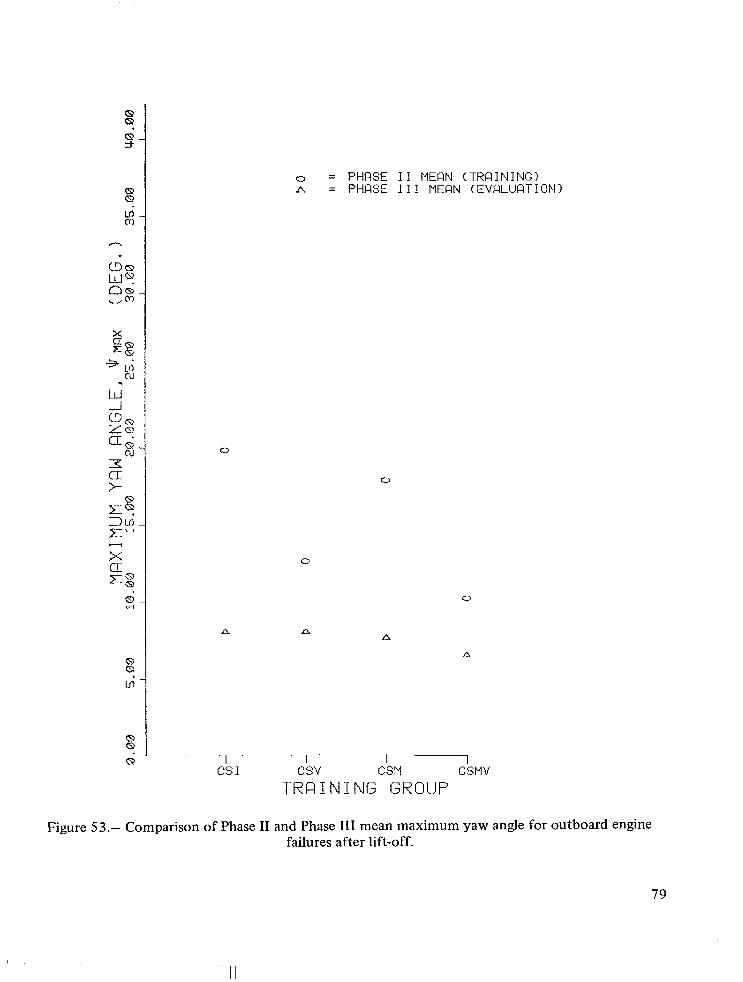
As with the on-the-ground failures, the GmaX means presented in figure 53 support the need for combined visual and motion cueing with respect to keeping yaw excursion to a minimum.
SUMMARY OF RESULTS
An investigation of the effects of visual scene and motion simulation on the ability of a pilot to perform the task of controlling a large four-engine transport aircraft following an outboard engine failure during takeoff has indicated the following:
1. The use of cockpit instruments only or cockpit instruments in conjunction with limited motion is inadequate for negotiating engine failures during takeoff and offer poor training for this task.
2. The visual cueing is mandatory for keeping the aircraft on the runway during takeoff regardless of engine failures.
15
I 1 I I I II I I III I. I ,II,,, I I 11.11. _I-.. ....,..._-__- I
3. The visual cueing added t o cockpit instruments offers significant improvement with respect t o detecting the onset of an engine failure, but motion is highly desired t o achieve high overall task performance.
4. The visual scene offers an improvement with respect to training, but visual and motion cueing far exceed the visual-alone capabilities.
Both performance measures and subjective opinion indicated the results stated above. However, further studies should be conducted to evaluate the effects of various levels of motion cueing on performance for a wide range of aircraft and tasks.
Ames Research Center National Aeronautics and Space Administration
Moffett Field, Calif. 94035, Feb. 21, 1978
16
I
-1 111-11= II11111I11111 1 1 1111 II 1111II I m III II1.1 111 I1111I I
APPENDIX A
SAMPLE SUBJECT QUESTIONNAIRES
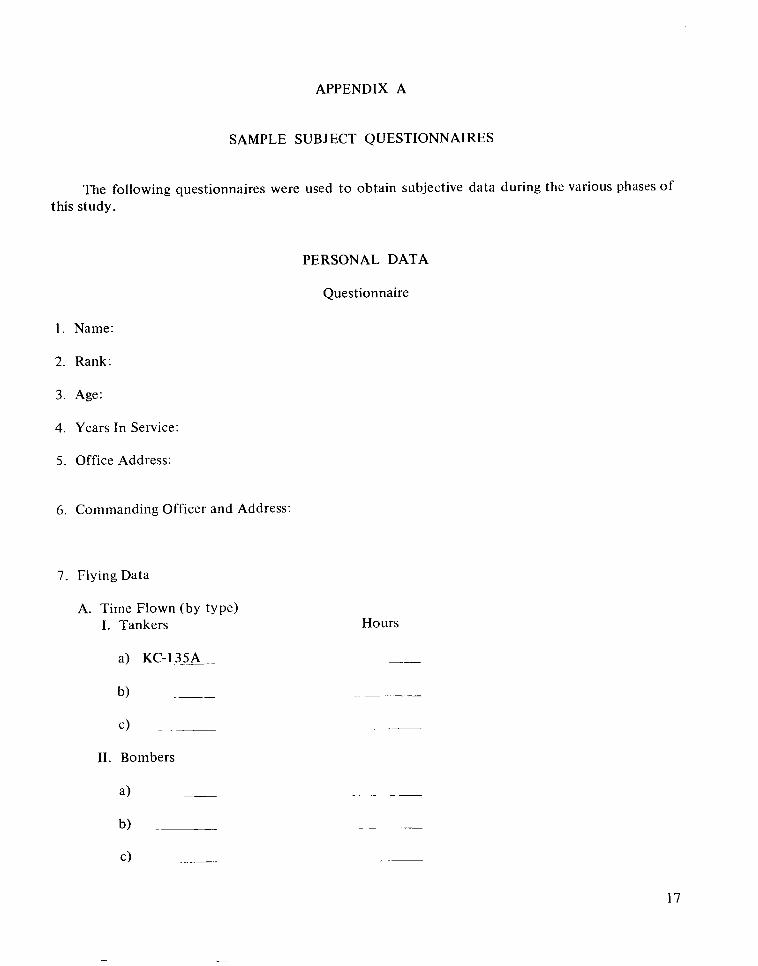
The following questionnaires were used to obtain subjective data during the various phases of this study.
PERSONAL DATA
1. Name:
2. Rank:
3. Age:
4. Years In Service:
5. Office Address:
6. Commanding Officer and Address:
7. Flying Data
A. Time Flown (by type) I. Tankers
a) KC-135A
11. Bombers
Questionnaire
Hours
. -___
17
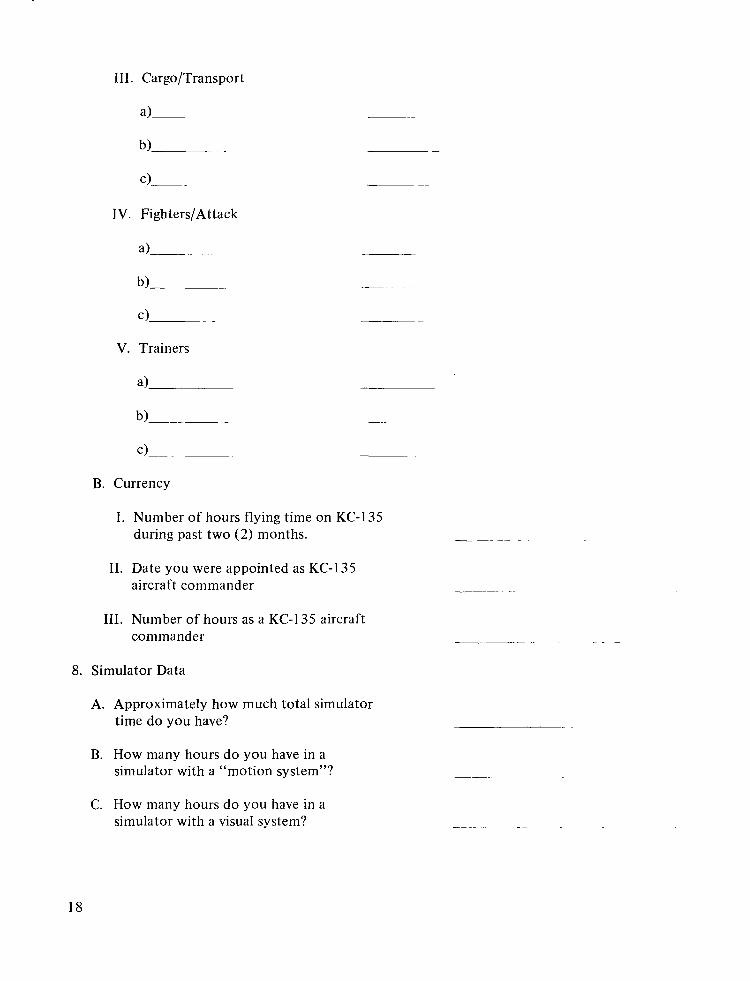
111. Cargo/Transport
V. Trainers
B. Currency
I. Number of hours flying time on KC-1 35 during past two (2) months.
11. Date you were appointed as KC-135 aircraft commander
111. Number of hours as a KC-135 aircraft commander
8. Simulator Data
A. Approximately how much total simulator time do you have?
B. How many hours do you have in a simulator with a “motion system”?
C. How many hours d o you have in a simulator with a visual system?
18
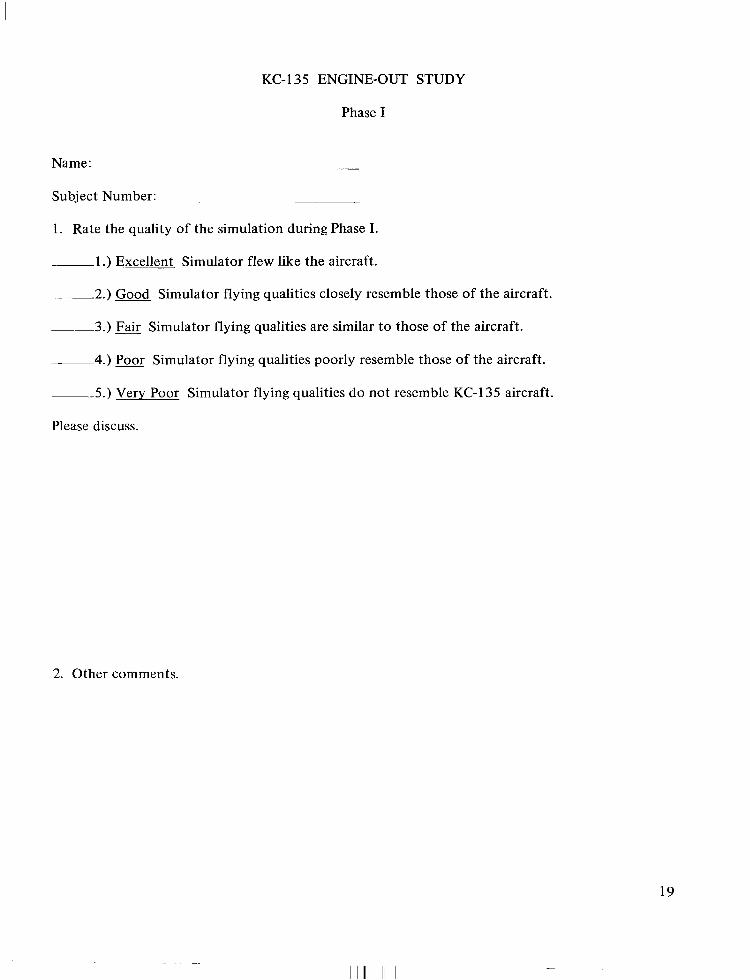
KC-135 ENGINE-OUT STUDY
Phase I
Name:
Subject Number:
1. Rate the quality of the simulation during Phase I .
.) Excellent Simulator flew like the aircraft.
-2.) Good Simulator flying qualities closely resemble those of the aircraft.
-3.) Fair Simulator flying qualities are similar to those of the aircraft.
-4.) Poor Simulator flying qualities poorly resemble those of the aircraft.
-5.) Very Poor Simulator flying qualities do not resemble KC-135 aircraft.
Please discuss.
2. Other comments.
19
-1

KC-1 35 ENGINE-OUT STUDY
Phase I1
Name:-- - . _ -
Subject Number: .
1 . What cues did you use t o detect when an engine failure had occurred? Please discuss.
2. What cues did you use t o discriminate between outboard and inboard engine failures? Please discuss.
3. Rate how sufficiently these cues enabled you t o negotiate engine failures.
a) Very sufficient Cues consistently permitted a prompt and proper reaction.
b) Sufficient. Cues usually permitted a prompt and proper reaction.
c) Occasionally, Sufficient Cues occasionally permitted a prompt and proper reaction.
d) Insufficient- Cues rarely permitted prompt and proper reaction.
e) Very Insufficient Cues were inadequate to permit a prompt and proper reaction. Please discuss.
4. Rate this cueing system as a training device for outboard engine failures in actual aircraft.
a) Excellent
b) Good
c) Fair
-d) Poor
-e) Very poor
Please discuss.
20
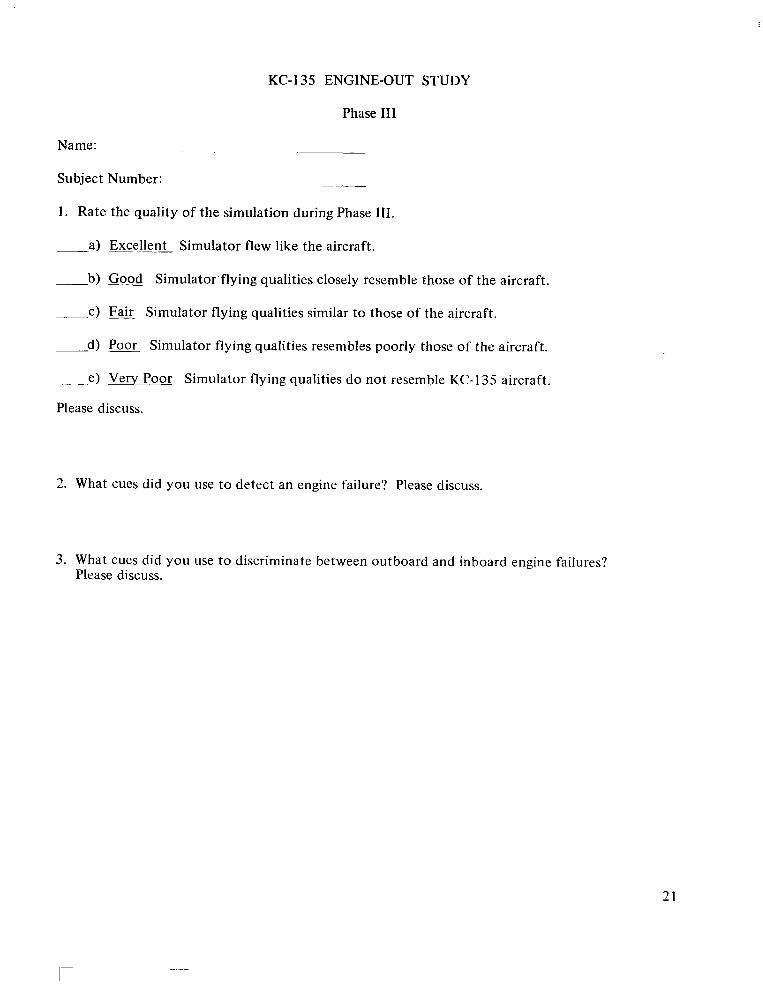
KC-1 35 ENGINE-OUT STUDY
Phase 111
Name:
Subject Number:
1 . Rate the quality of the simulation during Phase 111.
a) Excellent Simulator flew like the aircraft.
b) Good Simulator.flying qualities closely resemble those of the aircraft.
c) Fair Simulator flying qualities similar t o those of the aircraft.
d ) Poor Simulator flying qualities resembles poorly those of the aircraft.
e) Very Poor Simulator flying qualities do not resemble KC-I 35 aircraft.
Please discuss.
2. What cues did you use t o detect an engine failure? Please discuss.
3. What cues did you use t o discriminate between outboard and inboard engine failures? Please discuss.
21
I-
4. Rate how sufficiently these cues enabled you to negotiate an engine failure.
a) Very Sufficient Cues consistently permitted a prompt and proper reaction.
b) Sufficient Cues usually permitted a prompt and proper reaction.
c) Occasionally Sufficient Cues occasionally did permit a prompt and proper reaction.
d) Insufficient Cues rarely permitted prompt and proper reactions.
-e) Very Insufficient Cues were inadequate to permit a prompt and proper reaction.
Please discuss.
5. Describe the relationship between the cueing system you used in Phase I1 and you; performance in Phase 111.
a) Strong Positive Relationship Experience with Phase I1 cueing system was excellent training for Phase 111.
-b) Positive Relationship Experience with Phase I1 cueing system was good training for Phase 111.
-c) Neutral Relatiomhip Experience with Phase 11 cueing system was of little value in Phase 111.
-d) Negative Relationship Experience with Phase I1 cueing system led to some improper reactions in Phase 111.
-e) Strong Negative Relationship Experience with Phase I1 cueing system led to many improper reactions in Phase 111.
Please discuss.
22
1 2 3 4 5 6 7 8
1 2 3 4 5 6 7 8
1 2 3 4 5 6 7 8
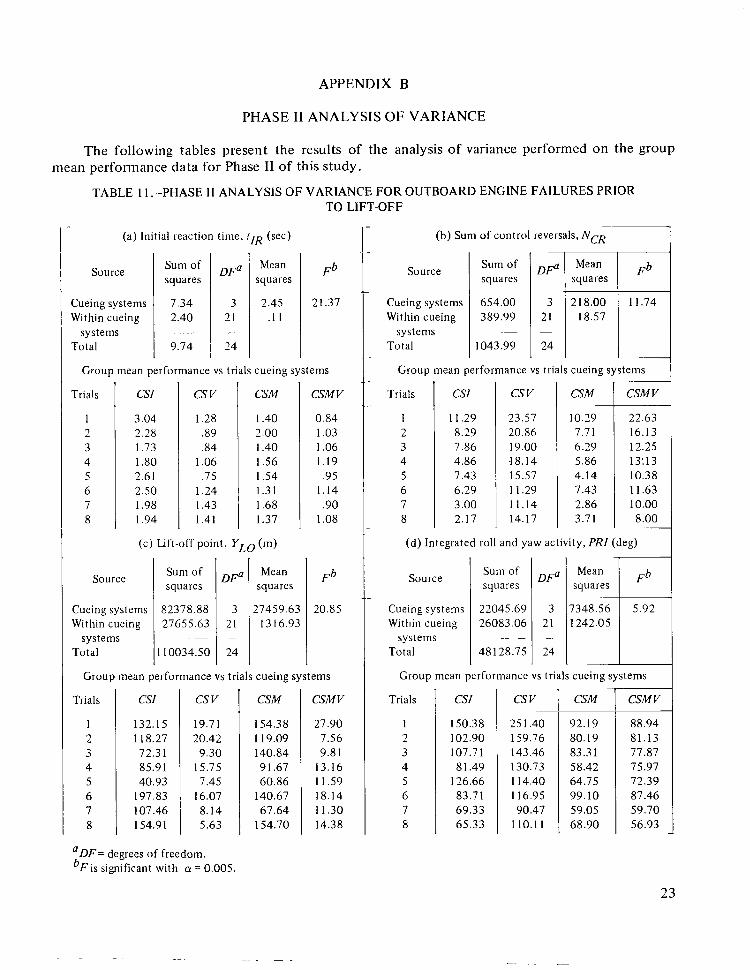
APPENDIX B
PHASE I1 ANALYSIS OF VARIANCE
The following tables present the results of the analysis of variance performed on the group mean performance data for Phase I1 of this study.
TABLE 1 1 .-PHASE I1 ANALYSIS OF VARIANCE FOR OUTBOARD ENGINE FAILURES PRIOR TO LIFT-OFF
1 - (a) Initial reaction time, t IR (sec) I- (b) Sum of control reversals, NCRI Sum of
Source Sum of D F ~ Mean Fb I Source squaressquares squares I J
Cueing systems 7.34 3 2.45 21.37 Cueing systems 654.00 3 218.00 11.74 Within cueing 2.40 21 . I 1 Within cueing 389.99 21 18.57
systems .- - systems .- -
Total 9.74 24 Total 1 1043.99 24 ~ ~
Trials CSI csv CSM CSM V Trials CSI csv CSM CSM V
3.04 1.28 1.40 0.84 1 1.29 23.57 10.29 22.63 2.28 .89 2.00 1.03 8.29 20.86 7.71 16.13 1.73 .84 1.40 1.06 7.86 19.00 6.29 12.25 1 .BO 1.06 1.56 1.19 4.86 18.14 5.86 13:13 2.61 .75 1.54 .95 7.43 15.57 4.14 10.38 2.50 1.24 1.31 1.14 6.29 11.29 7.43 1 1.63 1.98 1.43 1.68 .90 3 .OO 11.14 2.86 10.00 1.94 1.41 1.37 1.08 2.17 14.17 3.71 8.00
.-
Cueing systems 82378.88 3 27459.63 20.85 Within cueing 27655.63 21 1316.93
systems .- - systems Total 110034.50 24 Total
Group mean performance vs trials cueing systems
Trials CSI csv CSM CSM V Trials CSI csv ~
132.15 19.71 154.38 27.90 150.38 25 1.40 92.19 88.94 1 18.27 20.42 119.09 7.56 102.90 159.76 80.19 81.13 72.3 1 9.30 140.84 9.81 107.71 143.46 83.31 77.87 85.91 15.75 91.67 13.16 81.49 130.73 40.93 7.45 60.86 11.59 126.66 1 14.40 64.75 72.39
197.83 16.07 140.67 18.14 83.71 116.95 107.46 8.14 67.64 1 1.30 69.33 90.47 59.05 59.70 1 54.9 1 5.63 154.70 14.38 65.33 110.1 1
aDF= degrees of freedom. bF is significant with a = 0.005
23
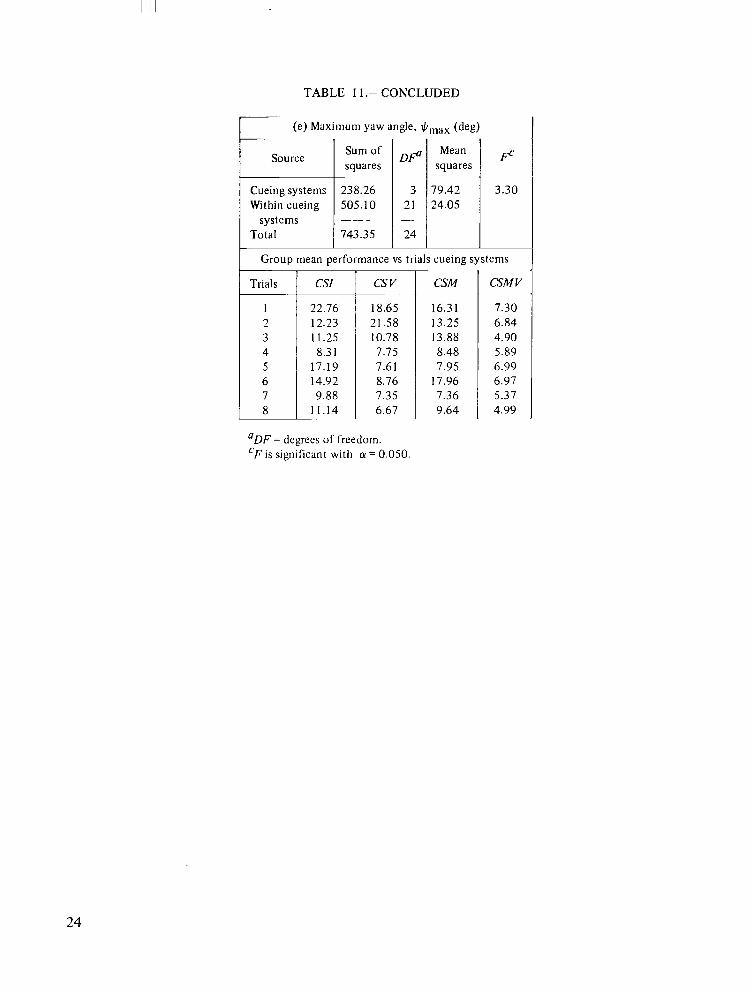
TABLE 1 1 . - CONCLUDED
(e) Maximum yaw angle, $max (deg)
Source 1 Sumof I D p / Mean I FC squares squares
systems Total 743.35
Group mean performance vs trials cueing systems ~
Trials CSJ csv CSM CSMV
22.76 18.65 16.31 7.30 12.23 21.58 13.25 6.84 11.25 10.78 13.88 4.90 8.3 1 7.75 8.48 5.89
17.19 7.61 7.95 6.99 14.92 8.76 17.96 6.97 9.88 7.35 7.36 5.37
11.14 6.67 9.64 4.99
‘DF = degrees of freedom. ‘ F is significant with a = 0.050.
24
1 2 3 4 5 6 7 8
1 2 3 4 5 6 7 8
1 2 3 4 5 6 7 8
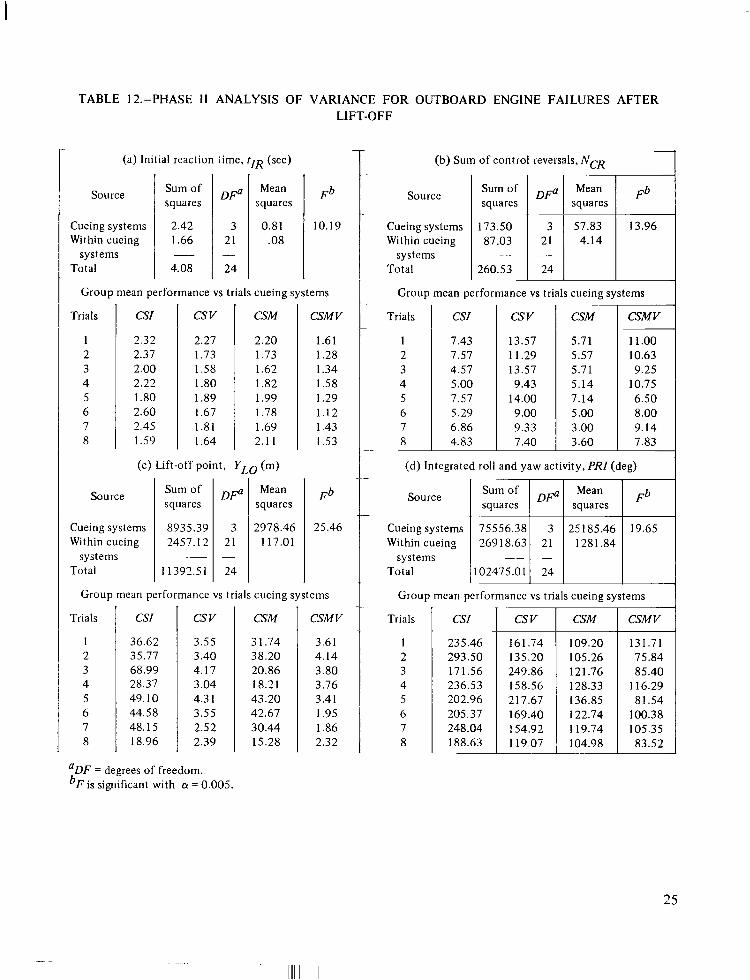
TABLE I2.-PHASE I I ANALYSIS OF VARIANCE FOR OUTBOARD ENGINE FAILURES AFTER LIFT-OFF
(a) Initial reaction iime, R (set) (b) Sum of control reversals, NcR
Source Sum of D P Mean 1 Fb Source Sum of D F ~ squares squares squares squares
Cueing systems 2.42 3 0.81 10.19 Cueing systems 173.50 Within cueing 1.66 21 .08 Within cueing 87.03
systems - systems Total 4.08 24 Total 260.53
~
Group mean performance vs trials cueing systems Group mean performance vs trials cueing systems
Trials CSI csv CSM CSM V Trials I CSI csv CSM CSM V
2.32 2.27 2.20 1.61 13.57 5.71 11.oo 2.37 1.73 1.73 1.28 1 1.29 5.57 10.63 2.00 1.58 1.62 1.34 13.57 5.71 9.25 2.22 1.80 1.82 1.58 9.43 5.14 10.75 1.80 1.89 1.99 1.29 14.00 7.14 6.50 2.60 1.67 1.78 1.12 5.29 9.00 5.00 8.00 2.45 1.81 1.69 1.43 7 6.86 9.33 3.OO 9.14 1.59 1.64 2.1 1 1.53 8 4.83 7.40 3.60 7.83
(c) Lift-off point, YLo (m) (d) Integrated roll and yaw activity, PRI (deg)
Source Sum of D P Mean Fb Source Sum of Mean squares squares
Cueing systems 8935.39 3 2978.46 25.46 Cueing systems 75556.38 3 25185.46 19.65 Within cueing 2457.12 21 117.01 Within cueing 269 18.63 21 1281.84
systems - systems _ _ - I
Total 1 1392.51 24 Total 10247 5 .O 1 24 I Group mean performance vs trials cueing systems Group mean performance vs trials cueing systems
Trials CSI csv CSM CSM V Trials CSI csv CSM CSM v 36.62 3.55 3 1.74 3.61 235.46 161.74 109.20 131.71 35.77 3.40 38.20 4.14 293.50 135.20 105.26 75.84 68.99 4.17 20.86 3.80 171.56 249.86 121.76 85.40 28.37 3.04 18.21 3.76 236.53 158.56 128.33 116.29 49.10 4.3 1 43.20 3.41 202.96 217.67 136.85 81.54 44.58 3.55 42.67 1.95 205.37 169.40 122.74 100.38 48.15 2.52 30.44 1.86 248.04 154.92 1 19.74 105.35 18.96 2.39 15.28 2.32 188.63 1 19.07 104.98 83.52
aDF = degrees of freedom. bF is significant with (Y = 0.005
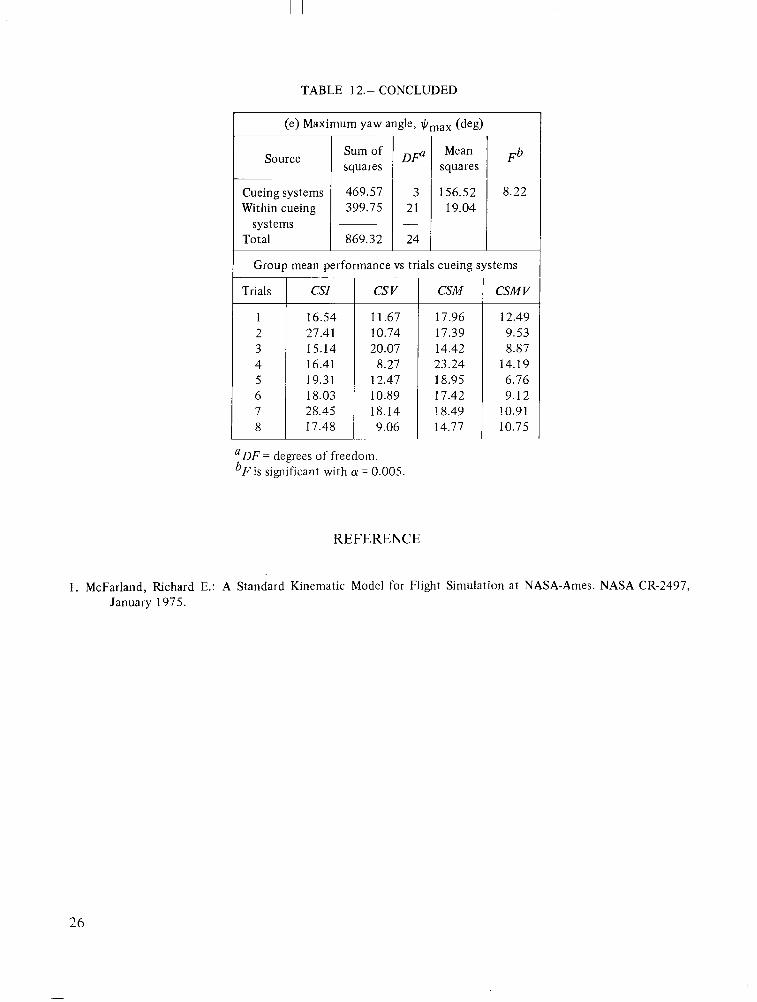
TABLE 12.- CONCLUDED
(e) Maximum yaw angle, (deg)
Source Sum of DFQ Mean Fb squares squares
Cueing systems 469.57 3 156.52 8.22 Within cueing 399.75 21 19.04
systems -Total 869.32 24
Group mean performance vs trials cueing systems
Trials csr csv CSM CSMV
16.54 1 1.67 17.96 12.49 27.41 10.74 17.39 9.53 15.14 20.07 14.42 8.87 16.41 8.27 23.24 14.19 19.31 12.47 18.95 6.76 18.03 10.89 17.42 9.12 28.45 18.14 18.49 10.91 17.48 9.06 14.77 10.75
aDF = degrees of freedom. bF is significant with ct = 0.005.
REFERENCE
1. McFarland, Richard E.: A Standard Kinematic Model for Flight Simulation at NASA-Ames. NASA CR-2497, January 1975.
26
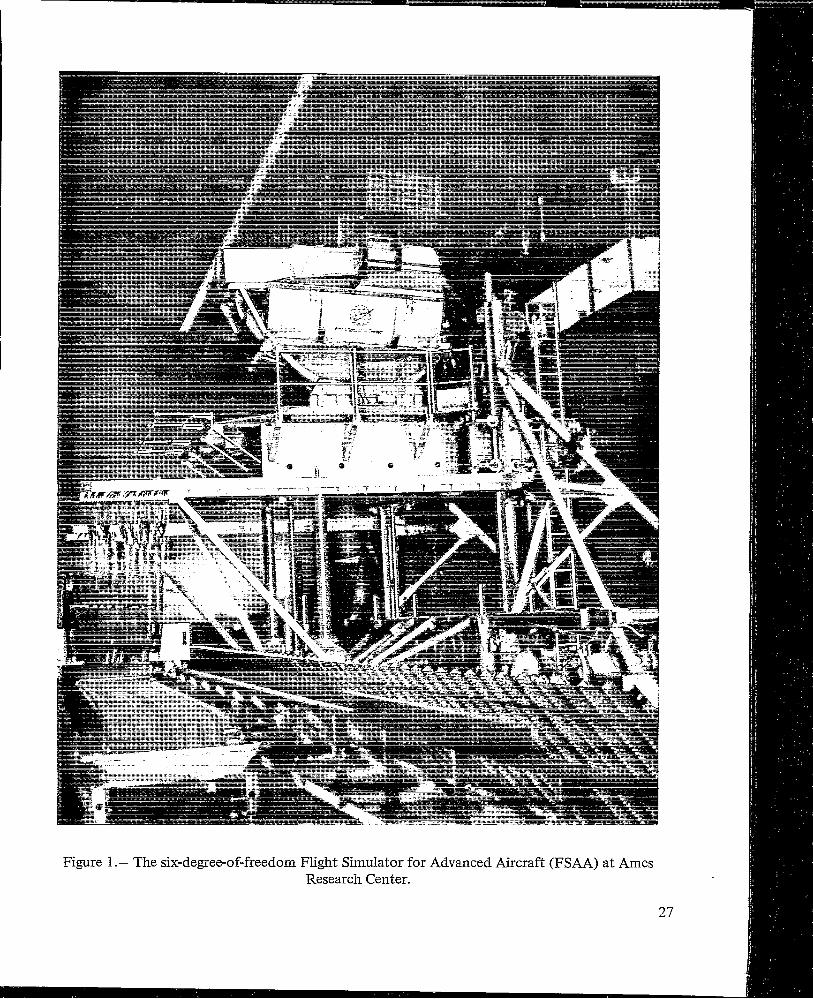
Figure 1 .- The six-degree-of-freedom Flight Simulator for Advanced Aircraft (FSAA) at Ames Research Center.
27
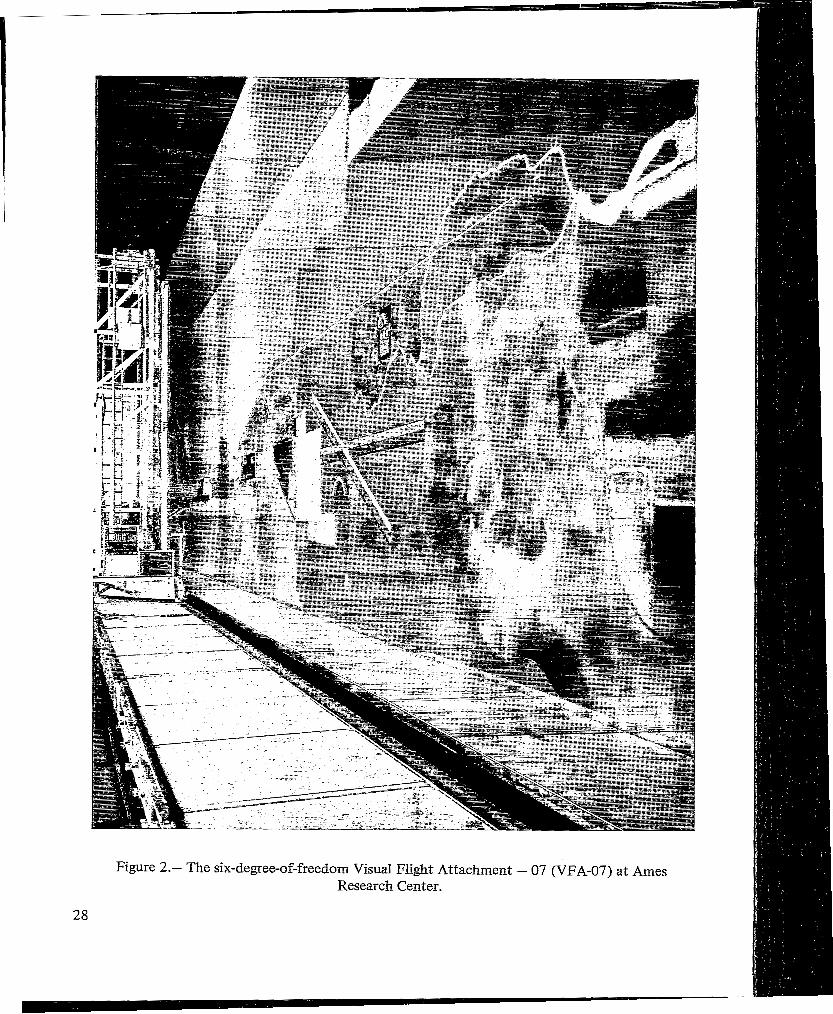
Figure 2.- The six-degree-of-freedom VisuaI Flight Attachment -07 WA-07) at Ames Research Center.
28
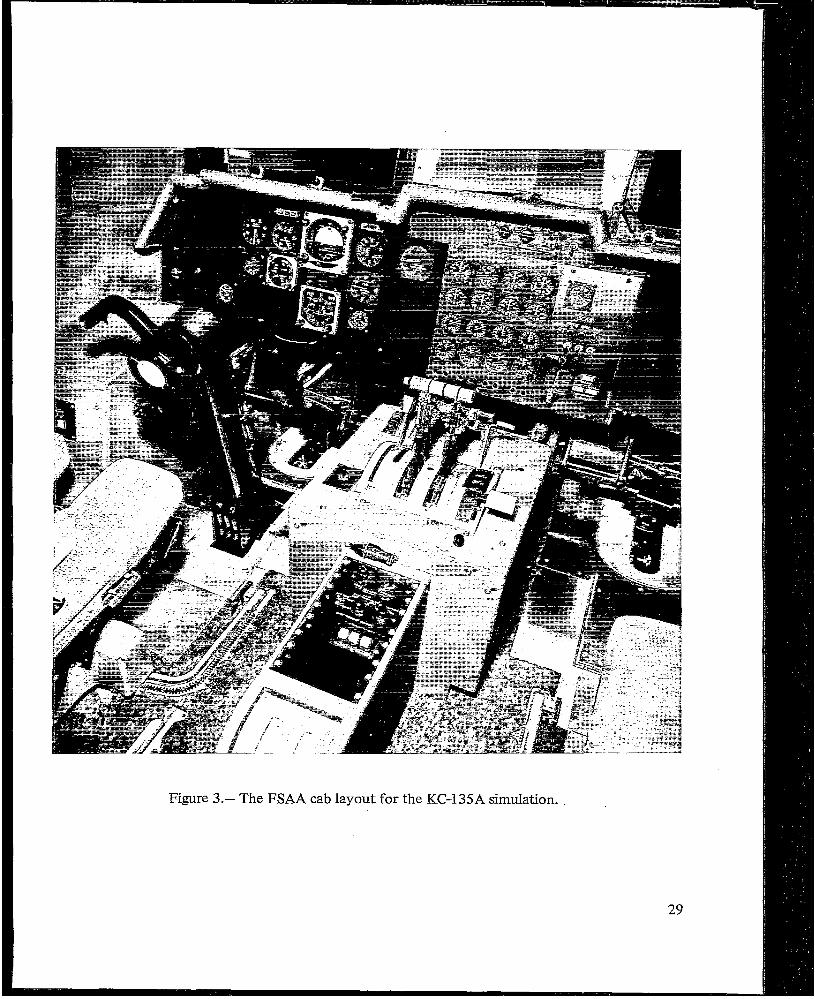
Figure 3.- The FSAA cab layout for the KC-135A simulation.
29
-- I I lllIllllIllIl I II
c3 = CSI A = CSV 3 = CSM
= CSMV u = CSF
-Ia w t-H
Z EH A
-.I I I I I
Figure 4.- Initial reaction time average Phase I1 learning for outboard engine failures prior to lift-off.
30
0 = C S I a = csv + = CSM
= CSMV o = CSF
4
a I . . I I I 1 1
0 2 4 6 8 10 1; RUNS
Figure 5.- Control reversal average Phase I1 learning for outboard engine failures prior to lift-off.
31
I- -
I IIIIIIIIII I
0 = CSI A = CSV + = CSM w = CSMV e = CSF
RUNWAY EDGE (23 m). . 1I I ’ I -. --I
0 2 4 E 8 10 1;R UP4 S
Figure 6.- Lift-off point average Phase I1 learning for outboard engine failures prior to lift-off.
32
0 = C S I A = csv + = CSM* = CSMV v = CSF
I 7 I I I I
2 4 6 8e 19 1;RUNS
Figure 7.- Integrated roll and yaw activity average Phase I1 learning for outboard engine failures prior to lift-off.
33
!llll1l11 IIllIlllIIllllI 1l l l1 l11l l1 I 1 I
rJ = CSI n = csv + = CSM w = CSMV o = CSF
Figure 8.- Maximum yaw angle average Phase I1 learning for outboard engine failures prior to lift-off.
34
0 = CSI A = csv t- = CSM SK. =csr. iv o = CSF
- 1 I Q 2 4 6 8 1 Q 1;
RUNS
Figure 9.- Initial reaction time average Phase I1 learning for outboard engine failures after lift-off.
35
I
IIII I l l I I1 l l1 l l1 l1 Ill I I I I I
0 = CSI 2% = csv + = CSM HC = CSMV e = CSF
7-----I I I 1
0 2 4 G 8 l@ 1;RIJI\]S
Figure 10.- Control reversal average Phase I1 learning for outboard engine failures after lift-off.
36
-- --
0 = CSI J 3 = csv + = CSM ~t = CSMV o = CSF
RUNWAY EDGE (23 m)
‘-----e* I - 1 I 1 I I
0 2 4 G 8 l@ 1; R l lNS
Figure 1 1.- Lift-off point average Phase I1 learning for outboard engine failures after lift-off.
37
- -
0 = CSI A = csv -I- = CSM e = CSMV o = CSF
I .
Q,a Q e
I - -_I-I ----I- - -1
2 u c 8 lr3 1: R iJNS
Figure 12.- Integrated roll and yaw activity average Phase I1 learning for outboard engine failures after lift-off.
38
0 = CSI a = csv + = CSM
= CSMV Q = CSF
0 2 4 E: 8 10 RUNS
Figure 13.- Maximum yaw angle average Phase I1 learning for outboard engine failures after lift-off.
39
0 = CSI A = csu + = CSM* = CSMV
6)
RUNS
Figure 14.- Initial reaction time average Phase I11 learning for outboard engine failures prior to lift-off.
40
0 = C S I A = csv + = CSM w = CSMV
I - - 1 I I I I 0 1 2 3 4 5 6
RUNS
Figure 1 5.- Control reversal average Phase I11 learning for outboard engine failures prior to lift-off.
41
0 = CSI A = CSV + = CSM e = CSMV
0 1 2 3 4 5 6 RUNS
Figure 16.- Lift-off point average Phase I11 learning for outboard engine failures prior to lift-off.
42
0 = CSI a = csv + = CSM e = CSMV
. . I I - 1 I . I I
0 1 2 3 4 5 6 RUNS
Figure 17.- Integrated roll and yaw activity average Phase I11 learning for outboard engine failures prior to lift-off.
43
0 = CSI A = csv + , = CSM e = CSMV
~ - . ,. - - I II I -.
Q 1 2 3 4 5 6 RUNS
Figure 18.- Maximum yaw angle average Phase I11 learning for outboard engine failures prior to lift-off.
44
I . I - I ' 1 - I I
0 1 2 3 4 5 6 RUNS
Figure 19.- Initial reaction time average Phase I11 leaming for outboard engine failures after lift-off.
45
0 = CSI A. = csv -i- = CSM wc = CSMV'
0 1 2 3 4 5 8 RUNS
' Figure 20.- Control reversal average Phase 111 learning for outboard engine failures after lift-off.
46
0 = CSI A = csv -t = CSM e = CSMV
0 1 2 3 4 5 c RU/\I S
Figure 21.- Lift-point average Phase I11 learning for outboard engine failures after lift-off.
47
0 = CSI A = cs\/+- = CSM w = CSMV
0 1 3 Y 5 E; RUNS
Figure 22.- Integrated roll and yaw activity average Phase I11 learning for outboard engine failures after lift-off.
48
0 = CSI a = csv 5 = CSM
= CSMV
... - 1 . - ' I I r I I
0 1 2 3 Lc 5 6 RUNS
Figure 23.- Maximum yaw angle average Phase I11 learning for outboard engine failures after lift-off.
49
I
0
+
0
3-
Figure 24.- Initial reaction time average group performance during Phase I1 for outboard engine failures prior to lift-off.
50
0 = R7v a = RVt.5SD + 2 RV-.SSD
a
a
0
n
4
0
a +
0 +
t
Figure 25.- Control reversal average group performance during Phase I1 for outboard engine failures prior to lift-off.
51
-----------
0 = !=w P = FIV+.5SD -t = W- .5SD
A
0
+ +
RUNWAY EDGE
a---(23 m) 4% A 0 (3 0+ + +
7---I 1 - 7 cs I csv CSM CSMV CSF
CUEING SYST*EPl
Figure 26.- Lift-off point average group performance during Phase I1 for outboard engine failures prior to lift-off.
52
0 = RV A = QV+.SSD+ = RV-.5SD
0
a
0 + A A a
0 01
0
3. ++
.-.
1 I I 1 7 cs I CSV CSM cSMv CSF
CUE1 NG SYSTEM
Figure 27.- Integrated roll and yaw activity average group performance during Phase I1 for outboard engine failures prior to lift-off.
53
-------
d = RV a = QVt.5SD + = QV-.5SD
a
a a
0
+ A
0
3
a
Q
-I-
+
I I I 1 cs I c5‘q; csrj Csriv CSF
CUES NG SYSTEM
Figure 28.- Maximum yaw angle average group performance during Phase 11 for outboard engine failures prior to lift-off.
54
- -
0 = RV a = FIV+.SSQ + = FIV-.SSD
a
a 0
a
c\
+ + a
Q
+ 0
+
. ._~ _ _T I 1 I I csI CSV CSM CSM'V' CSF
CUEING SYSTEM
Figure 29.- Initial reaction time average group performance during Phase I1 for outboard engine failures after lift-off.
55
0 = nv P = RV+.5SD + = RV-.SSD
A
0
3
A
0
3
a
0
+
A L?.
0 0
44
{ I - I cs I csv CSM CSMV 7 CSF
CUE IN G SYSTEM
Figure 30.- Control reversal average group performance during Phase I1 for outboard engine failures after lift-off.
56
0 = RV P = RV+.5SD -t = QU-.5SD
A
+
!$ + 8 I I . ----r
cs I CS'V CSM CSMV CSF
CUEING SYSTEM
Figure 3 1.- Lift-off point average group performance during Phase I1 for outboard engine failures after lift-off.
57
Q = Rv A = RVt.5SD + = RV-.5SD
.
+ A
0
I
n
0
+
Figure 32.- Integrated roll and yaw activity average group performance during Phase I1 for outboard engine failures after lift-off.
58
--
0 = RV A = RV+.5SD + = RV-.5SD
a
0 n
0
A
0
3 A
0
-I
a
+
.~I i.- I
cs I csv CSM CSMV CSF CUEING SYSTEM
Figure 33.- Maximum yaw angle average group performance during Phase I1 for outboard engine failures after lift-off.
59
n 0 A
0 Q
0 -t 4-
+
0 = QV P = RV+.SSD + = F-IV-.5SD
n
0
+
I cs I csv CSM CSMV
T R F l I N l N G GROUP
Figure 34.- Initial reaction time average group performance during Phase I11 for outboard engine failures prior to lift-off.
60
n
n 0
c3 -t
-I-
I I cs I CSV T R F i I N l N G
0 = RV w = QVI .5SD -t = FIV-.5SD
A
A
0
0
3. +
Ycsrl CSMV GROUP
Figure 35.- Control reversal average group performance during Phase I11 for outboard engine failures prior to lift-off.
61
+ 0+ + +
I I 1 - 1 cs I csv CSM csr4v
TRFI IN ING GROUP
Figure 36.- Lift-off point average group performance during Phase I11 for outboard engine failures prior to lift-off.
62
0 = RV A = FIV+.5SD + = W - . 5 S D
A
A0
0a
0 + + +
t3
0 3
__ I I I 1
cs I csv CSM CSMV
T R F l I N l N G GROUP
Figure 37.- Integrated roll and yaw activity average group performance during Phase I11 for outboard engine failures prior to lift-off.
63
A
0
-t
P
0
+ A
0
+
II=I . . . - 1 cs I csv CSPI csiw TRRINING GROUP
Figure 38.- Maximum yaw angle average group performance during Phase I11 for outboard engine failures prior to lift-off.
64
0 = nv A = RV+.SSD -t = RV-.SSD
0 A
a A
0 0
0 0
+ ++ +
I ' I I I cs I csv csri CSI'IV
TRFl lNlNG GROUP
Figure 39.- dnitial reaction time average group performance during Phase 111 for outboard engine failures after lift-off.
65
0 = nv A = RV+.5SD + = FIV-.SSD
a
A
a
-t 3
I 1 - ' I . i csI CSV CSM CSMV
TRFl IN lNG GROUP
Figure 40.- Control reversal average group performance during Phase I11 for outboard engine failures after lift-off.
66
@ - ~ Q e,I--. 7-1 - 7
cs I csv CSM CSMV
TRQINING GROUP
Figure 41.- Lift-off point average group performance during Phase I11 for outboard engine failures after lift-off.
67
0 = FIV P = 17V+.5SD I- = W-.5SD
a A
0
+
a
0
-t.
I I I - -1 cs I csv CSM CSMV
TRRINJNG GROUP
Figure 42.- Integrated roll and yaw activity average group performance during Phase 111 for outboard engine failures after lift-off.
68
Q = nv P = RV+.5SD -t = RV-.SSD
A
0
+
P
0
+
A
a
0
Q
-k 4-
I'-I cs I csv CSM CSMV
T R R I N I N G GROUP
Figure 43.- Maximum yaw angle average group performance during Phase I11 for outboard engine failures after lift-off.
69
I I I II II I I 11111 IIII I I I I II III1111111 I I II I I .I I I --...--..,.-. .-.lr_. I
0 = PHRSE I I MEFlN I T R R l N l N G l A = PHRSE I I I MERN CEVRLURTION)
A 0A
n
Figure 44.- Comparison of Phase I1 and Phase I11 mean initial reaction time for outboard engine failures prior to lift-off.
70
k
0
I cs I
o = PHF3SE 11 MEQPJ CTRQINING) 0 = PHQSE I I I MEQN CEVDLUGITION)
a
1 I I
Figure 45.- Comparison of Phase I1 and Phase 111 mean control reversals for outboard engine failures prior to lift-off.
71
0 = PHQSE I 1 MEQN CTRFIINING) P = PHRSE I 1 1 MEW (EVCILUQTIONI
0
Figure 46.- Comparison of Phase I1 and Phase I11 mean lift-off point for outboard engine failures prior to lift-off.
72
- - -
o = PHQSE I 1 MEQN (TRFIINING) n = PHQSE I 1 I MEQN CEVFILUQTION)
0
a
A
0
- I- I . I -7
cs I csv CSPI CSMV TRFlIb11 NG GROUP
Figure 47.- Comparison of Phase I1 and Phase I11 mean integrated roll and yaw activity for outboard engine failures prior to lift-off.
73
0 z PHQSE I 1 MEQN (TRRINING) A = PHQSE 111 MEQN CEVRLUQTIONI
P a 0
a
I I I 1 csI csv CSM CSMV
T R R I N I N G GROUP
Figure 48.- Comparison of Phase I1 and Phase I11 mean maximum yaw angle for outboard engine failures prior to lift-off.
74
o = PHQSE I I MEQN CTRQINING3 n = PHQSE I 1 1 MEQN CEVRLURTIONI
(3
a Ata
- - I - 1 cs I csv CSM csriv
T R Q I N I N G GROUP
Figure 49.- Comparison of Phase I1 and Phase I11 mean initial reaction time for outboard engine failures after lift-off.
75
Q = PHRSE I I MEQN ~ T R i 2 I N I N G l A = PHQSE I I I MEFlN IEVFlLURTION3
a
n
0
n �2
Figure 50.- Comparison of Phase I1 and Phase I11 mean control reversals for outboard engine failures after lift-off.
76
o = PHFISE I I PIEFIN CTRR ININGl A = PHRSE I11 MERN IE?RLUQTIONj
Q
: L csI csv CSM CSPIV
TRR I NING GROUP
Figure 51.- Comparison of Phase �1and Phase III mean Lift-off point for outboard en+&ne failures after lift-off.
77
0 PHRSE I 1 PlERN ( T R Q I N T N G 3 A = PHOSE 111 MEQN CEVRLUQTIONI
0
n n CJa
A
cs I CS'V' CSM CSM'v
TRR IN ING GROUP
Figure 52.- Comparison of Phase 11 and Phase I11 mean integrated roll and yaw activity for outboard engine failures after lift-off.
78
0 = P H R S E I I MEFIN (TRlr l INING3 A = P H R S E I I I MERN CEVRLIJQTIONI
0
0
LI a A
A
. I 1 - I I u s I csv CSM CSMV
TRRINING GROUP
Figure 53.- Comparison of Phase I1 and Phase I11 mean maximum yaw angle for outboard engine failures after lift-off.
79
- Ill I
1. Report No. 2. Gov&ment Accession No. 3. Recipient's Catalog No.
NASA TP -1365 ~-
I 4. Title and Subtitle 5. Rewrt Date
EFFECTS OF VISUAL AND MOTION SIMULATION December 1978~~~~~
CUEING SYSTEMS ON PILOT PERFORMANCE DURING 6. Performing Organization Code
WITH ENGINE.-~FAILURES.-.
7. Author(s) 8. Performing Organization Report No.
I Benton L. Parris and Anthony M. Cook A-7352 _ - 10. Work Unit No.
9. Performing Organization Name and Address 505-0941 NASA Ames Research Center 11. Contract or Grant No. Moffett Field, Calif. 94035
- . .. - - 13. Type of Report and Period Covered 12. Sponsoring Agency Name and Address Technical Paper
National Aeronautics and Space Administration 14. Sponsoring Agency Code
- -_Washington, D.C. 20546 -~ ... . ~ .. 15. Supplementary NotesI-
~ __ ~~- .-._ - 16. Abstract
Data are presented that show the effects of visual and motion cueing on pilot performance during takeoffs with engine failures. Four groups of USAF pilots flew a simulated KC-135 using four different cueing systems. The most basic of these systems was of the instrument-only type. Visual scene simulation and/or motion simulation was added to produce the other systems. Learning curves, mean performance, and subjective data are examined. These data show that the addition of visual cueing results in significant improvement in pilot performance, but the combined use of visual and motion cueing results in far better performance.
-17. Key Words (Suggested by Authorb) 1 18. Distribution Statement
Motion and visual cue evaluation Unlimited Engine out takeoffs I Ground based simulation Flight simulation STAR Category - 05
I . _
Classif. (of this page) ~ 1 21. NO*; Pages 22. Price.
Unclassified Unclassified 1 -
$5.00 -_- -~
'For sale by the National Technical Information Service, Springfield, Virginia 22161 NASA-Langl ey, 1978
11-.11111 II 111 111 1.111.11 II I III111111 I I I I I I I l l
National Aeronautics and THIRD-CLASS BULK RATE Postage and Fees Paid National Aeronautics and
Space Administration Space Administration NASA451
Washington, D.C. 20546 Official Business
Penalty for Private Use, $300
i 1 1 9 u , 4 , 9201 78 S009Q3DS ~ DEPT OF THE A I R FORCE
AP VEXPOWS L E B O R A T O R Y ATTN: TECHNICAL L I B S A P Y (SUL) K I R T Z A N D A P B ~ f ia7117
1 I
POSTMASTER: If Undeliverable (Section 158 Postal Manual) Do Not Return
I 'I I l l l l l I1