Embed Size (px)
Citation preview

DOT/FAA/AR-03/53
Office of Aviation Research Washington, D.C. 20591
Effects of Surface Preparation on the Long-Term Durability of Adhesively Bonded Composite Joints January 2004 Final Report This document is available to the U.S. public through the National Technical Information Service (NTIS), Springfield, Virginia 22161.
U.S. Department of Transportation Federal Aviation Administration

NOTICE
This document is disseminated under the sponsorship of the U.S. Department of Transportation in the interest of information exchange. The United States Government assumes no liability for the contents or use thereof. The United States Government does not endorse products or manufacturers. Trade or manufacturer's names appear herein solely because they are considered essential to the objective of this report. This document does not constitute FAA certification policy. Consult your local FAA aircraft certification office as to its use. This report is available at the Federal Aviation Administration William J. Hughes Technical Center's Full-Text Technical Reports page: actlibrary.tc.faa.gov in Adobe Acrobat portable document format (PDF).

Technical Report Documentation Page 1. Report No.
DOT/FAA/AR-03/53
2. Government Accession No. 3. Recipient's Catalog No.
4. Title and Subtitle EFFECTS OF SURFACE PREPARATION ON THE LONG-TERM DURABILITY
5. Report Date January 2004
OF ADHESIVELY BONDED COMPOSITE JOINTS 6. Performing Organization Code
7. Author(s) Jason Bardis and Keith Kedward
8. Performing Organization Report No.
9. Performing Organization Name and Address Department of Mechanical & Environmental Engineering
10. Work Unit No. (TRAIS)
University of California Santa Barbara Santa Barbara, CA 93106
11. Contract or Grant No.
12. Sponsoring Agency Name and Address U.S. Department of Transportation Federal Aviation Administration
13. Type of Report and Period Covered Final Report
Office of Aviation Research Washington, DC 20591
14. Sponsoring Agency Code
ANM-120 15. Supplementary Notes The FAA William J. Hughes Technical Center Technical Monitor was Curtis Davies. 16. Abstract
The long-term durability of adhesively bonded composite joints is critical to modern aircraft structures, which are increasingly using bonding as an alternative to mechanical fastening. The effects of surface preparation for the adherends are critical to initial strength, long-term durability, fracture toughness, and failure modes of bonded joints. In this study, several potential factors are evaluated, with focus on the following: 1. Effects of possible chemical contamination from release fabrics, release films, and peel plies during adherend cure. 2. Chemical and mechanical effects of abrasion on the fracture toughness and failure mode. 3. Characterization of paste and film adhesives using mechanical test methods. There are several standard test methods to evaluate specimen fracture, but the majority concentrate on bonded metals and interlaminar composite fracture. Testing is concentrated on mode I tests. A custom double cantilever beam specimen was devised and used, and two forms of a wedge crack test (traveling and static) were also used. Additionally, mode II single lap shear tests were run to compare to the mode I tests. Nondestructive testing included X-ray photography of crack fronts, energy dispersive spectroscopy and X-ray photoelectron spectroscopy surface chemistry analyses, and scanning electron microscope imaging of prepared surfaces. All mode I test methods tended to be in agreement in the ranking of different surface preparation methods. Test results showed that release agents deposited on adherend surfaces during their cure cycle prevented proper adhesion. While mechanical abrasion did improve their fracture toughness and lower their contamination greatly, the test values did not reach the levels of samples that were not contaminated before bonding; therefore, the interfacial modes of failure did not always change to desirable modes. 17. Key Words Bonded joint durability, Bonded joint surface preparation, Mode I fracture tests
18. Distribution Statement This document is available to the public through the National Technical Information Service (NTIS), Springfield, Virginia 22161.
19. Security Classif. (of this report) Unclassified
20. Security Classif. (of this page) Unclassified
21. No. of Pages 91
22. Price
Form DOT F1700.7 (8-72) Reproduction of completed page authorized

TABLE OF CONTENTS
Page
EXECUTIVE SUMMARY ix 1. INTRODUCTION 1-1
2. LITERATURE REVIEW 2-1
2.1 Introduction 2-1 2.2 Surface Preparation 2-1
2.2.1 General Issues 2-2 2.2.2 Composite Adherends 2-3
3. SURFACE PREPARATION AND CHARACTERIZATION 3-1
3.1 Introduction 3-1 3.2 Chemistry 3-1 3.3 Abrasion 3-5
3.3.1 Grit Blasting 3-5 3.3.2 Hand Sanding 3-8 3.3.3 Abrasive Pad Scrubbing 3-10 3.3.4 Peel Ply Removal 3-10
3.4 Quantification and Evaluation of Surface Preparation Effects 3-11 3.5 Processing and Manufacturing 3-15
4. EVALUATION OF FRACTURE MECHANICS-BASED TEST METHODS 4-1
4.1 Introduction 4-1 4.2 Fracture Tests Comparison to Shear Strength Tests 4-1 4.3 ASTM Standards vs Custom Tests 4-2 4.4 Floating Roller Peel 4-3 4.5 Double Cantilever Beam 4-4
4.5.1 Consideration of Adhesive Layer in Analyses 4-6 4.5.2 The Area Method 4-7 4.5.3 The Modified Beam Theory Method 4-9 4.5.4 The Compliance Method 4-11 4.5.5 The Load Method 4-11
4.6 Traveling Wedge 4-12 4.7 Static Wedge 4-15
iii

4.7.1 Quality Control 4-15 4.7.2 Qualitative Comparison 4-16 4.7.3 Analysis 4-16
4.8 Crack Front X-Ray Photography 4-17 4.9 Summary 4-18
5. RESULTS AND DISCUSSIONS 5-1
5.1 Introduction 5-1 5.2 Paste Adhesive Tests 5-1
5.2.1 Floating Roller Peel Test Results 5-1 5.2.2 Double Cantilever Beam Test Results 5-2 5.2.3 Traveling Wedge Test Results 5-4
5.3 Film Adhesive Tests 5-6
5.3.1 Floating Roller Peel Test Results 5-6 5.3.2 Traveling Wedge Test Results 5-6 5.3.3 Static Wedge Test Results 5-10 5.3.4 Single Lap Shear Test Results 5-15
5.4 Scanning Electron Microscopy 5-16 5.5 Energy-Dispersive Spectroscopy 5-20 5.6 X-Ray Photoelectron Spectroscopy 5-21 5.7 Summary 5-25
6. CONCLUSIONS 6-1
7. PROPOSED FUTURE WORK 7-1
8. REFERENCES 8-1
9. ADDITIONAL INFORMATION 9-1
iv

LIST OF FIGURES
Figure Page 3-1 Polar Water Molecules Arranging Themselves 3-2
3-2 Chemical Reaction Describing Hardening of Epoxy Adhesive 3-3
3-3 Contact Angle Between Adherend and Drop of Water in the Water Break Test 3-15
4-1 Single Lap Shear Test Method Setup 4-2
4-2 Floating Roller Peel Test Method Setup 4-4
4-3 Double Cantilever Beam Test Method Setup 4-4
4-4 Double Cantilever Beam GIc vs Crack Length With and Without Adhesive Layer 4-7
4-5 Load-Displacement Plot From a Typical Loading/Unloading DCB Test 4-8
4-6 Typical Compliance1/3 vs Crack Length Plot to Find Crack Offset for MBT Method 4-10
4-7 Traveling Wedge Test Method Setup 4-12
4-8 Wedge Passing Over Fracture Surface Contours, Changing its Effective Thickness 4-13
4-9 Static Wedge Test Method Setup 4-15
4-10 X-Ray Photographs of Crack Fronts 4-17
5-1 Floating Roller Test Configurations 5-1
5-2 Sample Load-Displacement Plots From Paste Adhesive DCB Tests 5-2
5-3 Fracture Surface Scans From Paste Adhesive DCB Tests 5-3
5-4 GIc Values From Paste Adhesive DCB Tests 5-4
5-5 Sample Load-Displacement Plots From Paste Adhesive DCB vs Traveling Wedge Tests 5-5
5-6 GIc Values From Paste Adhesive Traveling Wedge vs DCB Tests 5-6
5-7 Sample Load-Displacement Plots From Film Adhesive Traveling Wedge Tests 5-7
5-8 Fracture Surface Scans From Traveling Wedge Tests 5-9
v

5-9 GIc Values From Film Adhesive Traveling Wedge Tests 5-10
5-10 Static Wedge Test Crack Growth in pH 7.3 Room-Temperature, Deionized Water 5-10
5-11 Static Wedge Test Crack Growth in pH 2.9 Room-Temperature, Deionized Water 5-12
5-12 Static Wedge Test Crack Growth in pH 11.7 Room-Temperature, Deionized Water 5-14
5-13 Shear Strengths of Film Adhesive-Bonded Single Lap Specimens 5-15
5-14 Scanning Electron Microscopy Images of Surfaces Cured Against FEP Release Film 5-17
5-15 Scanning Electron Microscopy Images of Surfaces Cured Against FEP Release Film and Blasted 5-17
5-16 Scanning Electron Microscopy Images of Surfaces Cured Against NAT Peel Ply 5-17
5-17 Scanning Electron Microscopy Images of Surfaces Cured Against NAT Peel Ply and Blasted 5-18
5-18 Scanning Electron Microscopy Images of Surfaces Cured Against SRB Release Fabric 5-18
5-19 Scanning Electron Microscopy Images of Surfaces Cured Against SRB Release Fabric and Blasted 5-18
5-20 Scanning Electron Microscopy Images of Surfaces Cured Against VLP Peel Ply 5-19
5-21 Scanning Electron Microscopy Images of Surfaces Cured Against VLP Peel Ply and Blasted 5-19
5-22 Scanning Electron Microscopy Images of Interlaminar Fracture Surfaces 5-20
5-23 Energy-Dispersive Spectroscopy Surface Chemistry Plots 5-20
5-24 X-Ray Photoelectron Spectroscopy Plots for Blasted and Nonblasted Surfaces Cured Against FEP Release Film 5-21
5-25 X-Ray Photoelectron Spectroscopy Plots for Blasted and Nonblasted Surfaces Cured Against NAT Peel Ply 5-22
5-26 X-Ray Photoelectron Spectroscopy Plots for Blasted and Nonblasted Surfaces Cured Against SRB Release Fabric 5-23
vi

5-27 X-Ray Photoelectron Spectroscopy Plots for Blasted and Nonblasted Surfaces Cured Against VLP Peel Ply 5-24
5-28 X-Ray Photoelectron Spectroscopy Chemical Plots of Interlaminar Surfaces 5-24
5-29 X-Ray Photoelectron Spectroscopy Chemical Concentrations of All Nine Samples 5-25
LIST OF TABLES
Table Page 1-1 Potential Bonding Durability Factors 1-2
3-1 Ranking of Strengths of Different Types of Molecular Bonds 3-3
4-1 Mode I ASTM Bonded Joint Tests Not Used in This Study 4-3
4-2 Tensile and Shear ASTM Bonded Joint Tests Not Used in This Study 4-3
4-3 Double Cantilever Beam Area vs MBT Critical Strain Energy Release Rate Test Results, Paste Adhesive 4-11
4-4 Summary of Test Methods 4-19
vii/viii

EXECUTIVE SUMMARY
The long-term durability of adhesively bonded composite joints is critical to modern aircraft structures, which are increasingly using bonding as an alternative to mechanical fastening. The effects of surface preparation for the adherends are critical to initial strength, long-term durability, fracture toughness, and failure modes of bonded joints. In this study, several potential factors are evaluated, with focus on the following: 1. Effects of possible chemical contamination from release fabrics, release films, and peel
plies during adherend cure.
2. Chemical and mechanical effects of abrasion on the fracture toughness and failure mode.
3. Characterization of paste and film adhesives using mechanical test methods. There are several standard test methods to evaluate specimen fracture, but the majority concentrate on bonded metals and interlaminar composite fracture. Testing is concentrated on mode I tests; a custom double cantilever beam specimen was devised and used, and two forms of a wedge crack test (traveling and static) were also used. Additionally, mode II single lap shear tests were run to compare to the mode I tests. Nondestructive testing included X-ray photography of crack fronts, energy-dispersive spectroscopy and X-ray photoelectron spectroscopy surface chemistry analyses, and scanning electron microscope imaging of prepared surfaces. All mode I test methods tended to be in agreement in the ranking of different surface preparation methods. Test results showed that release agents deposited on adherend surfaces during their cure cycle prevented proper adhesion. While mechanical abrasion did improve their fracture toughness and lower their contamination greatly, the test values did not reach the levels of samples that were not contaminated before bonding; therefore, the interfacial modes of failure did not always change to desirable modes.
ix/x

1. INTRODUCTION.
The general aviation (GA) industry tends to rely extensively on bonded joints, although lower loads are typically found in smaller aircraft. To a lesser extent, commercial transport rotorcraft and military aircraft industries also rely on bonding for structural components. Advantages of bonding over mechanical means of fastening include higher stiffness, more uniform load distribution, cleaner aerodynamic lines, part consolidation, no holes in adherends (with stress concentrations and reduced load-bearing area), and less labor. Adherend surface preparation is critical to structural integrity of bonded joints. Inadequate surface roughening, environmental effects, possible peel ply/release fabric/release film chemical contamination, and other mechanical and chemical factors can prevent adhesives from bonding properly to composites, resulting in interfacial failures [1]. These failures can occur at loads well below those of properly bonded joints that fail cohesively. Other interfacial failures occur over time in service as joints are exposed to harsh environments, including elevated temperature and humidity [2-12]. Mechanical, chemical, and applied research discussed in this work can provide greater insight and extensive data to support increased application and confidence in bonded structures. Many possible factors that could affect an adhesive bond’s durability were considered for evaluation (table 1-1). After reviewing these factors with composites and bonding experts in academia and industry, it was decided to focus on the effects of peel plies, release films, release fabrics, grit blasting, and environmental exposure, which not only have significant mechanical and chemical effects on bond integrity but are relevant to aviation manufacturing processes. Factors that were studied are indicated by bold type in table 1-1. A common practice currently adopted in the GA industry for structural development is the reliance on full-scale structural test articles. This approach can limit the ability to evaluate the adequacy of critical small-scale structural details such as bonded joints. However, by implementing a tailored version of the building block test/analysis/fabrication philosophy that supports effective integrated product development and is used widely in the military and commercial transport aircraft community, valuable and key information can be obtained on bonded joint characteristics. It is suggested that such approaches could complement full-scale test information, providing the industry with insight that would aide in the design, manufacture, and certification of reliable bonded structures. There are few standard methods for testing bonded composite joints. Test methods address bonded metal or composite interlaminar failure. Therefore, the American Society of Testing and Materials (ASTM) standard test methods need to be adapted to test these joints. Analytical models of these modified test methods need to be performed to tailor specimen configurations to ensure proper test performance. Because adhesive bonding is particularly sensitive to materials and processes, those used in this bonding study must be typical of the ones used in aircraft fabrication to ensure relevance. Results can then be used to study the relative importance of each factor’s contribution to bond strength and durability. These results can be used to provide manufacturers with bonding guidance and to assist the FAA with certification procedures.
1-1

TABLE 1-1. POTENTIAL BONDING DURABILITY FACTORS
Factor Variables Adherend lay-up 0°[n], quasi-isotropic, other; orientation of ply on bonding
surface Adherend material Fiber and matrix materials, composite vs metal, typical
aviation materials Adhesive material Paste adhesive, film adhesive Adhesive filler material Type of filler, percentage of filler Adhesive preparation Hand- or machine-mixed two-part epoxy, vacuum application
to remove trapped air during mixing, storage temperature/humidity, film adhesive carrier mat
Bondline thickness control Glass microbeads/silane treatment, wires, tabs/tape, applied pressure, film adhesive carrier mat
Compressed air blowing Pressure, gas used, bottled gas vs compressor, blow time Environmental exposure Temperature, humidity, exposure time, prebond, postbond,
under load, adherend/adhesive, acidic/basic environment Grit blasting Pressure, grit size, grit media, number of passes, speed of
passes, recirculating/nonrecirculating media, vacuum exhaust in blast cabinet
Hand sanding Grit size, grit type, number of passes, wet/dry sanding, pressure applied, hand or sanding block application
Peel ply, release fabric, release film
Nylon/polyester/FEP/PTFE, release coated/calendered/scoured and heat-set
Solvent wiping Acetone/isopropyl alcohol, number of wipes, type of cloth used
As implied by table 1-1, the chief thrust of this research is to study the bonding manufacturing processes of the aircraft industry. The emphasis of bonding research must tend toward an industrial, experimental, processing science approach in addition to solely mechanics theory or analysis. Therefore, the work herein is an attempt to marry the practical requirements of a manufacturing production line and the intellectual pursuits of academia.
1-2

2. LITERATURE REVIEW.
This section discusses the literature relevant to this research. The following sections are grouped by topic. The references that cover multiple subjects may be cited in more than one section. 2.1 INTRODUCTION.
Adhesive bonding dates back to the dawn of aviation and far beyond, to ancient times [13]. While early aircraft were made of wood, the majority of modern planes have been primarily metal. As a result, to take full advantage of the benefits of bonding over mechanical fastening, there has been considerable research in bonding aluminum over the past several decades. This has included much work in anodizing, etching, and other surface preparation methods for metals, culminating in the Primary Adhesively Bonded Structure Technology (PABST) in the 1970s [14 and 15]. Only more recently has bonding of fiber-reinforced polymer composite materials become the focus of research. The contents of this literature review include the older, traditional materials, surface preparations, test methods, and analyses, but in combination with information on composite materials. Because of the laminated nature of most composite materials (which is often their weakness), much of the studies on them deal with interlaminar fracture and strength, not bonding of cured adherends. Therefore, it was necessary to draw upon both groups of literature to combine them for this study. Some aspects of preparing, bonding, and testing isotropic metals transition easily to anisotropic- reinforced polymers, while others do not. Surface preparation methods are largely different, while the test methods are similar. For both of these adherends, because structural adhesive bonds are generally loaded in shear, lap joints have been the traditional method of testing bonds. When recent research efforts were done, it was determined that mode I cleavage or peel tests could provide more sensitive feedback to refine bonding processes. 2.2 SURFACE PREPARATION.
The surface preparation of a bonded joint is key to its strength and long-term durability. The process of preparing and bonding adherends must be tested and controlled to ensure consistently good bonds [1, 6, 9, 10, 15-20]. A successful bond hinges upon strong primary chemical bonds between the adhesive and adherends, and to a much lesser extent, upon mechanical issues like surface area and mechanical interlocking achieved from adhesive penetrating into adherend cavities. Therefore, extensive research has been performed on various surface preparation methods to optimize the process. Usually this involves abrasion or some other means of removing the outer, chemically inert layer of the adherend. Feedback for different preparations comes from destructive testing. Because aircraft engineers have dealt primarily with metallic structures, much of the literature covers the preparation of aluminum adherends, encompassing various surface preparations such as anodization, etching, cleaning, and priming.
2-1

2.2.1 General Issues.
Several authors approached the problem of preparing metal adherends from a managerial or production standpoint. Lincoln, et al. describes issues that must be dealt with in a production environment to certify bonded joints for aircraft [20]. Issues discussed include the concern over a lack of standardization and documented certification procedures on bonding production lines. One of their main motivating factors was the patching, reinforcing, and repair of metallic structures, as well as overcoming disbonding from environmental exposure. Because the use of composite materials for repairs can result in a 70% cost savings over metallic repairs, this report deals with composite-composite, composite-metal, and metal-metal bond situations, all of which have similar processing issues. Some of these general concerns for any bonds include: • Nondestructive testing (NDT) cannot identify bonds that will be prone to environmental
degradation. This technology is not likely to improve in the near future, though NDT of prebond surfaces to determine their suitability for bonding will make progress.
• The growth of bond defects and the process of environmental degradation are not
analytically predictable. Environmental degradation is not entirely quantifiable through accelerated aging tests (including lap shear and fatigue tests), though the ASTM D 3762 static wedge test (section 4.7) does identify a bonding process’s expected service durability. Not more than 10% of a wedge test specimen’s fracture surface may be an interfacial failure for the bonding process to pass.
• Separate test (witness) coupons, pieces bonded along with production parts so that they
can be tested destructively to assess the bonding process for that batch, should be used. The authors identified that the bonding process must be controlled, in agreement with other researchers [18]. Lincoln, et al. [20] broke down the process into five requirements that must be met to ensure good bonding: • Stabilized materials and processes (reproducibility, proper combinations of materials and
processes, development of documentation and instructions).
• The ability to produce good results (proper training and feedback, consistency).
• The ability to characterize mechanical properties.
• Structural performance assessment, including analysis and a range of tests from coupons to full-scale.
• The ability to inspect bonding in the manufacturing facility and in service. In light of these organizational issues, the authors acknowledge that prebond surface preparation is the most important factor in bonded joints, with moisture attack being the main culprit of service disbonds.
2-2

Caldwell discusses similar issues in his bond lab certification program on tensile testing of bonded steel adherends [16]. Caldwell monitored the tensile strength of butt joints over 6 years and investigated significant changes in test results to provide feedback on technician training and process parameters. They deduced that one of the most significant factors that affected bond strength was the variation in the adhesive materials itself. The raw material affects results even more than differences between technicians. Other issues that affected performance and needed proper monitoring and managing included the following: • The temperature at which the adhesive is stored caused test result variation. • Seasonal temperature and humidity changes affected results. • Grit blasters needed filtered air and clean media, leading to dedicated blasters. • Technicians needed monthly certification to ensure proper training. The work of Hart-Smith, et al. discusses general fabrication principles. The authors note that despite a greater initial cost, the long-term cost of researching bonding processes is less than that of inspection and repair programs. Even with inspection programs in place, nondestructive tests like ultrasound do not detect poor bonds unless there are gaps in the joint [19]. Hart-Smith and Davis discuss other managerial issues when using patches and repairs on aluminum adherends. They note that bonded repair procedures for older aircraft need to be updated. When these airplanes were repaired, the specifications for surface preparation did not incorporate recent technique improvements. Because insufficient surface preparation processes were used, 42% of the repairs needed re-repair. This underscores the need for the dissemination of information and the training of employees on all levels [21]. Espie, et al. have implemented a Visual BASIC computer program to assist in the management of the bonding process and to ensure acceptable levels of reliability and consistency, acting as a quality assurance tool [22]. 2.2.2 Composite Adherends.
While metals have been used in structures for centuries, composite materials only became widely used during the last few decades. Thus, the processing and surface preparation procedures for composites are far less refined and are often based upon practices used for metals (with varying degrees of success in the translation). Chin and Wightman’s study on prebond surface preparation for composite materials covered methyl ethyl ketone (MEK) solvent wipes, grit blasting, peel ply vs fluorinated ethylene propylene (FEP), and gas plasma treatments. These were characterized by lap shear, static wedge, wetting tests, profilometry, X-ray photoelectron spectroscopy (XPS), ion scattering spectroscopy (ISS), and scanning electron microscopy (SEM) [23 and 24]. Before performing surface preparation, adherends were first oven-dried and stored in a desiccator. Specific preparation schemes included the following: 1. “As-received”: MEK wipe, blow with dry N2. 2. Peel ply: removed by hand, MEK wipe, blow with dry N2.
2-3

3. Blast: 150 grit silica, 60 psi, 3 passes, 6-8 in. distance, MEK wipe, dry N2 blow. 4. Oxygen plasma: mechanical vacuum pump then backfill with O2. Results of the different preparation processes included: 1. Contact angle tests showed that surface energy was a function only of chemistry.
2. XPS showed: fluorine, sulfur, silicon, and silicates on the as-received specimens, no fluorine or sodium but higher nitrogen and silicon on peel ply surfaces, no fluorine but some silicon and sodium on blasted surfaces.
3. ISS revealed a fluorine peak on as-received samples, but no fluorine peak on both peel ply and blasted samples.
4. Wettability tests showed that only the as-received surface did not experience wetting adequate for the surface tension of molten epoxy.
5. Profilometry showed a regular sinusoidal pattern on as-received specimens, a jagged and rough pattern on peel ply surfaces, a rough and random surface on blasted panels.
6. Double lap shear tests at room temperature showed that the as-received specimens had low strength, while peel ply and plasma surfaces had high strength.
7. Environmental lap shear tests revealed that peel ply and plasma surfaces maintained their strength better than as-received or blasted ones. Blasting decreased bond strength because the outer matrix layer was removed and fibers were damaged. Postfracture SEM images showed cohesive failures for all specimens but the as-received, which had both cohesive and interfacial failures.
8. Static wedge tests displayed identical initial crack lengths for all specimens but as-received specimens exhibited high crack growth and interfacial failures in high-temperature wet crack growth, while the others performed well.
Davis and Bond’s work covered general principles applicable to composite as well as metals. In addition, they recommend against • glass peel plies that are difficult to remove and can cause delamination,
• nylon plies that transfer release agents to the adherend, and
• heat-set or corona discharge-treated ones that leave an adherend surface that is clean but not chemically active.
They suggest light blasting with Al2O3 in a stream of dry N2 to remove only the surface without exposing fibers. Following blasting, a cleaning blow with N2 will remove debris safely [17].
2-4

Parker and Waghorne reviewed surface preparation for bonding composite joints by molding adherends against release fabrics, release-coated metal tools, and silicone rubber sheets. A range of abrasive treatments were performed and compared with XPS and single lap shear tests, with and without environmental exposure. The abrasion methods used were silicon-carbide sandpaper on a sanding block with light, medium, or heavy pressure; Scotch-Brite hand abrasion; and one to three alumina grit-blasting passes. Abrasion reduced impressions left by fabrics and lowered, but never totally removed, fluorine and silicon contamination. It was much more difficult to remove liquid mold release contamination than release fabric contamination on the composite surface. Heavy sanding was roughly as effective as blasting but exhibited higher contamination variation. Lap shear test results followed the same trends—strength lowered and failures became interfacial as contamination increased [25]. Hart-Smith had performed several studies on prebond surface preparation, including the effects of different release fabrics, peel plies, and abrasion. His work showed that most peel plies and all release fabrics could not create a surface adequate for durable, moisture-resistant bonds unless an abrasion process followed the fabric’s removal. While some peel plies did fracture the surface resin in producing durable bonds, it was found that light blasting was the only universally reliable method to achieve satisfactory bonds. Blasting must be light enough to not expose adherend fibers, which present a poor bonding surface. Nylon fabrics were coated with release agents to facilitate removal but were transferred to the adherend’s surface during cure, creating a layer that was chemically incompatible with the adhesive. Apart from improving the ease of manufacturing, release agents reversed the situation where a peel ply-matrix bond can be stronger than a fiber-matrix bond and remove the adherend’s outer matrix entirely, revealing fibers. Short-term shear tests may give good results, but a bond to a surface contaminated by a release agent will lack long-term durability, which can be assessed with a static wedge test. The outer surface must be removed through abrasion, preferably blasting. Because polyester does not combine chemically with the adherend’s matrix during cure as nylon does, release agents are not needed to remove it, while keeping the fiber-matrix bond intact. Thus, release agents are not transferred to the surface and bonds made to such an adherend should be more durable than those made to surfaces cured against coated nylon peel plies. However, the surface is inert and smooth and is, therefore, not conducive to bonding. Additionally, energy dissipative X-ray analysis (EDX) on parts that were fabricated with silicone-free or nontransferring mold release sprays revealed that the products did not actually meet manufacturers’ claims. Finally, Hart-Smith noted that a peel ply may work for one resin, but it may be ineffective with others [1]. Hart-Smith’s later work on the effect of prebond moisture on bond durability found that water at the interface lowers the surface energy of the substrate, preventing proper adhesive wetting. This adherend moisture is driven to the surface during cure and can be prevented from escaping by the texture surface left from a peel ply. Prebond adhesive moisture is also problematic. Hart-Smith noted that most service failures are interfacial and are usually a result of prebond moisture or release fabric silicone transfer. To ensure dry adherends, Hart-Smith suggested drying for more than several hours, and to prevent or minimize hydration, the out-time of components between curing and bonding should be short. It was also found that vacuum bags with good airflow removed moisture from the adhesive during its cure [6 and 26].
2-5

Hart-Smith, et al. continued with a more thorough surface preparation study of bonded composites that included a historical review of bonding versus mechanical fastening, methods to characterize different surfaces, and the formulation of successful fabrication methods. They also discussed the use of silane coupling agents to increase chemical compatibility between adhesives and adherends, noting that this process is more effective if adherends are undercured before bonding. Their work on abrasion showed that it is impossible to sand peel ply impression valleys without damaging the fibers in the peaks. Although broken fibers result in weaker structures, the weaker materials are preferable to disbonding. Therefore, when abrading, one must use adherends created with prepreg or add a surface adhesive layer to create a gel coat thick enough to abrade without harming fibers. In a comparison of different blast methods, Hart-Smith found that a light blast left the peel ply texture but did not damage fibers, while a strong blast removed the peel ply texture but damaged fibers and could even blast through thin laminates [19]. Armstrong’s prebond water absorption study on composite adherends examined dry, immersed-then-dried, abraded, and peel-plied surfaces. Armstrong found that only the specimens that were dry and never immersed prior to bonding experienced cohesive bond failures in a static-wedge test after years of water immersion. Surfaces cured against a peel ply, whether dry or immersed-then-dried, showed interfacial failure, a result of contaminants left behind by the ply. Both types of peel ply specimens produced identical fracture energies, indicating that prebond drying removed all moisture. The material was a heat-set and scoured polyester cloth with a corona discharge treatment. Surface preparation for his study included: 1. Sandpaper abrasion 2. Wipe with cotton wool pads slightly moistened with MEK 3. One more wipe with a dry pad to dry adherend before solvent evaporates Interestingly, small amounts of moisture improved measured short-term fracture toughness, though long-term durability was likely reduced. This was believed to be a result of prebond moisture plasticizing and toughening the adhesive [27]. Johnson, et al. studied the preparation of bismaleimide-epoxy adherends, including hand sanding and a methanol wipe, resulting in cohesive or interlaminar failures, even in aggressive environments [28]. Galantucci, et al.’s laser process was used on composite adherends in addition to metal ones, with optical, SEM, and wetting measurements to characterize surfaces. The wetting contact angle test was employed because it covered a larger area than the roughness test. Results showed that the laser treatment lowered the wetting angle and gave more consistent results on hand-sanded samples [29].
2-6

3. SURFACE PREPARATION AND CHARACTERIZATION.
This section discusses prebond surface preparation issues, ways to characterize surface preparation, and comparisons between paste and film adhesives. 3.1 INTRODUCTION.
In most bonding situations, prebond preparation must be performed to ensure a quality bond. Depending upon the case, quality can be interpreted as short-term strength, long-term durability, or environmental resistance. Surface preparation must be tailored toward the application at hand. When successful combinations of adherend, adhesive, and preparation are determined, these recipes are valuable because they are generally repeatable in any manufacturing line, though any change in the variables may easily upset the system. The surface preparation must be tailored to the materials used. For example, bonded aluminum requires anodization or etching and priming, a topic previously researched extensively due to its popularity as a structural material [2, 7, 14, 15, 17, 18, 20, 21, 28, 30, 31, and 32]. When bonding glass, silane can be used to promote adhesion between the adherend and the polymeric adhesive, two dissimilar materials that do not normally form strong chemical bonds. In the case of epoxy matrix composites bonded with epoxy adhesive, one typically does not need to go to great lengths because these thermoset polymer materials are chemically very similar, though preparation is still critical. The chief concern of bonded composite pieces is chemical contamination from the bagging and curing process. During cure, the part is formed against a mold on one or both sides. To ensure that the piece can be removed from the tooling, a tool can be either chemically coated with a release agent or covered with a release film. If the other side of the part is not formed against a second tool, a release scheme must still be used to prevent the piece from adhering to the bagging materials. These release systems hinder secondary bonding if not addressed. Even if surface preparations are carried out properly, an undesirable bond may still be produced through problems in the bonding process itself. Improper mixing of epoxies, poor bond thickness control, prebond adhesive moisture, and improper cure temperature/pressure/vacuum can ruin a bond between well-prepared adherends. This section provides background on mechanical and chemical preparation concepts, practices, and theory, as applicable to this research. Manufacturing and test methods are reviewed, critiqued, and applied to the problem at hand. 3.2 CHEMISTRY.
Several researchers have determined that both the initial strength and long-term durability of adhesive bonds are chiefly a function of chemistry, while mechanical factors are minor or insignificant [17, 18, 23, 25, 29, 30, 33, and 34]. There are generally two mechanisms that create intermolecular forces: primary and secondary bonds. High strength primary bonds include covalent and ionic bonds that are conducive to long-term durability, especially in the presence of
3-1

moisture [35]. They are more difficult to form but stronger. Secondary bonds (polar, Van der Waals and hydrogen bonds) are weak interactions that break and reform easily, resulting in poor adhesion. Polar bonds involve separated partial charges instead of ions. Because a molecule is comprised of atoms that become polarized in their exchange of electrons, the entire molecule itself may be polar (tending to be positively charged on one side and negative on the other where there is a greater electron density). A polar molecule will align itself with an electric field. More important to adhesive bonding, polar molecules will rotate to align with each other, creating a very weak connection. The experimental measure of the molecule’s polarity is called its dipole moment. Figure 3-1 shows an example of polar water molecules aligning themselves with each other. The figure depicts a special case of a polar dipole-dipole bond. The bond, because hydrogen atoms are involved, produces a stronger-than-expected dipole-dipole bond, which is still far weaker than any primary bond.
FIGURE 3-1. POLAR WATER MOLECULES ARRANGING THEMSELVES The hydrogen bond receives its own subcategory within the dipole-dipole grouping because of its unusually high strength for a secondary bond. Although it figures most prominently for water, it is also common in polymers, including epoxies. It occurs whenever a hydrogen atom with a partial positive charge approaches a nonbonded electron pair. Hydrogen bonding most often occurs between hydrogen and oxygen, but it will also occur with nitrogen or fluorine. This is important in epoxy systems, where the OH group of the reacted epoxy group interacts strongly with the nitrogen atoms from the hardener. Figure 3-2 shows the chemical reaction occurring when a hardener is combined with resin [34 and 36]. Van der Waals bonds result from interactions of induced dipoles. An induced dipole is a molecule that is normally nonpolar but, in the presence of a polar molecule, its electron cloud can be distorted by repulsion to create mild polarity. An induced dipole can be created by an ion, a polar molecule, or even another nonpolar molecule that also becomes an induced dipole. Dipole and induced dipole types are typical of the materials being studied herein. Nonpolar molecules possess a polarizability that indicates their likelihood of becoming induced dipoles. In general, the heavier the molecule, the more electrons and the larger the electron cloud, thus more opportunity to distort the cloud into an induced polar configuration.
3-2

FIGURE 3-2. CHEMICAL REACTION DESCRIBING HARDENING OF EPOXY ADHESIVE
Table 3-1 ranks intermolecular bonds by strength [37]. The interaction in secondary bond forces varies greatly—the strongest is about three orders of magnitude greater than the weakest. However, even the strongest secondary bond is still one to two orders of magnitude weaker than a primary bond.
TABLE 3-1. RANKING OF STRENGTHS OF DIFFERENT TYPES OF MOLECULAR BONDS
Bond Type Strength Ion-ion 400-4000 kJ/mol Ion-dipole 40-600 kJ/mol Hydrogen bond 5-25 kJ/mol Dipole-dipole 10-40 kJ/mol Dipole-induced dipole 2-10 kJ/mol Induced dipole-induced dipole 0.05-40 kJ/mol
In an ionic bond, one or more electrons completely transfer from one atom to another, usually occurring between metals on the left side of the periodic table and nonmetals on the far right. Elements in a covalent bond tend to lie closer together on the periodic table. Instead of a
3-3

complete transfer, electrons are shared between the atoms. Ionic bonds are generally stronger than covalent because the latter has both repulsive in addition to attractive forces. A bond can have both ionic and covalent characteristics—electrons are shared between a pair of atoms, though not equally. Previous research has proven that prebond abrasion increased bond strength and durability considerably [1, 5, 6, 13, 17-19, 23-25, 27, 28, 33, 38, 39, and 40-43]. However, the mechanism that causes this improvement is often mistakenly attributed to mechanical, not chemical, factors. It is thought that surface roughness, increased surface area, and mechanical keying effects, resulting from abrasion, produce better bonds. While this may be true of porous materials like wood, it is generally insignificant in materials like epoxy matrices or metals [17, 18, 23, 24, 30, 33, and 34]. The main advantage of surface abrasion in bonding epoxy-matrix composites is a chemical one. During cure of a composite, the polymer matrix forms long interlocked chains that are relatively inert—only weak Van der Waals forces are available to create bonds. If these chains are broken open and exposed, a fresh surface is created that is able to form strong ionic or covalent bonds with the adhesive. By using release agents that inhibit bonding to tools and vacuum bags during cure, a chemically inert layer is formed on top of the epoxy matrix, allowing only weak intermolecular bonds. The release agents on the tool and bag allow the composite part to detach from the tool and vacuum bag cleanly, generally important when creating composite parts. There is a transfer of release agents from the tool, film, or fabric to the surface of the part during the cure. This new layer inhibits bonding chemically by exposing only molecules that are not suited to primary bonds [1, 6, 17, 18, 20, and 23-27]. Extended adherend exposure to the atmosphere can adversely affect bonding, especially with oxidation-prone metals. Aluminum is generally primed immediately after anodizing or acid etching to prevent surface oxidation, which would result in oxygen from the air bonding to free ions, reducing the available ions for strong adhesion. The epoxy matrix in a composite does not oxidize but can absorb water from the air, bonding to available ions, making them unavailable to the adhesive. Drying adherends to evaporate the water can avert this problem. Abrasion will not affect this chemistry issue. The need to remove surface contamination before bonding has led to methods for measuring and quantifying the chemical content of an adherend’s surface; XPS can read the chemical makeup of an object’s surface. XPS creates a plot of intensity versus energy that results in peaks, which correspond to individual chemical elements and reveal bond-unfriendly elements such as silicon and fluorine. Previous work shows that repeating an XPS analysis after abrasion shows lower peaks and bonds made to such surfaces tend to be durable [23-25 and 33].
3-4
3.3 ABRASION.
There are several different means of abrading a surface to remove its outer layer to prepare it for bonding, including (in decreasing order of effectiveness) grit blasting, hand sanding, and scrubbing with an abrasive pad such as Scotch-Brite. The other chief method for removing a portion of the surface is peeling off a peel ply that was cured against it. The following sections discuss these methods, emphasizing manufacturing as well as scientific principles behind the processes. 3.3.1 Grit Blasting.
Although blasting has proven to be a very effective means of surface abrasion, it is not as convenient as other methods, and excessive in some cases, making it relatively unpopular in industry. Thus, this method is not as common as manual abrasion. Drawbacks are discussed in detail below. • Cost. Relative to sandpaper or abrasive pads, the blast cabinet cost is high. The price
breakdown to setup the benchtop blasting cabinet for this research is detailed in appendix A.1 of reference 44. The initial setup cost was approximately $771.
Note that dry pressurized gas is specified in the cost breakdown. Typical shop air from a compressor is likely to contain moisture from ambient air entering the system or oil from lubricated parts. Both contaminants can easily ruin an otherwise clean and acceptable system by projecting contaminated media onto a part and transferring the contaminant to it. If a compressor system must be used, it is advisable to filter and dry the air before it reaches the blast cabinet.
• Size limitations. The Econoline Mini Bench benchtop blaster system used in this research has an 18- x 16-in. cabinet, with a 12- x 6-in. access window. This size is well suited to research coupons and small production parts, but it is not large enough for many components. The largest cabinet in the McMaster-Carr Supply Company 107 catalog (part #3463K28) is 60 x 48 x 40 in., with a door opening of 30 x 20 in., which is quite small in terms of aerospace structures.
• Contamination. Many blaster setups use recirculating media. Once the pressurized gas
expels the media from the nozzle onto the part, it falls back down in a hopper where it is again sent through the nozzle. Eventually the grit will escape the cabinet through a seam or hole, be carried out of the cabinet on a finished part, or be sucked into a dust collector system. By this time, the media may contain the very contaminants that were intended to be removed from the parts to be bonded. It is critical that any blast cabinet be kept clean and used exclusively for one type of adherends. Even if the cabinet does not recirculate its media, it is still advisable to avoid blasting any parts other than those being prepared for bonding [16].
3-5

• Mess. In addition to restrictions on part size, the parts must be brought to a dedicated blasting room, which may prove difficult in production. For large parts, portable blasting systems (without cabinets) can be used, but these create debris that is difficult to contain and clean, requiring a dedicated blasting area.
One solution to contaminated media is to clean and degrease a part before blasting and replace the media regularly. A previous certification program showed the ability to track bond performance closely, attributing drops in bond quality to contaminated blast media, eliminated by replacing the grit [16]. Even with a sealed cabinet system with a dust collector system, fine media, dust, and adherend debris can exit the cabinet. This creates a nuisance that requires regular cleaning, and escaping dust can potentially find its way back onto adherends before bonding or upset other manufacturing processes. Any grit blast system must be located in a designated area away from any sensitive processes. This recommendation is even more critical for systems with open or no cabinets.
• Maintenance. Media replacement and cabinet cleaning are two required regular tasks that are necessary to ensure a consistent, acceptable surface quality. Another maintenance issue involves the pressurized gas source. For example, when a pressurized tank is used, it must be replaced as it is depleted. If a compressor is used, filters and dryers must be inspected and replaced frequently [16].
The nature of abrasive media and high pressure leads to wear on the blast system itself. Parts that are frequently replaced are listed in appendix A.1 of reference 44.
• Training. As with any manufacturing process, technicians must be trained to use the equipment safely while performing their tasks successfully. While a grit blaster removes operator variation that affects final bond quality, it introduces some potentially devastating problems. Contaminated media can ruin surface preparation, so it must be monitored.
There is also greater potential for overabrasion with a blaster than with other abrasion processes. If the grit stream remains on one location too long, it can remove the outer layer of matrix and expose fibers, which are considerably more difficult to bond to. It can also damage or break fibers, or cause folds [1, 18, and 19]. The same damage can also result from too many passes or excessively high blast pressure. Unlike manual abrasion, there is no direct tactile feedback to help the operator gauge the level of abrasion. Above all, compressed gas can be fatal. Strict safety precautions must be followed when dealing with compressed gas, including transporting and securing tanks. Despite these drawbacks (which are addressable production issues, not process shortcomings), a blasting system has the potential to provide better prebond surfaces than other surface preparation systems. The advantages are discussed below.
3-6

• No contact. Through the very nature of manual abrasion, contaminants that are removed from the surface of the adherends transfer to the sandpaper and have a potential to be redeposited onto the part. Ideally, no portion of the sandpaper would be used to abrade more than one small area of adherend. Of course, this is impossible, as a piece of sandpaper is held such that one portion of it is used to sand a relatively large area of adherend before the sandpaper is cycled to a fresh, unused portion for further use.
In a nonrecirculating blaster, every piece of grit hurled at the part is free of contaminants. In a recirculating grit system with proper maintenance, the possibility of transferring contamination from the grit to the part is small. When sanding, the outer layer that is removed tends to remain on the part’s surface until blown away. While these particles are present, subsequent passes of sandpaper may grind contaminants back into the piece and the sandpaper. There is potential for chemical recontamination and the presence of debris on the surface, coupled with the motions and pressures of manual abrasion, can lead to folds [18]. These problems can be prevented by frequent debris removal during sanding; but with a grit blaster setup, the continuous stream of air and dust collection system keep the adherend relatively free of dust buildup, reducing the risk of recontamination.
• Consistency. According to the literature, consistency from part to part is usually more important than absolute strength or durability [16, 18, 22, 33, and 25]. Consistency in fabrication obviates the need for expensive, time-consuming quality control, resulting in confidence in processing and products. Since grit blasting produces more consistent bond strength than hand abrasion [1, 18, 25], it justifies the initial investment in blasting.
Additionally, when a part has a complex geometry, blasting may be the only adequate method of abrasion. Concavities prevent hands from entering and being able to abrade properly with sandpaper, but a blast stream may still reach that section. Unlike manual abrasion, blasting will provide smooth and consistent results over lay-ups with ply drop-offs [19]. Features on a smaller scale lend themselves to blasting rather than manual abrasion. A peel ply or release fabric leaves a woven impression on a part’s surface. It is impossible to sand the small, potentially contaminated, valleys in this texture without oversanding and damaging fibers in the peaks and ridges [1].
• Repeatability. Once an optimal blasting setup has been determined, it is easy to repeat this process consistently. One important factor that can be dialed in is the blast pressure, with the use of a regulator and gauge. With hand abrasion, it is impossible to apply the same amount of pressure from part to part and from location to location within one part. In addition to selecting and maintaining the appropriate blasting pressure, the distance between the nozzle and the part, the angle of projected media, the type of media, the velocity nozzle across the part, and the number of passes must also be controlled. Once values for these parameters are determined, they are easy to measure and reproduce for every part. In a cabinet blaster, these variables are even easier to set, quantify, and
3-7

maintain. Based on industry recommendations and data in the literature, it was decided to use 40 psi pressure [1, 33, 23, and 24].
• Feedback. It is visually easy to determine which surface sections have been blasted.
When hand abrading, it is difficult for the technician to determine if a surface has been sanded or to what degree. Therefore, there is subjectivity in the pressure, duration, and number of passes. This is compounded by the fact that the abrasive pad and the operator’s hand obscure the area being abraded. When blasting with a nozzle, there is significant distance between the nozzle and the part, making it is clear to the operator when a section has been blasted, and a quick visual inspection reveals any unblasted portions. All of these issues are automatically addressed with a blast cabinet.
• Safety. Because cabinets are sealed and include vacuum dust removal systems, there is
little airborne debris. Although blasters do tend to create messes in and around the cabinet, it is usually in the form of large dust particles that fall out during part insertion and removal. It is not required to use a dust mask when working with a cabinet.
Note: When blasting large parts outside of a cabinet, the operators and those nearby must wear proper eye, mouth, and nose protection.
• Variety. A number of readily available grit media can be used for different applications
(appendix A.2 of reference 44). For blasting epoxy-matrix composites, aluminum oxide grit was selected based on recommendations in the literature, because the jagged shape of the media is conducive to easy removal of epoxy [18].
If the interest of this research were to simply outline the best surface preparation methods, grit blasting would be chosen without weighing the pros and cons of the other methods. However, because this study includes recommendations for practical industrial applications, cost and production factors as well as the chemical and abrasion factors must be taken into account. 3.3.2 Hand Sanding.
Hand sanding is the most popular abrasion method, but there are several reasons why it is inferior to blasting. Disadvantages, both scientific and practical, of hand sanding are discussed in detail below.
• Contamination. Hand sanding is a contact process, which means that any contaminants that are removed from the adherend’s surface can be redeposited through one of two methods. First, as the abrasive grit cuts the outer layer of the epoxy matrix, dust and debris, containing surface contaminants, are created. These collect on the part where they can be ground back in with the sandpaper. Second, contaminants removed from the surface can become embedded in the sandpaper and redeposited. These potential problems can be minimized but not necessarily removed altogether by swapping out used sandpaper for fresh pieces frequently.
3-8

• Inconsistency. Consistency issues are complicated when the adherend is not a flat panel. Hart-Smith has found that ply drop-offs and peel ply/release fabric texture impressions have contours that prevent the part from receiving equal abrasion across its surface when sanding [1 and 19]; other geometric factors present the same challenges for manual sanders, reducing the consistency necessary in fabrication.
• Lack of feedback. The inherent inconsistency in a manual operation cannot be avoided
because every technician sands differently—variables that are impossible to quantify, measure, and control include pressure, hand motion, hand size and means of holding sandpaper, decision of when to cease sanding, and frequency of swapping to fresh sandpaper.
• Folding. Another potential problem caused by hand sanding is folding of the surface
being abraded. Because of the nature and motion of hand sanding, as well as the built-up removed surface debris, it is possible to create contours and shapes on the adherend’s surface that trap contaminants and moisture [18].
• Mess. Although grit blasting and hand sanding generate similar dust and debris, grit
blasting contains it inside a cabinet. The fine particles generated from sanding become airborne and create a hazard for technicians. This problem can be minimized by using water to trap the particles. However, moisture can degrade sandpaper materials and obscure an operator’s view of the surface, making it more difficult to determine if an area has been sanded adequately. A drying step must be added to remove adherend moisture before bonding. Depending on the materials and processes, it is advisable to include a drying step regardless of wet or dry abrasion. However, the drying time will be longer if the adherends have been exposed to water because epoxy tends to absorb water readily [1, 6, 7, 13, 18, 20, 21, 23, 24, 26, 27, 32, 38, and 45-49].
• Lack of variety. Sandpaper grit does not come in as many varieties as blast media,
though there are several varieties of backing papers (appendix A.3 of reference 44). Despite the disadvantages discussed above, there are indeed several advantages, both science-based and production-oriented, to the hand-sanding process that make it such a popular option, as discussed in detail below. • Cost. Sandpaper is extremely cost-effective, costing less than $1 per sheet. Thus, in
most production environments, it may be financially sound practice to first attempt to use hand sanding before investing in a grit blaster setup.
• Training. Sanding requires less training time and expense than blasting. Because
sandpaper is a common household tool, most technicians already have sanding experience. Because of its simplicity, one need only train the operators on specific parameters like pressure, number of passes, etc. However, because technicians may already have self-taught sanding experience, they may have developed habits that are incompatible with the surface preparation goals, potentially requiring retraining.
3-9

• Safety/mess. Hand sanding does not involve some of the risks associated with compressed gas, electricity, or machinery. Although significant dust and debris are generated, the process does not create messes outside the immediate sanding area. A vacuum air recirculation system may minimize the mess. Nevertheless, the sanding area must be segregated from other processes to prevent unintentional contamination.
• No size limitations. Blast cabinets cannot accommodate large parts. A cabinetless setup
must be used in such cases. Hand sanding, however, can be performed on any part. 3.3.3 Abrasive Pad Scrubbing.
Although there are several types of abrasive pads available for manual abrasion, 3M’s nylon Scotch-Brite is the most common. Though it abrades surfaces less than sandpaper and creates less debris, it scores the surface, leaving small traces. Most arguments for and against the use of manual sanding (section 3.3.2) also apply to Scotch-Brite and other abrasive pads. The only differences are that Scotch-Brite tends to remove adherend material more slowly than sandpaper and produces less dust, creating less mess and respiratory hazard. 3.3.4 Peel Ply Removal.
Another method to remove the outer layer of an adherend in order to prepare it for bonding is to cure it against a peel ply cloth and then tear it off before bonding. First, terminology must be clarified. The term peel ply is often mistakenly used to refer to a release fabric. Both peel ply and release fabrics are woven synthetic fabrics used in vacuum bags, are cured directly against the laminate, create a texture on the adherend surface, and are intended to be left on the composite part as protection from contamination or handling damage until the part is to be used. The main difference between the two is that a release fabric is intended to pull off the surface easily, removing no material from the part, while peel plies are designed to adhere to a part’s epoxy-rich outer surface and fracture the matrix when peeled off. To achieve these two different goals, peel plies and release fabrics are usually made with different materials and processes. A release fabric is coated with release agents like silicone or siloxane, which prevent bonding between the composite’s matrix and the release fabric during cure. Because no strong chemical bonds are formed, it is easy to peel off. Release agents transferred to the adherend during cure inhibit secondary bonding and must be removed with abrasion before bonding. A peel ply contains no release agents, is scoured clean, and is heat-set so that it will not react chemically with the adherend’s matrix as it cures and cross-links. Thus, it bonds strongly to the composite’s matrix during cure. Therefore when the peel ply is pulled off before bonding, it should fracture and break off a thin layer of the epoxy matrix. If the strength of the chemical bond formed between the peel ply and the matrix is too weak, relative to the bonds in the matrix, then fracture may not occur.
3-10

Three different versions of the same polyester cloth were used in this research. They were produced by Precision Fabrics Group and supplied by Richmond Aircraft Products: 60001 NAT (natural), 60001 VLP (very low porosity), and 60001 SRB (super release blue) (appendix A.4 of reference 44). The SRB release fabric version has an inert, heat-stabilized, cross-linked siloxane polymer finish. The two peel plies are NAT, with its scoured and heat-set finish, and VLP, which is mechanically finished through calendering. In this proprietary calendering process, the cloth is passed between several pairs of heated rollers that compress the material, reducing its porosity and flattening out the cloth’s fibers. Using VLP results in less resin bleed into the peel ply during cure and improved releasability without chemical agents that impede secondary bonding. 3.4 QUANTIFICATION AND EVALUATION OF SURFACE PREPARATION EFFECTS.
Even with blasters (especially cabinet ones) where many surface preparation parameters can be quantified and controlled, it is still important to measure and quantify the effects of abrasion. Several test methods can read the chemical composition, take high magnification pictures, make a three-dimensional (3-D) map, or measure the surface roughness (wettability) of a surface. All of these processes are valuable in quantifying the abrasion process. While only XPS, energy-dispersive spectroscopy (EDS), and SEM tests are used in this study, the following relevant processes are discussed: • Scanning Electron Microscopy. SEM is a form of microscopy that creates
monochromatic images by bouncing a stream of electrons off the surface of the object and detecting the paths of secondary electrons that are knocked free [50]. An extremely hot cathode acts as an electron gun, magnetic-reducing lenses focus the stream to converge on the sample surface, and scan coils bend the electron stream to raster across the surface. Electrons from the sample are knocked free from the surface and hit one or more detectors (which associate a brightness with the number of electrons collected for a given beam location) whose signals are amplified and displayed on a monitor, producing images at high magnifications, over 300,000X.
Because SEM relies upon electrons for imaging, the specimen must be either electrically conductive or coated with a layer of conductive material. Because the specimens in this research have epoxy surfaces, they were sputter coated with carbon before imaging. In this study, SEM was used on prebond, prepared adherends. As mentioned above, chemistry is generally more important than morphology in adhesion, thus, obtaining images of a prepared surface does not tell the whole story. However, what can be gained in postabrasion SEM images is an indication of the quantity or intensity of abrasion, which shows if the surface has been disrupted adequately. This indication is impossible to quantify from SEM photos, and these surface pictures cannot be used to accurately predict bond durability, but like the XPS data, they can be used for feedback and comparison. One can compare unabraded surfaces against abraded ones to qualitatively determine if the abrasion appears adequate.
3-11
Surfaces can be checked for exposed or broken fibers or other indications of overaggressive abrasion. SEM photos of postfracture surfaces can also reveal much information about the bonding and surface preparation process. On a gross scale, it is readily apparent to the test operator whether a specimen appears to have failed interfacially (adhesive pulls off adherend, poor bond), cohesively (adhesive fractures and some remains attached to each adherend, good bond), or interlaminarly (bond remains intact and adherend fractures, good bond), as discussed in ASTM D 5573 Standard Test Method for Classifying Failure Modes in Fiber-Reinforced-Plastic (FRP) Joints. However, with SEM, one can view minutiae not visible to the human eye: − Features in the vicinity of bondline thickness spacers (carrier cloth, glass
microbeads, wires etc) to determine if they acted as crack initiation sites.
− Porosity or voids from inadequate pressure during adhesive cure.
− The sometimes subtle distinction between an interfacial failure and a thin-layer cohesive (or surface) failure where the extremely thin adherend surface resin has remained attached to the adhesive and pulled off of the adherend.
− Small patches of interfacial failure in a primarily cohesive failure (or vice versa) that may reveal inconsistencies in surface preparation.
• Energy Dispersive Spectroscopy. An EDS detector is generally attached to an SEM machine to add chemical analysis capability. The rastering electron beam used for imaging also generates X rays characteristic of the elements in the sample. When the beam hits the sample, surface atoms’ electrons are ejected. These new gaps are then filled by an electron from a higher shell and an X ray is emitted to balance the energy difference between those two electrons. The detector, made of a semiconductor, decodes the X rays and converts them into an electronic signal. The signals are counted over a period of time and plotted—the count is proportional to the frequency for the type of atom that was found on the sample. Perhaps the best aspect of EDS is that it can be performed in conjunction with SEM imaging. The SEM can be used to visually pinpoint small, specific features on a sample while the EDS detector reads the chemistry corresponding to that same area. However, because SEM requires electrically conductive samples, they must be carbon-coated, which skews the EDS chemistry evaluation. Hart-Smith’s work has used EDS to show that considerable concentrations of fluorine and silicon are transferred from a release fabric during laminate cure [1]. Adherends that showed this behavior produced poor bonds that failed interfacially and were susceptible to environmental degradation. Hart-Smith showed that blasting lowered contamination, producing durable, environmentally resistant bonds.
3-12

EDS or XPS used in conjunction with different preparation methods can provide information on chemical contamination, a chief factor in bond quality. It is impossible to quantify bond strength or durability from an EDS (or XPS) plot because there are several other factors in the bonding process itself that can affect bond quality. However, one can rank processes. One can also use these tools at several points along a surface preparation process, after each step, to streamline the production by determining which steps are the key ones and which can be eliminated or modified.
• X-Ray Photoelectron Spectroscopy. Originated in the 1950s, there were several different types of photoelectron spectroscopy, including X ray. In XPS, incident radiation in the X-ray energy range (on the sample’s surface) probes the energy distribution of valence and nonbonding core electrons. The latter have highly characteristic energies, revealing the atomic element, as well as information on its chemical state [51].
XPS was used in previous research on the transfer of release agents to a laminate, as well as other cases of adherend surface contamination [23-25, 30, and 33], including the discovery of fluorine contamination that is removed from the adherend surface through grit blasting. XPS used in conjunction with different preparation methods can provide valuable information on chemical contamination, the principal factor in determining bond quality. It is impossible to quantify a bond’s strength or durability from an XPS plot because there are several other factors in the bonding process itself that can affect bond quality, but one can rank processes. One can also use XPS at several points along a surface preparation process, after each step, to streamline the production by determining which steps are the key ones and which can be eliminated or modified.
• Atomic Force Microscopy (AFM). Like SEM, AFM produces surface images, but it uses an extremely small cantilever beam (about 4 x 10⁻³ in. long by 4 x 10⁻⁵ in. wide) with a spring constant weaker than the equivalent interatomic spring force. It is dragged over a surface or passes just over it at a distance of about 4-40 x 10-7 in. to measure short-range interatomic forces. The cantilever beam has an extremely fine tip, less than 2 x 10⁻⁶ in. wide, which is either an integral part of the beam or a separate bonded-on piece. As this beam tip passes over the surface’s atoms, the cantilever deflects, and the amount and location of deflection are recorded (variable deflection mode) by one of several techniques, providing an altitude value for each (x, y) coordinate. An alternate measurement technique is to use constant force mode and use a feedback system to adjust the distance between the beam and the surface to maintain a constant force. A 3-D image is generated and studied. An AFM can discern features smaller than 4 x 10⁻¹⁰ in. [52 and 53].
The 3-D surface map provides feedback on the effects of abrasion, much like SEM. However, since this data can be input into and manipulated by a computer, the roughness can be quantified through curve fits and other mathematical algorithms.
3-13

• Profilometry. There are several different versions of profilometry, but most fall under
two categories: stylus or light. In stylus profilometry, a stylus transducer is mechanically rastered across a surface and a height measurement is taken for each (x, y) coordinate scanned, much like AFM. This type dates back to 1936 and has been refined over the decades to produce a vertical resolution of less than 3.9 x 10⁻⁹ in. and a horizontal resolutions as small as 3.9 x 10⁻¹⁰ in. [54 and 55]. Optical profilometry involves shining light (typically a laser) on a surface in a rastering pattern and sensing the reflections, giving vertical and horizontal resolutions smaller than 3.9 x 10⁻¹⁰ in. [56]. The resulting 2-D or 3-D topographic data is equivalent to AFM maps, with similar potential and benefits. Previous researchers have employed profilometry for feedback on surface preparation and abrasion [23, 25, and 33].
• Water break test. The simplest, cheapest, and fastest method to assess both surface
roughness and chemical contamination is the water break test, recommended by Hart-Smith in his discussion of design principles of bonded joints [13]. Water wets surfaces differently: if the surface is smooth or contaminated, it will bead up; if the surface is rough and clean, it will spread out. When a flowing adhesive is curing, it will act like the water and wet or bead up on a surface. For improved bonding with maximum surface area contact between the adherend and the adhesive, the adherend must be roughened by some method [23, 24, 29, and 34].
The test is conducted simply by pouring water on the part and observing the results. Because no measurements are involved, the results are subjective, well-suited to rough estimations of surface roughness and contamination or comparing different preparations. Water should form a solid sheet across an ideal adherend. Apart from its cost and ease, the main benefit of this nondestructive test is that actual production parts can be tested. The other tests discussed here use a piece cut from of the adherend, but that small sample may not be representative of the rest of the part.
• Contact angle test. The contact angle test is a quantitative version of the water break test where the operator measures the angle between the adherend and a liquid bead where it contacts the surface (figure 3-3). A drop is placed on a surface and light is passed through it to project an enlarged image on a screen, where the angle can be measured. This step removes the subjectivity in judging water beads. Previous research has shown that wettability is key to adhesion because it measures both surface roughness and chemical contamination, and the contact angle can be used furthermore to compute the surface energy of the adherend [23, 24, 29, 32, and 34].
Another quantitative version of the contact angle test involves placing a fixed volume of liquid on a surface and measuring the drop’s diameter. An advantage to this version is that there is no need for any special equipment [32].
3-14

FIGURE 3-3. CONTACT ANGLE BETWEEN ADHEREND AND DROP OF WATER IN THE WATER BREAK TEST
3.5 PROCESSING AND MANUFACTURING.
In addition to abrasion or peel ply removal, there are several other recommended prebond steps, mostly addressing how to avoid moisture or contamination. The recommended order of surface preparation is listed below and discussed in detail in this section [13, 17, 18, and 27]: • Dry. Prebond moisture has been a common, serious problem in bonding, especially when
making field repairs where aircraft have been exposed to the elements [6, 26, and 27]. The effects of prebond adherend moisture are two-fold: water molecules prevent proper chemical bonding, and the local pressure increase of vaporizing water can create mechanical separation and deformation (most heat cure adhesives cure above 212°F).
Before surface preparation, adherends should be dried thoroughly, preferably in a convection or vacuum oven. Depending upon the adherend material and the cure temperature of the matrix in a composite, the drying temperature can vary greatly. For this study, the oven-drying temperatures used were 130°-180°F, and they were dried for a minimum of 2 hours, but typically longer than 12 hours. Depending on the environment and the length of time between the initial drying and the bonding process, adherends may need to be dried again.
• Clean. As discussed above, chemical contamination almost always exists on the surface of adherends, whether it be from release agents in the bagging system, improper handling, or another source. The contamination must be removed before any other surface preparation steps. If one abrades a surface to expose a fresh, clean layer without first removing surface contaminants, this contamination is likely to be ground into the fresh layer, especially if a manual abrasion technique is used.
It is recommended that adherends be cleaned thoroughly with a solvent rather than detergent [18]. Acetone and isopropyl alcohol (IPA) are commonly used. The wiping process should be performed with a fresh, clean, lint-free cloth. Each cloth should be disposed of after one pass. Once there is no more visible dirt or debris on the cloth, the adherend surface is considered to be clean. For most of the initial cleaning processes performed in this study, Kaydry EX-L Delicate Task Wipers by Kimberly-Clark were used. According to the manufacturer, it is a two-
3-15

ply, extra low-lint tissue intended to wipe up liquid and dust. Since it is also white, it is easy for the operator to determine if any contaminants are being removed. At the end of the cleaning process, each surface was blown dry with compressed air to remove any lint particles that may have been left behind. For adherends cured against peel plies, this step was omitted because the peel ply was still attached to the adherend. If the peel ply is present during a solvent wipe, it and any coating may be dissolved into the adherend, contaminating it severely.
• Abrade. Once the outside surface has been cleared of any stray debris or easily removed contaminants, the abrasion process is commenced. Theoretically, the removal of a peel ply obviates the need for abrasion, but adding an abrasion step to the process should ensure proper chemical adhesion. In practice, abrasion is often omitted after peel ply removal, likely leading to durability problems, especially considering the frequent confusion between release fabrics and peel plies.
• Blow clean. Once contaminated surface debris has been removed from an adherend, it
should be cleaned with a dry cloth or, preferably, a stream of dry inert gas. Wiping with a solvent at this stage could redissolve removed contaminants back into the adherend.
In addition to theoretically obviating the need for prebond abrasion, the use of a peel ply is also intended to obviate this step. As discussed above, because this method of fracturing the surface may leave contaminated debris on the surface, using a solvent wipe after this step may redeposit contaminants onto the adherend. A blast of dry gas would remove such debris after peel ply removal, before the adhesive is applied. Although the work in this research leads to the recommendation of blowing the adherend clean after peel ply removal, this step is generally omitted in practice.
• Bond. After all preparation, the bonding process can commence. Because this section deals chiefly with surface preparation, most bonding specifics are located in the appendices of reference 44, where individual test specimens and test methods are discussed.
One general note that is relevant to all bonding is the effect of prebond moisture has in the adhesive itself. Because the adhesives in this study were stored in freezers, it is important to take precautions when preparing them for bonding. Paste adhesive was sealed in cans while film adhesive was sealed in bags with desiccant packs to absorb moisture. Before bonding, adhesives that were still sealed were set out at room temperature for several hours to avoid condensation. Additionally, the inclusion of air paths in the vacuum bags assisted moisture removal during cure. Hart-Smith intentionally placed prebond moisture in an adhesive and showed that adequate vacuum bag air paths can remove adhesive moisture during cure, producing adequate bonds. Identical specimens with poor air paths had produced poor bonds [26].
3-16
4. EVALUATION OF FRACTURE MECHANICS-BASED TEST METHODS.
This section covers fracture test methods used to evaluate adhesively bonded composite joints as well as analysis methods to predict and describe mode I behavior. 4.1 INTRODUCTION.
The test methods for the characterization of bond surface cleanliness are of two basic types: strength and fracture. Strength-based tests determine integrity based on failure load and bond area. Fracture-based tests determine resistance to cracking. Standard strength-based testing such as lap shear and various fracture mechanics test methods were investigated. The fracture test methods characterize the surface by developing different cracking modes on the adhesively bonded surface. The use of three modes were evaluated: Mode I, Mode II, and Mix Mode I-II. Strength-based tests are common in the control of adhesives that are not well suited for the determination of bond integrity. The fracture-based methodology interrogates the adhesive bond in a manner which easily identifies the contamination of the bond surface. 4.2 FRACTURE TESTS COMPARISON TO SHEAR STRENGTH TESTS.
Out of the several test methods that measure bond strength, lap shear tests have been the most popular, since bonded joints are designed to carry shear loads. However, previous researchers established that lap shear tests provided limited verification of bonded assembly reliability, especially when considering prolonged loading and environmental conditions [6, 15, 18, 34, 57, and 58]. Confirmation of bond integrity requires a mode I test similar to the static wedge test, used for surface preparation and processing evaluation for metal adherends. In addition, it was found that, for metal, lap shear tests conducted over a range of temperatures and environments do not duplicate service disbond behavior [9 and 10]. Thus, shear tests are not as good an indicator of long-term bond durability as mode I tests. Also, the attainment of pure shear loading conditions is rarely achieved in practice or tests—there is always a peel component from eccentric load paths near joint edges, even in symmetric double-lap specimens [9 and 10]. Mode I tests are an appropriate test for evaluating surface preparation and durability of bonded joints. A compromise is to use a mix of modes I and II, achieved through asymmetric specimens or special loading schemes. While specimens are subjected to mode I opening forces, a smaller mode II component drives the crack to one side of the bondline, ensuring that it propagates in the desired region. Despite the literature’s bias toward mode I tests, a series of lap shear tests were conducted and compared against the mode I tests (figure 4-1). The test followed ASTM D 1002 Standard Test Method for Apparent Shear Strength of Single-Lap-Joint Adhesively Bonded Metal Specimens by Tension Loading (Metal-to-Metal) except specimens that were 1/2 in. wide instead of 1 in. wide.
4-1

PP
b=width
l
h
Legend: P = load applied by test machine b = width of sample (constant for the specimens used herein) l = joint overlap length h = height of each of the two adherends
FIGURE 4-1. SINGLE LAP SHEAR TEST METHOD SETUP
Average shear strength, T, is calculated simply by dividing the failure load over the bond area:
blP=Τ
(4-1) However, because the shear stress is not distributed evenly over the joint, this value alone does not necessarily characterize a bond completely. 4.3 ASTM STANDARDS VS CUSTOM TESTS.
There is no standard test procedure for measuring the strength of bonded composites. ASTM tests researched cover adhesively bonded metals or interlaminar failures in composites. Double cantilever beam (DCB) and wedge tests (both traveling and static) were used in this work and drew upon several mode I ASTM test methods (appendix D1.1 of reference 44). • ASTM D 3433 Standard Test Method for Fracture Strength in Cleavage of Adhesives in
Bonded Joints
• ASTM D 3762 Standard Test Method for Adhesive-Bonded Surface Durability of Aluminum (Wedge Test)
• ASTM D 5528 Standard Test Method for Mode I Interlaminar Fracture Toughness of Unidirectional Fiber-Reinforced Polymer Matrix Composites
Similarly, the ASTM D 3167 Standard Test Method for Floating Roller Peel Resistance of Adhesives was used for evaluating bonded composites, though the method specifies, “clad aluminum alloy conforming to the specification for aluminum-alloy sheet and plate (Specification B209) Alloy 2024-T3 shall be used.” Some other bonded joint mode I test methods that were considered are listed in table 4-1. Several tensile and shear methods that were reviewed but not employed, as they would likely prove ineffective for bond durability evaluation, are listed in table 4-2.
4-2

TABLE 4-1. MODE I ASTM BONDED JOINT TESTS NOT USED IN THIS STUDY
Test Specimen Purpose D 903 180° peel, thick adherend to thin,
flexible adherend Peel/stripping adhesive characteristics
D 1062 Thick DCB-like bonded metal Adhesive cleavage properties D 1781 Climbing drum peel Peel resistance between flexible and rigid
adherends D 1876 T-peel, bonded joint Peel resistance between flexible adherends D 3807 Plastic DCB with long starter crack Adhesive cleavage/peel strength
TABLE 4-2. TENSILE AND SHEAR ASTM BONDED JOINT TESTS NOT USED
IN THIS STUDY
Test Specimen Purpose D 897 Wood or metal butt tensile Adhesive tensile properties D 2919 Single lap shear Environmental durability of lap joints
under load D 3163 Plastic single lap shear Shear strength for bonded plastic joint D 3164 Single lap shear, plastic bonded
between metal adherends Shear strength for bonded plastic joints
D 3165 Single lap shear with thickened adherends
Comparative shear strength of adhesives in large area joints
D 3528 Metal double lap shear Shear strength for bonded metal joints under low-peel loading
D 3983 Thick adherend single lap shear Adhesive shear modulus and rupture stress D 4027 Wood modified rail specimen Shear modulus and rupture stress between
rigid adherends D 4896 Small single lap shear Appropriate interpretation of lap shear test
data E 229 Circular torsion shear Adhesive shear strength and shear modulus
4.4 FLOATING ROLLER PEEL.
In this research, the initial approach for evaluating bonded composite joints was the floating roller peel test (figure 4-2). This test is designed for use as a pass/fail quality control method for bonded metals. It is designed for a thick adherend bonded to a thin flexible adherend that bends around a roller—the force required to peel it off is compared against a pass/fail criterion. Because composite-to-composite bonds are more typical of the type of aircraft being studied in this research, 0-90 woven glass or carbon fiber plies were substituted for the thin adherend. Calculations were performed (appendix C1.1 of reference 44) to ensure that if the thin adherend wrapped around the roller, it would not fracture.
4-3

thick adherend
thin adherend
FIGURE 4-2. FLOATING ROLLER PEEL TEST METHOD SETUP 4.5 DOUBLE CANTILEVER BEAM.
The DCB test (figure 4-3) is well established and has been used by many researchers for many materials and applications, including bonded metal or composite joints, interlaminar composite fracture, and monolithic metal/polymer fracture. There are several variations in the test method and the data analysis.
a
P
P
db=width
hinge
h 2t
Legend: d = opening displacement between beams’ inner faces at load application
P = load applied by test machine a = crack length (from point of load application to crack tip) b = width of sample (constant for the specimens used herein) h = height of each of the two beams t = half of bond thickness
FIGURE 4-3. DOUBLE CANTILEVER BEAM TEST METHOD SETUP
4-4

All DCB tests and analyses were performed on constant cross-section specimens rather than on ones with thickness or width tapers that give constant GI values as the crack progresses. All of the specimens in this study were designed to avoid nonlinear behavior (appendix D1.1 of reference 44). In addition to the GIc data that this test is designed to generate, the load-displacement plots and the postfracture surfaces also provide valuable information on bond strength and durability. As a test is conducted, a load-displacement plot is generated. Several plot features can provide valuable information on the bond (section 5.2.2 and appendix D2.3 of reference 44). First, the load value at the initial peak (the value at which the crack first advances) can be used to rank specimens by initial joint strength. Second, the opening displacement value at final, complete fracture can be used to compare specimens with identical lengths—a larger value indicates a shorter crack length and thus a tougher bond. Third, the contour of the plot at crack propagation portions reveals whether the crack is advancing stably or unstably—stable crack growth results in smooth curves while unstable stick-slip growth gives jagged ones. The crack path and postfracture surfaces provide information on surface preparation and bond quality. Common failure modes, determined from visual fracture surface examination, using terminology found in ASTM D 5573 are: 1. Cohesive: the crack propagates through the adhesive, a desirable failure since the
adhesive-adherend interfaces remain intact.
2. Interfacial: the crack propagates along one of the interfaces, an undesirable failure, as the bond is the weak link and the joint will likely have poor long-term durability; these types of cracks often jump from one interface to the other.
3. Interlaminar: the crack propagates between plies in one of the adherends, a desirable failure since the adhesive-adherend interfaces remain intact.
4. Surface/thin-layer cohesive: the crack propagates just under the epoxy surface of one of the adherends, a desirable failure since the interfaces remain intact.
Many specimens exhibited a combination of these failure modes, requiring one to determine the ratio of failure modes to characterize the failure completely. There are four commonly used GIc data reduction methods for the DCB test, two of which were used in this study. 1. The area method 2. The modified beam theory (MBT) method 3. The compliance method 4. The load method The area method was used first, but further review of Whitney’s work revealed that it tends to overestimate GIc [59]. Therefore, the MBT method was used on subsequent tests. There was
4-5

close correlation between the two methods, though the MBT method did indeed produce slightly lower values. The data reduction/analysis methods are discussed below. 4.5.1 Consideration of Adhesive Layer in Analyses.
Before commencing the DCB analyses, the inclusion of the adhesive layer in these calculations must be addressed. Several analyses in the literature cover homogeneous monolithic specimens or composite interlaminar fracture. In either case, there is no adhesive layer to consider. Analyses in the literature on bonded joints sometimes include the adhesive layer. However, it was decided, after evaluating previous research [60], that adhesive layer effects can be neglected in this work because certain conditions had been met. Based on a homogeneous, linear elastic, symmetric DCB arrangement (figure 4-3), Fernlund and Spelt derived two equations for GI: one ignored the adhesive, equation 4-2, and one included the effects of the adhesive layer, equation 4-3:
GPa
EhI =12 2
3
( ) (4-2)
23
2
)()(12
II thEPaG Φ−
= (4-3)
where: E = Young’s modulus of isotropic adherend
ΦI = correction function for effects of adhesive layer
= 41
)]}12(1[)1{(667. 3 −+−+aEE
ht
ht
ah01
Ea = Young’s modulus of adhesive The equations incorporate several assumptions: the specimen is under plane stress, the beams are perfectly clamped cantilevers mounted at the crack tip, the beams follow elementary beam theory, and there are no shear deformations in the adherends. Given these assumptions, equation 4-3 is an exact solution. In their tests on bonded aluminum, they found that at small crack lengths, GIc values approached zero if equation 4-2 was used (figure 4-4(a)). But, above a certain crack length, GIc plateaued, remaining constant at lengths beyond that point. When plotting the same test data with the exact solution, the plot remained constant through the entire range of lengths, as seen in figure 4-4(b). This value in figure 4-4(b) is the same as the plateau value that is approached in figure 4-4(a).
4-6

(a) (b)
FIGURE 4-4. DOUBLE CANTILEVER BEAM GIc VS CRACK LENGTH WITH AND
WITHOUT ADHESIVE LAYER [33] (a) IGNORING ADHESIVE LAYER (EQUATION 4-1) AND (b) INCLUDING ADHESIVE LAYER (EQUATION 4-2)
From a visual analysis of the curves in figure 4-4, it can be seen that the crack length values at which the simpler approximation matches the exact solution is:
8>− tha (4-4)
For the DCB specimens described in this report, h = 0.125 in., t = 0.005 in., and the starter crack was at least 2 in. beyond the loading point. Substituting into equation 4-4, one obtains 16.66 > 8, satisfying the requirement. Although Fernlund and Spelt’s work covered isotropic materials, it is based on the same simple beam theory principles discussed below and used in this work. Other research that covers composite adherends or interlaminar fracture demonstrates that a unidirectional layup is similar enough to a homogeneous material that Fernlund and Spelt’s energy-based linear analysis holds for composites. Therefore, the GIc calculations used in this report need not include the adhesive layer [59 and 61-70]. 4.5.2 The Area Method.
The area method is based upon a change in the DCB’s compliance, C, defined in equation 4-5, resulting from a change in crack length [67, 70, and 59]. The strain energy lost due to crack extension for a linear elastic body is equal to the area between the loading and unloading curves on a load-displacement plot (figure 4-5).
PdC = (4-5)
4-7

Legend: P1 and P2 = applied loads at positions 1 and 2 d1 and d2 = beam opening displacement at positions 1 and 2 ∆A = area between loading and unloading curves
FIGURE 4-5. LOAD-DISPLACEMENT PLOT FROM A TYPICAL LOADING/UNLOADING
DCB TEST By definition, the mode I strain energy release rate, GI, is:
dadU
bGI
1−= (4-6)
where: U = total strain energy stored in the specimen Figure 4-5 displays that the change in energy due to crack extension, dU/da, is equivalent to the shaded area, ∆A. For a linear elastic specimen, linear elastic fracture mechanics (LEFM) can be used to compute, for a small change in displacement and load, the energy change:
)(21 dPdddPdAdU ⋅−⋅==− (4-7)
Make note to not confuse the derivative operator, d, with the opening displacement d (therefore, dd represents a minimal change in opening displacement d, not d2). Substituting equation 4-7 into equation 4-6 results in:
)(
21
)(11
dadPd
daddP
b
dadA
bdadU
bGI
−=
−−=−= (4-8)
Note that the equations thus far have been based on differentials, not on finite crack extensions and load changes. This analysis holds for very small changes in d and P where the portion of the load-displacement curve can be approximated as a straight line. If the entire crack advancement portion of the plot can be approximated as a straight line, then equation 4-8 can be rewritten in
4-8

terms of experimentally derived variables, producing equation 4-9. Appendix D1.11 of reference 44 discusses this approximation further, including the subjectivity of deciding which data point to decide to use to best represent the curve and produce accurate results.
)(2
11221 dPdP
abGIc −
∆= (4-9)
At this point, the strain energy release rate, GI, has been changed to the critical strain energy release rate, GIc, indicating measurement of the critical input energy at which the crack advances. Because each specimen provides several load, displacement, and crack measurements, several GIc values per test can be generated. The more values generated, the more chance of generating a statistically valid average value that represents the bonded specimen accurately:
∑=
−∆
=n
iiiiiIc dPdP
abnG
11221 )(
211 (4-10)
4.5.3 The Modified Beam Theory Method.
To verify the validity of the area method, the MBT technique was employed, as detailed in ASTM D 5528 [7, 28, 59, and 62]. As indicated by the name, the Modified Beam Theory method is based upon beam theory, which involves an inadequate assumption. Equation 4-11 describes the deflection of a cantilever beam. Note that these calculations require only one data point each, while the area method requires pairs, allowing for more data points per specimen and removing some of the subjectivity in determining which pairs of data points best present a straight line in the curve. (4-11) 3BPad =
where: constbhE
Bb
== 3
8
where: Eb = effective bending modulus of one beam Assuming the DCB sample has linear elastic cantilever beams clamped at their ends, the opening displacement can be substituted into equation 4-8 to produce
baPd
baBP
dadPBPa
daBPadP
bGI
23
23
))((21
22
33
=
=
−=
(4-12)
4-9

The assumption that the specimen is a pair of ideal cantilever beams is incorrect. In an ideal beam, the compliance vs crack length plot crosses the origin. Unlike an ideal cantilever beam, the DCB’s beams are not clamped rigidly at their base—there is significant rotation at their clamped ends. Thin specimens also experience significant effective beam shortening at large deflections and at large crack lengths, resulting in inflated calculated GI values. Because of the rotation, a plot of compliance versus crack length does not go through the origin (the point where zero crack length gives zero compliance). The crack length, a, must be offset by a value ∆ to correct equation 4-12 into 4-13 [28, 58, and 61]:
GPd
b aI =+
32 ( )∆
(4-13)
where: ∆ = crack correction offset factor The offset ∆ is determined experimentally for each specimen by plotting compliance1/3 vs crack length, performing a linear least squares plot, and finding the x-axis intercept (figure 4-6). The excellent curve fits obtained in this study validate the accuracy of the determination of the correction factor and GIc. Because an excellent fit was obtained for every sample, this also validates the one-sided, optical tick-mark measurement method for determining the crack tip location (section 4.8).
Vacuum bag, grit blast, paste adhesive, delta=0.379928"
y = 0.0558x + 0.0212
0.00 0.05 0.10 0.15 0.20 0.25 0.30
-1 0 1 2 3 4 5 Crack Length (in)
Com
plia
nce^
1/3
(in/lb
)^1/
3
↑ ∆
FIGURE 4-6. TYPICAL COMPLIANCE1/3 VS CRACK LENGTH PLOT TO FIND CRACK
OFFSET FOR MBT METHOD As mentioned above, the area method produces higher GIc results than MBT. The results of reducing the same DCB data by both methods is in table 4-3, where RF and VB denote bonded surfaces that had been cured against a nylon release fabric and a polytetrafluoroethylene (PTFE) vacuum bag material, respectively. In three out of four test conditions, the area method produces larger GIc values. The standard deviation in the fourth test condition is so large that the two methods’ averages are essentially equal (the large scatter reveals the poor surface preparation in
4-10

that group). Despite the differences in the computed data, the results of the two techniques are within a few percentage points of each other, which shows both methods are acceptable.
TABLE 4-3. DOUBLE CANTILEVER BEAM AREA VS MBT CRITICAL STRAIN ENERGY RELEASE RATE TEST RESULTS, PASTE ADHESIVE
Surface Preparation
Reduction Method RF – RF* no blast RF – RF blast VB** – VB no blast VB – VB blast
AREA GIc: in-lb/in2 1.244 ±0.144 2.412 ±0.896 2.410 ±0.464 3.086 ±0.198
MBT GIc: in-lb/in2 1.174 ±0.224 2.560 ±1.565 2.328 ±0.516 2.843 ±0.326
*RF = Release fabric **VB = Vacuum bag
4.5.4 The Compliance Method.
The compliance method is also based on beam theory and LEFM [34, 62, and 70]. Compliance is the basis of the area method, but the actual compliance measurements are not a part of the data reduction. The compliance method is based upon equation 4-14, similar to equation 4-12:
dadC
bPGI 2
2
= (4-14)
This method involves computing compliance from the load-displacement plot, performing differentiation (the slope of compliance vs crack length), and substituting into equation 4-14. The plot is often curve-fit with one or more polynomials to simplify the differentiation. To obtain the critical strain energy release rate, GIc, one needs to use data points corresponding to the onset of crack extension. The compliance method was not employed in this study not only because of the extra curve fitting and differentiation steps but because of the subjectivity and difficulty of curve fitting, especially with extremely irregular, jagged plots. 4.5.5 The Load Method.
The final LEFM approach is the load method, very similar to the others [62 and 70]. Expanding on the definition of compliance, one can use simple beam theory to produce equation 4-15:
IE
aPdC
b32 3
== (4-15)
where: I = beam’s moment of inertia = 3
121 bh
4-11

Because the flexural modulus of the carbon fiber adherend is much greater than that of the adhesive, Ea, then equation 4-15 can be rewritten as:
3
38hbE
aCb
= (4-16)
Substituting equation 4-16 back into equation 4-14 results in:
bb
I EhbaP
IbEaPG 32
2222 12== (4-17)
The main drawback to this method is that the bending, or flexural, modulus of the beam adherends is a required input variable. This information may not be available or may vary from specimen to specimen, influencing test results adversely. 4.6 TRAVELING WEDGE.
The traveling wedge test is not as well established as the DCB and static wedge tests, yet it is very similar. In recent years, it has been used successfully on bonded polymers and glasses [68 and 69]. All of the traveling wedge tests and analyses performed in this research were on specimens with a constant cross section (figure 4-7).
d a h 2t
b=widthv
Legend: d = opening displacement between beams at point of load application v = velocity of traveling wedge a = crack length (from point of load application to crack tip) b = width of sample h = height of each of the two identical beams t = half of bond thickness
FIGURE 4-7. TRAVELING WEDGE TEST METHOD SETUP
Traveling wedge tests are an attractive alternative to DCB for several reasons. • No special fixturing hardware (hinges or holed blocks) is needed. These fixtures, bonded
to the specimen and pulled, are often a weak link in the specimen and may break prematurely. To attach this hardware, one must perform additional surface preparation on the outside, and these surfaces must be smooth and flat.
4-12

• Correction factors to account for stiffening due to the fixturing hardware are not required. The fixturing hardware, especially the blocks, artificially stiffens the beam arms. Correction factors have been derived [62, 71, and 72] but add complexity.
• Only the crack length needs to be measured during a test. Because of this simplicity, the
test can be automated easily, allowing for extremely slow, quasi-static wedge velocity, which will eliminate any possible adhesive strain rate behavior effects.
• A simple benchtop rig can be used to drive the wedge while crack measurement data is
taken manually or automatically. If no such machine is available, the test can be performed manually by inserting a wedge, measuring the crack length, manually advancing the wedge, or measuring the crack length until the specimen fails.
Drawbacks to the traveling wedge include the following. • The traveling wedge test is relatively new and not much literature or data is available,
especially for materials in this study. • The wedge damages the postfracture surfaces as it scrapes along them. This hinders
SEM or other fracture surface analyses. Fortunately, the last portion of the specimens, over which the wedge has not passed, remains untouched.
• Large contours on the fracture surface can cause an effective increase in wedge thickness,
i.e., an interfacial failure in a thick bond can jump from one interface to the other and immediately back, leaving a peak on one side and a valley in the other. As the wedge passes over these features, it lifts on the peak and spreads the specimen farther apart (figure 4-8), lowering the measured GIc values. An initial traveling wedge test was adapted from another research project. The wedge was a razor blade not much thicker than the paste adhesive bondline, leading to significant effective wedge thickness changes. The thicker wedge used in subsequent tests was not as susceptible to thin-film adhesive bond contours.
FIGURE 4-8. WEDGE PASSING OVER FRACTURE SURFACE CONTOURS, CHANGING ITS EFFECTIVE THICKNESS
Because of the short crack lengths involved and the stiff adherend beams, it was assumed that all of the elastic energy in the system came from simple linear elastic beam bending and not from any energy stored ahead of the crack tip.
4-13

The mode I stress-intensity factor, KIc, can be determined from simple beam theory in an energy rate analysis of slender rods in a DCB-style arrangement (equation 4-18), assuming a>>h [73]. Because of the plane stress relationship between KI and GI (equation 4-19), GI as a function of d follows as equation 4-20. A general form of this (equation 4-21) can be used for asymmetric specimens [64]. This approach gives a good approximation for long cracks but overestimates GI for short cracks, typical of joints with strong interfaces such as those obtained with the high-performance adhesives used in this research.
KdEhaI =
34
32
2 (4-18)
E
KG II
2
= (4-19)
Gd Eh
aI =316
2 3
4 (4-20)
)(8
33
223
114
322
311
2
hEhEahEhEdGI +
= (4-21)
where: KI is the crack tip stress-intensity factor
E1 and E2 are the Young’s moduli of the two adherends h1 and h2 are the heights of the two cantilever beams a is the crack length
Creton, et al. present a more accurate approximation based on Kanninen’s work. It states that for a specimen where the uncracked ligament is greater than the total specimen thickness, equation 4-22 defines the stress-intensity factor [74], thereby producing equation 4-23 [68].
KdEhaI
ha
ha
ha
ha
=+
+ + +32
1 0 641 192 122 0 39
32
2 2
. ( ). ( ) . ( ) . ( )3 (4-22)
)(8
33
13
223
23
11
21
322
22
311
4
322
311
2
ChEChEChEChE
ahEhEdGI +
+= (4-23)
where: ahC 1
1 64.01+= ahC 2
2 64.01+=
Simplifying equation 4-23 gives equation 4-24 when the specimen is symmetric. As mentioned above, if data is taken at crack advance, the GI value is actually GIc, the desired calculated test value. Equation 4-24 was used for all traveling wedge tests in this study.
4-14
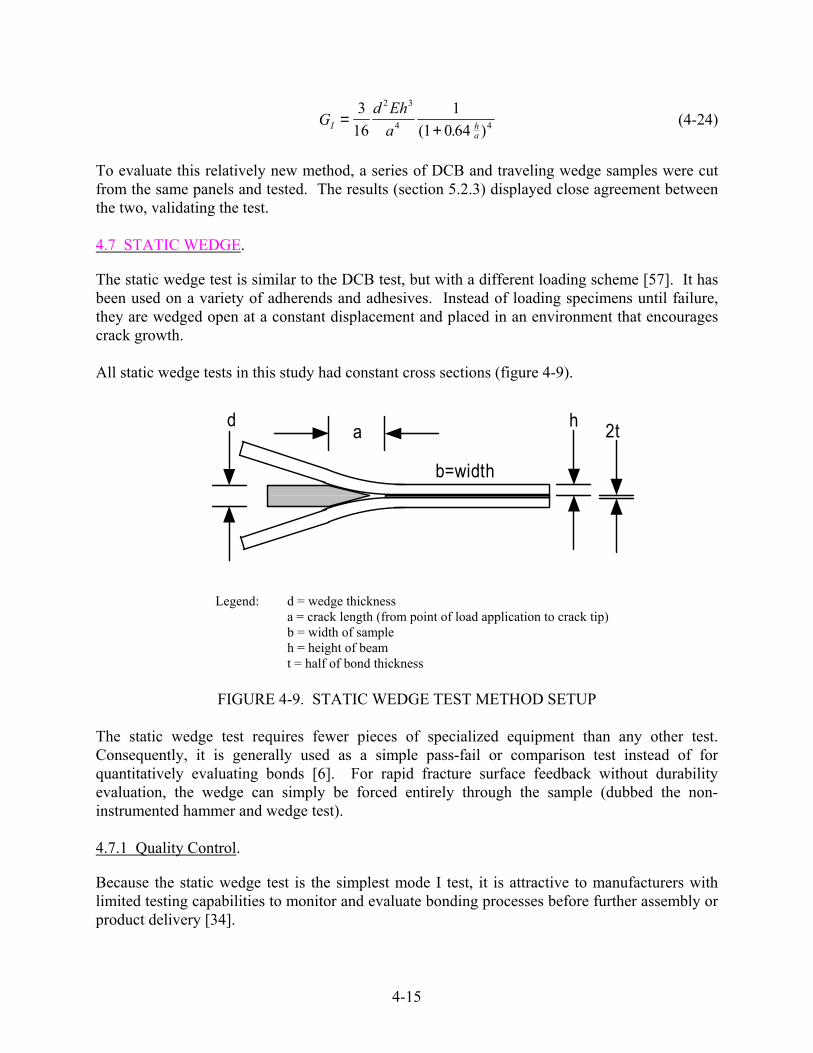
Gd Eh
aI ha
=+
316
11 0 64
2 3
4 ( . )4 (4-24)
To evaluate this relatively new method, a series of DCB and traveling wedge samples were cut from the same panels and tested. The results (section 5.2.3) displayed close agreement between the two, validating the test. 4.7 STATIC WEDGE.
The static wedge test is similar to the DCB test, but with a different loading scheme [57]. It has been used on a variety of adherends and adhesives. Instead of loading specimens until failure, they are wedged open at a constant displacement and placed in an environment that encourages crack growth. All static wedge tests in this study had constant cross sections (figure 4-9).
d a h 2t
b=width
Legend: d = wedge thickness a = crack length (from point of load application to crack tip) b = width of sample h = height of beam t = half of bond thickness
FIGURE 4-9. STATIC WEDGE TEST METHOD SETUP
The static wedge test requires fewer pieces of specialized equipment than any other test. Consequently, it is generally used as a simple pass-fail or comparison test instead of for quantitatively evaluating bonds [6]. For rapid fracture surface feedback without durability evaluation, the wedge can simply be forced entirely through the sample (dubbed the non-instrumented hammer and wedge test). 4.7.1 Quality Control.
Because the static wedge test is the simplest mode I test, it is attractive to manufacturers with limited testing capabilities to monitor and evaluate bonding processes before further assembly or product delivery [34].
4-15
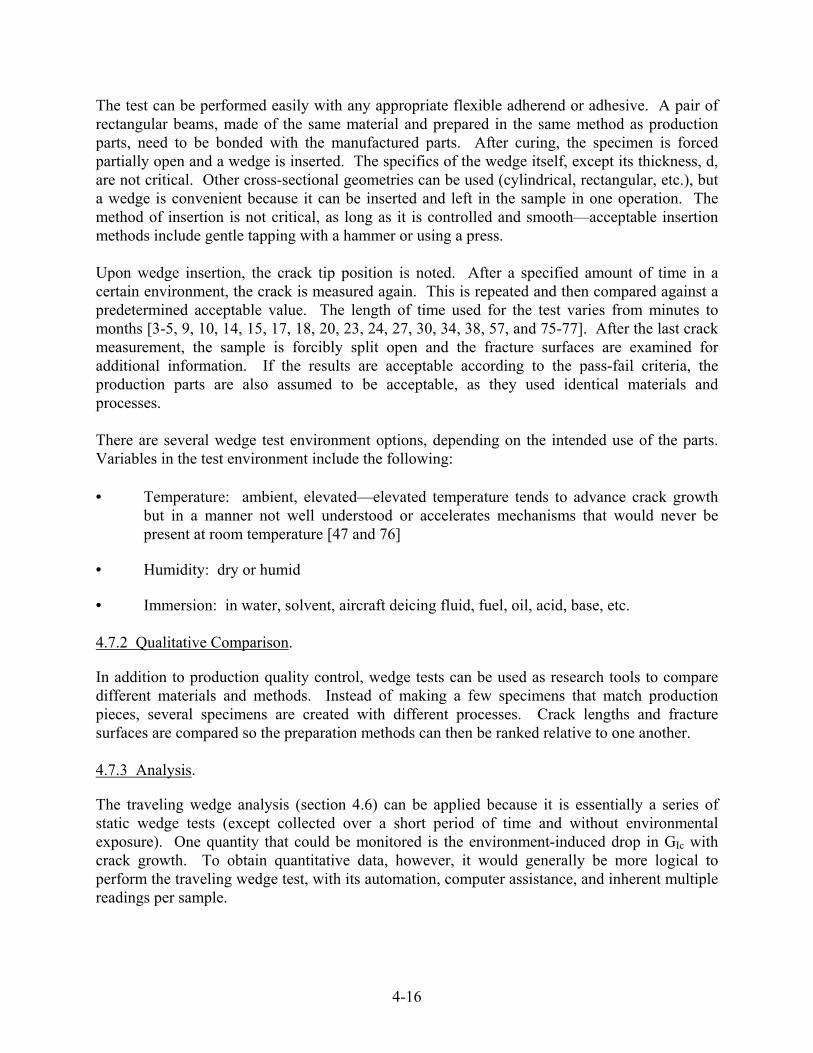
The test can be performed easily with any appropriate flexible adherend or adhesive. A pair of rectangular beams, made of the same material and prepared in the same method as production parts, need to be bonded with the manufactured parts. After curing, the specimen is forced partially open and a wedge is inserted. The specifics of the wedge itself, except its thickness, d, are not critical. Other cross-sectional geometries can be used (cylindrical, rectangular, etc.), but a wedge is convenient because it can be inserted and left in the sample in one operation. The method of insertion is not critical, as long as it is controlled and smooth—acceptable insertion methods include gentle tapping with a hammer or using a press. Upon wedge insertion, the crack tip position is noted. After a specified amount of time in a certain environment, the crack is measured again. This is repeated and then compared against a predetermined acceptable value. The length of time used for the test varies from minutes to months [3-5, 9, 10, 14, 15, 17, 18, 20, 23, 24, 27, 30, 34, 38, 57, and 75-77]. After the last crack measurement, the sample is forcibly split open and the fracture surfaces are examined for additional information. If the results are acceptable according to the pass-fail criteria, the production parts are also assumed to be acceptable, as they used identical materials and processes. There are several wedge test environment options, depending on the intended use of the parts. Variables in the test environment include the following: • Temperature: ambient, elevated—elevated temperature tends to advance crack growth
but in a manner not well understood or accelerates mechanisms that would never be present at room temperature [47 and 76]
• Humidity: dry or humid
• Immersion: in water, solvent, aircraft deicing fluid, fuel, oil, acid, base, etc. 4.7.2 Qualitative Comparison.
In addition to production quality control, wedge tests can be used as research tools to compare different materials and methods. Instead of making a few specimens that match production pieces, several specimens are created with different processes. Crack lengths and fracture surfaces are compared so the preparation methods can then be ranked relative to one another. 4.7.3 Analysis.
The traveling wedge analysis (section 4.6) can be applied because it is essentially a series of static wedge tests (except collected over a short period of time and without environmental exposure). One quantity that could be monitored is the environment-induced drop in GIc with crack growth. To obtain quantitative data, however, it would generally be more logical to perform the traveling wedge test, with its automation, computer assistance, and inherent multiple readings per sample.
4-16

The only critical decision is to avoid inserting a wedge that is so thick that it will cleave the sample entirely or almost entirely (not leaving enough room for crack growth). This is generally not an issue, provided that the bond and wedge thicknesses and materials are selected carefully. 4.8 CRACK FRONT X-RAY PHOTOGRAPHY.
Unfortunately, DCB and traveling wedge tests use optical observation of the crack tip against a hand-drawn set of tick marks on one side of the specimen (the static wedge test is an exception because it requires no test machine, so the specimen can be handled and observed easily on both sides). Equipment limitations prevent practical simultaneous observation on both sides of the sample. If the crack front is not straight and perpendicular to its direction of travel, the measured tip may not represent the true crack front. Consistency in test-derived GIc values, which rely upon dependable crack measurement, suggests that the current method of crack tip measurement is adequate. Therefore, the crack fronts in these specimens are likely to be relatively straight and normal to the crack propagation direction. This postulate was evaluated by X-ray photography. Specimens were wedged open to advance their cracks partially. Then, a water/zinc iodide (ZnI2) solution was injected into the crack tip and X-ray photos (figure 4-10) were taken in an Astrophysics Research Corporation Torrex 120D. The specimens used in these images were [0]22 IM7/8552 bonded with EA9394 adhesive, cut from existing DCB and traveling wedge test specimens (appendices D1 and E1 of reference 44).
(b) (c) (a)crack propagation direction →
FIGURE 4-10. X-RAY PHOTOGRAPHS OF CRACK FRONTS (a) 0.983-in.-WIDE
SPECIMEN, FRESHLY CRACKED, (b) 0.425-in.-WIDE SPECIMEN, FRESHLY CRACKED, AND (c) 0.425-in.-WIDE SPECIMEN, ONE WEEK OF
EXPOSURE TO NATURAL ENVIRONMENT The crack fronts in figures 4-10(a) and 4-10(b) are relatively linear but slightly diagonal on one side. In figure 4.10(a) the crack front is 0.136 in. ahead of the other across its 0.983-in. width; while in figure 4-10(b), the crack varies by 0.053 in. across 0.425 in., giving crack advancement-to-crack width ratios of 0.138 and 0.125. These can also be expressed as 7.88° and 7.11° angles (where 0° is defined as straight across the sample). These angles are considered to be relatively minor and insignificant sources of potential test data error, especially considering measurement accuracy and resolution inherent in optical crack length measurement and the intrinsic material and joint variability.
4-17

The front in figure 4-10(c) shows effects of natural environmental degradation over one week—the crack advanced noticeably on the edges where it was exposed to ambient humidity. Note that figure 4-10(a) also exhibits this curvature, but it is more localized than in figure 4-10(c) and the overall crack shape is roughly linear, or even concave (the center has advanced farther than the edges). Note that these samples experienced interfacial bond failure, so they were susceptible to environmental exposure [1, 6, 7, 9-11, 14-18, 21, 25, 27, 28, 30, 35, 38, 47-49, 57, and 76]. Because of the excellent consistency in DCB and traveling wedge tests and the agreement between the two and as a result of the crack front X rays, it is concluded that the combination of materials and geometries used in this research produces adequately straight crack fronts. Consequently, optical measurement of crack tips by examination of one side of the specimen was justified and used. Note that care must be taken in using the H2O/ZnI2 solution because the water can cause rapid joint degradation during photography, especially with poorly prepared surfaces. Photographs should be taken immediately after injection—X rays in this research were taken no longer than 5 to 10 minutes after injection. 4.9 SUMMARY.
This section describes only some of the methods used to measure bond durability. Additional methods include the climbing drum peel test, tensile butt tests, adhesive scrape tests, and mode II configurations like the single and double lap shear. As in any experiment, there is no one test that works for all combinations of materials, geometries, and processes and puts out usable results. One must pick the method best suited to the project and modify it to conform to the study’s needs. For this work, DCB and wedge tests proved to be most useful for evaluating long-term bond durability. Each contributed to the study of prebond surface preparation problem in different ways. DCB and traveling wedge tests provided short-term GIc data, providing rapid feedback on the effects of different preparation methods. Static wedge tests provided long-term durability data in a relatively short period of time, though differences between different samples were less pronounced. Traveling wedge tests were extremely easy to prepare and conduct, but produced slightly more scatter than the DCB, which required labor-intensive fixtures and preparation but tended to provide more consistent results when performed properly. Because of the volume of specimens that were created and tested, the traveling wedge test was used for the majority of the experimental work herein. The remaining tests discussed were of no, or little, value in this study. The floating roller peel test was not acceptable with the materials used. The noninstrumented hammer and wedge version of the static wedge test and X-ray photography were useful and quick-processing aids but were of less research value. They complemented the other tests and the processing of specimens.
4-18

Table 4-4 summarizes these final notes.
TABLE 4-4. SUMMARY OF TEST METHODS
Test Method Value(s) measured Pros Cons Notes
Mode II tests Apparent shear strength, failure mode
Much reference data available, simple, specimens loaded similarly to actual structures
Mode I exists despite desired mode II configuration, does not predict service performance
Not well-suited for bonded joint durability testing
Floating roller Peel load, failure mode
Relatively simple Requires plastically deforming thin adherends to operate properly
Used as a quality control method for metals, poorly suited to composites
DCB GIc, failure mode, failure load
Straightforward, widely accepted
Complicated fixtures, does not directly predict durability
Excellent test for measuring GIc of bonded joints in general
Traveling wedge GIc, failure mode, cleavage force
Simpler fixtures and setup than DCB
Requires accurate crack length measurement, wedge disturbs fracture surface, does not directly measure long-term durability
Best test for measuring GIc of bonded joints in general
Static wedge Environmental durability, failure mode
Easy, cheap, predicts durability, no special equipment
May require test chamber, test time can be lengthy
Best method to assess durability quickly
Noninstrumented hammer and wedge
Failure mode Easy, cheap, quick Provides no quantitative value
Excellent for quick, qualitative feedback on processing methods
X-ray photography
Crack front shape
Visualizes crack fronts in opaque materials for analysis validation
Expensive machinery, purely qualitative
If available, helpful to confirm testing/ analysis/assumptions
4-19/4-20

5. RESULTS AND DISCUSSIONS.
This section covers the results from the various test methods used to evaluate adhesively bonded composite joints, as well as interpretation of the data. 5.1 INTRODUCTION.
Because several different factors affect the bonding process, no single test can provide a complete assessment of surface preparation. Thus, several tests were conducted to assess different aspects of surface preparation quality. Strength and fracture tests were performed on paste and film joints, and microscopy and chemical analyses were conducted on sample adherends. Some tests were more successful than others in ranking surface preparation methods or predicting bond durability. 5.2 PASTE ADHESIVE TESTS.
Floating roller peel, DCB, and traveling wedge tests were performed on joints bonded with paste adhesive. After determining that the floating roller peel test was poorly suited to composites, DCB tests were used, then new traveling wedge test was developed as a less complicated, more reliable replacement for the DCB. 5.2.1 Floating Roller Peel Test Results.
Floating roller peel tests were performed on eight-ply fiberglass adherends bonded to two-ply adherends with paste adhesive. Despite calculations (appendix C1.1 of reference 44) to ensure that the thin adherend would not fracture when it was bent to conform to the roller (figure 5-1(a)), there were problems using these materials with this test. The thin adherends did not conform to the roller as desired when they were pulled from the thick adherends. Instead, they bent elastically like a spring and overly advanced the thick adherend through the fixture, rather than deforming plastically (and not springing the thick adherend forward) as a thin sheet of aluminum (0.025 in. is specified) would (figure 5-1(b)). The radius of curvature along the roller was greater than ideal but still too small in the vicinity of the crack tip. This portion of the specimen bent so tightly that the thin adherend fractured before the bond broke properly.
P P
(a) (b) FIGURE 5-1. FLOATING ROLLER TEST CONFIGURATIONS (a) IDEAL BEHAVIOR, AS
EXPECTED WITH ALUMINUM THIN ADHEREND AND (b) OBSERVED ACTUAL BEHAVIOR WITH COMPOSITE THIN ADHEREND
5-1

All nine specimens experienced premature adherend failure. Even in conditions when the fracture was progressing stably, the test did not produce consistent, usable load-displacement data (appendix C2.3 of reference 44). Thus, this test was abandoned in favor of other mode I tests that do not require such extreme strain on the adherends to fracture the bond. 5.2.2 Double Cantilever Beam Test Results.
This test produces a load-displacement plot, a failure mode, and a GIc value, each of which contributes to the assessment of the joint. Results from these three groups of information are discussed below. Four different paste adhesive DCB specimen types were tested: adherends with surfaces cured against a nylon release fabric or a PTFE vacuum bag, each cure further divided to grit blasted or not blasted. The vacuum bag was expected to produce a smooth, relatively chemically inert finish (some fluorine was expected to transfer). The release fabric was coated heavily with silicone and siloxane release agents (determined in an analysis by Precision Fabrics Group), leaving a textured impression on the adherend surface containing a high concentration of release agents. Figure 5-2 shows four typical load-displacement plots, one from each of the four groups. It is immediately apparent that the vacuum bag surface bonds achieved a higher load before the first crack advance and that the specimens achieved larger opening displacements before complete failure. Note that the release fabric surfaces produced jagged behavior while vacuum bag surfaces showed smooth, continuous crack growth. All of these features indicate that bonding against vacuum bag-cured surfaces resulted in stronger bonds than their release fabric counterparts.
FIGURE 5-2. SAMPLE LOAD-DISPLACEMENT PLOTS FROM PASTE ADHESIVE DCB TESTS
release fabric-relase fabric, no blast
0
10
20
30
40
50
0 0.1 0.2 0.3 0.4 0.5
opening disp (in)
load
(lb)
release fabric-release fabric, blast
0
10
20
30
40
50
0 0.1 0.2 0.3 0.4 0.5
opening disp (in)
load
(lb)
vacuum bag-vacuum bag, no blast
0
10
20
30
40
50
0 0.1 0.2 0.3 0.4 0.5
opening disp (in)
load
(lb)
vacuum bag-vacuum bag, blast
0
10
20
30
40
50
0 0.1 0.2 0.3 0.4 0.5
opening disp (in)
load
(lb)
5-2

Effects of blasting are immediately clear. Prebond blasting resulted in higher initial failure loads and slightly increased the maximum opening displacements for release fabric surfaces. It did not significantly change this value for vacuum bag surfaces. Blasting did not change crack growth behavior, implying that the failure mode was unchanged, as confirmed below. Failure mode, determined by visual fracture surface examination, reveals a crucial aspect; whether or not the adhesive-adherend interface was weaker than the adhesive or adherend. The fracture surface images (figure 5-3) revealed that release fabric surfaces, blasted or not, produced interfacial failures from poor preparation.
Specimen ID and Notes Fracture Surface Scan
1&2-1: release fabric, no blast • Purely interfacial failures
1&2g-1: release fabric, blast • Purely interfacial failures
3&4-1: vacuum bag, no blast • cohesive/interlaminar failures
3&4g-1: vacuum bag, blast • cohesive/interlaminar failures
FIGURE 5-3. FRACTURE SURFACE SCANS FROM PASTE ADHESIVE DCB TESTS
Grit blasted or not, vacuum bag surfaces exhibited cohesive and interlaminar failure. The crack commenced propagating through the bondline, leaving adhesive on both sides of the joint, then it partially traveled into one adherend and continued between plies at a pre-existing adherend flaw, where the interlaminar fracture toughness was less than the bond interface’s. Indeed, Hysol reports that EA9394’s GIc is 5.83 in-lb/in2, while the manufacturer of IM7/8552 notes an interlaminar GIc of 1.33 in-lb/in2; thus, as the crack seeks the path of least resistance, it will enter the adherend if possible and remain there, as seen in figure 5-3. Given the chemical contamination issues, the difference between release fabric and vacuum bag surfaces is not surprising. However, it is interesting that blasting did not improve the mode of failure of the release fabric surfaces. This shows that although the blasting process improved the mechanical features of the surface and the load-displacement plots, it did not completely remove chemical contamination. This confirms that chemistry, not mechanics, is the critical factor for bond strength, perhaps even more so than in metals because of the low modulus of the plastic matrix, which makes keying and interlocking features less rigid. Also obtained from a DCB test is the GIc value. After data reduction using the area and MBT methods, trends between the four specimen types were compared (figure 5-4) and they matched the fracture mode and load-displacement results excellently.
5-3

GIc: Area vs. MBT Methods(error bars are standard deviation)
0.0 1.0 2.0 3.0 4.0 5.0
rf-rf
no
blas
t
rf-rf
blas
t
vb-v
b
no
blas
t
vb-v
b bl
ast
Specimen Type
GIc
(in-
lb/in
2 ) Area Method MBT Method
FIGURE 5-4. GIc VALUES FROM PASTE ADHESIVE DCB TESTS As expected, vacuum bag surfaces produced bonds with higher GIc values than release fabrics. Blasting improved the values, more for the release fabric specimens because there was more room for improvement with these contaminated surfaces. As dictated by Whitney, the area method indeed produces higher values than the MBT method [59]. The exception was the grit-blasted release fabric specimens, but the variation in the values for this group was so great that the slight difference is negligible. This high variation shows the large performance difference between specimens that received more blasting than others. Of interest is the fact that, according to the average GIc values, grit-blasted release fabric bonds performed as well as nonblasted vacuum bag bonds, but the standard deviation is approximately three times greater. As previously mentioned, consistency is as important to industry as bond strength or durability. GIc data must also be used in conjunction with failure mode data. Although both groups have the same average GIc, the vacuum bag surfaces produced cohesive/interlaminar failures, while the grit-blasted release fabric surfaces gave interfacial fractures. Finally, as mentioned above, Dexter Hysol reports a GIc of 5.83 in-lb/in2 for EA9394 paste adhesive from DCB tests on aluminum adherends, while the best bonds in this study produced a GIc of about 3 in-lb/in2. This is a result of the cracks wandering from the bond to the adherends, where the interlaminar GIc is only 1.33 in-lb/in2. Therefore, these tests produced intermediate values between adhesive and adherents, etc. 5.2.3 Traveling Wedge Test Results.
Because of the similarity between the DCB and traveling wedge tests, the results and analyses are also similar. This test proved much more straightforward than the DCB, but it was unproven for this class of materials. Thus, a series of validation tests were first run to confirm that it could produce equivalent results.
5-4

With nonblasted release fabric and vacuum bag specimens cut from the same panel, the traveling wedge and DCB test samples exhibited the same failure modes. Because of a change in surface preparation from the previous tests discussed above (omission of the Scotch-Brite scrubbing), all samples produced interfacial failures. The two methods’ load-displacement plots are too different to compare directly. Load decreases with increasing crack growth in a DCB test but remains relatively constant in the traveling wedge test, and the loads are different: opening vs wedging. However, they all exhibit similar crack growth behavior (figure 5-5).
DCB, rf-rf, no blast
5
10
15
20
25
30
0 0.1 0.2 0.3 0.4 0.5
opening disp (in) lo
ad (l
b)
travelling wedge, rf-rf, no blast
5 10 15 20 25 30
0 1 2 3
wedge location (in)
wed
ge lo
ad (l
b)
travelling wegde, vb-vb, no blast
0 5
10 15 20 25 30
0 1 2 3wedge location (in)
wed
ge lo
ad
DCB, vb-vb, no blast
05
1015202530354045
0 0.1 0.2 0.3 0.4 0.5
opening disp (in)
load
(lb)
00
FIGURE 5-5. SAMPLE LOAD-DISPLACEMENT PLOTS FROM PASTE ADHESIVE DCB
VS TRAVELING WEDGE TESTS GIc values obtained on identical specimens with the two test methods agreed closely (figure 5-6). The standard deviation for traveling wedge results was greater than for DCB because the only input into its reduction equation is crack length raised to the fourth power (equation 4-22), amplifying data acquisition inaccuracies. After viewing the GIc values, failure modes, and load-displacement plots, the traveling wedge test was validated. Because it is more attractive from specimen preparation and test operation standpoints, the traveling wedge test was employed for the surface preparation comparison tests that followed.
5-5

GIc: Traveling wedge vs. DCB(error bars are standard deviation)
0.0 0.5 1.0 1.5 2.0 2.5
rf-rf
no
blas
t
vb-v
b no
bl
ast
Specimen Type
GIc
(in-
lb/in
2 ) Traveling wedge DCB
FIGURE 5-6. GIc VALUES FROM PASTE ADHESIVE TRAVELING WEDGE VS DCB TESTS
5.3 FILM ADHESIVE TESTS.
Because of difficulties and variations in processing paste adhesive, film adhesive was used for the majority of the tests in this study because it removes several possible variables like bond thickness and adhesive distribution. Additionally, film adhesive is more typical of commercial transport-bonded structures and its use, in addition to paste, broadens and generalizes the results of the tests herein. Initial floating roller peel tests were performed with cocured film adhesive joints, later followed by traveling and static wedge studies, single lap shear tests, as well as SEM, EDS, and XPS of prepared adherends. 5.3.1 Floating Roller Peel Test Results.
The floating roller peel test was used on specimens made of eight plies of woven carbon fiber/epoxy cocured to one more woven ply (appendices C1 and C2 of reference 44). These specimens performed like the paste adhesive ones—the thin adherends did not conform to the roller (figure 5-1) and fractured before the crack progressed. Only one of the six specimens produced a usable amount of data, but the load-displacement plot generated was not smooth enough to allow analysis. As mentioned previously, because this test method was not able to produce usable data, it was abandoned. 5.3.2 Traveling Wedge Test Results.
The traveling wedge test proved well-suited to cleaving bonded joints and producing usable data. After validation, this test was used for the surface preparation comparison that concentrated on the effects of peel plies, release films, release fabrics, and grit blasting on bond strength.
5-6

As with DCB tests, three pieces of information were provided by the traveling wedge test that contributed to bond assessment: load-displacement plots, fracture surfaces, and GIc values. These load-displacement plots (figure 5-7) are not as valuable as the DCB tests because they are less smooth and less clear. However, load and failure displacement values can be used to compare different samples.
FEP2-1
0
10
20
30
40
50
0 1 2 3
wedge location (in)
wedg
e lo
ad (l
b)
4
NAT2-2
0
10
20
30
40
50
0 1 2 3 4
wedge location (in)
wedg
e lo
ad (l
b)
FEPg1-2
0
10
20
30
40
50
0 1 2 3 4
wedge location (in)
wedg
e lo
ad (l
b)
NATg2-5
0
10
20
30
40
50
0 1 2 3 4
wedge location (in)
wedg
e lo
ad (l
b)
SRB1-3
0
10
20
30
40
50
0 1 2 3 4
wedge location (in)
wedg
e lo
ad (l
b)
VLP2-1
0
10
20
30
40
50
0 1 2 3 4
wedge location (in)
wedg
e lo
ad (l
b)
SRBg2-3
0
10
20
30
40
50
0 1 2 3 4
wedge location (in)
wedg
e lo
ad (l
b)
VLPg2-3
0
10
20
30
40
50
0 1 2 3
wedge location (in)
wedg
e lo
ad (l
b)
4
FIGURE 5-7. SAMPLE LOAD-DISPLACEMENT PLOTS FROM FILM ADHESIVE TRAVELING WEDGE TESTS
5-7

In all cases when a sample was blasted, the load required to drive the wedge through the bondline increased greatly, peaks are up to an order of magnitude higher than mean load values from unblasted samples. This is an indication of a stronger bond and its associated shorter crack length.
The first result from the traveling wedge testing was that crack growth behavior in all nonblasted specimens was smooth and regular, while blasting produced jagged load-displacement plots, indicating unstable growth. Grit blasted specimens required up to 2.5 in. greater wedge travel to cleave them completely, indicating a stronger bond and shorter crack. Without blasting, a NAT bond required the greatest cleavage force and fluorinated FEP required the least. Bonds made to surfaces cured against SRB and VLP required similar loads to cleave the joints. These trends follow the computed GIc values closely. Trends for the grit-blasted specimens also echo computed GIc values. Grit-blasted FEP required 28 lb, followed by NAT (20 lb), VLP (18 lb), and SRB (15 lb).
The second piece of information immediately available after testing was the failure surfaces. Interfacial failures indicated poor preparation, while cohesive or interlaminar failures were a result of strong adhesive-adherend interfaces. From observing fracture surface scans (figure 5-8), it was apparent that all nonblasted specimens failed interfacially—FM300-2K adhesive will not bond properly to the M73 matrix without blasting. When blasting was performed, the failure modes improved dramatically. Except for adherends cured against the SRB release fabric, all bonds to grit-blasted surfaces failed cohesively and interlaminarly. The SRB surfaces fractured interlaminarly and interfacially, indicating that the abrasion process did not remove all contaminants. However, as shown in the SEM images (section 5.4), the level of abrasion appears representative of best practice—further blasting would expose and damage the carbon fibers.
The third result of the traveling wedge tests was the GIc values (figure 5-9), computed from several crack length measurements per specimen (appendix E3.3 of reference 44). In excellent correlation with the GI results and the SEM images shown in figure 5-8, it follows that the nonblasted surfaces produce GIc values far lower than blasted ones. The NAT peel ply, which slightly cracks the matrix and deposits no release agents, produced the best of the nonblasted joints, with the mechanically calendered VLP peel ply close behind. Both FEP and SRB surfaces produced poor bonds—the entire specimen often split upon wedge insertion, making testing impossible. Note that the standard deviation of GIc values for nonblasted samples was relatively small—the surfaces produced by curing against these different materials were very consistent.
FEP release film, which produced the worst surfaces without blasting, created bonds that were at least twice as strong when blasted as the next best preparation method when grit blasted. Again, grit-blasted NAT and VLP provided similar, successful bonds. The grit-blasted SRB release fabric specimens required the least energy to fracture because the release agents were not completely blasted away, thereby producing partially interfacial failures.
Note that the standard deviations of grit-blasted samples were larger than the nonblasted counterparts. This is an expected result of variation in blasting (velocity and number of blast gun passes, etc.), which led to more randomness in surface textures and chemistry.
5-8

Specimen ID and Notes Failure Surface
Crack Propagation Direction → Specimen FEP 1-1 (unblasted) • Interfacial failures • White side paint seeped into bondline in
six of seven samples • Many had interfacial failure on both
interfaces (lighter patches)
Specimen FEP g1-5 (blasted) • Cohesive/interlaminar failures • Some cracks changed from cohesive to
interlaminar • White lines indicate crack fronts
Specimen NAT 1-2 (unblasted) • Interfacial failures • Two samples had a mis-inserted wedge,
giving interlaminar failure • White lines indicate crack fronts
Specimen NAT g2-1 (blasted) • Cohesive/interlaminar failures • White lines indicate crack fronts
Specimen SRB 2-2 (unblasted) • Interfacial failures • White side paint seeped into bondline in
five of six samples
Specimen SRB g1-1 (blasted) • Interfacial/interlaminar failures • White lines indicate crack fronts
Specimen VLP 2-3 (unblasted) • Interfacial failures • Many had interfacial failure on both
interfaces (lighter patches)
Specimen VLP g1-3 (blasted) • Cohesive/interlaminar failures • White lines indicate crack fronts
FIGURE 5-8. FRACTURE SURFACE SCANS FROM TRAVELING WEDGE TESTS
5-9

GIc, Traveling Wedge Surface Preparation Tests
(error bars are standard deviation)
0 2 4 6 8
10 12 14 16
FEP NAT SRB VLP
No Blast Blast
FIGURE 5-9. GIc VALUES FROM FILM ADHESIVE TRAVELING WEDGE TESTS 5.3.3 Static Wedge Test Results.
5.3.3.1 Neutral: pH=7.3.
Submersion of partially wedged samples in pH-neutral (7.3) room-temperature, deionized water over a period of up to 510 hours was intended to encourage crack growth in poorly bonded specimens as water attacked the adhesive-adherend interface. Crack growth was very short (figure 5-10), even for the specimens that performed poorly in other test methods. This indicated that either these specimens were well prepared and resistant to environmental attack or, more likely, that the materials used were inherently resistant to the environment chosen.
Crack growth, static wedge tests, pH=7.3(error bars are standard deviation)
0 0.05
0.1 0.15
0.2 0.25
0.3 0.35
0.4 0.45
0.5
F
Cra
ck G
row
th (i
n)
No Blast Blast
*
*sample
FIGURE 5-10. ST
EP NAT SRB VLP Specimen Type
s split before test
ATIC WEDGE TEST CRACK GROWTH IN pH 7.3 ROOM-TEMPERATURE, DEIONIZED WATER
5-10

Additional information not conveyed by the bar chart includes the following. 1. FEP: Four samples. There is no data displayed for growth of the four samples because
all the specimens had split completely and interfacially upon wedge insertion.
2. Grit-blasted FEP: Four samples. One of the specimens displayed significant cohesive growth. The other three cracks did not grow, resulting in the extremely large standard deviation shown in figure 5-10.
3. NAT: Four samples. These specimens gave the best crack growth performance—only two of the four samples’ cracks grew interfacially, and these by the least amount of any in the test.
4. Grit-blasted NAT: Three samples. Grit blasting the NAT samples reduced their performance somewhat—two cracks grew only slightly and one exhibited uncharacteristically large growth, though these growths were all cohesive.
5. SRB: Four samples. SRB samples performed like FEP samples—two specimens broke upon wedge insertion, the third broke almost entirely upon insertion and then fractured completely within two hours of exposure, and the fourth experienced large growth before stabilizing. Because only one sample was actually immersed and fully tested, there is no standard deviation. All growth was interfacial.
6. Grit-blasted SRB: Four samples. Blasting the SRB samples improved their performance greatly—all specimens’ cracks grew only slightly, but interfacially.
7. VLP: Four samples. These specimens performed poorly—one specimen broke entirely upon wedge insertion and three specimens’ cracks grew far more than any other category, all interfacially.
8. Grit-blasted VLP: Four samples. Blasting improved the VLP specimen performance greatly—two specimens did not grow, while the other two had short cohesive and interlaminar crack growth.
In addition to the crack growth behavior over time in an aggressive environment, the static wedge test, like other mode I tests used, provided meaningful data in the form of failure mode and crack length. Failure modes matched those from the traveling wedge tests, reinforcing previous assertions on surface preparation effects on the bond interface. When a wedge is inserted, the crack length can be used to compare specimens—the longer the crack, the weaker the bond. This length can be used to compute the strain energy release arrest rate, GIa, for each specimen, but this value is generally not used to quantify bond strength because it describes the arrest of crack growth, not its initiation. The traveling wedge test also provides crack length information, with the aid of instrumentation and more precise conditions, so it was better suited to this sort of measurement and computation. But, as expected, the crack lengths of both wedge test versions matched excellently, indicating that the same GIc trends could have been obtained from the static wedge test.
5-11

Except for NAT specimens that performed worse after blasting, even though the failure mode shifted from interfacial to cohesive, the general crack growth trends reinforced the traveling wedge GIc results closely. It is suspected that because the NAT surfaces are contaminant-free and had performed excellently, they are already resistant to hydration. However, blasting may increase the likelihood of trapping moisture or even adding contamination to the NAT-prepared surface. In the other three cases, contamination from the SRB release fabric, and overly smooth surfaces from the FEP release film and VLP peel ply, gave the blasting operation more opportunity for surface improvement. 5.3.3.2 Acidic: pH=2.9.
Because of the small crack growth (relative to crack length), the environment was changed to one that was expected to attack the bond interface more aggressively. The next bath solution used was room-temperature, deionized water with sulfuric acid added until the pH reached 2.9. Crack growth was monitored for 242 hours (figure 5-11).
Crack growth, static wedge tests, pH=2.9(error bars are standard deviation)
0.00 0.05 0.10 0.15 0.20 0.25 0.30 0.35 0.40 0.45 0.50
Cra
ck G
row
th (i
n)
No Blast Blast
* *
*samp
FIGURE 5-11. S
Exposure to the acidic sneutral one did. Details 1. FEP: Zero sam
specimens split u
2. Grit-blasted FEPgrowth. The oth
FEP NAT
Specimen Type
les split before tested
TATIC WEDGE TEST CRAC
TEMPERATURE, DEIONIZ
olution produced less environmon the eight groups of specimen
ples. There is no data displapon wedge insertion in the prev
: Four samples. Two specimer two did not grow, resulting in
5-12
SRB VLP
K GROWTH IN pH 2.9 ROOM-ED WATER
ent-induced crack growth than the pH-s follow.
yed for these samples because all the ious static wedge tests.
ens displayed relatively small cohesive a large standard deviation.

3. NAT: Four samples. The nonblasted NAT specimens exhibited no crack growth.
4. Grit-blasted NAT: Four samples. Blasting NAT samples reduced their performance greatly—two experienced growth far larger than any other and two had moderate growth, all cohesive.
5. SRB: One sample. The one specimen that survived the pH-neutral test broke interfacially upon wedge insertion for this test, so there is no data for this group.
6. Grit-blasted SRB: Blasting the SRB samples improved their performance greatly—two of the specimens had no growth, while the other two experienced minor growth, though still interfacial.
7. VLP: Three samples. One specimen broke completely and interfacially upon wedge insertion, while the other two showed significant interfacial crack growth, resulting in a large standard deviation.
8. Grit-blasted VLP: Four samples. These specimens’ cracks did not grow.
The acidic tests did not distinguish between different preparations as much as the pH-neutral ones—two groups (NAT and blasted VLP) did not grow, and all other growths but NATs were lessened. The unexpected NAT vs blasted NAT behavior seen in the pH-neutral test was exaggerated in the acid bath—nonblasted specimen cracks were stable but blasting caused enormous growth. The blasting process appeared to induce a mechanism where the acidic water attacked the bond more than neutral water did. However, although the only difference between the NAT and VLP peel plies was the calendering process, the VLP specimens performed conversely—blasting completely removed the minor crack growth experienced by the non-blasted ones. Mechanical effects appear to have been responsible, as the surface chemistries should be identical (as seen in XPS results in section 5.6)—the greater depth of the NAT peel ply impression in the adherend matrix may lead to more opportunities for moisture to enter and remain in a bond. 5.3.3.3 Basic: pH=11.7.
After examining growth in an acid, the specimens were placed in fresh, deionized water with enough sodium hydroxide to increase the pH to 11.7, and crack growth was monitored for 306 hours (figure 5-12).
5-13

Crack growth, static wedge tests, pH=11.7(error bars are standard deviation)
0.00 0.05 0.10 0.15 0.20 0.25 0.30 0.35 0.40 0.45 0.50
FEP* NAT SRB* VLP* Specimen Type
Cra
ck G
row
th (i
n)
No Blast Blast
*samples split before test
FIGURE 5-12. STATIC WEDGE TEST CRACK GROWTH IN pH 11.7 ROOM-
TEMPERATURE, DEIONIZED WATER Exposure to the base solution produced much less overall cracking than the acidic or neutral one. Details on the eight groups of specimens follow. 1. FEP: Zero samples. There is no data displayed for growth of nonblasted FEP samples
because all of the specimens split upon wedge insertion in previous tests.
2. Grit-blasted FEP: Four samples. One specimen displayed extremely small cohesive growth (hence the large standard deviation), while the other cracks did not grow.
3. NAT: Four samples. Two of the four nonblasted NAT specimens exhibited minimal interfacial crack growth, while the other two had none.
4. Grit-blasted NAT: Four samples. Blasting NAT samples reduced their performance, but only slightly—all experienced short cohesive crack growth.
5. SRB: 0 samples. There is no data displayed for the growth of nonblasted SRB samples because all the specimens split upon wedge insertion in previous tests.
6. Grit-blasted SRB: Four samples. Three grit-blasted SRB samples experienced minor interfacial crack growth, while the other had none.
7. VLP: 0 samples. There is no data for VLP samples because both split interfacially upon wedge insertion.
8. Grit-blasted VLP: Four samples. Two specimens’ cracks remained stable, while the other two grew slightly in a cohesive and interlaminar manner.
5-14

The tests in a base solution produced such minor crack advance data that they were of little value. This coincides with Bistac, et al.’s previous results that a basic solution inhibits crack growth in a polymer adhesive [76]. In fact, the average growth values for all five groups were within their margins of error, so no concrete comparison conclusions could be drawn. However, it appears that, as in the other two tests, blasting the NAT specimens caused their growth to increase, though only slightly here. 5.3.4 Single Lap Shear Test Results.
As discussed in section 4.2, mode II tests traditionally have not been as useful in judging bond durability as mode I tests. Thus, after comparing several variations on mode I fracture, it was decided to verify this with a series of single lap shear specimens that matched the traveling wedge surface preparation comparison samples. Four specimens from each of the same eight traveling wedge test preparation groups were used (FEP, NAT, SRB, and VLP, blasted or nonblasted). The mode I tests provided three useful pieces of information (GIc, failure mode, and load-displacement plot features). Lap shear tests, however, gave only two pieces of information, the shear strength (figure 5-13) and the failure mode—the load-displacement plot is generally linear and its lack of features reveals nothing about bond quality.
Lap Shear Surface Preparation Tests (error bars are standard deviation)
0
1000
2000
3000
4000
5000
FEP NAT SRB VLP
Specimen Type
stre
ss (p
si)
No Blast Blast
FIGURE 5-13. SHEAR STRENGTHS OF FILM ADHESIVE-BONDED SINGLE LAP SPECIMENS
In comparing their relative strengths, the unblasted specimens were ranked the same in shear strength as they were in traveling wedge form. The specimens based on the NAT peel plies without blasting were exceptionally strong, surpassing even the grit-blasted versions of the other three types. The unblasted strength of VLP specimens were 1/2 of NAT’s, and SRB’s were 1/3 of NAT’s. As expected, the smooth surfaces cured against FEP (as confirmed by SEM examination in section 5.4) were by far the weakest in shear because, in mode II tests, the effects of morphology and mechanical keying are more significant than in mode I.
5-15

Blasting did improve shear strength in all four cases, but generally not as dramatically as in the traveling wedge test. Because of the poor shear performance of smooth FEP surfaces, the most dramatic blasting improvement was in this group. The excellent performance of NAT surfaces left little room for shear strength improvement from blasting, but the SRB and VLP surfaces’ moderate strengths were roughly doubled by blasting. The failure modes of lap shear specimens did appear to match those obtained in the traveling wedge tests. Because the induced peel in a single lap shear joint is likely to cause crack initiation, it is expected that the failure modes of this test would match the traveling wedges. All nonblasted specimens failed interfacially, as did the blasted SRB specimens. The other three blasted groups failed cohesively. However, determination of the failure mode was not straightforward and required a benchtop optical microscope. The specimen consisted of very thin layers of adhesive that were not easily distinguishable from clean adherend surfaces, making it difficult to differentiate between cohesive and interfacial failures. Shear testing did provide rankings of different preparations, but not all of the results matched those from other tests and analyses. For example, the NAT surfaces showed very high shear strength, yet the failure was interfacial. This was likely a result of the large peaks and valleys in the NAT surfaces providing interlocking that resists shear better than peel. While bonded joints are generally loaded in shear in practice, this was one case where testing a joint in its intended configuration did not reflect its preparation quality or expected durability. 5.4 SCANNING ELECTRON MICROSCOPY.
SEM images of nine different surfaces were obtained at two magnifications. The intent of examining the surface morphology was to qualitatively determine the effects of grit blasting and removing four different bagging materials, as well as perhaps to detect the presence of release agents or contaminants. One sample was created for each of the eight preparation schemes. The ninth was an interlaminar fracture surface specimen from a [0]22 panel. Each group of images shown in figures 5-14 through 5-22 a sample at 1000× and 5000× magnification. The qualitative assessments of all of these surface images reinforce the test results obtained in the fracture tests, especially the traveling and static wedge tests. Figure 5-14 shows surfaces cured against FEP release film. In this sample, a smooth, featureless matrix surface is seen. This surface corresponded to extremely low-traveling wedge GIc values and interfacial failures, as the adhesive had neither active chemical bonds to attach to nor surface texture for mechanical interlocking.
5-16
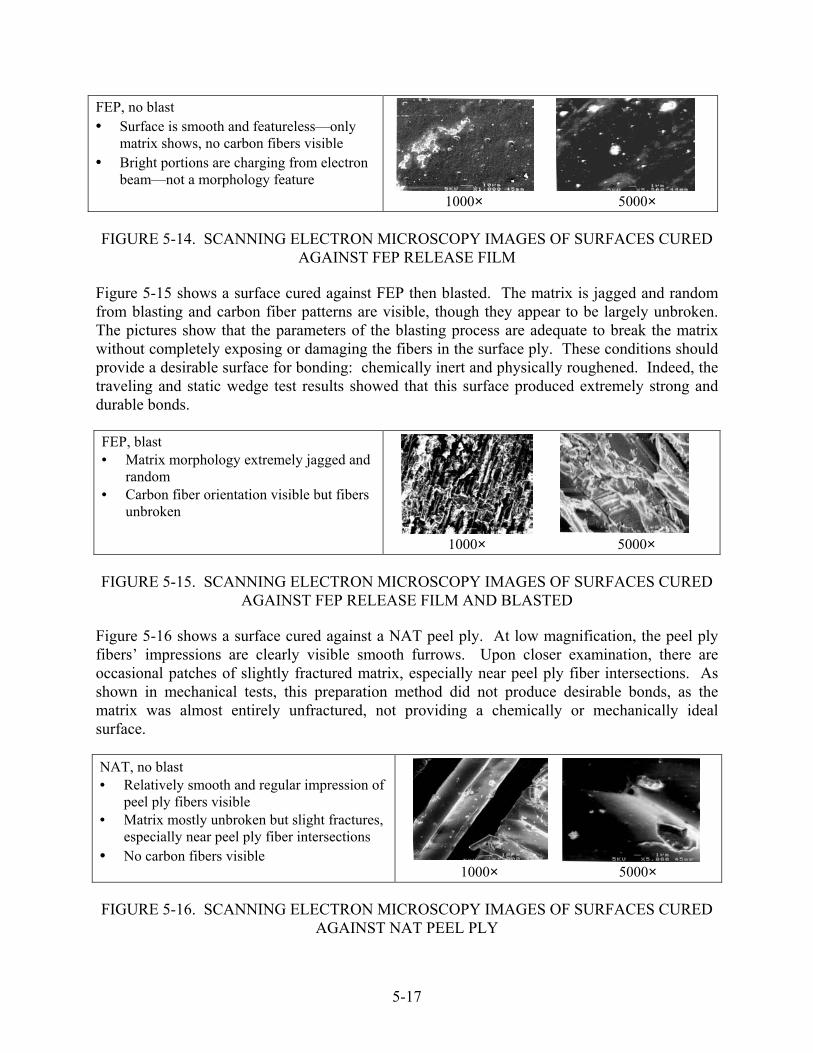
FEP, no blast • Surface is smooth and featureless—only
matrix shows, no carbon fibers visible • Bright portions are charging from electron
beam—not a morphology feature 1000× 5000×
FIGURE 5-14. SCANNING ELECTRON MICROSCOPY IMAGES OF SURFACES CURED
AGAINST FEP RELEASE FILM Figure 5-15 shows a surface cured against FEP then blasted. The matrix is jagged and random from blasting and carbon fiber patterns are visible, though they appear to be largely unbroken. The pictures show that the parameters of the blasting process are adequate to break the matrix without completely exposing or damaging the fibers in the surface ply. These conditions should provide a desirable surface for bonding: chemically inert and physically roughened. Indeed, the traveling and static wedge test results showed that this surface produced extremely strong and durable bonds. FEP, blast • Matrix morphology extremely jagged and
random • Carbon fiber orientation visible but fibers
unbroken
1000× 5000×
FIGURE 5-15. SCANNING ELECTRON MICROSCOPY IMAGES OF SURFACES CURED AGAINST FEP RELEASE FILM AND BLASTED
Figure 5-16 shows a surface cured against a NAT peel ply. At low magnification, the peel ply fibers’ impressions are clearly visible smooth furrows. Upon closer examination, there are occasional patches of slightly fractured matrix, especially near peel ply fiber intersections. As shown in mechanical tests, this preparation method did not produce desirable bonds, as the matrix was almost entirely unfractured, not providing a chemically or mechanically ideal surface. NAT, no blast • Relatively smooth and regular impression of
peel ply fibers visible • Matrix mostly unbroken but slight fractures,
especially near peel ply fiber intersections • No carbon fibers visible
1000× 5000×
FIGURE 5-16. SCANNING ELECTRON MICROSCOPY IMAGES OF SURFACES CURED AGAINST NAT PEEL PLY
5-17

Figure 5-17 shows a grit-blasted NAT surface where the regular peel ply impression has been removed, leaving a random, fractured matrix surface with carbon fibers slightly visible, identical to the blasted FEP sample. As expected, these abraded NAT surfaces produced far better bonds than the nonblasted ones. NAT, blast • Peel ply fiber impression no longer visible • Carbon fiber pattern exposed but fibers
apparently not broken • Matrix extremely broken and jagged
1000× 5000×
FIGURE 5-17. SCANNING ELECTRON MICROSCOPY IMAGES OF SURFACES CURED AGAINST NAT PEEL PLY AND BLASTED
The surface cured against SRB release fabric (figure 5-18) is very smooth and has no matrix fracture. No carbon fibers are visible, just the release fabric impression. Features at and near fiber intersections appear to be release agent deposits (XPS analysis, in section 5.6, did reveal deposited silicon). As expected, bonding to this surface produced joints that were neither strong nor durable. SRB, no blast • Matrix impression from release fabric smooth • Matrix unbroken • Carbon fibers unexposed • Release agents visible on surface
1000× 5000×
FIGURE 5-18. SCANNING ELECTRON MICROSCOPY IMAGES OF SURFACES CURED AGAINST SRB RELEASE FABRIC
Blasting the SRB surfaces (figure 5-19) produces conditions attractive to bonding. Blasting broke the matrix and revealed textures from the carbon fibers without breaking or fully exposing them, like the other blasted samples. The sample still shows a series of regularly spaced lines in one direction, a remnant of the woven release fabric impression, though individual fiber impressions are entirely removed. SRB, blast • Matrix extremely jagged • Release agents no longer visible • Remnants of release fabric impression visible
(bright area on left) • Carbon fiber pattern exposed but fibers unbroken 1000× 5000×
FIGURE 5-19. SCANNING ELECTRON MICROSCOPY IMAGES OF SURFACES CURED
AGAINST SRB RELEASE FABRIC AND BLASTED
5-18

This matrix breakage and removal of release agents improved fracture and durability results, but they still fell short of other blasted surfaces that were not contaminated before blasting. This reinforces the concept that surfaces cannot be assessed simply by their roughness or morphology—chemical effects play an important role. A level of blasting that breaks up the matrix without damaging the fibers is not adequate to remove chemical contaminants and produce durable bonds. Figure 5-20 shows that the surface cured against VLP peel ply have smooth impressions of peel ply fibers in the matrix. Because the polyester fibers in the cloth are compressed and widened by the calendering process, the impressions are flatter and have shorter peaks between them than in the nonblasted NAT and SRB surfaces. At intersections, there are slight amounts of fractured epoxy. VLP, no blast • Impression of peel ply fibers in matrix
mostly smooth • Matrix slightly broken, especially at
fiber intersections • Carbon fibers unexposed 1000× 5000×
FIGURE 5-20. SCANNING ELECTRON MICROSCOPY IMAGES OF SURFACES CURED
AGAINST VLP PEEL PLY Figure 5-21 shows a grit-blasted VLP surface that is nearly identical to other grit-blasted surfaces; the matrix is fractured and jagged but the carbon fibers are intact. No evidence of peel ply fiber impressions remain. As expected, this surface produced results very close to the grit-blasted NAT surfaces. After blasting away the peel ply impression, there is essentially no difference in these two surfaces (and their traveling wedge GIc values are similar), as the only difference between the peel plies was that VLP had been calendered. VLP, blast • Peel ply fiber impression not visible • Carbon fiber pattern visible but fibers
apparently unbroken • Extremely jagged matrix remnants
1000× 5000×
FIGURE 5-21. SCANNING ELECTRON MICROSCOPY IMAGES OF SURFACES CURED
AGAINST VLP PEEL PLY AND BLASTED An interlaminar fracture surface was scanned by EDS (figure 5-22) to obtain chemistry data to be used as a baseline sample that had never been cured against any material or abraded. The specimen showed several exposed carbon fibers that had bridged the fracture plane and remained attached to the surface.
5-19

Interlaminar • Carbon fibers (or impressions of carbon
fibers) • Surface morphology relatively smooth
and regular—no jagged epoxy as in grit-blasted surfaces 1000× 5000×
FIGURE 5-22. SCANNING ELECTRON MICROSCOPY IMAGES OF INTERLAMINAR
FRACTURE SURFACES 5.5 ENERGY-DISPERSIVE SPECTROSCOPY.
While samples were imaged with the SEM, an EDS machine was also connected to the same vacuum chamber that analyzed their chemical compositions at a depth of 1-2 x 10⁻⁶ in. and at an electron beam voltage of 15kV. The process could not discriminate between different chemical compositions of different surface preparation methods. The interlaminar fracture surface, FEP, SRB, and grit-blasted SRB specimen readings (figure 5-23) were nearly identical because of the carbon fibers at or just below the surface. Carbon is also one of the chief elements of epoxy. As expected, oxygen, another component of epoxy, was somewhat prominent in all readings. FIGURE 5-23. ENERGY-DISPERSIVE SPECTROSCOPY SURFACE CHEMISTRY PLOTS
The FEP sample showed minor oxygen, silicon, and sulfur peaks, while the interlaminar sample had a lower oxygen peak and no trace of silicon. A low peak indicated that silicon was present in the SRB sample but was missing in the grit-blasted SRB sample, while a small aluminum peak (from the blast media) formed. The large oxygen peak was also nearly completely removed by
5-20
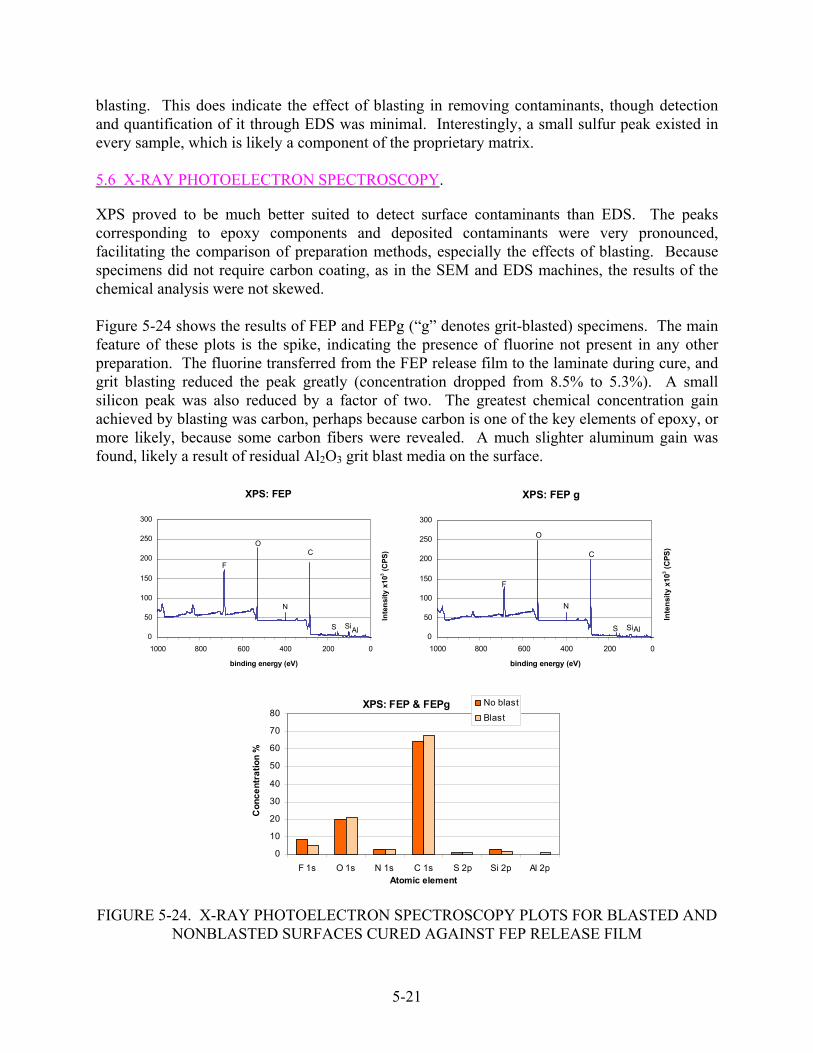
blasting. This does indicate the effect of blasting in removing contaminants, though detection and quantification of it through EDS was minimal. Interestingly, a small sulfur peak existed in every sample, which is likely a component of the proprietary matrix. 5.6 X-RAY PHOTOELECTRON SPECTROSCOPY.
XPS proved to be much better suited to detect surface contaminants than EDS. The peaks corresponding to epoxy components and deposited contaminants were very pronounced, facilitating the comparison of preparation methods, especially the effects of blasting. Because specimens did not require carbon coating, as in the SEM and EDS machines, the results of the chemical analysis were not skewed. Figure 5-24 shows the results of FEP and FEPg (“g” denotes grit-blasted) specimens. The main feature of these plots is the spike, indicating the presence of fluorine not present in any other preparation. The fluorine transferred from the FEP release film to the laminate during cure, and grit blasting reduced the peak greatly (concentration dropped from 8.5% to 5.3%). A small silicon peak was also reduced by a factor of two. The greatest chemical concentration gain achieved by blasting was carbon, perhaps because carbon is one of the key elements of epoxy, or more likely, because some carbon fibers were revealed. A much slighter aluminum gain was found, likely a result of residual Al2O3 grit blast media on the surface.
XPS: FEP
0 50
100 150 200 250 300
0200400 600 800 1000 binding energy (eV)
Inte
nsity
x10
3 (CPS
)
F O
N
C
S SiAl
XPS: FEP g
0
50
100
150
200
250
300
0200 400 6008001000
binding energy (eV) In
tens
ity x
103 (C
PS)
F
O
N
C
S Si Al
XPS: FEP & FEPg
0
10
20
30
40
50
60
70
80
F 1s O 1s N 1s C 1s S 2p Si 2p Al 2pAtomic element
Con
cent
ratio
n %
No blastBlast
FIGURE 5-24. X-RAY PHOTOELECTRON SPECTROSCOPY PLOTS FOR BLASTED AND NONBLASTED SURFACES CURED AGAINST FEP RELEASE FILM
5-21

Destructive test results of FEP surfaces produced weak interfacial failures, but blasted versions were among the strongest bond type. Because the only significant changes achieved by blasting were the reduction of the fluorine content and the surface roughening, one of those two factors is responsible for the dramatic improvement. Since the fluorine was not removed altogether, it is likely that the surface roughening (in addition to chemistry), in this case, plays an important role in bond strength, especially because the FEP was so flat and smooth to start with. The chemical compositions of the NAT and NATg surfaces (figure 5-25) are dominated by carbon, with none of the fluorine present in the previous plots. Insignificantly small concentrations of fluorine (0.2%) and silicon (0.7%) indicate that no contaminants were transferred from this scoured and heat-set peel ply, as expected. Additionally, chemical changes from blasting were minimal. Because the peel ply had already slightly fractured the epoxy surface, further abrasion did not change the surface chemistry significantly. Interestingly, the carbon concentration lowered slightly, indicating that the amount of blasting was not adequate to expose and break carbon fibers, which would have increased its concentration. Therefore, since the surface chemistry did not change significantly, improvements in strength and durability in the destructive tests above must have relied predominantly on surface morphology.
XPS: NAT
0 50
100 150 200 250 300
0200400 600 800 1000 binding energy (eV)
Inte
nsity
x10
3 (CPS
)
F
O
N
C
S SiAl
XPS: NATg
0
50
100
150
200
250
300
0200 400 6008001000
binding energy (eV)
Inte
nsity
x10
3 (CPS
)
F
O
N
C
S SiAl
XPS: NAT & NATg
0
10
20
30
40
50
60
70
80
F 1s O 1s N 1s C 1s S 2p Si 2p Al 2pAtomic element
Con
cent
ratio
n %
No blastBlast
FIGURE 5-25. X-RAY PHOTOELECTRON SPECTROSCOPY PLOTS FOR BLASTED AND NONBLASTED SURFACES CURED AGAINST NAT PEEL PLY
5-22

The chemical makeup of SRB and SRBg specimens (figure 5-26) reveals that blasting reduces significantly the silicon contamination by a factor of three (14.5% to 4.9%). As in the case with the significant removal of fluorine in the FEP samples, the carbon concentration increased greatly as the silicon contamination was removed. The large amount of silicon in the SRB samples resulted in poor bond performance, and blasting improved it greatly, but not to the point of other blasted specimens. Apparently, in this case, the amount of remaining 4.9% atomic concentration of silicon was still adequate to prevent proper bonding, even though the surface had been improved mechanically.
XPS: SRB
0 50
100 150 200 250 300
0200400 600 800 1000 binding energy (eV)
Inte
nsity
x10
3 (CPS
)
F
O
N
C
S
Si
Al
XPS: SRB g
0
50
100
150
200
250
300
0200 400 6008001000
binding energy (eV)
Inte
nsity
x10
3 (CPS
)
F
O
N
C
S Si Al
XPS: SRB & SRBg
0
10
20
30
40
50
60
70
80
F 1s O 1s N 1s C 1s S 2p Si 2p Al 2pAtomic element
Con
cent
ratio
n %
No blastBlast
FIGURE 5-26. X-RAY PHOTOELECTRON SPECTROSCOPY PLOTS FOR BLASTED AND NONBLASTED SURFACES CURED AGAINST SRB RELEASE FABRIC
The final set of prepared samples, cured against VLP (figure 5-27), showed surface chemistry very close to the NAT group, as expected because VLP is the mechanically processed version of NAT. Both VLP and VLPg are absent of fluorine and silicon contaminants and blasting did not change the chemistry noticeably, except for a 2% increase in carbon. Therefore, as in the NAT samples, mechanical rather than chemical effects are responsible for improvements gained from blasting.
5-23

FIGURE 5-27. X-RAY PHOTOELECTRON SPECTROSCOPY PLOTS FOR BLASTED AND
NONBLASTED SURFACES CURED AGAINST VLP PEEL PLY Finally, as in the EDS and SEM analyses, a sample surface produced by interlaminar failure was observed (figure 5-28) to determine what elements were present within an adherend, away from any potential surface contamination. It had 2.9%-7.5% more oxygen than other samples, but nitrogen and carbon, the other chief epoxy elements, were present in approximately the same amounts. Fluorine was nonexistent and silicon concentration was only 0.5%. Because of the especially strong match between an internal surface and blasted surfaces (except for SRBg), one can conclude that grit-blasting a contaminated surface does tend to return it back to the adherend’s pure chemical composition before contamination.
XPS: interlaminar
0 50
100 150 200 250 300
0200400 600 800 1000 binding energy (eV)
Inte
nsity
x10
3 (CPS
)
F
O
N
C
S SiAl
XPS: interlaminar
0
10
20
30
40
50
60
70
80
F 1s O 1s N 1s C 1s S 2p Si 2p Al 2p
Atomic element
Conc
entr
atio
n %
FIGURE 5-28. X-RAY PHOTOELECTRON SPECTROSCOPY CHEMICAL PLOTS OF INTERLAMINAR SURFACES
5-24

When all nine specimens’ chemical concentrations are compared side by side (figure 5-29), a few key trends are reinforced. Fluorine exists only on the FEP samples, and FEPg’s fluorine is much less than FEP’s. Similarly, silicon is present in significant quantities only in the SRB and, to a lesser extent, the SRBg samples, while the other seven specimens contained only minute traces of it.
XPS: all specimens
0
10
20
30
40
50
60
70
80
F 1s O 1s N 1s C 1s S 2p Si 2p Al 2pAtomic element
Con
cent
ratio
n %
FEPFEPgNATNATgSRBSRBgVLPVLPgint
FIGURE 5-29. X-RAY PHOTOELECTRON SPECTROSCOPY CHEMICAL CONCENTRATIONS OF ALL NINE SAMPLES
Oxygen, nitrogen, carbon, and sulfur, all basic elements of epoxy, exist in roughly the same concentrations (hydrogen, another chief epoxy component, could not be measured by the XPS machine). The slight trends within these three elements reveal that the interlaminar chemical composition contains more oxygen than any other surface, and that SRB and FEP have the lowest carbon concentrations. This is a result of the spikes that correspond to the contamination covering a significant portion of their surfaces. Finally, an insignificant amount of aluminum (0.79% at most) remained after blasting, indicating that the grit media was not imbedding itself in the surface, and that a simple blast of dry nitrogen is adequate to remove the remaining grit dust particles. 5.7 SUMMARY.
The tests above provided valuable information on surface preparation effects on the strength and durability of bonds. Some tests did not perform well enough with bonded composite joints to provide data, but the process of attempting to adapt them to these materials is valuable in itself and may be built upon by future researchers to make them successful.
5-25

The floating roller peel test, despite its simplicity, was one of these unsuccessful tests. The thin composite adherend had too much flexural rigidity to wrap around the roller. It fractured or advanced the thick adherend too far forward, bypassing the roller altogether. This test was abandoned after analyzing upgrades like larger rollers or twin rollers that would grip and control the advance of the thick adherend in conjunction with the peeling of the thin adherend. The DCB test proved useful in distinguishing between different surface preparations in the original series of paste adhesive tests. Results obtained fell between values for interlaminar fracture and adhesive fracture with metal adherends and showed that blasting surfaces improved GIc greatly. The smooth surfaces cured against PTFE vacuum bags produced better bonds (higher GIc and better failure mode) than the textured surfaces cured against release fabrics, reinforcing the assertion that chemistry issues are as vital as mechanical issues in bond strength. However, difficulties in conducting the DCB test made it less attractive than the traveling wedge test, which was able to produce comparable results. The traveling wedge test was first tested with paste adhesive specimens that matched the geometry of the DCB test’s samples. After this validation, it was used for the main series of tests, specimens cured against FEP, NAT, SRB, or VLP, half of which were grit blasted before bonding. GIc and failure mode results reinforced the importance of blasting to create surfaces chemically and mechanically suited for bonding. All nonblasted surfaces, as well as some of the blasted SRB surfaces, had interfacial failures and low GIc values. Bonds that were made on blasted peel ply and release film surfaces performed excellently with cohesive failures and high GIc values, especially the blasted FEP bonds. Static wedge tests in neutral, acidic, and basic solutions were used on the same types of specimens as the traveling wedge specimens, with less conclusive results. Crack growth was minimal in specimens tested (especially in the acidic solution, even more so in the basic solution), partially because the poorest ones fractured completely and interfacially before they could be exposed. All others exhibited small or no growth. Interestingly, grit-blasted VLP surfaces surpassed VLP surfaces, but blasting worsened the performance of NAT samples. Overall, the test proved to not produce results adequately clear to draw conclusions on bond durability, though failure modes did match those produced in the traveling wedge tests. However, more testing is needed to fully evaluate static wedge tests, particularly for contaminated and other poor surfaces. To investigate claims in the literature that mode II tests were not well suited for testing adhesive bonds, a series of single lap shear tests were conducted on the same specimens used in the above two tests. Failure modes of all specimens and relative shear strengths of unblasted specimens matched the failure modes and GIc values of the traveling wedge tests, but the blasted specimens’ strengths did not fall off in the same order as the corresponding traveling wedge test. Grit-blasted FEP samples performed the worst of the four, preceded by blasted SRB and VLP, with blasted NAT specimens producing the highest strength. Strength gains from blasting were less pronounced than in the traveling wedge test—NAT specimen shear strength increased only slightly from blasting.
5-26

Nondestructive microscopy and spectroscopy tests revealed chemistry and morphology features that explained the destructive test results. Smooth and fluorine-contaminated surfaces cured against FEP were neither chemically nor mechanically ideal, though blasting did create rough, less-contaminated surfaces. SRB surfaces were rough but contaminated heavily with silicon, indicating that chemistry is at least as important as morphology. Blasting improved SRB surfaces greatly, even though they still produced unacceptable bonds in the destructive tests. VLP and NAT surfaces were contaminant-free but the VLP ones were not as textured as the NATs, indicating that differences in surface morphology does lead to different bond qualities, even if the chemistry is identical. Blasted VLP and NAT surfaces had improved morphology but little chemistry change, which resulted in increased performance in all of the destructive tests, proving the benefits of surface roughening. In review, the recommended surface preparation is obtained by curing against a NAT peel ply, removing the peel ply, wiping with acetone, grit blasting, and then bonding. In terms of ease-of-use and the ability to distinguish between different preparations, the traveling wedge proved to be the most effective method.
5-27/5-28

6. CONCLUSIONS.
The results and trends observed in this investigation can be used as bonding guidelines and to increase awareness of potential surface preparation problems. The distinctions between peel plies, release fabrics, and release films apply to any recipe, though exact results will certainly vary. Release fabrics and release films left bond-inhibiting contaminants, while peel plies did not. The extremely smooth surface created by a release film provided a poor mechanical interface, while the textures from peel plies and release fabrics were better suited to bonding. Likewise, effects of grit blasting were similar but not identical between the different joints tested herein. Except for the grit-blasted (NAT) samples in the static wedge test, blasting improved performance, sometimes mildly but often significantly. Therefore, grit blasting, if performed carefully at parameters similar to those used in this research (section 3.3.1), is strongly recommended for all bonding operations for its chemical and morphological benefits. Unlike the test data, the results and trends of the different destructive test methods can be applied more generally to other recipes with the same or similar results, as evidenced in the literature review. Mode I fracture tests were found to be more sensitive to processing variations like blasting and chemical contamination than lap shear tests, with the exception of the static wedge test, which did not produce clear trends between different preparation methods. The double cantilever beam test proved to produce consistent and reasonable results, but the more user-friendly traveling wedge test could provide the same information. Finally, the floating roller peel test was found to be very poorly suited to brittle composites and should be reserved for ductile metals, though modifications may make it usable with composites. Additionally, of the nondestructive test methods used to evaluate prebond surfaces, scanning electron microscopy (SEM) and X-ray photoelectron spectroscopy (XPS) provided excellent information, while energy-dispersive spectroscopy (EDS) revealed very little. SEM images could be used for qualitative morphological assessments to provide feedback on abrasion, peel ply removal, and other morphology-modifying processes. XPS revealed accurate chemical assessments of surfaces, aiding in correlation of specific elements to bond performance, especially failure mode. Because EDS examines chemical composition deeper than XPS does, it did not detect differences even between grossly different surface preparations. Finally, the X-ray photography was a useful tool in understanding crack front behavior in these opaque joints, justifying the optical tick mark measurement methods used in most of the tests for the given specimens. The recipes that were found to produce successful bonds (high GIc, cohesive and/or interlaminar failure mode, as well as high shear strength when lap shear tests were performed) follow: • Hexcel IM7/M73 adherends cured against Richmond Aircraft Products A-5000
fluorinated ethylene propylene release film or Precision Fabrics Group polyester 60001 NAT (natural) or very low porosity (VLP) peel ply, then grit blasted with 180 grit Al2O3 grit at 40 psi, then bonded with Cytec Fiberite FM300-2K film adhesive.
6-1

• Hexcel IM7/8552 adherends cured against Chemfab VB-3 polytetrafluoroethylene vacuum bag film, grit blasted with #120 Garnet Al2O3 at 60 psi, then bonded with Dexter Hysol EA9394 paste adhesive.
Note that because the composite materials’ fibers should not affect bond quality, unless they are overblasted, any other adherend with an M73 or 8552 matrix should also perform well under the same conditions, though this should be independently verified. Recipes found to produce unsuccessful bonds (low GIc, interfacial failure, and low shear strength when lap shear tests were performed) are: • IM7/M73 adherends cured against A-5000 FEP or 60001 NAT, SRB (super release blue),
or VLP, then bonded with FM300-2K adhesive (without blasting). The same adherends cured against the same SRB material with the blasting procedure described above.
• IM7/8552 adherends cured against a heavily coated (with silicone and siloxane) nylon release fabric, either blasted with #120 Garnet Al2O3 at 60 psi or not, then bonded with EA9394 paste adhesive.
Because every combination of materials can produce different chemical and mechanical bonding conditions, it is impossible to provide a specific and comprehensive set of bonding rules. Additionally, although different industries have very different requirements in materials and adhesives, the materials used herein were intended to be as representative of aerospace applications as possible. Recommendations can come only in the form of trends produced by certain processes or material types, test methods that provide desired data for feedback, and specific recipes that were tested herein. Because chemistry plays such a critical role in bonding, the exact results and trends of all tests herein cannot be applied directly to other adherends, adhesives, bagging materials, grit media, blast parameters, etc. Unfortunately, every adhesive and adherend’s exact chemical composition is proprietary, further hindering attempts to apply specific test data to other recipes. Therefore, bonded joints that use similar materials cannot be assumed to perform like their counterparts, and even minor batch-to-batch material variations can change bonding performance significantly. Therefore, not only should all joint combinations be tested before production, but all incoming materials must also be tested before use. The traveling wedge test is the recommended method, for the reasons described herein. In summary, the chemically inert, deeply textured NAT peel ply is the best type of material to cure against if one is performing secondary bonding on a surface. Grit blasting the surface improves overall bond performance and should be performed before any bonding operation. The traveling wedge test proved to be the method best suited to evaluating the bonding process, because of its accuracy and simplicity.
6-2

7. PROPOSED FUTURE WORK.
The problem of properly bonding composites has too great a scope to be comprehensively covered in one investigation. There are several other approaches, test methods, and materials that were not addressed herein. If more time and resources had been available, the following work would have been added: 1. Further static wedge testing. Because static wedge test results did not distinguish
between the materials and processes used in this work, it would be beneficial to perform them on a different set of specimens to determine if the test is indeed sensitive to minor differences. As used herein, it did little more than single out the samples that were prepared extremely poorly and failed immediately upon wedge insertion before any environmental exposure, which is one of the many pieces of information already provided by the traveling wedge test.
2. Fatigue. Environmentally exposed fatigue specimens would produce the most accurate representation of a service part. These tests could be performed in mode I or II loading, in either a liquid or a steam environment.
3. Atomic force microscopy (AFM) and profilometry. Although SEM images provided excellent qualitative information on surface morphology, conclusions drawn were subjective and strongly dependent on imaging techniques (exposure, focus, cropping, as well as several electron beam tuning parameters). Processes like AFM and profilometry (section 3.4) provided three-dimensional data of exact surface topography, allowing for quantification of surface processing effects on morphology. This would allow for precise determination of optimal grit blaster settings as well as the exact effects of peel ply removal.
4. Bond thickness effects. General aviation structures tend to not only have thicker bondlines than commercial aviation structures, but the bondlines can vary greatly along the length of a joint. This variation may affect surface preparation issues as well as joint design and testing.
5. Postfracture study. Perform microscopy or spectroscopy on fractured joints to better characterize failure modes and mechanisms.
7-1/7-2

8. REFERENCES.
1. Hart-Smith, L.J., “The Curse of the Nylon Peel Ply,” 41st International SAMPE Symposium, 1996, pp. 303-317.
2. Bascom, Willard D. and Cottington, Robert L., 1976, “Effect of Temperature on the Adhesive Fracture Behavior of an Elastomer-Epoxy Resin,” Journal of Adhesion, Vol. 7, 1976, pp. 333-346.
3. Cognard, J., “The Mechanics of the Wedge Test,” Journal of Adhesion, Vol. 20, No. 1, Gordon and Breach Science Publishers, 1986, pp. 1-13.
4. Cognard, J., “Quantitative Measurement of the Energy of Fracture of an Adhesive Joint Using the Wedge Test,” Journal of Adhesion, Vol. 22, No. 2, Gordon and Breach Science Publishers, 1987, pp. 97-108.
5. Crosley, P.B. and Ripling, E.J., “A Thick Adherend, Instrumented Double-Cantilever-Beam Specimen for Measuring Debonding of Adhesive Joints,” Journal of Testing and Evaluation, Vol. 19, No. 1, 1991, pp. 24-28.
6. Hart-Smith, L.J., “A Peel-Type Durability Test Coupon to Assess Interfaces in Bonded, Co-Bonded, and Co-Cured Composite Structures,” McDonnell Douglas Paper MDC 97K0042, presented to MIL-HDBK-17 Meeting, Tucson, 1997.
7. Johnson, W.S. and Butkus, L.M., “Considering Environmental Conditions in the Design of Bonded Structures: A Fracture Mechanics Approach,” Fatigue & Fracture of Engineering Materials & Structures, Vol. 21, No. 4, 1998, pp. 465-478.
8. Jurf, R.A., “Environmental Effects on Fracture of Adhesively Bonded Joints,” Adhesively Bonded Joints: Testing, Analysis, and Design, ASTM STP 981, Philadelphia, PA, 1988, pp. 276-288.
9. Marceau, J.A., et al., “A Wedge Test for Evaluating Adhesive Bonded Surface Durability,” 21st National SAMPE Symposium “Bicentennial of Materials Progress,” Los Angeles, CA, 1976, pp. 332-355.
10. Marceau, J.A., et al., “A Wedge Test for Evaluating Adhesive-Bonded Surface Durability,” Adhesives Age, 1977, pp. 28-34.
11. Ripling, E.J., et al., “Stress Corrosion Cracking of Adhesive Joints,” Journal of Adhesion, Vol. 3, 1971, pp. 145-163.
12. Sloan, Forrest, “A Constant-G Double Cantilever Beam Fracture Specimen for Environmental Testing,” Journal of Composite Materials, Vol. 27, No. 16, Technomic Publishing Co., 1993, pp. 1606-1615.
13. Hart-Smith, L.J., “Design of Adhesively Bonded Joints,” Joining Fibre-Reinforced Plastics, F. L. Matthews editor, 1987, pp. 271-311.
8-1

14. Thrall, Edward W. Jr., “Primary Adhesively Bonded Structure Technology (PABST),” J. Aircraft, Vol. 14, No. 6, 1977, pp. 588-594.
15. Thrall, Edward W. Jr., “PABST Program Test Results,” Adhesives Age, Vol. 22, No. 10, 1979, pp. 22-33.
16. Caldwell, Gordon A., “Bond Lab Certification Program,” 44th International SAMPE Symposium, 1999, pp. 562-571.
17. Davis, M.J. and Bond, D.A., “The Importance of Failure Mode Identification in Adhesive Bonded Aircraft Structures and Repairs,” 1999, ICCM 12, Paris.
18. Davis, Maxwell and Bond, David, “Principles and Practices of Adhesive Bonded Structural Joints and Repairs,” International Journal of Adhesion and Adhesives, Vol. 19, 1999, pp. 91-105.
19. Hart-Smith, L.J., et al., “Surface Preparations for Ensuring that the Glue Will Stick in Bonded Composite Structures,” Handbook of Composites, edited by S. T. Peters, Chapman & Hall, London, 1998, pp. 667-685.
20. Lincoln, J.W., et al., Action Group 13 of the Technical Cooperation Program, “Certification of Bonded Structures,” TTCP final report, 2001.
21. Hart-Smith, L.J. and Davis, M.J., “An Object Lesson in False Economies—The Consequences of Not Updating Repair Procedures for Older Adhesively Bonded Panels,” 41st International SAMPE Symposium, 1996, pp. 279-290.
22. Espie, A.W., et al., “Quality Assurance in Adhesive Technology,” International Journal of Adhesion and Adhesives, Vol. 15, 1995, pp. 81-85.
23. Chin, J.W. and Wightman, J.P., “Surface Pretreatment and Adhesive Bonding of Carbon Fiber-Reinforced Epoxy Composites,” Composites Bonding, ASTM STP 1227, Philadelphia, PA, 1994, pp. 1-16.
24. Chin, Joannie W. and Wightman, James P., “Surface Characterization and Adhesive Bonding of Toughened Bismaleimide Composites,” Composites Part A, Vol. 27A, No. 6, Elsevier, 1996, pp. 419-428.
25. Parker, B.M. and Waghorne, R.M., “Surface Pretreatment of Carbon Fibre-Reinforced Composites for Adhesive Bonding,” Composites, Vol. 3, No. 3, 1982, pp. 280-288.
26. Hart-Smith, L.J., “Effects of Pre-Bond Moisture on Interfacial Failures in Composite Joints,” MIL-HDBK-17 Meeting, 1999.
27. Armstrong, K.B., “Effect of Absorbed Water in CFRP Composites on Adhesive Bonding,” International Journal of Adhesion and Adhesives, Vol. 16, pp. 21-28.
8-2

28. Johnson, W. Steven, et al., “Applications of Fracture Mechanics to the Durability of Bonded Composite Joints,” FAA report DOT/FAA/AR-97/56, May 1998.
29. Galantucci L.M., et al., “Surface Treatment for Adhesive-Bonded Joints by Excimer Laser,” Composites Part A (Applied Science and Manufacturing), Vol. 27A, No. 11, Elsevier, 1996, pp. 1041-1049.
30. Clearfield, H.M., et al., “Surface Preparation of Metals,” ASM Engineered Materials Handbook, Vol. 3, ASM International, Metals Park, OH, 1987, pp. 259-264.
31. Chai, Herzl, “Bond Thickness Effect in Adhesive Joints and its Significance for Mode I Interlaminar Fracture of Composites,” Composite Materials (Seventh Conference), 1986, pp. 209-231.
32. Kalnins, M., et al., “On the Importance of Some Surface and Interface Characteristics in the Formation of the Properties of Adhesive Joints,” International Journal of Adhesion and Adhesives, Vol. 17, 1997, pp. 365-372.
33. Harris, A.F. and Beevers, A., “The Effects of Grit-Blasting on Surface Properties for Adhesion,” International Journal of Adhesion and Adhesives, Vol. 19, 1999, pp. 445-452.
34. Kinloch, A.J., Adhesion and Adhesives, Chapman and Hall, London, 1987.
35. Bowditch, M.R., “The Durability of Adhesive Joints in the Presence of Water,” International Journal of Adhesion and Adhesives, Vol. 16, 1996, pp. 73-79.
36. Young, R.J. and Lovell, P.A., Introduction to Polymers, second edition, Chapman & Hall, London, 1991.
37. Kotz, John C. and Purcell, Keith F., Chemistry & Chemical Reactivity, Saunders College Publishing, Philadelphia, PA, 1987.
38. Brockmann, W. and Kollek, H., “Durability Assessment and Life Prediction for Adhesive Joints,” ASM Engineered Materials Handbook, Vol. 3, Adhesives and Sealants, editor Cyril A. Dostol, 1990, pp. 663-672.
39. Knox, E.M. and Cowling, M.J., “A Rapid Durability Test Method for Adhesives,” International Journal of Adhesion and Adhesives, Vol. 20, 2000, pp. 201-208.
40. Bardis, J.D. and Kedward, K.T., “Effects of Surface Preparation on Long Term Durability of Composite Adhesive Bonds,” 15th Annual ASC Technical Conference: Proceedings, College Station, TX, 2000.
41. Bardis, J.D. and Kedward, K.T., “Effects of Surface Preparation on Long-Term Durability of Composite Adhesive Bonds,” FAA Report DOT/FAA/AR-01/8, April 2001.
8-3

42. Bardis, Jason D. and Kedward, Keith T., “Effects of Surface Preparation on Long-Term Durability of Composite Adhesive Bonds,” SME Technical Paper #EM01-341 (Dearborn, MI: Society of Mfg. Engineers, 2001), and 13th International Conference on Composite Materials (ICCM) Proceedings, Beijing, China, June 25-29, 2001.
43. Bardis, J.D. and Kedward, K.T., “Surface Preparation Effects on Mode I Testing of Adhesively Bonded Composite Joints,” Journal of Composites Technology & Research, accepted for publication in 2002.
44. Bardis, Jason, “Effects of Surface Preparation on the Long-Term Durability of Adhesively Bonded Composite Joints,” Ph.D. dissertation, University of California Santa Barbara, March 2002.
45. Carpenter, Alain and O’Donnell, Tim, “Qualification of Room-Temperature-Curing Epoxy Adhesives for Spacecraft Structural Applications,” 33rd International SAMPE Symposium, 1988.
46. Carpenter, A, “Qualification of EA9394 Adhesive,” 33rd International SAMPE Symposium, 1988.
47. Fernando, M., et al., “A Fracture Mechanics Study of the Influence of Moisture on the Fatigue Behaviour of Adhesively Bonded Aluminum-Alloy Joints,” International Journal of Adhesion and Adhesives, Vol. 16, 1996, pp.113-119.
48. Mostovoy, S. and Ripling, E.J., “Factors Controlling the Strength of Composite Structures,” Materials Research Laboratory, Inc. Final Report for the Naval Air Systems Command, Contract # N00019-70-C-0137, 1971.
49. Yang, Zhong and Biney, Paul O., “Study on the Thermal and Hygrothermal Behaviors of Epoxy and Polyimide Adhesives,” 46th International SAMPE Symposium, 2001, pp. 51-60.
50. Maurice, F., editor, 1978, Microanalysis and Scanning Electron Microscopy, Les Éditions de Physique, Orsay, France.
51. Briggs, D., editor, Handbook of X-Ray and Ultraviolet Photoelectron Spectroscopy, Heyden, London, 1977.
52. Gould, S.A.C., et al., “From Atoms to Integrated Circuit Chips, Blood Cells, and Bacteria With the Atomic Force Microscope,” Journal of Vacuum Science and Technology I, Vol. 8, No. 1, 1990, pp. 369-373.
53. Rugar, Daniel, and Hansma, Paul, “Atomic Force Microscopy,” Physics Today, October 1990, pp. 23-30.
54. Schneir, J. and Jobe, et al., “High-Resolution Profilometry for CMP Process Control,” Solid State Technology, Vol. 40, No. 6, 1997, pp. 203-210.
8-4

55. Teague, E.C., et al., “Three-Dimensional Stylus Profilometry,” Wear, Vol. 82, No. 1, 1982, pp. 1-12.
56. Laeri, F. and Strand, T.C., “Angstrom Resolution Optical Profilometry for Microscopic Objects,” Applied Optics, Vol. 26, No. 11, 1987, pp. 2245-2249.
57. Ripling, E.J., et al., “Fracture Mechanics: A Tool for Evaluating Structural Adhesives,” Journal of Adhesion, Vol. 3, 1971, pp. 107-123.
58. O’Brien and T. Kevin, “Composite Interlaminar Shear Fracture Toughness, GIc: Shear Measurement or Sheer Myth?”, ASTM STP 1330, 1998, pp. 3-18.
59. Whitney, J.M., et al., “A Double Cantilever Beam Test for Characterizing Mode I Delamination of Composite Materials,” Journal of Reinforced Plastics and Composites, Vol. 1, Technomic Publishing, 1982, pp. 297-313.
60. Fernlund, G. and Spelt, J.K., “Mixed Mode Energy Release Rates for Adhesively Bonded Beam Specimens,” Journal of Composites Technology & Research, Vol. 16, No. 3, 1994, pp. 234-243.
61. Rao, B. Nageswara and Acharya, A.R., “Evaluation of Fracture Energy GIc Using a Double Cantilever Beam Fibre Composite Specimen,” Engineering Fracture Mechanics, Vol. 51, No. 2, 1995, pp. 317-322.
62. Blackman, B., et al., “The Calculation of Adhesive Fracture Energies from Double-Cantilever Beam Test Specimens,” Journal of Materials Science Letters, Vol. 10, No. 5, 1999, pp. 253-256.
63. Keary, Paul E., et al., “Mode I Interlaminar Fracture Toughness of Composites Using Slender Double Cantilevered Beam Specimens,” Journal of Composite Materials, Vol. 19, No. 2, 1985, pp. 154-177.
64. Rhee, K.Y., “An Application of the Single Specimen Technique to a Double Cantilever Beam Specimen to Determine GIc from a Single Test Record,” Composite Structures, Vol. 26, No. 3, Elsevier Science Publishers, England, 1993, pp. 109-113.
65. Rhee, K.Y., “Evaluation of Elastic Work Factor for a Double Cantilever Beam Specimen,” Journal of Materials Science Letters, Vol. 13, No. 8, 1994, pp. 613-614.
66. Gutowski, W.S. and Pankevicius, E.R., “Interlaminar Fracture Energy of UHMPE/Epoxy Composites by Double Cantilever Beam and Peel Tests,” Fatigue and Fracture of Engineering Materials Structures, Vol. 17, No. 3, 1994, pp. 351-360.
67. Cairns, Douglas S., “Static and Dynamic Strain Energy Release Rates in Toughened Thermosetting Composite Laminates,” 9th Annual DoD/NASA/FAA Conference, 1991.
68. Creton, Costantino et al., “Failure Mechanisms of Polymer Interfaces Reinforced With Block Copolymers,” Macromolecules, Vol. 26, 1992, pp. 3075-3088.
8-5

69. Jiao, J., et al., “Measurement of Interfacial Fracture Toughness Under Combined Mechanical and Thermal Stresses,” Journal of Electronic Packaging, Vol. 120, No. 4, 1998, pp. 349-353.
70. Hashemi, S., et al., “Corrections Needed in Double-Cantilever Beam Tests for Assessing the Interlaminar Failure of Fibre-Composites,” Journal of Materials Science Letters, Vol. 8, No. 2, 1989, pp. 125-129.
71. Hu, Xiao-Zhi, Mai and Yiu-Wing, “Mode I Delamination and Fibre Bridging in Carbon-Fibre/Epoxy Composites With and Without PVAL Coating,” Composites Science and Technology, Vol. 46, 1993, pp. 147-156.
72. Nairn, John A., “Energy Release Rate Analysis for Adhesive and Laminate Double Cantilever Beam Specimens Emphasizing the Effect of Residual Stresses,” International Journal of Adhesion and Adhesives, Vol. 20, 2000, pp. 59-70.
73. Tada, Hiroshi, et al., The Stress Analysis of Cracks Handbook, Del Research Corporation, Hellertown, PA, 1973.
74. Kanninen, M.F., “An Augmented Double Cantilever Beam Model for Studying Crack Propagation and Arrest,” International Journal of Fracture, Vol. 9, No. 1, 1973, pp. 83-92.
75. Plausinis, D. and Spelt, J.K., “Designing for Time-Dependent Crack Growth in Adhesive Joints,” International Journal of Adhesion and Adhesives, Vol. 15, 1995, pp. 143-154.
76. Bistac, S., et al., “Durability of Steel/Polymer Adhesion in an Aqueous Environment,” International Journal of Adhesion and Adhesives, Vol. 18, 1998, pp. 365-369.
77. Plausinis, D. and Spelt, J.K, “Application of a New Constant G Load-Jig to Creep Crack Growth in Adhesive Joints,” International Journal of Adhesion and Adhesives, Vol. 15, 1995, pp. 225-232.
8-6

9. ADDITIONAL INFORMATION.
Chai, Herzl, “Observation of Deformation and Damage at the Tip of Cracks in Adhesive Bonds Loaded in Shear and Assessment of a Criterion for Fracture,” International Journal of Fracture, Vol. 60, No. 4, 1993, pp. 311-326.
Wylde, J.W. and Spelt, J.K., “Measurement of Adhesive Joint Fracture Properties as a Function of Environmental Degradation,” International Journal of Adhesion and Adhesives, Vol. 18, 1998, pp. 237-246.
Mostovoy, S., et al., “Fracture Toughness of Adhesive Joints,” Journal of Adhesion, vol. 3, 1971, pp. 125-144.
Ikegami, K., et al., “Benchmark Tests on Adhesive Strengths in Butt, Single and Double Lap Joints and Double-Cantilever Beams,” International Journal of Adhesion and Adhesives, Vol. 16, 1996, pp. 219-226.
Kinloch, A.J. and Shaw, S.J., “The Fracture Resistance of a Toughened Epoxy Adhesive,” Journal of Adhesion, Vol. 12, No. 1, 1981, pp. 59-77.
Huston, R.J., “The Effect of Glass Transition Temperature on Interlaminar Shear Strength on Glass Reinforced Epoxy Composites,” unpublished document, Defencetek, CSIR, 2000.
Gleich, D.M., et al., “Analysis of Bondline Thickness Effects on Failure Load in Adhesively Bonded Structures,” 32nd International SAMPE Technical Conference, 2000, pp. 567-579.
Hart-Smith, L.J., “A New Method of Rating and Comparing Structural Adhesives,” McDonnell Douglas Paper 8128, expanded version of Adhesives Age, Vol. 30, No. 4, 1987, pp. 28-32.
Guess, T.R., et al., “Mechanical Properties of Hysol EA-9394 Structural Adhesive,” Sandia Report SAND95-0229 UC-704, 1995.
Radon, J.C., et al., “Use of the Double Cantilever Beam Test in Fracture Studies,” Practical Applications of Fracture Mechanics to Pressure-Vessel Technology Conference, Institution of Mechanical Engineers, London, UK, 1971, pp. 48-55.
Kim, Jangkyo, et al., “Fracture Toughness of CFRP With Modified Epoxy Resin Matrices,” Composites Science and Technology, Vol. 43, 1992, pp. 283-297.
Kusaka, Takayuki, et al., “Rate Effects on Mode I Interlaminar Fracture Toughness in Carbon-Fibre/Epoxy and Carbon-Fibre/Toughened-Epoxy Composite Laminates,” ICCM-11, Australia, Volume II: Fatigue, Fracture and Ceramic Matrix Composites, 1997, pp. II-234-243.
Funk, Joan G. and Sykes, G.F., “The Effects of Radiation on the Interlaminar Fracture Toughness of a Graphite/Epoxy Composite,” Journal of Composites Technology and Research, Vol. 8, No. 3, 1986, pp. 241-247.
9-1

Wetherhold, Robert C. and Forand, James A., “Improving Stability in the Double-Cantilever-Beam Fracture Test,” Materials Science and Engineering, Vol. A147, No. 1, 1991, pp. L17-L20.
Brown, H.R., “Mixed-Mode Effects on the Toughness of Polymer Interfaces,” Journal of Materials Science, Vol. 25, 1990, pp. 2792-2794.
El-Senussi, A.K. and Webber, J.P.H., “On the Double Cantilever Beam Technique for Studying Crack Propagation,” Journal of Applied Physics, Vol. 56, No. 4, American Institute of Physics, 1984, pp. 885-889.
Kondo, Kyohei, “Analysis of Double Cantilever Beam Specimen,” Advanced Composite Materials, Vol. 4, No. 4, VSP, 1995, pp. 355-366.
Freund, L.B., “A Simple Model of the Double Cantilever Beam Crack Propagation Specimen,” Journal of the Mechanics and Physics of Solids, Vol. 25, No. 1, Pergamon Press, Great Britain, 1977, pp. 69-79.
Penado, F.E., “A Closed Form Solution for the Energy Release Rate of the Double Cantilever Beam Specimen With an Adhesive Layer,” Journal of Composite Materials, Vol. 27, No. 4, 1993, pp. 383-407.
Valentin, G. and Lahna, F., “Stress Intensity Factor of a Double Cantilever Beam in an Orthotropic Homogeneous Material,” Comptes Rendus de l’Academie des Sciences, Serie II (Mecanique, Physique, Chimie, Sciences de l’Univers, Sciences de la Terre), Vol. 299, No. 3, France, 1984, pp. 85-88.
Chang, D.J., et al., “Double Cantilever Beam Models in Adhesive Mechanics,” International Journal of Solids and Structures, Vol. 12, No. 1, Pergamon Press, Great Britain, 1976, pp. 13-26.
Pradhan, S.C., et al., “Finite Element Analysis of Crack Growth in Adhesively Bonded Joints,” International Journal of Adhesion and Adhesives, Vol. 15, 1995, pp. 33-41.
Fleck, Norman A., et al., “Crack Path Selection in a Brittle Adhesive Layer,” International Journal of Solids and Structures, Vol. 27, No. 13, 1991, pp. 1683-1703.
Mostovoy, S., et al., “Use of Crack-Line-Loaded Specimens for Measuring Plane-Strain Fracture Toughness,” Journal of Materials, Vol. 2, No. 3, 1967, pp. 661-681.
Fichter, W.B., “The Stress Intensity Factor for the Double Cantilever Beam,” International Journal of Fracture, Vol. 22, No. 2, Martinus Nijhoff Publishers, The Hague, Netherlands, 1983, pp. 133-143.
Georgiadis, H.G. and Papadopoulos, G.A., “Elastostatics of the Orthotropic Double-Cantilever-Beam Fracture Specimen,” Journal of Applied Mathematics and Physics, Vol. 42, No. 6, 1990, pp. 889-899.
9-2

Krasovskii, A. Ya, et al., “Determination of the J-Integral on Double Cantilever Beam Specimens at Crack Start and Arrest,” Soviet Materials Science, Vol. 22, No. 2, 1986, 1986, pp. 27-33.
Krasovskii, A. Ya, et al., “Question of Determination of the J-Integral on a Double Cantilever Beam Specimen,” Soviet Materials Science, Vol. 23, No. 2, 1987, pp. 47-51.
Balendran, B., “On the Double Cantilever Beam Specimen for Mode-I Interface Delamination,” Journal of Applied Mechanics, Vol. 61, No. 2, 1996, Transactions of the ASME, 1994, pp. 471-473.
Davidson, B.D., “An Analytical Investigation of Delamination Front Curvature in Double Cantilever Beam Specimens,” Journal of Composite Materials, Vol. 24, No. 11, Technomic Publishing Co., 1990, pp. 1124-1137.
Johnson, W.S. and Mall, S., “Influence of Interface Ply Orientation on Fatigue Damage of Adhesively Bonded Composite Joints,” Journal of Composites Technology and Research, Vol. 8, No. 1, 1986, pp. 3-7.
9-3/9-4