Embed Size (px)
Citation preview

Effects of Special Use Airspace On Economic Benefits'Of Direct Flights
Koushik Datta and Craig Barrington
Abstract
A methodology for estimating the economic effects of Special Use Airspace (SUA) on
direct route flights is presented in this paper. The methodology is based on evaluating operating
costs of aircraft and analyzing the different ground-track distances traveled by flights under
different air traffic scenarios. Using this methodology the following objectives are evaluated:
optimistic bias of studies that assume accessible SUAs, the maximum economic benefit of
dynamic use of SUAs, and the marginal economic benefit of the dynamic use of individual SUAs.
Background
In the current Air Traffic Control (ATC) system, a system of preferred routes has been
established to guide pilots flying under Instrument Flight Rules (IFR) in planning their flight route
and "to aid in the efficient, orderly management of the air traffic using federal airways" (NOAA,
1996). These ATC preferred IFR routes are designed to serve the needs of airspace users and
provide tbr systematic flow of air traffic in the major terminal and en route flight environments.
"Cooperation by all pilots in filing preferred routes will result in fewer traffic delays and will better
provide for efficient departure, en route and arrival air traffic service" (NOAA, 1996). This
system of ATC preferred IFR routes exists only between certain city pairs.
Previous studies have examined the effects of moving from the current ATC system,
which includes a preferred route structure, to a system without preferred routes. Ball et al.
(1995) examined moving to a system which combines wind-optimized routes for flight distances
https://ntrs.nasa.gov/search.jsp?R=20020039157 2020-07-13T20:47:57+00:00Z

greaterthan500 nmanddirect routesfor flight distanceslessthan500 nm. CoulurisandDorskyw
(1995) investigated the potential benefits of moving from ATC preferred routes to user-optimized
routes. Datta and Schultz (1995) examined differences between current ATC preferred route
flights and direct route flights. One simplification common to these studies was the neglect of
effects of Special Use Airspace (SUA) on flight paths, i.e. simulated flights were not required to
avoid SUA. This simplification results in some exaggeration of the benefits of moving from the
current ATC system.
The above mentioned studies were motivated by the need to establish the benefits of a less
restrictive air traffic management scenario called "Free Flight". Direct-route flight is one type of
free flight where aircraft follow the shortest ground-track route from origin to destination.
Whereas ATC preferred routes steer around certain types of SUAs, direct routes may conflict
with one or more inaccessible SUA. In cases where the direct route passes through SUAs, if
access to these SUAs is not available, the shortest path must avoid the SUAs and is, therefore,
longer than the direct route. It should be noted, though, that for most origin-destination airport
pairs in use, there are no intervening SUAs on the direct route.
Special Use Airspace
"Special use airspace consists of airspace of defined dimensions identified by an area on
the surface of the earth wherein activities must be conf'med because of their nature, or wherein
limitations are imposed upon aircraft operations that are not a part of those activities, or both"
(TAB, 1996). SUAs are of the following types - Alert Areas, Controlled Firing Areas, Military
Operations Areas, National Security Areas, Prohibited Areas, Restricted Areas and Warning
Areas. In this study, only Prohibited and Restricted Areas are considered. The others are non-

regulatoryspecialuse airspaceand we assumeunrestrictedaccessto them. From this point
onward, referencesin this paper to SUAs are to a combinationof Prohibited and Restricted
Areas. Commercialaircraft flight is never allowed through Prohibited Areas, whereasit is
sometimespossiblefor commercialaircraft to traversesomerestrictedareas. This is because
manyRestrictedAreasaredesignatedas"joint use"andcommercialflight operationsin theSUA
maybeauthorizedby thecontrollingATC facility whentheSUA is inactive.
Dynamic Use of SUAs
Special use airspace is an important factor affecting free flight. The concept of accessing
SUAs during periods of inactivity suggests the opportunity for economic benefits to all other
airspace users. Increased public access during periods of SUA inactivity is termed "dynamic use
of SUA", and has been identified by the RTCA Task Force 3 (1995) as a concept on the
evolutionary course to free flight. Previous studies (Ball et al., 1995; Couluris et al., 1995; Datta
et al., 1995), which ignored effects of SUAs on direct routes were, in effect, estimating the upper
bound on the economic benefits of Free Flight.
The thrust of this study is to examine the maximal effect of dynamic use of SUAs, i.e,
complete access to SUAs, on the economic benefits of minimum-distance routes. Direct, or great
circle, route flights are compared to shortest route flights avoiding SUAs.
Objectives
The objectives of this study are to evaluate order-0f-magnitud¢ estimates of:
1) the optimistic bias of previous economic analyses which compared ATC preferred route
flights to direct route flights that assumed unrestricted access to SUAs. This analysis focuses
only on air tral'fic on the ATC preferred routes.

2) the maximumpossibleeconomicbenefitof dynamicuseof SUAs comparedto minimum-w
distance routes that avoid SUAs. All traffic is considered in this analysis.
3) the marginal economic benefit of the dynamic use of individual SUAs. And, to identify those
SUAs having the greatest potential benefits. All traffic is considered in this analysis.
This study considers only economic effects of SUAs on flight path length. Potential
conflicts and delays caused by other effects of SUAs, such as air traffic congestion, are not
addressed in this study. For a complete evaluation of the effect of SUAs on air traffic flow safety
and economics, all of these effects Should be considered together.
This study applies only to scheduled, Instrument Flight Rules (IFR) flights. No Visual
Flight Rules (VFR) traffic data was available.
Mathematical Formulation
The indices i, j and k, as subscripts, denote aircraft type, origin-destination airport pair,
and individual SUAs, respectively. Subscripts p, s and d denote ATC preferred route flights,
shortest route flights avoiding SUAs and direct route flights, respectively.
notation is:
Ci =
j_J=
j_Jp=
L0 _
The rest of the
Oi_erating cost rate of aircraft type i ($/nrn/aircraft),
Set of all airport pairs in the traffic schedule,
Set of airport pairs corresponding to all ATC preferred routes that have at least one
flight in the traffic schedule,
Set of all SUAs,
I_, = Set of all SUAs except for the k '_ SUA,

pj -
d j=
sjk =
nij =
Distance of the ATC preferred route for airport pair j (rim),P
Direct route distance of airport pair j (nm),
Shortest route distance avoiding the Lk set of SUAs between airport pairj (nm),
Number of aircraft of type i in the traffic schedule that fly between airport pair j
(aircraft/day),
The cost multiplier ($/nm/day) for the jt_ airport pair is given by:
mj = ,__,inij x c i (1)
The annual cost ($/yr) of aircraft flying on ATC preferred routes for the set of airport pairs Jp, i.e.
those airport pairs having preferred routes between them, is:
C,(Jp)= 365 x _j_G mj × pj (2)
The annual cost ($/yr) of aircraft flying on direct routes for the set of airport pairs Jp is:
Cd(Jp)=365x_,.i_: m,×d j (3)
The annual cost ($/yr) of aircraft flying on shortest routes for the set of airport pairs Jp and
avoiding all the SUAs (Lo set) is:
C,(Jp,O)=365x__,j_, mjx s i o (4)
The annual cost ($/yr) of aircraft flying on direct routes for the set of airport pairs J, i.e. all city
pairs, is:
C,_(J) = 365 x ,_j_jmj x dj (5)

The annualcost ($/yr) of aircraft flying on shortest routes for the set of airport pairs J and
avoidingtheLksetof SUAs,i.e. all SUAsexceptfor thek'h SUA, is:
C,(J,k)= 365 x "_-,s_.'msxs: (6)
In evaluating equations (4) and (6) the SUAs are assumed to be inaccessible at all times.
A check of the SUA times-of-use data showed that 97% of them are either continuously
inaccessible or can be activated by a notice to airmen within a few hours (NFDC, 1995). This
assumption is judged reasonable a posteriori, as the results show that SUAs with the largest
economic effect have continuous times of use.
Based on the above six equations, the three objectives are evaluated as follows:
1) The annual economic benefit of aircraft flying direct routes instead of ATC preferred routes
(Cp(Jp) - Cd(Jp)) is compared against the annual economic benefit of aircraft flying shortest
routes avoiding SUAs instead of ATC preferred routes (Cp(Jp) - C,(Jp,0)). Comparing these in
percentage terms quantifies the optimistic bias of assuming access to all SUAs. Only air
traffic on ATC preferred routes (set Jp) are considered.
2) The annual economic benefit of all aircraft (set J) flying direct routes instead of shortest routes
avoiding SUAs (C,(J,0) - Ca(J)) is an estimate of the maximum economic benefit of dynamic
use of SUAs. This corresponds to a scenario where air traffic always has access to fly
through SUAs at the desired times.
3) Rank in decreasing order the economic benefit of access to a SUA (C,0,0) - C_(J,k) for all k),
i.e., where only one SUA is available for flights through it while all other SUAs are
inaccessible. This is an estimate of the marginal maximum economic benefit of the dynamic
use of a SUA.

Analysis
Data and Software Tools U_ed
IFR traffic schedule: The IFR traffic schedule ftle was obtained from Seagull Technology, Inc.
and represents a typical, busy day in the year 1995. This traffic schedule includes flights either
into and/or out of 70 major US airports, the vast majority of all the scheduled IFR air traffic in the
USA. The schedule specifies each flight's identification number, aircraft equipment type, origin
and destination airport, and scheduled gate arrival and departure time.
ATC preferred route: ATC preferred route data, airways data, airport data, navigation aid data
and fix data were obtained from the FAA's National Flight Data Cenfer (NFDC, 1995). The ATC
preferred route data consists of a combination of airport, airways, navigation aid, fixes, standard
terminal arrival routes and standard instrument departure routes. Software was written to convert
the ATC preferred route data into routes consisting of locations and, further, to evaluate the
length of each route. Some city pairs have more than one high/low altitude ATC preferred IFR
route, for example: one for over-water flight and one for over-land flight. In these cases, the
shortest route was chosen as the desired preferred route. A limitation of the NFDC data base is
that it does not include ATC preferred routes that are defined by a Memorandum of
Understanding or other agreements.
Shortest route avoiding SUA: Software was written to generate the shortest ground-track path
that avoids SUAs between airport pairs and to evaluate the path length. Such paths may follow
the edges of SUAs. SUA boundary data was obtained from the FAA (NFDC, 1995). Only
Prohibited and Restricted SUAs were used in the analysis. These SUAs are shown in Figure I.

L _ l.J ......'...
_°
,)
......... _ ...... i...... ;. u
• II .f"
i!
i
O_
•i_ _.
"1 , " ¢
Figure 1: Prohibited and Restricted Special Use Airspace in Continental USA
Aircraft operating cost rate: Approximate aircraft operating cost rates ($/nm/aircraft) were
obtained by dividing the direct operating cost rates ($/hr) by aircraft cruise speeds (nm/hr). The
direct operating cost rates were obtained from Couluris and Dorsky (1995) for various aircraft
classes, while aircraft cruise speeds were obtained from Abkin and Olmstead (1989) for
representativ, :raft in each aircraft class. This approximation underestimates costs because
aircraft travc )wer during the acceleration-to-cruise and deceleration-from-cruise phases of
flight.
Cruise altitude offlights: The altitude profiles of the flights in the schedule were determined by
the Total Airspace & Airport ModeUer (The Preston Group, 1995) , an air traffic simulation
software package. The software bases its cruise altitude predictions on aircraft performance data,
ATC rules, and the route characteristics.
8

Evaluation
The very large number of aircraft types in the IFR traffic schedule were categorized into
aircraft classes based on attributes significant to cost, as in Couluris and Dorsky (1995), The
significant attributes were: the number of engines (1, 2, 3 or 4), type of engine (jet, turboprop or
piston) and aircraft size (heavy, large-to-heavy, large, large-to-small or small). This
categorization provides a method to correlate direct operating cost rates ($/hr) with aircraft types.
From the IFR traffic schedule data, the 102 aircraft types were categorized into 19 classes. A
typical cruise speed (nm/hr) was then selected for each of these aircraft classes from data in Abkin
and Olmstead (1989). An operating cost rate in S/rim/aircraft was obtained from the ratio of these
two numbers. These cost rates are listed in Table 1 below.
Aircraft classes from Operating cost rate Aircraft classes from Operating cost rate
IFR traffic schedule (S/rim/aircraft) IFR traffic schedule ($/nm/aircraft)
(NT/A) (NT/A)
4J/H 8.08 4T/L 3.86
4J/l., 3.81 2TFL 1.55
3J/H 6.20 2T/S 1.43
3J/L 3.29 IT/S 1.63
2J/H 4.59 4P/L 4.33
2J/LH 3.24 2P/L 3.45
2J/L 2.56 2P/S 1.58
2J/LS 2.36
2J/S 1.72
1.321-2P/S
IP/S 0.75
SST 5.94
Format of aircraft classes is NT/A, where N is number of engines, T is type of engine and A is aircraft size.
Number of engines: 1, 2, 3 or 4 Type of engine: Jet (J), Turboprop (T) or Piston (P)Aircraft size: Small (S), Large-to-smaU (LS), Large (L). Large-to-heavy (LH) or Heavy (H)
Table 1: Aircraft classes and their operating cost rates (in 1995 S/nm/aircraft)
flight.
The operating cost rates of Table 1 represent costs directly related to time spent in actual
q"hey include crew, maintenance and airborne fuel cost rates and do not include passenger
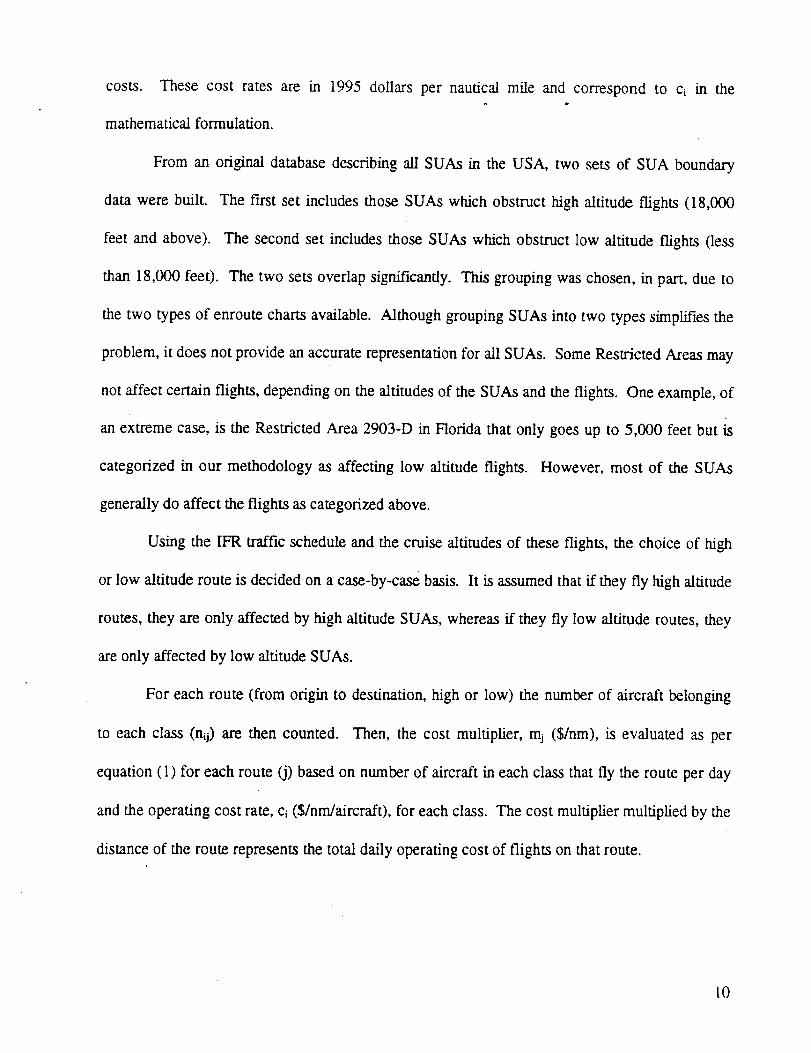
costs. Thesecost rates are in 1995 dollars per nautical mile and correspondto ci i.n the
mathematicalformulation.
From an original databasedescribingall SUAs in the USA, two setsof SUA boundary
datawere built. The first set includesthoseSUAswhich obstructhigh altitude flights (18,000
feet and above). The secondset includesthoseSUAs which obstruct low altitude flights (less
than 18,000feet). The two setsoverlapsignificandy. This groupingwaschosen,in part, due to
thetwo typesof enroutechartsavailable. AlthoughgroupingSUAsinto two typessimplifiesthe
problem,it doesnot provideanaccuraterepresentationfor all SUAs. SomeRestrictedAreasmay
notaffect certainflights,dependingon thealtitudesof theSUAsandtheflights. Oneexample,of
anextremecase,is theRestrictedArea2903-D in Floridathat only goesup to 5,000 feet but is
categorizedin our methodologyas affecting low altitudeflights. However,most of the SUAs
generallydo affect theflights ascategorizedabove.
Using the IFR traffic scheduleandthe cruisealtitudesof these flights, the choice of high
or low altitude route is decided on a case-by-case basis. It is assumed that if they fly high altitude
routes, they are only affected by high altitude SUAs, whereas ff they fly low altitude routes, they
are only affected by low altitude SUAs.
For each route (from origin to destination, high or low) the number of aircraft belonging
to each class (nij) are then counted. Then, the cost multiplier, mj ($/nm), is evaluated as per
equation (1) for each route (j) based on number of aircraft in each class that fly the route per day
and the operating cost rate, ci ($/nrn/aircraft), for each class. The cost multiplier multiplied by the
distance of the route represents the total daily operating cost of flights on that route.
l0

To quantifythe optimistic biasof previousstudiesthat assumeaccessto SUAs for directw
route flights, only fights that qualify for a high or low altitude ATC preferred route are
considered (set Jp). Tower enroute control flights were not considered because these are flights
of shorter length (median length of about 150 nm) and the methodology of this study (based on
$/nm/aircraft derived from cruise speeds) was thought to be less applicable under these
conditions.
For origin-destination airport pairs corresponding to the high and low altitude ATC
preferred routes, flight distances are evaluated on the shortest ATC preferred route (pj), shortest
route avoiding SUAs (sjo), and the direct route (dj). The direct route distance corresponds to the
great circle distance between the airport pairs. The ATC preferred route is longer than or equal
to the shortest route avoiding SUAs, which is longer than or equal to the direct route. Figure 2
presents the curves for two ratios of these distances. The upper curve is the ratio of the shortest
route distance avoiding SUAs to the direct route distance. As seen from the intercept of this
curve, in only about one third of the cases it was actually larger, indicating that in these cases the
direct route passed through a SUA.
distance to the direct route distance.
The lower curve is the ratio of the ATC preferred route
Very few of the route distance ratios are 1.0 indicating that
almost all ATC preferred routes are longer than direct routes. The ATC preferred route distance
was also larger than the length of the shortest route avoiding SUAs, as seen from the difference
between the two curves. These curves provide a preview to the economic benefit results - there is
a larger savings available in moving from ATC preferred routes to direct routes than in moving
from shortest routes avoiding SUAs to direct routes.
11

100% i'-
,..,90%
80%
-_ 70%
4,)
._40%
20%10%
)
0%
.............--'''''''''''''
o
o
o+
.o4,
ii I
,I
l
: Route distance ratios+)
."i
+J
)
....... Preferred / Direct
-- Shortest avoiding SUAs I Direct
1.00 I.I0 1.20 1.30 1.40
Ra(io oCfRoute Distances
Figure 2: Comparison of route distance ratios for city pairs that have ATC preferred routes
For the analysis of maximum economic benefit of dynamic use of SUAs, all IFR flights in
the data base are taken into consideration (set J). For origin-destination airport pairs
corresponding to these flights, distances are evaluated on the shortest route avoiding all SUAs
(Sjo) and the direct route (dj). Again, the length of the shortest route avoiding SUAs must be
greater than or equal to the direct route distance.
For the analysis of marginal economic benefit of dynamic use of SUA groups, only routes
where the shortest distance avoiding SUAs is larger than the great circle distance were
considered. For simplicity, all contiguous SUAs were grouped together and the marginal
economic benefit of the group of contiguous SUAs was calculated. One SUA group (group k)
was then removed from the set of all SUAs (to form set Lk). For all the routes under
consideration, the shortest route distance (s)O avoiding the rest of the SUAs was evaluated. This
process is repeated for each SUA group in turn.
Equations (1) through (6) were evaluated and the desired results are presented in the next
section and in tables 2, 3 and 4.
12

Resultsw
Ali economic benefit results are presented in 1995 dollars. As explained previously, the
aircraft operating cost rates are biased low (conservative), so the total evaluated costs are also
biased low. However, ratios of costs are assumed to be more realistic because the bias is assumed
to affect both the numerator and the denominator of the ratios similarly.
Economic Benefit of Different Air Traffic Flight Scenarios
The results of the comparisons of economic benefits for different flight scenarios are
summarized in Table 2 below. Only 7,566 of the 33,271 IFR flights/day in the schedule had
corresponding ATC preferred routes. These 7,566 flights were first assumed to fly on ATC
preferred routes, then on shortest routes avoiding all SUAs and f'maUy on direct routes. The
difference in distances flown between ATC preferred routes and direct routes for all 7,566 flights
was 220,000 nm per day. This corresponds to a potential, daily operating cost savings of
$693,000 and a potential annual operating cost savings of $253 million. In a previous study
(Couluris and Dorsky, 1995), the savings from user-optimized routes with access through SUAs
Daily fLight distance
savings (i000 nm)
Daily operating cost
savings ($ thousand.)
Annual operating cost
savings ($ million)
Percentage of operating
cost savings
ATC preferred
routes
to Direct routes
ATC preferred routesto Shortest routes
avoidin_ SUAs
Shortest routes
avoiding SUAsto Direct route
220 218 2.6
693 685 8
253 250 3
100% 98.8% 1.2%
Total number of flights per day = 7,566 Total number of routes - 1,075
Table 2: Comparisons of economic benefits (in 1995 $) for different flight scenarios
13

wasestimatedto be$332 million/year. Comparisonof thesetwo resultsshowthat this study's
estimateof the savingsis lower thanthatof CoulurisandDorsky (1995). However,Coulurisand
Dorsky (1995) assumeduser preferred routing (as compared to direct routing) taking into
accountprevailingwinds. Theotherdifferenceis thatthisstudy'sestimatehasaconservativebias
becauseof the useof cruisespeedsin estimatingtheoperatingcost rate($/nm)and the useof a
limited IFR traffic schedule.
When ATC preferredroute flights arecomparedto shortest routesavoidingSUAs, the
total of differencesin the distancesflown is 218,000rim, correspondingto a daily and annual
operatingcost savingsof $685,000and $250 million, respectively. The last columnof Table2
comparesthe shortestroutesavoidingSUAs to direct routes. These resultsare the difference
betweentheprevioustwocolumnsof resultsin Table2.
If the savingsin going from ATC preferredroutesto direct routes is assumedto be the
maximum savingsof a 100%, then when SUAs are taken into account and shortest routes
avoidingSUAsareusedinsteadof direct routestheavailablesavingsis 98.8%. This resultshows
that the estimatesmadewith noconsiderationto SUAsin other studiesareof thecorrect order-
of-magnitude. This result quantifiesobjective 1 of this paper: the optimistic bias of previous
economicanalyseswhich assumedaccessthroughSUAsisonly 1.2%.
Maximum Economic Benefit of Dynamic Lr_e of all SUAs
The results of the analysis of maximum economic benefit of dynamic use of SUAs are
summarized in Table 3 below. When all 33,271 IFR Rights/day on 6,818 routes in the schedule
were flown on shortest routes avoiding SUAs, only 16% of the flights and only 18% of the routes
were affected by SUAs. For flights on these routes, the total of the differences in distances flown
14

betweenshortestroutesavoidingSUAs anddirect routeswas7,000 nm. This correspondsto aw
potential daily and annual operating cost savings of $21,000 and $7.8 million, respectively.
This result quantifies objective 2 of this paper: the maximum economic benefit of dynamic
use of SUAs is about $7.8 million annually. From the IFR schedule, the route with the maximum
savings benefit ($ 520,000 annually) is the Phoenix, AZ to San Francisco, CA route, while the
route with the maximum distance savings (25 nm) is the Las Vegas, NV to San Luis Obispo, CA
route.
Affected by
SUAs
Percentageof IFR
flights
16
Percentageof routes
with IFR
fli_htsw
18
Total number of flights per day = 33,271
Daily flightdistance
difference
(1000 nm)
Daily
operating costdifference
($ thousands)
21
Annual
operating costdifference
($ millions)7.8
Total number of routes = 6,818
Table 3: Economic benefit of dynamic use of SUAs (in 1995 $)
Marginal Economic Benefit of Dynamic Use of One SUA
The results of the analysis of the marginal economic benefit of dynamic use of SUA
groups are summarized in Table 4 below. The SUA groups are ranked in decreasing order of
marginal economic benefit. The top ten are high altitude SUA groups, while the top low altitude
SUA group, near Eglin Air Force Base, Florida, is ranked 19th. These SUA groups and their
locations are shown in Figure 3 - most of these SUAs are located in the western part of the USA.
These western SUAs are also the larger SUAs in the country. However,. the marginal economic
benefit of the SUAs is not solely dependent on size, as seen from Figure 3, where some smaller
SUA groups that affect more flights are ranked higher than others with larger areas. The largest
economic benefit of dynamic use of a SUA group is $ 7600 daily or $ 2.8 million annually for the
i
15

group of SUAs over EdwardsAir Force Baseand Naval Air WeaponsStation, China Lake,u
California. The marginal benefits decrease quite rapidly as the tenth-ranked SUA group has
marginal economic benefits of only $ 0.1 million annually, 4% of the marginal economic benefit of
the first group.
Ranking
1
9
10
19
SUA GroupNames
R-2502E&N, R-2505, R-2508,
R-2515, R-2524over Edwards AFB and NAWS
China Lake, CA
R-5103C&D, R-5107A to G,R-5 I09A&B, R-5111A&C
over White Sands Missile Range,NM
R-4806E&W, R-4807A&B,
R-4808N&S, R-4809
North-west of Nellis AFB, NV
R-6402A&B, R-6405, R-6406A&B,
R-6407
Near Wendover, LIT
R-250 IN,E,W&S
over Twentynine Palms, CA
R-2306A, B,D&E, R-2307,
R-2308A, B&C
Yuma Provin s Ground, AZR-4002, R-4005, R-4006, R-4008,
R-6609
Near NAS Patuxent River, MD
High/Low
High
High
High
High
High
High
High
R-2507N&S
over Chocolate Mountains, CAHigh
Savings in operating costs
Daily Annual
($ thousands) ($ millions)
7.6 2.8
4.7 1.7
2.6 1.0
1.7 0.6
1.3 0.5
0.7 0.3
0.6 (
0.4 0.2
O.4 0.1
0.3 0.t
0.03
R-2301E&W, R-2304, R-2305 HighNear Gila Bend, AZ
HighR-4001A&B
Aberdeen Proving Ground, MD
R-2914A&B, R-2917, R-2918, Low 0.08R-2919A&B
near Eglin AFB, FL
All the above mentioned SUA groups consist of Restricted Areas (indicated by a _reftx R-).
All contiguous SUAs were grouped together by the authors for this analysts.
Table 4: Marginal economic benefit (in 1995 $) rankings for dynamic use of SUA groups
16

This result quantifies objective 3 of the paper: the marginal maximum economic benefit of
dynamic use of one SUA group is about $2.8 million annually.
Figure 3: Groups of SUAs with the largest marginal economic benefit for dynamic use
Conclusions
A methodology was presented for estimating the economic effects of Special Use Airspace
on direct route flights. The results (in 1995 $) for restricted and prohibited areas are summarized
below.
1) The optimistic bias of economic analyses which compared ATC preferred route flights to
direct route flights that ignore the effects of SUAs is only 1.2%. Therefore, when access to
fly through SUAs is not available, 98.8% of the economic benefits of direct route flights are
still realizable.
17

2) The maximum economic benefit of dynamic use of all SUAs is about $7.8 million annually.
This result is based on the scenario where air traffic operating on direct routes that pass
through a SUA have access to fly through that SUA at the desired time.
3) The results show that the top ten SUA groups, those with the largest marginal economic
benefits of the dynamic use of those SUAs, all affect high altitude flights and are typically
located in the western pai:t of the country. The marginal maximum economic benefit of
dynamic use of a SUA group is $2.8 million annually. The SUA group that has the tenth
largest marginal economic benefit corresponds to a savings of only $0.1 million annually. The
marginal maximum economic benefit of dynamic use of a SUA corresponds to a scenario
where only that SUA is available for flights through it, while all others are unavailable.
Many effects of SUAs, such as safety of flight and congestion of traffic, and their
consequences in terms of potential conflicts and delays, are not addressed in this study. For a
complete evaluation of the effect of SUAs all other effects should also be considered along with
the economic benefits.
Current VFR traffic data was not available and is not a part of the analysis. The IFR
traffic schedule which was available and used in the analysis was limited to scheduled flights that
either arrived at, or departed from, one of 70 major US airports. When all VFR and IFR traffic is
considered, the results of objectives 2 and 3 could change significantly.
This study does not evaluate the effects of SUA on wind-optimized routes. However, for
order-of-magnitude results, the trends in this study are thought to be representative.
18
Acknowledgmentsw
This work has been sponsored by NASA Ames Research Center under contract number
NAS2-13767. The authors would like to thank Mr. David Schleicher of NASA Ames for his
encouragement concerning this work. The authors would also like to thank Mr. Russ PaieUi of
NASA Ames and Mr. Win den Braven of Sterling Software for their comments on this paper.
References
1. Abkin, M.H., and Olmstead, J.R. (1989), En Route GPS Benefits Analysis Model: Technical
Documentation, Report to Systems Control Technology, Inc. from ATAC, Mountain View,
CA 94042, January 1989.
2. Ball, M., DeArmon, J.S., and Pyburn, J.O. (1995), Is Free Flight Feasible? Results from
Initial Simulations, Journal of ATC, Official Publication of the Air Traffic Control
Association, Inc., January-March 1995, pages 14-17.
3. Couluris, G.J., and Dorsky, S. (1995), Advanced Air Transportation Technologies (AATT)
Potential Benefits Analysis, Report to NASA Ames from Seagull Technology, Inc.,
Cupertino, CA 95014, September 1995.
4. Datta, K., and Schultz, G. (1995), An Evaluation of TAAMfor Free Flight Modeling, Draft
Report to NASA Ames from Sverdrup Technology, Inc., NASA Ames, Moffett Field, CA
94035, November 1995.
5. NFDC (1995), Airport, Navigation Aid, Fix, Airways, and Preferred IFR Route Listings,
computer data fdes, National Flight Data Center, Federal Aviation Administration,
Washington DC 20591, June 1995.
6. NOAA (1996), United States Government Flight Information Publication, Airport/Facili_
Directory, National Oceanic and Atmospheric Administration, Department of Commerce,
Silver Spring, MD 20910, 29 February 1996.
7. RTCA (1995), Final Report of the RTCA Task Force 3 Free Flight Implementation, RTCA,
Inc., Washington, DC 20036, October 26, 1995.
19

8. TAB (1996), AIM�FAR 1996 Aeronautical Information Manual / Federal Aviation
Regulations, TAB AERO, Blue Ridge Summit, PA 17294.
9. The Preston Group (1995), TAAM, Total Airspace & Airport Modeller, Release 2.9, The
Preston Group Pty Ltd., Richmond, Victoria 312 I, Australia, 1995.
Indexing Terms
Economic Benefits, Special Use Airspace, Dynamic Use of SUA, Direct Route, ATC Preferred
IFR Route, Avoiding SUA.
20