Embed Size (px)
Citation preview

Journal of Hydrology 513 (2014) 81–90
Contents lists available at ScienceDirect
Journal of Hydrology
journal homepage: www.elsevier .com/ locate / jhydrol
Effects of shallow water table, salinity and frequency of irrigation wateron the date palm water use
http://dx.doi.org/10.1016/j.jhydrol.2014.03.0300022-1694/� 2014 Elsevier B.V. All rights reserved.
⇑ Corresponding author. Address: National Engineering School of Gabes, StreetOmar Ibn El Khattab, Zrig, 6029 Gabes, Tunisia. Tel.: +0096895172067.
E-mail address: [email protected] (B. Askri).
Downloaded from http://www.elearnica.ir
Brahim Askri a,⇑, Abdelkader T. Ahmed b, Tarek Abichou c, Rachida Bouhlila d
a Dept. of Civ. Eng., National Eng. School of Gabes, Tunisiab Dept. of Civ. Eng., Faculty of Engineering, Aswan University, Egyptc Dept. of Civ. and Environ. Eng., Florida State University, United Statesd Dept. of Civ. Eng., National Eng. School of Tunis, Tunisia
a r t i c l e i n f o s u m m a r y
Article history:Received 22 May 2013Received in revised form 4 March 2014Accepted 15 March 2014Available online 27 March 2014This manuscript was handled by LaurentCharlet, Editor-in-Chief, with the assistanceof Bibhash Nath, Associate Editor
Keywords:Date palmTranspirationShallow saline groundwaterIrrigation frequencyHYDRUS-1D model
In southern Tunisia oases, waterlogging, salinity, and water shortage represent serious threats to the sus-tainability of irrigated agriculture. Understanding the interaction between these problems and theireffects on root water uptake is fundamental for suggesting possible options of improving land and waterproductivity. In this study, HYDRUS-1D model was used in a plot of farmland located in the Fatnassa oasisto investigate the effects of waterlogging, salinity, and water shortage on the date palm water use. Themodel was calibrated and validated using experimental data of sap flow density of a date palm, soilhydraulic properties, water table depth, and amount of irrigation water. The comparison between pre-dicted and observed data for date palm transpiration rates was acceptable indicating that the modelcould well estimate water consumption of this tree crop. Scenario simulations were performed with dif-ferent water table depths, and salinities and frequencies of irrigation water. The results show that theimpacts of water table depth and irrigation frequency vary according to the season. In summer, high irri-gation frequency and shallow groundwater are needed to maintain high water content and low salinity ofthe root-zone and therefore to increase the date palm transpiration rates. However, these factors have nosignificant effect in winter. The results also reveal that irrigation water salinity has no significant effectunder shallow saline groundwater.
� 2014 Elsevier B.V. All rights reserved.
1. Introduction
Date palm (Phoenix dactylifera, Deglet Nour) is the main fruittree cultivated in Tunisian oases and is naturally adapted todrought conditions in the southern part of the country, whereevapotranspiration exceeds 1500 mm year�1 and rainfall is lessthan 100 mm year�1 (SANYU Consultants INC., 1996). These sys-tems are intensively cultivated and are particularly known for theirimportant biodiversity. Typically, several crops such date palms,fruit trees, and market gardening are cultivated on the same field(Askri et al., 2010). The irrigation water is mainly supplied by theNorthwest Sahara Aquifer System (NWSAS) which consists of thecomplex terminal and the continental intercalary aquifers. Watermanagement in the oases faces several technical and environmen-tal constraints. There are relevant water losses that occur along thewater distribution system, starting from the pumping station until
the parcel entrance. These losses decrease the water discharge.Furthermore, illegal planting of private palm trees on parcels ofland on the periphery of oases has required more water allocationand the irrigation network capacity became unable to satisfy thewater demand (Omrani and Dieter, 2012). These factors inducedwater shortage in the summer season and consequently the inter-val between two irrigation applications extended to more than45 days. Under these conditions, farmers increased the irrigationtime and applied excessive amounts of irrigation water to ensurethat crop needs are fulfilled. As soils are predominantly sandy, suchover-irrigation makes the groundwater table rise up to few centi-metres below land surface, leading to positive salt balance in theroot-zone and chronic waterlogging (Askri et al., 2010). In SouthernTunisia, the areas affected by soil salinisation (soil salinity >4 dS/m) and groundwater rise (average depth <1.5 m) are estimated tobe about 20,000 and 5000 ha, respectively (FAO, 2011). To over-come these problems, a massive effort has been implemented sincethe 1990s with the execution of the APIOS project (Improvement ofIrrigated Areas in Southern Oases) for improving the irrigation anddrainage schemes and increasing farmers’ incomes (SANYU

82 B. Askri et al. / Journal of Hydrology 513 (2014) 81–90
Consultants INC., 1996). The rehabilitation works undertaken al-lowed 25 to 30% saving of water losses, and adding to that the irri-gation interval was shortened by 3 to 2 weeks within therehabilitated oases (SAPI, 2005). Despite these works, the amountsof irrigation water still exceed the crops water requirement,whereas other parcels suffer from the problem of water shortagein the summer season. Sustainable irrigation management in oasesrequires the correct determination of water requirement for crops.
Date palm transpiration in Tunisian oases has been documentedsince the 1970s. El Amami and Laberche (1973) estimated the realwater requirements of this tree crop using the soil method (neu-tron probe and tensiometers). Sellami and Sifaoui (2003) carriedout of sap flow measurements on date palms in the oasis of Tozeurshowing that the variation of sap flow is governed by environmen-tal variables such as soil moisture deficit and vapour pressure def-icit. Recently, Ben Aïssa et al. (2009) used a similar approach toquantify date palm transpiration in the Fatnassa oasis. Theyshowed that this process considerably affects the short termgroundwater regime. However, these studies were based on sim-plifications where the water consumption of date palm was con-sidered independently of the water table depth, root-zonesalinity, fertilizers, and irrigation management. Ghazouani (2009)indicated that the water tale depth has a significant effect(p < 0.05) on date palm quantity and a highly significant effect(p < 0.001) on its quality.
Understanding the interaction between climatic conditions, irri-gation practices, water salinity, groundwater regime, and their ef-fects on root water uptake is fundamental to maintain the existingoases, and thus to ensure the sustainability of date production inSouthern Tunisia. Such effects can be conveniently described usingHYDRUS-1D package that simulates water and solute transfersacross the root-zone (Šimunek and Suarez, 1997). This model soft-ware can evaluate the reduction of transpiration and evaporationfrom their potential to their actual values based on the conditionsprevailing in the soil profile and the specific properties of the veg-etation. The objectives of this study are: (i) to validate the HY-DRUS-1D model for simulating the date palm transpiration undershallow saline groundwater, and (ii) to analyse the individualand combined effects of water table depth, and salinity and fre-quency of irrigation water on root water uptake.
2. Materials and methods
2.1. HYDRUS-1D package software
HYDRUS-1D model (Šimunek et al., 2008) was used to simulatethe one dimensional water flow and salt transport in a variably sat-urated medium. Water flow was simulated with Richards’ equationas follows:
@h@t¼ @
@zK
@h@zþ 1
� �� �� s ð1Þ
where h is the soil water content (L3 L�3), h is the soil pressure head(L), t is the time (T), z is the vertical coordinate (positive upward), Kis the unsaturated hydraulic conductivity (L T�1), and S is a rootextraction term (L3 L�3 T�1). The unsaturated soil hydraulic proper-ties were described using the van Genuchten–Mualem functionalrelationships (Mualem, 1976; van Genuchten, 1980) as follows:
hðhÞ ¼hr þ hs�hr
ð1þjchjnÞm for h < 0
hs for h P 0
(ð2Þ
KðhÞ ¼ KsS1e ½1� ð1� S1=m
e Þm�z
ð3Þ
m ¼ 1� 1=n ð4Þ
where Se is the effective saturation:
Se ¼hðhÞ � hr
hs � hrð5Þ
and where hr and hs are the residual and saturated soil water con-tents (L3 L�3), respectively; Ks is the saturated hydraulic conductiv-ity (L T�1); c is the air entry parameter; n is the pore sizedistribution parameter (–); and l is the pore connectivity parameter,which is always taken as 0.5 (Mualem, 1976).
Salt transport in a homogeneous one-dimensional porous med-ium was computed using the convection–diffusion equation (CDE)as follow:
@hc@t¼ @
@zhD
@c@z� qc
� �� / ð6Þ
where c is the solute concentration of the liquid phase (M L�3), D isa combined diffusion and dispersion coefficient (L2 T�1), and q is thevolumetric flux density given by Darcy law (L T�1), and / is sink orsource for solutes (M L�3 T�1). In this paper, S and / are associatedexclusively with root uptake process. The molecular diffusion underirrigated field conditions is insignificant relative to dispersion, andwas neglected in this study (Mandare et al., 2008).
2.2. Root water uptake
Modelling water uptake with sink terms in Eqs. (1) and (6) is atypical macroscopic approach that averages uptake over a largenumber of roots. It was assumed that the potential root water up-take of the crop can be reduced due to water stress as a result ofthe adopted irrigation schedule. It was also assumed that the po-tential root water uptake can be further reduced by osmotic stress,resulting from the use of saline irrigation water. The effects ofwater and salinity stresses were considered to be multiplicativeas described by van Genuchten (1987):
Sðh;h0; zÞ ¼ a1ðhÞa2ðh0ÞbðzÞTp ð7Þ
where Tp is the potential transpiration rate (L T�1), a1 is the rootwater uptake stress reduction function (0 6 a1 6 1) depending onsoil water pressure, h (L), a2 is the root water uptake stress reduc-tion function (0 6 a2 6 1) depending on osmotic head, h0 (L), b isthe root spatial distribution (L�1). For the a1(h)-function, we usedthe following water stress reduction function proposed by Feddeset al. (1978):
a1ðhÞ ¼
0; h 6 h4 or h > h1h�h4
h3�h4h4 < h 6 h3
1; h3 < h < h2h�h1
h2�h1h2 < h 6 h1
8>>>><>>>>:
ð8Þ
where h1, h2, h3, and h4 are threshold parameters such that wateruptake of date palm is at the potential rate when the soil pressurehead is between h2 and h3, decreases linearly when h > h2 orh < h3, and becomes zero when the soil pressure head is above theanaerobiosis point h1 and below the wilting point h4. The HY-DRUS-1D model includes a database of suggested crop-specificparameters for water uptake. However, the values of h1, h2, h3 andh4 for the date palm are not available.
For the a2(h0)-function, we used the piecewise linear (thresh-old-slope) function proposed by Mass and Hoffman (1977) asfollows:
a2ðh0Þ ¼ 1� b360ðh�0 � h0Þ ð9Þ
where b is the yield reduction as percent per unit increase salinityof soil water as dS m�1, and h�0 is the threshold soil water osmotichead corresponding to the threshold soil water salinity (L). This

Fig. 1. Map of the Fatnassa oasis.
Table 1Composition of irrigation water in the Fatnassa oasis (Bouarfa et al., 2009).
EC Ca Mg Na K Cl SO4 HCO3
(dS m�1) (mmol l�1)
3.97 15.07 9.91 17.43 1.02 22.51 16.57 1.33
B. Askri et al. / Journal of Hydrology 513 (2014) 81–90 83
equation is valid for h0 6 h�0. The threshold salinity level for the datepalm was assumed to be 4 dS m�1; above this value, the root wateruptake declines at a rate of 3.6% per 1 dS m�1 increase in soil salin-ity (Ayers and Westcot, 1985).
The actual transpiration rate, Ta (L T�1), was obtained by inte-grating Eq. (7) over the root domain as follows:
Ta ¼Z
LR
Sðh;h0; zÞdz ¼ Tp
ZLR
a1ðhÞa2ðh0ÞbðzÞdz ð10Þ
where LR is the root depth (L), which can be either constant or var-iable during the simulation.
2.3. Boundary conditions
Implementing the atmospheric boundary condition requiresspecifying irrigation and precipitation rates, as well as the poten-tial evaporation and potential transpiration rates. Potential evapo-transpiration rate (ET0), was computed by the Penman–MonteithFAO-56 approach (Allen et al., 1998). Then, it was partitioned intotwo components, potential transpiration and potential evaporationrates. Potential transpiration rate was computed as follows:
Tp ¼ KcbET0 ð11Þ
where Kcb is the basal crop coefficient for transpiration (–) given byAllen et al. (1998).
The potential evaporation rate Ep (L T�1) from the land surfacewas calculated as follows:
Ep ¼ KeET0 ð12Þ
where Ke is evaporation coefficient (–), which can be modelled asfollows (Allen et al., 1998):
Ke ¼ minðKcmax � Kcb; fKcmaxÞ ð13Þ
where Kcmax is the maximum value of the crop coefficient followingrain or irrigation (–), and f is the fraction of soil not covered byplants and exposed to evaporation (–).
The hourly variations of potential transpiration and potentialevaporation rates were estimated using an approximated diurnalcycle. The hourly rates were assumed to be zero before sunriseand after sunset (Sellami and Sifaoui, 2003). Beginning at sunrise,they were assumed to follow a sinusoidal form that peaks at02:00 PM. The integration on truncated sinusoidal expressionsgives the daily potential transpiration and potential evaporationrates. The diurnal pattern of potential transpiration rate was calcu-lated as follows (modified Liu et al., 2005):
TpðtÞ ¼ 0 t < 0:208d; t > 0:75d
TpðtÞ ¼ p2DL sinðp t
DLÞTp t 2 ð0:208d; 0:75dÞ
(ð14Þ
where Tp(t) is the hourly potential transpiration rate, Tp is the dailypotential transpiration rate, DL is the number of daylight hours, andt is the number of hours since sunrise. The hourly potential evapo-ration rate from land surface was calculated using similar approach.
2.4. Model calibration and validation
2.4.1. Study siteFatnassa is an ancient oasis located in the governorate of Kebili
in southern Tunisia (latitude 33�80N and longitude 8�70E) (Fig. 1).The bioclimatic classification is Saharian. The soils are gypsiferousand saline with sandy texture (Boukhsila, 2011). The electrical con-ductivity of the 0–1.0 m topsoil layer varies between 2.9 and54.0 dS m�1, with an average of 13.1 dS m�1 (Ghazouani, 2009).The most saline areas are located in low zones close to Chott El Jer-id. The water table depth ranges between 0.8 ± 0.24 m in winterand 1.06 ± 0.40 m in summer (Ben Aïssa et al., 2006). The salinity
of the shallow groundwater aquifer varies between 3.78 and11.84 g l�1, with an average of 7.23 g l�1 (Bouarfa et al., 2009).
The oasis covers about 214 ha and is divided into individualplots of farmland of different sizes. The cropping system is com-posed of three distinct crop layers from top to bottom: date palms,fruit trees such as apricot and fig, and fodder crops such as alfalfa.The date palms are all of nearly the same age, the height of theirtrunks is about 8 m, their density is 200 palms ha�1 and the spac-ing between them is 7 m � 7 m. Surface irrigation by flooding isstill the main irrigation system in the oasis. The irrigation waterhas a pH of 7.7 and electrical conductivity of about 4.0 dS m�1 (Ta-ble 1). Sodium Adsorption Ratio (SAR) value is 4.9. The irrigationwater is managed by the Water Users‘ Association of Fatnassafarmers. The irrigation management system, based on rotationdelivery schedule, induces water shortage in summer when thedistribution capacity of the network reaches its limits. Three treat-ments of irrigation periods were adopted in the oasis (Table 2): T1
consists of applying about 10 cm of irrigation water every 44 and36 days in summer and winter seasons, respectively; T2 consistsof applying about 10 cm of irrigation water every 52 and 43 daysin summer and winter seasons, respectively; T3 consists on apply-ing about 10 cm of irrigation water 45 and 41 days in summer andwinter seasons, respectively. The water shortage in summer wasconsidered to be the main cause of the low productivity of the datepalm (Ghazouani, 2009). At the oasis scale, the water shortage andthe irregularity of irrigation frequency are explained by severalreasons such as the leakage of water due to inadequate mainte-nance and repair of the terminal channels, the continuous increaseof irrigated area within the same plot, and the uncontrolled exten-sion of date palm plantations.
2.4.2. Data collection and measurementThe studied period was from July 20 to October 01, 2007. Vari-
ous input parameters needed to calibrate and validate the HY-DRUS-1D model were collected and measured in a 2.0 ha plot offarmland located in the northern part of the Fatnassa oasis. Dailyvalues of rainfall, maximum and minimum temperatures, meanhumidity, and mean wind velocity were obtained from a weatherstation located 9 km east of the oasis. Data of diurnal sap flow den-sity of a mature date palm located in the same plot studied weretaken from Ben Aïssa and Bouarfa (2009). Canopy transpirationwas estimated by multiplying the sap flow density and the

Table 2Mean indicators of irrigation performance in the Fatnassa oasis.
Irrigationtreatment
Actual irrigationintervals (day)
Number ofirrigation events
Annual irrigationwater depth (cm)
Summer Winter Summer Winter
T1 44 36 4 6 100T2 52 43 4 4 80T3 45 41 4 5 90
84 B. Askri et al. / Journal of Hydrology 513 (2014) 81–90
cross-sectional area of the stand per unit area of ground. Hourlywater table depths were measured using a water level sensor (Di-ver DI240, Van Essen Instrument) in a 2.5 m hand-augured well.Soil physical properties and hydraulic parameters were assessedin the plot. Soil samples were collected at three depths below theland surface: 10, 50 and 90 cm. They were air-dried and analysedfor particle size distribution first by mechanically sieving to 2, 1and, 0.5 mm. The <0.5 mm fraction was then analysed using thepipette method in a sedimentation cylinder (Day, 1965). Soil bulkdensity samples were collected from the same soil pit using a100 cm3 cylinder at 20 cm intervals down to 100 cm depth belowthe land surface. The gravimetric water content at the matricpotentials 0, 3.16, 10.0 and 158.50 m was measured in a laboratoryfollowing Richards procedure (Richards, 1947). The permeability ofthe upper soil layer was measured in situ using a double-ring infil-trometer. Infiltration under ponded conditions was conducted bymanual ponding to 3.0 cm depth. The infiltration rate was foundby regressing the recorded cumulative infiltration and time data(Justin et al., 2005).
The depth and distribution of the roots of the monitored datepalm were not measured because the water table was shallow.Toumi (1995) investigated date palm root distribution patternsthrough intensive sampling around a mature date palm (P. dactylif-era, L.) in the modern oasis of Draa, which is located 20 km awayfrom the Fatnassa oasis, and found that date palm root depthreached 2.0 m below the land surface, with 50% of the roots areconcentrated within the 0–1 m layer, and more that 80% withinthe 0–1.5 m layer. Therefore, the modelled rooting depth was setat 2.0 m (Fig. 2). We assumed that the date palm had no need ofexpanding their roots below this depth since the groundwaterwas shallow with a consolidated gypsum layer at the bottom ofthe soil profile (Boukhsila, 2011). The modelled rooting depthwas divided into three zones of different thickness (Oihabi, 1991;Zaid and Jiménez, 2002):
Zone I, called respiratory zone: It is localised at the palm base sur-rounding area with a 0.2 m depth. The roots in this zone play only arespiratory role and are ignored in the simulation process.
Fig. 2. Spatial distribution of root density of date palm tree.
Zone II, called nutritional zone: This is a deep zone between 0.2and 1.5 m depth which contains the highest proportion of primaryand secondary roots. This zone could contain 1000 roots/m2 andmore than 1.60 g of roots/100 g soil. These roots are quite uniform.
Zone III, called absorbing zone: The root density is lower than inzone II, with only about 200 roots/m2. The root density decreaseslinearly from a maximum value at 1.5 m depth to zero at 2.0 mdepth.
2.5. Calibration and validation of HYDRUS-1D model
Water flow and salt transport modelling was carried out for theplot studied considering a uniform and isotropic sandy soil profile200 cm deep. The numerical grid was discretised in 200 nodes of1.0 cm each to form a regular grid 200 cm long. The values of Kcmax
and Kcb for the date palm are 1.20 and 0.85, respectively (Allenet al., 1998). The shaded area of this tree-crop was estimated tobe 40%. From Eq. (13): Ke = min(1.2–0.85, 0.6 � 1.2) = 0.35. Theparameters for root water uptake are not available in the literaturefor date palm. In all simulations, hhigh
3 and hlow3 were set to be 5.0
and 7.0 m, respectively, and h4 to be �150 m, as suggested by Fed-des et al. (1976) for various vegetable crops (Table 3). The values ofh1 and h2 parameters were fixed using a trial-and-error procedurebased on available data from a sap flow study which took placefrom July 20 to August 19, 2007 (DOY 202 to DOY 232). The validityof these parameters was then tested using independent measure-ments of sap flow density from August 20 to October 01 (DOY233 to DOY 275), 2007. The time step of the simulations is onehour. For the initial conditions, we choose a pressure head distribu-tion starting with 300 cm at soil surface and increasing linearly tothe pressure head of 0 cm at the water table. The estimated hourlypotential transpiration and potential evaporation rates were usedfor the atmospheric boundary condition. The hourly values of thebottom pressure head were deduced from the water table depth.For salt transport, the salt concentration at the soil surface corre-sponds to the one of the irrigation water. Given that the groundwa-ter salinity was not measured, a constant salt concentration of7.23 g l�1 was used as the bottom boundary conditions; it corre-sponds to the average salt concentration of the groundwater calcu-lated at the oasis scale.
The accuracy of the simulation results was evaluated by theroot mean square error (RMSE) between the measured and simu-lated sap flow density of the monitored date palm. The RMSEwas calculated as follows:
RMSE ¼ffiffiffiffiffiffiffiffiffiffiffiffiffiffiffiffiffiffiffiffiffiffiffiffiffiffiffiffiffiffiffiffiffi1n
XðOi � PiÞ2
rð15Þ
where n is the number of observations, Oi is the ith measured sapflow density (l s�1), and Pi is the ith predicted sap flow density(l s�1). In addition, regression analyses between the simulated andmeasured daily transpiration rate were performed.
2.6. Numerical experiments
After validating the HYDRUS-1D model, three different sched-ules of irrigation water were designed on the basis of the local irri-gation management. The aim was to identify a water table depthand an irrigation water salinity that were sufficient to maintainthe soil water availability and soil salinity at safe levels, whilemeeting the water requirements of date palm. Root water uptakewas simulated by HYDRUS-1D model with a daily time step duringthe period from May 1, 2003 to April 30, 2007. Simulations wereperformed using different water table depths (WTD), from 0.5 to2.0 m, and irrigation water salinities, from 0 to 4 g l�1. The scenariowith no water table was also considered. The water table was as-

Table 3Soil water and crop parameter values used in the HYDRUS model for estimating datepalm transpiration and soil evaporation in the Fatnassa oasis.
Parameter Value Source
Van Genuchten model parametersVolumetric water content at
saturation hs (cm3 cm�3)0.3 Measured
Residual volumetric watercontent hr (cm3 cm�3)
0.038 Adjusted using the RETCsoftware
c (cm�1) 0.114 Adjsuted using the RETCsoftware
n 1.573 Adjsuted using the RETCsoftware
Ks (cm day�1) 11.0 Measured‘ 0.5 Mualem (1976)
Root water uptake reduction parametersh1 0.0 Model calibrationh2 0.0 Model calibration
hhigh3 (cm) �500 Feddes et al. (1976)
hlow3 (cm) �700 Feddes et al. (1976)
h4 (cm) �15,000 Feddes et al. (1976)
Crop parametersKcb 0.85 Allen et al. (1998)Kcmax 1.20 Allen et al. (1998)f 0.4 Ghazouani (2009)Soil dispersion length (cm) 1.0 Flury et al. (1998), van den
Bosch et al. (1999)
B. Askri et al. / Journal of Hydrology 513 (2014) 81–90 85
sumed to be in hydrostatic equilibrium with the soil profile at thestart of the simulations (initial condition). The initial salt concen-trations were assumed to be 8.38 and 7.23 g l�1, respectively,above and below the water table. For the lower boundary condi-tion, a constant salt concentration of 7.23 g l�1 was assumed.
The irrigation treatments T1, T2 and T3 were simulated using theHYDRUS-1D model to assess the influence of different irrigationschedules on date palm water use.
3. Results and discussion
3.1. Climatic conditions in the Kebili region
The prevailing weather conditions in the Kebili city from Janu-ary 2003 to December, 2007 are shown in Table 4. The data revealthat the mean maximum monthly temperature was 33.3 �C duringthe summer months from June to September, while the mean min-imum monthly temperature was 11.3 �C during the winter monthsfrom December to February. The average relative humidity variedfrom about 29% in July to 66% in December. The annual potentialevapotranspiration (ET0) varied from 2344 to 2670 mm year�1
with an average of 2482 mm year�1. Rainfall was generallyinsignificant.
Fig. 3 shows the daily potential transpiration of date palm with-in the agricultural year 2006–2007 (May through April). It can beseen that Tp increased from 1.8 mm day�1 in February, before thepollination stage, to 19.1 mm day�1 in June at the kalal stage; thenit decreased to 4.1 mm day�1 in September at end of the Tamer
Table 4The average monthly values of daily air temperature, relative humidity (RH), wind speedJanuary 01, 2003 to December 31, 2007.
Parameter January February March April May Jun
Air temperature (�C) 11.3 13.1 17.1 21.3 26.0 30.6RH (%) 58.5 51.5 44.2 42.9 34.3 29.6U (m/s) 3.9 4.2 4.8 5.4 5.7 5.6ET0 (mm/day) 2.6 3.6 5.3 7.1 9.6 11.4Rainfall (mm) 13.9 7.1 8.6 59 4.4 1.7
stage. After the date palm harvest, Tp declined to reach the mini-mum value of 0.6 mm day�1 in December and January, when datepalm was pruned. The maximum values of Tp were 19.1 and16.5 mm day�1 in June and July, respectively, at the fruits forma-tion stage, when air temperature and wind speed were high, andrelative humidity was low.
3.2. Soil physical properties
Soil main physical properties are presented in Table 5. Sandcontent varies from 97.6% to 98.2% and silt from 1.4% to 2.1%. Claycontent also varies from 0.4% to 1.1%. According to the USDA tex-tural classification system, the soil texture is classified as sand (SoilConservation Service, 1972). The hydraulic conductivity of theupper layer is 11 cm h�1. The saturated soil water content (hs) var-ies from 0.28 to 0.32 cm3 cm�3. The vertical distribution of soil tex-ture is quite homogeneous. Thus, the soil hydraulic propertieswere assumed uniform across the soil profile. The unknownparameters (hr, c and n) were predicted using the nonlinearleast-squares optimisation program RETC. vanGenuchten et al.,1991) from average soil water retention data, bulk density, andpercentages of sand, silt, and clay. The saturated soil water contentwas fixed at 0.30 cm3 cm�3, which is the mean value of hs acrossthe soil profile. The estimated values of hr, c and n are 0.038,0.114, and 1.573, respectively. The soil dispersion length was setto 1.0 cm for sandy soil (Flury et al., 1998; van den Bosch et al.,1999).
3.3. Groundwater dynamics
Three irrigation events were recorded in the plot studied duringthe monitored period. The total amount of irrigation water was45 cm (about 15 cm per irrigation event). The water table re-sponded quickly to these recharge events (Fig. 4), but remained be-low the respiratory zone of the date palm. This dynamic responseof the shallow water table was observed in many Tunisian oasesand was explained by the high amounts of irrigation water andthe high infiltration capacity of the sandy soil (Goussi, 1996; Askriet al., 2010).
3.4. Model calibration
Different simulations were carried out to test the role of thea1(h)-function (Eq. (8)) and to estimate the values of the specificcrop parameters h1 and h2. The model is very sensitive to theseparameters as they define the pattern of root water uptake closeto saturation. The best fitting between the measured and predictedsap flow densities is for h1 = h2 = 0 cm with a1(h) close to one in thesaturated zone. To illustrate the performance of HYDRUS-1D mod-el, the time course of simulated sap flow density was compared tothe measured data during 31 days (Fig. 5). The model provides verygood estimates of hourly sap flow compared to the thermal dissi-pation measurements with a relatively small RMSE value of1.31 l h�1. The beginning and the stopping of the sap flowcorresponded with sunrise at 08:00 AM and sunset at 08:00 PM,
(U), Potential evapotranspiration (ET0), and accumulated rainfall at Kebili region from
e July August September October November December
33.3 33.2 28.3 24.8 17.0 12.029.2 32.9 42.9 47.8 55.9 66.2
5.4 5.3 4.8 4.3 3.8 3.811.8 11.0 7.8 5.8 3.4 2.2
0.3 0.9 9.3 8.6 9.8 16.9

Fig. 3. Potential and actual transpiration rate of date palm under different watertable depths (WTD) during the agricultural year 2006–2007.
Fig. 4. Water table depth and amount of irrigation water measurement from Day202 (July 20, 2007) to Day 275 (October 01, 2007) in the parcel studied.
Fig. 5. Time courses of measured (discontinuous line) and simulated (continuousline) values of date palm transpiration rates from Day 202 (July 20, 2007) to Day232 (August 19, 2007), hourly basis.
86 B. Askri et al. / Journal of Hydrology 513 (2014) 81–90
respectively. The sap flow began to rise from 08:00 AM andreached its maximum at 02:00 PM. The model overestimates somevalues of maximum hourly sap flow density. These discrepanciesmay be related to uncertainties in the estimation of potentialevapotranspiration, which was calculated using weather data mea-sured out of the Fatnassa oasis. The multi-layer cropping system in-side the oasis can greatly change the temperatures underneath thecanopy and influence transpiration and evaporation rates (Sellamiand Sifaoui, 1999).
No sap flow reduction was observed even during the two dayswhen the water table level was at 40 cm below the land surfaceor less. Date palm absorbed water without being affected by shal-low saline groundwater. These results show that the root water up-take of this variety of date palm is not affected by the presence of awater-table in its root profile, provided the water table is below itsrespiratory zone.
During the period from July 20 to August 19, 2007, the mea-sured transpiration rate varied between 7.08 and 9.95 mm day�1
with an average of about 8.46 mm day�1 and standard deviationof 1.0 mm day�1, while the simulated transpiration rate varied be-tween 6.34 and 10.38 mm day�1 with an average of 8.23 mm day�1
and a standard deviation of 1.03 mm day�1. The simulated transpi-ration rate tended to follow the 1:1 line (R2 = 0.75) when comparedwith measured values (Fig. 6).
3.5. Model validation
From August 20 to October 01, 2007 there is a good agreementbetween measured and simulated hourly sap flow densities with arelatively small RMSE value of 1.32 l h�1 (Fig. 7). Measured and
Table 5Soil physical and hydraulic properties for soil profile in the plot studied.
Depth (cm) Particle size distribution Bulk density (g/cm3) Volum
Sand (%) Loam (%) Clay (%) Satura
0–15 98.2 1.4 0.4 1.52 0.3115–25 1.55 0.2825–35 1.48 0.2935–45 1.46 0.3045–55 97.4 1.5 1.1 1.51 0.3055–65 1.49 0.3265–75 1.54 0.3075–85 1.55 0.2985–95 97.2 2.1 0.7 1.53 0.3095–105 1.55 0.30
Average 97.6 1.7 0.7 1.52 0.30
simulated sap flow densities were close to zero after sunset and be-fore sunrise, increased at 08:00 AM, reached a maximum at 02:00PM, and decreased after that. The observed peak magnitudes of thehourly sap flow density were over-predicted by the model duringthe first ten days of the simulation and under-predicted duringthe rest of the simulation period. This can be explained partly bythe experimental errors that may influence the water and solutetransfer across the soil profile. Indeed, the measured transpirationrate was given with an error of about 10% in optimal condition;may be more if the hourly values were considered (Cabibel and
etric water content (cm3 cm�3) at
tion Field capacity (�316 cm) �1000 cm Wilting point (�15,850 cm)
0.08 0.06 0.050.05 0.04 0.030.06 0.05 0.040.07 0.05 0.040.07 0.05 0.040.09 0.07 0.060.07 0.06 0.040.06 0.05 0.040.07 0.06 0.040.07 0.06 0.04
0.07 0.06 0.04

Fig. 6. Overall comparison of daily actual transpiration rate of date palm betweenmeasurement and simulation in the calibration experiment; regression coefficientR2 = 0.75.
Fig. 8. Overall comparison of daily actual transpiration rate of date palm betweenmeasurement and simulation in the validation experiment; regression coefficientR2 = 0.65.
B. Askri et al. / Journal of Hydrology 513 (2014) 81–90 87
Do, 1991). Furthermore, the amounts of irrigation water were esti-mated with an error of about 10%.
The measured transpiration rate of the date palm varied be-tween 4.8 and 9.5 mm day�1 with an average of 7.1 mm day�1,while the simulated rates ranged between 3.9 and 9.3 mm day�1
with an average of 6.4 mm day�1. The coefficient of correlation(R2 = 0.66) shows an acceptable correlation between measuredand simulated daily transpiration rates (Fig. 8).
3.6. Numerical experiments
3.6.1. Effect of water table depth on the date palm water useThe effect of change in water table depth on the date palm
water use (transpiration) was analysed for the irrigation watertreatment T1 with a salt concentration of irrigation water close to2.56 g l�1. A constant pressure head (corresponding to the positionof the water table) was used as bottom boundary condition.
Daily variation in actual transpiration rate during the agricul-tural year 2006–2007 (May 2006 through April 2007) is shown inFig. 3 for different water table depths. This rate ranged from 0.3to 6.8 mm day�1, with an average of 2.2 mm day�1, and from 0.4to 9.1 mm day�1, with an average of 2.4 mm day�1 forWTD = 100 cm and WTD = 200 cm, respectively. Increasing thewater table depth from 100 to 200 cm decreases the actualevaporation rate at the soil surface and consequently decreases
Fig. 7. Time courses of measured (discontinuous line) and simulated (continuousline) values of date palm transpiration rates from Day 233 (August 20, 2007) to Day275 (October 01, 2007), hourly basis.
the root-zone salinity. In fact, the evaporation rate depends uponwater table depth and decreases as this depth increases (data arenot shown). For comparison, daily measured transpiration rate ofdate palm ranged from 1.9 to 9.9 mm day�1 in the semi-arid envi-ronment of Jordan Valley (Mazahrih et al., 2012), and from 1.9 to7.3 mm day�1 in the arid region of the middles Kingdom of SaudiArabia (Kassem, 2007).
Simulation scenarios reveal that in summer season, the actualtranspiration was significantly less than the potential one becausethe water content in the root-zone was too low and its salinity wastoo high to sustain the potential uptake rate. For WTD = 200 cm,the mean water content of the root-zone was between 0.04 and0.18 cm3 cm�3, with an average of 0.07 cm3 cm�3; and the meanroot zone-salinity was between 13.5 and 22.2 g l�1, with an aver-age of 19.2 g l�1 (data are not shown). These values of salinityare higher than the Mass and Hoffman (1977) threshold valuesfor date palm salt tolerance. This means that an irrigation intervalof 44 days in summer may induce a sever water and salinity stress.A deep water table considerably decreases the actual transpirationduring periods when no rainfall and no irrigation occur. This rein-forces the point that this tree crop is able to meet its water needswith shallow groundwater despite its high salinity.
In winter, the actual transpiration rate has little variations from0.3 to 1.2 mm day�1 and from 0.4 to 1.9 mm day�1 forWTD = 100 cm and WTD = 200 cm, respectively. These resultsshow that during this cold and wet season, the effect of water tabledepth on the date palm water use is not significant. For all scenar-ios, the actual transpiration rate was very close to the potential onebecause the mean water content of the root-zone was high and themean root-zone salinity was relatively low. In winter, the datepalm transpiration seems to be not affected by the low irrigationfrequency even when the water table is deep.
Relative transpiration of a crop was defined as the ratio of thecumulative annual actual transpiration to the cumulative annualpotential transpiration under no-drought and no-salinity stressconditions. The influences of water table depth on mean root-zonesalinity and relative transpiration are shown in Fig. 9 for the agri-cultural year 2006–2007. The scenario with WTD = 75 cm has thehighest relative transpiration (48%), and the scenario withWTD = 100 cm the lowest one (34%). The date palm transpirationwas likely hampered by salt stress. When the water table depth in-creased from 50 to 75 cm, the mean annual root-zone salinity de-creased by about 2 g l�1 and the relative transpiration increased byabout 6%. In this case, soil desalinisation occurred due to the mix-ing of the bottom upflow solution with the root zone solution.Increasing the water table depth from 50 to 75 cm decreases the

Fig. 9. Effects of water table depth on relative transpiration of date palm and meanroot zone salinity.
Fig. 10. Daily actual transpiration rate of date palm under different concentrationsof irrigation water during the agricultural year 2006–2007.
Fig. 11. Relative transpiration of date palm and mean root zone salinity fordifferent concentrations of irrigation water.
88 B. Askri et al. / Journal of Hydrology 513 (2014) 81–90
root-zone water storage and consequently increases the bottomupflow rate to maintain this depth constant. The mixing of7.23 g l�1 upflow solution with higher than 13 g l�1 root-zone solu-tion leads to its dilution. The mean root-zone salinity increased byabout 3 g l�1 and consequently the relative transpiration decreasedby about 13% when the water table depth increased from 75 to100 cm. For the last depth, the capillary action does not carry waterto the unsaturated zone as fast as evaporation takes it away. Due tothe drying of the unsaturated zone, evaporation from the soil sur-face induced soil salinisation. Finally, the increase in water tabledepth from 100 to 200 cm induced a linearly decrease of the meanannual root-zone salinity from 20 to 16 g l�1. In this case, the soildesalinisation is explained by the decrease in actual evaporationat the soil surface. For comparison, the average annual root-zonesalinity for WTD = 75 cm was higher than that for WTD = 200 cm,while the highest relative transpiration corresponded to the firstwater table depth. This result shows that the environmental stresson the date palm water use was not effectively alleviated with thedecline of salt storage because of concurrent decrease in watercontent of the root-zone.
3.6.2. Effect of irrigation water salinity on date palm water useThe effect of change in irrigation water salinity on actual tran-
spiration of the date palm was simulated without water table toavoid the influence of groundwater on this process. The bottomboundary conditions were defined as free drainage for water andzero concentration gradient for salt transport.
Fig. 10 shows the daily variation in actual transpiration rateduring the agricultural year 2006–2007 for different irrigationwater salinities. In summer, the actual transpiration rate was sig-nificantly low during periods without irrigation or rainfall. Afterirrigation and rainfall events, the date palm responded quickly towater input for all salinities of irrigation water. In winter, the ac-tual transpiration rate has an increasing trend which is indepen-dent of water input, but closely related to meteorological factorssuch as temperature and humidity.
Fig. 11 shows the average root-zone salinity and relative tran-spiration under different irrigation water salinities. Average root-zone salinity increased and relative transpiration decreased withincreased irrigation water salinity. The relative transpiration de-creases from 34% to 30% if this salinity increases from 0 to4 g l�1. The low values of relative transpiration are explainedmainly by the low irrigation frequency. Date palm is consideredas one of the most tolerant crops to salinity; it is slightly affectedby salinity stress. A previous study conducted in an Egyptian oasisshowed that date palm can produce full yield if it was irrigated
with saline water up to 2 g l�1 but the date palm yield was reducedby about 10%, 25%, and 50% if the irrigation water salinity rises to 3,5, and 8 g l�1, respectively (El-Bana and Ibrahim, 2008). In Werglabasin (north-eastern Sahara in Algeria), the impact of soil salinityon date palm yield was not significant when the groundwaterwas shallow (Bouhoun et al., 2011).
3.6.3. Combined effects of water table depth and irrigation watersalinity on date palm water use
Simulation results indicate that relative transpiration is low inall scenarios (Fig. 12). Relative transpiration ranges from 33% for100 cm water table depth and an irrigation water salinity closeto 4.0 g l�1 to 50% for 75 cm water table depth and irrigation waterfree of salt.
The analysis of the interaction between water table depth andirrigation water salinity shows that there is no significant effectof water salinity on relative transpiration when the water table isshallow. For WTD = 50 cm, the increase in salinity from 0 to4 g l�1 decreases the relative transpiration by only 4%. In contrast,the effect is more significant if the water table is deep. ForWTD = 200 cm, the increase in salinity from 0 to 4 g l�1 decreasesthe relative transpiration by 9%. The effect of water table depthon relative transpiration is significant for all irrigation water salin-ities. For irrigation water salinity close to zero, the relative transpi-ration decreases by 12% when the water table depth increases from75 to 100 cm.
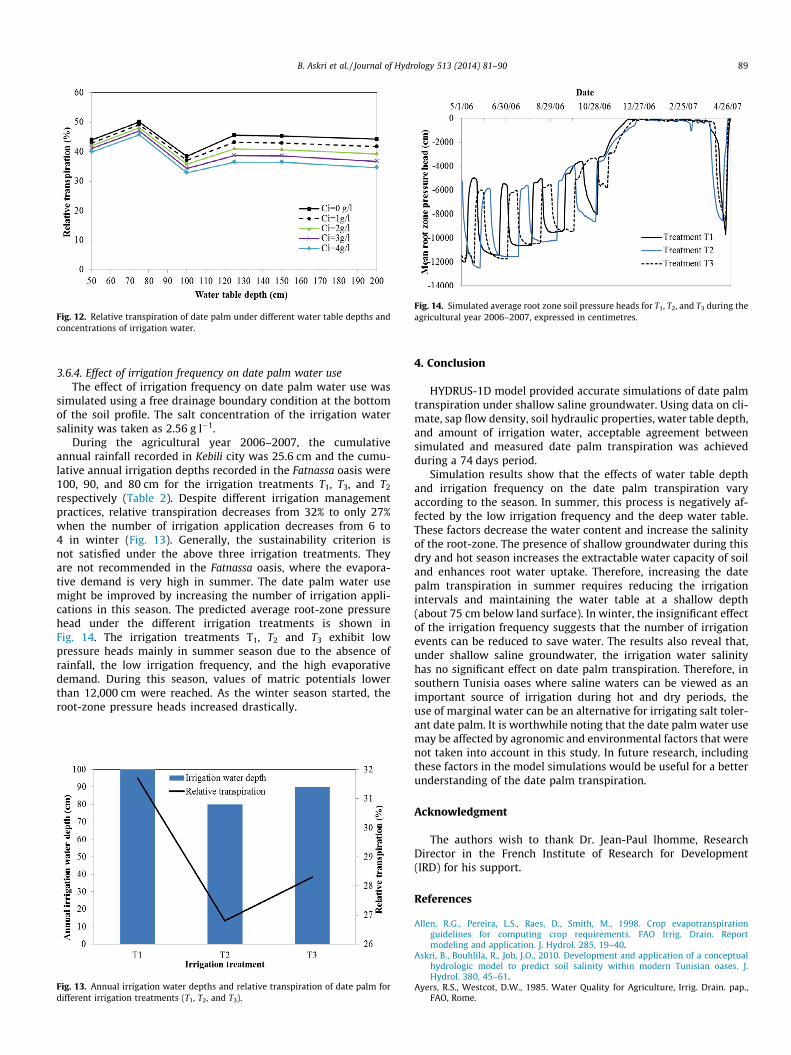
Fig. 12. Relative transpiration of date palm under different water table depths andconcentrations of irrigation water.
Fig. 14. Simulated average root zone soil pressure heads for T1, T2, and T3 during theagricultural year 2006–2007, expressed in centimetres.
B. Askri et al. / Journal of Hydrology 513 (2014) 81–90 89
3.6.4. Effect of irrigation frequency on date palm water useThe effect of irrigation frequency on date palm water use was
simulated using a free drainage boundary condition at the bottomof the soil profile. The salt concentration of the irrigation watersalinity was taken as 2.56 g l�1.
During the agricultural year 2006–2007, the cumulativeannual rainfall recorded in Kebili city was 25.6 cm and the cumu-lative annual irrigation depths recorded in the Fatnassa oasis were100, 90, and 80 cm for the irrigation treatments T1, T3, and T2
respectively (Table 2). Despite different irrigation managementpractices, relative transpiration decreases from 32% to only 27%when the number of irrigation application decreases from 6 to4 in winter (Fig. 13). Generally, the sustainability criterion isnot satisfied under the above three irrigation treatments. Theyare not recommended in the Fatnassa oasis, where the evapora-tive demand is very high in summer. The date palm water usemight be improved by increasing the number of irrigation appli-cations in this season. The predicted average root-zone pressurehead under the different irrigation treatments is shown inFig. 14. The irrigation treatments T1, T2 and T3 exhibit lowpressure heads mainly in summer season due to the absence ofrainfall, the low irrigation frequency, and the high evaporativedemand. During this season, values of matric potentials lowerthan 12,000 cm were reached. As the winter season started, theroot-zone pressure heads increased drastically.
Fig. 13. Annual irrigation water depths and relative transpiration of date palm fordifferent irrigation treatments (T1, T2, and T3).
4. Conclusion
HYDRUS-1D model provided accurate simulations of date palmtranspiration under shallow saline groundwater. Using data on cli-mate, sap flow density, soil hydraulic properties, water table depth,and amount of irrigation water, acceptable agreement betweensimulated and measured date palm transpiration was achievedduring a 74 days period.
Simulation results show that the effects of water table depthand irrigation frequency on the date palm transpiration varyaccording to the season. In summer, this process is negatively af-fected by the low irrigation frequency and the deep water table.These factors decrease the water content and increase the salinityof the root-zone. The presence of shallow groundwater during thisdry and hot season increases the extractable water capacity of soiland enhances root water uptake. Therefore, increasing the datepalm transpiration in summer requires reducing the irrigationintervals and maintaining the water table at a shallow depth(about 75 cm below land surface). In winter, the insignificant effectof the irrigation frequency suggests that the number of irrigationevents can be reduced to save water. The results also reveal that,under shallow saline groundwater, the irrigation water salinityhas no significant effect on date palm transpiration. Therefore, insouthern Tunisia oases where saline waters can be viewed as animportant source of irrigation during hot and dry periods, theuse of marginal water can be an alternative for irrigating salt toler-ant date palm. It is worthwhile noting that the date palm water usemay be affected by agronomic and environmental factors that werenot taken into account in this study. In future research, includingthese factors in the model simulations would be useful for a betterunderstanding of the date palm transpiration.
Acknowledgment
The authors wish to thank Dr. Jean-Paul lhomme, ResearchDirector in the French Institute of Research for Development(IRD) for his support.
References
Allen, R.G., Pereira, L.S., Raes, D., Smith, M., 1998. Crop evapotranspirationguidelines for computing crop requirements. FAO Irrig. Drain. Reportmodeling and application. J. Hydrol. 285, 19–40.
Askri, B., Bouhlila, R., Job, J.O., 2010. Development and application of a conceptualhydrologic model to predict soil salinity within modern Tunisian oases. J.Hydrol. 380, 45–61.
Ayers, R.S., Westcot, D.W., 1985. Water Quality for Agriculture, Irrig. Drain. pap.,FAO, Rome.

90 B. Askri et al. / Journal of Hydrology 513 (2014) 81–90
Ben Aïssa, I., Bouarfa, S., Perrier, A., 2009. Utilisation de la mesure thermique du fluxde sève pour l’évaluation de la transpiration d’un palmier dattier. Actes duquatrième atelier régional du projet Sirma, Mostaganem, Algérie, 26–28 mai2008. Cirad, Montpellier, France, colloques-cédérom, pp. 12.
Ben Aïssa, I., Bouarfa, S. Bouksila, F., Bahri, A., Vincent, B., Chaumont, C., 2006.Fonctionnement du drainage au sein d’une oasis modernisée du sudtunisien. Cas de l’oasis de Fatnassa Nord à Kébili, Tunisie. Actes dudeuxième atelier régional du projet Sirma, Marrakech, Maroc, 29–31 mai2006, pp. 13.
Bouarfa, S., Marlet, S., Douaoui, A., Hartani, T., Mekki, I., Ghazouani, W., 2009. BenAissa, I., Vincent, B., Hassani, F., Kuper, M., Salinity patterns in irrigationsystems, a threat to be demystified, a constraint to be managed: Field evidencefrom Algeria and Tunisia. Irrigation and Drainage 58 (S3), 231–369.
Bouarfa, S., Marlet, S., Douaoui, A., Hartani, T., Mekki, I., Ghazouani, W., Ben Aïssa, I.,Vincent, B., Bouhoun, M.D., Marlet, S., Brinis, L., Lakhdar Saker, M., Rabier, J.,Marc, C., 2011. A survey of the combined effects of water logging and salinity onfruit yield in the date palm groves of the Wargla basin, Algeria. Fruits 66 (1), 11–24.
Boukhsila, F., 2011. Sustainability of Irrigated Agriculture Under Salinity Pressure –a Study in Semiarid Tunisia. Doctoral Thesis. Lund University. 57p.
Cabibel, B., Do, F., 1991. Mesures thermiques des flux de sève dans les troncs et lesracines et fonctionnement hydrique des arbres. I. Analyse théorique des erreurssur la mesure des flux et validation des mesures en présence de gradientsthermiques extérieurs. Agron 11, 669–678.
Day, P.R., 1965. Particle fractionation and particle-size analysis. In: Black, C.A. et al.(Ed.), Methods of Soil Analysis, Part 1. Agron. 9, 545–567.
El Amami, S., Laberche, J.C., 1973. Climats et microclimats des oasis de Gabescompares a l’environment desertique. Ann. INRAT, 41(3), 20p.
El-Bana, A., Ibrahim, H.A., 2008. Irrigated date Palm Production in Egypt. Workshopon ‘‘Irrigation of Date Palm and Associated Crops’’. Damascus, Syrian ArabRepublic, 27–30 May 2007, 25–30.
Food and Agriculture Organization of the United Nations (FAO), 2011. Water Qualityfor Agriculture. <http://www.fao.org/DOCREP/003/T0234E/T0234E02.htm>.
Feddes, R.A., Kowalik, P.J., Kolinska-Malinka, K., Zaradny, H., 1976. Simulation offield water uptake by plants using a soil water dependent root extractionfunction. J. Hydrol. 31, 13–26.
Feddes, R.A., Kowalik, P.J., Zaradny, H., 1978. Simulation of Field Water used andCrop Yield. Simulation Monographs, Pudoc, Wageningen, pp. 189.
Flury, M., Yates, M.V., Jury, W.A., Anderson, D.L., 1998.Variability of solute transportin field lysimeters. In: ACS Symp. Ser. 699, 65–75.
Ghazouani, W., 2009. De l’identification des contraintes environnementales àl’évaluation des performances agronomiques dans un système irrigué collectif.Cas de l’oasis de Fatnassa (Nefzaoua, sud tunisien). PhD de l’Ecole Nationale dugénie Rural, des Eaux et des Forêts, Montpellier, France. pp. 154.
Goussi, L., 1996. Contribution à l’évaluation du fonctionnement du réseau dedrainage enterré. Cas du réseau de drainage de l’oasis Ibn Chabbat à Tozeur,Mémoire de projet de fin d’études à l’INAT, 98pp.
Justin, H.G., Michael, D.D., Grady, L.M., Pierce, H.J., 2005. Analysis of Double-RingInfiltration Techniques and Development of a Simple Automatic Water DeliverySystem. Plant Management Network.
Kassem, M.A., 2007. Water requirements and crop coefficient of date palm trees‘‘Sukariah CV’’. Misr J. Ag. Eng. 24 (2), 339–359.
Liu S., Graham, W.D., Jacobs, J.M., 2005. Daily potential evapotranspiration anddiurnal climate forcings: influence on the numerical modelling of soil waterdynamics and evapotranspiration. J. Hydrol. 309, 39–52.
Mandare, A.B., Ambast, S.K., Tyagi, N.K., Sing, J., 2008. On-farm water managementin saline groundwater area under scarce canal water supply condition in theNorthwest India. Agric. Water Manage. 96, 516–526.
Mass, E.V., Hoffman, G.J., 1977. Crop salt tolerance-current assessment. J. Irr. Drain.Eng. Div. Am. Soc. Civ. Eng. 103, 115–134.
Mazahrih, N.T., AL-Zubi, Y., Ghnaim, H., Lababdeh, L., 2012. Determination Actualevapotranspiration and crop coefficients of date palm trees (Phoenix dactylifera)in the Jordan Valley. American–Eurasian J. Agric. Environ. Sci. 12 (4), 434–443.
Mualem, Y., 1976. A new model for predicting the hydraulic conductivity ofunsaturated porous media. Water Resour. Res. 12, 513–522.
Oihabi, A., 1991. Effect of Vesicular Arbuscular Mycorrhizae on Bayoud Disease andDate Palm Nutritious. Ph-D thesis. University of Marrakech, Morocco.
Omrani, N., Dieter, B., 2012. Water management issue in Southern Tunisia under aclimate change context. Clim. Change Manage., 225–235.
Richards, L.A., 1947. Pressure membrane apparatus – construction and use. Agr.Eng. 28, 451–454.
SANYU Consultants INC. 1996. Projet d’amélioration des périmètres irrigués dansles oasis du sud en république de Tunisie. Agence japonaise de coopérationinternationale. Rapport final, pp. 300.
SAPI (Assistance Spéciale pour l’Exécution du Projet), 2005. Projet d’Améliorationdes Périmètres irrigués des oasis du Sud de la Tunisie (TS-P10), Final Report.
Sellami, M.H., Sifaoui, M.S., 1999. Modelling solar radiative transfer inside the oasisExperimental validation. J.Q.S.R.T. 63, 85–96.
Sellami, M.H., Sifaoui, M.S., 2003. Estimating transpiration in an intercroppingsystem: measuring sap flow inside the oasis. Agric. Water Manage. 59, 191–204.
Šimunek, J., Suarez, D.L., 1997. Sodic soil reclamation using multicomponenttransport modeling. ASCE J. Irrig. Drain. Eng. 123 (5), 367–376.
Šimunek, J., van Genuchten, M.T., Šejna, M., 2008. Development and applications ofthe HYDRUS and STANMOD software packages and related codes. Vadose ZoneJ. 7 (2), 587–600.
Soil Conservation Service, 1972. National Engineering Handbook: Hydrology,Section 4. USDA.SCS, Washington, DC.
Toumi, A., 1995. Analyse et diagnostique de l’irrigation dans l’oasis moderne deDraa Sud (Tozeur). Sols de Tunisie, Bulletin de la Direction des Sols, 59–71.
van den Bosch, H., Ritsema, C.J., Boesten, J.J., Dekker, L.W., Hamminga, W., 1999.Simulation of water flow and bromide transport in a water repellent sandy soilusing a one-dimensional convection-dispersion model. J. Hydrol. 215 (1–4),172–187.
Van Genuchten, M.Th., 1980. A closed form equation for predicting the hydraulicconductivity of unsaturated soils. Soil Sci. Soc. Am. J. 44, 892–898.
Van Genuchten, M. Th., 1987. A Numerical Model for Water and Solute Movementin and below the Root Zone. Res. Rep. 121, U.S. Salinity Lab., USDA-ARS,Riverside, CA.
vanGenuchten, M.Th., Leij, F.J., Yates, S.R., 1991. The RETC Code for Quantifying theHydraulic Functions of Unsaturated Soils, Version 1.0.EPA Report 600/2-91/065,U.S. Salinity Laboratory, USDA, ARS, Riverside, California.
Zaid, A., Jiménez, E.J., 2002. Date Palm Cultivation. Chapter I: Botanical andSystematic Description of the date Palm. FAO Plant Production and ProtectionPaper 156 Rev. 1.