Embed Size (px)
Citation preview

Effects of Seated Whole-Body Vibration on
Spinal Stability Control
Gregory P Slota
Dissertation submitted to the Faculty of the Virginia Polytechnic Institute and State University
In partial fulfillment of the requirements for the degree of
Doctor of Philosophy in
Biomedical Engineering
Kevin P. Granata, Chair Michael L. Madigan, Co-Chair
John W. Grant Maury A Nussbaum
Thurmon E. Lockhart Sara E Wilson, University of Kansas
November 14th, 2008 Blacksburg, Virginia
Keywords: Stability, Spine, Whole-body vibration
Copyright 2008, Gregory P. Slota

ABSTRACT
Effects of Seated Whole-Body Vibration on Spinal Stability Control
Gregory P Slota
Low back disorders and their prevention is of great importance for companies and their employees. Whole-body vibration is a risk factor for low back disorders, but the neuromuscular, biomechanical, and/or physiological mechanisms responsible for this increased risk are unclear. These studies investigated changes in the biomechanics and control of the trunk in order to further the understanding of the mechanisms responsible for this increased risk.
The purpose of the first study was to measure the acute effect of seated whole-
body vibration on the postural control of the trunk during unstable seated balance. The findings show that whole-body vibration impaired the postural control of the trunk as evidenced by increased kinematic variance and non-linear stability control measures during unstable sitting. These findings imply an impairment in spinal stability control
The purpose of the second study was to measure the effect of seated whole-body
vibration on the parameters of spinal stability control: passive stiffness, active stiffness, and neuromuscular reflexes. The findings show that whole-body vibration altered trunk stiffness (passive stiffness and equivalent reflex stiffness) as well as reflex dynamics. There was no evidence of compensation by active muscle co-contraction recruitment for the decreased trunk stiffness and reflex gain.
The purpose of the third study was to measure the changes in the natural
frequency characteristics of the trunk (which can be related to trunk stiffness and damping) during exposure to seated whole-body vibration. The findings show that whole-body vibration caused a decrease in natural frequency suggesting a decrease in the trunk stiffness, and also an increase in the peak amplitude of the frequency response functions suggesting a decrease in overall trunk damping. The rate of change of the natural frequency characteristics suggest that the majority of effects happen within the first 10 minutes of vibration exposure. These findings reveal changes in the biomechanical properties of the trunk with exposure to seated whole body vibration, and a mechanism by which vibration may increase the risk of low back injury.

Dedication
This work is dedicated to
DR. KEVIN P. GRANATA
I first started to work for Dr. Granata back in the spring semester of 2000 at the University of Virginia in the Kluge Children’s Rehabilitation Center. First working for free to show my worth, then being picked up and funded that summer. In December of 2002 I defended my master’s thesis and prepared for the moving of the lab. Starting January 1st, 2003, the lab of Dr. Granata, along with Shawn Russell and myself, was now a part of Virginia Tech in the ESM and emerging Biomedical Engineering departments. During the start-up of the lab, I was hired on as a research associate faculty member to assist with the grant work and working with the new students of the lab group. By that August I was enrolled as a PhD student with Dr. Granata as my advisor again. Throughout the years, I have worked with Dr. Granata and the lab on many projects. The final project I was in charge of was a new frontier of the lab, whole-body vibration. After completing a pilot study, we worked on a grant proposal to fund and continue the project further. While midway through data collection on my first main study, the tragedy of April 16th, 2007 came to be. In memory, and with the dedication that he had for his own work, I pushed on to complete the first study, as well as finish the line of work on WBV.
In his honor, the lab has been renamed
The Kevin P. Granata Musculoskeletal Biomechanics Laboratory
iii

Acknowledgements
Duncan Hall For his assistance in creating the vibration platform and greatly needed assistance
with creating the computer control of the shaker. For the countless effort wrestling Simulink, though it may look like Labview, and it may be a Matlab program, it behaves like neither. Emmanuel Ekwueme
For his assistance with the first study’s data collection. Emily Miller
For her assistance with the second and third studies. Including the experiment set-up, protocol authoring, data collection, and keeping the data collection atmosphere. Additional thanks are needed for her laptop that provided the distraction of subjects’ boredom when considering that people had to sit for 30 minutes not doing anything for three different visits. And last but not least is her organizational skills in handling the 20 subjects, for 3 visits each, over the course of 5 weeks, where anybody who started the study was able to finished the study. Jul Davis For being a sounding board for problem solving. For his laughter that can be heard though out Norris Hall. Not for poking his head in, seeing me acting as the subject, all connected to the equipment, asking “Are his hands tied?” Mike Diersing For all the help with design / building of the wobble chair, all three of them. For the assistance in the lab with equipment, purchasing, and building. And for trips to the gym, to work out the body when the mind has had enough. ESM Dept, et al For all the assistance to continue and complete my studies following the events of April 16th, even though my project was not directly funded. May the Low Back Lab be able to continue on and not just pass out of sight. Norris Hall For being a home away from home. For still standing even after all the equipment that we have attached to the walls or sat on the floor, shaking and perturbing people as well as being heard though out the building. Funding
The projects were supported, in part, by Grant Number R01 AR046111 from NIAMS of NIH.
iv

Table of Contents Chapter 1 : Literature Review 1.1 Low Back Pain 1 1.1.1 Risk Factors 2 1.1.2 Individual Risk Factors 2 1.1.3 Occupational Risk Factors 5 1.1.4 Psychological & Psychosocial Risk Factors 7 1.1.5 Differences between individuals with and without LBP 8 1.2 Vibration 9 1.2.1 Epidemiological Evidence 9 1.2.2 Vibration and Low Back Pain 10 1.2.2.1 Nervous System 11 1.2.2.2 Muscles System 12 1.2.2.3 System of Passive Tissues 14 1.2.3 Measuring of Vibration Exposure 15 1.2.3.1 Vibration Characteristics 15 1.2.3.2 Apparent Mass 16 1.2.3.3 Transmissibility 19 1.2.3.4 Human Vibration Dynamics 23 1.3 References 27 Chapter 2 : Preface to Studies 35
v

Chapter 3 : Effects of Seated Whole-Body Vibration on Postural Control of the Trunk
During Unstable Seated Balance
3.1 Title 39 3.2 Abstract 40 3.3 Introduction 41 3.4 Materials & Methods 44 3.4.1 Apparatus Design 44 3.4.2 Experimental Protocol 48 3.5 Results 53 3.6 Discussion 55 3.7 Conclusion 58 3.8 References 59
Chapter 4 :
Effects of Seated Whole-Body Vibration on Spinal Stability Control: Stiffness & Muscle Reflex
4.1 Title 63 4.2 Abstract 64 4.3 Introduction 65 4.4 Methods 68 4.4.1 Experimental Protocol 68 4.4.2 Data Collection / Analysis 72 4.5 Results 75 4.6 Discussion 76 4.7 Conclusion 81 4.8 References 82
Chapter 5 : Progression of Changes in Natural Frequency of the Trunk with Exposure to Whole-Body Vibration as Measured by Apparent Mass and Transmissibility
5.1 Title 85 5.2 Abstract 86 5.3 Introduction 87 5.4 Methods 90 5.4.1 Experimental Protocol 91 5.4.2 Data Collection / Analysis 93 5.5 Results 96 5.6 Discussion 98 5.7 Conclusion 104 5.8 References 105
vi

Chapter 6 : Closing Statements 107 Chapter 7 : Appendix 7.1 Equilibrium & Stability 110 7.1.1 Ball & Bowl 110 7.1.2 Spine Model 112 7.1.3 Stability Control 116 7.1.4 Factors Affecting Stability 118 7.1.4.1 Muscle Fatigue 118 7.1.4.2 Trunk Posture 119 7.1.4.3 Tissue Stretch 120 7.1.4.4 Task Demands 120 7.1.4.5 People with LBP 122 7.2 Wobble Chair 123 7.2.1 Background 123 7.2.2 New Approach 125 7.2.3 Design 125 7.2.4 Method of Use 129 7.2.5 Calibration 130 7.6 Data Processing 132 7.3 Chapter 3 Supplemental 135 Wobble Chair Spring Settings 7.4 Chapter 4 Supplemental 138 Maximum Voluntary Co-Contraction (MCC) Recovery After WBV Post Hoc: Gender 7.5 Chapter 5 Supplemental 142 Matlab Modeling of Stiff & Damping Transmissibility Second Characteristic Frequency
Post Hoc: Gender Alternate Movement: For-Aft Frequency Function
7.6 References 149
vii

List of Figures 1.2.3.2 Figure 1: Example time domain data for apparent mass calculation 17 Figure 2: Example frequency domain data for apparent mass calculation 17 Figure 3: Example apparent mass frequency response function 18 Figure 4: Apparent mass with natural frequency labeled 18 1.2.3.3 Figure 5: Example time domain data for transmissibility calculation 20 Figure 6: Example frequency domain data for transmissibility calculation 21 Figure 7: Example transmissibility frequency response function 21 Figure 8: Transmissibility with natural frequency labeled 22 3.4.1 Figure 1: Wobble chair and spring layout 45 Figure 2: Model diagram of the wobble chair functionality 46 Figure 3: Vibration apparatus set-up with wobble chair on top 47 3.5 Figure 4: Example stabilogram data before and after WBV exposure 53 4.4.1 Figure 1: Trunk perturbation set-up 69 Figure 2: Example Force/Position/EMG data 70 Figure 3: Vibration apparatus set-up with wobble chair on top 71 Figure 4: Results of dependent measures with respect to WBV 75 5.4.1 Figure 1: Vibration apparatus set-up with wobble chair on top 92 5.4.2 Figure 2: Example transmissibility data 94
viii

5.5 Figure 3: Trend lines for the time progression of natural frequency 96 Figure 4: Trend lines for the time progression of peak value 97 7.1.1 Figure 1: Ball & Bowl: Stable system 110 Figure 2: Ball & Bowl: Unstable system 111 Figure 3: Ball & Bowl: System stability robustness 112 7.1.2 Figure 4: Pendulum: Stable system and unstable system 113 Figure 5: Model of spinal stability control 114 7.1.3 Figure 6: Spinal stability control diagram 116 Figure 7: Spinal stability control: Equation 117 7.2.1 Figure 8: Unstable seat design by Cholewicki 124 7.2.3 Figure 9: Pivot point for the wobble chair 126 Figure 10: Spring Assemblies 127 Figure 11: Wobble chair base and spring positions 127 Figure 12: Metal channel on the top section 128 Figure 13: Complete wobble chair 129 Figure 14: Model diagram of the wobble chair functionality 131 7.2.6 Figure 15: Example plots of data from the wobble chair 133 7.5 Figure 16: Example decrease in natural frequency 142
ix

Figure 17: Example increase in peak values 143 Figure 18: Frequency trend for the secondary characteristic frequency 144 Figure 19: Peak value trend for the secondary characteristic frequency 144 Figure 20: Gender & time interactions for TR(f2) 145 Figure 21: Gender & time interactions for AM(Pv) and TR(Pv) 146 Figure 22: Examples of FRC for the Z-axis and Y-axis 148 Figure 23: Example of frequency local maximum and minimums 148
x

List of Tables
3.5 Table 1: Kinematic variance measures of unstable seated balance 54 Table 2: Stability assessment measures of unstable seated balance 54
xi
xii
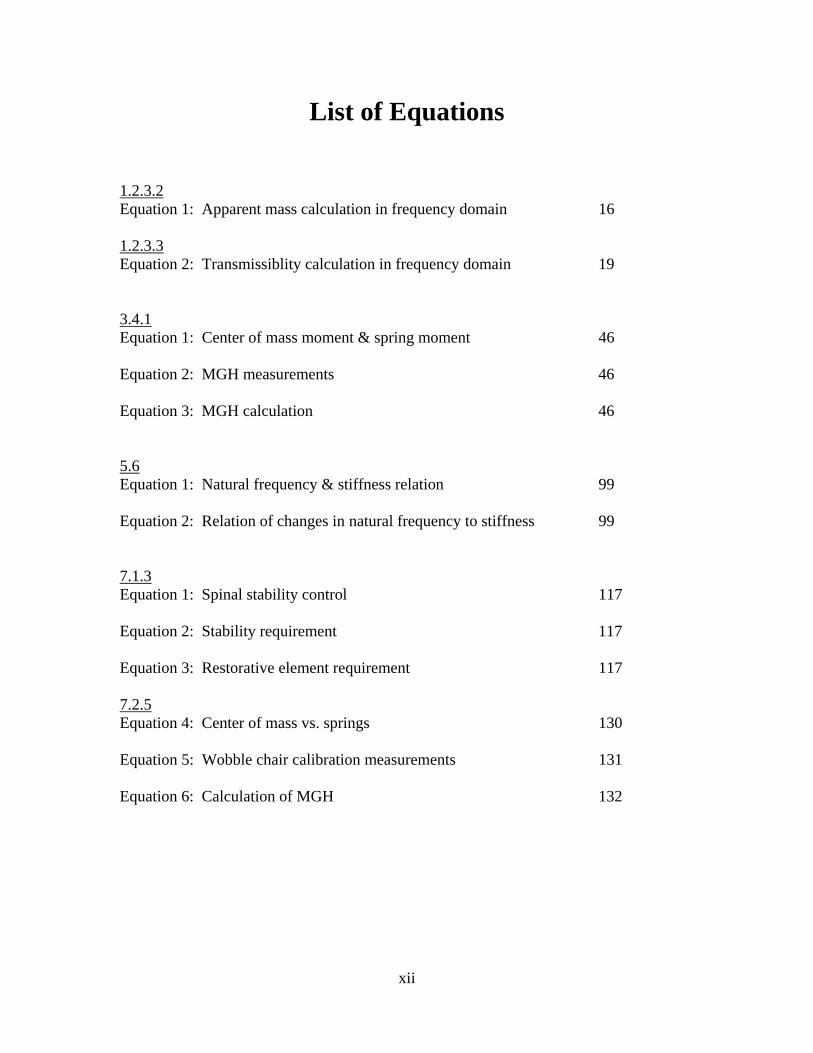
List of Equations
1.2.3.2 Equation 1: Apparent mass calculation in frequency domain 16 1.2.3.3 Equation 2: Transmissiblity calculation in frequency domain 19 3.4.1 Equation 1: Center of mass moment & spring moment 46 Equation 2: MGH measurements 46 Equation 3: MGH calculation 46 5.6 Equation 1: Natural frequency & stiffness relation 99 Equation 2: Relation of changes in natural frequency to stiffness 99 7.1.3 Equation 1: Spinal stability control 117 Equation 2: Stability requirement 117 Equation 3: Restorative element requirement 117 7.2.5 Equation 4: Center of mass vs. springs 130 Equation 5: Wobble chair calibration measurements 131 Equation 6: Calculation of MGH 132

Chapter 1 :
Literature Review
Literature Review
(1.1) Low Back Pain
Low back pain (LBP) is defined as pain, muscle tension, or stiffness of the lumbar
spine (Manek and MacGregor, 2005). Low back disorders (LBDs) are anatomical or
neuromuscular changes that in some cases can include the sources of LBP. Examples of
LBDs are intervertebral disc herniations, spinal stenosis, osteoporosis, osteoarthritis,
ankylosing spondylitis, and spondylolisthesis.
LBP affects many people, disrupts daily life and work, and presents a great
financial burden to society. It is estimated that between 60% and 80% of adults
experience an episode of LBP at least once during their lifetime (van Tulder et al., 2001).
Within a single year, 15% to 20% of adults experience LBP (Andersson, 1998). In
people under the age of 45, LBDs are the most frequent cause of physical activity
limitation (Kelsey et al., 1984), and the most frequent cause of absence from work
(Andersson, 1998, Rubin, 2007). In addition, the evaluation and treatment of LBP are
two of the most common reasons for patients to seek medical attention and apply for
workers’ compensation (Rubin, 2007). In terms of financial burden, LBP and spinal
disorders are ranked in the top ten ‘health and productivity costs’ in America (Goetzel et
al., 2003). The total health care expenditures for people with LBP in the United States
exceeds $90 billion (Luo et al., 2004).
1

Literature Review
(1.1.1) Risk Factors
According to Manek and MacGregor (2005), approximately 90% of LBP cases
have no identifiable physiological cause, and are typically designated as nonspecific by
health care professionals. LBP is typically classified as either acute (lasting up to 3
months) or chronic (lasting greater than 3 months). Current research continues to
advance the understanding as to which individuals are susceptible to LBP, and the
etiology of LBP. Risk factors are conditions and/or characteristics that can lead to an
increased probability of LBP. A number of epidemiological studies have identified
possible risk factors for LBP (Andersson, 1981, Andersson, 1998, Andersson, 1991,
Rubin, 2007). The identification of these risk factors is important in the prevention of
LBP. The different factors that have been related to LBP are grouped into three main
categories: individual, occupational, and psychological/psychosocial. In most cases of
LBP, multiple risk factors are likely involved.
(1.1.2) Individual Risk Factors
Individual risk factors are characteristics specific to a person that have been
correlated to incidents of LBP. These risk factors include age, gender, anthropometrics,
overall health, spinal anatomy, socioeconomic status, and education level. Initial cases of
LBP are highest during the first 3-4 decades of life (Reigo et al., 1999). Incidence rates
of LBP increase with age with the greatest frequency for LBP occurring between the ages
2

Literature Review
of 35 – 55 years (Andersson, 1981). In the older population (age > 65 years), the risk for
LBP tends to be increased compared to a younger population due to the prevalence for
women having osteoporosis of the spine (Bressler et al., 1999).
LBP is a significant problem for both genders (Rubin, 2007) and there is no clear
consensus signifying one gender or another having an overall higher risk for LBP. Some
studies present evidence suggesting that women are more predisposed to LBP (Kopec et
al., 2004, Linton et al., 1998), while others report that men are more likely to undergo
surgery for the same degree of symptoms (Kelsey and Ostfeld, 1975). Perhaps adding to
the uncertainty is that gender tends to be coupled with other LBP risk factors. For
example, males have more occurrence of disc herniations (individual risk factor) than
females (Brown, 1975). Additionally, there may be more frequent mismatches between
physical strength of female workers than males and the job requirements (occupational
risk factor) (Brown, 1973).
There are correlations between anthropometric measures of height, weight, and
body build with occurrence of LBP (Mellin, 1986). Rates increase with taller and heavier
individuals, possibly due to increases in moment-loads on the spinal column.
Additionally, BMI (body mass index) has been associated with herniated discs and LBP
(Battie et al., 1990).
The health status of an individual is an important risk factor of development of
LBP. Obesity (BMI >30) as a measure of health status is an independent predictor of the
3

Literature Review
development of LBP (Webb et al., 2003). Smoking habits have an impact on the
musculoskeletal system, increasing the risk of osteoporosis, fractures, decreasing bone
density, and increasing degenerative changes in the spine (Rubin, 2007) which can lead
to LBDs and LBP. Self-rated health status and the perception of poorer health is also
predictor for the development of LBP (Hartvigsen et al., 2004). In addition, the dietary
habits and physical fitness level of an individual can be considered. Someone with a
good state of physical fitness will have a lesser risk of chronic LBP and more rapid
recovery after a LBP episode (Nachemson, 1989).
Degenerative changes in the spinal anatomy and supportive tissues can lead to
LBP (Taskaynatan et al., 2005). Also, additional anatomical conditions of osteoporosis,
naturally occurring spinal fusions, and disc herniations can cause pain at the affected
vertebral joint (vertebrae-disc-vertebrae) or adjacent vertebral joints (Jonsson et al.,
1989). Spinal deformities can contribute to an earlier and more severe development of
degenerative disc changes (Noren et al., 1991) and mechanical stress to the spine
accelerates the process (Biering-Sorensen et al., 1985). The disc acts as a spacer and
cushion for the vertebrae, but damaged discs can alter the normal motions of the
vertebrae and or cause spinal stenosis and nerve pinching. When a disc is damaged, the
viscous nucleus can extend from the annulus resulting in protrusions, extrusions, and
herniations. Intervertebral disc space narrowing is strongly associated with LBP (Pye et
al., 2004) and disc degeneration is more frequent in individuals who do heavy lifting
(Andersson, 1981). Spinal anatomy deformities may also be risk factors for LBP. It has
4

Literature Review
been reported that deformities such as scoliosis and kyphosis are related to incidents of
LBP (Gremeaux et al., 2008, Kang et al., 2007).
Education and socioeconomic status have also been mentioned as risk factors for
LBP (Dionne et al., 2001). It has been suggested that less education is correlated to
lower socioeconomic status, and lower socioeconomic status is related to the job type,
typically manual labor. It is also suggested that lower socioeconomic status may be
correlated to other individual factors (smoking, obesity, dietary habits), psychological
factors (stress, depression), and physical occupations (Rubin, 2007) each of which
increase the risk for LBP.
(1.1.3) Occupational Risk Factors
Occupational risk factors are elements of a job task that have been correlated to
incidence of LBP. These risk factors include aspects of physical/repetitive activities
(lifting, pushing, pulling) and the postures and motions (static postures, bending,
twisting) associated with manual material handling (Eriksen et al., 2004).
Physical activity (lifting, pushing, or pulling) applies loads and moments on the
spine that can lead to development of LBP (Rubin, 2007). The highest rates of back
muscle strains and ligament sprains are amongst workers in industries with heavy,
physically demanding occupations (Klein et al., 1984). Occupations that consist of
5

Literature Review
manual material handling apply more stress on the structures of the spine (Andersson,
1998, Hoogendoorn et al., 1999). The risk of LBP is related to the degree of physical
load, cumulative / long term load, type, and duration (Hoogendoorn et al., 1999). The
repetitive nature of manual material handling increases the risk of LBP depending on the
duty cycle of work and rest (Solomonow et al., 2000). Repetitive physical activity may
consist of smaller loads and apply lower levels of stress on the spine, but the buildup over
time can lead to LBP (Rubin, 2007). Additionally, one theory is that vibrations during
load handling are associated with repetitive small trauma that can give rise to permanent
damage to the structures of the spine which can increase LBP incidents (Andersson,
1981, Bernard, 1997).
Occupational risk factors for LBP include a worker’s posture and motions
required to complete required job tasks. Static work postures of standing and sitting can
be correlated to incidents of LBP (Magora, 1972). In addition, postures of trunk flexion
are a known risk for LBP (Punnett et al., 1991) as well as asymmetric postures (Marras et
al., 1993). Bending and twisting of the trunk has an established connection with LBP
(Brown, 1975, Magora, 1973, Eriksen et al., 2004) as well as the compounded effect
when lifting loads (Kelsey et al., 1984).
Lifting is a risk factor of LBP, with LBP incidence increasing when lifting in
excess of what is considered acceptable. When modeling the loading effects of lifting on
the low back, disc compression forces are one measure of concern (Marras and Granata,
1995). Musculoskeletal and over-exertion medical problems are twice as common if
6
Literature Review
predicted lumbosacral disc compression forces exceed the recommended limit of 6800 N
(Herrin et al., 1986). Other measures that have been examined include measures of
spinal stability and the control parameters associated with stability control. Examples
risk factors for LBP that have been modeled with spinal stability include load height
(Granata and Orishimo, 2001), flexed postures (Granata and Rogers, 2007), prolonged
flex postures (Granata et al., 2005), and muscle fatigue (Granata et al., 2004). Delayed
trunk muscle responses have also been shown to be predictive of low back injury
(Cholewicki et al., 2005).
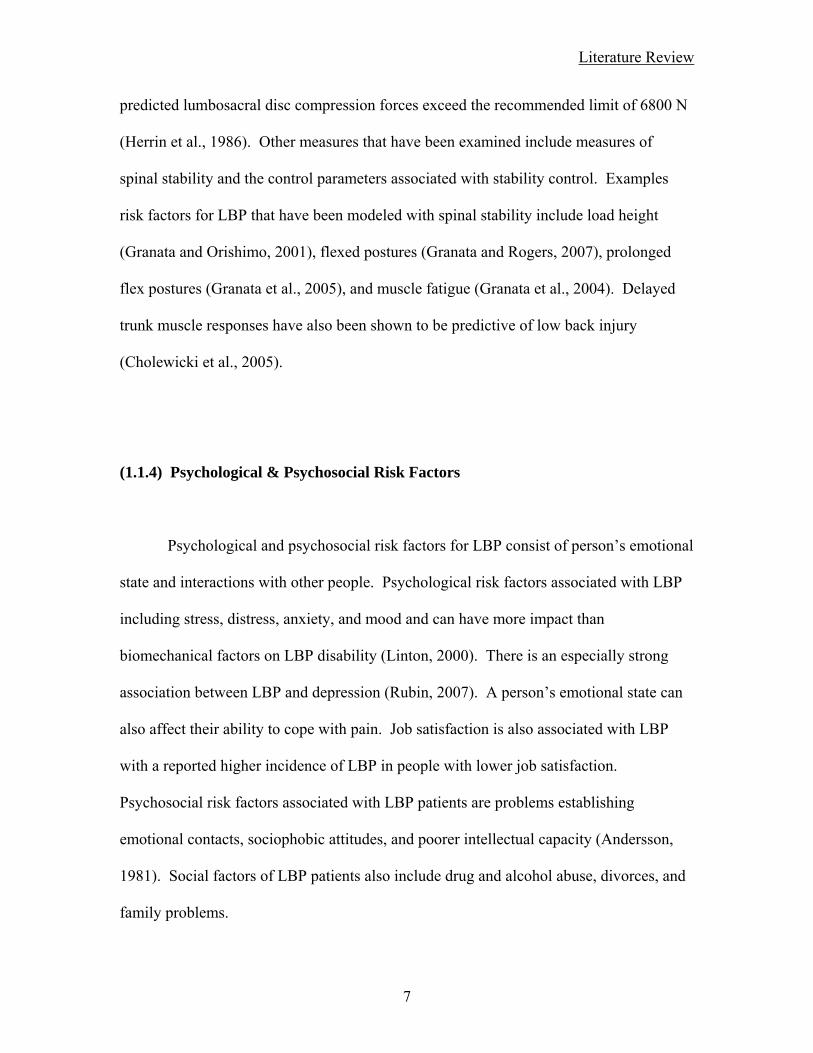
(1.1.4) Psychological & Psychosocial Risk Factors
Psychological and psychosocial risk factors for LBP consist of person’s emotional
state and interactions with other people. Psychological risk factors associated with LBP
including stress, distress, anxiety, and mood and can have more impact than
biomechanical factors on LBP disability (Linton, 2000). There is an especially strong
association between LBP and depression (Rubin, 2007). A person’s emotional state can
also affect their ability to cope with pain. Job satisfaction is also associated with LBP
with a reported higher incidence of LBP in people with lower job satisfaction.
Psychosocial risk factors associated with LBP patients are problems establishing
emotional contacts, sociophobic attitudes, and poorer intellectual capacity (Andersson,
1981). Social factors of LBP patients also include drug and alcohol abuse, divorces, and
family problems.
7

Literature Review
(1.1.5) Differences between individuals with and without LBP
Several studies have reported differences between individuals with and without
LBP to help understand the possible causes of the LBP. While these studies are helpful
in identifying important biomechanical and/or neurological factors in LBP, they are
limited by the fact that it is difficult to discern if any differences contributed to LBP, or
resulted from LBP. Nevertheless, these studies have provided a rich source of
information on the occurrence of LBP. There are suggested diminished strength of the
trunk muscles (Takemasa et al., 1995), reduced reflex response times (Radebold et al.,
2000), and vertebral instability (Weiler et al., 1990). All of these factors can cause
impaired spinal stability and increase the risk of LBP (Leone et al., 2007) but it is not
known if this is a cause or effect (Andersson, 1981). Currently there are no reported
studies where data collections were made before, and then after an incident of LBP.
8

Literature Review
(1.2) Vibration
Whole-body vibration (WBV) is another risk factor for LBP and is the focus of
this dissertation. Long-term exposure to WBV can have detrimental effects on the
musculoskeletal system, and extensive repeated exposure can lead to the development of
pathological changes to the spinal anatomy leading to LBDs. There is epidemiologic
evidence linking occupational WBV exposure and reports of LBP. Presented here will be
a theory of how WBV exposure can lead to LBP, and current methods used to measure
vibration exposure and human dynamics during vibration.
(1.2.1) Epidemiological Evidence
WBV commonly occurs in job tasks that include the seated operation of vehicles
and other heavy machines. Six million workers are exposed to seated WBV (Griffin,
2006) including delivery vehicles drivers (Rosegger and Rosegger, 1960), forklift
operators (Boshuizen et al., 1992), helicopters pilots (De Oliveira and Nadal, 2005), and
construction equipment operators (Spear et al., 1976). WBV exposure has been correlated
to incidence of acute and chronic LBP in industrial workers. For example, tractor drivers
have a reported 61-94% prevalence of LBP and pathological changes in the spine
(Dupris, 1966) as well as heavy-equipment drivers reported 70% prevalence of LBP
(Cremona, 1972). Additionally, there is also the compounding risk for LBP when WBV
exposure is followed by other physical activities. This can include delivery drivers
9

Literature Review
unloading their payload immediately when reaching their destination (Pope and Hansson,
1992).
(1.2.2) Vibration and Low Back Pain
Although a link between WBV and LBP is generally accepted, there is no
consensus as to the mechanism of injury (Mansfield and Maeda, 2005a). Moreover,
methods of predicting which individuals are most susceptible to the effects of WBV
remain elusive (Mansfield, 2005b). One mechanism by which WBV may lead to LBP is
through changes in the system of spinal stability control. Such changes in the spine
dynamics could lead to increased dynamic loads of the spine, increasing out-of-range
compressive loads. The neuromusculoskeletal system that controls spinal stability is
comprised of the three subsystems: passive tissue stiffness, active muscle stiffness, and
neuromuscular reflexes (Panjabi, 1992). The physiologic systems involved in these
subsystems include the nervous system (sensory information, motor control), muscular
system (force production, reflex) and system of passive tissues (connective, surrounding).
WBV can alter a single element of a subsystem, or combination of multiple elements, that
can then lead to a disruption of spinal stability control and LBP. It has been reported that
“if the [control] system does not perform well, then it is more prone to injury” (Reeves et
al., 2007).
10

Literature Review
(1.2.2.1) Nervous System
The nervous system has a role in both active muscle stiffness and muscle reflexes,
which in turn, contribute to spinal stability. Thus alterations in the nervous system may
affect spinal stability. Studies have shown that vibration of the human body, either
localized or whole-body exposure, causes changes to the nervous system sensory
information and motor control. Vibration can affect the perception of the position and
motion of a joint (Goodwin et al., 1972). Additionally, the perception of the intensity of
contraction and tension in muscles can be distorted (Carlsoo, 1982). More specifically,
muscles are perceived as being longer than their actual length (Eklund, 1972). There is
also a change in the sensitivity and impairment of movement precision. The severity of
the influence of vibration on a muscle depends on the level of receptor activity and the
state of the muscle (length, change in length, tension) (Carlsoo, 1982). Vibration can also
cause the neural pathways to become saturated with stimulation rendering additional
stimuli ineffective (Brown et al., 1967, Granit and Henatsch, 1956). It was concluded
that sustained Ia sensory activity elicited by vibration also has an after effect on the motor
system producing a long lasting dynamical modification of posture (Wierzbicka et al.,
1998).
There are changes to the static and dynamic control of the musculoskeletal system
due to vibration. WBV causes changes to the perceived orientation of the body (Ceyte et
al., 2006). In the case of vibration of the muscle groups of pretibial, hamstring, and
paraspinal, there is an induced forward tipping of the body (Carlsoo, 1982). When
11
Literature Review
vibrations were applied to the multifidus muscles, an error in target positioning of the
trunk was induced, potentially due to error in proprioception feed back used in muscle
movement control (Brumagne et al., 1999). The effects of muscle vibration on postural
control were concluded to originate from changes in sensory information (Slijper and
Latash, 2004). Vibration exposure has also been shown to produce deviations in motion
during straight-ahead walking (Schmid et al., 2005).
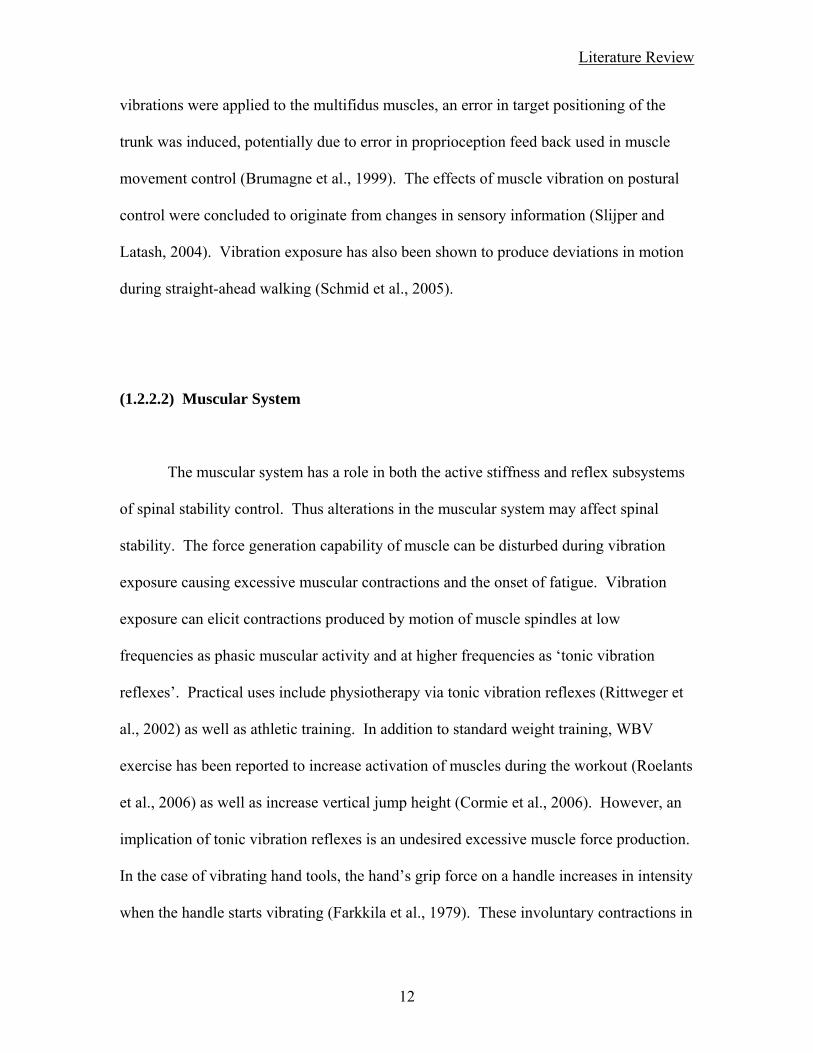
(1.2.2.2) Muscular System
The muscular system has a role in both the active stiffness and reflex subsystems
of spinal stability control. Thus alterations in the muscular system may affect spinal
stability. The force generation capability of muscle can be disturbed during vibration
exposure causing excessive muscular contractions and the onset of fatigue. Vibration
exposure can elicit contractions produced by motion of muscle spindles at low
frequencies as phasic muscular activity and at higher frequencies as ‘tonic vibration
reflexes’. Practical uses include physiotherapy via tonic vibration reflexes (Rittweger et
al., 2002) as well as athletic training. In addition to standard weight training, WBV
exercise has been reported to increase activation of muscles during the workout (Roelants
et al., 2006) as well as increase vertical jump height (Cormie et al., 2006). However, an
implication of tonic vibration reflexes is an undesired excessive muscle force production.
In the case of vibrating hand tools, the hand’s grip force on a handle increases in intensity
when the handle starts vibrating (Farkkila et al., 1979). These involuntary contractions in
12

Literature Review
the hand and arms can also become so sever that there is difficulty releasing of the hand’s
grip (Rood, 1860). Additionally, in trunk perturbation testing, it was reported that there
was an increased reflex amplitude from 55% to 67% maximum voluntary contraction
(Wilder et al., 1996). Vibration induced muscle contraction and increased reflex
responses can lead to an earlier onset of muscle fatigue with either a reduced maximum
force production or shorter duration of sustained sub-maximal contractions (Vollestad,
1997). WBV vibration can cause muscle fatigue and WBV has been used as a fatigue
intervention for the trunk (Wilder et al., 1996).
Muscle reflex delay can also be affected by vibration exposure. More
specifically, the short-latency and medium-latency reflex delays increase due to WBV
exposure (Bove et al., 2003). This has been reported by studies of trunk muscle reflexes
where reflex delays increased. In one study, trunk perturbations applied by the sudden
loading of a hand-held box showed an increased paraspinal reflex delay from 87 to 108
msec after exposure to WBV (Wilder et al., 1996). In another study, WBV exposure
increased reflex delay from 205 to 228 msec with perturbations applied directly to the
trunk (Li et al., 2008). Vibration exposure can also suppress muscle reflexes. As
described earlier, vibration of muscles can produce a saturation of the neural pathways
blocking any additional stimulus from causing a reflex response (Brown et al., 1967,
Granit and Henatsch, 1956). This in turn can lead to an inhibition of muscle reflexes
which normally assist in the injury protection of preventing joints from twisting or
ligaments from rupturing (Carlsoo, 1982).
13
Literature Review
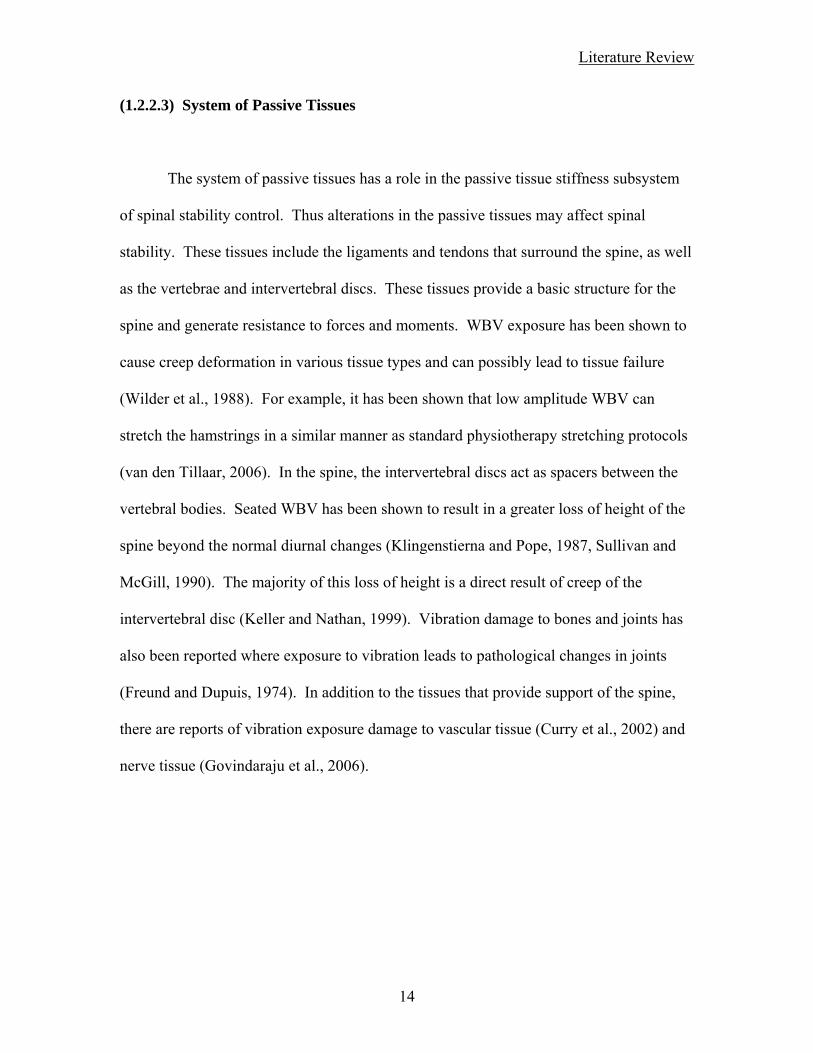
(1.2.2.3) System of Passive Tissues
The system of passive tissues has a role in the passive tissue stiffness subsystem
of spinal stability control. Thus alterations in the passive tissues may affect spinal
stability. These tissues include the ligaments and tendons that surround the spine, as well
as the vertebrae and intervertebral discs. These tissues provide a basic structure for the
spine and generate resistance to forces and moments. WBV exposure has been shown to
cause creep deformation in various tissue types and can possibly lead to tissue failure
(Wilder et al., 1988). For example, it has been shown that low amplitude WBV can
stretch the hamstrings in a similar manner as standard physiotherapy stretching protocols
(van den Tillaar, 2006). In the spine, the intervertebral discs act as spacers between the
vertebral bodies. Seated WBV has been shown to result in a greater loss of height of the
spine beyond the normal diurnal changes (Klingenstierna and Pope, 1987, Sullivan and
McGill, 1990). The majority of this loss of height is a direct result of creep of the
intervertebral disc (Keller and Nathan, 1999). Vibration damage to bones and joints has
also been reported where exposure to vibration leads to pathological changes in joints
(Freund and Dupuis, 1974). In addition to the tissues that provide support of the spine,
there are reports of vibration exposure damage to vascular tissue (Curry et al., 2002) and
nerve tissue (Govindaraju et al., 2006).
14

Literature Review
(1.2.3) Measurements of Vibration Exposure
In order to study the effects of WBV exposure, there is the need to quantify
vibration characteristics of the human body. The two primary characteristics of vibration
are frequency and amplitude, and both have been shown to affect the human body
differently. Two common approaches to measure the human body’s response to vibration
include using frequency response functions of apparent mass and transmissibility.
Parameters from these functions can be related to the human dynamics and how the body
reacts during vibration exposure.
(1.2.3.1) Vibration Characteristics
When describing vibrations, it is important to fully describe the vibration
characteristics involved. For WBV exposure, this includes the vibration frequency
content, amplitude, direction, and exposure duration. A vibration wave can consist of a
single frequency sine wave, or be as complex as a broad-band waveform consisting of
multiple frequencies. Typical vibrations (in industrial job settings) may have one main
frequency component and about that frequency a broad-band of random vibration. The
frequency of a vibration wave describes how fast the vibrations are moving, while the
vibration characteristic of the amplitude of the signal describes the strength of the
movement. The amplitude can be reported in units of length (displacement) or
acceleration.
15

Literature Review
While vibration has characteristics of frequency and amplitude, the application of
the vibration to the human body has two more characteristics. The direction of the
vibration’s force to the body needs to be considered. WBV can be applied vertically,
horizontally anterior/posterior, horizontally lateral, and any combination there of.
Additionally, the duration of the vibration exposure needs to be considered.
(1.2.3.2) Apparent Mass
There are two common approaches used for studying the human biomechanical
response during WBV, one of which is the impedance method to quantify apparent mass
(Mansfield and Maeda, 2005a). The apparent mass represents the kinetic response of the
body to vibration and is a measure of the driving-point frequency response function
determined at the seat-person interface (Fairley and Griffin, 1989). The apparent mass
(AM(f)) is calculated as the ratio of the applied force (F(f)) transmitted to the person from
the seat and the subsequent acceleration (Acc(f)) in the frequency domain (Equation 1)
(Mansfield, 2005b).
( ) ( )( )fAccfFfAM = (1)
The process of calculating the apparent mass of the human body requires the
measurement in the time domain of the force applied to the body (F(t)) and the subsequent
acceleration (Acc(t)) at the seat-person interface (Figure 1). Using the Fast Fourier
16

Literature Review
Transformation (FFT), the time domain data is translated into the force (F(f)) and
acceleration (Acc(f)) in the frequency domain (Figure 2). Following equation 1 above, the
apparent mass (AM(f)) is calculated as the ratio of force and acceleration at each individual
frequency sample (Figure 3).
Figure 1: Example of time domain data of force recorded from a load cell (above) and acceleration from an accelerometer (below) located at the seat-person interface.
Figure 2: Example of frequency domain data of force (above) and acceleration (below). Data is the Fast Fourier Transform of the data in figure 1.
17

Literature Review
Figure 3: Example apparent mass frequency response function in the frequency domain (2-20 Hz). The graph is the results of the calculation using equation 1 and from the data
shown in figures 1 and 2 and is normalized to the static mass.
For the vibration of a rigid mass, the apparent mass at all frequencies is equal to
the actual mass. The apparent mass of a dynamic system that has compliance will have
an apparent mass greater than its actual mass at frequencies where it resonates and less
than its actual mass at frequencies where movement is attenuated. The frequency
response function of apparent mass is relative to the actual mass and therefore can be
normalized. For vertical WBV, the human body acts as a second order, low-pass system
with unity (equal to actual mass) for low frequencies (≤1Hz, not shown in figure 4), a
resonance frequency near 5 Hz, and attenuation at higher frequencies (Figure 4).
Figure 4: Example apparent mass frequency response curve (2-20 Hz) normalized to
static mass. The peak (>1) near 5 Hz signifies the natural frequency of the system. The natural frequency of the system is related to the system stiffness, and the peak value is
related to the system damping.
18

Literature Review
The apparent mass is used to measure the dynamic response of the human body to
vibration. The use of apparent mass has been shown to be an effective laboratory tool for
testing the dynamics of vehicle seats (Boileau et al., 2002), seat vibration transmission
(Wei and Griffin, 1998), and the effects of different seat backrests (Mansfield and Maeda,
2005b). In addition, understanding the apparent mass of the human body assists in the
improved design characteristics of dynamic test dummies (Lewis and Griffin, 2002) as
well as to further the understanding of human biomechanics (Mansfield and Griffin,
2002).
(1.2.3.3) Transmissibility
Transmissibility methods are another common approach used for studying the
human biomechanical response during WBV. This method studies the kinematic
assessment of the human body by measuring the transmission of vibration from one point
to another. Transmissibility functions indicate the transmission of vibration between the
point at which the vibrations are applied the body and at a second point at which the
vibration is measured on the body (Hinz et al., 2001). Transmissibility (TR(f)) is
expressed in the frequency domain as the ratio of two accelerations (Acchead(f), Accseat(f))
measured at two different locations (Equation 2).
( ) ( )( )fAcc
fAccfTR
seat
head= (2)
19

Literature Review
The process of calculating the transmissibility of the human body requires the
measurement in the time domain of the acceleration at the seat-person interface (Accseat(t))
and a second acceleration on the subject’s body, in the example the head (Acchead(t))
(Figure 5). Using the Fast Fourier Transformation (FFT), the time domain data is
translated into accelerations (Accseat(f), Acchead(f)) in the frequency domain (Figure 6).
Following equation 2 above, the transmissibility (TR(f)) is calculated as the ratio of the
accelerations at each individual frequency sample (Figure 7).
Figure 5: Example of time domain data of acceleration from an accelerometer located at the seat-person interface (above) and acceleration at the subject’s head from an
accelerometer held in the mouth with a bite-bar (below).
20
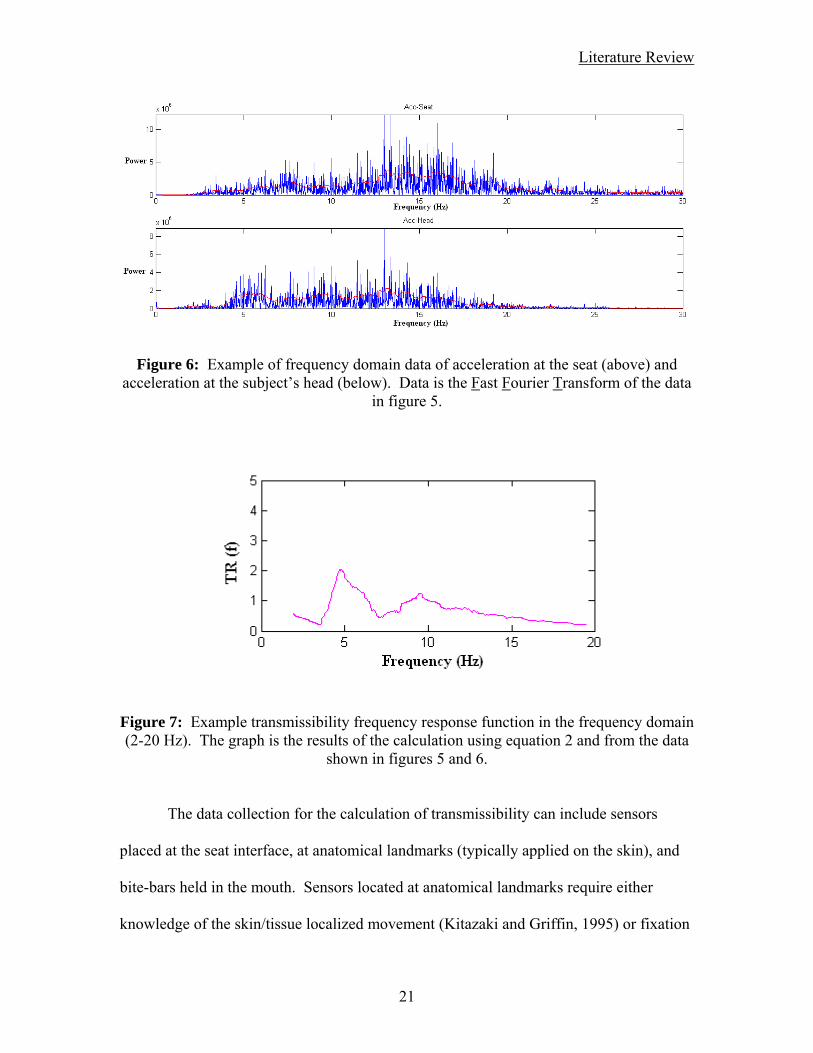
Literature Review
Figure 6: Example of frequency domain data of acceleration at the seat (above) and acceleration at the subject’s head (below). Data is the Fast Fourier Transform of the data
in figure 5.
Figure 7: Example transmissibility frequency response function in the frequency domain (2-20 Hz). The graph is the results of the calculation using equation 2 and from the data
shown in figures 5 and 6.
The data collection for the calculation of transmissibility can include sensors
placed at the seat interface, at anatomical landmarks (typically applied on the skin), and
bite-bars held in the mouth. Sensors located at anatomical landmarks require either
knowledge of the skin/tissue localized movement (Kitazaki and Griffin, 1995) or fixation
21

Literature Review
to bony structures (Rubin et al., 2003). For ease of testing, a bite-bar can be used to
measure the seat-to-head transfer function of the human body along the spinal column.
Similar to apparent mass measures, transmissibility frequency response curves can be
used to measure the characteristic frequencies and response of the human body (Figure
8).
Figure 8: Example transmissibility frequency response curve (2-20 Hz). The frequency peak near 5 HZ signifies the natural frequency of transmissibility. The natural frequency of the system is related to the system stiffness, and the peak value is related to the system
damping. The second peak in transmissibility near 10 Hz represents an additional characteristic frequency of the system. (Transmissibility is a unit less measure)
Transmissibility can be used to measure how the human body reacts to vibration
exposure. It has been used to assess vibration on work vehicle drivers and helicopter
pilots (De Oliveira and Nadal, 2005) as well as for designing wheelchairs (Hostens et al.,
2003). Also, the understanding of the transmissibility of vibrations has been used to
improve models of the human body (Boileau et al., 2002, Hinz et al., 2001).
22

Literature Review
Apparent mass and transmissibility are two common approaches used for studying
the human biomechanical response during WBV. Apparent mass can be measured in
laboratory tests requiring straightforward instrumentation measuring applied forces and
resultant accelerations. For seated WBV, the measure of apparent mass is influenced
primarily by the torso and contributions of the limbs can be controlled and limited.
Measures of apparent mass can also be influenced by the effects of postural movements
(Mansfield and Griffin, 2002, Mansfield et al., 2006). Transmissibility can be measured
in field testing with unobtrusive measurements of accelerations. In the case of measuring
seat to head transmissibility, attenuation along the entire spine contributes to the
transmissibility. However, the bite-bar typically used in this assessment will also be
influenced by movements of the head and neck. Though the transfer functions of
apparent mass and transmissibility are measured differently, it was concluded that similar
mechanisms influence their frequency response curves (Mansfield and Griffin, 2000).
(1.2.3.4) Human Vibration Dynamics
The human body’s perception of WBV is a function of frequency (Mansfield,
2005a), with greatest sensitivity to seated vertical vibration at frequencies between 4 and
8 Hz (Parsons and Griffin, 1988). Investigators have found that these subjective ratings
for the perception of vibration are related to the biomechanical response of the body to
WBV (Mansfield and Maeda, 2005c). The study of the frequency response of the human
trunk has been investigated initially using a series of vertical sinusoidal WBV inputs and
23

Literature Review
has progressed to random, broad-band vibrations (Fairley and Griffin, 1989). The results
were similar between sinusoidal vibration and random, broad-band vibration, the latter of
which has a better frequency resolution as well as a better definition of any resultant
peaks (Mansfield and Maeda, 2005a). The frequency response of the trunk is non-linear
(second order system) for both vertical WBV (Mansfield and Griffin, 2000) and different
directions of horizontal WBV (Mansfield and Lundstrom, 1999). The results of initial
studies that have quantified the natural frequency for vertical WBV of the human trunk
found a major resonance in the region of 5 Hz and in some cases a second mode in the
region of 10 Hz (Fairley and Griffin, 1989).
Using the frequency response functions of apparent mass and transmissibility,
studies have investigated some effects of WBV on the human body. Increasing the
magnitude of acceleration of WBV led to a ‘softening’ of the body with increase in
magnitude (Mansfield and Griffin, 2000). This softening was reported as the decrease of
the resonance frequency from about 6 Hz to 4 Hz when the magnitude of the vibration
was increased from 0.25 to 2.0 m/s2 root-mean-squared (Fairley and Griffin, 1989). In
addition to studies where the magnitude of vibration was varied, one study measured the
apparent mass as the direction of horizontal WBV vibration was changed. Similar to that
of increasing vibration magnitude, the results for the resonance frequency decreased as
the direction of horizontal WBV was changed incrementally from 0° (anterior/posterior)
to 90° (medial/lateral) (Mansfield and Lundstrom, 1999). However, it has been reported
that the frequency and peak in apparent mass in one direction are not related to that of
another (Mansfield and Maeda, 2007).
24
Literature Review
In order to simulate work environments and study the effects of WBV on the
human body, additional factors need to be taken into account. These can be considered in
two parts, 1) the human component, and 2) the human/environment interfaces. Current
standards for the human body’s frequency response functions are based on average values
of apparent mass or transmissibility and the existence of significant inter-subject
differences and different test conditions can lead to misinterpretations (Hinz et al., 2001).
In the case of the human component, the subject’s body mass, height, posture, and state
of muscular contraction needs to be considered(Fairley and Griffin, 1989). Body mass
can be accounted for when calculating apparent mass by normalizing to the static mass,
however transmissibility is not normalized to static mass. Also, a study concluded that
the ISO 5982 guidelines are insufficient for comparison with Japanese people who have
higher natural frequencies and peak values than the guidlines’ range (Maeda and
Mansfield, 2005). The study concluded that further research is needed to improve the
standards when considering anthropometrics and the biodynamics of WBV. Possibilities
for the variance from the standards mentioned in the study included controlling for
factors of age and height. Additionally, a subject’s muscle tension should also be taken
into account (Mansfield et al., 2006) as WBV can induce a vibration-synchronous
response from the trunk muscles when they are preloaded (Zimmermann et al., 1993) and
increase the effective trunk stiffness (Lee et al., 2006).
The human/environmental interfaces can also have an influence on the human
body’s response to WBV and include the support of the feet and legs, hands on a steering
25

Literature Review
wheel, and the use of seat backrests. Compared to the static mass of the subject, a static
foot rest (independent of vibrating seat) as it is lowered away from the seat will decrease
the apparent mass results. There is an increase above static mass for free hanging feet
and legs, and measurements closer to static mass when using a moving foot rest (moving
with the seat) (Fairley and Griffin, 1989). In the case of accounting for hands on a
steering wheel, there is the suppression of horizontal body rocking and changes to model
parameters of stiffness and damping (Stein et al., 2007). The use of a back rest will
increase the natural frequency and median normalized apparent mass of a subject
(Mansfield and Maeda, 2005b).
26

Literature Review
(1.3) Introduction References:
ANDERSSON, G. B. (1981) Epidemiologic aspects on low-back pain in industry. Spine, 6, 53-60.
ANDERSSON, G. B. (1998) Epidemiology of low back pain. Acta Orthop Scand Suppl, 281, 28-31.
ANDERSSON, G. B. J. (1991) The Epidemiology of Spinal Disorders. IN FRYMOYER, J. W. (Ed.) The Adult Spine: Principles and Practice. New York, Raven Press, Ltd.
BATTIE, M. C., BIGOS, S. J., FISHER, L. D., SPENGLER, D. M., HANSSON, T. H., NACHEMSON, A. L. & WORTLEY, M. D. (1990) Anthropometric and clinical measures as predictors of back pain complaints in industry: a prospective study. J Spinal Disord, 3, 195-204.
BERNARD, B. P. (1997) Musculoskeletal Disorders and Workplace Factors. Technical Report No. 97-141, U.S. Department of Health and Human Services, Washington, D.C.
BIERING-SORENSEN, F., HANSEN, F. R., SCHROLL, M. & RUNEBORG, O. (1985) The relation of spinal x-ray to low-back pain and physical activity among 60-year-old men and women. Spine, 10, 445-51.
BOILEAU, P. E., RAKHEJA, S. & WU, X. (2002) A BODY MASS DEPENDENT MECHANICAL IMPEDANCE MODEL FOR APPLICATIONS IN VIBRATION SEAT TESTING. Journal of Sound and Vibration, 253, 243-264.
BOSHUIZEN, H. C., BONGERS, P. M. & HULSHOF, C. T. (1992) Self-reported back pain in fork-lift truck and freight-container tractor drivers exposed to whole-body vibration. Spine, 17, 59-65.
BOVE, M., NARDONE, A. & SCHIEPPATI, M. (2003) Effects of leg muscle tendon vibration on group Ia and group II reflex responses to stance perturbation in humans. J Physiol, 550, 617-30.
BRESSLER, H. B., KEYES, W. J., ROCHON, P. A. & BADLEY, E. (1999) The prevalence of low back pain in the elderly. A systematic review of the literature. Spine, 24, 1813-9.
BROWN, J. R. (1973) Lifting as an industrial hazard. Am Ind Hyg Assoc J, 34, 292-7.
BROWN, J. R. (1975) Factors contributing to the development of low back pain in industrial workers. Am Ind Hyg Assoc J, 36, 26-31.
BROWN, M. C., ENGBERG, I. & MATTHEWS, P. B. (1967) The relative sensitivity to vibration of muscle receptors of the cat. J Physiol, 192, 773-800.
BRUMAGNE, S., LYSENS, R., SWINNEN, S. & VERSCHUEREN, S. (1999) Effect of paraspinal muscle vibration on position sense of the lumbosacral spine. Spine, 24, 1328-31.
27

Literature Review
CARLSOO, S. (1982) The effect of vibration on the skeleton, joints and muscles. A review of the literature. Appl Ergon, 13, 251-8.
CEYTE, H., CIAN, C., NOUGIER, V., OLIVIER, I. & ROUX, A. (2006) Effects of neck muscles vibration on the perception of the head and trunk midline position. Exp Brain Res, 170, 136-40.
CHOLEWICKI, J., SILFIES, S. P., SHAH, R. A., GREENE, H. S., REEVES, N. P., ALVI, K. & GOLDBERG, B. (2005) Delayed trunk muscle reflex responses increase the risk of low back injuries. Spine, 30, 2614-20.
CORMIE, P., DEANE, R. S., TRIPLETT, N. T. & MCBRIDE, J. M. (2006) Acute effects of whole-body vibration on muscle activity, strength, and power. J Strength Cond Res, 20, 257-61.
CREMONA, E. (1972) Die Wirbelsaule dei den Schwerarbeiten der Eisen-und Stahlindustrie sowie des Bergbaus. Kommiss. Europ. Gem. Genaraldir. Soz. Angelegenheitern Dok. Nr 1911/72.
CURRY, B. D., BAIN, J. L., YAN, J. G., ZHANG, L. L., YAMAGUCHI, M., MATLOUB, H. S. & RILEY, D. A. (2002) Vibration injury damages arterial endothelial cells. Muscle Nerve, 25, 527-34.
DE OLIVEIRA, C. G. & NADAL, J. (2005) Transmissibility of helicopter vibration in the spines of pilots in flight. Aviat Space Environ Med, 76, 576-80.
DIONNE, C. E., VON KORFF, M., KOEPSELL, T. D., DEYO, R. A., BARLOW, W. E. & CHECKOWAY, H. (2001) Formal education and back pain: a review. J Epidemiol Community Health, 55, 455-68.
DUPRIS, C. W. (1966) Urber die Deansprunchung die Wirbelsaule unter dem Einfluss sinusformiger und stochastischer Schwingungen Int. Zeitschrift angewandte Phys. Arbeitsphys, 22, 258-78.
EKLUND, G. (1972) General features of vibration-induced effects on balance. Ups J Med Sci, 77, 112-24.
ERIKSEN, W., BRUUSGAARD, D. & KNARDAHL, S. (2004) Work factors as predictors of intense or disabling low back pain; a prospective study of nurses' aides. Occup Environ Med, 61, 398-404.
FAIRLEY, T. E. & GRIFFIN, M. J. (1989) The apparent mass of the seated human body: vertical vibration. J Biomech, 22, 81-94.
FARKKILA, M., PYYKKO, I., KORHONEN, O. & STARCK, J. (1979) Hand grip forces during chain saw operation and vibration white finger in lumberjacks. Br J Ind Med, 36, 336-41.
FREUND, I. L. & DUPUIS, H. (1974) Physiologische und pathophysiologische Veeranderungen durch Ganzkorpervibration. Arb-Med, Prav-Med, 9, 234-236.
GOETZEL, R. Z., HAWKINS, K., OZMINKOWSKI, R. J. & WANG, S. (2003) The health and productivity cost burden of the "top 10" physical and mental health
28

Literature Review
conditions affecting six large U.S. employers in 1999. J Occup Environ Med, 45, 5-14.
GOODWIN, G. M., MCCLOSKEY, D. I. & MATTHEWS, P. B. (1972) The contribution of muscle afferents to kinaesthesia shown by vibration induced illusions of movement and by the effects of paralysing joint afferents. Brain, 95, 705-48.
GOVINDARAJU, S. R., CURRY, B. D., BAIN, J. L. & RILEY, D. A. (2006) Comparison of continuous and intermittent vibration effects on rat-tail artery and nerve. Muscle Nerve, 34, 197-204.
GRANATA, K. P. & ORISHIMO, K. F. (2001) Response of trunk muscle coactivation to changes in spinal stability. J Biomech, 34, 1117-23.
GRANATA, K. P. & ROGERS, E. (2007) Torso flexion modulates stiffness and reflex response. J Electromyogr Kinesiol, 17, 384-92.
GRANATA, K. P., ROGERS, E. & MOORHOUSE, K. (2005) Effects of static flexion-relaxation on paraspinal reflex behavior. Clin Biomech (Bristol, Avon), 20, 16-24.
GRANATA, K. P., SLOTA, G. P. & WILSON, S. E. (2004) Influence of fatigue in neuromuscular control of spinal stability. Hum Factors, 46, 81-91.
GRANIT, R. & HENATSCH, H. D. (1956) Gamma control of dynamic properties of muscle spindles. J Neurophysiol, 19, 356-66.
GREMEAUX, V., CASILLAS, J. M., FABBRO-PERAY, P., PELISSIER, J., HERISSON, C. & PERENNOU, D. (2008) Analysis of low back pain in adults with scoliosis. Spine, 33, 402-5.
GRIFFIN, N. J. (2006) Health Effects of Vibration – The Known and Unknown. Conference on Human Vibration. Morgan Town, WV: DHHS / CDC / NIOSH, 2006: 3-4.
HARTVIGSEN, J., CHRISTENSEN, K. & FREDERIKSEN, H. (2004) Back and neck pain exhibit many common features in old age: a population-based study of 4,486 Danish twins 70-102 years of age. Spine, 29, 576-80.
HERRIN, G. D., JARAIEDI, M. & ANDERSON, C. K. (1986) Prediction of overexertion injuries using biomechanical and psychophysical models. Am Ind Hyg Assoc J, 47, 322-30.
HINZ, B., MENZEL, G., BLUTHNER, R. & SEIDEL, H. (2001) Transfer functions as a basis for the verification of models--variability and restraints. Clin Biomech (Bristol, Avon), 16 Suppl 1, S93-S100.
HOOGENDOORN, W. E., VAN POPPEL, M. N., BONGERS, P. M., KOES, B. W. & BOUTER, L. M. (1999) Physical load during work and leisure time as risk factors for back pain. Scand J Work Environ Health, 25, 387-403.
HOSTENS, I., PAPAIOANNOU, Y., SPAEPEN, A. & RAMON, H. (2003) A study of vibration characteristics on a luxury wheelchair and a new prototype wheelchair. Journal of Sound and Vibration, 266, 443-452.
29

Literature Review
JONSSON, B., STROMQVIST, B. & EGUND, N. (1989) Anomalous lumbosacral articulations and low-back pain. Evaluation and treatment. Spine, 14, 831-4.
KANG, C. H., SHIN, M. J., KIM, S. M., LEE, S. H. & LEE, C. S. (2007) MRI of paraspinal muscles in lumbar degenerative kyphosis patients and control patients with chronic low back pain. Clin Radiol, 62, 479-86.
KELLER, T. S. & NATHAN, M. (1999) Height change caused by creep in intervertebral discs: a sagittal plane model. J Spinal Disord, 12, 313-24.
KELSEY, J. L., GITHENS, P. B., WHITE, A. A., 3RD, HOLFORD, T. R., WALTER, S. D., O'CONNOR, T., OSTFELD, A. M., WEIL, U., SOUTHWICK, W. O. & CALOGERO, J. A. (1984) An epidemiologic study of lifting and twisting on the job and risk for acute prolapsed lumbar intervertebral disc. J Orthop Res, 2, 61-6.
KELSEY, J. L. & OSTFELD, A. M. (1975) Demographic characteristics of persons with acute herniated lumbar intervertebral disc. J Chronic Dis, 28, 37-50.
KITAZAKI, S. & GRIFFIN, M. J. (1995) A data correction method for surface measurement of vibration on the human body. J Biomech, 28, 885-90.
KLEIN, B. P., JENSEN, R. C. & SANDERSON, L. M. (1984) Assessment of workers' compensation claims for back strains/sprains. J Occup Med, 26, 443-8.
KLINGENSTIERNA, U. & POPE, M. H. (1987) Body height changes from vibration. Spine, 12, 566-8.
KOPEC, J. A., SAYRE, E. C. & ESDAILE, J. M. (2004) Predictors of back pain in a general population cohort. Spine, 29, 70-7; discussion 77-8.
LEE, P. J., ROGERS, E. L. & GRANATA, K. P. (2006) Active trunk stiffness increases with co-contraction. J Electromyogr Kinesiol, 16, 51-7.
LEONE, A., GUGLIELMI, G., CASSAR-PULLICINO, V. N. & BONOMO, L. (2007) Lumbar intervertebral instability: a review. Radiology, 245, 62-77.
LEWIS, C. H. & GRIFFIN, M. J. (2002) EVALUATING THE VIBRATION ISOLATION OF SOFT SEAT CUSHIONS USING AN ACTIVE ANTHROPODYNAMIC DUMMY. Journal of Sound and Vibration, 253, 295-311.
LI, L., LAMIS, F. & WILSON, S. E. (2008) Whole-body vibration alters proprioception in the trunk. International Journal of Industrial Ergonomics, 38, 792-800.
LINTON, S. J. (2000) A review of psychological risk factors in back and neck pain. Spine, 25, 1148-56.
LINTON, S. J., HELLSING, A. L. & HALLDEN, K. (1998) A population-based study of spinal pain among 35-45-year-old individuals. Prevalence, sick leave, and health care use. Spine, 23, 1457-63.
LUO, X., PIETROBON, R., SUN, S. X., LIU, G. G. & HEY, L. (2004) Estimates and patterns of direct health care expenditures among individuals with back pain in the United States. Spine, 29, 79-86.
30

Literature Review
MAEDA, S. & MANSFIELD, N. J. (2005) Comparison of the apparent mass during exposure to whole-body vertical vibration between Japanese subjects and ISO 5982 standard. Ind Health, 43, 436-40.
MAGORA, A. (1972) Investigation of the relation between low back pain and occupation. 3. Physical requirements: sitting, standing and weight lifting. IMS Ind Med Surg, 41, 5-9.
MAGORA, A. (1973) Investigation of the relation between low back pain and occupation. IV. Physical requirements: bending, rotation, reaching and sudden maximal effort. Scand J Rehabil Med, 5, 186-90.
MANEK, N. J. & MACGREGOR, A. J. (2005) Epidemiology of back disorders: prevalence, risk factors, and prognosis. Curr Opin Rheumatol, 17, 134-40.
MANSFIELD, N. J. (2005a) Human response to vibration, Boca Raton, FL :, CRC Press.
MANSFIELD, N. J. (2005b) Impedance methods (apparent mass, driving point mechanical impedance and absorbed power) for assessment of the biomechanical response of the seated person to whole-body vibration. Ind Health, 43, 378-89.
MANSFIELD, N. J. & GRIFFIN, M. J. (2000) Non-linearities in apparent mass and transmissibility during exposure to whole-body vertical vibration. J Biomech, 33, 933-41.
MANSFIELD, N. J. & GRIFFIN, M. J. (2002) EFFECTS OF POSTURE AND VIBRATION MAGNITUDE ON APPARENT MASS AND PELVIS ROTATION DURING EXPOSURE TO WHOLE-BODY VERTICAL VIBRATION. Journal of Sound and Vibration, 253, 93-107.
MANSFIELD, N. J., HOLMLUND, P., LUNDSTROM, R., LENZUNI, P. & NATALETTI, P. (2006) Effect of vibration magnitude, vibration spectrum and muscle tension on apparent mass and cross axis transfer functions during whole-body vibration exposure. J Biomech, 39, 3062-70.
MANSFIELD, N. J. & LUNDSTROM, R. (1999) The apparent mass of the human body exposed to non-orthogonal horizontal vibration. J Biomech, 32, 1269-78.
MANSFIELD, N. J. & MAEDA, S. (2005a) Comparison of the apparent mass of the seated human measured using random and sinusoidal vibration. Ind Health, 43, 233-40.
MANSFIELD, N. J. & MAEDA, S. (2005b) Effect of backrest and torso twist on the apparent mass of the seated body exposed to vertical vibration. Ind Health, 43, 413-20.
MANSFIELD, N. J. & MAEDA, S. (2005c) Equal sensation curves for whole-body vibration expressed as a function of driving force. J Acoust Soc Am, 117, 3853-9.
MANSFIELD, N. J. & MAEDA, S. (2007) The apparent mass of the seated human exposed to single-axis and multi-axis whole-body vibration. J Biomech, 40, 2543-51.
31

Literature Review
MARRAS, W. S. & GRANATA, K. P. (1995) A biomechanical assessment and model of axial twisting in the thoracolumbar spine. Spine, 20, 1440-51.
MARRAS, W. S., LAVENDER, S. A., LEURGANS, S. E., RAJULU, S. L., ALLREAD, W. G., FATHALLAH, F. A. & FERGUSON, S. A. (1993) The role of dynamic three-dimensional trunk motion in occupationally-related low back disorders. The effects of workplace factors, trunk position, and trunk motion characteristics on risk of injury. Spine, 18, 617-28.
MELLIN, G. (1986) Chronic low back pain in men 54-63 years of age. Correlations of physical measurements with the degree of trouble and progress after treatment. Spine, 11, 421-6.
NACHEMSON, A., ECK,C,LINSTROM,IL, ET AL. (1989) Chronic low back disability can largely be prevented: A prospective randomized trial in industry. AAOS 56th annual meeting. Las Vegas.
NOREN, R., TRAFIMOW, J., ANDERSSON, G. B. & HUCKMAN, M. S. (1991) The role of facet joint tropism and facet angle in disc degeneration. Spine, 16, 530-2.
PANJABI, M. M. (1992) The stabilizing system of the spine. Part I. Function, dysfunction, adaptation, and enhancement. J Spinal Disord, 5, 383-9; discussion 397.
PARSONS, K. C. & GRIFFIN, M. J. (1988) Whole-body vibration perception thresholds. Journal of Sound and Vibration, 121, 237-258.
POPE, M. H. & HANSSON, T. H. (1992) Vibration of the spine and low back pain. Clin Orthop Relat Res, 49-59.
PUNNETT, L., FINE, L. J., KEYSERLING, W. M., HERRIN, G. D. & CHAFFIN, D. B. (1991) Back disorders and nonneutral trunk postures of automobile assembly workers. Scand J Work Environ Health, 17, 337-46.
PYE, S. R., REID, D. M., SMITH, R., ADAMS, J. E., NELSON, K., SILMAN, A. J. & O'NEILL, T. W. (2004) Radiographic features of lumbar disc degeneration and self-reported back pain. J Rheumatol, 31, 753-8.
RADEBOLD, A., CHOLEWICKI, J., PANJABI, M. M. & PATEL, T. C. (2000) Muscle response pattern to sudden trunk loading in healthy individuals and in patients with chronic low back pain. Spine, 25, 947-54.
REEVES, N. P., NARENDRA, K. S. & CHOLEWICKI, J. (2007) Spine stability: the six blind men and the elephant. Clin Biomech (Bristol, Avon), 22, 266-74.
REIGO, T., TIMPKA, T. & TROPP, H. (1999) The epidemiology of back pain in vocational age groups. Scand J Prim Health Care, 17, 17-21.
RITTWEGER, J., JUST, K., KAUTZSCH, K., REEG, P. & FELSENBERG, D. (2002) Treatment of chronic lower back pain with lumbar extension and whole-body vibration exercise: a randomized controlled trial. Spine, 27, 1829-34.
32

Literature Review
ROELANTS, M., VERSCHUEREN, S. M., DELECLUSE, C., LEVIN, O. & STIJNEN, V. (2006) Whole-body-vibration-induced increase in leg muscle activity during different squat exercises. J Strength Cond Res, 20, 124-9.
ROOD, O. N. (1860) On crntraction of the muscles induced by contact with bodies in vibration. Americal Journal of Science and Arts, Second Series, 449.
ROSEGGER, R. & ROSEGGER, S. (1960) Health effects of tractor driving. Ann Agric Eng Res, 5, 241-76.
RUBIN, C., POPE, M., FRITTON, J. C., MAGNUSSON, M., HANSSON, T. & MCLEOD, K. (2003) Transmissibility of 15-hertz to 35-hertz vibrations to the human hip and lumbar spine: determining the physiologic feasibility of delivering low-level anabolic mechanical stimuli to skeletal regions at greatest risk of fracture because of osteoporosis. Spine, 28, 2621-7.
RUBIN, D. I. (2007) Epidemiology and risk factors for spine pain. Neurol Clin, 25, 353-71.
SCHMID, M., DE NUNZIO, A. M. & SCHIEPPATI, M. (2005) Trunk muscle proprioceptive input assists steering of locomotion. Neurosci Lett, 384, 127-32.
SLIJPER, H. & LATASH, M. L. (2004) The effects of muscle vibration on anticipatory postural adjustments. Brain Res, 1015, 57-72.
SOLOMONOW, M., HE ZHOU, B., BARATTA, R. V., LU, Y., ZHU, M. & HARRIS, M. (2000) Biexponential recovery model of lumbar viscoelastic laxity and reflexive muscular activity after prolonged cyclic loading. Clin Biomech (Bristol, Avon), 15, 167-75.
SPEAR, R. C., KELLER, C. A. & MILBY, T. H. (1976) Morbidity studies of workers exposed to whole body vibration. Arch Environ Health, 31, 141-5.
STEIN, G. J., MUCKA, P., CHMURNY, R., HINZ, B. & BLUTHNER, R. (2007) Measurement and modelling of x-direction apparent mass of the seated human body-cushioned seat system. J Biomech, 40, 1493-503.
SULLIVAN, A. & MCGILL, S. M. (1990) Changes in spine length during and after seated whole-body vibration. Spine, 15, 1257-60.
TAKEMASA, R., YAMAMOTO, H. & TANI, T. (1995) Trunk muscle strength in and effect of trunk muscle exercises for patients with chronic low back pain. The differences in patients with and without organic lumbar lesions. Spine, 20, 2522-30.
TASKAYNATAN, M. A., IZCI, Y., OZGUL, A., HAZNECI, B., DURSUN, H. & KALYON, T. A. (2005) Clinical significance of congenital lumbosacral malformations in young male population with prolonged low back pain. Spine, 30, E210-3.
VAN DEN TILLAAR, R. (2006) Will whole-body vibration training help increase the range of motion of the hamstrings? J Strength Cond Res, 20, 192-6.
33

Literature Review
34
VAN TULDER, M. W., OSTELO, R., VLAEYEN, J. W., LINTON, S. J., MORLEY, S. J. & ASSENDELFT, W. J. (2001) Behavioral treatment for chronic low back pain: a systematic review within the framework of the Cochrane Back Review Group. Spine, 26, 270-81.
VOLLESTAD, N. K. (1997) Measurement of human muscle fatigue. J Neurosci Methods, 74, 219-27.
WEBB, R., BRAMMAH, T., LUNT, M., URWIN, M., ALLISON, T. & SYMMONS, D. (2003) Prevalence and predictors of intense, chronic, and disabling neck and back pain in the UK general population. Spine, 28, 1195-202.
WEI, L. & GRIFFIN, J. (1998) THE PREDICITON OF SEAT TRANSMISSIBILITY FROM MEASURES OF SEAT IMPEDANCE. Journal of Sound and Vibration, 214, 121-137.
WEILER, P. J., KING, G. J. & GERTZBEIN, S. D. (1990) Analysis of sagittal plane instability of the lumbar spine in vivo. Spine, 15, 1300-6.
WIERZBICKA, M. M., GILHODES, J. C. & ROLL, J. P. (1998) Vibration-induced postural posteffects. J Neurophysiol, 79, 143-50.
WILDER, D. G., ALEKSIEV, A. R., MAGNUSSON, M. L., POPE, M. H., SPRATT, K. F. & GOEL, V. K. (1996) Muscular response to sudden load. A tool to evaluate fatigue and rehabilitation. Spine, 21, 2628-39.
WILDER, D. G., POPE, M. H. & FRYMOYER, J. W. (1988) The biomechanics of lumbar disc herniation and the effect of overload and instability. J Spinal Disord, 1, 16-32.
ZIMMERMANN, C. L., COOK, T. M. & GOEL, V. K. (1993) Effects of seated posture on erector spinae EMG activity during whole body vibration. Ergonomics, 36, 667-75.

Chapter 2 :
Preface to Studies

Preface to Studies
Preface to Studies
Although WBV is a risk factor for LBP, there is no clear agreement for the
mechanism as to how WBV exposure leads to LBDs. The three studies performed here
aim to clarify how WBV may contribute to LBP. The first study investigated the after
effects of WBV exposure on the postural control of the trunk. The results found an
increase in trunk dynamics that suggest a loss in postural and spinal stability control,
potentially a risk factor for LBP due to increased variability in trunk dynamics(Granata et
al., 1999). The second study further investigated the change in spinal stability control by
quantifying the effects of WBV on parameters of a control model. From the results of
this study, there is a better understanding as to which subsystems (passive stiffness,
active stiffness, neuromuscular reflex) are affected by WBV exposure. The third study
investigated the progression of changes during the exposure to WBV. These three studies
used spinal stability control as a mechanism that links WBV exposure and the risk for
LBP. The results form these studies can be helpful in the understanding of how WBV
leads to LBDs and aid in the development of guidelines for WBV exposure duration.
Does WBV exposure change spinal stability control?
Previous studies have reported some information that would suggest a possible
change in spinal stability control due to WBV including sensory error and changes in
muscular reflex response. These studies were limited to single frequency vibration and
35

Preface to Studies
different methods of applying trunk perturbations. The first study was designed to
continue from these other studies and to assess changes to spinal stability control via
measures of postural control. The postural control of the trunk was measured by a
wobble chair before and after a period of controlled, broad-band random WBV. The
measures of the wobble chair movement relate to the postural control of the trunk and
infers to spinal stability control.
Study 1:
Effects of Seated Whole-Body Vibration on Postural Control of the Trunk
During Unstable Seated Balance
From this study, it was shown that spinal stability control, as measured by postural
control, decreased with vibration exposure.
How is spinal stability control affected after WBV exposure?
From the results of the first study, we know that spinal stability control, as
measured from postural control, was reduced due to WBV exposure. The first study was
limited to reporting only if there is a change in spinal stability control. This second study
further addresses the issue by assessing the changes in parameters of a spinal stability
control model. Data was collected from trunk perturbations before and after vibration
36

Preface to Studies
exposure and system identification was used to quantify trunk stiffness, co-contraction
recruitment, muscle reflex delay and gain.
Study 2:
Effects of Seated Whole-Body Vibration on Spinal Stability Control:
Stiffness and Muscle Reflex
From this study, it was shown that after seated WBV, trunk stiffness and muscle reflexes
were decreased. There were no significant changes in reflex delays or recruitment of
muscle co-contraction.
What changes in the human body during WBV exposure?
From the results from the first two studies, the change in spinal stability control
after exposure to WBV was addressed. The third study was performed to assess the
progressive changes in trunk dynamics during the WBV exposure leading to the
reduction in spinal stability control. Data was collected from the seated subject during
the WBV exposure. Frequency response functions of apparent mass and transmissibility
were calculated in the frequency domain and natural frequencies and peak values were
quantified. Changes in these two parameters infers to the biomechanical properties of
trunk stiffness and damping respectively. Previous studies that have used apparent mass
and transmissibility to study the spine have been limited to short duration (<1 min)
37

Preface to Studies
38
vibration exposure, and were performed to test the vibration characteristics of frequency,
amplitude, and direction. The purpose of this study was to assess the vibration
characteristic of exposure duration on the human trunk.
Study 3:
Changes in the Natural Frequency of the Trunk
During Seated Whole-Body Vibration
From this study, it was shown that trunk stiffness and damping decreased over time of
WBV exposure with a trend for a rapid initial decrease in parameters.
References:
GRANATA, K. P., MARRAS, W. S. & DAVIS, K. G. (1999) Variation in spinal load and trunk dynamics during repeated lifting exertions. Clin Biomech (Bristol, Avon), 14, 367-75.
Vibration Effects on Seated Balance
Chapter 3
Effects of Seated Whole-Body Vibration on Postural Control of the Trunk During Unstable Seated Balance
Gregory P Slota, MS
SLOTA, G. P., GRANATA, K. P. & MADIGAN, M. L. (2008). Effects of seated
whole-body vibration on postural control of the trunk during unstable seated balance. Clinical Biomechanics (Bristol, Avon),23(4): 318-6.
Virginia Polytechnic Institute & State University School of Biomedical Engineering & Sciences
The Kevin P. Granata Musculoskeletal Biomechanics Laboratory
39

Vibration Effects on Seated Balance
(3.2) Abstract
Background: Low back disorders and their prevention is of great importance for
companies and their employees. Whole-body vibration is thought to be a risk factor
for low back disorders, but the neuromuscular, biomechanical, and/or physiological
mechanisms responsible for this increased risk are unclear. The purpose of this study
was to measure the acute effect of seated whole-body vibration on the postural
control of the trunk during unstable seated balance.
Methods: Twenty-one healthy subjects (age: 23 years (SD 4 years) ) were tested on a
wobble chair designed to measure trunk postural control. Measurements of kinematic
variance and non-linear stability control were based on seat angle before and after 30
minutes of seated whole-body vibration (bandwidth = 2 – 20 Hz, root-mean-squared
amplitude =1.15 m/s2).
Findings: All measures of kinematic variance of unstable seated balance increased
(P<0.05) after vibration including: ellipse area (35.5%), root-mean-squared radial
lean angle (17.9%), and path length (12.2%). Measures of non-linear stability control
also increased (P<0.05) including Lyapunov exponent (8.78%), stability diffusion
analysis (1.95%), and Hurst rescaled range analysis (5.2%).
Interpretation: Whole-body vibration impaired postural control of the trunk as
evidenced by the increase in kinematic variance and non-linear stability control
measures during unstable sitting. These findings imply an impairment in spinal
stability and a mechanism by which vibration may increase low back injury risk.
Future work should investigate the effects of whole-body vibration on the anatomical
and neuromuscular components that contribute to spinal stability.
40

Vibration Effects on Seated Balance
(3.3) Introduction
Low back disorders (LBDs) are common, costly, and debilitating. For Example,
26.4% of adults of the United States reported having low back pain within the last three
months (Deyo et al., 2006) and 60% to 80% experience low back pain (LBP) at some
point in their lives (van Tulder et al., 2001, Kelsey et al., 1984). The total health care
expenditures for people with LBP in the United States is over $90 billion (Luo et al.,
2004, Pope, 1996), while back pain and spine disorders were ranked in the top ten health
and productivity expenditures (Goetzel et al., 2003). Numerous risk factors for LBDs
have been identified including excessive spinal loading (Fathallah et al., 1998, Lee et al.,
1991, Marras et al., 1993), atypical postures (Marras and Granata, 1995, Granata and
Rogers, 2007, Keyserling, 2000), and spinal instability (Granata et al., 2004). Whole
body vibration (WBV) is another risk factor for LBDs. The National Research Council
(2001) reported that there is evidence of a “clear relationship between back disorders and
… whole-body vibration”. Six million workers are exposed to WBV (Griffin, 2006)
typically while in a seated position including delivery vehicles drivers (Rosegger and
Rosegger, 1960), forklift operators (Boshuizen et al., 1992), helicopters pilots (De
Oliveira and Nadal, 2005), and construction equipment operators (Spear et al., 1976).
Tractor drivers have reported 61-94% prevalence of LBP and pathological changes in the
spine (Dupris, 1966), and heavy-equipment drivers report 70% prevalence of LBP
(Cremona, 1972).
41

Vibration Effects on Seated Balance
Despite the categorization of WBV as a risk factor for LBDs and its prevalence in
the workplace, the neuromuscular, biomechanical, and/or physiological mechanisms by
which WBV can contribute to low back injuries are not well understood (Dong et al.,
2006, Griffin, 2006). Panjabi (1992a) decomposed the neuromusculoskeletal system that
controls spinal stability into three subsystems: passive tissue stiffness, active muscular
stiffness, and neuromuscular reflexes. Several studies have identified effects of WBV on
some of these subsystems. In regard to the passive tissue stiffness subsystem, seated
WBV increased the loss of height of the spine beyond the normal diurnal changes
(Klingenstierna and Pope, 1987, Sullivan and McGill, 1990), and the majority of this loss
of height is a direct result of creep of the intervertebral disc (Keller and Nathan, 1999).
Creep deformation of the connective tissue can disrupt the passive stability of the spine
and sensory organs contained within. In regard to the neuromuscular reflex subsystem,
WBV has been reported to decrease reflex activity (Roll et al., 1980). The effects were
reported to be due to alterations in the peripheral sensory motor system performance
affecting the senses of position and effort (Gauthier et al., 1981). Although these studies
illustrate the effects of WBV on the subsystems of passive tissue stiffness and
neuromuscular reflexes, the effect of WBV on overall spinal stability and postural control
is not known.
Measures of seated postural sway during unstable seated balance have been used
as surrogate measures of trunk postural control (Cholewicki et al., 2000, Van Daele et al.,
2007) and have been related to spinal stability (Reeves et al., 2006, Silfies et al., 2003).
In addition, differences in seated postural sway have been identified between patients
42

Vibration Effects on Seated Balance
with LBP and healthy individuals (Radebold et al., 2001). The goal of this study was to
investigate the acute effects of seated WBV on the postural control of the trunk. Seated
WBV was investigated because machine operators are typically exposed to vibration
while seated. Measures of kinematic variance and non-linear stability control were
recorded during unstable seated balance. It was hypothesized that WBV would impair
postural control of the trunk, suggesting a loss of spinal stability and perhaps an increased
risk for low back injury.
43

Vibration Effects on Seated Balance
(3.4) Materials & Methods
A wobble chair was designed and constructed to measure unstable seated balance,
and a platform was created to allow exposure to vertical seated WBV. The experimental
design involved repeated measurements of unstable seated balance both before and after
controlled exposure to seated WBV.
(3.4.1) Apparatus Design
The wobble chair design (Figure 1) was adapted from the concept by Cholewicki
et al. (2000). The seat pivoted on a low friction ball-and-socket joint located under the
center of the seat. Supplemental seat support was also provided by four springs (stiffness
= 99.82 N/cm) spaced every 90° circumferentially that could be moved radially from the
ball-and-socket to modulate task difficulty (as the springs are moved radially outward,
resistance to rotation is increased and maintaining a stable seat becomes easier). The
range of motion of the seat allowed approximately twelve degrees of rotation in any
direction from the initial level position before the seat would impact the physical limits of
the wobble chair. Affixed to the seat was an adjustable foot rest to limit the motion of the
lower limbs during unstable seated balance testing. Two seat belts were used to restrict
the movement of the pelvis with respect to the seat, thus limiting motion to only the
spine. The anterior/posterior (A/P) position of the seat with respect to the ball-and-socket
44

Vibration Effects on Seated Balance
joint was adjustable so that the equilibrium balance position of an upright trunk posture
would coincide with a level seat platform.
Figure 1: Wobble chair (above) and spring layout (below). The spring position was adjustable radially from the central ball-and-socket pivot point.
The wobble chair was designed (Figure 2) such that a tilt of the seat platform ( θ2)
would result in a restorative force from the springs ( KL2sin(θ2) ) in proportion to the
square of the radial position from the center ( L ). The springs resisted the gravitational
moment of the subject’s center of mass ( MGHsin(θ1) ) (Equation 1). The springs could
be positioned 7-22 cm from the center. This distance was converted to percent MGH to
correspond to the ratio of spring force to gravitational force. MGH was calculated from
two measurements of moment on a force plate (Equation 2) during static tilted postures at
two different angles. More specifically, it was the ratio of the difference in moments
over the differences in the angle ( sin(θa)-sin(θb) ) (Equation 3). A spring position of
45

Vibration Effects on Seated Balance
L=100%MGH (i.e. KL2 = MGH) was considered neutrally stable (as a rigid mass would
reach equilibrium at any angle). A greater percentage of MGH would create a more
robustly stable seating condition approaching that of fixed seat. At a lower percent
MGH, the seat was unstable without active control to balance. The adjustability of the
springs and conversion to percent MGH allowed for testing at comparable levels of
relative stability robustness regardless of individual subject’s anthropometrics
(differences in mass or center of mass location) as seen in previous studies (Cholewicki et
al., 2000).
( ) ( )22
1 sinsin θθ KLMGH = (1)
( )( ) eMyMGH
eMyMGH
bb
aa
+=+=
θθ
sinsin
(2)
( ) ( )( ) ( )ba
ba eMyeMyMGH
θθ sinsin −+−+
= (3)
Figure 2: Model diagram of the wobble chair functionality. Springs used only in compression and are not attached to top surface.
46

Vibration Effects on Seated Balance
The wobble chair was fixed to the top of a vibration platform so that each subject
could be exposed to WBV or unstable seated balance trials without leaving the chair
(Figure 3). This also allowed for the continued use of the seat belts and foot rest to
restrict the pelvic ad lower limb motions during WBV. The vibrating platform consisted
of an electro-mechanical shaker (MB Dynamics PM-100, Cleveland, OH, USA) on the
back of the platform, a spring in the middle to offset the subject’s weight, and a hinge in
the front to allow vertical movement of the chair. Using this configuration, the maximum
vertical excursion of the subject was approximately 1.27cm above and below the neutral
position during WBV.
Figure 3: Vibration apparatus set-up with wobble chair on top.
An accelerometer (CXL04, Crossbow Inertial Systems, San Jose, CA, USA) was
attached to the seat of the wobble chair inline with the base of the spine to monitor the
47

Vibration Effects on Seated Balance
vibration characteristics. The shaker was driven by a Quanser Q8-I/O card (Quanser
Consulting Inc., Markham, Ontario, Canada) connected to a SS530 Amplifier (MB
Dynamics). Simulink (The MathWorks, Natick, MA, USA) code was used to generate in
real-time a signal and control the shaker. The signal was created from a random number
generator passed through discrete high-pass and low-pass filters set to 2 Hz and 20 Hz,
respectively (transmissibility band of the torso (Griffin et al., 1982) ). The filtered signal
was adjusted by controlling the proportional gain based on the difference between a five
second window of root-mean-squared (RMS) amplitude from the accelerometer and the
desired acceleration for this test of 1.15 m/s2 (International Organization for
Standardization exposure limit (International Organization for Standardization, 1997) ).
(3.4.2) Experimental Protocol
Testing was performed on 21 healthy adults (age: 23 years (SD 4 years) , height:
170.8 cm (SD 12.2 cm), mass: 73.89 kg (SD 13.97 kg), 13 males and 8 females) who had
no previous history of low back pain. Fourteen of the 21 subjects completed a second
experiment during which WBV was replaced with quiet sitting. The goal of this second
control experiment was to identify any effects of prolonged sitting on postural control of
the trunk. This study was approved by the Virginia Polytechnic Institute & State
University Institutional Review Board, and all subjects provided informed consent prior
to participation.
48

Vibration Effects on Seated Balance
The experiment began by determining the desired spring position on the wobble
chair. The desired spring position would be one where balance could be maintained
without hitting the physical limits of the wobble chair, but still be sufficiently
challenging. In a previous study measuring the differences in unstable seated balance,
between LBP patients and healthy individuals, the differences were more apparent when
sitting is more challenging (Radebold et al., 2001). Starting with a spring position of 13
cm (near L=100%MGH), unstable seated trials were performed. After each balance trial of
the wobble chair, the spring positions were moved in 1-2 cm. This process continued
until the range of motion of the seat tilt was constantly crossing a 7° radial tilt threshold
and or the subject was unable to balance without hitting the physical limits. In the case of
the latter, the springs were then moved out 0.5 cm between trials until the ability to
balance was restored and the threshold was still being crossed. This final spring position
was then used for all subsequent trials for that subject. This process typically required 6-
8 trials. These trials also served as practice trials to 1) minimize any learning effects in
the data collection trials, 2) allow the subject to acclimatize to the task. The mean spring
position during all testing was 43.55 %MGH (SD 8.4 %MGH).
Four unstable seated balance trials were collected while the subject sat on the
wobble chair. Each subject was instructed to sit with an upright posture, eyes open, and
their arms folded across their chest. Each trial lasted 60 seconds, and a minimum of one
minute rest was allowed between trials to minimize fatigue. After these trials, WBV was
applied for 30 minutes while the subject sat on the wobble chair after locking it in place.
Immediately following WBV, three more trials of unstable seated balance were
49
Vibration Effects on Seated Balance
performed as before WBV. Rest periods of less than ten seconds between trials were
used to minimize any potential recovery from WBV.
The control group completed an additional experimental session within one week
of the WBV test session. During this session, each subject performed the same protocol
as described, but the 30 minutes of WBV was replaced with quiet sitting between the
measurements of unstable seated balance on the wobble chair. The same spring settings
as in the vibration session were used.
Wobble chair angular position was sampled at 100 Hz during all trials using a tri-
axial angle sensor (X-sens Motion Technologies, Netherlands). The sensor was oriented
such that rotation in the pitch and roll directions were aligned with anatomical directions
of A/P and medial/lateral (M/L) respectively. Calculations were also perform in the
resultant radial (RR); resultant lean angle. Kinematic variance of the angle data were
determined using common measures of postural sway during quiet standing including the
95% ellipse area , RMS (A/P, M/L, and RR), and path length (Prieto et al., 1996). Non-
linear stability control measures of the data consisted of Lyapunov exponent, stability
diffusion analysis, and Hurst rescaled range analysis. The Lyapunov exponent looks at
the rhythmic activity of the system in state space as a limit cycle. The process quantifies
the exponential separation of trajectories of nearest neighbors with time (Harbourne and
Stergiou, 2003). The analysis used the 4 dimensional state dynamics (two angles, two
angular velocities) to calculate the nearest neighbors (Kang and Dingwell, 2006).
Stability diffusion analysis allows for correlation between past and future displacements
50

Vibration Effects on Seated Balance
and summarizes the mean square displacement as a function of the time interval between
comparisons (Collins and De Luca, 1993). The analysis allows for the system to be
broken down into two parts, short-term open-loop control (reported here as HS-A/P, -
M/L, -RR) and long-term closed-loop control. The long-term stability diffusion analysis
parameter is not representative of a bounded system (Delignieres et al., 2003) and
therefore was not used in this study. The Hurst rescaled range analysis describes the
fractal properties of fluctuations in measurements during postural control (Duarte and
Zatsiorsky, 2000) (reported here as HR-A/P, -ML, -RR). All calculation of non-linear
stability control measures were made with custom-written code in Matlab (The
MathWorks, Natick, MA, USA) by our lab.
Initial analysis resulted in no significance due to learning effects, therefore all
four trials from each subject before vibration were averaged, and all three trials after
vibration were averaged. One subject had to be excluded from the analysis because they
were unable to balance on the wobble chair after vibration. Data from the two
experimental sessions were analyzed separately due to the differing number of subjects.
The effects of vibration on kinematic variance and non-linear stability control measures
of unstable seated balance were investigated using a one-way repeated measures
ANCOVA. The independent variable was vibration (before and after), and the covariate
was normalized spring position (%MGH) because it was shown to influence some
measures of kinematic variance and non-linear stability control. The effects of 30
minutes of sitting were investigated using the same statistical test. All statistical analysis
51

Vibration Effects on Seated Balance
was performed using Stastica (StatSoft, Inc., Tulsa, OK, USA) with α=0.05 indicating
statistical significance.
52

Vibration Effects on Seated Balance
(3.5) Results
WBV increased all measures of kinematic variance (Table 1). For example,
ellipse area increased 35.5% (SD 50.5%) (P<0.01), RMS-RR increased 17.9% (SD
21.0%) (P <0.01), and path length increased 12.2% (SD 15.1%) (P <0.01). WBV also
increased all non-linear stability control measures (Table 2). Lyapunov exponent
increased 8.78% (SD 10.9%) (P <0.01), and all three directions of stability diffusion
analysis and Hurst rescaled range analysis increased including HS-RR increasing 1.95%
(SD 2.8%) (P <0.01), and HR-RR increasing 5.2% (SD 4.0%) (P <0.01). Thirty minutes
of sitting did not affect most measures of kinematic variance and non-linear stability
control measures. Only RMS-M/L decreased 7.6% (SD 12.0%) (P =0.027), and HS-M/L
decreased 1.0% (SD 1.3%) (P =0.019) after prolonged sitting.
Figure 4: Example stabilogram data of before and after WBV exposure. The circle represents the area of the average distance from equilibrium. Also labeled are
ellipse area (EA) and path length (PL). Units are degrees of seat tilt.
53

Vibration Effects on Seated Balance
Table 1: Kinematic variance measures (Mean (SD) ) of unstable seated balance both before and after vibration exposure.
Variable Before After P-value
Ellipse Area (degrees) 58.600 (40.468) 79.390 (40.864) 0.005* RMS-A/P (degrees) 1.461 (0.614) 1.801 (0.626) 0.003* RMS-M/L (degrees) 1.835 (0.437) 2.283 (0.569) p<0.001* RMS-RR (degrees) 2.448 (0.778) 2.887 (0.767) 0.001*
Path Length (degrees) 173.179 (60.275) 194.338 (60.134) 0.002* (* indicates p<0.05)
Table 2: Stability assessment measures of unstable seated balance (Mean (SD) ) both before and after vibration exposure.
Variable Before After P-value Lyapunov Exponent 0.613 (0.082) 0.667 (0.074) 0.002*
HS-A/P 0.643 (0.028) 0.652 (0.029) 0.039* HS-M/L 0.659 (0.015) 0.668 (0.019) 0.041* HS-RR 0.608 (0.022) 0.620 (0.025) 0.006* HR-A/P 0.886 (0.030) 0.929 (0.021) p<0.001* HR-M/L 0.905 (0.024) 0.930 (0.021) p<0.001* HR-RR 0.853 (0.024) 0.897 (0.026) p<0.001*
(* indicates p<0.05)
54

Vibration Effects on Seated Balance
(3.6) Discussion
The goal of this study was to investigate the effects of seated WBV on the
postural control of the trunk. All measures of kinematic variance and non-linear stability
control during unstable seated balance increased following WBV, suggesting that the
postural control of the trunk was impaired. It is commonly believed that greater
variability indicates greater instability (Dickstein and Laufer, 2004, Dingwell and Marin,
2006). Therefore, the results of this study imply an impairment of spinal stability with
WBV. The results of the control group analysis suggest that the changes in postural
control were not due to sitting alone.
The changes in postural control of the trunk during unstable seated balance
reported here imply an impairment of spinal stability. Spinal stability is maintained
through contributions from passive tissue stiffness, active muscular stiffness, and
neuromuscular reflexes. The effect of WBV on any of these subsystems could
conceivably alter postural control of the trunk (Reeves et al., 2007), and explain the
changes found in the present study. Wilder et al. (1996) investigated the effects of
seated, sinusoidal WBV on neuromuscular reflexes elicited from a sudden trunk flexion
loading from a hand-held box. Erector spinae reaction times increased from 87 msec to
108 msec, and reflex amplitudes from 55% to 67% maximum voluntary contraction. In a
similar study, Li et al. (2007) investigated the effects of seated WBV on trunk kinematics
and neuromuscular reflexes in response to a sudden trunk flexion loading applied to the
trunk. Maximum trunk flexion angle increased from 11.8 to 13.2 degrees, and time to
55
Vibration Effects on Seated Balance
peak muscle response increased from 205 msec to 228 msec. In addition, the position
sense error of the torso increased 1.58-fold. The increase in peak muscle response time
was therefore attributed to an increase in the movement threshold to elicit a reflex. These
studies indicate that seated WBV impairs neuromuscular reflexes, which can impair
postural control of the trunk, and spinal stability (Franklin and Granata, 2007). Perhaps
related to this increase in movement threshold, Panjabi (1992b) described a change in the
passive tissue stiffness due to an increase in the range of the neutral zone (i.e. the range
of motion where spinal motion is produced with a minimal internal resistance). Seated
WBV has also been shown to affect the passive stiffness components by causing creep
deformation in intervertebral discs (Klingenstierna and Pope, 1987), which could also
increase the neutral zone and affect postural control of the trunk and spinal stability
(Courville et al., 2005, Panjabi, 1992b).
A few limitations to this study are worth noting. First, this study investigated
WBV with specific characteristics (RMS amplitude, frequency content, duration). This
amplitude was selected to match the exposure limit as set by the International
Organization for Standardization. Vibration with different characteristics may have
different effects on unstable seated balance. Second, this study only investigated the
acute effects of WBV. It is unclear how long these effects persist. Third, although all
dependant variables exhibited statically significant changes after WBV, it is unclear if
these changes are clinically meaningful. Effect sizes ranged from 0.31 to 2.07 (average
1.19), which we feel would likely reveal meaningful changes, but follow up studies are
required to validate. Fourth, this study implicitly attributed the changes in the postural
56

Vibration Effects on Seated Balance
control of the trunk with WBV to aspects directly-related to the control of spinal stability
(i.e. passive tissue stiffness, active muscular stiffness, and neuromuscular reflex control).
However, WBV could have influenced other systems or factors such as the vestibular
(Gauthier et al., 1981, Roll et al., 1980) and visual systems (Ishitake et al., 1998), which
in turn influenced our dependent measures.
57

Vibration Effects on Seated Balance
(3.7) Conclusion
In conclusion, WBV impaired postural control of the trunk, which may indicate
impaired spinal stability. Future studies are required to further explore the affects of
WBV on the subsystems of the neuromusculoskeletal system that controls spinal stability,
as well as to understand the effects of different vibration characteristics, exposure
durations, and recovery time-line.
Acknowledgements
This work is dedicated to Dr. Kevin P. Granata, whose contributions started this
study, but was tragically killed on April 16, 2007 at Virginia Tech, and was not able to
see it through to completion. Also to be acknowledged are Duncan Hall for his
contributions on the vibration platform construction and software control, and Emmanuel
Ekwueme for his assistance with data collections.
58

Vibration Effects on Seated Balance
(3.8) References
BOSHUIZEN, H. C., BONGERS, P. M. & HULSHOF, C. T. (1992) Self-reported back pain in fork-lift truck and freight-container tractor drivers exposed to whole-body vibration. Spine, 17, 59-65.
CHOLEWICKI, J., POLZHOFER, G. K. & RADEBOLD, A. (2000) Postural control of trunk during unstable sitting. J Biomech, 33, 1733-7.
COLLINS, J. J. & DE LUCA, C. J. (1993) Open-loop and closed-loop control of posture: a random-walk analysis of center-of-pressure trajectories. Exp Brain Res, 95, 308-18.
COURVILLE, A., SBRICCOLI, P., ZHOU, B. H., SOLOMONOW, M., LU, Y. & BURGER, E. L. (2005) Short rest periods after static lumbar flexion are a risk factor for cumulative low back disorder. J Electromyogr Kinesiol, 15, 37-52.
CREMONA, E. (1972) Die Wirbelsaule dei den Schwerarbeiten der Eisen-und Stahlindustrie sowie des Bergbaus. Kommiss. Europ. Gem. Genaraldir. Soz. Angelegenheitern Dok. Nr 1911/72.
DE OLIVEIRA, C. G. & NADAL, J. (2005) Transmissibility of helicopter vibration in the spines of pilots in flight. Aviat Space Environ Med, 76, 576-80.
DELIGNIERES, D., DESCHAMPS, T., LEGROS, A. & CAILLOU, N. (2003) A methodological note on nonlinear time series analysis: is the open- and closed-loop model of Collins and De Luca (1993) a statistical artifact? J Mot Behav, 35, 86-97.
DEYO, R. A., MIRZA, S. K. & MARTIN, B. I. (2006) Back pain prevalence and visit rates: estimates from U.S. national surveys, 2002. Spine, 31, 2724-7.
DICKSTEIN, R. & LAUFER, Y. (2004) Light touch and center of mass stability during treadmill locomotion. Gait Posture, 20, 41-7.
DINGWELL, J. B. & MARIN, L. C. (2006) Kinematic variability and local dynamic stability of upper body motions when walking at different speeds. J Biomech, 39, 444-52.
DONG, R., KRAJNAK, K. & WIRTH, O. (2006) Introduction:. Conference on Human Vibration. Morgantown, WV: DHHS/CDD/NIOSH, 2006: 1.
DUARTE, M. & ZATSIORSKY, V. M. (2000) On the fractal properties of natural human standing. Neurosci Lett, 283, 173-6.
DUPRIS, C. W. (1966) Urber die Deansprunchung die Wirbelsaule unter dem Einfluss sinusformiger und stochastischer Schwingungen Int. Zeitschrift angewandte Phys. Arbeitsphys, 22, 258-78.
FATHALLAH, F. A., MARRAS, W. S. & PARNIANPOUR, M. (1998) An assessment of complex spinal loads during dynamic lifting tasks. Spine, 23, 706-16.
59
Vibration Effects on Seated Balance
FRANKLIN, T. C. & GRANATA, K. P. (2007) Role of reflex gain and reflex delay in spinal stability--a dynamic simulation. J Biomech, 40, 1762-7.
GAUTHIER, G. M., ROLL, J. P., MARTIN, B. & HARLAY, F. (1981) Effects of whole-body vibrations on sensory motor system performance in man. Aviat Space Environ Med, 52, 473-9.
GOETZEL, R. Z., HAWKINS, K., OZMINKOWSKI, R. J. & WANG, S. (2003) The health and productivity cost burden of the "top 10" physical and mental health conditions affecting six large U.S. employers in 1999. J Occup Environ Med, 45, 5-14.
GRANATA, K. P. & ROGERS, E. (2007) Torso flexion modulates stiffness and reflex response. J Electromyogr Kinesiol, 17, 384-92.
GRANATA, K. P., SLOTA, G. P. & WILSON, S. E. (2004) Influence of fatigue in neuromuscular control of spinal stability. Hum Factors, 46, 81-91.
GRIFFIN, M. J., WHITHAM, E. M. & PARSONS, K. C. (1982) Vibration and comfort. I. Translational seat vibration. Ergonomics, 25, 603-30.
GRIFFIN, N. J. (2006) Health Effects of Vibration – The Known and Unknown. Conference on Human Vibration. Morgan Town, WV: DHHS / CDC / NIOSH, 2006: 3-4.
HARBOURNE, R. T. & STERGIOU, N. (2003) Nonlinear analysis of the development of sitting postural control. Dev Psychobiol, 42, 368-77.
INTERNATIONAL ORGANIZATION FOR STANDARDIZATION (1997) Mechanical Vibration and Shock - Evaluation of human exposure to whole-body vibration. ISO 2631. 1997. Geneva.
ISHITAKE, T., ANDO, H., MIYAZAKI, Y. & MATOBA, F. (1998) Changes of visual performance induced by exposure to whole-body vibration. Kurume Med J, 45, 59-62.
KANG, H. G. & DINGWELL, J. B. (2006) A direct comparison of local dynamic stability during unperturbed standing and walking. Exp Brain Res, 172, 35-48.
KELLER, T. S. & NATHAN, M. (1999) Height change caused by creep in intervertebral discs: a sagittal plane model. J Spinal Disord, 12, 313-24.
KELSEY, J. L., GITHENS, P. B., WHITE, A. A., 3RD, HOLFORD, T. R., WALTER, S. D., O'CONNOR, T., OSTFELD, A. M., WEIL, U., SOUTHWICK, W. O. & CALOGERO, J. A. (1984) An epidemiologic study of lifting and twisting on the job and risk for acute prolapsed lumbar intervertebral disc. J Orthop Res, 2, 61-6.
KEYSERLING, W. M. (2000) Workplace risk factors and occupational musculoskeletal disorders, Part 1: A review of biomechanical and psychophysical research on risk factors associated with low-back pain. AIHAJ, 61, 39-50.
KLINGENSTIERNA, U. & POPE, M. H. (1987) Body height changes from vibration. Spine, 12, 566-8.
60

Vibration Effects on Seated Balance
LEE, K. S., CHAFFIN, D. B., HERRIN, G. D. & WAIKAR, A. M. (1991) Effect of handle height on lower-back loading in cart pushing and pulling. Appl Ergon, 22, 117-23.
LI, L., LAMIS, F. & WILSON, S. E. (2007) Whole body vibration alters proprioception in the trunk. International Journal of Industrial Ergonomics.
LUO, X., PIETROBON, R., SUN, S. X., LIU, G. G. & HEY, L. (2004) Estimates and patterns of direct health care expenditures among individuals with back pain in the United States. Spine, 29, 79-86.
MARRAS, W. S. & GRANATA, K. P. (1995) A biomechanical assessment and model of axial twisting in the thoracolumbar spine. Spine, 20, 1440-51.
MARRAS, W. S., LAVENDER, S. A., LEURGANS, S. E., RAJULU, S. L., ALLREAD, W. G., FATHALLAH, F. A. & FERGUSON, S. A. (1993) The role of dynamic three-dimensional trunk motion in occupationally-related low back disorders. The effects of workplace factors, trunk position, and trunk motion characteristics on risk of injury. Spine, 18, 617-28.
NATIONAL RESEARCH COUNCIL (2001) Musculoskeletal disorders and the workplace : low back and upper extremities, Washington, D.C. :, National Academy Press.
PANJABI, M. M. (1992a) The stabilizing system of the spine. Part I. Function, dysfunction, adaptation, and enhancement. J Spinal Disord, 5, 383-9; discussion 397.
PANJABI, M. M. (1992b) The stabilizing system of the spine. Part II. Neutral zone and instability hypothesis. J Spinal Disord, 5, 390-6; discussion 397.
POPE, M. H. (1996) Occupational Risk Factors, St. Louis, MO.
PRIETO, T. E., MYKLEBUST, J. B., HOFFMANN, R. G., LOVETT, E. G. & MYKLEBUST, B. M. (1996) Measures of postural steadiness: differences between healthy young and elderly adults. IEEE Trans Biomed Eng, 43, 956-66.
RADEBOLD, A., CHOLEWICKI, J., POLZHOFER, G. K. & GREENE, H. S. (2001) Impaired postural control of the lumbar spine is associated with delayed muscle response times in patients with chronic idiopathic low back pain. Spine, 26, 724-30.
REEVES, N. P., EVERDING, V. Q., CHOLEWICKI, J. & MORRISETTE, D. C. (2006) The effects of trunk stiffness on postural control during unstable seated balance. Exp Brain Res, 174, 694-700.
REEVES, N. P., NARENDRA, K. S. & CHOLEWICKI, J. (2007) Spine stability: the six blind men and the elephant. Clin Biomech (Bristol, Avon), 22, 266-74.
ROLL, J. P., MARTIN, B., GAUTHIER, G. M. & MUSSA IVALDI, F. (1980) Effects of whole-body vibration on spinal reflexes in man. Aviat Space Environ Med, 51, 1227-33.
61

Vibration Effects on Seated Balance
62
ROSEGGER, R. & ROSEGGER, S. (1960) Health effects of tractor driving. Ann Agric Eng Res, 5, 241-76.
SILFIES, S. P., CHOLEWICKI, J. & RADEBOLD, A. (2003) The effects of visual input on postural control of the lumbar spine in unstable sitting. Hum Mov Sci, 22, 237-52.
SPEAR, R. C., KELLER, C. A. & MILBY, T. H. (1976) Morbidity studies of workers exposed to whole body vibration. Arch Environ Health, 31, 141-5.
SULLIVAN, A. & MCGILL, S. M. (1990) Changes in spine length during and after seated whole-body vibration. Spine, 15, 1257-60.
VAN DAELE, U., HUYVAERT, S., HAGMAN, F., DUQUET, W., VAN GHELUWE, B. & VAES, P. (2007) Reproducibility of postural control measurement during unstable sitting in low back pain patients. BMC Musculoskelet Disord, 8, 44.
VAN TULDER, M. W., OSTELO, R., VLAEYEN, J. W., LINTON, S. J., MORLEY, S. J. & ASSENDELFT, W. J. (2001) Behavioral treatment for chronic low back pain: a systematic review within the framework of the Cochrane Back Review Group. Spine, 26, 270-81.
WILDER, D. G., ALEKSIEV, A. R., MAGNUSSON, M. L., POPE, M. H., SPRATT, K. F. & GOEL, V. K. (1996) Muscular response to sudden load. A tool to evaluate fatigue and rehabilitation. Spine, 21, 2628-39.

Vibration Effects on Spinal Biomechanics
Chapter 4
Effects of Seated Whole-Body Vibration on Spinal Stability Control: Stiffness & Muscle Reflex
Gregory P Slota, MS
Virginia Polytechnic Institute & State University School of Biomedical Engineering & Sciences
The Kevin P. Granata Musculoskeletal Biomechanics Laboratory
63

Vibration Effects on Spinal Biomechanics
(4.2) Abstract
Background: Whole-body vibration is a risk factor for low back disorders, but the
neuromuscular, biomechanical, and/or physiological mechanisms responsible
for this increased risk are unclear. The purpose of this study was to measure
the effect of seated whole-body vibration on spinal stability control
parameters.
Methods: Twenty healthy subjects were exposed to a series of pseudorandom force
perturbations applied to the trunk both before and after 30 minutes of seated
whole-body vibration (2 – 20 Hz and 1.15 m/s2 root-mean-squared amplitude).
System identification techniques were performed to quantify total trunk
stiffness, co-contraction recruitment, and erector spinae reflex delay and gain.
Findings: Total trunk stiffness and erector spinae reflex gain decreased significantly
after exposure to seated whole-body vibration. Vibration did not change
erector spinae reflex delay. Active muscle co-contraction recruitment was
also not found to change due to vibration exposure.
Interpretation: Seated whole-body vibration altered trunk stiffness (passive stiffness and
effective reflex stiffness) as well as reflex dynamics. All of which contribute
to spinal stability. There was no evidence of compensation for decreases in
trunk stiffness and reflex gain by active muscle co-contraction recruitment.
This research helps to elucidate a biomechanical mechanism by which
vibration may increase low back injury risk.
64
Vibration Effects on Spinal Biomechanics
(4.3) Introduction
Low back disorders (LBDs) afflict a large percentage of workers every day, and
enact a large economic toll in terms of medical costs and lost work time. They affect
59% to 80% of U.S. workers (Kelsey et al., 1984), cost approximately $100 billion a year
in total compensation (Pope, 1996), and account for 25% of all lost work days in industry
(Guo et al., 1995). Numerous risk factors for LBDs have been identified including
excessive spinal loading (Fathallah et al., 1998, Lee et al., 1991, Marras et al., 1993),
atypical postures (Marras and Granata, 1995, Keyserling, 2000), and spinal instability
(Granata et al., 2004). Whole-body vibration (WBV) has also been identified as a risk
factor for LBDs (Waters et al., 2007). In fact, the National Research Council (2001)
reported that there is evidence of a “clear relationship between back disorders and …
whole-body vibration”. In support of this, tractor and heavy-equipment drivers have
reported 61-94% and 70% prevalence of low back pain (LBP), respectively (Dupris,
1966, Cremona, 1972).
Despite the characterization of WBV as a risk factor for LBDs, the
neuromuscular, biomechanical, and/or physiological mechanisms by which WBV
contributes to low back injuries are not well understood (Dong et al., 2006, Griffin,
2006). The neuromusculoskeletal system that contributes to the control of spinal stability
can be thought of as three subsystems: passive tissue stiffness, active muscular stiffness,
and neuromuscular reflexes (Panjabi, 1992a). Passive tissue stiffness, which is attributed
to bony and ligamentous structures, is only able to support minimal compressive loads up
65

Vibration Effects on Spinal Biomechanics
to 88 N without buckling (Crisco, 1989), and is insufficient to independently provide
stability. Active muscle stiffness, which is attributed to muscle co-contraction, is able to
support larger loads, but requires an elevated energy cost due to maintaining constant
muscular activity. Neuromuscular reflexes provide a reactive component that responds to
disruptions in spinal alignment. Up to 40% of the total stiffness from all three
subsystems has been attributed to the contribution of neuromuscular reflexes which the
authors called effective reflex stiffness (Moorhouse and Granata, 2007).
Several studies have identified the effects of WBV on these subsystems. In
regard to the passive tissue stiffness, seated WBV increased the loss of height of the spine
beyond the normal diurnal changes (Klingenstierna and Pope, 1987, Sullivan and McGill,
1990). The majority of this height loss was a direct result of intervertebral disc
deformation (Keller and Nathan, 1999). In terms of the neuromuscular reflexes, WBV
has been reported to decrease reflex activity. Seated WBV, leg vibration, and head-trunk
vibration each resulted in reflex inhibition for tendon-stretch, tonic vibration, and
Hoffmann reflexes in the soleus muscle (Roll et al., 1980). Studies of trunk perturbations
found increased erector spinae reaction times (i.e. reflex delay) after exposure to seated
WBV in addition to increased torso angular displacement and muscle reflex amplitudes
(Wilder et al., 1996, Li et al., 2008). These effects have been attributed to an increase in
the movement threshold necessary to elicit a reflex (Li et al., 2008), or a disturbance to
the proprioceptive system creating errors is position, velocity, and force control (Gauthier
et al., 1981). These changes can decrease spinal stability and increase the risk of LBP.
However, another study that used a protocol of 60 minutes random WBV found
66

Vibration Effects on Spinal Biomechanics
conflicting results. It was reported that there were no significant effects of WBV on
balance or EMG reflex gain or delay (Santos et al., 2008). These conflicting results may
be due to differences in vibration protocols and data analysis methods. All three studies
used sudden loading protocols to elicit reflexes. Wilder et al. (1996) used a hand-held
crate and Li at al. (2008) used trunk perturbations, both measuring from force onset to
reflex peak while Santos et al. (2008) used trunk perturbations and reflex onset time.
Additionally, the studies that found effects of WBV used 5 Hz sinusoidal vibration (0.223
and 0.315 m/s2 RMS) targeting the natural frequency of the trunk while the other used a
seated posture and random WBV exposure (0.5-20 Hz, 0.86 m/s2 RMS) to simulate a
mining trunk.
This lab has also been investigating the effects of seated WBV on the
neuromuscularskeletal system. A previous study reported increased seated postural sway
during unstable seated balance after exposure to seated WBV (Slota et al., 2008). These
results suggest changes in seated postural control, and potentially spinal stability, which
conflicts with the balance tests of Santos et al. (2008). Based on the change in seated
balance and using the same vibration protocol, the goal of this current study was to
measure the effects on the three subsystems of the neuromusculoskeletal system that
contribute to seated postural control and spinal stability. Understanding the effects of
WBV on these subsystems will help elucidate how WBV influences the control of the
spine, and may contribute to the development of interventions to help prevent LBDs.
67
Vibration Effects on Spinal Biomechanics
(4.4) Methods
This experiment was performed on 20 healthy adults who had no history of LBP.
Subjects included ten males and ten females with a mean (standard deviation) age of 24.8
years (SD 6.2 years), height of 171.5 cm (SD 8.8 cm), and mass of 69.0 kg (SD 10.6 kg).
This study was approved by the Virginia Polytechnic Institute & State University
Institutional Review Board, and each subject provided informed consent prior to
participation.
Each subject completed two experimental sessions separated by approximately
one week in an order that was counter-balanced across all subjects. During both sessions,
measurements to determine total trunk stiffness, muscle reflex gain and delay, and muscle
activity were collected before and after an intervention. The interventions were either 30
minutes of seated WBV or 30 minutes of quiet sitting. Quiet sitting was investigated to
separate the effects of seated WBV from any effects due to simply sitting or sequential
measures.
(4.4.1) Experimental Protocol
The subject was assisted into the testing apparatus seat (Figure 1) and secured to
the seat with two seatbelts to restrict pelvic movement. A footrest limited lower limb
movement. Four maximum voluntary contractions (MVC) in trunk flexion and extension
68
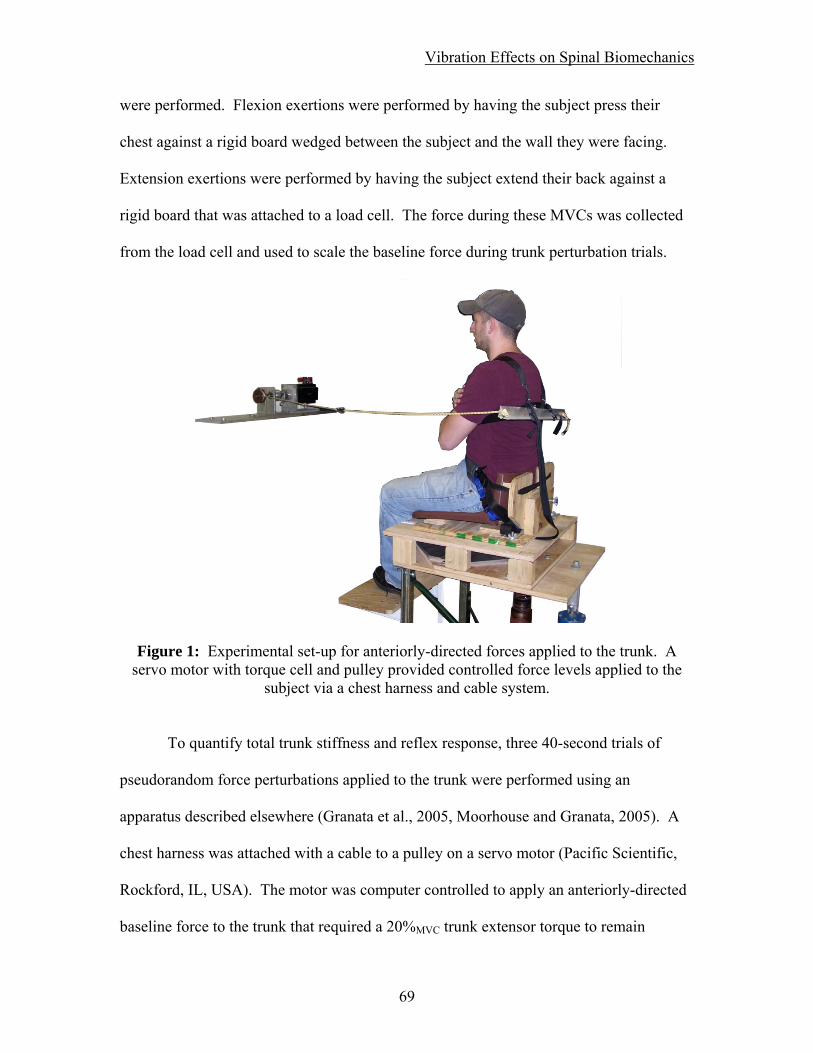
Vibration Effects on Spinal Biomechanics
were performed. Flexion exertions were performed by having the subject press their
chest against a rigid board wedged between the subject and the wall they were facing.
Extension exertions were performed by having the subject extend their back against a
rigid board that was attached to a load cell. The force during these MVCs was collected
from the load cell and used to scale the baseline force during trunk perturbation trials.
Figure 1: Experimental set-up for anteriorly-directed forces applied to the trunk. A servo motor with torque cell and pulley provided controlled force levels applied to the
subject via a chest harness and cable system.
To quantify total trunk stiffness and reflex response, three 40-second trials of
pseudorandom force perturbations applied to the trunk were performed using an
apparatus described elsewhere (Granata et al., 2005, Moorhouse and Granata, 2005). A
chest harness was attached with a cable to a pulley on a servo motor (Pacific Scientific,
Rockford, IL, USA). The motor was computer controlled to apply an anteriorly-directed
baseline force to the trunk that required a 20%MVC trunk extensor torque to remain
69

Vibration Effects on Spinal Biomechanics
upright. Trunk perturbations consisted of pseudorandom, anteriorly-directly, force
perturbations of 33% of the subject’s combined head, arms, and trunk weight (58% of
total weight (Granata and Rogers, 2007)) ranging 50-150 msec in duration and rest
periods. Each trial consisted of: 5 seconds of ramp loading from zero torque to baseline,
3 seconds of sustained baseline, 30 seconds of perturbations superimposed on the
baseline (Figure 2), and 2 seconds of ramping down to zero torque. The subject was
instructed to not co-contract their trunk flexors, and this was monitored using EMG. Rest
periods were provided between trials to avoid neuromuscular fatigue.
Figure 2: Example data of a) forces (N) applied to the trunk, b) position displacement (mm) of the trunk, and c) ES muscle activity (normalized left and right signals).
After these measurements, seated WBV was applied for 30 minutes. The subject
sat on a vibrating platform (Figure 3) that consisted of an electro-mechanical shaker (MB
Dynamics PM-100, Cleveland, OH, USA) on the back of the platform, a spring in the
middle to offset the subject’s weight, and a hinge in the front to allow for primarily
vertical movement of the seat. Using this configuration, the maximum vertical excursion
of the seat observed during testing was approximately +/- 1.27cm during vibration. The
70

Vibration Effects on Spinal Biomechanics
shaker was driven by a Quanser Q8-I/O card (Quanser Consulting Inc., Markham,
Ontario, Canada) connected to a SS530 Amplifier (MB Dynamics, Cleveland, OH, USA).
Simulink (The MathWorks, Novi, MI, USA) code was used to generate a signal and
control the shaker. The input signal to the shaker was white noise with a frequency range
of 2-20 Hz (transmissibility band of the torso (Griffin et al., 1982)) using low-pass and
high-pass filters and maintaining an root-mean squared (RMS) amplitude of acceleration
of 1.15 m/s2 (ISO 2631-1 (1997) exposure limit for 30 minutes of WBV) applied to the
seat pan at the base of the spine. An accelerometer (CXL04, Crossbow Inertial Systems,
San Jose, CA, USA) was attached to the seat platform of the chair in-line with the base of
the spine. Feedback control in the software used the accelerometer signal to maintain the
desired level of vibration in terms of RMS amplitude of acceleration.
Figure 3: Vibration apparatus set-up with chair on top.
71

Vibration Effects on Spinal Biomechanics
Immediately following the vibration, the vibration platform was locked in place
and three more 40 second trials of trunk perturbations were performed. Time between
trials was kept at less than ten seconds to minimize potential recovery from WBV.
During the experimental session with quiet sitting, each subject performed the
same protocol as described, but was not exposed to vibration during the 30 minutes
between the measurement sets of trunk perturbations. The same seated posture as well as
preload and perturbation settings were used for both test sessions, scheduled one week
apart in a counter-balanced design.
(4.4.2) Data Collection / Analysis
During all trunk perturbation trials, trunk position was sampled at 60 Hz using a
three degree of freedom rotational position sensor (X-sens Motion Technologies,
Netherlands) placed on the subject’s manubrium. Motor torque, position, and velocity
were sampled at 1000 Hz from a torque cell (Omega, Stamford, CT, USA) and motor
encoder. Electromyogram (EMG, Measurement Systems Inc, Ann Harbor , MI) data was
sampled at 1000 Hz from the right and left erector spinae (ES) and rectus abdominus
(RA) muscles using electrode placement reported by Marras and Mirka (1992). EMG
data were band-pass filtered from 20-450 Hz, band-stop filtered at 60 Hz, rectified, and
integrated with a 25 Hz low pass, zero phase shift, seventh-order Butterworth filter.
72

Vibration Effects on Spinal Biomechanics
Total trunk stiffness and muscle reflex delay and gain were quantified using
system identification methods (Moorhouse and Granata, 2005). By using pseudorandom
trunk perturbations and system identifications, results are based on an average of
numerous (greater than 50) trunk loading events. The reaction of the trunk to the applied
force, be it changes in position or muscle response, is accounted for within the transfer
function for stiffness or muscle reflex. Total trunk stiffness, which includes potential
contributions from all three subsystems contributing to the control of spinal stability, was
calculated from the transfer function of the torque applied by the motor and the trunk
angle displacement. Muscle reflex parameters of gain and delay were quantified from the
transfer function of the ES muscle activity and the trunk angle displacement.
Agonist/antagonist co-contraction of trunk flexor and extensor muscles was quantified
using recordings of the RA muscle activity averaged across the perturbation trials. The
average RMS value of muscle activity during each trunk perturbation trial signified the
baseline recruitment level. Values were compared from trials before WBV to those
measured after.
Initial analysis verified that there were no trends due to learning effects so that all
three trials from each subject before vibration were averaged, and all three trials after
vibration were averaged. Additionally, reflex and muscle activity parameters were
averaged across the left and right sides since the task was symmetric about the sagittal
plane. A two-way repeated measures ANOVA was used to investigate the effects of
intervention (WBV or quiet sitting), time (before after the intervention), and their
interaction on total trunk stiffness, muscle reflex gain and delay, and RA muscle activity.
73

Vibration Effects on Spinal Biomechanics
Post-hoc comparisons following a significant interaction were performed using Tukey’s
HSD. All statistical analysis were performed using Stastica (StatSoft, Inc., Tulsa, OK,
USA) with α=0.05 indicating statistical significance.
74

Vibration Effects on Spinal Biomechanics
(4.5) Results
Total trunk stiffness (Figure 4a) exhibited a main effect of intervention (P=0.025),
time (P=0.007), and an interaction between time and intervention (P=0.041). Post-hoc
analysis showed a 12.5% (SD 15.4%) decrease in trunk stiffness with WBV (P=0.003),
but no changes with quiet sitting (P=0.765). There was also a difference in pre-
intervention measures of trunk stiffness (P=0.009). RA muscle activity (Figure 4b)
exhibited no main effect of intervention (P=0.348), time (P=0.325) or their interaction
(P=0.484). Reflex gain (Figure 4c) exhibited no effect of intervention (P=0.118), an
8.7% (SD 22.0%) decrease with time (P=0.007), and no significant interaction between
intervention and time (P=0.262). Finally, ES reflex delay (Figure 4d) exhibited no main
effect of intervention (P=0.303), time (P=0.148), or their interaction (P=0.416).
Figure 4: Results of the dependant measures with respect to exposure to WBV and quiet
sitting for a) total trunk stiffness, b) RA activity, c) reflex gain, d) reflex delay. (** time as a main effect P<0.05, ++ post-hoc WBV P<0.05)
75
Vibration Effects on Spinal Biomechanics
(4.6) Discussion
The goal of this study was to measure the effects of seated WBV on the three
subsystems of the neuromusculoskeletal system that contribute to seated postural control
and spinal stability. Results demonstrated that seated WBV significantly reduced total
trunk stiffness, and that both interventions of seated WBV and quiet sitting reduced reflex
gain when exposed to trunk flexion perturbations. Neither seated WBV nor quiet sitting
affected trunk flexor activity or reflex delay. The decrease in total trunk stiffness and
reflex gain with seated WBV suggest that spinal stability control was impaired.
Trunk stiffness decreased with seated WBV. This total trunk stiffness
incorporates passive stiffness, active stiffness, and effective reflex stiffness. Because it
included contributions from all three subsystems, it is difficult to determine which
subsystem is responsible for the change in total trunk stiffness. However, other variables
also collected in this study can help to begin to isolate changes to the individual
subsystems. Results showed that ES reflex gain was decreased 8.7% due to 30 minutes
of maintaining a seated posture for both interventions. Though there was not a
significant interaction of time and intervention, post-hoc analysis showed that the 11.5%
decrease for WBV was significant (P=0.008) while the 5.61% in quiet sitting was not
(P=0.114), however these results are ambiguous. The decrease in reflex gain can reduce
the trunk stiffness because ES reflexes has been reported to account for up to 42% of
trunk stiffness (Moorhouse and Granata, 2007). However, the decrease in reflex gain was
significant as a result of maintain the seated posture while the decrease in total trunk
76

Vibration Effects on Spinal Biomechanics
stiffness was only significant for seated WBV and not the quiet sitting. Thus, it appears
that the decrease in reflex gain due to maintaining a seated posture was not sufficient by
itself to cause the decrease in total trunk stiffness due to seated WBV. The decrease in
total trunk stiffness would therefore have to be due in part by the decrease in reflex gain
and by changes in the active and or passive stiffness subsystems. Active stiffness is
controlled through co-contraction of the trunk flexor and extensor muscles, and was
monitored by the RA muscle activity. Results showed that seated WBV did not affect the
average RA muscle activity, which indicates that the active stiffness subsystem did not
change with WBV. This indicates that the decrease in total trunk stiffness may be due, in
part, by a decrease in passive stiffness. Although passive stiffness was not directly
measured in this study, it has been shown that vibration can lead to compression of the
intervertebral discs (Klingenstierna and Pope, 1987) and creep deformation of the
connective tissue due to cyclic loading (Solomonow et al., 2000). These changes can
result in a decrease in stiffness and increase in joint laxity (Panjabi, 1992b). This leads to
the conclusion that the decrease in total trunk stiffness due to seated WBV was possibly
due to the combination of reduced passive stiffness and reflex gain. This decrease in
trunk stiffness will impair spinal stability control.
Of the three neuromusculoskeletal subsystems that contribute to spinal stability,
active stiffness and reflexes have demonstrated the ability to compensate when one
subsystem is compromised. For example, external conditions of increases in the height a
load is held (Granata and Orishimo, 2001) or decreases in person-object interface
stability (Lee and Granata, 2006) increase the overall stability requirements for the spine.
77

Vibration Effects on Spinal Biomechanics
In both studies, the increased stability requirements were compensated for by increased
trunk flexor/extensor muscle co-contraction which increased active trunk stiffness (Lee
et al., 2006). Other factors that can impair spinal stability include prolonged trunk
flexion (Granata et al., 2005) and trunk muscle fatigue (Granata et al., 2004). Prolonged
flexion, which reduced passive trunk stiffness, resulted in increased muscle reflex gain as
compensation (Granata et al., 2005). Trunk muscle fatigue results in reduced force
generation capabilities (Vollestad, 1997) and increased reflex delays (Wilder et al.,
1996). These changes can impair stability (Franklin and Granata, 2007) and it has been
shown to result in compensation events including increased co-contraction recruitment
(Granata et al., 2001, Granata et al., 2004) as well as increased muscular reflex gain
(Herrmann et al., 2006).
Including the current study, four different reports have been made on the effects
of WBV on the neuromuscular control of the trunk (Li et al., 2008, Santos et al., 2008,
Wilder et al., 1996). Two studies have used 5 Hz sinusoidal vibration, targeting the
natural frequency of the trunk, and different neuromuscular methods to measure changes
in reflex responses. These studies reported significant effects of WBV on the delay of
reflexes. The third study used random vibration in a simulation of a mining vehicle.
Their vibration characteristics consisted of a 0.5-20 Hz frequency bandwidth with the
peak frequency centered around 2.7 Hz, below the natural frequency of the trunk. Unlike
the other studies, the environment included a suspension-type seat with arm rests and a
steering wheel. Their results showed no effects on balance performance or muscle reflex
gain or delay. A previous study performed in our lab, and the current study reported
78

Vibration Effects on Spinal Biomechanics
here, used a 2-20 Hz bandwidth with even distributed frequency content. It was
demonstrated that seated postural balance was impaired and further that shown that reflex
gain and trunk stiffness were decreased due to WBV exposure. Additionally, the current
study differs on how reflex dynamics were assessed. Two of the previous studies used
reflex onset time and found conflicting results. The other study used time to reflex peak,
while the current used the transfer function of numerous hits, both finding significant
changes due to WBV exposure.
The results of the current seated WBV study suggest that passive trunk stiffness
was decreased in addition to decreased reflex gain, both of which can impair spinal
stability control. This study also did not provide any evidence of the neuromuscular
systems compensating for a loss in spinal stability by either increased co-contraction
recruitment or increased reflex gain. One possibility that explains the lack of
compensation would be if the stability control systems did not perceive that there was
impairment in control due to errors in the sensory information. This is suggestive that
WBV exposure can disrupt the proprioceptive system creating errors in position, velocity,
and force control (Gauthier et al., 1981). WBV exposure resulted in changes in trunk
proprioceptive acuity increasing maximum torso flexion angle from 11.8° to 13.2° in
response to sudden loadings to a chest harness (Li et al., 2008). This result was coupled
with a 1.58-fold increase in the position sense error of the torso after WBV exposure.
Errors in the sensory information can possibly explain the impairment of compensation
mechanisms in response to impaired spinal stability control.
79

Vibration Effects on Spinal Biomechanics
Several limitations of this study warrant discussion. Trunk stiffness was only
measured in terms of the total trunk stiffness. The elements of passive stiffness, active
stiffness and effective reflex stiffness were not independently measured. Assessment of
active stiffness and effective reflex stiffness were inferred from measures of muscular
activity with EMGs. Future studies should consider directly measuring each component
in order to attribute changes to each subsystem. Secondly, there is a potential problem
with the measurement of trunk stiffness in that the values before WBV were greater than
that before quiet sitting. The same protocol was used for each lab visit and the
intervention presentation order was randomized and scheduled in a balance design in
order to control for this.
80

Vibration Effects on Spinal Biomechanics
(4.7) Conclusion
In conclusion, 30 minutes of seated WBV reduced the stiffness of the trunk and
decreased reflex gain without compensation from increased reflex gain or co-contraction
recruitment. A reduction of total trunk stiffness and reflexes following seated WBV can
impair spinal stability and increase the risk of a low back injury. By understanding the
effects of WBV on the subsystems of spinal stability control, interventions can be
developed to help prevent possible LBDs.
Acknowledgement
The authors would like to acknowledge Emily Miller for assistance with the data
collection and subject recruitment. The project described was supported, in part, by
Grant Number R01 AR046111 from the National Institute Of Arthritis and
Musculoskeletal And Skin Diseases. The content is solely the responsibility of the
authors and does not necessarily represent the official views of the National Institute Of
Arthritis and Musculoskeletal And Skin Diseases or the National Institute of Health.
81

Vibration Effects on Spinal Biomechanics
(4.8) References
CREMONA, E. (1972) Die Wirbelsaule dei den Schwerarbeiten der Eisen-und Stahlindustrie sowie des Bergbaus. Kommiss. Europ. Gem. Genaraldir. Soz. Angelegenheitern Dok. Nr 1911/72.
CRISCO, J. J. (1989) The biomechanicsl stability of the human lumbar spine: experimental and theoretical investigations, New Haven, CT, Yale University.
DONG, R., KRAJNAK, K. & WIRTH, O. (2006) Introduction:. Conference on Human Vibration. Morgantown, WV: DHHS/CDD/NIOSH, 2006: 1.
DUPRIS, C. W. (1966) Urber die Deansprunchung die Wirbelsaule unter dem Einfluss sinusformiger und stochastischer Schwingungen Int. Zeitschrift angewandte Phys. Arbeitsphys, 22, 258-78.
FATHALLAH, F. A., MARRAS, W. S. & PARNIANPOUR, M. (1998) An assessment of complex spinal loads during dynamic lifting tasks. Spine, 23, 706-16.
FRANKLIN, T. C. & GRANATA, K. P. (2007) Role of reflex gain and reflex delay in spinal stability--a dynamic simulation. J Biomech, 40, 1762-7.
GAUTHIER, G. M., ROLL, J. P., MARTIN, B. & HARLAY, F. (1981) Effects of whole-body vibrations on sensory motor system performance in man. Aviat Space Environ Med, 52, 473-9.
GRANATA, K. P. & ORISHIMO, K. F. (2001) Response of trunk muscle coactivation to changes in spinal stability. J Biomech, 34, 1117-23.
GRANATA, K. P., ORISHIMO, K. F. & SANFORD, A. H. (2001) Trunk muscle coactivation in preparation for sudden load. J Electromyogr Kinesiol, 11, 247-54.
GRANATA, K. P. & ROGERS, E. (2007) Torso flexion modulates stiffness and reflex response. J Electromyogr Kinesiol, 17, 384-92.
GRANATA, K. P., ROGERS, E. & MOORHOUSE, K. (2005) Effects of static flexion-relaxation on paraspinal reflex behavior. Clin Biomech (Bristol, Avon), 20, 16-24.
GRANATA, K. P., SLOTA, G. P. & WILSON, S. E. (2004) Influence of fatigue in neuromuscular control of spinal stability. Hum Factors, 46, 81-91.
GRIFFIN, M. J., WHITHAM, E. M. & PARSONS, K. C. (1982) Vibration and comfort. I. Translational seat vibration. Ergonomics, 25, 603-30.
GRIFFIN, N. J. (2006) Health Effects of Vibration – The Known and Unknown. Conference on Human Vibration. Morgan Town, WV: DHHS / CDC / NIOSH, 2006: 3-4.
GUO, H. R., TANAKA, S., CAMERON, L. L., SELIGMAN, P. J., BEHRENS, V. J., GER, J., WILD, D. K. & PUTZ-ANDERSON, V. (1995) Back pain among workers in the United States: national estimates and workers at high risk. Am J Ind Med, 28, 591-602.
82

Vibration Effects on Spinal Biomechanics
HERRMANN, C. M., MADIGAN, M. L., DAVIDSON, B. S. & GRANATA, K. P. (2006) Effect of lumbar extensor fatigue on paraspinal muscle reflexes. J Electromyogr Kinesiol, 16, 637-41.
INTERNATIONAL ORGANIZATION FOR STANDARDIZATION (1997) Mechanical Vibration and Shock - Evaluation of human exposure to whole-body vibration. ISO 2631. 1997. Geneva.
KELLER, T. S. & NATHAN, M. (1999) Height change caused by creep in intervertebral discs: a sagittal plane model. J Spinal Disord, 12, 313-24.
KELSEY, J. L., GITHENS, P. B., WHITE, A. A., 3RD, HOLFORD, T. R., WALTER, S. D., O'CONNOR, T., OSTFELD, A. M., WEIL, U., SOUTHWICK, W. O. & CALOGERO, J. A. (1984) An epidemiologic study of lifting and twisting on the job and risk for acute prolapsed lumbar intervertebral disc. J Orthop Res, 2, 61-6.
KEYSERLING, W. M. (2000) Workplace risk factors and occupational musculoskeletal disorders, Part 1: A review of biomechanical and psychophysical research on risk factors associated with low-back pain. AIHAJ, 61, 39-50.
KLINGENSTIERNA, U. & POPE, M. H. (1987) Body height changes from vibration. Spine, 12, 566-8.
LEE, K. S., CHAFFIN, D. B., HERRIN, G. D. & WAIKAR, A. M. (1991) Effect of handle height on lower-back loading in cart pushing and pulling. Appl Ergon, 22, 117-23.
LEE, P. J. & GRANATA, K. P. (2006) Interface stability influences torso muscle recruitment and spinal load during pushing tasks. Ergonomics, 49, 235-48.
LEE, P. J., ROGERS, E. L. & GRANATA, K. P. (2006) Active trunk stiffness increases with co-contraction. J Electromyogr Kinesiol, 16, 51-7.
LI, L., LAMIS, F. & WILSON, S. E. (2008) Whole-body vibration alters proprioception in the trunk. International Journal of Industrial Ergonomics, 38, 792-800.
MARRAS, W. S. & GRANATA, K. P. (1995) A biomechanical assessment and model of axial twisting in the thoracolumbar spine. Spine, 20, 1440-51.
MARRAS, W. S., LAVENDER, S. A., LEURGANS, S. E., RAJULU, S. L., ALLREAD, W. G., FATHALLAH, F. A. & FERGUSON, S. A. (1993) The role of dynamic three-dimensional trunk motion in occupationally-related low back disorders. The effects of workplace factors, trunk position, and trunk motion characteristics on risk of injury. Spine, 18, 617-28.
MARRAS, W. S. & MIRKA, G. A. (1992) A comprehensive evaluation of trunk response to asymmetric trunk motion. Spine, 17, 318-26.
MOORHOUSE, K. M. & GRANATA, K. P. (2005) Trunk stiffness and dynamics during active extension exertions. J Biomech, 38, 2000-7.
MOORHOUSE, K. M. & GRANATA, K. P. (2007) Role of reflex dynamics in spinal stability: intrinsic muscle stiffness alone is insufficient for stability. J Biomech, 40, 1058-65.
83

Vibration Effects on Spinal Biomechanics
84
NATIONAL RESEARCH COUNCIL (2001) Musculoskeletal disorders and the workplace : low back and upper extremities, Washington, D.C. :, National Academy Press.
PANJABI, M. M. (1992a) The stabilizing system of the spine. Part I. Function, dysfunction, adaptation, and enhancement. J Spinal Disord, 5, 383-9; discussion 397.
PANJABI, M. M. (1992b) The stabilizing system of the spine. Part II. Neutral zone and instability hypothesis. J Spinal Disord, 5, 390-6; discussion 397.
POPE, M. H. (1996) Occupational Risk Factors, St. Louis, MO.
ROLL, J. P., MARTIN, B., GAUTHIER, G. M. & MUSSA IVALDI, F. (1980) Effects of whole-body vibration on spinal reflexes in man. Aviat Space Environ Med, 51, 1227-33.
SANTOS, B. R., LARIVIÈRE, C., DELISLE, A., PLAMONDON, A., BOILEAU, P.-É. & IMBEAU, D. (2008) A laboratory study to quantify the biomechanical responses to whole-body vibration: The influence on balance, reflex response, muscular activity and fatigue. International Journal of Industrial Ergonomics, 38, 626-639.
SLOTA, G. P., GRANATA, K. P. & MADIGAN, M. L. (2008) Effects of seated whole-body vibration on postural control of the trunk during unstable seated balance. Clin Biomech (Bristol, Avon), 23, 381-6.
SOLOMONOW, M., HE ZHOU, B., BARATTA, R. V., LU, Y., ZHU, M. & HARRIS, M. (2000) Biexponential recovery model of lumbar viscoelastic laxity and reflexive muscular activity after prolonged cyclic loading. Clin Biomech (Bristol, Avon), 15, 167-75.
SULLIVAN, A. & MCGILL, S. M. (1990) Changes in spine length during and after seated whole-body vibration. Spine, 15, 1257-60.
VOLLESTAD, N. K. (1997) Measurement of human muscle fatigue. J Neurosci Methods, 74, 219-27.
WATERS, T., RAUCHE, C., GENAIDY, A. & RASHED, T. (2007) A new framework for evaluating potential risk of back disorders due to whole body vibration and repeated mechanical shock. Ergonomics, 50, 379-95.
WILDER, D. G., ALEKSIEV, A. R., MAGNUSSON, M. L., POPE, M. H., SPRATT, K. F. & GOEL, V. K. (1996) Muscular response to sudden load. A tool to evaluate fatigue and rehabilitation. Spine, 21, 2628-39.

Vibration Effects on Trunk Natural Frequency
Chapter 5
Changes in the Natural Frequency of the Trunk During Seated Whole-Body Vibration
Gregory P Slota, MS
Virginia Polytechnic Institute & State University School of Biomedical Engineering & Sciences
The Kevin P. Granata Musculoskeletal Biomechanics Laboratory
85

Vibration Effects on Trunk Natural Frequency
(5.2) Abstract
Background: In the interest of low back pain prevention, research has been testing the
effects of whole-body vibration exposure. Studies investigating changes in
the frequency response functions of apparent mass and transmissibility of the
trunk during vibration strive to further understand the mechanisms responsible
for the increased risk of low back pain. The purpose of this study was to
measure the changes in the natural frequency characteristics of the trunk
(which can be related to trunk stiffness and damping) over time with exposure
to seated whole-body vibration.
Methods: 41 healthy subjects were tested during 30 minutes of seated whole-body
vibration (bandwidth = 2 – 20 Hz, root-mean-squared amplitude =1.15 m/s2).
The force applied to the seat and the accelerations of the seat and trunk were
recorded at 5 minute intervals. These data were used to determine the natural
frequency characteristics of the trunk using the frequency response functions
of apparent mass and transmissibility.
Findings: For frequency response functions of both apparent mass and transmissibility,
the natural frequency decreased (P<0.01), and the peak magnitude of the
frequency response functions increased (P<0.01) with exposure to whole-
body vibration.
Interpretation: Changes in the natural frequency characteristics of the trunk are
indicative of changes in overall axial trunk stiffness and damping. The
decrease in natural frequency suggested a decrease in the axial trunk stiffness.
The increase in the peak magnitude of the frequency response function
suggested a decrease in overall trunk damping. These findings reveal changes
in the biomechanical properties of the trunk with exposure to seated whole
body vibration as a possible mechanism for an increase risk of low back
injury.
86

Vibration Effects on Trunk Natural Frequency
(5.3) Introduction
Whole-body vibration (WBV) is a risk factor for LBP (Bovenzi et al., 2006).
Approximately 6 million workers are exposed to seated WBV, including, but not limited
to, professional drivers (e.g. fork-lift, trunk, earth movers, bus, tractor) and helicopter
pilots (De Oliveira and Nadal, 2005, Griffin, 2006). Although a link between WBV and
LBP is generally accepted , there is no consensus as to the mechanism of injury
(Mansfield and Maeda, 2005, Damkot et al., 1984, Frymoyer et al., 1983). In addition,
the methods of identifying individuals who are most susceptible to the effects of WBV
remain elusive (Mansfield, 2005). By investigating the frequencies of WBV delivered to
the spine and the resultant effects, further understanding can be achieved as to the
possible causes of discomfort and injury
There are two common approaches for studying the human biomechanical
response to seated WBV: apparent mass and transmissibility (Mansfield and Maeda,
2005). The apparent mass approach first involves converting into the frequency domain
the force applied to the individual relative to the acceleration at the driving-point where
the force is applied. Based on Newton’s second law, the quotient of these two quantities
results in the “apparent” mass of the individual (Mansfield, 2005). Calculating this
quotient for all frequencies will result in a frequency response function that illustrates the
apparent mass of the individual as a function of driving-point frequency. The
transmissibility approach first involves converting into the frequency domain the
acceleration measured at two locations (Hinz et al., 2001). Calculating the quotient of
87

Vibration Effects on Trunk Natural Frequency
these two accelerations for all frequencies will result in a frequency response function
that illustrates how well the acceleration is transmitted between the two measurement
sites as a function of driving-point frequency. The magnitude of the apparent mass and
transmissibility frequency response functions is non-linear with frequency, and can be
used to identify the dynamics of the system (such as the natural frequency defined as the
frequency at the peak magnitude of the frequency response function) (Mansfield and
Griffin, 2000).
Several studies have used these approaches to quantify the biomechanical
response of the human body to seated WBV. The human body’s natural frequency when
exposed to seated vertical WBV has been demonstrated to be in the region of 5 Hz and
with a second resonance mode in the region of 10 Hz (Fairley and Griffin, 1989,
Mansfield and Griffin, 2000). The natural frequency appears to decrease when the
magnitude of vibration is increased. Fairley and Griffin (1989) reported a decrease in
natural frequency from about 6 Hz to 4 Hz when the magnitude of the vibration was
increased from 0.25 to 2.0 m/s2 RMS. This has been interpreted as a ‘softening’ (i.e.
decrease in lumped vertical stiffness) of the body with increase in vibration magnitude
(Mansfield and Griffin, 2000). The peak magnitude of the frequency response function
has also been shown to increase as the magnitude of vibration increases (Mansfield and
Griffin, 2000, Mansfield and Lundstrom, 1999), but the authors of these studies made no
conclusions based upon these findings. Finally, the orientation of WBV also influences
the biomechanical response of the human body. Mansfield and Maeda (2007) reported
that the natural frequency and the peak magnitude of the apparent mass frequency
88

Vibration Effects on Trunk Natural Frequency
response function are dependent upon the direction that WBV is applied (Mansfield and
Lundstrom, 1999).
The goal of these previous studies was to quantify the biomechanical response of
the human body to seated WBV. As such, the duration of WBV exposure was only long
enough to obtain sufficient data for the analysis (typically < 1 minute). In the workplace,
individuals are exposed to WBV over extended periods of time (minutes to hours). It is
unclear how the biomechanical response of the human body to WBV changes over
extended exposure to WBV. Knowing this would advance our understanding of how
WBV affects the body, and potentially contribute to the improvement of safety guidelines
and work schedules. Therefore, the goal of this study was to investigate changes in the
biomechanical response of the human body to WBV. Both the apparent mass and
transmissibility approach were used to quantify changes in the natural frequency
characteristics of the body. Subjects were exposed to 30 minutes of seated WBV to
simulate the environment during driving. It was hypothesized that extended exposure to
WBV would decrease the trunk natural frequency and increase the peak magnitude of the
apparent mass and transmissibility frequency response functions. This would imply a
decrease in both total trunk stiffness and damping that may contribute to the reported
increase in risk for low-back injury associated with WBV.
89

Vibration Effects on Trunk Natural Frequency
(5.4) Methods
Testing was performed on 41 healthy adults (23 males and 18 females) with a
mean (standard deviation) age of 24 (SD 5.2) years, height of 171.2 (SD 10.5) cm, mass
of 71.5 (SD 12.6) kg, and no self-reported history of LBP. Twenty of the 41 subjects also
completed a control experiment during which WBV was replaced with quiet sitting. This
study was approved by the Virginia Polytechnic Institute & State University Institutional
Review Board, and all subjects provided informed consent prior to participation.
Subjects were exposed to WBV for 30 minutes while sitting in an upright posture
with their hands resting in their lap. Measurements of frequency response dynamics to
determine apparent mass and transmissibility were collected for 1 minute at 5 minute
intervals throughout exposure. The control testing on 20 subjects was performed at least
one week before or after the experimental session involving WBV. The order of
presentation of these experimental sessions was counter-balanced. The purpose of the
control testing was to determine the effect of 30 minutes of sitting itself (without WBV)
on apparent mass and transmissibility. It consisted of 1 minute of WBV before and after
30 minutes of quiet sitting. This amount of WBV was required to collect the data
necessary for our analysis.
90

Vibration Effects on Trunk Natural Frequency
(5.4.1) Experimental Protocol
The testing apparatus (Figure 1) consisted of a seat affixed to the top of a
vibration platform so that each subject could be exposed to WBV while sitting (Slota et
al., 2008). Attached to the seat were an adjustable foot rest and two seat belts used to
limit the motion of the lower limbs and the pelvis, respectively, with respect to the seat
during vibration. The vibration platform consisted of an electro-mechanical shaker (MB
Dynamics PM-100, Cleveland, OH, USA), a counter-balancing spring in the middle to
offset the subject weight, and a hinge in the front to allow vertical movement of the chair.
Using this configuration, the maximum vertical excursion of the seat was approximately
+/- 1.27cm during WBV. The shaker was driven by a Quanser Q8-I/O card (Quanser
Consulting Inc., Markham, Ontario, Canada) connected to a SS530 Amplifier (MB
Dynamics, Cleveland, OH, USA). Simulink (The MathWorks, Natick, MA, USA) code
was used to generate a white noise signal with a frequency range of 2-20 Hz, which is the
transmissibility frequency bandwidth of the torso (Griffin et al., 1982, Huang and Griffin,
2008), using low-pass and high-pass filters. The root-mean squared (RMS) amplitude of
acceleration was 1.15 m/s2, which is the ISO 2631-1 (1997) exposure amplitude limit for
30 minutes of WBV. A tri-axial piezoelectric accelerometer (CXL04, Crossbow Inertial
Systems, San Jose, CA, USA) was attached to the chair in-line with the base of the spine.
Feedback control in the software used the accelerometer signal as input to maintain the
desired level of seat vibration in terms of RMS amplitude of acceleration.
91

Vibration Effects on Trunk Natural Frequency
Figure 1: Photograph of testing apparatus. On top of the vibration platform was the seat. Under the vibration platform, from right to left was the electro-mechanical shaker with integrated load cell, spring to offset subject body weight, and hinge. The seat was
equipped with seatbelts and foot rest to control pelvic and lower limb movement.
Prior to testing, each subject was briefed on the testing protocol and assisted into
the seat. Adjustments were made to account for the subject’s height (foot rest) and
weight (counter-balancing spring), and the subject was secured with seatbelts. During the
30 minute WBV exposure, each subject was asked to sit upright with their hands resting
on their lap. The data necessary for the analyses (see below) was sampled for one minute
every five minutes. During this time, each subject was required to hold an instrumented
bite-bar in their mouth and hold their arms folded across their chest. After the data was
sampled, the bite-bar was removed and the subject could relax their arms with their hands
resting on their lap until the next recording.
92

Vibration Effects on Trunk Natural Frequency
(5.4.2) Data Collection / Analysis
During each one minute of data collection, force applied to the vibration platform
by the shaker was sampled at 1000 Hz from an in-line load cell (Interface Force,
Scottsdale, AZ, USA) positioned between the shaker and platform. Seat acceleration was
sampled at 1000 Hz using the tri-axial accelerometer attached to the seat in-line with the
base of the spine (Crossbow Inertial Systems, San Jose, CA, USA). Body acceleration at
the head was sampled at 1000 Hz using an accelerometer on a bite-bar held between the
teeth.
The calculation of the apparent mass frequency response function involved
determining the transfer function of input force to output acceleration (Mansfield, 2005).
Using the Fast Fourier Transformation (FFT), the force applied to the vibration platform
and acceleration measured at the seat were converted to the frequency domain. The
magnitude of the frequency response function of apparent mass at each frequency was
then determined by dividing the amplitude of the force and acceleration at each
frequency. The apparent mass frequency response function was then normalized by
dividing all magnitudes by the mass of the individual.
The calculation of the transmissibility frequency response function involved
determining the transfer function of applied acceleration to the acceleration measured
elsewhere on the body (Mansfield, 2005). Using the FFT, the acceleration measured at
the seat and the acceleration measured at the head were converted to the frequency
93

Vibration Effects on Trunk Natural Frequency
domain. The magnitude of the transmissibility frequency response function at each
frequency was then determined by dividing the amplitude of the head acceleration by the
seat acceleration at each frequency.
The magnitudes of the frequency response function indicate frequencies where
vibrations are attenuated (magnitudes less than one) as well as amplified (magnitudes
greater than one). Peak magnitudes, typically greater than one, signify characteristic
resonant frequencies of the system. From each of the frequency response functions, the
natural frequency (fn) was identified as the first resonance frequency (Figure 2), and the
peak magnitude (Pv) was calculated as the magnitude of the frequency response function
at that local maximum.
Figure 2: Example transmissibility frequency response function. Note the function’s peak magnitude at about 5 Hz signifying the natural frequency of transmissibility as well
as that the magnitudes of the peaks are greater than one signifying vibration amplification.
A one-way repeated measures ANOVA was used to determine the effect of time
on apparent mass natural frequency (AMfn), apparent mass peak magnitude (AMPv),
94

Vibration Effects on Trunk Natural Frequency
transmissibility natural frequency (TRfn), and transmissibility peak magnitude (TRPv). A
two-way repeated measures ANOVA was used to determine if the effects of WBV
differed from the effects of quiet sitting. This separate analysis was necessary because
not all of the subjects participated in the control testing, and because control testing only
involved collecting data at 0 min and 30 mins. Post hoc analysis was performed using
the Tukey’s HSD. All statistical analysis were performed using Stastica (StatSoft, Inc.,
Tulsa, OK, USA) with level for significance for all tests set to an α-level of 0.05.
95
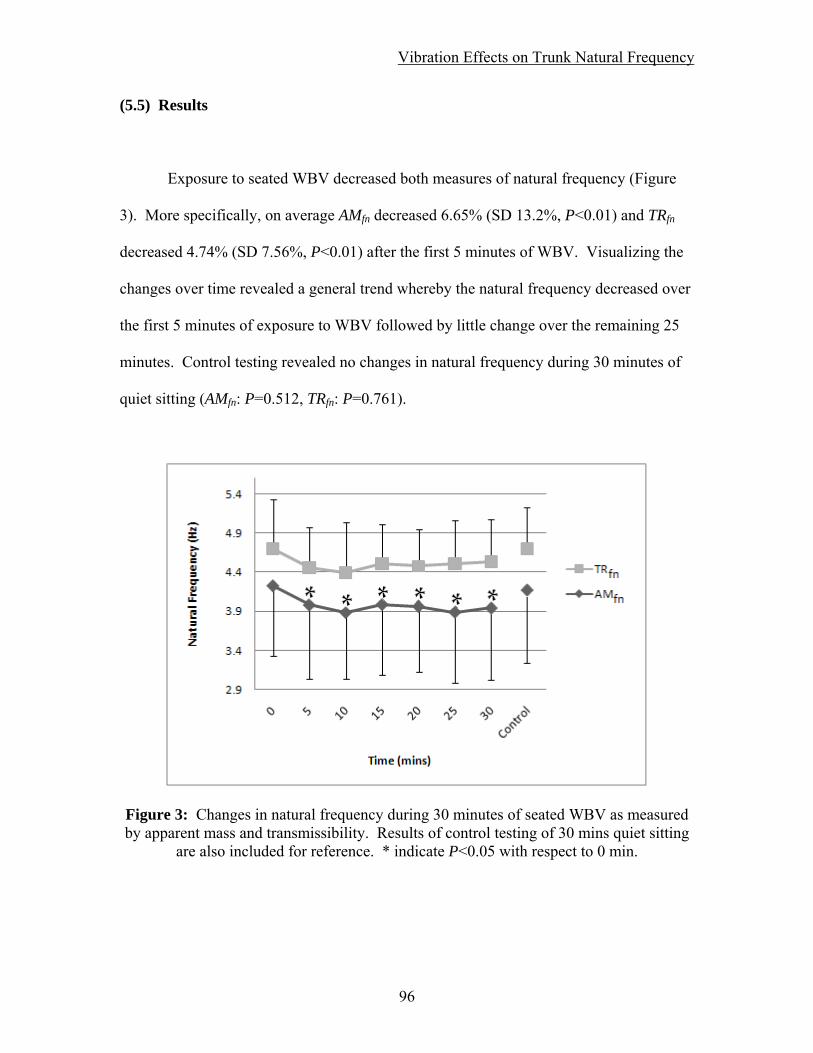
Vibration Effects on Trunk Natural Frequency
(5.5) Results
Exposure to seated WBV decreased both measures of natural frequency (Figure
3). More specifically, on average AMfn decreased 6.65% (SD 13.2%, P<0.01) and TRfn
decreased 4.74% (SD 7.56%, P<0.01) after the first 5 minutes of WBV. Visualizing the
changes over time revealed a general trend whereby the natural frequency decreased over
the first 5 minutes of exposure to WBV followed by little change over the remaining 25
minutes. Control testing revealed no changes in natural frequency during 30 minutes of
quiet sitting (AMfn: P=0.512, TRfn: P=0.761).
Figure 3: Changes in natural frequency during 30 minutes of seated WBV as measured by apparent mass and transmissibility. Results of control testing of 30 mins quiet sitting
are also included for reference. * indicate P<0.05 with respect to 0 min.
96

Vibration Effects on Trunk Natural Frequency
Exposure to seated WBV increased the peak magnitudes of the frequency
response functions (Figure 4). More specifically, on average AMPv increased 4.59 % (SD
17.4%, P<0.01) and TRPv increased 31.8% (SD 45.6%, P<0.01) after the first 5 minutes
of WBV. Visualizing the changes over time revealed a general trend whereby AMPv
increased over the first five minutes of exposure to WBV followed by little change over
the remaining 25 minutes. For TRPv, in addition to a general increases after the first 10
minutes, there were differences between measurements pairs of 5-20,5-25,5-30, and 10-
20 minutes suggesting a more prolonged rate of increase as compared to AMPv. Control
testing revealed no changes in peak magnitude of either the frequency response function
during quiet sitting (AMPv: P=0.999, TRPv: P=0.962).
Figure 4: Changes in the peak magnitudes of the frequency response functions during 30 minutes of seated WBV. Results of control testing of 30 mins quiet sitting are also
included for reference. (*,†,‡ indicate P<0.05 with respect to measures at 0, 5, 10 mins respectively)
97

Vibration Effects on Trunk Natural Frequency
(5.6) Discussion
The goal of this study was to measure changes in the frequency response
characteristics of the human body during 30 minutes of seated WBV. The results
demonstrated that maximal effects of exposure to seated WBV decreased the natural
frequency 6.61-7.96% and increased the peak magnitude of the frequency response
functions 5.90-42.0% while quiet sitting resulted in 3.84-5.03% and 2.08-6.01%
respectively. Moreover, the time course of these changes began as a decrease in natural
frequency over the first five minutes, with less change over the remaining 25 minutes.
The peak magnitude of the frequency response functions increased for 10-20 minutes
before leveling off.
The natural frequency of a simple mass-spring system is related to the system
stiffness, and can be calculated as the square-root of the ratio of stiffness to mass
(Equation 1a). Thus, an increase (or decrease) in natural frequency indicates an overall
increase (or decrease) in stiffness or a decrease (or increase) in mass. Since mass is
constant, the change in stiffness is equal to the change in natural frequency squared
(Equations 2). Thus the result of a 4.74% average decrease in TRfn implies a decrease of
9.26% in stiffness and a decrease of 6.68% in AMfn to a 12.9% decrease in stiffness. The
cause for the difference in stiffness assessment may be a function of pelvis and
abdominal soft tissues increasing the apparent mass measure while having limited impact
on transmissibility.
98

Vibration Effects on Trunk Natural Frequency
The parameter of trunk damping has been provided less attention than trunk
stiffness in the literature even though it can be of great importance. Damping resists the
velocity of movement, dissipates energy, and controls the magnitude of the frequency
response functions. As vibrations are transmitted through the body, the tissues exhibit a
damping effect which in effect, decreases the magnitude of vibration (Jovanovic, 2003).
In this study, the peak magnitudes of the frequency response functions were all greater
than unity, indicating that the vibrations at the natural frequency were being amplified.
Additionally, the peak magnitudes exhibited an increase of 5.1% as measured by AMPv
and 36.4% as measured by TRPv after 30 minutes of seated WBV. This indicates that the
system damping was decreased, dissipating less vibration energy and increasing motion,
and may result in greater strains on the spinal column (Wilder et al., 1988). This can be
due to various factors that can contribute to the results including changes in trunk
posture, passive tissue properties as well as the neuromuscular response. More studies
are required in understanding the changes in the damping properties of the trunk as the
importance of this property calls for more attention. Testing of the damping properties of
the various trunk systems (passive elements, muscles) along with modeling of the internal
loading changes due to reduction of damping can further elucidate the effects over time
of WBV exposure.
99

Vibration Effects on Trunk Natural Frequency
Trunk muscle fatigue and prolonged trunk flexion are two risk factors for LBP
that have also been shown to influence rotational trunk stiffness, which may be related to
the observed changes in axial trunk stiffness. Granata et al. (2004) used sudden loading
perturbations applied to the trunk along with a biomechanical model to quantify changes
in rotational trunk stiffness after a lumbar extensor fatiguing protocol. The model
simulated fatigue-induced reduction in active muscle stiffness and force generating
capacity (reduced reflex gain) resulting in diminished spinal stability. Empirical data
supported the model predictions with increased active stiffness due to increased agonist-
antagonist co-contraction. As a result total trunk stiffness did not change with fatigue. In
a different study, Granata et al. (2005) used pseudo-random force perturbations of the
trunk along with a system identification analytical approach to quantify changes in
rotational trunk stiffness after prolonged trunk flexion. Trunk flexion for 15 minutes
reduced the passive stiffness of the trunk. Additionally, prolonged flexion resulted in
increased reflex response (hyper-excitability). As a result, total rotational trunk stiffness
was maintained. With both of these risk factors for LBP, there appeared to be a
compensatory mechanism between the different neuromuscular systems that contribute to
total trunk stiffness. In the current study, axial trunk stiffness was found to be decreased,
suggesting that no compensation mechanism was evident. One potential reason as to why
there was no compensation may be due to a disruption of the sensory pathways of the
trunk. WBV has been shown to alter the proprioceptive acuity of the trunk (Li et al.,
2008).
100

Vibration Effects on Trunk Natural Frequency
Measuring changes in the frequency response dynamics during 30 minutes of
WBV reveals trends in these variables over time that had not been previously examined.
The characteristics provide valuable information on the anatomical structures and/or
mechanisms involved. Changes in natural frequency (or stiffness) happen within the first
five minutes of exposure while the peak magnitudes (or damping) change within the first
five to fifteen minutes. This can be the result of different tissues that are changing at
different rates or during different time periods. For instance, intervertebral discs have
been shown deform with WBV exposure (Klingenstierna and Pope, 1987) where two
thirds of the total height loss occurs in a initial time period of axial loading of the spine
(Keller and Nathan, 1999). Additionally, other tissues including ligaments and tendon-
muscle systems can possibly experience creep deformations at different rates. These
deformations are coupled with changes in neuromuscular control. Measuring changes in
the natural frequency characteristics during 30 minutes of seated WBV can also help us
to begin to understand possible exposure limits. During the second half of the vibration
period, there were nominal changes to the natural frequency characteristics suggesting
that no additional changes will occur with WBV exposure beyond 30 minutes. However,
it is not evident from this current study if any additional changes to the physiology of the
trunk will occur over larger time periods. Future research is needed to explore the effects
of WBV for time periods greater than 30 minutes, including the equivalent of an entire
work shift. Differences were seen between the measures of peak magnitude for apparent
mass and transmissibility. Apparent mass measures were lower overall than that of
transmissibility while also resulting in less of an increase over time of WBV exposure.
The main difference in factors that affect apparent mass more than transmissibility are the
101
Vibration Effects on Trunk Natural Frequency
pelvic and abdominal soft tissues. The difference in results would suggest that these
tissues may act as a buffer to the measurement of vibration. These elements may
dissipate the energy of vibration applied to the whole body. Transmissibility along the
more rigid structure of the spine would not be as susceptible to these effects.
Several limitations of this study warrant discussion. The apparent mass frequency
response function measures the dynamic properties and relative movement of bodies of
mass. This measure can be influenced by not only the properties and movement of the
trunk mass, but also the properties and movement of the head and limbs masses
(Mansfield and Griffin, 2002, Mansfield et al., 2006). By restricting the relative
movement of the arms with respect to the trunk and the legs with respect to the seat
(Fairley and Griffin, 1989) , the measures of apparent mass can be concluded to be
caused along a transmission path common to the spine and abdomen (Mansfield and
Griffin, 2000). Similarly, the transmissibility frequency response function measured by
the bite-bar is influenced by motions along the lumbar spine (area of interest) as well as
the neck, head and buttocks. Additionally, rotational movement of the head and trunk in
the sagittal plane influences the measures made in the vertical direction. Though these
effects could not be controlled directly, they could be accounted for by comparing the
trends in transmissibility with that of apparent mass. Matching trends in the frequency
response functions would be conclusive of having come from similar main effects on the
trunk (Mansfield and Griffin, 2000). Finally, although there were statistically
significance for the decreased natural frequency and increased peak magnitudes which
relate to trunk stiffness and damping, it is not clear if the effect size is clinically relevant.
102

Vibration Effects on Trunk Natural Frequency
However, these results are for decreased total effective trunk stiffness and damping
which suggests there was no compensation (example co-contraction recruitment) and
implies that the control of spinal stability was affected.
103

Vibration Effects on Trunk Natural Frequency
(5.7) Conclusion
In conclusion, 30 minutes of seated WBV decreased the natural frequency of the
trunk and increased the peak magnitudes of the frequency response functions. These
results suggest decreased trunk stiffness and damping and changes in pelvic soft tissue
properties. The trends suggest that WBV effects are greatest during the first 5-15
minutes of exposure. The overall effect of decreased stiffness and damping would result
in increased tissue strain with the potential of leading to LBP. Further studies are still
required to assess the physiologic harm due to extended WBV exposure.
Acknowledgement
The project described was supported, in part, by Grant Number R01 AR046111
from the National Institute Of Arthritis and Musculoskeletal And Skin Diseases. The
content is solely the responsibility of the authors and does not necessarily represent the
official views of the National Institute Of Arthritis and Musculoskeletal And Skin
Diseases or the National Institute of Health.
104

Vibration Effects on Trunk Natural Frequency
(5.8) References
BOVENZI, M., RUI, F., NEGRO, C., D'AGOSTIN, F., ANGOTZI, G., BIANCHI, S., BRAMANTI, L., FESTA, G., GATTI, S., PINTO, I., RONDINA, L. & STACCHINI, N. (2006) An epidemiological study of low back pain in professional drivers. Journal of Sound and Vibration, 298, 514-539.
DAMKOT, D. K., POPE, M. H., LORD, J. & FRYMOYER, J. W. (1984) The relationship between work history, work environment and low-back pain in men. Spine, 9, 395-9.
DE OLIVEIRA, C. G. & NADAL, J. (2005) Transmissibility of helicopter vibration in the spines of pilots in flight. Aviat Space Environ Med, 76, 576-80.
FAIRLEY, T. E. & GRIFFIN, M. J. (1989) The apparent mass of the seated human body: vertical vibration. J Biomech, 22, 81-94.
FRYMOYER, J. W., POPE, M. H., CLEMENTS, J. H., WILDER, D. G., MACPHERSON, B. & ASHIKAGA, T. (1983) Risk factors in low-back pain. An epidemiological survey. J Bone Joint Surg Am, 65, 213-8.
GRANATA, K. P., ROGERS, E. & MOORHOUSE, K. (2005) Effects of static flexion-relaxation on paraspinal reflex behavior. Clin Biomech (Bristol, Avon), 20, 16-24.
GRANATA, K. P., SLOTA, G. P. & WILSON, S. E. (2004) Influence of fatigue in neuromuscular control of spinal stability. Hum Factors, 46, 81-91.
GRIFFIN, M. J., WHITHAM, E. M. & PARSONS, K. C. (1982) Vibration and comfort. I. Translational seat vibration. Ergonomics, 25, 603-30.
GRIFFIN, N. J. (2006) Health Effects of Vibration – The Known and Unknown. Conference on Human Vibration. Morgan Town, WV: DHHS / CDC / NIOSH, 2006: 3-4.
HINZ, B., MENZEL, G., BLUTHNER, R. & SEIDEL, H. (2001) Transfer functions as a basis for the verification of models--variability and restraints. Clin Biomech (Bristol, Avon), 16 Suppl 1, S93-S100.
HUANG, Y. & GRIFFIN, M. J. (2008) Nonlinear dual-axis biodynamic response of the semi-supine human body during vertical whole-body vibration. Journal of Sound and Vibration, 312, 296-315.
INTERNATIONAL ORGANIZATION FOR STANDARDIZATION (1997) Mechanical Vibration and Shock - Evaluation of human exposure to whole-body vibration. ISO 2631. 1997. Geneva.
JOVANOVIC, M. L., JOVANOVIC, J.D. (2003) Frequency Response of Crane Operator's Spinal Column to Random Vibrations. Facta Universitatis: Mechanical Engineering, 1, 1299-1310.
KELLER, T. S. & NATHAN, M. (1999) Height change caused by creep in intervertebral discs: a sagittal plane model. J Spinal Disord, 12, 313-24.
105

Vibration Effects on Trunk Natural Frequency
106
KLINGENSTIERNA, U. & POPE, M. H. (1987) Body height changes from vibration. Spine, 12, 566-8.
LI, L., LAMIS, F. & WILSON, S. E. (2008) Whole-body vibration alters proprioception in the trunk. International Journal of Industrial Ergonomics, 38, 792-800.
MANSFIELD, N. J. (2005) Impedance methods (apparent mass, driving point mechanical impedance and absorbed power) for assessment of the biomechanical response of the seated person to whole-body vibration. Ind Health, 43, 378-89.
MANSFIELD, N. J. & GRIFFIN, M. J. (2000) Non-linearities in apparent mass and transmissibility during exposure to whole-body vertical vibration. J Biomech, 33, 933-41.
MANSFIELD, N. J. & GRIFFIN, M. J. (2002) EFFECTS OF POSTURE AND VIBRATION MAGNITUDE ON APPARENT MASS AND PELVIS ROTATION DURING EXPOSURE TO WHOLE-BODY VERTICAL VIBRATION. Journal of Sound and Vibration, 253, 93-107.
MANSFIELD, N. J., HOLMLUND, P., LUNDSTROM, R., LENZUNI, P. & NATALETTI, P. (2006) Effect of vibration magnitude, vibration spectrum and muscle tension on apparent mass and cross axis transfer functions during whole-body vibration exposure. J Biomech, 39, 3062-70.
MANSFIELD, N. J. & LUNDSTROM, R. (1999) The apparent mass of the human body exposed to non-orthogonal horizontal vibration. J Biomech, 32, 1269-78.
MANSFIELD, N. J. & MAEDA, S. (2005) Comparison of the apparent mass of the seated human measured using random and sinusoidal vibration. Ind Health, 43, 233-40.
MANSFIELD, N. J. & MAEDA, S. (2007) The apparent mass of the seated human exposed to single-axis and multi-axis whole-body vibration. J Biomech, 40, 2543-51.
SLOTA, G. P., GRANATA, K. P. & MADIGAN, M. L. (2008) Effects of seated whole-body vibration on postural control of the trunk during unstable seated balance. Clin Biomech (Bristol, Avon), 23, 381-6.
WILDER, D. G., POPE, M. H. & FRYMOYER, J. W. (1988) The biomechanics of lumbar disc herniation and the effect of overload and instability. J Spinal Disord, 1, 16-32.

Chapter 6 :
Closing Statements

Closing Statements
Closing Statements
The goal of the three studies was to investigate the effects of seated WBV on
spinal stability control in order to understand the risk for developing LBP. These studies
were designed to investigate a series of questions:
Does WBV exposure change spinal stability control?
How is spinal stability control affected after WBV exposure?
What changes in the human body during WBV exposure?
With the results of the first study, it was shown that spinal stability control
decreased with vibration exposure. With the second study, it was shown that after WBV,
trunk stiffness decreased and the magnitude of muscle reflexes was reduced. In the
second study, there was no additional recruitment of muscle co-contraction to
compensate for the impaired spinal stability control. In the third study, it was shown that
axial trunk stiffness and damping decreased over time of WBV exposure with a pattern of
a rapid initial decrease, followed by diminishing effects.
The possible options for physiological explanations for loss in trunk stiffness
include: muscle fatigue, passive tissue creep or damage, and sensory changes. Passive
tissues are the basis for trunk stiffness and the damage that accumulates could impair
spinal stability control. Passive tissue damage could contribute to decreases in spinal
stability control (Study 1), decrease in trunk stiffness (Study 2), shifts in natural
frequency characteristics (Study 3). In addition to passive tissue changes, and perhaps
107

Closing Statements
due to it, are changes to sensory information. If the sensory information relaying the
position of the trunk, velocities of moments, as well as the tension of the muscle are
impaired or misinterpreted, then the feedback control of spinal stability will be impaired.
This would explain the changes in muscle reflex gain (Study 2), impairment of active
muscle recruitment (Study 2), and leading to impairment of spinal stability control (Study
1). Active muscle involvement may also be a part of the shifts in natural frequency
characteristics (Study 3). Muscle fatigue was not assessed in the studies, but could
possibly be a factor that decreased stability control (Study 1), caused the decreased in
effective trunk stiffness (Study 2), and contributed to the changes in the natural frequency
characteristics (Study3).
These 3 studies suggested spinal stability control as a mechanism that links WBV
exposure and the risk for LBP. The results from these studies can be helpful in the
understanding of how WBV could lead to LBDs and aid in the development of guidelines
for WBV exposure duration. These studies have shown impairment in spinal stability
control (via mechanical and sensory information) with WBV exposure and give a
biomechanical possibility for the increased risk for LBP.
Future work in the field of WBV exposure following these studies should
progress where questions are unanswered or limitations were encountered.
Improvements on testing protocols need to be able to measure each component of trunk
stiffness (passive stiffness, active stiffness, effective stiffness due to reflexes) directly and
not just infer from other measures (i.e. EMG). Studies also need to address WBV
108

Closing Statements
109
exposure consisting different levels of the vibration characteristics including RMS
amplitude, frequency content, and duration. In order to understand the effects of WBV
on industry workers, different vibration characteristics need to be investigated to match
that of the machinery being used and to the work shifts. Different vibration
characteristics may result in various effects on the biomechanics of the trunk, involving
different degrees of the effect as well as the timing (rate of change, time period of
change, recovery period). Understanding how different elements are affected by WBV,
which frequencies are involved, and the post vibration after effects will aid in the design
of proper guidelines and protective measures to prevent lasting complications such as the
development of LBP.
The studies presented suggested decreases in spinal stability control subsystems
without evidence of compensation mechanisms. The summary effect suggests that WBV
exposure impaired spinal stability control which can possibly increase the risk for low
back injury. Recommendations would include the basic understanding that WBV
exposure should be controlled through limited the duration of expose, attenuation of
vibration magnitudes especially near 5 and 10 Hz, as well as accounting for recovery
time periods. Implications of impaired spinal stability control following WBV exposure
suggests that precautions should be imposed limited physically demanding tasks
following exposure.

Chapter 7 :
Appendix

Appendix
(7.1) Equilibrium & Stability
The definition of equilibrium is the state of a body or physical system that is at
rest or in constant and unchanging motion. A system is in stable equilibrium if small
disturbances to the system cause only temporary changes before it returns to its original
state.
(7.1.1) Ball & Bowl
The example that will be used to describe stability terms is a ball in a bowl. The
equilibrium state is for the ball to be at rest at the bottom of the bowl (Figure 1a).
Perturbations up the side of the bowl (Figure 1b) will displace the ball away from its
point of equilibrium. The result will be the movement of the ball back towards
equilibrium, returning to rest at the bottom again (Figure 1c).
Figure 1: Ball & Bowl: Stable system A) Equilibrium position, B) Perturbation displacement,
C) Resultant movement, toward equilibrium
110

Appendix
An example of an unstable system is an overturned bowl. The ball can rest at
equilibrium on top of the bowl (Figure 2a). Any perturbations will displace the ball away
from the equilibrium point (Figure 2b). The subsequent movement will consist of the
ball rolling further away from the equilibrium (Figure 2c).
Figure 2: Ball & Bowl: Unstable system A) Equilibrium position, B) Perturbation displacement,
C) Resultant movement, away from equilibrium
Stability also has its limits; the robustness of stability (Reeves et al., 2007). Any
perturbation that pushes the ball within the limits of the bowl will result in the ball
returning to the equilibrium point (Figure 3a). However, if the perturbation displaces the
ball to a point outside of the bowl’s limits, the result will be the ball rolling away from
the bowl (Figure 3b).
111

Appendix
Figure 3: Ball & Bowl: System stability robustness A) Displacements within the limits of the bowl, stable
B) Displacements outside the limits of the bowl, unstable
(7.1.2) Spine Model
The spinal column can be modeled as a single pendulum (Figure 4), similar to that
of the ball and bowl, with stable and unstable configurations. On its own, the inverted
pendulum is unstable and any perturbations will result in the pendulum falling over.
There is nothing to resist the potential energy of the mass on top from falling to the
ground (Figure 5a).
112

Appendix
Figure 4: Pendulum: Stable system (above) and unstable system (below) A) Equilibrium position, B) Perturbation displacement,
C) Resultant movement, toward/away equilibrium
The system of the spinal column consists of three components: the passive
musculoskeletal subsystem, the active musculoskeletal subsystem, and the neural and
feedback subsystem (Panjabi, 1992). Each of these subsystems contributes to the
mechanical stability of the spine and controls the motion of each segment. Excessive
motion at any point along the spine can cause tissue strain or tears leading to LBP and
LBDs.
The passive musculoskeletal subsystem consists of the structural elements of the
spine. The vertebrae are the building blocks of the spinal column supported in between
by the intervertebral discs. The facet joints, spinal ligaments, joint capsules, and the
passive properties of the muscles aid in the alignment and moments of the spine. All
together, these components contribute to the passive stiffness (Kp) of the spine (Figure
5b).
113

Appendix
E) D) B) C) A)
Figure 5: Model of spinal stability control A) Spine, B) Passive stiffness (torsion spring),
C) Active stiffness (external linear springs), D) Neuromuscular reflex (contractile elements), E) Complete System
The active musculoskeletal subsystem components are the muscles and tendons
that are associated with the trunk. This included muscles that are attached to the spine
directly (ex. erector spinae) along with muscle that connect from adjacent structures (ex.
rectus abdominus connecting the pelvis to the ribcage). Muscle contractions provide
additional stiffness to the spinal column. Contraction from the agonist muscles
(providing force in the desired direction) along with contraction from the antagonist
muscles (working against the agonist) is call co-contraction. The opposing force
generation works to stiffen the spinal column (Lee et al., 2006). This is considered the
active stiffness (Ka) of the spine as seen in the model above (Figure 5c).
The neural and feedback subsystem is comprised of three components. Sensory
organs perceive the position and velocity of the motion segments as well as the tension of
connective tissues and muscles. The control system processes the information. And the
final output is muscular control (contraction or relaxation). Some actions will elicit a
muscular reflex while others will inhibit a muscular contraction. Muscle reflexes are
114

Appendix
modeled as having a proportional response gain (G) with respect to their input as well as
a delay (τ) in response. Different reflexes are attributed to having different delay times.
Muscle reflexes are modeled above as external contractile elements (Figure 5d).
Passive stiffness, active stiffness, and muscle reflexes each support the spinal
column. Alone, each subsystem is insufficient at supporting the spinal column under
normal loading conditions. The passive stiffness of the spine has been measured at a
load-carrying capacity of 2-9 kg (Crisco, 1989) as compared to the loading of body mass
at 140-210 kg (Nachemson and Evans, 1968). The combination of the three subsystems
(Figure 5e) provides the spinal stability control needed to support the spinal column.
Reflexes have been measured to account for 42% of the total stabilizing trunk stiffness
(Moorhouse and Granata, 2007) noting that passive stiffness, without active stiffness, was
not sufficient at stabilizing the spine. Each subsystem is susceptible to deterioration from
use including: tissue creep, muscle fatigue, and sensory overload. Compensation from
one subsystem to another works to maintain the total system stability (Granata and
Orishimo, 2001). If muscle reflexes were to have increase delay and or decrease gain,
there must be an increase in co-contraction to maintain stability (Franklin and Granata,
2007). However, no pattern of muscle contraction will maintain spinal stability when
exposed to an external load of 200 N or greater; reflexes are required (Le et al., 2007).
115

Appendix
(7.1.3) Stability Control
The human spine is subjected to external disturbance forces resulting in
displacements. The system of spinal stability control functions to maintain equilibrium
within physiological limits. The system consists of the intrinsic properties: mass,
damping and stiffness. With the addition a of feedback control, muscle reflexes
contribute to the system stability (Figure 6).
Mass Damping Stiffness
Position, Velocity
Reflex
Force
Figure 6: Spinal stability control diagram
The control diagram of spinal stability control can be represented in equation
form (Figure 7). When the system is reduced into a single equation (Equation 1), there
can be seen the control of stability. Holding inertia (I) constant and with damping (B)
being a dissipative element, the final collection of terms holds the key to stability. In
order for the system to be stable (all poles in the left hand plane), the final set of terms
must be greater or equal to zero (Equation 2). An inverted pendulum alone is unstable
with the potential energy (V) of the mass resulting in the pendulum falling down. The
restorative elements of stiffness and muscle reflex counteract the potential for the
pendulum falling over (Equation 3). The contributions from each component (passive
116

Appendix
stiffness, active stiffness, and muscle reflex) work together to maintain stability. In the
event that one component’s normal contribution is diminished, the other components can
compensate for the loss.
1
Is2 + Bs + (Kp + Ka)
θ
θ
G, τ
F
Figure 7: Spinal stability control: Equation
1 / ( Is2 + Bs + [(Kp + Ka) + (Slota et al.) - V] ) (1)
[(Kp + Ka) + (Slota et al.) - V] ≥ 0 (2)
[(Kp + Ka) + (Slota et al.)] ≥ V (3)
117

Appendix
(7.1.4) Factors Affecting Stability
Spinal stability is composed of passive stiffness, active stiffness, and
neuromuscular reflexes. These subsystems are composed of ligaments, tendons, muscles,
intervertebral discs, and other surrounding soft tissues. Different factors affect these
tissues and can disrupt the subsystems of spinal stability. Muscle fatigue, caused by
sustained, maximal, or repeated exertions, weakens the muscles’ force production
capabilities. Trunk posture, when working at different degrees of flexion, lateral
bending, or twisting, increases the loading of the passive tissues. Prolonged work in
flexed postures, repetitive movements and tissue loading can then lead to tissue stretch
disrupting passive stiffness and sensory feedback. Task demands (lifting, pushing, and
pulling) can affect the spinal stability requirements. In studies to understand how
changes in spinal stability control can lead to LBP, researchers have also compared
measurements between LBP patients and healthy people.
(7.1.4.1) Muscle Fatigue
Trunk stability control is dependent on the muscles for support both passively and
actively. Muscle fatigue affects the power output of motor groups. The neuromuscular
system is able to adjust to changes in the system. Muscles provide active trunk stiffness
through co-contractions and assist stability with feedback reflexes. Following muscle
fatiguing exertions, it has been shown that subjects have an increased state of co-
118

Appendix
contraction (Granata et al., 2001). This has been reported as a means for compensation
for fatigue to maintain stability when exposed to sudden loading (Granata et al., 2004b).
While in a fatigued state, muscle reflexes have been measured to have increased reflex
amplitudes (Herrmann et al., 2006). Further, differences have been seen between
genders, with increased electromechanical delay in females and decreased EMG and
force amplitude in males (Moore et al., 2002).
(7.1.4.2) Trunk Posture
Work performed in a flexed posture is a known risk factor for LBP (Marras et al.,
1993). Flexed postures have been shown to increase the reliance on passive tissue
support of the trunk extension moment as flexion increases. This results in greater trunk
stiffness with flexion angle as well as a decrease in the reflex gain (Granata and Rogers,
2007). With the increase in passive tissue stiffness, the need for muscle reflex is reduced
in order to maintain stability. However, a study has also shown that there is an increase
in reposition error with flexed postures (Wilson and Granata, 2003) suggesting that the
sensory information of the trunk is disturbed and may suggest an inhibition of muscle
reflex response.
119

Appendix
(7.1.4.3) Tissue Stretch
Working in a sustained flexed posture or the repetitive movement to the limits of
the trunk range of motion results in immediate and residual laxity of the joint (Little and
Khalsa, 2005). Joint laxity of the trunk is the result of a decrease in the passive stiffness
without compensation or with reduction of active stiffness (Courville et al., 2005).
Studies of trunk flexion and tissue creep have reported two effects on the neuromuscular
reflex system. In studies of direct spinal stretch loading (Solomonow et al., 2000) as well
as with whole-body trunk flexion (Rogers and Granata, 2006), tissue creep and joint
laxity suppress reflexive muscular activity and decrease the reflex gain. Tissue creep
reduces the sensory information along the spine. This change in reflex behavior of the
muscles has been shown to recover with a delayed state of hyperexcitability (Hoops et al.,
2007). This increased reflex gain after tissue stretching (Granata et al., 2005b) has been
reported as the recovery of fast adapting receptors in tendons and ligaments with rest
(Courville et al., 2005). The ligamento-muscular reflex provides the lumbar spine with a
mechanism in which increased musculature activity compensates for the laxity
developing in the lumbar viscoelastic tissue (Le et al., 2007).
(7.1.4.4) Task Demands
The control system for trunk stability utilizes and adapts the three subsystems to
the demands of the tasks to be performed in order to maintain spinal stability. Voluntary
120

Appendix
increase in trunk muscle co-contraction will increase trunk stiffness (Lee et al., 2006).
With the expectation of a sudden load, there is a reported trend of preparatory EMG
increase (Granata et al., 2001). This would suggest that the trend was for an increased
trunk stiffness to handle the loading and stabilize the spine. Co-contraction has also been
recorded to increase as a task demands more stability control. As a barbell was
maintained at a constant moment arm (no change in equilibrium demand) and raised to
higher levels (increase in potential energy and therefore and increase in stability demand)
there were increasing levels of co-contraction of the trunk muscles (Granata and
Orishimo, 2001). In the case of a study of different handles used in pushing tasks, there
was an increase in co-contraction from the stable handle (1-DoF) to the unstable handle
(2-DoF) (Lee and Granata, 2006). Comparing pushing and pulling tasks, the flexion
exertion associated with the pushing task resulted in increased co-contractions from that
of extension exertions, with additional increases with exertion level (Lee et al., 2007).
Flexion exertions had average co-contraction approximately twice the value of extension
tasks with co-contraction; accounted for up to 47% of total spinal load (Granata et al.,
2005a).
Trunk muscles and their adaptation to different tasks has been an area of active
research. Pre-loading the trunk muscles with an external flexion force was associated
with a significant increase in preparatory EMG activity (Granata et al., 2001). With the
increase in muscle extension exertion, the results were of increased system damping and
effective stiffness (Moorhouse and Granata, 2005). Muscle reflex amplitude has been
reported to decrease with preload activity and to increase with perturbation force
121
Appendix
(Granata et al., 2004a). Muscle reflexes are important to the stability of the spine and
account for 42% of the total stabilizing trunk stiffness (Moorhouse and Granata, 2007).
(7.1.4.5) People with LBP
Studies of spinal stability are concerned with preventing LBP. Of interest are
studies that investigate the differences between people who have a history of low back
pain and those that are healthy. Studies by Radebold (Radebold et al., 2000, Radebold et
al., 2001) have reported that LBP patients demonstrate poorer postural control of the
lumbar spine. They exhibit patterns of higher levels of co-contraction and had longer
muscle reaction times. The consensus is for people with LBP to adopt a stiff spine
strategy, possibly in adaptation to compromised quality of trunk control (Mok et al.,
2007). However, there are no studies that confirm if the effects are preexisting for LBP
patients or if it is due to the pain.
122
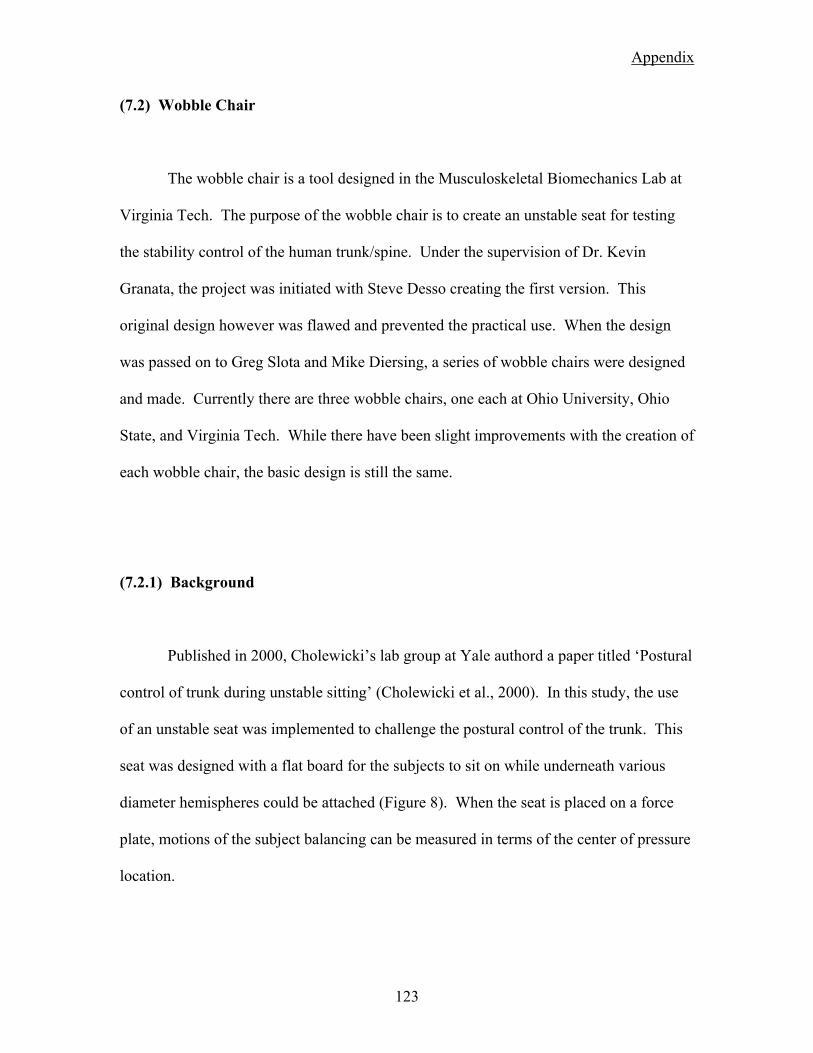
Appendix
(7.2) Wobble Chair
The wobble chair is a tool designed in the Musculoskeletal Biomechanics Lab at
Virginia Tech. The purpose of the wobble chair is to create an unstable seat for testing
the stability control of the human trunk/spine. Under the supervision of Dr. Kevin
Granata, the project was initiated with Steve Desso creating the first version. This
original design however was flawed and prevented the practical use. When the design
was passed on to Greg Slota and Mike Diersing, a series of wobble chairs were designed
and made. Currently there are three wobble chairs, one each at Ohio University, Ohio
State, and Virginia Tech. While there have been slight improvements with the creation of
each wobble chair, the basic design is still the same.
(7.2.1) Background
Published in 2000, Cholewicki’s lab group at Yale authord a paper titled ‘Postural
control of trunk during unstable sitting’ (Cholewicki et al., 2000). In this study, the use
of an unstable seat was implemented to challenge the postural control of the trunk. This
seat was designed with a flat board for the subjects to sit on while underneath various
diameter hemispheres could be attached (Figure 8). When the seat is placed on a force
plate, motions of the subject balancing can be measured in terms of the center of pressure
location.
123
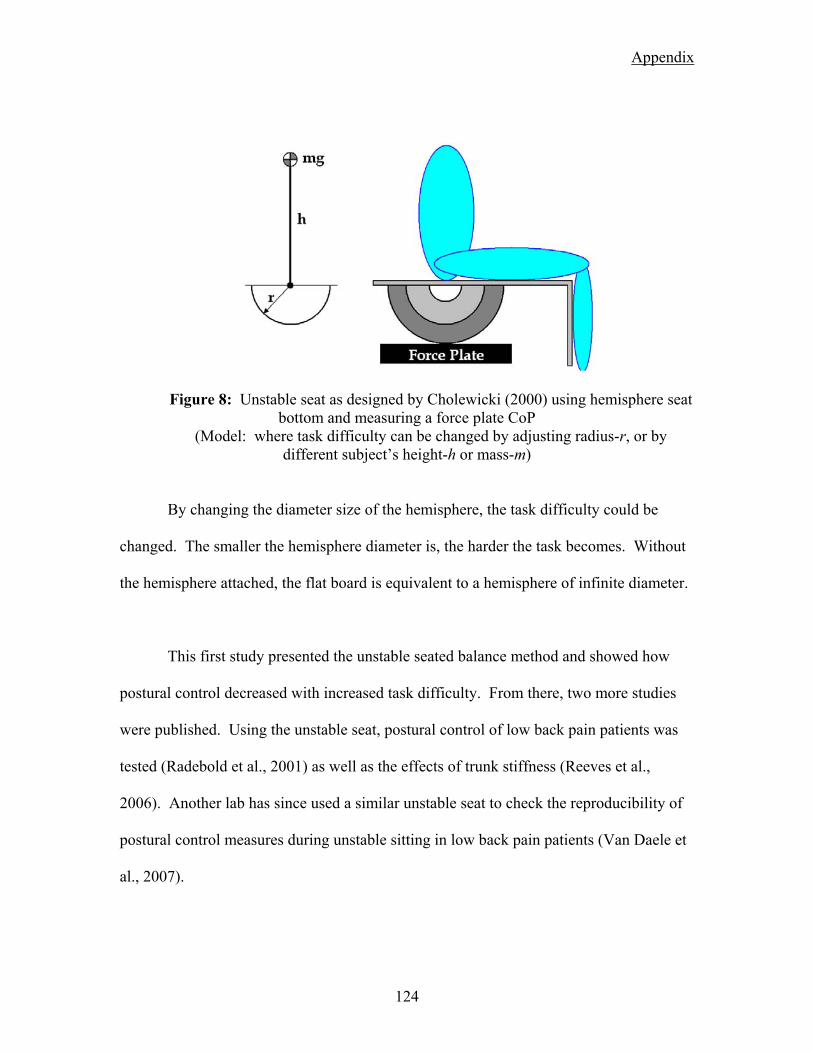
Appendix
Figure 8: Unstable seat as designed by Cholewicki (2000) using hemisphere seat bottom and measuring a force plate CoP
(Model: where task difficulty can be changed by adjusting radius-r, or by different subject’s height-h or mass-m)
By changing the diameter size of the hemisphere, the task difficulty could be
changed. The smaller the hemisphere diameter is, the harder the task becomes. Without
the hemisphere attached, the flat board is equivalent to a hemisphere of infinite diameter.
This first study presented the unstable seated balance method and showed how
postural control decreased with increased task difficulty. From there, two more studies
were published. Using the unstable seat, postural control of low back pain patients was
tested (Radebold et al., 2001) as well as the effects of trunk stiffness (Reeves et al.,
2006). Another lab has since used a similar unstable seat to check the reproducibility of
postural control measures during unstable sitting in low back pain patients (Van Daele et
al., 2007).
124
Appendix
(7.2.2) New Approach
In the study by Cholewicki where the unstable seat was presented, there was
reported a high correlation of subject anthropometrics and ability to balance. With the
hemisphere approach, four diameters were used: Infinite (flat), 50 cm, 44 cm, 22cm. It
was reported that balance ability was correlated to the subject’s mass and height. In the
cases of subjects that were unable to balance on the smaller hemispheres, there were the
tallest or heaviest people. To account for the differences in subjects, a new approach to
the unstable seat was designed. The wobble chair was created with the idea of having
unlimited adjustability (within bounds). The basis behind the new approach was to use a
small pivot point that would create an unstable seat that is impossible to balance on. In
comparison to the unstable seat of Cholewicki, this would be the equivalent to a
hemisphere of about 2 cm. To adjust the stability of the seat, a series of springs are
positioned under the seat. By varying the spring position, the unstable seat can be
controlled in a manner similar to that of changing the diameter of the hemisphere.
(7.2.3) Design
The basis of the wobble chair design is still based off of the original concept by
Cholewicki. The wobble chair is designed to balance on a single pivot point created by
using a ball-in-socket ball bearing of about 2 cm in diameter (Figure 9a). The wobble
chair is created in two parts, a seat and a base. The base has a central post with the ball-
125

Appendix
bearing pivot attached on top. The seat platform has attached to the bottom a plastic
piece with a small divot (Figure 9b) in the center which rests atop the pivot.
Figure 9: Pivot point for the wobble chair (left) and the seat contact point (right)
In this current state, balance of a seated subject is unlikely. To provide support
and allow for the adjustability of the wobble chair, four spring assemblies are positioned
between the seat platform and the base (Figure 10). Each spring assembly holds the
bottom end of the spring and is attached to the wobble chair base in one of four grooves
and bolted into place (Figure 11). The grooves run radially out from the central pivot
point in front, behind, left, and right. The spring assembly can be positioned anywhere
from 7 cm to 22 cm away from the central pivot. The closer the springs are to the center,
the harder the task of balancing on the seat becomes.
126

Appendix
Figure 10: Wobble chair base with central pivot point, radial grooves, and spring assemblies.
Figure 11: Spring Base with central pivot point. The spring position can be adjustable radially from the central ball-and-socket pivot point.
The seat platform is designed to sit atop the ball bearing and tilt in any direction
around it. The bottom of the seat platform, in addition to the plastic pivot interface, has
four metal channels (Figure 12). Each channel is aligned with a groove in the base where
127

Appendix
the springs are attached. The channels act as the interface point for the tops of the
springs. The springs are not attached to the seat platform and only work in compression.
As the seat tilts, the space between the seat platform and base decreases and compresses
the spring. The channels also functions to limit the rotation of the seat about the third
axis (Z).
Figure 12: Metal channel on top section of the wobble chair. The springs of the base make contact within the metal channel.
To assist in the measurement of postural control, the movements of the pelvis and
lower limbs are restricted. The seat is equipped with two seat belts to assist in holding
the pelvis still and allowing movement from the spine (Figure 13). An adjustable foot
rest is attached to the front of the seat platform to restrict lower limb movement with
respect to the pelvis and seat.
128

Appendix
Figure 13: Complete wobble chair. The seat is equipped with two seatbelts and an adjustable footrest (off picture).
The seat that is mounted on the top platform of the wobble chair is also
adjustable. The neutral position of the wobble chair is to have a subject sitting upright
with the seat platform level. To accommodate for differences in subjects’
anthropometrics (height, weight, mass distribution) the seat can be moved forward or
backwards. With the use of a level, the seat position is adjusted to achieve equilibrium in
the neutral position.
(7.2.4) Method of Use
Initially, measurements of the wobble chair were performed by using center of
pressure on a force plate located below the wobble chair. The premise is that as the
subject tilts the wobble chair in any direction, the force of the body will be distributed
between the center pivot point and any springs that are compressed. In this manner, the
movement of the wobble chair can be traced similar to that of standing postural sway.
129

Appendix
Currently, the measurements of the wobble chair have changed from forces and
moments on a force plate, to that of measuring the angle of tilt of the seat and trunk. X-
sens motion sensors are currently used in the Virginia Tech lab. Each sensor provides
rotational measurements in both planes of movement. Additionally, measures of linear
accelerometers in all three axes are collected. This information can be used in detection
of “bottoming out” when the physical limits of the wobble chair are reached.
(7.2.5) Calibration
It was noted in one of Cholewicki’s studies that people of greater body height and
great mass had more difficulty in balancing on the smaller hemispheres. With the current
design of the wobble chair, the springs can be positioned at a greater variable range then
that of pre-sized hemispheres. With the adjustability, two different scales can be used to
describe the spring positions. There is the distance from the center of the spring to the
center of pivot point. This measurement is made in centimeters. The other method to
position the springs is terms of the MGH of the subject (Equation 4, Figure 14). This
method scales the spring positioning based on the anthropometrics of the subject. To do
this, a calibration of the wobble chair is required.
( ) ( )22
1 sinsin θθ KLMGH = (4)
130
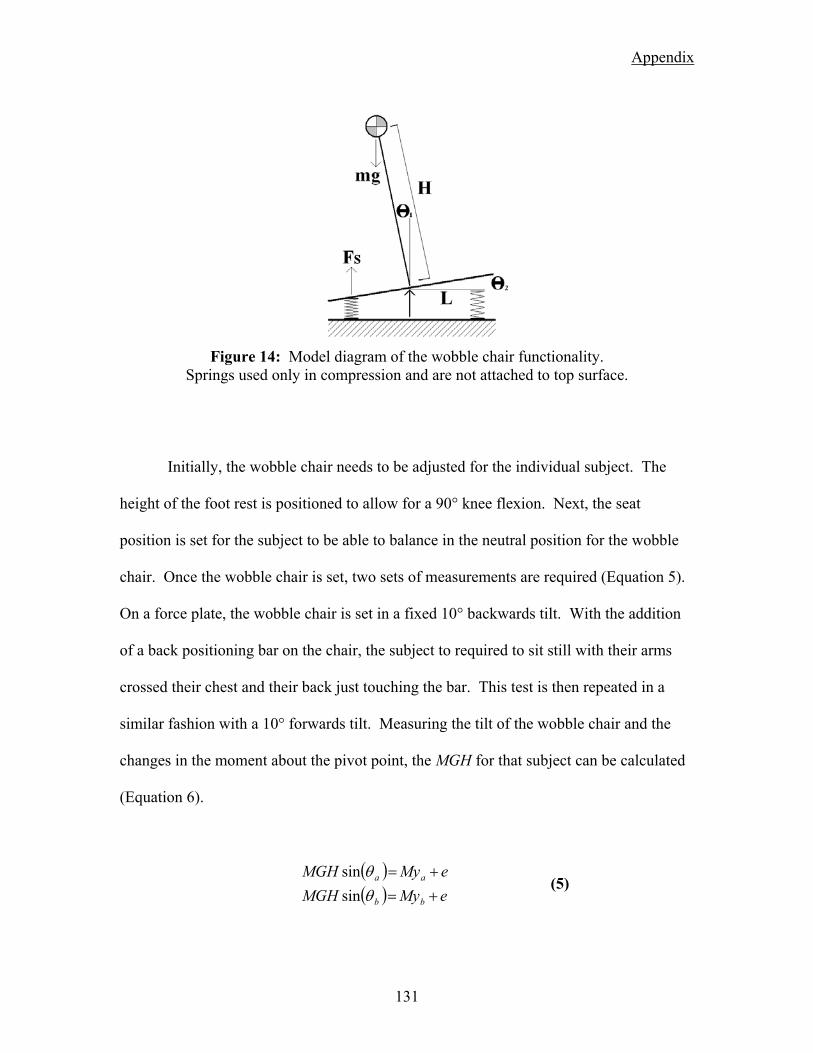
Appendix
Figure 14: Model diagram of the wobble chair functionality.
Springs used only in compression and are not attached to top surface.
Initially, the wobble chair needs to be adjusted for the individual subject. The
height of the foot rest is positioned to allow for a 90° knee flexion. Next, the seat
position is set for the subject to be able to balance in the neutral position for the wobble
chair. Once the wobble chair is set, two sets of measurements are required (Equation 5).
On a force plate, the wobble chair is set in a fixed 10° backwards tilt. With the addition
of a back positioning bar on the chair, the subject to required to sit still with their arms
crossed their chest and their back just touching the bar. This test is then repeated in a
similar fashion with a 10° forwards tilt. Measuring the tilt of the wobble chair and the
changes in the moment about the pivot point, the MGH for that subject can be calculated
(Equation 6).
( )( ) eMyMGH
eMyMGH
bb
aa
+=+=
θθ
sinsin
(5)
131

Appendix
( ) ( )( ) ( )ba
ba eMyeMyMGH
θθ sinsin −+−+
= (6)
Two strategies have been employed with this design and task difficulty control.
The basic method is this set difficulty based on %-MGH. This will account for
differences in subjects’ height and body mass (i.e. center of mass location and value).
Typical usage is to use a spring setting of 100%MGH and other settings below that.
Previous lab testing used 75%MGH and 50%MGH. It has also been noted in other research
as well as from collaborators at Ohio University, that for testing the differences between
low back pain patients and pain free people, that more challenging settings are required.
Based off of this is the need for higher task difficulty.
The other method, which is used in the first study with WBV, is to account for
and match a subject’s ability to balance. While a subject’s height and weight play a
factor in the difficulty to balance on the wobble chair, the subject’s ‘skill’ to balance can
be considered. This method requires a series of trials and spring adjustments to locate a
desired level of difficulty. Limits of stability can be test specific as well as the criteria for
adjusting the springs. One example is finding the threshold for balancing without
reaching the physical limits of the wobble chair.
(7.2.6) Data Processing
With either the measurement of force plate center of pressure, or with the tilt of
the seat platform (Figure 15), the data processing is similar and only the units are
132

Appendix
different. Measures of kinematic variance, similar to that of standing postural sway
(Prieto et al., 1996), can be used to quantify the control of seated balance. This includes
ellipse area, path length, and root mean squared (RMS) movement. The ellipse area
represents the 95% range of motion area during the balance trial where a larger area is
attributed with a decrease in balance control. The ellipse area is greatly affected by the
general ‘waling’ trend (low frequency signal content). The path length is simply the liner
length of movement regardless of direction traveled and is greatly effected by ‘trembling’
or noise (high frequency signal content). RMS movement is the average distance from
the point of equilibrium. The RMS value can be broken into components of
anterior/posterior, medial/lateral, and also the resultant radial directions (Figure 15,
circles).
Figure 15: Example plots of data from the wobble chair. Shown are plots for before and after WBV exposure. Parameters of ellipse area (EA), path length (PL) are labeled, as
well as circles representing RMS-RR.
133

Appendix
Non-linear stability control measures include Lyapunov exponent, stability
diffusion analysis (SDA), Hurst rescaled range analysis (HRRA). The Lyapunov
exponent looks at the rhythmic activity of the system in state space as a limit cycle. The
process quantifies the exponential separation of trajectories of nearest neighbors with
time (Harbourne and Stergiou, 2003). The analysis uses the 4 dimensional state
dynamics (two angles, two angular velocities) to calculate the nearest neighbors (Kang
and Dingwell, 2006). SDA allows for correlation between past and future displacements
and summarizes the mean square displacement as a function of the time interval between
comparisons (Collins and De Luca, 1993). The analysis allows for the system to be
broken down into two parts, short-term open-loop control and long-term closed-loop
control. The long-term stability diffusion analysis parameter is not representative of a
bounded system (Delignieres et al., 2003) and therefore cannot be used with the wobble
chair. The HRRA describes the fractal properties of fluctuations in measurements during
postural control (Duarte and Zatsiorsky, 2000). Similar to that of the kinematic measure
of RMS movement, SDA and HRRA can be analyzed for each direction (-A/P, -ML, -
RR).
134

Appendix
(7.3) Chapter 3 Supplemental
Wobble Chair Spring Settings – Location, Location, Location…
The purpose of the wobble chair is to provide a “stability-controlled” seating
condition. This means that the springs can be moved and positioned to desired setting,
thusly controlling the “stability” of the seat. As mentioned earlier, the position of the
springs can create a neutrally-stable seat when the subject can achieve equilibrium at any
angle of seat tilt. In this case the restorative force of the springs is equal to the moment
created by a tilted torso. The springs can also be moved further out from this position
(with respect to the pivot point) and create a “stable” seating condition where equilibrium
is held in the upright posture. Of typical interest is when the springs are moved closer to
the pivot point and an unstable seated condition is created. In this case, only with the
inclusion of muscle reflexes to trunk stiffness can balance be maintained.
For the purpose of testing, there are four methods that have been used for setting
the springs. A simple approach is to use an absolute spring position for all subjects; that
is to say that the springs are set at 11 cm away from the pivot point. This is similar to the
Cholewicki hemisphere approach in which all subjects were exposed to the exact same
seat condition.
The next evolution in control of the spring position is the basis of the current
wobble chair design. With infinite (yet bounded) spring position control, the springs can
135

Appendix
be fine-tuned to different scaling methods. The initial method account for the differences
in subject anthropometrics. By measuring a subject’s MGH, the springs can now be
positioned in terms of percent MGH instead of just length away from the pivot. With
100%MGH as the neutrally stable condition, subjects can now be tested at similar seat
stability levels accounting for the limitations in the Cholewicki design. Past testing
protocols have used the spring settings of 100%MGH, 75%MGH and 50%MGH.
Even though the scale of %MGH can account for anthropometrics, people still
perform differently. The third method of setting the springs is to account for the subject’s
personal ability to balance. In method, the springs are adjusted to result in trials that have
similar performance outcomes. As used in chapter 3, the springs were adjusted till the
subject’s balance performance was within bounds of challenging enough, but not too
difficult. In this case, the subject’s performance was monitored such that the tilt of the
chair stayed primarily greater than 4° but less than 7° of seat tilt. The purpose of this
method was to use an increased difficulty level where changes in the postural stability of
the trunk would be more pronounced after the applied factor (in this case WBV).
The fourth method that has been investigated for spring positioning would be the
location of the subject’s threshold of stability. Though not complete in process, this
method has been explored by progressively moving the springs away from the pivot
point. In addition, analysis of the data collected can be used to locate the basin of
stability for parameters of tilt angle and angular velocity. With this it can be shown that
while it looks like one person can balance better (smaller ellipse area) than another, the
136

Appendix
person with the larger ellipse area may also in fact have a larger basin of stability and can
handle larger disturbances to their trunk posture.
137

Appendix
(7.4) Chapter 4 Supplemental
Maximum Voluntary Co-Contraction (MCC)
In addition to the protocol used in the second study (chapter 4), there were also
trials pre-exposure that had subjects providing maximum voluntary co-contraction during
the pseudo-random trunk perturbations. For three of the trials, the subjects were
instructed to maximally co-contract their trunk flexors while maintaining the 20%MVE
baseline extensor torque. For the other three trials, the subject will be instructed to not
co-contract. During the six trials, EMG activity was monitored of all four muscle groups
(L-ES, R-ES, L-RA, R-RA), with importance on the activity of the rectus abdominus.
Trials without the requirement of co-contraction were seen to be maintained on average
below 5% MVC. Trials were co-contraction was required were seen to be greater than
10% MVC and were off the visible scale. Verbal encouragement was provided along
with time updates so that subjects could maintain a maximal effort through the trials.
The initial purpose of having MCC trials were to use to measure the effects of
WBV and then scale them based on the non-MCC (0%) and MCC (100%) values of
muscle activity. However there was 1) no significant changes in rectus abdominus
activity due to WBV exposure, and 2) the results of the MCC trials are counter intuitive.
To expand on this complication there were three expected outcomes of the MCC trials
versus the non-MCC. First, that there would be an increase in activity of the rectus
abdominus muscles, as this is the muscle group that you can ‘consciously’ recruit when
138

Appendix
thinking about co-contracting. Second, that there would be an increase in the activity of
the erector spinae muscles to counter the bending moment generated by the rectus
abdominus. This is the definition of co-contraction. The third expectation would be for
an increase in trunk stiffness due to the increase in co-contraction. The ‘bracing’ effect
increases the stiffness of the spine at the costs of increase muscle usage and compression
loading of the spine.
For the MCC trials, subjects’ rectus abdominus activity was monitored for
increased activity, and the post processing analysis reviled these results (on average from
4%MVC non-MCC to 11%MVC MCC). However, the activity of the erector spinae and
trunk stiffness were not seen to increase. The lack of noticeable changes in erector spinae
activity can possibly be due to effect size. The force increase in the rectus abdominus
may have been minimal compared to the 20%MVE force level that was required to be
sustained as well as the perturbation forces. Noise levels of the EMG recordings may
have also occluded any differences.
Trunk stiffness, as measured by the IRF method yielded no significant increased
in trunk stiffness with co-contraction. This is counter intuitive. Additional analysis does
show that the average force level during a trial of perturbations was increased as well as
average trunk angle displacement was decreased. The combination of these results would
suggest that the stiffness of the trunk increased with co-contraction, however, the IRF
method uses de-trended data series and would not see these differences in trials.
139

Appendix
Recovery After WBV
The effects of WBV vibration were tested and reported for effects from before to
after exposure. Additionally, for the study of trunk perturbations, there was an additional
series of three trials after 30 minutes of quite sitting (serving as recovery) after the WBV
espouser. The two main effects seen for WBV exposure, a decrease in total trunk
stiffness and decrease in reflex gain, where not seen to have any significant change with
recovery. This follows the trends for creep exposure of tissues to exhibit longer recovery
periods compared to the time of effect causing the creep deformation.
Post-Hoc: Gender
Some results were seen between genders that are worth noting. The mean forces
for trunk perturbations were significantly higher for males (185 N) than females (145 N)
(P=0.0360). This has a two part explanation. First is that the males had higher MVE
torques and second is that the males were heavier than the females. These two factors
add together to have an increased mean force level even though all subject were exposed
to the same perturbation sequence. (Note: the sequence is composed of 20% MVE
baseline torque and 33% BW perturbations.) Now it is of interest that the purpose of
scaling the perturbations to the subjects’ trunk mass was successful, and that there were
no significant differences in the mean trunk displacements. Keeping this in mind, then it
is significant that results also show that females had a higher reflex gain as compared to
140

Appendix
males (P=0.0339). Based off of the current information presented here, this would mean
that the reflex response is either higher in females in general, or that the difference in
force is more accountable. Finally, most measures of rectus abdominus activity was
found to be higher in females than males for base-line pre-trial activity (P=0.0106),
during trials (P=0.0046), and in terms of MCC effort (P=0.0406).
141
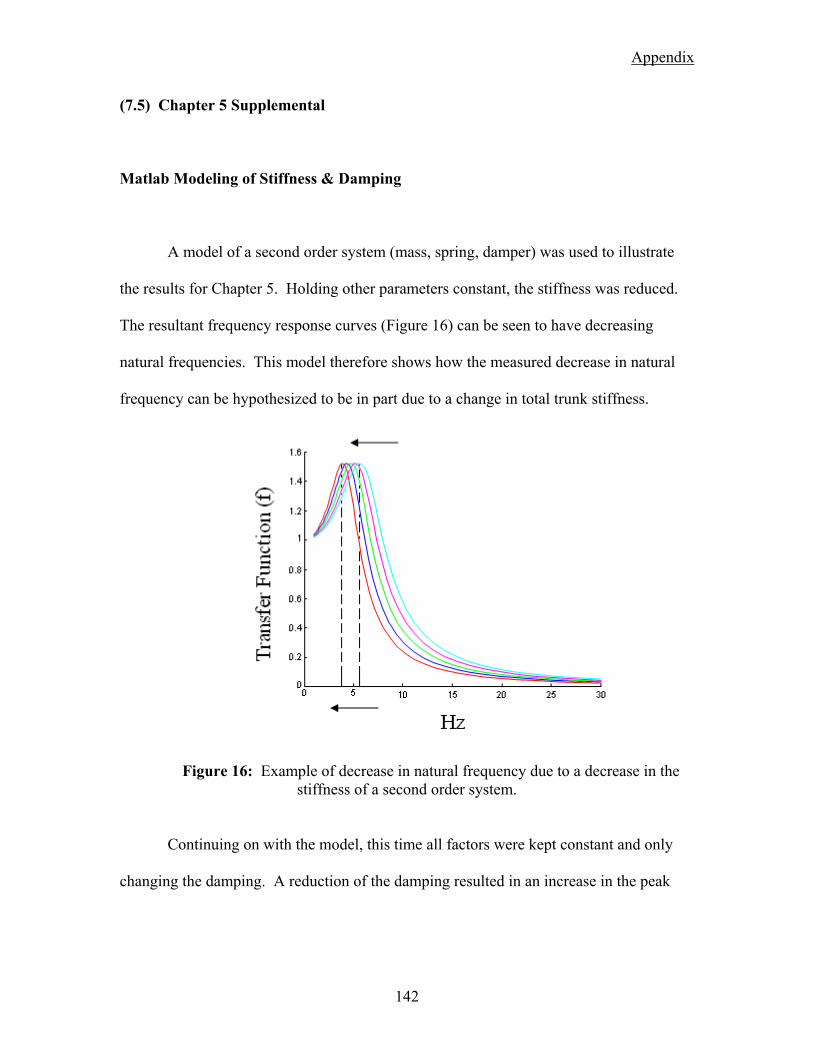
Appendix
(7.5) Chapter 5 Supplemental
Matlab Modeling of Stiffness & Damping
A model of a second order system (mass, spring, damper) was used to illustrate
the results for Chapter 5. Holding other parameters constant, the stiffness was reduced.
The resultant frequency response curves (Figure 16) can be seen to have decreasing
natural frequencies. This model therefore shows how the measured decrease in natural
frequency can be hypothesized to be in part due to a change in total trunk stiffness.
Figure 16: Example of decrease in natural frequency due to a decrease in the stiffness of a second order system.
Continuing on with the model, this time all factors were kept constant and only
changing the damping. A reduction of the damping resulted in an increase in the peak
142

Appendix
value of the frequency response function (Figure 17). This model demonstrates how a
change in the peak value is an implication of a decrease in the system damping.
Figure 17: Example of increase in peak value at the natural frequency as seen with the increase in vibration exposure duration. Modeled here as a decrease in damping of a
second order system.
Transmissibility Second Characteristic Frequency
The transmissibility frequency response function, in addition to the natural
frequency near 5 Hz, also has a secondary characteristic frequency. Similar to that of the
natural frequency (Figure 18), there was a significant overall drop of 6.40% (SD 16.0%)
for TRf2 (P<0.01). Visualizing the changes over time indicate an initial rapid decline with
a gradual leveling off. The peak value measured at the secondary frequency was lower
than that of the natural frequency and also exhibited the same increase with exposure to
WBV (Figure 19). The overall increase was 22.8% (SD 69.6%) for TRP2 (P<0.01).
Similar to rate of change of the natural frequency, the increase in the frequency response
functions’ peak value had an initial increase which gradually levels (Figure 19) . Control
143

Appendix
group testing revealed no significant changes in peak values for either of the frequency
response functions.
Figure 18: Frequency trend for the secondary characteristic frequency of transmissibility
with respect to the natural frequencies of transmissibility and apparent mass.
Figure 19: Peak value trend for the second characteristic frequency of transmissibility
with repect to the natural frequency of transmissibility ans apparent mass.
144

Appendix
Post-Hoc: Gender
Some significance between genders and interactions with time were seen. There
was a significant trend for males to have a lower secondary frequency for transmissibility
(P=0.0324). This was also evident in the interaction of gender and time (P=0.0347)
where the males had lower values than females (P<0.05) for all samples after the initial
(Figure 20). Additionally, only the males had differences (P<0.05) from the initial value
to recordings at later times of WBV exposure. In contrast, in the control group testing,
the natural frequency for both frequency response functions showed males to have a
higher natural frequency than females (AM(fn) P=0.0069, TR(fn) P=0.0468).
7.5
8
8.5
9
9.5
10
T1 T2 T3 T4 T5 T6 T7
Time (mins)
TR(f2
) MaleFemale
Figure 20: Gender and time interaction for TR(f2). Arrows mark post-hoc significance
between genders and per-gender differences from the initial measurement.
Significance was found for the interaction of gender and time for the peak values
for both apparent mass (P=0.0495) and transmissibility (P=0.0457). Differences were
seen for males to have lower peak values than females for apparent mass at some time
145

Appendix
samples (Figure 21a). For transmissibility, initially there was a lower peak value for
females than males, where the difference between genders is reduced due to the rapid
increase in the females’ parameter (Figure 21b).
Figure 21: AM(Pv) and TR(Pv) gender by time interaction. Arrows mark post-hoc
significance between genders and per-gender differences from the initial measurement.
Alternate Movement: Anterior/Posterior Frequency Function
Measures of frequency response functions can be prone to the effects of postural
movements (Mansfield and Griffin, 2002, Mansfield et al., 2006). This applies to
changes in posture during vibration as well as possible effects of anterior/posterior
pivoting. In the case of postural changes, subjects were monitored to limit any changes
throughout testing. As for any anterior/posterior complications, additional analysis was
performed to address this issue.
1
1.05
1.1
1.15
1.2
1.25
0 5 10 15 20 25 30
Time (mins)
AM
(Pv) Male
Female
1
1.2
1.4
1.6
1.8
2
2.2
2.4
0 5 10 15 20 25 30
Time (mins)
TR(P
v) MaleFemale
146

Appendix
In the case of transmissibility, there are questions as to where the 10 Hz
secondary characteristic frequency originates from. One hypothesis is that the rocking
motion in the anterior/posterior direction would cause it. Another possibility is that the
effect is of the cervical spine and the head. This second hypothesis can also explain why
the second characteristic frequency is primarily seen in transmissibility and not in
apparent mass. The agreement between the two methods at the natural frequency near 5
Hz is and not at 10 Hz is the proportion of mass that is involved. With the head being a
smaller mass with respect to the entire HAT (head, arms, trunk) mass, any effects on
apparent mass would be negligible. With the measure of transmissibility with a bite bar,
segment mass is less of an issue.
To address the concept of for/aft rocking, transmissibility in the for/aft direction
was process and compared to the vertical direction (Figure 22). In the four examples, the
darker line represents the Z-axis (vertical) transmissibility while the lighter line is the Y-
axis (anterior/posterior). In each case the peaks of one axis does not line up with the
peaks of the other. If the for/aft pivoting moment was responsible for peaks in the
vertical direction, it would be expected that the transmissibility curves would share some
characteristics. In fact is has been stated that the frequency and peak in one direction are
not related to that of another (Mansfield and Maeda, 2007). Of interest to this
investigation is the noticeable occurrence of a peak in one signal matching up with a local
minimum in another (Figure 23). As shown, the natural frequency (Fn) in the Z-axis
lines up with a local minimum in the Y-axis. Likewise, the peak value in the Y-axis (FY)
is aligned with a local minimum of the Z-axis in between the natural frequency and the
secondary frequency (F2).
147
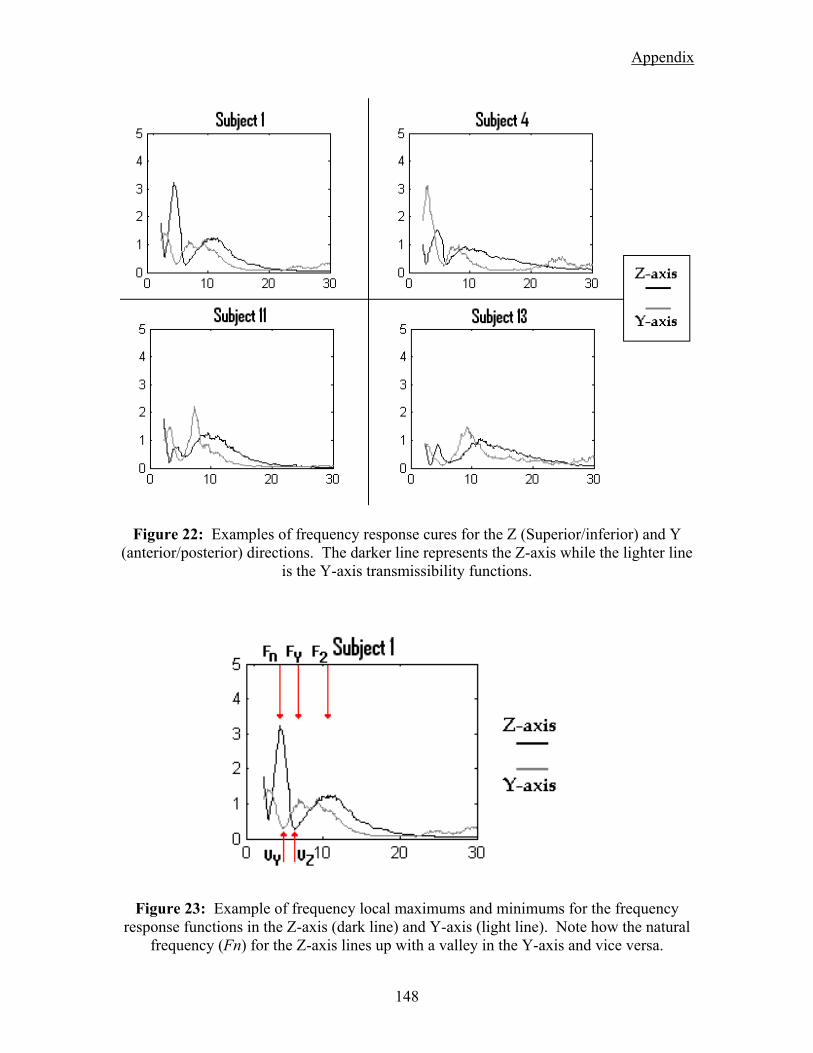
Appendix
Figure 22: Examples of frequency response cures for the Z (Superior/inferior) and Y (anterior/posterior) directions. The darker line represents the Z-axis while the lighter line
is the Y-axis transmissibility functions.
Figure 23: Example of frequency local maximums and minimums for the frequency response functions in the Z-axis (dark line) and Y-axis (light line). Note how the natural
frequency (Fn) for the Z-axis lines up with a valley in the Y-axis and vice versa.
148

Appendix
(7.6) Appendix References
CHOLEWICKI, J., POLZHOFER, G. K. & RADEBOLD, A. (2000) Postural control of trunk during unstable sitting. J Biomech, 33, 1733-7.
COLLINS, J. J. & DE LUCA, C. J. (1993) Open-loop and closed-loop control of posture: a random-walk analysis of center-of-pressure trajectories. Exp Brain Res, 95, 308-18.
COURVILLE, A., SBRICCOLI, P., ZHOU, B. H., SOLOMONOW, M., LU, Y. & BURGER, E. L. (2005) Short rest periods after static lumbar flexion are a risk factor for cumulative low back disorder. J Electromyogr Kinesiol, 15, 37-52.
CRISCO, J. J. (1989) The biomechanicsl stability of the human lumbar spine: experimental and theoretical investigations, New Haven, CT, Yale University.
DELIGNIERES, D., DESCHAMPS, T., LEGROS, A. & CAILLOU, N. (2003) A methodological note on nonlinear time series analysis: is the open- and closed-loop model of Collins and De Luca (1993) a statistical artifact? J Mot Behav, 35, 86-97.
DUARTE, M. & ZATSIORSKY, V. M. (2000) On the fractal properties of natural human standing. Neurosci Lett, 283, 173-6.
FRANKLIN, T. C. & GRANATA, K. P. (2007) Role of reflex gain and reflex delay in spinal stability--a dynamic simulation. J Biomech, 40, 1762-7.
GRANATA, K. P., LEE, P. E. & FRANKLIN, T. C. (2005a) Co-contraction recruitment and spinal load during isometric trunk flexion and extension. Clin Biomech (Bristol, Avon), 20, 1029-37.
GRANATA, K. P. & ORISHIMO, K. F. (2001) Response of trunk muscle coactivation to changes in spinal stability. J Biomech, 34, 1117-23.
GRANATA, K. P., ORISHIMO, K. F. & SANFORD, A. H. (2001) Trunk muscle coactivation in preparation for sudden load. J Electromyogr Kinesiol, 11, 247-54.
GRANATA, K. P. & ROGERS, E. (2007) Torso flexion modulates stiffness and reflex response. J Electromyogr Kinesiol, 17, 384-92.
GRANATA, K. P., ROGERS, E. & MOORHOUSE, K. (2005b) Effects of static flexion-relaxation on paraspinal reflex behavior. Clin Biomech (Bristol, Avon), 20, 16-24.
GRANATA, K. P., SLOTA, G. P. & BENNETT, B. C. (2004a) Paraspinal muscle reflex dynamics. J Biomech, 37, 241-7.
GRANATA, K. P., SLOTA, G. P. & WILSON, S. E. (2004b) Influence of fatigue in neuromuscular control of spinal stability. Hum Factors, 46, 81-91.
HARBOURNE, R. T. & STERGIOU, N. (2003) Nonlinear analysis of the development of sitting postural control. Dev Psychobiol, 42, 368-77.
149

Appendix
HERRMANN, C. M., MADIGAN, M. L., DAVIDSON, B. S. & GRANATA, K. P. (2006) Effect of lumbar extensor fatigue on paraspinal muscle reflexes. J Electromyogr Kinesiol, 16, 637-41.
HOOPS, H., ZHOU, B. H., LU, Y., SOLOMONOW, M. & PATEL, V. (2007) Short rest between cyclic flexion periods is a risk factor for a lumbar disorder. Clin Biomech (Bristol, Avon), 22, 745-57.
KANG, H. G. & DINGWELL, J. B. (2006) A direct comparison of local dynamic stability during unperturbed standing and walking. Exp Brain Res, 172, 35-48.
LE, P., SOLOMONOW, M., ZHOU, B. H., LU, Y. & PATEL, V. (2007) Cyclic load magnitude is a risk factor for a cumulative lower back disorder. J Occup Environ Med, 49, 375-87.
LEE, P. J. & GRANATA, K. P. (2006) Interface stability influences torso muscle recruitment and spinal load during pushing tasks. Ergonomics, 49, 235-48.
LEE, P. J., GRANATA, K. P. & MOORHOUSE, K. M. (2007) Active trunk stiffness during voluntary isometric flexion and extension exertions. Hum Factors, 49, 100-9.
LEE, P. J., ROGERS, E. L. & GRANATA, K. P. (2006) Active trunk stiffness increases with co-contraction. J Electromyogr Kinesiol, 16, 51-7.
LITTLE, J. S. & KHALSA, P. S. (2005) Human lumbar spine creep during cyclic and static flexion: creep rate, biomechanics, and facet joint capsule strain. Ann Biomed Eng, 33, 391-401.
MANSFIELD, N. J. & GRIFFIN, M. J. (2002) EFFECTS OF POSTURE AND VIBRATION MAGNITUDE ON APPARENT MASS AND PELVIS ROTATION DURING EXPOSURE TO WHOLE-BODY VERTICAL VIBRATION. Journal of Sound and Vibration, 253, 93-107.
MANSFIELD, N. J., HOLMLUND, P., LUNDSTROM, R., LENZUNI, P. & NATALETTI, P. (2006) Effect of vibration magnitude, vibration spectrum and muscle tension on apparent mass and cross axis transfer functions during whole-body vibration exposure. J Biomech, 39, 3062-70.
MANSFIELD, N. J. & MAEDA, S. (2007) The apparent mass of the seated human exposed to single-axis and multi-axis whole-body vibration. J Biomech, 40, 2543-51.
MARRAS, W. S., LAVENDER, S. A., LEURGANS, S. E., RAJULU, S. L., ALLREAD, W. G., FATHALLAH, F. A. & FERGUSON, S. A. (1993) The role of dynamic three-dimensional trunk motion in occupationally-related low back disorders. The effects of workplace factors, trunk position, and trunk motion characteristics on risk of injury. Spine, 18, 617-28.
MOK, N. W., BRAUER, S. G. & HODGES, P. W. (2007) Failure to use movement in postural strategies leads to increased spinal displacement in low back pain. Spine, 32, E537-43.
150

Appendix
MOORE, B. D., DROUIN, J., GANSNEDER, B. M. & SHULTZ, S. J. (2002) The differential effects of fatigue on reflex response timing and amplitude in males and females. J Electromyogr Kinesiol, 12, 351-60.
MOORHOUSE, K. M. & GRANATA, K. P. (2005) Trunk stiffness and dynamics during active extension exertions. J Biomech, 38, 2000-7.
MOORHOUSE, K. M. & GRANATA, K. P. (2007) Role of reflex dynamics in spinal stability: intrinsic muscle stiffness alone is insufficient for stability. J Biomech, 40, 1058-65.
NACHEMSON, A. L. & EVANS, J. H. (1968) Some mechanical properties of the third human lumbar interlaminar ligament (ligamentum flavum). J Biomech, 1, 211-20.
PANJABI, M. M. (1992) The stabilizing system of the spine. Part I. Function, dysfunction, adaptation, and enhancement. J Spinal Disord, 5, 383-9; discussion 397.
PRIETO, T. E., MYKLEBUST, J. B., HOFFMANN, R. G., LOVETT, E. G. & MYKLEBUST, B. M. (1996) Measures of postural steadiness: differences between healthy young and elderly adults. IEEE Trans Biomed Eng, 43, 956-66.
RADEBOLD, A., CHOLEWICKI, J., PANJABI, M. M. & PATEL, T. C. (2000) Muscle response pattern to sudden trunk loading in healthy individuals and in patients with chronic low back pain. Spine, 25, 947-54.
RADEBOLD, A., CHOLEWICKI, J., POLZHOFER, G. K. & GREENE, H. S. (2001) Impaired postural control of the lumbar spine is associated with delayed muscle response times in patients with chronic idiopathic low back pain. Spine, 26, 724-30.
REEVES, N. P., EVERDING, V. Q., CHOLEWICKI, J. & MORRISETTE, D. C. (2006) The effects of trunk stiffness on postural control during unstable seated balance. Exp Brain Res, 174, 694-700.
REEVES, N. P., NARENDRA, K. S. & CHOLEWICKI, J. (2007) Spine stability: the six blind men and the elephant. Clin Biomech (Bristol, Avon), 22, 266-74.
ROGERS, E. L. & GRANATA, K. P. (2006) Disturbed paraspinal reflex following prolonged flexion-relaxation and recovery. Spine, 31, 839-45.
SLOTA, G. P., GRANATA, K. P. & MADIGAN, M. L. Effects of seated whole-body vibration on postural control of the trunk during unstable seated balance. Clinical Biomechanics, In Press, Corrected Proof.
SOLOMONOW, M., HE ZHOU, B., BARATTA, R. V., LU, Y., ZHU, M. & HARRIS, M. (2000) Biexponential recovery model of lumbar viscoelastic laxity and reflexive muscular activity after prolonged cyclic loading. Clin Biomech (Bristol, Avon), 15, 167-75.
VAN DAELE, U., HUYVAERT, S., HAGMAN, F., DUQUET, W., VAN GHELUWE, B. & VAES, P. (2007) Reproducibility of postural control measurement during unstable sitting in low back pain patients. BMC Musculoskelet Disord, 8, 44.
151

Appendix
152
WILSON, S. E. & GRANATA, K. P. (2003) Reposition sense of lumbar curvature with flexed and asymmetric lifting postures. Spine, 28, 513-8.


![1 Rotor service On car brake lathe. 2 Rotor runout Rotor runout [wobble] causes pedal pulsation and vibration during braking. Beside irritating customers](https://img.dokumen.tips/doc/110x75/56649e535503460f94b48dc2/1-rotor-service-on-car-brake-lathe-2-rotor-runout-rotor-runout-wobble-causes.jpg)