Embed Size (px)
Citation preview

Effects of ruminal nutrient degradability on volatile fatty acid dynamics, ruminal
epithelial gene expression, and post-absorptive system
Linda Beckett
Thesis submitted to the faculty of Virginia Polytechnic Institute and State
University in partial fulfillment of the requirements for the degree of
Master of Science
In
Animal and Poultry Sciences
Robin R. White, Chair
Thomas Bain Wilson
Mary Beth Hall
November 15th, 2018
Blacksburg, Virginia
Keywords: volatile fatty acids, nutrient degradability, rumen epithelium, skeletal
muscle metabolic rate

Effects of ruminal nutrient degradability on volatile fatty acid dynamics, ruminal epithelial gene
expression, and post-absorptive system
Linda Beckett
SCHOLARLY ABSTRACT
This study evaluated degradable nutrient supply effects on VFA concentrations, fluid flux
and pool sizes, rumen epithelial metabolic and absorptive genes, and post-absorptive muscle and
blood responses. Six ruminally cannulated Holstein heifers (BW = 330 ± 11.3 kg) were used in a
partially replicated Latin Square experiment with four treatments consisting of beet pulp or
timothy hay and barley or corn grain. Periods were18 d with 3 d diet adaptation and 15 d of
treatment. During each period, d 10 to 14 was used for in situ nutrient degradation assessment, d
16 to 18 was used for rumen fluid sampling, and d 18 was used for rumen papillae and skeletal
muscle biopsies and blood sampling. In situ ruminal starch disappearance rate (barley 7.61 to
10.5 %/h vs corn 7.30 to 8.72%/h; P = 0.05) and extent of fiber disappearance (timothy hay 22.2
to 33.4 % DM vs beet pulp 34.4 to 38.7 % DM P = 0.0007) differed significantly among diets.
Acetate (P = 0.02) and isovalerate (P = 0.008) molar percentages (% mol) were increased by
timothy hay, but propionate (P = 0.06) and valerate (P = 0.10) molar percentages were
decreased. Corn increased propionate (P = 0.02) and valerate (P = 0.049) molar percentage, but
decreased butyrate (P = 0.04) molar proportion. Fluid volume and fluid passage rate, and
individual VFA pool sizes were not influenced by diet (P > 0.05). Four epithelial genes, two
metabolic and two absorptive, had increased expression on timothy hay diets (P < 0.15). Blood
acetate concentration was influenced by treatment (P = 0.067) but no other blood metabolites
were. Skeletal muscle metabolic rate was significantly increased on corn diets (P = 0.023). The
results of this study provide a whole-system snapshot of how the rumen environment changes on
diets differing in nutrient degradability and how the post-absorptive system adapts in response.

Effects of ruminal nutrient degradability on volatile fatty acid dynamics, ruminal epithelial gene
expression, and post-absorptive system
Linda Beckett
GENERAL AUDIENCE ABSTRACT
Over the last 50 years, dairy cattle have been bred to optimize milk production to meet
growing population demands for milk and dairy products. The world population continues to
grow and is projected to reach 9.7 billion people by 2050. Because of this growing population,
there is an overwhelming need for dairy nutritionists to optimize the conversion of human
inedible fibers into human edible food. The ruminant animal accomplishes this conversion
through microbial fermentation of feedstuffs into volatile fatty acids (VFA), which account for
approximately 70% of total energy available for meat, milk, and fiber production. Because
rumen fermentation is a complex biochemical system, it is influenced by myriad factors
including the substrate provided, the pH of the environment, and the absorptive and metabolic
capacity of the rumen wall, among others. Although we understand how diet influences
individual aspects of rumen fermentation, few studies have concurrently evaluated how diet
influences the rumen chemical environment, the epithelium, and the resulting shifts in post-
absorptive metabolism. Our study sought to understand the impacts of feedstuffs with different
expected ruminally available starch and fiber supplies on these aspects of ruminant physiology.
Six ruminally cannulated Holstein heifers were fed four different diets which used either beet
pulp (low fiber ingredient) or timothy hay (high fiber ingredient), and ground corn (low starch
ingredient) or ground barley (high starch ingredient). Heifers were fed each diet for a period of
18 days. From day 10 to day 14 of the period, nutrient degradability was assessed by incubating
bags of feed in the rumen and conducting feed analysis after removed from the rumen. During
the last four days of each period, rumen fluid samples, blood samples, muscle biopsies, and
rumen papillae biopsies were collected. Feed analysis indicated that the starch sources differed in

degradation rates (i.e. the speed of degradation) and fiber sources different in extent of rumen
degradation (i.e. the percentage of feed degraded). Timothy hay caused greater concentrations of
Total VFA, Total branched-chain VFA, acetate isobutyrate, and isovalerate. Timothy hay caused
greater molar proportions of acetate and isovalerate. Corn caused greater molar proportions of
propionate and valerate when barley caused greater molar proportions of butyrate. Rumen
papillae biopsies were used to evaluate gene expression. Out of 14 genes, four were impacted by
diet. Two rumen transporters responsible for the absorption of VFA had greater expression when
animals were fed timothy hay diets versus beet pulp diets. Two metabolic genes also had greater
expression due to timothy hay. The changes of both absorptive genes and metabolic genes is
likely connected to the increased presence of VFA in the rumen. Lastly, blood acetate was
increased, but there was not a specific ingredient or combination that caused the change. These
results provide an overall snapshot of rumen fermentation characteristics and how changes in the
rumen affect other biology.

iv
ACKNOWLEDGEMENTS
First and foremost, I would like to say “Thank You” to my wonderful parents, Patrick
and Rose Beckett, because 1) I physically would not be here today without them, 2) I would not
be intellectually, mentally, socially, or emotionally here without them, and 3) they have shaped,
molded and crafted me into a person they’re proud to be the parents of. Secondly, I like to thank
my sister, Angela, for dealing with somewhat chaotic research and lab work schedules. Her
flexibility allowed me to sometimes work 12 to 15 hours a day, and still come home to a
bountiful feast of dinosaur shaped chicken nuggets for dinner to console the “hangry” grad
student.
Next, I’d like to extend a sincere “Thank You” to my major professor, Dr. Robin White,
for her undying patience, honesty, and encouragement. I distinctly remember the day we met
because unbeknownst to me at the time, it was a sporadic and informal way of meeting my future
major professor. Imagine this: March 2016, heat stress trial, basement of Litton-Reaves at some
ungodly morning hour. I must have left a decent impression between stating I wanted to go to
grad school, and then being the only undergrad to take the 1am and 4am shifts repeatedly.
Next, I’d like to thank my committee members, Dr. Bain Wilson and Dr. Mary Beth Hall,
for their consistent support, encouragement, patience, and intellectual contribution to help
interpret my data. Additionally, I’d like to thank several colleagues, lab mates and undergraduate
workers: Dr. Andrea Bedford, Dr. Ben Renquist, Dr. Mike McGilliard, Dr. Kristy Daniels, Dr.
Taylor Yohe, Doug Liebe, Claire Gleason, Keri Hardin, Rainey Rosemond, Celina Guzman,
Anna Foley, and Melissa Barnes. The folks listed above either helped with the physical trial
during summer 2017, helped process samples in the lab, made an intellectual contribution to my
current wealth of knowledge, or are co-authors on future publications.

v
Lastly, I’d like to thank the family I did get to choose: Shelby, Sam, Grace, Halee, Mary,
and Nicole for being available for “family dinner” nights, movie nights, random check-in phone
calls, and helping clean stalls and feed cows for those late nights at the barns. Lastly, I’d like to
thank my dog, Nelly, for being an unofficial, official therapy dog. This degree would not have
been possible without everyone listed above.

vi
TABLE OF CONTENTS
General Introduction 1
Chapter One: Literature Review 7
Introduction 8
Physiology of Digestion 9
Nutrient Degradation 10
Biological Mechanisms Driving Degradation Differences 13
Fiber Degradability 14
Starch Degradability 17
Current Knowledge of Starch and Fiber Extent and Rate of Disappearance 19
Protein Degradability 20
General Introduction to VFA 22
Mechanism of VFA Production 23
Effects of Feed Type on VFA Supplies 23
Effects of Substrate Source on VFA Supplies 26
Methods to Measure VFA Concentrations 27
Calculating VFA Concentrations 28
VFA Absorption 30
Papillae Structure and Function 31
Rumen Epithelium 33
Rumen Epithelial Transporters 34
Monocarboxylate Transporters 35
Sodium Hydrogen Exchangers 36
Rumen Epithelium Integrity 37
Metabolic Genes 38
Acetoacetyl-CoA Synthase 38
3-hydroxy-3-methylglutaryl-CoA synthase 2 39
3-hydroxy-3-methylglutaryl-CoA lyase 39
3-hydroxybutyrate dehydrogenase type 1 39
Serine-threonine protein kinase 40
Heat shock protein 70 40
Propionate Metabolism Genes 41
Background on Post-Absorptive System 41
Impact of Starch on Post-Absorptive System 41
Impact of Fiber on Post-Absorptive System 42
Conclusion 42
References 43
Figures 56
Tables 58

vii
Chapter Two: Adaptation of a common cell culture assay to rank cattle based on 59
skeletal muscle metabolic activity
Abstract 60
Basal Metabolic Rate Measurements 61
Treatment Diets and Adaptation Period 61
Sample Preparation and Collection 62
Sample Analysis 64
Consistency of Samples Within Animal-Periods 64
Statistical Analysis 65
Results and Discussion: Time 66
Results and Discussion: Diet 66
Results and Discussion: Animal 67
Tables 69
Figures 71
References 75
Chapter Three: Ruminal volatile fatty acid, epithelial gene expression, and
post-absorptive responses to varying fiber and starch sources 77
Abstract 79
Introduction 81
Animals and Treatments 83
Sample Collection 83
Feed Analysis 84
In Situ Degradability 85
Rumen Fluid Volume, Passage Rate, and VFA Concentrations 85
Blood Metabolite Sample Collection and Analysis 87
Papillae Biopsy Sample Analysis 88
Calculations and Statistical Analysis 89
Results and Discussion: Dry Matter Intake 90
Results and Discussion: Average Daily Gain 91
Results and Discussion: Nutrient Degradability 92
Results and Discussion: Rumen pH 93
Results and Discussion: VFA Molar Proportions and Concentrations 94
Results and Discussion: Rumen Fluid Volume 95
Results and Discussion: Individual VFA Pool Size and Calculated 95
Fluid-Mediated Flux
Results and Discussion: Gene Expression 96
Results and Discussion: Blood Metabolites 98
Conclusions 99
Figures 100
Tables 105
References 112
General Conclusion 116

viii
LIST OF TABLES
Chapter One Page
Table 1.1. Calculated ATP conversion efficiencies for glucose, acetate,
propionate, and butyrate as presented by Baldwin (1968). 58
Chapter Two
Table 2.1. Ingredients and nutrient composition for each treatment diet
expressed on a dry matter basis. 69
Table 2.2. Relative fluorescence treatment means, standard error, and
P-values for measuring skeletal muscle metabolic activity in bovines fed
different ruminal degradable starch and fiber diets. 70
Chapter Three
Table 3.1. Diet ingredient and nutrient inclusion for each treatment diet. 105
Table 3.2 Calculated VFA molar proportions for animals receiving diets
differing in expected ruminal starch and fiber degradation rate and extent of
degradation. Starch ingredients included barley and corn and fiber ingredients
included timothy hay and beet pulp. 106
Table 3.3. VFA concentrations for animals receiving diets differing in
expected ruminal starch and fiber degradation rate and extent of degradation.
Starch ingredients included barley and corn and fiber ingredients included
timothy hay and beet pulp. 107
Table 3.4. Calculated fluid-mediated VFA flux and ruminal VFA pool size
for animals receiving diets differing in expected ruminal starch and fiber
degradation rate and extent of degradation. Starch ingredients included barley
and corn and fiber ingredients included timothy hay and beet pulp. 108
Table 3.5. Gene name, abbreviation, function, and starch, fiber, and starch by
fiber P-values for each gene investigated when animals were fed diet differing
in expected fiber and starch degradation rate and extent of degradation. 110
Table 3.6 Blood plasma metabolite concentrations for each treatment diet, which were
formulated based on expected ruminal starch and fiber degradation rate and
extent of degradation. Acetate, propionate, and beta-hydroxybutyrate are presented
in mM, glucose in mg/dL, and insulin uIU/mL. 111

ix
LIST OF FIGURES
Chapter One Page
Figure 1.1. Visual description of different degradation rates 56
Figure 1.2. Visual representation of different extents of degradation 57
Chapter Two
Figure 2.1. Relative Fluorescence over time 71
Figure 2.2. Least squares mean relative fluorescence for each animal 72
Figure 2.3. Mean relative fluorescence of each animal mapped against
correlation parameters 73
Chapter Three
Figure 3.1. Location of rumen epithelium transporters 100
Figure 3.2. : Dry Matter Intake and Average Daily Gain 101
Figure 3.3. Ruminal Starch and Fiber Degradation Rate and Extent 102
Figure 3.4. Average rumen pH 103
Figure 3.5. Calculated rumen fluid pool size and passage rate 104

1
GENERAL INTRODUCTION
There is an overwhelming need for animal product producers to find the most humane,
economical, and environmentally efficient strategies to produce more meat, milk, and co-
products (i.e. cheese, butter, etc.). Factors driving the need for increased efficiency are: the
increasing global population expected to reach 9.2 billion people by 2050 (Thornton, 2010);
increasing pressure for animal agriculture to be more environmentally friendly; and consumers
being further removed from agriculture but still curious about how their food is produced. In
livestock production, efficiency is commonly defined as the ratio between every unit of feed and
every unit of product (meat, milk, etc.) produced (Hanset et al., 1987). This ratio is also known
as the Feed to Gain (F:G) ratio (Hanset et al., 1987). An inefficient animal would consume more
feed for every one unit of product produced (e.g. F:G 2:1). An efficient animal would consume
less feed for every one unit of product produced (e.g. F:G 1.5:1). By increasing ruminant feed
efficiency, farmers can feed less and either maintain or increase production. Increasing feed
efficiency also can allow for feeding more animals per unit of land. Ruminant feed efficiency is a
function of genetic (Hardie et al., 2017) and environmental (Hooven et al., 1968), and individual
animal factors (e.g. age, parity) (Hooven et al., 1968). Optimizing supply of volatile fatty acids
(VFA) is one nutritional way to increase ruminant feed efficiency.
Volatile fatty acids are the end products of microbial fermentation and account for 70 to
80% of energy available to the ruminant (Bergman, 1990). Because VFA are an output of
microbial fermentation, optimizing VFA supplies to the animal requires considering the substrate
provided for fermentation, the chemical environment of the rumen, the microbes available for
fermentation, and the capacity of the rumen fluid and epithelium to remove end-products of
fermentation. Historically, work has focused exclusively on rumen VFA concentrations as a way

2
to represent fermentation; however, these concentrations are not the most accurate way to
describe shifts in the rumen environment associated with fermentation (Hall, 2015). The rumen
is a dynamic, kinetic ecosystem with constant inputs and outputs. To describe VFA as
concentrations is an incomplete characterization because multiple factors influence the presence
or absence of VFA in the rumen. To more fully understand how to optimize VFA supplies, there
must be a conversion from the use of VFA concentrations to VFA pool size. Pool size describes
the amount of VFA as a function of individual VFA concentrations, rumen fluid volume, and
fluid flow (entry and exit) (Hall, 2015).
When characterizing fermentation responses to dietary changes, it is also critical to
evaluate the responses of the rumen epithelium. A healthy rumen epithelium is critical for VFA
absorption and metabolism. There are multiple short chain fatty acid, electrolyte, proton, and
other transporters imbedded in the rumen papillae (Aschenbach et al., 2009; Kramer et al.,1996),
which drive majority of ruminal absorption (Gabel and Sehested, 1997). The propensity of
transporter adaptation to different VFA supplies, diets and possibly detrimental rumen conditions
has partially been described in the literature but warrants further investigation because
fermentations with different characteristics often yield unique and, at times, inconsistent
responses. An example of these unique responses associated with fermentation environment can
be noted in Steele (2011) when animals had structural epithelial adaptations ultimately impacting
the expression of different transporters due to intense grain feeding.
The objective of this study to investigate effects of nutrient disappearance on VFA
dynamics and epithelial gene expression using calculated VFA pool size and fluid mediated flux
as more accurate indicators of VFA dynamics. Chapter 3 describes a different approach to
enhance feed efficiency by understanding VFA dynamics. Treatment diets were formulated

3
based off predicted rumen disappearance to altered fiber and starch sources based on assumed
microbial fermentation patterns. The procedural design bridges identified gaps by using a rumen
fluid marker to measure rumen volume and passage rate. Samples were taken every hour for 21
to 30 hours to measure VFA concentration and marker degradation over time. Fluid-mediated
VFA flux and pool size were calculated from VFA concentrations and rumen fluid dynamics
results. By integrating rumen fluid measurements with VFA concentrations, we gain a more
robust understanding of how VFA and changing in the rumen.
Another factor influencing an animal’s feed efficiency is their maintenance requirements,
which are quantified by measuring basal metabolic rate. Historically, basal metabolic rate is
measured using metabolic chambers, which are able to measure the amount of O2 consumed by
an animal and the carbon dioxide produced. Due to facility expense, small sample size, pressure
for quantifying greenhouse gas emissions, and amount of labor to conduct a study using
metabolic chambers, this method is now less common for basal metabolic rate quantification.
However, to better equip an animal to be more efficient, there is a need to understand variation
of individual animal maintenance requirements. To avoid using metabolic chambers, a common
cell culture assay designed to measure metabolic activity was tested as a way to stratify animals
based on skeletal muscle metabolic activity. This assay was adapted from a zebrafish embryo
protocol (Williams and Renquist, 2013; Renquist et al., 2016). The objective of this experiment,
described in Chapter 2, is to test the repeatability, practicality, and sensitivity of the novel assay.
The application of the common cell culture assay to measure skeletal metabolic rate may be a
way to reduce the expense and small sample size limitations of metabolic chambers, despite the
small sample size shown in Chapter 2. Additionally, after further research is conducted with

4
larger sample sizes, the assay could be useful for broad-spectrum, low-cost phenotyping of feed
efficiency.

5
LITERATURE CITED
Aschenbach, J.R., S. Bilk, G. Tadesse, F. Stumpff, and G. Gäbel. 2009. Bicarbonate-dependent
and bicarbonate-independent mechanisms contribute to nondiffusive uptake of acetate in
the ruminal epithelium of sheep. Am. J. Physiol. Gastrointest. Liver Physiol. 296:G1098–
107. http://dx.doi.org/10.1152/ajpgi.90442.2008.
Bergman, E.N. 1990. Energy contributions of volatile fatty acids from the gastrointestinal tract in
various species. Physiol. Rev. 70:567–590.
http://dx.doi.org/10.1152/physrev.1990.70.2.567.
Gäbel, G., and J. Sehested. 1997. SCFA transport in the forestomach of ruminants. Comp.
Biochem. Physiol. A Physiol. 118:367–374. http://dx.doi.org/10.1016/S0300-
9629(96)00321-0.
Hall, M.B., T.D. Nennich, P.H. Doane, and G.E. Brink. 2015. Total volatile fatty acid
concentrations are unreliable estimators of treatment effects on ruminal fermentation in
vivo1. J. Dairy Sci. 98:3988–3999. http://dx.doi.org/10.3168/jds.2014-8854.
Hanset, R., C. Michaux, and A. Stasse. 1987. Relationships between growth rate, carcass
composition, feed intake, feed conversion ratio and income in four biological types of
cattle. Genet. Sel. Evol. 19:225–248. http://dx.doi.org/10.1186/1297-9686-19-2-225.
Hardie, L.C., M.J. VandeHaar, R.J. Tempelman, K.A. Weigel, L.E. Armentano, G.R. Wiggans,
R.F. Veerkamp, Y. de Haas, M.P. Coffey, E.E. Connor, M.D. Hanigan, C. Staples, Z.
Wang, J.C.M. Dekkers, and D.M. Spurlock. 2017. The genetic and biological basis of
feed efficiency in mid-lactation Holstein dairy cows. J. Dairy Sci. 100:9061–9075.
http://dx.doi.org/10.3168/jds.2017-12604.
Hooven, N.W., Jr., R.H. Miller, and R.D. Plowman. 1968. Genetic and Environmental
Relationships Among Efficiency, Yield, Consumption and Weight of Holstein Cows. J.
Dairy Sci. 51:1409–1419. http://dx.doi.org/10.3168/jds.S0022-0302(68)87204-2.
Renquist, B.J., C. Zhang, S.Y. Williams, and R.D. Cone. 2013. Development of an assay for
high-throughput energy expenditure monitoring in the zebrafish. Zebrafish 10:343–352.
http://dx.doi.org/10.1089/zeb.2012.0841.
Steele, M.A., J. Croom, M. Kahler, O. AlZahal, S.E. Hook, K. Plaizier, and B.W. McBride.
2011. Bovine rumen epithelium undergoes rapid structural adaptations during grain-
induced subacute ruminal acidosis. Am. J. Physiol. Regul. Integr. Comp. Physiol.
300:R1515–23. http://dx.doi.org/10.1152/ajpregu.00120.2010.

6
Thornton, P.K. 2010. Livestock production: recent trends, future prospects. Philos. Trans. R.
Soc. Lond. B Biol. Sci. 365:2853–2867. http://dx.doi.org/10.1098/rstb.2010.0134.
Williams, S.Y., and B.J. Renquist. 2016. High Throughput Danio Rerio Energy Expenditure
Assay. J. Vis. Exp. e53297. http://dx.doi.org/10.3791/53297.

7
CHAPTER ONE
LITERATURE REVIEW
8
Introduction
Animal products have been used habitually and routinely in lifestyles for centuries
(Larson, 2003). Meat, milk, and respective dietary by-products (i.e. cheese, butter, etc.) have
high nutrient to calorie ratios, meaning that they help consumers to meet vitamin and mineral,
protein, and essential fatty acid requirements without exceeding dietary energy requirements
(White and Hall, 2017). Despite market cyclicity and surplus or rationing of goods, animal
products remain in demand (Gerber et al., 2013). Demand for animal products is expected to
double in developing countries due to rapid population growth between present and 2050
(Thornton, 2010). Increasing ruminant feed efficiency is one strategy to meet this growing global
demand without compromising resources and the environment (Capper and Bauman, 2013). A
promising strategy to increase ruminant feed efficiency is to optimize the profile and supply of
energy sources, i.e., volatile fatty acids (VFA), available to the post-absorptive system. Different
energy sources (fat, VFA, sugar) are used for different metabolic processes (production of milk
fat, protein, lactose, among others) with different energetic efficiencies (Baldwin, 1968). These
differences in efficiency are because of the different metabolic pathways (i.e. glycolysis,
oxidation of pyruvate, etc.) needed to convert a substrate to the desired end product. The
theoretical energy conversion efficiencies for acetate, propionate, and butyrate are shown in
Table 1. The differences in theoretical energy conversion efficiencies suggests an opportunity to
optimize post-absorptive efficiency if optimal supplies of each substrate could be delivered from
the pre-absorptive system with a high degree of certainty.
Unfortunately, manipulating VFA supplies absorbed from the rumen is a complex task.
First, there is a major gap in our knowledge of how different substrates or dietary ingredients
influence VFA production, absorption, and interconversion because relatively few studies (e.g.,
Sutton et al., 2003; Markantonatos et al., 2008) have been specifically conducted to evaluate

9
VFA absorption. A much larger body of literature has evaluated how diet influences VFA
concentrations (e.g. Sutton et al., 2003). However, recent work by Hall et al. (2015) discussed
that VFA dynamics are a function of rumen fluid volume and fluxes, as well as VFA pools,
which are determined by VFA production, interconversion, and absorption. The work of Hall et
al. (2015) identifies a need to quantify VFA by considering the rumen ecosystem as a whole
rather than focusing exclusively on concentration.
The last significant gap in our understanding is how the rumen epithelium responds to
different fermentation environments, perhaps influencing the capacity of the epithelium to absorb
and metabolize VFA. The epithelium consists of proteins responsible for VFA transport (Gabel
and Sehested), ion exchange (Gabel and Sehested, 1997), and nutrient metabolism (Bugaut,
1987). Although studies have determined how genes encoding these proteins shift in response to
vastly different fermentation environments, such as acidosis (Steele et al., 2011) or different
stages of life (Steele et al., 2015), few studies have concurrently evaluated shifts in rumen
fermentation and the corresponding responses of the rumen epithelium. More data on these
interactions will allow us to understand the nature of rumen adaptations and how we can
manipulate the rumen environment and absorbed VFA profiles in order to increase ruminant feed
efficiency, decrease feed costs, and preserve rumen health.
Physiology of Digestion
Mechanical and chemical digestion begins at the mouth of ruminant and monogastric
species with chewing and saliva release (McDonald et al., 2011). Saliva moistens the feedstuff to
assist with travel down the esophagus to either the stomach of monogastric species or the
reticulorumen of ruminants (McDonald et al., 2011). Saliva also provides phosphorus, and
buffers that will help maintain stomach or rumen pH (McDonald et al., 2011). The two types of

10
digestive systems (monogastric versus ruminant) start to differ at the stomach and reticulorumen.
In monogastric species, the diet is chemically and mechanically broken down by enzymes and
stomach contractions. In ruminants, the diet is filtered and fermented in the reticulorumen. The
rumen and omasum have productive and absorptive functions (McDonald, et al., 2011). The
rumen and omasum produce VFA, and also absorb water, ammonia, VFA, and electrolytes
(Dijkstra et al., 2005). The rumen differs from the omasum due to fermentative capabilities. The
abomasum functions similarly to the monogastric stomach by secreting enzymes and
mechanically mixing the digesta as that digesta continues towards the small intestine. After
forestomach digestion, digestion is relatively similar between both types of digestive systems.
However, one difference is the fermentative capabilities in the large intestine. Some monogastric
species, like hind-gut fermenters (e.g. horses, rabbits), have substantial fermentative capabilities
in the large intestine and cecum, but most monogastric species have limited fermentation
capabilities in the hind gut (McDonald et al., 2011).
Nutrient Degradation
Nutrient degradation or disappearance refers specifically to the breakdown of feedstuffs
by microbial fermentation, typically occurring in the rumen or large intestine (McDonald et al.,
2011). Feedstuff complexity and dietary characteristics are the primary determinants of the
location of digestion in the gastrointestinal tract. For example, in ruminants, total tract
digestibility of starchy feedstuffs is greater than 95% (Tucker, et al., 1968; Cerrilla and Martinez,
2003) with 60 to 75% being degraded in the rumen (Patton et al., 2012). Total tract fiber
digestibility is highly variable due different feed stuffs. An example would be corn silage-based
diets, which vary between 20 to 60% NDF total tract digestibility (Goeser, 2008). The rumen is
responsible for 90 to 95% of total NDF degraded (Huhtanen et al., 2010). Remaining fibrous

11
feedstuffs are degraded in the large intestine, which functions similar to the cecum of hind-gut
fermenters.
There are two degradation parameters to describe disappearance of nutrients-degradation
rate and extent of degradation (Hackmann et al., 2010). Degradation rate describes the speed of
nutrient disappearance over time (McDonald et al., 2011). Graphically, rate of degradation is
determined by the slope (Figure 1). Extent of degradation describes the percent of feedstuff
degraded in the rumen (McDonald et al., 2011), and is demonstrated graphically by the “Y”
value (Figure 2). Both rate and extent are dependent upon the plant cellular composition of the
feedstuff but in different capacities (Moore and Jung, 2001). Plant cellular composition is driven
by plant maturity and growing temperature (Nelson et al., 2007). For example, a fibrous feedstuff
growing at a warmer temperature contains more hemicellulose and lignin in comparison to an
immature plant (Nelson et al., 2007). Additionally, there is an increased build-up of lignin in
forage plants that grow at warmer temperatures (Chatterton et al., 1989).
Degradation parameters can also be affected by the methodological technique used to
quantify the rate. In vitro techniques tend to underestimate degradation rate in comparison to in
situ techniques because of variable individual animal rumen characteristics and type of diet
(Dijkstra et al., 2005). The in situ technique provides a representative rumen environment, but is
also not the gold standard because results vary with bag placement in the rumen and sample size
to bag ratio, among other factors (Liebe et al., 2018). If pores are too large, microbes have
greater access to the feedstuff causing an overestimation of degradability, and underestimation
can result from small pore size (Dijkstra et al., 2005). The best option to measure ruminal
degradability is through the use of a marker and duodenal cannula or omasal sampling (Kozloski,
et al., 2014), though this method is more intensive, both in terms of animal use and economics.

12
Rate and extent of degradation are also dependent upon the processing method of the
feedstuff. Forages are normally fed as hays (long-stem) or silage (shorter chop length). Grasses
and hays can be further chopped or pelleted to accommodate smaller particle size (Cash et al.,
1998). Xu and Harrison (1996) discussed that commercial grains and different by-product
feedstuffs had the greatest variations in degradation parameters of several feed classes tested.
Normally, these feedstuffs are further processed (ground, pelleted, etc) to increase availability of
nutrients for degradation (Theurer, 1986). Pelleting requires crushing, grinding, and molding the
feedstuff into a new, pelleted form, typically under high heat and pressure. The grinding causes
the physical breakdown of the cell wall allowing for increased access to cell wall components
and nutrients. Steam can also be applied either during processing (i.e. steam-rolled corn) or may
be the only processing method (i.e. steam flaked corn). Many studies have investigated
digestibility between different processing methods of feedstuffs in all livestock species (e.g., Yu
et al., 1998; Alvarado et al., 2009). Yu et al. (1998) investigated five different corn processing
methods effects on milk yield and components found 1) milk yield, milk components, and
nutrient utilization differed due to the type of processing method and 2) depending upon farm
goals, a specific type of corn processing may be better. Additionally, feed efficiency, production,
and diet cost associated with changes in digestibility due to different processing methods has
been quantified (e.g., Yu et al., 1998; Alvarado et al., 2009; Dozier et al., 2010). Economical
differences are of particular importance because of the increased cost associated with a more
processed diet (Dozier et al., 2010), however, pelleting could cause greater availability of
nutrients.

13
Biological Mechanisms Driving Degradation Differences
The ability for a feedstuff to be degraded is a function of the surface area available for
microbial attachment and the complexity and density of the feedstuff cell wall (McDonald et al.,
2011). Not all exposed surface area on a feedstuff is available for microbial attachment
(McAllister et al., 1994). Microbial attachment happens in three waves: 1) the primary
colonizers, which foster an environment on the feedstuff for the next wave of microbes; 2) the
secondary colonizers, which start to create a biofilm on the feedstuff and 3) the general microbial
population starts attaching to respective nutrients (e.g., cellulolytic bacteria attach to cellulose)
(McAllister et al., 1994). Feed chemical factors that inhibit any phases of this process will likely
impair microbial attachment, and subsequently feed degradation (McAllister et al., 1994). Cereal
grains normally have small particle size and thus have smaller surface area available for
attachment, but due to chemical structure of starches are easily degradable. On the other hand,
forages have greater surface area for microbes to attach, but due to cell wall complexity are more
difficult to degrade (Lynd et al., 2002).
Some feedstuffs can have similar extent of degradation, but different rates of degradation.
Rate of degradation is affected by microbial populations (McAllister et al., 1994), feedstuff
characteristics (Hackmann et al., 2010), feedstuff processing (Yu et al., 1998), and gut fill
(Osbourn et al., 1981). The speed of degradation can be easily influenced by feed processing
because a “step” of the degradation process has been externally accomplished (Offner et al.,
2003). Extent of degradation is a product of microbial populations, feedstuff characteristics, and
passage rate. In comparison to these other factors, feedstuff processing and gut fill are less
important for determining a theoretical maximal extent of degradation because microbial
degradation will proceed as long as substrate is available. For example, rolled corn will have a
14
faster degradation rate than whole corn kernels, but will have the same extent of degradation
(Offner et al., 2003)
Feeds with higher particle passage rate have lower rumen degradability because particles
are exposed to fermentation conditions for less time, and particles from these feeds are often
subjected to more extensive digestion in the abomasum and intestine (Ehle, 1984; Offner et al.,
2003). Increased passage rate promotes the movement digesta out of the rumen to be further
digested. The enzymatic digestion of the abomasum and fermentative capabilities of the large
intestine contribute to improving the total-tract digestibility of feedstuffs that have poor rumen
fermentation. Examples of feedstuffs with poor fermentability include those that should normally
be processed or that have a complex cell wall structure and rumen microbes can only degrade a
fraction of the feed (Offner et al., 2003). Liquid passage rate plays a less important role in
degradability in comparison to solid digesta passage rate (Casper et al., 1999). Rumen fluid, as
the medium and housing environment of fermentative species, is essential for degradation of
nutrients in the rumen and theoretically limited rumen volume (due to high passage rate) could
impair degradation; however, this is very unlikely (Casper et al., 1999).
Fiber Degradability
Lactating cow rations are typically 35 to 40% NDF (DM basis), the exact NDF level is
dependent upon the amount of starch in the diet and the type of forage (NRC, 2001). Studies
have shown that dietary NDF below 25% (DM basis) has adverse effects on milk fat, but does
not change milk production (e.g. Clark and Armentano, 1993). Dry matter intake was limited
with dietary NDF at 44% with lower producing animals (e.g. 20 kg/d) (Mertens, 1994). The NDF
content of the diet may change based on production goals, ingredient availability, and general
cow management. The rumen is responsible for 90 to 95% of total NDF degraded (Huhtanen et

15
al., 2010) and typical rumen fiber degradation rate ranges from 4 to 10 %/h (Varga and Hoover,
1983). Both degradation parameters normally dependent upon the amount of digestible cellulose
(Varga and Kolver, 1997).
Fiber is typically analyzed as crude fiber, neutral detergent fiber, or acid detergent fiber.
Crude fiber contains true cellulose and insoluble lignin (Jung, 1997). Neutral detergent fiber
comprises cellulose, hemicellulose, and lignin (Van Soest et al., 1991), while acid detergent fiber
contains primarily cellulose and lignin (Minson, 2012). Hemicellulose is classified as lowly-
digestible and lignin as indigestible by rumen microbes (Van Soest, et al., 1991). These
compounds are challenging to digest because of covalent bonding between hemicellulose and
lignin (Chesson, 1993), complexity of chemical structure, and the degree of branching of
hemicellulose molecules (Niwińska, 2012). Cellulose in the cell wall, however, is not chemically
bound to hemicellulose or lignin, but is chemically bound to individual cellulose molecules
though beta-acetal linkages (Altaner et al., 2014).
Fibrous feedstuffs consist of primary and multiple secondary cell walls (Alberts et al.,
2002, Pérez et al., 2002). Each cell wall is comprised of an external-most lignin matrix, a middle
hemicellulose band, and inner-most cellulose fibril (Pérez et al., 2002). The cellulolytic fibril
consists of individual glucose units covalently bonded, and the individual chains are linked by
hydrogen bonds (Altaner et al., 2014). Hydrogen bonding is known to strengthen cellulose
particularly during stretching or straightening (Altaner et al., 2014). Variability in ruminant
cellulose digestion is not necessarily due to the strengthening of cellulolytic hydrogen bonds, but
can be explained by association (not bonding) with lignin (Altaner et al., 2014). Because the
poorly digestible cell wall components are the most external component of the cell, it is difficult
for rumen microbes to penetrate to begin digestion. Processing forages and chewing create
16
physical breakdown of the cell wall causing easier access to cellulose, but the same processing
method for all ingredients is not best because chemical composition is not altered uniformly
(Osbourn et al., 1981).
Another factor impacting extent of ruminal fiber degradation and rate is dry matter intake
(Van Soest, 1967; Hoover, 1986). Several studies (e.g., Osbourn et al., 1981; Hoover, 1986) have
indicated that fiber digestibility is decreased at a higher level of feeding due to increased gut fill
leading to slower particle passage rate. Understanding the relationship between fiber digestibility
and intake is an ongoing process, but is of interest because animals fed on a high plane of
nutrition to support milk production or growth most likely have decreased fiber digestibility due
to associative effects with high energy feedstuffs (Mould and Ørskov 1983; Firkins et al., 2001)
Mould and Ørskov (1983) discussed potential reasons behind the negative connection
between fiber digestibility and an increase in starch in the diet. These reasons focus on ruminal
pH depression and a decrease in cellulolytic bacteria population to accommodate starch digestion
(Mould and Ørskov, 1983). Shaver and colleagues (1988) investigated NDF digestibility and
passage rate, and believed a depression in NDF fractional rate was due to a shift in the rumen
environment to accommodate starch digestion as Mould and Ørskov (1983) had explained a few
years prior.
Ruminants are able to digest human inedible fibrous material (grass, hays, silage, some
by-products) because of microbial fermentation. Rumen responses to different fiber cell wall
densities and complexities (nutrient degradability) requires further study to better understand
how fiber in individual feeds degrade and how fiber interacts with other nutrients or aspects of
the rumen environment.

17
Starch Degradability
Starch is comprised of two main polysaccharides-amylose and amylopectin. Amylose is
an unbranched starch molecule comprised of alpha-D-glucose linked by glycosidic bonds
(Svihus et al., 2005). Amylose accounts for 25% of starch molecules; amylopectin accounts for
75% (Lafiandra et al., 2014). Amylopectin is similar to amylose, but is branched due to
glycosidic bonds attaching carbon 4 and 6. The non-linear structure of amylopectin causes it to
be more readily digestible than amylose (Svihus et al., 2005). Because the amylose and
amylopectin contents of a feedstuff can differ, the ratio of amylopectin to amylose is one way
feedstuff degradability can be assessed in vitro. Svihus et al. (2005) discussed the variability of
the amylose and amylopectin ratio within commonly used cereal grains.
Svihus et al. (2005) also discussed the impacts of processing methods on starch
digestibility and utilization and concluded that due to starch layer organization, abundance of
amylose, and fat and protein physical barriers, uniform processing methods would be
inappropriate. Starch feedstuff processing has evolved to include grinding, mashing, pelleting,
heating, and water treating (Svihus et al. 2005) allowing for specific plant processing to
accommodate individual starchy feedstuff differences. As discussed earlier, specific processing
also allows for optimal digestibility of a starchy feedstuff (steam-rolled versus steam-flaked
versus only rolled; Yu et al., 1998).
The majority of research connecting nutrient digestion and VFA has centered around
starch due to the nutrient density and composition of starch feedstuffs (Dijkstra et al., 2005).
Cereal grains, classified as starchy feedstuffs, are energy dense (Lafiandra et al., 2014). Energy
dense ingredients are used in lactating cow rations to meet energy demands for maintenance,
gestation, growth (youngstock), and milk production. Starchy ingredients provide an advantage

18
over fibrous feedstuffs when considering rumen degradation rate. Offner et al. (2003) reported
that cereal grains could have a starch disappearance rate as high as 20%/h when fibrous
feedstuffs could have a starch degradation rate as low as 3%/h. A faster rate of degradation
demonstrates a feedstuff more available to rumen microbial breakdown that most likely contains
less amylose, as discussed earlier. However, a rapid rate of degradation can be described as a
disadvantage due to the well-researched inverse relationship between rapidly fermentable
carbohydrates and ruminal pH depression (Mould and Ørskov, 1983). Drastic rumen pH
depression greatly alters rumen microbial populations (Hook et al., 2011), rumen epithelial
integrity (Steele et al., 2011), and rumen electrolyte homeostasis causing poor or impaired
digestion, absorption, and utilization of nutrients (Aschenbach et al., 2011). During severe pH
depression for a prolonged period, reduction in dry matter intake and subsequently a decrease in
milk production can also occur. This concept stems from Firkins (2002) that higher producing
animals who normally have higher DMI are more susceptible to ruminal pH depression. When
animals consistently consume rapidly fermentable carbohydrates, more VFA are produced
causing an accumulation of acids (Stone, 2004) and possibly protons (Aschenbach et al. 2011)
ultimately depressing rumen pH. Animals will most likely consume less or consume the forage-
based portion of the ration causing milk production to suffer (Beauchemin, 1991). The
connection between rapidly degraded carbohydrate sources and pH depression has led to the
assumption that starch is a driving force behind subacute ruminal acidosis (SARA) and acute
acidosis in cattle. Dietary inclusion of rapidly degradable starch sources requires ruminant
nutritionists to balance meeting energy requirements for combined maintenance and production
with the goal of maintaining rumen health.

19
Extent of ruminal starch degradation ranges from 60 to 80% meaning majority of starch
is degraded in the rumen (Harmon, 2009; Patton et al., 2012). Majority of starch should be
degraded in the rumen because an influx of starch to the large intestine could compromise
intestinal integrity causing leaky gut (Kvidera et al., 2018). Accordingly, starch total tract
digestibility ranges from 85 to 95% of total starch content (Patton et al., 2012).
Current Knowledge of Starch and Fiber Extent and Rate of Disappearance
Offner et al. (2003) reviewed ruminal starch degradation and provided significant
information describing the factors that regulate degradability and degradation rate. We currently
know that nutrient extent and rate of disappearance are affected by similar factors (feedstuff
chemical complexity, microbial populations, etc.), but not exactly the same factors because a
feedstuff can have different degradation rates and similar extent of degradation (Offner et al.,
2003). A more recent review by Guiberti et al. (2014) discussed similar information as Offner et
al. (2003), but discussed the need for enhanced plant breeding programs rather than animal
interventions to increase starch digestibility. Possibly a combination of plant breeding and
animal intervention could optimize starch digestibility.
Total tract fiber digestibility ranges from 40 to 70% total NDF (Buxton and Redfearn,
1997). Variability in fiber digestibility is due to the type of fiber (concentrate versus forage
fiber), leaf to stem ratio of an individual forage, and rumen microbial populations (Buxton and
Redfearn, 1997). Additionally, there has been work describing changes in processing methods or
conservation methods to render fiber more degradable (Sousa et al., 2014). More recently,
particle size and chewing times have played a significant role in understanding fiber digestibility.
Because Mertens et al. (1997) described physically effective neutral detergent fiber (peNDF),
papers like Zebeli et al. (2012) conducted experiments to gain data further understanding fiber

20
digestibility as a function of particle size and the portion of fiber contributing to the forage mat.
Then, White et al. (2017) took peNDF a step further by describing physically adjusted neutral
detergent fiber (paNDF) as a function of peNDF, particle size and individual feed NDF. The
authors were able to connect paNDF to individual animal parameters such as: dry matter intake,
rumen pH, and rumination time. Future work would include gaining more animal data regarding
peNDF and paNDF.
Protein Degradability
Two general classifications of protein in ruminant diets include rumen undegradable
protein (RUP) and rumen degradable protein (RDP). Rumen undegradable protein is not
degraded in the rumen and bypasses directly to the intestine (McDonald et al., 2011). Rumen
degradable protein provides a substrate for microbial protein synthesis (McDonald et al., 2011).
Additionally, the ratio between RDP and RUP has been linked to net milk production, feed
efficiency, and nitrogen efficiency (Savari et al. 2018). Savari et al. (2018) found that animals
consuming a high RDP:RUP diet produced more milk with no difference in dry matter intake.
Accordingly, animals with high RDP:RUP demonstrated greater feed efficiency and higher
apparent N efficiency (Savari et al., 2018). The relationship between increasing RDP:RUP and
greater feed efficient animals warrants further investigation because the ratio could provide
another avenue to increase feed efficiency.
Microbial protein is produced by microbes consuming ATP causing microbial growth
(Hackmann and Firkins, 2015). Historically, substrates for microbial protein production have
been fibrous feedstuffs with poor protein content (accessible protein) and non-protein nitrogen
sources (Dewhurst et al., 2000), but recent land competition and increased costs of different
feedstuffs has caused a shift in the type of substrate used to produce microbial protein (Matassa

21
et al., 2016). Now energy dense carbohydrates are fed to generate more ATP through
carbohydrate excess for microbial protein synthesis (Hackmann and Firkins, 2015).
Microbial protein production is of particular importance because 60 to 85% of amino
acids that reach the small intestine are derived from microbial protein (Storm et al., 1983), and
half of microbial protein derived amino acids are absorbed and utilized by the animal
(Agricultural and Food Research Council, 1992). However, microbial protein synthesis does not
produce adequate amounts of amino acids to meet requirements and rumen microbial enzymes
degrade amino acids unless protected (Chalupa, 1975). Thus, supplementation of ruminally
protected amino acids destined for post-ruminal degradation (i.e. RUP) is common practice to
meet amino acid requirements.
According to Erasmus et al. (1994), the amino acid profiles of the RDP fraction had
greater abundance in the post-absorptive system suggesting ruminal degradation has greater
impact on post-absorptive amino acid profiles in comparison to intestinal protein degradation
(Erasmus et al., 1994). Despite the positive relationship between RDP and microbial protein
production, if there is over-supplementation of RDP, then large amounts of ammonia are
ruminally produced (Savari et al., 2018). Ruminal production of ammonia can be absorbed,
converted to urea, and excreted in urine and manure ultimately increasing overall nitrogen
excretion (Muck, 1982).
Urea recycling is one biological way to reduce nitrogen excretion while meeting amino
acid requirements. Urea recycling salvages nitrogen in the form of urea and transports it back to
the rumen to be used for microbial protein synthesis (Lapierre and Lobley, 2001). Lapierre and
Lobley (2001) discussed two major options to mitigate the N losses and environmental impact:
1) by decreasing amino acid catabolism and ammonia absorption by providing and 2) increasing
22
the conversion efficiency of urea nitrogen to bacterial protein, which are normally measured by
isotope dilution techniques through urine collection. This allows for the origin of nitrogen atoms
to be traced to determine if they were recycled or not (Lapierre and Lobley, 2001).
General Introduction to VFA
Eleven VFA are commonly discussed with respect to rumen fermentation: acetate,
propionate, butyrate, formate, valerate, hexanate, heptanate, isovalerate, isobutyrate, and 2-
methylbutyrate. These VFA differ by the number of carbon atoms and shape of the carbon chain:
straight versus branched (Bergman, 1990). Acetate (2 carbon chain), propionate (3 carbon
chain), and butyrate (4 carbon chain) comprise 95% of total ruminal VFA supply (Bergman,
1990). Out of the 95%, ruminal acetate typically comprises 70%, propionate 20%, and butyrate
10% (France and Djikstra, 2005).
Volatile fatty acids are produced by microbial fermentation, but due to specie digestive
and metabolic differences, fermentation takes place in different locations of the gastrointestinal
tract. In humans and monogastric animal species VFA are produced in the large intestine,
particularly the cecum and colon (Fleming and Arce, 1986). In ruminant species, VFA are
mainly produced in the rumen. Location of VFA production in ruminants was first investigated
by Elsden et al. (1946) who discovered that ruminal VFA supply was greatest; however, there
was substantial VFA supplies in the large intestine of ruminant species. Differences in VFA
supply based on gastrointestinal tract location were further confirmed by subsequent studies
(Faichney, 1968; Goodall and Kay, 1965; Siciliano-Jones and Murphy, 1989). Production of
VFA is driven by the specific microbial population present in the rumen or large intestine
(Bergman, 1990). Slight changes in diet alter microbial populations and subsequently VFA
supplies. Additionally, Bergman (1990) discussed nutrient disappearance is proportional to VFA

23
concentrations at different locations. However, an individual animal’s specific microbial
population may be more influential than a change in diet (Weimer et al., 1999).
Mechanism of VFA Production
Volatile fatty acids are produced from microbial fermentation in the rumen. Microbial
fermentation relies on rumen microbes (bacteria, fungi, protozoa) to attach, destroy, and
breakdown feedstuffs (McDonald et al., 2011). Destruction of the plant allows for the different
chemical components, cellulose, hemicellulose sugars, and starches, to be further broken down
into glucose, a simple sugar (McDonald et al., 2011). The first step in microbial fermentation is
glycolysis when glucose is converted to pyruvate. Pyruvate can be broken down into many end-
products through the tricarboxylic acid cycle, and the population of microbes determines which
end-product route pyruvate will take (McDonald et al., 2011). Microbial populations are
influenced by diet and, in some microbial measurements, breed (Gleason and White, 2018).
Microbial fermentation is an energy consuming and energy producing process causing
energy to convert between different forms (Hobson and Stewart, 2012). One such conversion is
the transfer of chemical energy into gaseous energy in the form of carbon dioxide and methane
(Hobson and Stewart, 2012). Chemical energy can also be converted into heat energy by
microbial fermentation, which partially contributes to reduced dry matter intake during hot
seasons or in hot climates (Conte et al., 2018).
Effects of Feed Type on VFA Supplies
The amount and type of fermentation end products (carbon dioxide, VFA, alcohol, etc)
are diet-dependent. Murphy et al. (1982) investigated the impact of different nutrient substrates
from roughage and concentrate feedstuffs on VFA stoichiometric coefficients through modelling.

24
Concentrate diets increased acetate and propionate stoichiometric coefficients in comparison to
roughage diets. In contrast, roughage diets produced higher stoichiometric coefficients of
valerate, but butyrate did not differ. Sutton et al. (2003) conducted an animal experiment similar
to what Murphy et al. (1982) simulated. Sutton et al. (2003) fed a “normal diet” consisting of 7.8
kg DM/d concentrates and 5.1 kg DM/d hay and a “low roughage diet” consisting of 11.5 kg
DM/d concentrates and 1.2 kg DM/d hay. Sutton et al. (2003) measured VFA concentrations, and
calculated molar proportions, VFA production, and interconversion through infusing radio-
isotope (C14). Sutton et al. (2003) found that acetate and butyrate concentrations were greater on
the “normal diet”. Propionate and valerate concentrations were greater when animals consumed
the low roughage diet (Sutton et al., 2003). On a molar proportion basis, acetate and butyrate
were greater when animals consumed the “normal diet”, and propionate and valerate were
greater when animals consumed the low roughage diet (Sutton et al., 2003). Although VFA
concentrations and molar proportions are still accepted and widely reported in the literature,
Sutton et al. (2003) also measured rumen fluid dynamics using intraruminal markers and infused
isotopically labeled VFA allowing for estimations of VFA production, absorption, and
interconversion to be calculated. Some 12 years later Hall et al. (2015) urged for rumen fluid
dynamics to be measured in order to have a better interpretation of VFA concentrations and
molar proportions, but also to more accurately describe VFA production, absorption, and
interconversion.
One similar finding between Murphy et al. (1982) and Sutton et al. (2003) is both
reported finding similar changes in propionate. However, the units of estimation or measurement
differed between the articles with Murphy et al. (1982) providing simulated estimations of
stoichiometric parameters and Sutton et al. (2003) measured VFA concentrations, molar

25
proportions, and production. Murphy et al. (1982) specifically noted that starch from
concentrates was one of the greatest contributors to greater stoichiometric coefficients of
propionate. This increase was speculated to be due to a shift in rumen microbes, particularly
amylolytic and lactate-utilizing bacteria.
There was conflicting information regarding butyrate results between the two studies.
The Murphy et al. (1982) simulation demonstrated changes in butyrate stoichiometric
coefficients. Predicted butyrate stoichiometric coefficients associated with fiber are primarily
substrate driven when this was not investigated in Sutton et al. (2003). It is also possible that
VFA profile shifts discussed in Murphy et al. (1982) are concurrent to shifts in the microbiome.
Mrázek et al. (2006) considered the relationship between fiber and increasing ruminal
butyrate presence by investigating butyrate-producing bacteria: Butyrivibrio and
Pseudobutyrivibrio. Interestingly, high fiber diets only significantly impacted Butyrivibrio, but
did not impact Pseudobutyrivibrio enumeration (log n/mL; Figure 2 in Mrázek et al. (2006)).
Mrázek et al. (2006) did not measure ruminal butyrate concentrations, molar proportions or
production. Paillard et al. (2007) drew connections between phylogenetic position of
Butyrivibrio and Pseudobutyrivibrio and ruminal butyrate through increased ruminal butyrate
kinase activity. Paillard et al. (2007) only measured enzyme upregulation to determine increased
ruminal butyrate. This method does not accurately describe ruminal butyrate pool size, but the
experimental findings reiterate that feed type affects microbial populations.
Like Sutton et al. (2003) finding increased acetate concentrations and molar proportions
in response to roughages, there has been further work discussing high forage diets having greater
impacts on ruminal acetate and acetate to propionate ratio (Moran, 2005). The information
demonstrated in Moran (2005) stemmed from information presented by Mowrey et al. (1999).

26
Mowrey et al. (1999) discussed switching forage and concentrate-based ingredients to determine
the impact on VFA supplies. When animals were fed diets containing high-fiber ingredients
ruminal acetate concentration increased. Contrastingly, when animals were fed high-concentrate
ingredients, propionate concentration increased. Changes in ruminal acetate and propionate, and
acetate to propionate ratio associated with forage to concentration ratio was further supported by
Sarwar et al. (1991, 1992).
Effects of Substrate Source on VFA Supplies
Metabolic pathways require a constant supply of substrate. If substrate become limiting,
then severe adverse downstream effects can occur (e.g. lack of electron transporters for electron
transport chain) (McDonald et al., 2011). If there is excess substrate, the metabolic pathway is
flooded and will typically respond by changing the rate of the metabolic process through enzyme
upregulation or the substrate will go elsewhere, if possible (McDonald et al., 2011).
Additionally, the type of substrate fed to a metabolic pathway elicits different responses. A prime
example is type of feed chemical compound (cellulose, hemicellulose, starch, sugar) on rumen
fermentation (McDonald et al., 2011).
Murphy et al. (1982) included substrate sources when modeling the impacts of roughage
and concentrate-based diets on stoichiometric coefficients of VFA. Soluble carbohydrates
(sugars, fructans, beta-glucans (NRC, 2001)) and cellulose produced the greatest stoichiometric
coefficients of acetate (Murphy et al., 1982). Propionate stoichiometric coefficients were greatest
when protein was the substrate, and molar proportions of propionate doubled with starch from
concentrates (Murphy et al., 1982). According to Murphy et al. (1982), if one were trying to
maximize propionate supplies, then a high protein, high starch concentrate feedstuff would be
best.

27
Methods to Measure VFA Concentrations
The use of isotopes to understand metabolic changes in various species has been
available since the 1930s (Wilkinson, 2018). Isotope studies function by infusing a known
amount of a labeled isotope (e.g., C13 or C14) and quantifying VFA concentrations. In early
isotope-based VFA quantification work, C14, a radioactive isotope, was commonly used. Due to
concerns surrounding radioactivity exposure of animals and humans, stable isotope, C13, usage
began. There are two ways to deliver a stable isotope infusion: bolus, continuous, or a bolus
priming dose in conjunction with continuous infusion (Wilkinson, 2018). Regardless of delivery
method, animals must be sampled frequently. Normally, a goal of an isotope infusion is to
maintain a metabolic steady state because variation in metabolism could render a tracer
undetectable (Wilkinson, 2018). However, a metabolic steady state may not simulate true
biological conditions because animals do not constantly consume and would naturally have
fluctuations in metabolites.
Isotope-based approaches have been used in previous studies (e.g. Sutton et al., 2003;
Storm and Kristensen, 2010) to quantify VFA dynamics to gain more accurate VFA data.
However, isotope-based studies are expensive due to isotope costs and human labor. Modelling
provides an alternative to isotope-based approaches and is able to provide preliminary
predictions or improvements to previous work. An example of a model focusing on VFA
absorption kinetics is shown by Storm et al. (2012). This model utilized data previously
presented by Storm and Kristensen (2010; 2011), which infused p-aminohippuric acid into the
mesenteric artery, typically used to measure renal blood flow. The activity of the rumen
epithelium was measured using deuterium oxide dilution (Storm et al., 2012).The authors found

28
rumen epithelial blood flow can play a role in the concentration gradient upheld by the rumen
epithelium either preventing or allowing absorption of ruminal VFA (Storm et al., 2012).
Calculating VFA Concentrations
The VFA concentrations are typically obtained from comparing the labeled and unlabeled
proportion of VFA after a sample is analyzed by gas-chromatography. As described by Hall et
al. (2015), VFA supplies are a function of VFA production, absorption, rumen fluid volume, and
rumen fluid passage rate. To simply measure VFA concentrations likely does not accurately
describe the dynamics of the rumen ecosystem because there are constant inputs and outputs
(fluid entry and exit, presence and absence of substrate, etc.). However, VFA concentrations are
still widely accepted in the literature, but should only serve as a proxy to actual VFA supplies.
Another factor that contributes to VFA pool size is the interconversions among different
VFA. Interconversion occurs when two VFA are not in equilibrium. Interconversion is defined
as the transfer of carbon atoms between carbon chains (Kohn and Boston, 2003). Interconversion
can only be measured during isotope infusions because labeled carbons appear in the respective
VFA, but also other VFA suggesting transfer of carbon atoms (Sejrsen et al., 2006).
Interestingly, Seal and Parker (1994) found when C14 labeled propionate was infused, the
interconversion ratio of acetate to propionate and propionate to acetate was less than the
interconversion ratio without an infusion. This suggests the isotope infusion for propionate to
acetate interconversion produced three times the amount of the acetate to propionate
interconversion, but interconverted less than half of the no infusion treatment (Seal and Parker,
1994; Sejrsen et al., 2006), which could be due to infusions pushing the animal to exceed normal
physiological ranges. Work contributing to understanding VFA interconversions has centered on
acetate and propionate and acetate and butyrate. Typically, propionate and butyrate will

29
interconvert into acetate, but there is potential for “opposite interconversions” when acetate
converts into propionate and butyrate. Markantonatos et al. (2006) successfully used a steady
state stable isotope infusion method to calculate interconversions between major VFA.
Markantonatos et al. (2006) found when comparing high concentrate and low concentrate diets
there is increased transfer of carbon atoms between acetate and butyrate (38% for high and 28%
for low concentrate diets). Some acetate was converted to propionate and valerate, but
conversion of propionate to acetate or butyrate or butyrate conversion to acetate was almost non-
existent. Markantonatos et al. (2006) provides insight into a working four pool interconversion
model that needs to undergo further testing in order to better understand the nature of potential
interconversions. Additional work that has been conducted to describe interconversions between
straight-chain VFA and branched-chain VFA is modeling work conducted by Ghimire et al.
(2017). Lack of data caused the model to have large prediction errors, therefore, presenting the
need for more ruminal VFA interconversion data from animal studies.
The ability and possibility for carbon atom transfer is diet and rumen pH dependent. This
ideology stems back to Murphy et al. (1982) discussing the impacts of substrate source and type
of feed on stoichiometric coefficients of VFA. Additionally, ruminal pH is dependent upon VFA
supplies and lactic acid production and diet, particularly the presence or absence of rapidly
fermentable carbohydrates and long-stem forage (Nocek, 1997; Owens et al., 1998). pH
depression is also a function of the buffering capacity of the rumen (Dijkstra et al., 2012).
Additionally during pH depression, microbial populations are altered and may degrade substrates
at different rates causing improper, poor, and inefficient degradation of feed, and ultimately
inefficient nutrient absorption (Mould et al., 1983). All of these factors can cause decreased

30
rumen fluid passage rate and an accumulation of VFA potentially pushing VFA out of
equilibrium.
VFA Absorption
Ruminal VFA absorption accounts for 65 to 85% of total nutrients absorbed (Rémond et
al., 1995). Volatile fatty acids have two main routes of absorption: passive diffusion (Dijkstra,
1994) and transporter-mediated (Laarman et al., 2016). The relative proportion for a VFA to
passively diffuse or use a transporter-mediated channel is variable, and is based on the type of
VFA being absorbed. For example, Penner et al. (2009a) and Schurmann (2013) discussed
acetate was more likely to passively diffuse (30 to 60%) or use a bicarbonate-dependent transport
(42 to 57%). Similarly, butyrate is expected to passively diffuse (25 to 50%) or use bicarbonate-
dependent transport (25 to 75%), but has a moderately low tendency to passively diffuse than
acetate (Penner et al., 2009a).
There has been conflicting information regarding the form (associated or dissociated) of
VFA which are absorbed. Gäbel and Martens (1991) proposed that dissociated VFA, an ionized
organic acid (VFA-), was more likely to passively diffuse (Dijkstra, 1994). Bilk et al. (2005),
Aschenbach et al. (2009), and Penner et al. (2009b) found similar responses to Gäbel and
Martens (1991) and Dijkstra (1994). Ash and Dobson (1963), Allen (1997) and Laarman et al.
(2016), suggested that at a stable rumen pH (pH > 6), VFA passively diffuse in the associated
form. Under either paradigm, pH depression would result in greater proportions of dissociated
VFA and ultimately impair absorption rate (Allen, 1997).
Gäbel and Martens (1991) also provided a basic understanding to the complexity of the
rumen epithelial transporters and their role in VFA and electrolyte movement and pH
homeostasis. Rumen epithelial transporters are known to adapt as VFA concentrations change

31
(Aschenbach et al. 2009; Penner et al., 2009a). For example, Laarman et al. (2013) fed a diet
lacking in fibrous feedstuffs with the goal to provoke ruminal VFA supplies to understand rumen
epithelial adaptations. Del Bianco Benedeti et al. (2016) fed concentrate diets differing in
processing method with the same goal as Laarman et al. (2013). Each study had different types
of VFA, but were able to see directional changes of different rumen epithelial transporters. Del
Bianco Benedeti et al. (2016) saw decreased expression of sodium hydrogen exchanger isoform
1 (NHE1) and sodium hydrogen exchanger isoform 2 (NHE2), and increased supply of ruminal
valerate. Laarman et al. (2013) saw a higher abundance of monocarboxylate transporter 1
(MCT1), a short chain fatty acid transporter, and lower abundance of sodium-bicarbonate
cotransporter isoform 1 (NBC1) in response to butyrate treatment. Valerate is a BCVFA
accounting for < 5% of total VFA, and butyrate is a short-chain fatty acid accounting for
approximately 10% of the total VFA produced (Rémond et al., 1995).
One of the major concerns surrounding measuring VFA absorption rate is an accurate and
representative method. Absorption rate is a function of rumen fluid volume, fluid entry and exit,
rumen papillae absorptive capacity regulated by expression of genes, and ruminal pH. Many
studies like Laarman et al. (2013) and Del Bianco Benedeti et al. (2016) only focus on rumen
epithelial adaptations, and fail to consider other rumen environment factors that drive VFA and
electrolyte absorption. To gain an accurate understanding of VFA absorption, rumen fluid
volume and passage rate must be measured along with rumen epithelial gene expression.
Papillae Structure and Function
Rumen papillae, extremely small finger-like projections lining the rumen wall, are
essential for ruminal nutrient absorption (Dobson et al., 1956). Volatile fatty acids (Penner et al.,
2009a), water, nitrogen in the form of urea or ammonia (Houpt and Houpt, 1968), and different
32
electrolytes are the main nutrients absorbed from the rumen (Gäbel, et al., 1987; Penner et al.,
2009a). The length and width of a papilla is a good external indicator of the absorptive capacity
(Gäbel et al., 1987). Papillae with larger surface area are thought to have greater absorptive
capacity in comparison to papillae with smaller surface areas. The growth of papillae are
stimulated by the presence of VFA, particularly propionate and butyrate (Govil et al., 2017),
linking back to the particular diet the animal is fed or when solid feed is introduced to stimulate
microbe growth (Lane et al., 2000, Steele et al., 2015). For example, in calves, starter is fed
because the grain mixture contains rapidly fermentable carbohydrates which are easier for an
immature rumen to digest in comparison to a forage-based diet (Govil et al., 2017). Higher VFA
supply results in larger, longer papillae with a greater presence of genes regulating nutrient
absorption (Lane et al., 2000). Additionally, Wang et al., (2017) discussed the difference
between forage quality and particle size on papillae growth. They found when lactating animals
were fed low quality forage, larger particle size increased papillae width (Wang et al., 2017).
With this knowledge, the next step could be to provide high quality forage with high nutritional
value and larger particle size to investigate papillae width and length responses.
The rumen is described as a non-glandular stomach, which defines the type of epithelium
present (Elhamd and Elbab, 2017). The papillae are also referred to as the tunica mucosa. The
anatomy of a papilla begins with the keratin layer as the apical-most portion. Papilla keratin is
used as an epithelium protective agent. Directly underneath the keratin are the different rumen
epithelium strata. These strata, arranged apically to basolaterally, are called corneum,
granulosum, spinosum, and basale. The strata corneum, granulosum, and spinosum all have
squamous cells (Baldwin and Conner, 2017). The stratum corneum is the most keratinized layer
and being the apical-most layer, has the most defined cell wall (Steven and Marshall, 1969). The

33
keratinization of the corneum provides protection against microbes and changes in rumen pH
(Baldwin, 1998). Mitochondria have not been found in the stratum corneum (Kuhn and
Thompson, 1965). Because of the lack of mitochondria, the stratum corneum is thought to have
the least amount of metabolic activity (Baldwin, 1998). The stratum granulosum consists
primarily of granular cells (Dobson, 1956) and there appears to be no clear division between the
granulosum and spinosum as there is with other strata (Baldwin, 1998). The stratum granulosum
contains majority of the rumen epithelial transporters (Laarman et al., 2013). According to
Dobson (1956), the stratum spinosum appears to have intracellular structures resembling human
skin “goosebumps” and a complex of fibrils creating “bridges” across the stratum. Later work
suggested the structures described by Dobson (1956) are most likely mitochondria and various
organelles because the spinosum and basale have the most metabolic activity out of the strata
(Baldwin, 1998). The stratum basale consists of well-defined columnar cells, shown to have the
greatest mitochondrial density, and are less intensified when immunostaining for Claudin-1
meaning the integrity of the rumen epithelium at the apical-most portion is stronger (Graham and
Simmons, 2005). The basement membrane defines the separation between the epithelium and
lamina propia. The next layer is the tunica submucosa, a vascularized submucosal layer, will
drain the nutrients transported to the lamina propia. Immediately following the tunica
submucosa, the tunica muscularis and tunica serosa are the basolateral-most layers.
Rumen Epithelium
The primary roles of the rumen epithelium are to maintain ion homeostasis, serve as a
microbial barrier, and absorb VFA. The first route of SCFA transport is associated passive
diffusion, when a proton is linked to the fatty acid carbon chain. The second route is dissociated
transporter mediated, when negatively charged SCFA utilize a monocarboxylate transporter
34
(MCT). Monocarboxylate transporters are symporters because a proton is transported with the
SCFA to alleviate some of the potential ion gradient disturbances. The rumen epithelium is
comprised of multiple layers of stratified squamous epithelium. Each strata, except the stratum
corneum, contains different rumen epithelial transporters, which facilitate the movement of short
chain fatty acids (SCFA), protons, sodium and bicarbonate ions to maintain rumen pH and the
ion gradient. Additionally, each strata contains metabolic genes, which help maintain rumen
epithelium integrity (Zhang et al., 2018), consistent protein synthesis (Mayer and Bukau, 2005),
and regulate downstream responses like glucose and insulin homeostasis (Hay, 2011).
The location and abundance of the transporters and other metabolic genes is extremely
important in understanding the potential adaptations that can occur due to diet changes. Previous
work from a colleague’s lab, localized genes and found high expression in the stratum
granulosum, stratum basale, or throughout the strata. Additionally, transporters that work in
tandem with one another are more likely to simultaneously adapt (Yohe, unpublished data).
Rumen Epithelial Transporters
Rumen epithelial transporters are responsible for the movement of SCFA, protons,
sodium, and bicarbonate. The general classification of transporter isoforms are monocarboxylate
transporters (MCT), sodium-hydrogen exchangers (NHE), anion exchangers (AE), and sodium
bicarbonate cotransporters (NBC). These transporters are also present in the omasum,
abomasum, small intestine and large intestine, but in lesser abundance than the rumen (Kirat et
al., 2006) because majority of absorption occurs in the rumen.

35
Monocarboxylate Transporters
Monocarboxylate transporters are symporters responsible for the movement of SCFA-/H+
basolaterally. There are a number of isoforms, but the particular ones participating in VFA
transport are MCT1, MCT2, and MCT4. MCT1 is present in the stratum spinosum (Kirat et al.,
2006) and the basement membrane of the stratum basale, and typically works in tandem with
MCT4 or MCT2 to transport VFA (Graham et al., 2007). MCT2 is present intracellularly in the
stratum granulosum and spinosum, but is present on the basement membrane of stratum basale
(Graham et al., 2007). MCT4 is also present in the stratum granulosum, spinosum, and basale,
but is on the apical membrane of the stratum basale (Graham et al., 2007). MCT2 and MCT4
have approximately the same abundance, but due to MCT2 being slightly more intracellularly in
comparison to MCT4, we tend to see changes in transporters more proximal to the lumen or
basement membrane (Laarman et al., 2013). Because H+ accompanies SCFA from the rumen, all
MCT isoforms are thought to play a role in ruminal pH regulation (Steele et al., 2013).
Monocarboxylate transporter abundance is a function of diet, which drives rumen
conditions. For example, Steele et al. (2011) found that during pH depression the strata decrease
in size, but transporter abundance was not measured during this study. Steele et al. (2012)
conducted a similar experiment, but investigated genes regulating SCFA transport and
ketogenesis. Steele et al. (2012) found that MCT genes did not change in response to a diet shift
(from high forage to high concentrate) or an increase in ruminal butyrate concentration. The lack
of change in MCT, despite butyrate concentration increases, could be due to measured pH
depression. During pH depression, the rumen epithelium appears and functions in a
compromised manner. The cohort of animals from this study that did not display pH depression
also did not have greater VFA supplies likely not allowing an environment to promote

36
transporter adaptation. Contrastingly, Laarman et al. (2013) found that MCT1 abundance
increased when butyrate was ruminally bolused daily, but did not produce a different ruminal
VFA profile in comparison to cows not dosed with butyrate. Both cohort of animals (butyrate
infusion versus control) were in an acidotic state potentially causing the epithelium to be
compromised as Steele et al. (2012) recognized. Laarman et al. (2013) shows that MCT
abundance is dependent upon VFA profile, but ruminal pH depression seems to override VFA
influence on MCT.
Sodium Hydrogen Exchangers
Both NHE1 and NHE3 are responsible for recycling protons back to the lumen and
importing sodium (Laarman et al., 2013, 2016; Orlowski and Grinstein, 2004). NHE1 and NHE3
are present in the stratum granulosum along the apical membrane (Graham et al., 2007). The
exception to this would be NHE2, which is present intracellularly in the granulosum, spinosum,
and basale layers (Graham et al., 2007). NHE2 does not control electrolyte movement apically to
basolaterally like the other sodium hydrogen exchangers (Graham et al., 2007), but actually
controls intracellular sodium concentrations (Orlowski and Grinstein, 2004) NHE2 metabolizes
sodium and produces protons which maintains the intracellular charge (Orlowski and Grinstein,
2004). NHE1 and NHE3 isoforms play a significant role in ruminal pH homeostasis (Orlowski
and Grinstein, 2004). Changes in sodium hydrogen exchanger isoforms due to ruminal pH
depression is demonstrated by Yang et al. (2012) in goats. Yang et al. (2012) found that an
increase in dietary concentrates increased VFA concentrations and expression of NHE1 and
NHE3. Lu et al. (2016) found similar NHE1 and different NHE2 and NHE3 (decreased)
responses to Yang et al. (2012), but Lu et al. (2016) investigated omasal NHE responses instead
of ruminal. The likelihood for VFA to be absorbed across the ruminal epithelium is higher than

37
the omasal epithelium most likely causing the observed differences seen with NHE even though
they are not SCFA transporters.
Rumen Epithelium Integrity
Destruction of the rumen epithelium would greatly impair absorptive and metabolic
capacity due to projected sloughing and overall epithelium loss. Epithelium disruption normally
is caused by an adverse event such as acidosis (Khafipour et al., 2009) or heat stress (Baumgard
and Rhoads, 2013). During these conditions, it has been found that gram-negative bacteria
concentrations decrease, which normally regulate lipopolysaccharide (LPS) a ruminal
inflammatory marker (Khafipour et al., 2011). Due to increased concentrations of LPS, an
inducer of inflammation, rumenitis can occur ultimately causing further destruction of the rumen
environment (Zhao et al., 2018).
Claudin-1 (CLDN1) and Gap Junction alpha-1 (GJA1) are genes responsible for rumen
epithelium integrity maintenance. Claudin-1 has been expressed in the stratum granulosum and
stratum basale with some appearance in the stratum spinosum. Claudin-1 gene codes for a
Claudin-1, a tight junction membrane protein. Gap Junction alpha-1 can be classified as a
connexin, a group of gap junction proteins. Gap Junction alpha-1 codes for a transmembrane
protein (Connexin-43) that has a role in gap junction formation and pH regulation. Gap junction
alpha-1 is most highly expressed in the stratum granulosum and is less abundant in the spinosum
and basale, which is logical because gap junctions need to be in the apical-most portion of the
epithelium. Interestingly, during a high concentrate diet, fed to decrease rumen pH, and sodium
butyrate treatment, Claudin-1 and GJA1 were both upregulated. It appeared as though the
sodium butyrate treatment mitigated the effects of ruminal pH depression and Claudin-1 and
GJA1 were able to maintain rumen epithelial integrity (Zhang et al., 2018).

38
Metabolic Genes
The rumen epithelium metabolic genes selected for investigation have a direct role in
SCFA metabolism, mTOR signaling, glucose and insulin homeostasis, or protein folding. There
are four enzymes involved in the pathway converting Acetyl-CoA molecules into beta-
hydroxybutyrate (BHB): acetoacetyl-CoA synthase (AACS), 3-hydroxy-3-methylglutaryl- CoA
synthase 12 (HMGCS2), 3-hydroxymethyl-3- methylglutaryl-CoA lyase (HMGCL), 3-
hydroxybutyrate dehydrogenase, type 1 (BDH1). The production of BHB is called ketogenesis
because BHB is a ketone body. Thus, the genes regulating this process are called ketogenic
genes. Additionally, AACS, HMGCS2, and HMGCL regulate enzymes involved in the
melanovate pathway, which produces isopentenyl pyrophosphate the precursor to all isoprenoids.
Despite the importance of isoprenoids, we will remain focused on how these genes regulate
acetate and butyrate metabolism and BHB production.
Acetoacetyl-CoA Synthase
Acetoacetyl-CoA synthase (AACS) is involved in acetate metabolism (Okamura et al.,
2010). Acetoacetyl-CoA synthase is part of the thiolase family, which regulate the conversion of
two acetyl-CoA molecules to acetoacetyl-CoA. Acetoacetyl-CoA synthase behaves similarly to a
thiolase, but helps convert acetoacetate (acetyl CoA and malonyl CoA) to acetoacetyl-CoA
rather than the conversion of 2 acetyl-CoA molecules. Naeem et al. (2012) found no significant
change in AACS expression during high protein calf starter, which could be due to the calf
having an immature rumen or the lack of BHB concentration changes.

39
3-Hydroxy-3-Methylglutaryl-CoA Synthase 2
3-Hydroxy-3-Methylglutaryl-CoA Synthase 2 (HMGCS2) is responsible for the
conversion of acetoacetyl-CoA to B-hydroxy-B-methylglutaryl-CoA (HMG-CoA). Naeem et al.,
(2012) found HMGCS2 to be the most abundant metabolic gene of the rumen epithelium in pre-
weaned calves. Naeem et al., (2012) believed HMGCS2 was upregulated as a coping mechanism
to make sure enough substrate (HMG-CoA) was available for BHB synthesis. Leighton et al.
(1983) reported similar results to Naeem et al., (2012) in mature sheep. However, it is possible
the mature bovine rumen epithelium will respond differently because of diet differences between
the two species, allocation of energy (meat vs wool vs milk production), and rumen development
management during pre-weaning.
3-hydroxy-3-methylglutaryl-CoA lyase
A lyase will catalyze a reaction by the formation of new double bond without hydrolysis.
3-hydroxy-3-methylglutaryl-CoA lyase (HMGCL) helps remove Acetyl-CoA from HMG-CoA
and forms a double bond with an oxygen to form acetoacetate (Naeem et al., 2012). Naeem et al.
(2012) found that when calves were fed a high protein starter in comparison to a control starter
there was an upregulation of HMGCL despite blood BHB remaining unchanged.
3-hydroxybutyrate dehydrogenase type 1
3-hydroxybutyrate dehydrogenase type 1 (BDH1), is the last gene regulating production
of BHB. BDH1 converts acetoacetate into BHB. Acetone is also produced from the breakdown
of acetoacetate into BHB, but that reaction is catalyzed by a different enzyme. Similar to
HMGCL results in Naeem et al. (2012), despite blood BHB concentrations being unaffected by
treatment, BDH1 was upregulated when a high protein starter was fed. Work by Naeem et al.
40
(2012) suggests that ketogenic genes present in the rumen epithelium will respond to high
protein dietary concentrations in calves, but this response may not be indicative of mature bovine
epithelium because the calves in Naeem et al. (2012) had an underdeveloped, immature rumen.
Serine-Threonine Protein Kinase
Serine-threonine protein kinase or protein kinase B (AKT1), is responsible for a number
of things, but plays a main role in mTOR signaling allowing for increased cell growth and
differentiation, and increased protein synthesis (Dienstmann et al., 2014). In both mice and fruit
flies, AKT1 was found to play a main role in insulin homeostasis. Protein kinase B isoforms are
activated in a similar manner to mTOR signaling through Phosphatidylinositol-4,5-bisphosphate
3-kinase (PI3K) and Phosphatidylinositol (3,4,5)-trisphosphate (PIP3). Phosphatidylinositol-4,5-
bisphosphate 3-kinase and PIP3 are activated by insulin or insulin-like growth factor (IGF-1)
(Hay, 2011). Downstream effects of AKT1 are isoforms of forkhead transcription factors
(FOXOs; Hay, 2011). When activated, FOXOs will inhibit pancreatic B-cell causing insulin to
not respond appropriately to changes in blood glucose (Hay, 2011). AKT1 inhibits FOXOs, so
insulin can respond appropriately.
Heat Shock Protein 70
The heat shock protein (HSP) family is classified as a protein chaperone. A chaperone is
responsible for the correct folding and unfolding of proteins. HSP function is particularly
apparent when newly synthesized proteins are starting to denature due to a stressed situation.
HSP70, specifically, is the most understood HSP (Mayer and Bukau, 2005). It has three primary
roles: to prevent aggregation of newly synthesized proteins, fixing aggregated proteins, and
completing folding of proteins (Mayer and Bukau, 2005). HSP70 is important to investigate in
41
the rumen epithelium because if diets cause downregulation of HSP70, then protein function
could be impaired.
Propionate Metabolism Genes
One thing to recognize about the previously discussed genes is none are involved in
propionate metabolism. This is logical because majority of propionate metabolism occurs in the
liver (Aschenbach et al., 2010), so genes regulating propionate metabolism would not be present
in the rumen epithelium. If any gene would relate to propionate, it would be the SCFA
transporters rather than a metabolic gene.
Background on Post-Absorptive System
The post-absorptive system can be described in two-fold. The first level is the digestive
tract venous complex that shuttles absorbed nutrients from the reticulo-rumen, omasum,
abomasum, small intestine, and large intestine to the liver, various muscles, peripheral tissues
and kidneys. The second level is the actual metabolism of nutrients at their respective locations.
Absorbed nutrients are viewed as substrates to different metabolic processes. For example,
propionate, absorbed from the rumen, is catabolized in the liver to produce glucose. Glucose is a
substrate for microbial fermentation in the rumen preempting liver gluconeogenesis (Zhang et
al., 2016).
Impact of Starch on Post-Absorptive System
The impact of starch on the post-absorptive system will occur indirectly through blood
metabolite concentration changes. Extending into the periphery, the blood metabolite profiles are
most likely going to change due to hepatic gluconeogenesis and overall liver metabolism (Zhang
et al., 2016). The type of substrate provided to liver metabolism also drives the relative losses in

42
the system. For example, lactate produces hepatic glucose with more loss (lower efficiency) than
propionate, which has very little carbon loss (Armentano, 1992).
Impact of Fiber on Post-Absorptive System
Like starch, fiber does not have a direct impact on the post-absorptive system, but
impacts it by producing different VFA. Ruminal fiber digestibility is thought to increase with
increased presence of BCVFA, and recent work by Beckett et al. (unpublished data; Chapter 3)
found significant connections between fiber source and an increase in BCVFA molar
proportions, concentrations, and fluxes. Branched-chain volatile fatty acids also interconvert into
branched-chain amino acids (BCAA) (Yang, 2002). Branched-chain amino acids are believed to
be helpful for muscle protein synthesis in humans (Wolfe, 2017), and are known to activate the
mTOR signaling pathway, increase glucose uptake, and maintain mammary gland health and
milk synthesis (Zhang et al., 2017). Both animal experiments and modeling work have centered
around optimizing BCAA utilization in the post-absorptive system to decrease losses (Hanigan et
al., 1997). Lastly, similar to the rumen, the post-absorptive system has metabolic adaptations
during adverse events such as, heat stress (Baumgard and Rhoads, 2013).
Conclusion
Nutrient disappearance has the potential to impact VFA dynamics and the rumen
environment directly, and can alter the post-absorptive metabolism indirectly. However, the
nature of ruminal and post-absorptive adaptations to changes in nutrient disappearance have not
been well-defined. From the work described, accurately quantifying rumen VFA dynamics,
rumen epithelial adaptations, and post-absorptive blood metabolite concentrations in response to
starch and fiber sources is needed to optimize digestive and feed efficiency.

43
References
Agricultural and Food Research Council. 1992. Nutritive Requirements of Ruminant Animal:
Protein. Pages 787–835 in Nutrition Abstracts and Reviews, Series B.
Alberts, B., A. Johnson, J. Lewis, P. Walter, M. Raff, and K. Roberts. 2002. Molecular Biology
of the Cell 4th Edition: International Student Edition.
Allen, M.S. 1997. Relationship between fermentation acid production in the rumen and the
requirement for physically effective fiber. J. Dairy Sci. 80:1447–1462.
http://dx.doi.org/10.3168/jds.S0022-0302(97)76074-0.
Altaner, C.M., L.H. Thomas, A.N. Fernandes, and M.C. Jarvis. 2014. How cellulose stretches:
synergism between covalent and hydrogen bonding. Biomacromolecules 15:791–798.
http://dx.doi.org/10.1021/bm401616n.
Alvarado, C., R. Anrique, S. Navarrete, and Others. 2009. Effect of including extruded, rolled or
ground corn in dairy cow diets based on direct cut grass silage. Chilean Journal of
Agriculture Research 69:356–365. http://dx.doi.org/10.4067/S0718-58392009000300008.
Armentano, L.E. 1992. Ruminant hepatic metabolism of volatile fatty acids, lactate and pyruvate.
J. Nutr. 122:838–842. http://dx.doi.org/10.1093/jn/122.suppl_3.838.
Ash, R.W., and A. Dobson. 1963. The effect of absorption on the acidity of rumen contents. J.
Physiol. 169:39–61.
Aschenbach, J.R., G.B. Penner, F. Stumpff, and G. Gäbel. 2011. Ruminant Nutrition
Symposium: Role of fermentation acid absorption in the regulation of ruminal pH. J.
Anim. Sci. 89:1092–1107. http://dx.doi.org/10.2527/jas.2010-3301.
Aschenbach, J.R., N.B. Kristensen, S.S. Donkin, H.M. Hammon, and G.B. Penner. 2010.
Gluconeogenesis in dairy cows: the secret of making sweet milk from sour dough.
IUBMB Life 62:869–877. http://dx.doi.org/10.1002/iub.400.
Aschenbach, J.R., S. Bilk, G. Tadesse, F. Stumpff, and G. Gäbel. 2009. Bicarbonate-dependent
and bicarbonate-independent mechanisms contribute to nondiffusive uptake of acetate in
the ruminal epithelium of sheep. Am. J. Physiol. Gastrointest. Liver Physiol. 296:G1098–
107. http://dx.doi.org/10.1152/ajpgi.90442.2008.
Baldwin, R.L. 1968. Estimation of Theoretical Calorific Relationships as a Teaching Technique.
A Review. J. Dairy Sci. 51:104–111. http://dx.doi.org/10.3168/jds.S0022-
0302(68)86928-0.
Baldwin, R.L., 6th, and E.E. Connor. 2017. Rumen Function and Development. Vet. Clin. North
Am. Food Anim. Pract. 33:427–439. http://dx.doi.org/10.1016/j.cvfa.2017.06.001.

44
Baumgard, L.H., and R.P. Rhoads Jr. 2013. Effects of heat stress on postabsorptive metabolism
and energetics. Annu Rev Anim Biosci 1:311–337. http://dx.doi.org/10.1146/annurev-
animal-031412-103644.
Beauchemin, K.A. 1991. Ingestion and mastication of feed by dairy cattle. Vet. Clin. North Am.
Food Anim. Pract. 7:439–463. http://dx.doi.org/10.1016/S0749-0720(15)30794-5.
Bergman, E.N. 1990. Energy contributions of volatile fatty acids from the gastrointestinal tract in
various species. Physiol. Rev. 70:567–590. Doi: 10.1152/physrev.1990.70.2.567.
Bugaut, M. 1987. Occurrence, absorption and metabolism of short chain fatty acids in the
digestive tract of mammals. Comp. Biochem. Physiol. B 86:439–472.
http://dx.doi.org/10.1016/0305-0491(87)90433-0.
Buxton, D.R., and D.D. Redfearn. 1997. Plant limitations to fiber digestion and utilization. J.
Nutr. 127:814S–818S. Doi: 10.1093/jn/127.5.814S.
Capper, J.L., and D.E. Bauman. 2013. The role of productivity in improving the environmental
sustainability of ruminant production systems. Annu Rev Anim Biosci 1:469–489.
http://dx.doi.org/10.1146/annurev-animal-031412-103727.
Casper, D.P., H.A. Maiga, M.J. Brouk, and D.J. Schingoethe. 1999. Synchronization of
carbohydrate and protein sources on fermentation and passage rates in dairy cows. J.
Dairy Sci. 82:1779–1790. http://dx.doi.org/10.3168/jds.S0022-0302(99)75408-1.
Chalupa, W. 1975. Rumen bypass and protection of proteins and amino acids. J. Dairy Sci.
58:1198–1218. http://dx.doi.org/10.3168/jds.S0022-0302(75)84697-2.
Chatterton, N.J., P.A. Harrison, J.H. Bennett, and K.H. Asay. 1989. Carbohydrate Partitioning in
185 Accessions of Gramineae Grown Under Warm and Cool Temperatures. J. Plant
Physiol. 134:169–179. http://dx.doi.org/10.1016/S0176-1617(89)80051-3.
Chesson, A. 1993. Mechanistic Models of Forage Cell Wall Degradation. American Society of
Agronomy, Crop Science Society of America, Soil Science Society of America, Madison,
WI. http://dx.doi.org/10.2134/1993.foragecellwall.c14.
Clark, P.W., and L.E. Armentano. 1993. Effectiveness of Neutral Detergent Fiber in Whole
Cottonseed and Dried Distillers Grains Compared with Alfalfa Haylage1. J. Dairy Sci.
76:2644–2650. http://dx.doi.org/10.3168/jds.S0022-0302(93)77600-6.
Conte, G., R. Ciampolini, M. Cassandro, E. Lasagna, L. Calamari, U. Bernabucci, and F. Abeni.
2018. Feeding and nutrition management of heat-stressed dairy ruminants. Ital. J. Anim.
Sci. 17:604–620. http://dx.doi.org/10.1080/1828051X.2017.1404944.

45
Del Bianco Benedeti, P., B. de C. Silva, M.V.C. Pacheco, N.V.L. Serão, I. Carvalho Filho, M.M.
Lopes, M.I. Marcondes, H.C. Mantovani, S. de C. Valadares Filho, E. Detmann, and M.
de S. Duarte. 2018. Effects of grain processing methods on the expression of genes
involved in volatile fatty acid transport and pH regulation, and keratinization in rumen
epithelium of beef cattle. PLoS One 13:e0198963.
http://dx.doi.org/10.1371/journal.pone.0198963.
Dewhurst, R.J., D.R. Davies, and R.J. Merry. 2000. Microbial protein supply from the rumen.
Anim. Feed Sci. Technol. 85:1–21. http://dx.doi.org/10.1016/S0377-8401(00)00139-5.
Dienstmann, R., J. Rodon, V. Serra, and J. Tabernero. 2014. Picking the point of inhibition: a
comparative review of PI3K/AKT/mTOR pathway inhibitors. Mol. Cancer Ther.
13:1021–1031. http://dx.doi.org/10.1158/1535-7163.MCT-13-0639.
Dijkstra, J. 1994. Production and absorption of volatile fatty acids in the rumen. Livestock
Production Science 39:61–69. http://dx.doi.org/10.1016/0301-6226(94)90154-6.
Dijkstra, J., J.L. Ellis, E. Kebreab, A.B. Strathe, S. López, J. France, and A. Bannink. 2012.
Ruminal pH regulation and nutritional consequences of low pH. Anim. Feed Sci.
Technol. 172:22–33. http://dx.doi.org/10.1016/j.anifeedsci.2011.12.005.
Dijkstra, J., J.M. Forbes, and J. France. 2005. Quantitative Aspects of Ruminant Digestion and
Metabolism. CABI, Wallingford, Oxfordshire, England.
Dobson, M.J., W.C. Brown, A. Dobson, and A.T. Phillipson. 1956. A histological study of the
organization of the rumen epithelium of sheep. Q. J. Exp. Physiol. Cogn. Med. Sci.
41:247–253. http://dx.doi.org/10.1113/expphysiol.1956.sp001186.
Dozier, W.A., K.C. Behnke, C.K. Gehring, and S.L. Branton. 2010. Effects of feed form on
growth performance and processing yields of broiler chickens during a 42-day production
period. J. Appl. Poult. Res. 19:219–226. http://dx.doi.org/10.3382/japr.2010-00156.
Ehle, F.R. 1984. Influence of Feed Particle Density on Paniculate Passage from Rumen of
Holstein Cow. J. Dairy Sci. 67:693–697. http://dx.doi.org/10.3168/jds.S0022-
0302(84)81354-5.
Elhamd, A.A., M.F. Elbab. 2017. Histology: Systematic Veterinary Histology. LAP Lambert
Academic Publishing, Mauritius.
Elsden, S.R., M.W.S. Hitchcock, and R.A. Marshall. 1946. Volatile acids in the digesta of
ruminants and other animals. Unit of Animal Psychology: Cambridge.
Erasmus, L.J., P.M. Botha, C.W. Cruywagen, and H.H. Meissner. 1994. Amino acid profile and
intestinal digestibility in dairy cows of rumen-undegradable protein from various
feedstuffs1. J. Dairy Sci. 77:541–551. http://dx.doi.org/10.3168/jds.S0022-
0302(94)76982-4.

46
Faichney, G.J. 1968. Volatile fatty acids in the caecum of the sheep. Aust. J. Biol. Sci. 21:177–
180. http://dx.doi.org/10.1071/BI9680177.
Firkins, J.L. 2002. Optimizing rumen fermentation. Pages 39–53 in Tri-State Dairy Nutr. Conf.
Fort Wayne, IN.
Firkins, J.L., M.L. Eastridge, N.R. St-Pierre, and S.M. Noftsger. 2001. Effects of grain
variability and processing on starch utilization by lactating dairy cattle. J. Anim. Sci.
79:E218–E238. http://dx.doi.org/10.2527/jas2001.79E-SupplE218x.
Fleming, S.E., and D.S. Arce. 1986. Volatile fatty acids: their production, absorption, utilization,
and roles in human health. Clin. Gastroenterol. 15:787–814.
Food, and A. Organization. 1996. Rome Declaration on World Food Security and World Food
Summit Plan of Action: World Food Summit 13-17 November 1996, Rome, Italy. FAO.
Gäbel, G., and H. Martens. 1991. 7 - Transport of Na+ and Cl− across the Forestomach
Epithelium: Mechanisms and Interactions with Short-Chain Fatty Acids. T. Tsuda, Y.
Sasaki, and R. Kawashima, ed. Academic Press, San Diego.
http://dx.doi.org/10.1016/B978-0-12-702290-1.50014-X.
Gäbel, G., H. Martens, M. Sündermann, and P. Galfi. 1987. The effect of diet, intraruminal pH
and osmolarity on sodium, chloride and magnesium absorption from the temporarily
isolated and washed reticulo-rumen of sheep. Quarterly Journal of Experimental
Physiology: Translation and Integration 72:501–511.
http://dx.doi.org/10.1113/expphysiol.1987.sp003092.
Gerber, P.J., H. Steinfeld, B. Henderson, A. Mottet, C. Opio, J. Dijkman, A. Falcucci, G.
Tempio, and Others. 2013. Tackling Climate Change through Livestock: A Global
Assessment of Emissions and Mitigation Opportunities. Food and Agriculture
Organization of the United Nations (FAO), Rome, Italy.
Ghimire, S., R.A. Kohn, P. Gregorini, R.R. White, and M.D. Hanigan. 2017. Representing
interconversions among volatile fatty acids in the Molly cow model. J. Dairy Sci.
100:3658–3671. http://dx.doi.org/10.3168/jds.2016-11858.
Gleason, C.B., and R.R. White. 2018. Variation in animal performance explained by the rumen
microbiome or by diet composition. J. Anim. Sci. 96:4658–4673.
http://dx.doi.org/10.1093/jas/sky332.
Goeser, J.P. 2008. Improvement of Rumen in Vitro NDF Digestibility Techniques and Data
Analysis. University of Wisconsin--Madison.
Goodall, E.D., and R.N. Kay. 1965. Digestion and absorption in the large intestine of the sheep.
J. Physiol. 176:12–23. http://dx.doi.org/10.1113/jphysiol.1965.sp007531.
47
Govil, K., D.S. Yadav, A.K. Patil, S. Nayak, R.S. Baghel, P.K. Yadav, C.D. Malapure, and D.
Thakur. 2017. Feeding management for early rumen development in calves. J. Entomol.
Zool. Stud. 5:1132. http://dx.doi.org/10.22271/j.ento.
Graham, C., I. Gatherar, I. Haslam, M. Glanville, and N.L. Simmons. 2007. Expression and
localization of monocarboxylate transporters and sodium/proton exchangers in bovine
rumen epithelium. Am. J. Physiol. Regul. Integr. Comp. Physiol. 292:R997–1007.
http://dx.doi.org/10.1152/ajpregu.00343.2006.
Hackmann, T.J., and J.L. Firkins. 2015. Maximizing efficiency of rumen microbial protein
production. Front. Microbiol. 6:465. http://dx.doi.org/10.3389/fmicb.2015.00465.
Hackmann, T.J., J.D. Sampson, and J.N. Spain. 2010. Variability in in situ ruminal degradation
parameters causes imprecision in estimated ruminal digestibility. J. Dairy Sci. 93:1074–
1085. http://dx.doi.org/10.3168/jds.2008-1958.
Hall, M.B., T.D. Nennich, P.H. Doane, and G.E. Brink. 2015. Total volatile fatty acid
concentrations are unreliable estimators of treatment effects on ruminal fermentation in
vivo. J. Dairy Sci. 98:3988–3999. http://dx.doi.org/10.3168/jds.2014-8854.
Harmon, D.L., and Others. 2009. Understanding starch utilization in the small intestine of cattle.
Asian-Aust. J. Anim. Sci. 22:915–922. http://dx.doi.org/10.5713/ajas.2009.r.08.
Hanigan, M.D., J. Dijkstra, W.J. Gerrits, and J. France. 1997. Modelling post-absorptive protein
and amino acid metabolism in the ruminant. Proc. Nutr. Soc. 56:631–643.
http://dx.doi.org/10.1079/PNS19970063.
Hay, N. 2011. Akt isoforms and glucose homeostasis - the leptin connection. Trends Endocrinol.
Metab. 22:66–73. http://dx.doi.org/10.1016/j.tem.2010.09.003.
Hook, S.E., M.A. Steele, K.S. Northwood, J. Dijkstra, J. France, A.-D.G. Wright, and B.W.
McBride. 2011. Impact of subacute ruminal acidosis (SARA) adaptation and recovery on
the density and diversity of bacteria in the rumen of dairy cows. FEMS Microbiol. Ecol.
78:275–284. http://dx.doi.org/10.1111/j.1574-6941.2011.01154.x.
Houpt, T.R., and K.A. Houpt. 1968. Transfer of urea nitrogen across the rumen wall. Am. J.
Physiol. 214:1296–1303. http://dx.doi.org/10.1152/ajplegacy.1968.214.6.1296.
Huhtanen, P., S. Ahvenjärvi, G.A. Broderick, S.M. Reynal, and K.J. Shingfield. 2010.
Quantifying ruminal digestion of organic matter and neutral detergent fiber using the
omasal sampling technique in cattle—A meta-analysis1. J. Dairy Sci. 93:3203–3215.
http://dx.doi.org/10.3168/jds.2009-2988.
Jung, H.J. 1997. Analysis of forage fiber and cell walls in ruminant nutrition. J. Nutr. 127:810S–
813S. http://dx.doi.org/10.1093/jn/127.5.810S.

48
Khafipour, E., D.O. Krause, and J.C. Plaizier. 2009. A grain-based subacute ruminal acidosis
challenge causes translocation of lipopolysaccharide and triggers inflammation. J. Dairy
Sci. 92:1060–1070. http://dx.doi.org/10.3168/jds.2008-1389.
Kozloski, G.V., C.M. Stefanello, F.R. Mesquita, T.P. Alves, H.M.N. Ribeiro Filho, J.G.R.
Almeida, and T.C. Moraes Genro. 2014. Technical note: Evaluation of markers for
estimating duodenal digesta flow and ruminal digestibility: Acid detergent fiber, sulfuric
acid detergent lignin, and n-alkanes. J. Dairy Sci. 97:1730–1735.
http://dx.doi.org/10.3168/jds.2013-7414.
Kuhn, N.O., and J.H. Thompson. 1965. Ultrastructure of the rumen epithelium of the goat (Capra
Hircus). Chemical Research and Development labs, Edgewood Arsenal, MD.
Kvidera, S.K., M.J. Dickson, M. Abuajamieh, D.B. Snider, M.V.S. Fernandez, J.S. Johnson, A.F.
Keating, P.J. Gorden, H.B. Green, K.M. Schoenberg, and L.H. Baumgard. 2017.
Intentionally induced intestinal barrier dysfunction causes inflammation, affects
metabolism, and reduces productivity in lactating Holstein cows. J. Dairy Sci. 100:4113–
4127. http://dx.doi.org/10.3168/jds.2016-12349.
Laarman, A.H., L. Dionissopoulos, O. AlZahal, S.L. Greenwood, M.A. Steele, and B.W.
McBride. 2013. Butyrate and Subacute Ruminal Acidosis Affect Abundance of
Membrane Proteins Involved with Proton and Short Chain Fatty Acid Transport in the
Rumen Epithelium of Dairy Cows. Am J Anim Vet Sci. 8:220–229.
http://dx.doi.org/10.3844/ajavssp.2013.220.229
Laarman, A.H., R.-L.A. Pederzolli, K.M. Wood, G.B. Penner, and B.W. McBride. 2016. Effects
of subacute ruminal acidosis and low feed intake on short-chain fatty acid transporters
and flux pathways in Holstein steers. J. Anim. Sci. 94:3729–3737.
http://dx.doi.org/10.2527/jas.2016-0638.
Lafiandra, D., G. Riccardi, and P.R. Shewry. 2014. Improving cereal grain carbohydrates for diet
and health. J. Cereal Sci. 59:312–326. http://dx.doi.org/10.1016/j.jcs.2014.01.001.
Lane, M.A., R.L. Baldwin 6th, and B.W. Jesse. 2000. Sheep rumen metabolic development in
response to age and dietary treatments. J. Anim. Sci. 78:1990–1996.
http://dx.doi.org/10.2527/2000.7871990x.
Lapierre, H., and G.E. Lobley. 2001. Nitrogen Recycling in the Ruminant: A Review. J. Dairy
Sci. 84:E223–E236. http://dx.doi.org/10.3168/jds.S0022-0302(01)70222-6.
Larsen, C.S. 2003. Animal source foods and human health during evolution. J. Nutr. 133:3893S–
3897S. http://dx.doi.org/10.1093/jn/133.11.3893S.
Liebe, D.M., J.L. Firkins, H. Tran, P.J. Kononoff, and R.R. White. 2018. Technical note:
Methodological and feed factors affecting measurement of protein A, B, and C fractions,

49
degradation rate, and intestinal digestibility of rumen-undegraded protein. J. Dairy Sci.
101:8046–8053. http://dx.doi.org/10.3168/jds.2018-14837.
Lu, Z., L. Yao, Z. Jiang, J.R. Aschenbach, H. Martens, and Z. Shen. 2016. Acidic pH and short-
chain fatty acids activate Na+ transport but differentially modulate expression of Na+/H+
exchanger isoforms 1, 2, and 3 in omasal epithelium. J. Dairy Sci. 99:733–745.
http://dx.doi.org/10.3168/jds.2015-9605.
Lynd, L.R., P.J. Weimer, W.H. van Zyl, and I.S. Pretorius. 2002. Microbial cellulose utilization:
fundamentals and biotechnology. Microbiol. Mol. Biol. Rev. 66:506–77.
http://dx.doi.org/10.1128/MMBR.66.3.506-577.2002.
Markantonatos, X., M.H. Green, and G.A. Varga. 2008. Use of compartmental analysis to study
ruminal volatile fatty acid metabolism under steady state conditions in Holstein heifers.
Anim. Feed Sci. Technol. 143:70–88. http://dx.doi.org/10.1016/j.anifeedsci.2007.05.005.
Matassa, S., N. Boon, I. Pikaar, and W. Verstraete. 2016. Microbial protein: future sustainable
food supply route with low environmental footprint. Microb. Biotechnol. 9:568–575.
http://dx.doi.org/10.1111/1751-7915.12369.
Mayer, M.P., and B. Bukau. 2005. Hsp70 chaperones: cellular functions and molecular
mechanism. Cell. Mol. Life Sci. 62:670–684. http://dx.doi.org/10.1007/s00018-004-
4464-6.
McAllister, T.A., H.D. Bae, G.A. Jones, and K.J. Cheng. 1994. Microbial attachment and feed
digestion in the rumen. J. Anim. Sci. 72:3004–3018.
http://dx.doi.org/10.2527/1994.72113004x.
McDonald, P., J.F.D. Greenhalgh, C.A. Morgan, R. Edwards, L. Sinclair. 2011. Animal
Nutrition. Pearson Higher Ed, New York, NY.
Minson, D. 2012. Forage in Ruminant Nutrition. Elsevier, Amsterdam, Netherlands.
Mertens, D.R. 1994. Regulation of Forage Intake Chapter. Forage Quality, Evaluation, and
Utilization. American Society of Agronomy, Crop Science Society of America, Soil
Science Society of America, Madison, WI.
Mertens, D.R. 1997. Creating a system for meeting the fiber requirements of dairy cows. J. Dairy
Sci. 80:1463–1481. http://dx.doi.org/10.3168/jds.S0022-0302(97)76075-2.
Mertens, D.R., and L.O. Ely. 1979. A dynamic model of fiber digestion and passage in the
ruminant for evaluating forage quality. J. Anim. Sci. 49:1085–1095.
http://dx.doi.org/10.2527/jas1979.4941085x.
Moore, K.J., and H.-J.G. Jung. 2001. Lignin and Fiber Digestion. J. Range Manage. 54:420–430.
http://dx.doi.org/10.2307/4003113.

50
Moran, J. 2005. Tropical Dairy Farming: Feeding Management for Small Holder Dairy Farmers
in the Humid Tropics. Csiro Publishing, Clayton, Victoria, Australia.
Mould, F.L., and E.R. Ørskov. 1983. Manipulation of rumen fluid pH and its influence on
cellulolysis in sacco, dry matter degradation and the rumen microflora of sheep offered
either hay or concentrate. Anim. Feed Sci. Technol. 10:1–14.
http://dx.doi.org/10.1016/0377-8401(83)90002-0.
Mowrey, A., M.R. Ellersieck, and J.N. Spain. 1999. Effect of fibrous by-products on production
and ruminal fermentation in lactating dairy cows. J. Dairy Sci. 82:2709–2715.
http://dx.doi.org/10.3168/jds.S0022-0302(99)75527-X.
Mrázek, J., K. Tepsic, G. Avgustin, and J. Kopecný. 2006. Diet-dependent shifts in ruminal
butyrate-producing bacteria. Folia Microbiol. 51:294–298.
http://dx.doi.org/10.1007/BF02931817.
Muck, R.E. 1982. Urease Activity in Bovine Feces. J. Dairy Sci. 65:2157–2163.
http://dx.doi.org/10.3168/jds.S0022-0302(82)82475-2.
Murphy, M.R., R.L. Baldwin, and L.J. Koong. 1982. Estimation of stoichiometric parameters for
rumen fermentation of roughage and concentrate diets. J. Anim. Sci. 55:411–421.
http://dx.doi.org/10.2527/jas1982.552411x.
Naeem, A., J.K. Drackley, J. Stamey, and J.J. Loor. 2012. Role of metabolic and cellular
proliferation genes in ruminal development in response to enhanced plane of nutrition in
neonatal Holstein calves1. J. Dairy Sci. 95:1807–18208.
http://dx.doi.org/10.3168/jds.2011-4709.
National Research Council, Division on Earth and Life Studies, Board on Agriculture and
Natural Resources, Committee on Animal Nutrition, and Subcommittee on Dairy Cattle
Nutrition. 2001. Nutrient Requirements of Dairy Cattle: Seventh Revised Edition, 2001.
National Academies Press.
Nelson, C.J., D.D. Redfearn, and J.H. Cherney. 2012. Chapter 4: Forage Harvest Management.
Conservation Outcomes from Pastureland and Hayland Practices: assessment,
recommendations, and knowledge gaps. NRCS-USDA, Beltsville, MD.
Niwińska, B. 2012. Digestion in Ruminants Book Chapter. Carbohydrates-Comprehensive
Studies on Glycobiology and Glycotechnology. InTech, London, United Kingdom.
http://dx.doi.org/10.5772/51574.
Nocek, J.E. 1988. In situ and Other Methods to Estimate Ruminal Protein and Energy
Digestibility: A Review. J. Dairy Sci. 71:2051–2069.
http://dx.doi.org/10.3168/jds.S0022-0302(88)79781-7.

51
Nocek, J.E. 1997. Bovine acidosis: implications on laminitis. J. Dairy Sci. 80:1005–1028.
http://dx.doi.org/10.3168/jds.S0022-0302(97)76026-0.
Okamura, E., T. Tomita, R. Sawa, M. Nishiyama, and T. Kuzuyama. 2010. Unprecedented
acetoacetyl-coenzyme A synthesizing enzyme of the thiolase superfamily involved in the
mevalonate pathway. Proc. Natl. Acad. Sci. U. S. A. 107:11265–11270.
http://dx.doi.org/10.1073/pnas.1000532107.
Orlowski, J., and S. Grinstein. 2004. Diversity of the mammalian sodium/proton exchanger
SLC9 gene family. Pflugers Arch-Eur J Physiol. 447:549–565.
http://dx.doi.org/10.1007/s00424-003-1110-3.
Osbourn, D.F., R.A. Terry, M.C. Spooner, and R.M. Tetlow. 1981. Use of processing to explore
the factors affecting the digestion of forage cell walls. Anim. Feed Sci. Technol. 6:387–
403. http://dx.doi.org/10.1016/0377-8401(81)90017-1.
Owens, F.N., D.S. Secrist, W.J. Hill, and D.R. Gill. 1998. Acidosis in cattle: a review. J. Anim.
Sci. 76:275–286. http://dx.doi.org/10.2527/1998.761275x.
Paillard, D., N. McKain, L.C. Chaudhary, N.D. Walker, F. Pizette, I. Koppova, N.R. McEwan, J.
Kopecný, P.E. Vercoe, P. Louis, and R.J. Wallace. 2007. Relation between phylogenetic
position, lipid metabolism and butyrate production by different Butyrivibrio-like bacteria
from the rumen. Antonie Van Leeuwenhoek 91:417–422.
http://dx.doi.org/10.1007/s10482-006-9121-7.
Patton, R.A., J.R. Patton, and S.E. Boucher. 2012. Defining ruminal and total-tract starch
degradation for adult dairy cattle using in vivo data. J. Dairy Sci. 95:765–782.
http://dx.doi.org/10.3168/jds,2011-4183.
Penner, G.B., J.R. Aschenbach, G. Gäbel, R. Rackwitz, and M. Oba. 2009a. Epithelial capacity
for apical uptake of short chain fatty acids is a key determinant for intraruminal pH and
the susceptibility to subacute ruminal acidosis in sheep. J. Nutr. 139:1714–1720.
http://dx.doi.org/10.3945/jn.109.108506.
Pérez, J., J. Muñoz-Dorado, T. de la Rubia, and J. Martínez. 2002. Biodegradation and biological
treatments of cellulose, hemicellulose and lignin: an overview. Int. Microbiol. 5:53–63.
http://dx.doi.org/10.1007/s10123-002-0062-3.
Rémond, D., I. Ortigues, and J.P. Jouany. 1995. Energy substrates for the rumen epithelium.
Proc. Nutr. Soc. 54:95–105. http://dx.doi.org/10.1079/PNS19950040.
Sarwar, M., J.L. Firkins, and M.L. Eastridge. 1991. Effect of Replacing Neutral Detergent Fiber
of Forage with Soyhulls and Corn Gluten Feed for Dairy Heifers. J. Dairy Sci. 74:1006–
1017. http://dx.doi.org/10.3168/jds.S0022-0302(91)78250-7.

52
Savari, M., M. Khorvash, H. Amanlou, G.R. Ghorbani, E. Ghasemi, and M. Mirzaei. 2018.
Effects of rumen-degradable protein:rumen-undegradable protein ratio and corn
processing on production performance, nitrogen efficiency, and feeding behavior of
Holstein dairy cows. J. Dairy Sci. 101:1111–1122. http://dx.doi.org/10.3168/jds.2017-
12776.
Schurmann, B.L. 2013. Functional adaptation of the rumen epithelium. M. Sc. Thesis. University
of Saskatchewan, Saskatoon, SK, Canada,.
Siciliano-Jones, J., and M.R. Murphy. 1989. Production of Volatile Fatty Acids in the Rumen
and Cecum-Colon of Steers as Affected by Forage: Concentrate and Forage Physical
Form1. J. Dairy Sci. 72:485–492. http://dx.doi.org/10.3168/jds.S0022-0302(89)79130-X.
Seal, C.J., and D.S. Parker. 1994. Effect of intraruminal propionic acid infusion on metabolism
of mesenteric- and portal-drained viscera in growing steers fed a forage diet: I. Volatile
fatty acids, glucose, and lactate. J. Anim. Sci. 72:1325–1334.
http://dx.doi.org/10.2527/1994.7251325x.
Sejrsen, K., T. Hvelplund, and M.O. Nielsen. 2006. Ruminant Physiology: Digestion,
Metabolism and Impact of Nutrition on Gene Expression, Immunology and Stress.
Wageningen Academic Pub, Wapeningen, Gelderland, Netherlands.
Shaver, R.D., L.D. Satter, and N.A. Jorgensen. 1988. Impact of forage fiber content on digestion
and digesta passage in lactating dairy cows. J. Dairy Sci. 71:1556–1565.
http://dx.doi.org/10.3168/jds.S0022-0302(88)79719-2.
Steele, M.A., J. Croom, M. Kahler, O. AlZahal, S.E. Hook, K. Plaizier, and B.W. McBride.
2011. Bovine rumen epithelium undergoes rapid structural adaptations during grain-
induced subacute ruminal acidosis. Am. J. Physiol. Regul. Integr. Comp. Physiol.
300:R1515–23. http://dx.doi.org/10.1152/ajpregu.00120.2010.
Steele, M.A., L. Dionissopoulos, O. AlZahal, J. Doelman, and B.W. McBride. 2012. Rumen
epithelial adaptation to ruminal acidosis in lactating cattle involves the coordinated
expression of insulin-like growth factor-binding proteins and a cholesterolgenic enzyme.
J. Dairy Sci. 95:318–327. http://dx.doi.org/10.3168/jds.2011-4465.
Steele, M.A., C. Schiestel, O. AlZahal, L. Dionissopoulos, A.H. Laarman, J.C. Matthews, and
B.W. McBride. 2015. The periparturient period is associated with structural and
transcriptomic adaptations of rumen papillae in dairy cattle. J. Dairy Sci. 98:2583–2595.
http://dx.doi.org/10.3168/jds.2014-8640.
Steven, D. H.& Marshall, A. B. 1969. Organization of the rumen epithelium. In: Physiology of
Digestion and Metabolism in the Ruminant (Phillipson, A. T. ed.), pp. 80–100. Oriel
Press, Newcastle-upon-Tyne, United Kingdom.

53
Stone, W.C. 2004. Nutritional Approaches to Minimize Subacute Ruminal Acidosis and
Laminitis in Dairy Cattle. J. Dairy Sci. 87:E13–E26. http://dx.doi.org/10.3168/jds.S0022-
0302(04)70057-0.
Storm, A.C., and N.B. Kristensen. 2010. Effects of particle size and dry matter content of a total
mixed ration on intraruminal equilibration and net portal flux of volatile fatty acids in
lactating dairy cows. J. Dairy Sci. 93:4223–4238. http://dx.doi.org/10.3168/jds.2009-
3002.
Storm, A.C., and N.B. Kristensen. 2011. Erratum to “Effects of particle size and dry matter
content of a total mixed ration on intraruminal equilibration and net portal flux of volatile
fatty acids in lactating dairy cows” (J. Dairy Sci. 93:4223–4238). J. Dairy Sci. 94:532–
535. http://dx.doi.org/10.3168/jds.2011-94-1-532.
Storm, A.C., N.B. Kristensen, and M.D. Hanigan. 2012. A model of ruminal volatile fatty acid
absorption kinetics and rumen epithelial blood flow in lactating Holstein cows. J. Dairy
Sci. 95:2919–2934. http://dx.doi.org/10.3168/jds.2011-4239.
Storm, E., E.R. Orskov, and R. Smart. 1983. The nutritive value of rumen micro-organisms in
ruminants. 2. The apparent digestibility and net utilization of microbial N for growing
lambs. Br. J. Nutr. 50:471–478. http://dx.doi.org/10.1079/BJN19830115.
Svihus, B., A.K. Uhlen, and O.M. Harstad. 2005. Effect of starch granule structure, associated
components and processing on nutritive value of cereal starch: A review. Anim. Feed Sci.
Technol. 122:303–320. http://dx.doi.org/10.1016/j.anifeedsci.2005.02.025.
Theurer, C.B. 1986. Grain processing effects on starch utilization by ruminants. J. Anim. Sci.
63:1649–1662. http://dx.doi.org/10.2527/jas1986.6351649x.
Thornton, P.K. 2010. Livestock production: recent trends, future prospects. Philos. Trans. R.
Soc. Lond. B Biol. Sci. 365:2853–2867. http://dx.doi.org/10.1098/rstb.2010.0134.
Varga, G.A., and W.H. Hoover. 1983. Rate and Extent of Neutral Detergent Fiber Degradation
of Feedstuffs in Situ. J. Dairy Sci. 66:2109–2115. http://dx.doi.org/10.3168/jds.S0022-
0302(83)82057-8.
Varga, G.A., and E.S. Kolver. 1997. Microbial and animal limitations to fiber digestion and
utilization. J. Nutr. 127:819S–823S. http://dx.doi.org/10.1093/jn/127.5.819S.
Van Soest, P. J. 1967. Development of a comprehensive system of feed analyses and its
application to forages. J. Anim. Sci. 26:119-128.
http://dx.doi.org/10.2527/jas1967.261119x.

54
Van Soest, P.J., J.B. Robertson, and B.A. Lewis. 1991. Methods for dietary fiber, neutral
detergent fiber, and nonstarch polysaccharides in relation to animal nutrition. J. Dairy
Sci. 74:3583–3597. http://dx.doi.org/10.3168/jds.S0022-0302(91)78551-2.
Weimer, P.J., G.C. Waghorn, C.L. Odt, and D.R. Mertens. 1999. Effect of Diet on Populations of
Three Species of Ruminal Cellulolytic Bacteria in Lactating Dairy Cows. J. Dairy Sci.
82:122–134. http://dx.doi.org/10.3168/jds.S0022-0302(99)75216-1.
White, R.R., and M.B. Hall. 2017. Nutritional and greenhouse gas impacts of removing animals
from US agriculture. Proc. Natl. Acad. Sci. U. S. A. 114:E10301–E10308.
http://dx.doi.org/10.1073/pnas.1707322114.
Wilkinson, D.J. 2018. Historical and contemporary stable isotope tracer approaches to studying
mammalian protein metabolism. Mass Spectrom. Rev. 37:57–80.
http://dx.doi.org/10.1002/mas.21507.
Wolfe, R.R. 2017. Branched-chain amino acids and muscle protein synthesis in humans: myth or
reality?. J. Int. Soc. Sports Nutr. 14:30. http://dx.doi.org/10.1186/s12970-017-0184-9.
Xu, S., and J.H. Harrison. 1996. Characteristics of the rate and extent of fiber degradability of
feedstuffs common to the Pacific Northwest. The Professional Animal Scientist 12:215–
222. http://dx.doi.org/10.15232/S1080-7446(15)32527-4.
Yang, C.M. 2002. Response of forage fiber degradation by ruminal microorganisms to branched-
chain volatile fatty acids, amino acids, and dipeptides. J. Dairy Sci. 85:1183–1190.
http://dx.doi.org/10.3168/jds.S0022-0302(02)74181-7.
Yang, W., Z. Shen, and H. Martens. 2012. An energy-rich diet enhances expression of
Na(+)/H(+) exchanger isoform 1 and 3 messenger RNA in rumen epithelium of goat. J.
Anim. Sci. 90:307–317. http://dx.doi.org/10.2527/jas.2011-3854.
Yohe, T.T. Unpublished data. Nutritional impacts on rumen growth and development.
Yu, P., J.T. Huber, F.A. Santos, J.M. Simas, and C.B. Theurer. 1998. Effects of ground, steam-
flaked, and steam-rolled corn grains on performance of lactating cows. J. Dairy Sci.
81:777–783. http://dx.doi.org/10.3168/jds.S0022-0302(98)75634-6.
Zebeli, Q., J.R. Aschenbach, M. Tafaj, J. Boguhn, B.N. Ametaj, and W. Drochner. 2012. Invited
review: Role of physically effective fiber and estimation of dietary fiber adequacy in high-
producing dairy cattle. J. Dairy Sci. 95:1041–1056. http://dx.doi.org/10.3168/jds.2011-
4421.
Zhang, K., M. Meng, L. Gao, Y. Tu, and Y. Bai. 2018. Sodium Butyrate Improves High-
Concentrate-Diet-Induced Impairment of Ruminal Epithelium Barrier Function in Goats.
J. Agric. Food Chem. 66:8729–8736. http://dx.doi.org/10.1021/acs.jafc.8b03108.

55
Zhang, Q., S.L. Koser, and S.S. Donkin. 2016. Propionate induces mRNA expression of
gluconeogenic genes in bovine calf hepatocytes. J. Dairy Sci. 99:3908–3915.
http://dx.doi.org/10.3168/jds.2015-10312.
Zhang, S., X. Zeng, M. Ren, X. Mao, and S. Qiao. 2017. Novel metabolic and physiological
functions of branched chain amino acids: a review. J. Anim. Sci. Biotechnol. 8:10.
http://dx.doi.org/10.1186/s40104-016-0139-z.
Zhao, C., G. Liu, X. Li, Y. Guan, Y. Wang, X. Yuan, G. Sun, Z. Wang, and X. Li. 2018.
Inflammatory mechanism of Rumenitis in dairy cows with subacute ruminal acidosis.
BMC Vet. Res. 14:135. http://dx.doi.org/10.1186/s12917-018-1463-7.
Figures

56
Figure 1.1: Visual description of different ruminal degradation rates. Degradation rate is
equivalent to the slope (i.e. rate of change) of a line. Different degradation rates will demonstrate
different slopes, but may have the same extent of degradation as exhibited in this figure.

57
Figure 1.2: Visual representation of different extents of ruminal degradation. Feedstuffs with
different extents of degradation, but not different degradation rates, will have the same slope.
Different extents of degradation will have different ending “y” values representing different dry
matter percentage degraded.

58
Tables
Table 1.1: Calculated ATP conversion efficiencies for glucose, acetate, propionate, and butyrate
as presented by Baldwin (1968).
Metabolite Hc1 (kcal) ATP2 (kcal) Efficiency3
Glucose 686 304 44%
Acetate 209 80 38%
Propionate 367 144 39%
Butyrate 523 216 41% 1Hc: Heat of combustion for each metabolite measured in kilocalories. 2ATP: Amount of ATP produced by each metabolite measured in kilocalories. 3Efficiency: The ATP conversion efficiency for each metabolite expressed as a percentage.
Percentages are calculated by dividing the heat of combustion (kcal) for each metabolite by ATP
(kcal).

59
CHAPTER TWO
Adaptation of a common cell culture assay to rank cattle based on skeletal muscle
metabolic activity
This chapter will be published as: Beckett, L., R. Rosemond, B. Renquist, and R.R. White. 2019.
Technical note: a muscle biopsy technique for stratifying cattle by skeletal muscle metabolic
activity. Journal of Dairy Science.

60
ABSTRACT
Tissue biopsy metabolic activity, assessed using the oxidation-reduction indicator
Resazurin, may serve as a proxy to assess energy expenditure associated with maintenance in non-
growing animals or growth rate in growing animals. Herein, we evaluate the repeatability,
practicality, and sensitivity of a Resazurin-based assay for ranking bovine skeletal muscle biopsies
based on metabolic activity. Six yearling Holstein heifers (BW = 330 ± 11.3 kg) were fed 4 dietary
treatments consisting of high or low rumen degradable starch and fiber arranged factorially in a
partially replicated Latin Square design. Periods were 18 d long, consisting of 3 d diet transition,
14 d diet adaptation, and 1 d sample collection. Semitendinosus biopsies were collected into ice
cold Dulbecco’s modified eagle media (DMEM) from each heifer during each period. Analysis
was initiated within an hour of sample collection. To assess tissue metabolic rate, biopsies were
transferred to DMEM with Resazurin and incubated at 37⁰C. Fluorescence of each sample was
read at time 0 and at 15-minute intervals for two hours. Change in fluorescence was representative
of skeletal muscle reducing equivalent production. Fluorescent signal strength increased with time
(P < 0.001) and relative rank of treatments did not change with time (P > 0.05). Accordingly,
future studies may compare fluorescence at a single time point. Change in fluorescence at 120
minutes was used for analysis of the fixed effects of fiber, starch, and animal, when accounting for
a random effect of period. Samples collected when animals were on a high ruminally degradable
starch diet were more metabolically active than samples collected from animals on low starch diets
(P = 0.023). Significant differences in metabolic activity among individual animals were also
identified. Average relative fluorescence was correlated with dry matter intake (DMI), average
daily gain (ADG), and feed to gain ratio (F:G). The relative fluorescence tended to correlate with
ADG (r = 0.749; P = 0.0864) and F:G (r = -0.783; P = 0.066). Change in fluorescence did not

61
correlate with DMI (P = 0.773). Although evaluated on a small sample size, this technique shows
promise as a potential means of ranking animals by growth or feed efficiency. Further work on a
larger experimental population is needed to confirm the usefulness of this assay as a consistent and
reliable predictor of these important phenotypic parameters.
Keywords: bovine, skeletal muscle, metabolic activity
Basal Metabolic Rate Measurements
Selecting feed efficient animals will help dilute maintenance energy requirements and
enhance feed efficiency, improving dairy cattle production system sustainability (White, 2016).
One way to select animals with improved feed efficiency is to identify those with particularly
efficient metabolism. The energy requirements of cattle are related to maintenance, growth,
reproduction, and lactation. Maintenance energy expenditure and efficiency of energy use can be
measured by either using metabolic chambers that collect heat and gas produced (Ellis, et al., 2006)
or performing large serial slaughter studies (Lofgreen and Garrett, 1968). However, the
practicality of these approaches has declined over time due to the cost of conducting studies using
metabolic chambers and challenges with justifying terminal use of large numbers of animals. As a
result, our knowledge of how to manipulate energy use efficiency is primarily from cattle with
older genetics, and older feeding strategies (e.g., Lofgreen and Garrett, 1968). Recent work on the
genetic bias of feed efficiency suggests there is considerable between-animal variation in
efficiency of energy use (Hardie, et al., 2017). In turn, a high-throughput method for assessing
energy expenditure may allow for selection to improve efficiency.
A technique recently developed for measuring metabolic activity in embryonic zebrafish
(Renquist et al., 2013; Williams and Renquist, 2016) and skeletal muscle biopsies from tilapia

62
(Kentch et al., 2017) may be applied to assess metabolic activity in cattle, which could serve as
one such phenotyping approach. In brief, this assay applies Resazurin, an oxidation-reduction
indicator, which is highly fluorescent upon becoming irreversibly reduced by NADH, FADH2, or
cytochrome C. This technique has not previously been tested in cattle. We hypothesized that by
applying this technique in cattle skeletal muscle biopsies we could assess the change in metabolic
activity induced by changes in the diet or inherent animal variation in feed efficiency and segregate
individuals based on metabolic activity.
The objectives of this study were to: 1) investigate the application and sensitivity of this
novel fluorescent assay using muscle tissue biopsies collected from Holstein heifers; 2) evaluate
the application of this test to quantify the metabolic response to dietary changes; and 3) apply the
test to identify inherent individual animal variation in metabolic activity.
Treatment Diets and Adaptation Period
Six ruminally cannulated yearling (11 mo ± 7 d) Holstein heifers (BW = 330 ± 11.3 kg)
were randomly assigned to 4 dietary treatments in a partially replicated Latin Square design. The
square was partially replicated because there were 6 animals and 4 treatments meaning that two
treatments were duplicated in each period and the other two treatments were not. Each period
change corresponds to a change in treatment diet. Periods were 18 d in length. The first 3 d were
used to adapt animals between rations, animals consumed the treatment ration for 14 d, and
samples were collected on the final day. Diets were factorially designed with corn silage as a base
(29.4 to 35.6, % DM), and used different dietary inclusion combinations of ground barley (high
rumen degradable starch [HS] 14.1 to 14.8 % DM; low rumen degradable starch [LS] 0.310 to
0.670, % DM) or ground corn (HS 0.00 to 0.380 % DM; LS 10.5 to 12.3 % DM) and pelleted beet
pulp (high rumen degradable fiber [HF] 3.55 to 6.05 % DM; low rumen degradable fiber [LF] 30.2

63
to 32.9 % DM) or timothy hay (HF 19.9 to 25.0 % DM; LF 0.020 to 1.43, % DM) to generate
rations with high and low ruminal degradable starch and fiber. As described in Table 1, diets also
contained soybean meal (HS-HF 9.3 % DM; HS-LF 17.1 % DM; LS-HF 9.95 % DM; LS-LF 15.3
% DM), blood meal (HS-HF 3.78 % DM; HS-LF 0.00 % DM; LS-HF 4.37 % DM; LS-LF 0.040
% DM), and corn gluten feed (HS-HF 3.26 % DM; HS-LF 0.00 % DM; LS-HF 1.65 % DM; LS-
LF 7.22 % DM) to make them isonitrogenous. These treatment combinations resulted in divergent
energy supply to the animals (NRC, 2001), and the calculated metabolic energy (ME) for each
ration is included in Table 1.
Sample Preparation and Collection
A 10 cm wide area 5 cm to 35 cm ventral to the point of the ischium was shaved and
scrubbed three times with betadine and isopropanol. Ten ml of lidocaine was administered
subcutaneously in 5 to 6 locations radially arrayed 2 cm externally to the biopsy site. The target
biopsy site was 20 cm ventral to the point of the ischium. Muscle tissue samples were collected by
making a 1 cm incision through the skin with a #20 scalpel blade, inserting a 20 gauge biopsy
needle (Bard® Mission® Disposable Core Biopsy Instrument, Bard Biopsy, Tempe, AZ, USA) to
a 4 cm depth, and depressing the needle collection sheath to obtain a sample. Three biopsies, with
the aim of obtaining approximately 30 mg of sample, were collected per animal per period to
evaluate how variation in sample collection (sample mass, collection site within the muscle, and
other unknown factors) influenced consistency of the results. Samples were not weighed after
collection because an analytical balance was not available at the farm. The incision site was sealed
using monofilament #2 suture wire, cleaned with isopropanol, and sprayed with adhesive bandage.
The right semitendinosus was sampled in periods 1 and 3 and the left semitendinosus was sampled
in periods 2 and 4 allowing muscle to properly regenerate and animals to heal.

64
Immediately following collection, the biopsies were placed in individual wells of a 96 well
plate filled with a pre-test solution. The pre-test solution was formulated as described in Renquist
et al. (2013) and contained 30 ml DMEM (Fisher Scientific 21-041-025, Waltham, MA, USA),
7.5 mg Fungizone (Fisher Scientific 15-290-026), 0.12 mg Chloramphenicol (Fisher Scientific
BP904-100), and 0.03 mg Ampicillin (Fisher Scientific AAJ6097714). After all samples were
collected, they were transferred from the pre-test solution into individual wells of a 96 well plate
filled with AlamarBlue (Thermo Scientific Y00-100)_Test Assay solution. The test solution was
identical to the pre-test solution with 1.6% AlamarBlue added. Solutions were mixed immediately
prior to biopsy collection, filtered using a sterile 0.22 µM filter, and warmed to 37⁰C before use.
Sample Analysis
Directly after sample collection, the live muscle tissue samples were transported to the lab
in the pre-test solution on ice, transferred to the test solution, and analyzed. Analysis was initiated
within one hour of tissue collection. When samples were transferred to the test solution, the test
solution plate was incubated in the plate reader (Spectramax M5; Molecular Devices, LLC, San
Jose, CA) at 37℃. Fluorescence was read at time 0 and every 15 minutes for 2 hours using
excitation and emission wavelengths of 530 and 590 nm, respectively (Renquist, et. al, 2013;
Williams and Renquist, 2016). Soft Max Pro 6.1 (Molecular Devices, LLC, San Jose, CA) was
used to quantify resulting emissions, and relative fluorescence (standardized to time 0) was
calculated at each time point for each sample.
Consistency of Samples within Animal-Periods
Triplicate samples were collected within an animal-period to evaluate the consistency of
animal rankings obtained from like samples. The within-animal-period CV for relative

65
fluorescence was approximately 20%, suggesting a need to standardize samples by protein or DNA
content, as was done by Renquist et al. (2013), or by mass. Despite the degree of variation among
samples collected from the same animal consuming the same diet, a Wilcoxon rank sum test did
not find significant differences in the rankings of animals when different individual samples were
used (P>0.05) suggesting this variation did not impede opportunities to rank animals by skeletal
muscle metabolic activity.
Statistical Analysis
Mean relative fluorescence was calculated for each animal-period at each time point read.
Statistical analysis of these mean fluorescence data was conducted in R version 3.1.0. (R Core
Team, 2014). Analysis was structured into 2 questions: 1) does the incubation time change the
perceived influence of a treatment on relative NAD+ reduction rate; and 2) are differences between
animals and treatments discernable after 2 h. To address the first question, a linear mixed effect
model was used to test how time, fiber and starch digestibility, animal, and period influenced
standardized fluorescence readings. Fiber, starch and time were fixed effects, and the 2- and 3-
way interactions among these fixed effects were also evaluated. Period and animal were treated as
random effects. A significant time by starch or fiber interaction would suggest that treatment
differences were not consistent across a sampling period and some ideal fluorescence reading time
would need to be determined to make reliable inferences from the data. To address the second
question, data from the last time point (2 h) was analyzed using a linear mixed effect model with
fixed effects of fiber, starch, and animal and a random effect of period. Significant starch, fiber or
animal effects would suggest that the assay (using only a 2 h fluorescence time) was sensitive
enough to rank samples based on animal-level factors (genetic potential or diet).

66
Time
Because the plate can be read at multiple time points, we were able to test the effect of time
on within-sample fluorescence (Figure 1). The reduction reaction that causes Resazurin to
fluoresce is irreversible, and as a result the signal accumulates with time allowing small short-term
differences to amass as time of incubation is extended. The total signal increased linearly with
time (P < 0.0001). Thus, the tissue biopsies maintained a constant metabolic rate throughout the
incubation period. Time did not differentially affect fluorescence based on starch (P = 0.5106) or
fiber (P = 0.8072) in the diet, supporting the conclusion that the rankings of samples were similar
if evaluated at any time point within the 2 hours.
Diet
Skeletal muscle biopsies taken when heifers were on a high ruminally degradable starch
diet had a higher relative fluorescence than biopsies taken when heifers were fed a diet low in
ruminally degradable starch (P = 0.023) (Table 2). The link between starch source and skeletal
muscle metabolic activity could be caused by a change in energy availability. However, calculated
ME in the diets changed more with rumen degradable fiber than with rumen degradable starch
(Table 1), making this explanation unlikely. Alternatively, the increase in tissue metabolic activity
with increased ruminally degradable starch may be related to a different absorbed volatile fatty
acid profile. Different VFA are used for energy with different efficiencies in the post-absorptive
system (Baldwin, 1968). Approximate VFA contribution to muscle is dependent upon individual
VFA metabolism. Less than 30% of acetate (Knowles et al., 1974), 40 to 55% of propionate
(Wiltrout and Satter, 1972), and minimal butyrate is available to the periphery (Bergman and
Wolff, 1971). Glucose contribution to skeletal muscle in ruminants is due to gluconeogenesis.
Hepatic uptake of propionate, valerate, and isobutyrate allows for increased gluconeogenic

67
substrate (Aschenbach et al., 2010). If the different starch sources contributed to different profiles
of absorbed VFA, it is possible that the absorbed VFA profiles contributed to the effect of
ruminally degradable starch on skeletal muscle metabolic activity. Independent of the mechanism
driving this dietary effect, our results suggest the assay can be applied to understand the metabolic
effects of ration changes.
Animal
Comparisons among animals show that skeletal muscle metabolic activity varied between
individuals (P = 0.003). The effect of diet was consistent amongst animals, and animals ranked
similarly across diets (Figure 2). This consistency suggests that inherent differences in skeletal
muscle metabolic activity may be distinguishable across conditions, making it a possible way to
inexpensively and durably screen animals for energy expenditure associated with growth or in
non-growing animals, maintenance.
The metabolic activity of a ruminant is a function of body mass and metabolic flux in an
inactive, thermoneutral environment (White and Seymour, 2003). These differences in metabolic
flux contribute to variability in feed efficiency. Feed efficiency is also influenced by genetics (e.g.,
Koch et al., 1963), activity and behavior (e.g., Shaver, 2010; Socha et al., 2007), environment (e.g.,
Socha et al., 2007), and heifer rearing practices (e.g., Khan et al., 2011). The average skeletal
muscle metabolic activity (expressed as relative fluorescence) of each individual was paired with
dry matter intake (DMI), average daily gain (ADG), and calculated feed to grain ratio (F:G)
(Figure 3). Relative fluorescence tended to correlate with ADG (r = 0.749; P = 0.0864) and F:G (r
= -0.783; P = 0.066). Change in fluorescence did not correlate with DMI (P = 0.773) (Figure 3).
Because of concern with potential high-influence points, a leave-out-one analysis was performed
to assess how correlations changed when each point was iteratively removed from the dataset.

68
Correlations between relative fluorescence and ADG ranged from 0.701 and 0.855 with a mean of
0.778. The F:G correlations ranged from -0.540 and -0.875 with a mean of -0.763. The relationship
between DMI and relative fluorescence varied more substantially (range from 0.186 to 0.542,
mean 0.187). These results suggest that one animal may have been the primary reason for limited
relationship between DMI and relative fluorescence. When this animal was removed, the strength
of the F:G relationship also decreased. However, removing data from that animal did not
substantially alter the relationship identified between relative fluorescence and ADG. The
inconsistency across the dataset suggests the need for additional trials to confirm the relationship
between the outputs of this assay and animal productivity.
Skeletal muscle biopsy metabolic activity was indicative of energy expenditure for growth
and maintenance in these young, rapidly growing heifers. The tendency for a consistent positive
correlation with growth suggests that variation in the metabolic activity assay measurements
correlated with variation in animal growth, as would be expected from the measurement. However,
the inconsistency of correlations among the relative fluorescence and DMI or F:G highlights a
limitation of the small sample size used in this preliminary assay evaluation. Additional screening
on a larger sample size is needed to determine whether this assay could be useful in selecting
animals with higher rates of gain or greater feed efficiency.
ACKNOWLEDGMENTS
Research supported by state and federal funds appropriated to Virginia Tech, and by USDA-
NIFA project numbers 2015-03656, 2017-05943 (RRW) and 2015-06367 (BJR).

69
Tables
Table 2.1: Ingredients and nutrient composition for each treatment diet expressed on a dry
matter basis. Significance is determined by P < 0.05 and tendency by P < 0.10.
Descriptor HS-LF1 HS-HF2 LS-LF3 LS-HF4
Ingredients, % DM
Timothy Hay 0.020 19.9 1.43 25.0
Beet Pulp 30.2 6.05 32.9 3.55
Ground Corn 0.000 0.380 12.3 10.5
Ground Barley 14.8 14.1 0.310 0.670
Corn Silage 35.6 34.4 29.4 35.2
Corn Gluten Feed 0.000 3.26 7.22 1.65
Soybean Meal 17.1 9.30 15.3 9.95
Blood Meal 0.000 3.78 0.040 4.37
Vitamin E Premix
Vitamin A-D3 Premix
Nutrient, % DM
DM 73.4 64.8 74.7 63.9
OM 94.8 94.9 94.9 94.7
NDF 35.0 35.0 35.0 35.0
ADF 23.4 23.0 21.1 21.5
Starch 20.0 20.0 20.0 20.0
CP 16.0 15.9 16.0 15.9
Estimated ME, Mcal/kg
Animal Parameters
Dry Matter Intake, kg/d
Average Daily Gain, kg/d
2.74
10.6
0.90
2.63
11.6
0.81
2.75
10.9
0.76
2.62
12.3
0.60
Feed to Gain Ratio (kg/kg) 11.8 14.3 14.3 20.5
1HS-LF = high rumen degradable starch, low fiber treatment 2HS-HF = high rumen degradable starch, high fiber treatment 3LS-LF = low rumen degradable starch; low fiber treatment 4LS-HF = low rumen degradable starch; high fiber treatment
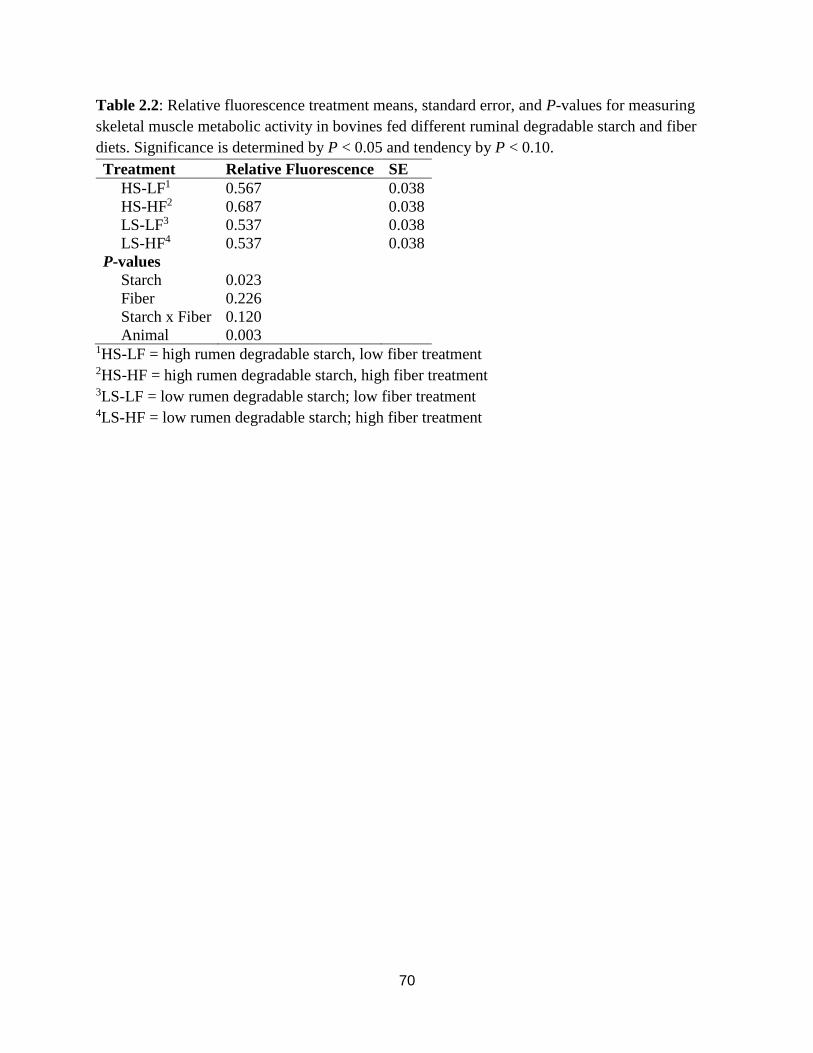
70
Table 2.2: Relative fluorescence treatment means, standard error, and P-values for measuring
skeletal muscle metabolic activity in bovines fed different ruminal degradable starch and fiber
diets. Significance is determined by P < 0.05 and tendency by P < 0.10.
Treatment Relative Fluorescence SE
HS-LF1 0.567 0.038
HS-HF2 0.687 0.038
LS-LF3 0.537 0.038
LS-HF4 0.537 0.038
P-values
Starch 0.023
Fiber 0.226
Starch x Fiber 0.120
Animal 0.003 1HS-LF = high rumen degradable starch, low fiber treatment 2HS-HF = high rumen degradable starch, high fiber treatment 3LS-LF = low rumen degradable starch; low fiber treatment 4LS-HF = low rumen degradable starch; high fiber treatment

71
Figures
Figure 2.1: Relative fluorescence, equivalent to energy expenditure, analyzed over a 2-hour
period for high fiber-high starch (HF-HS), high fiber-low starch (HF-LS), low fiber-high starch
(LF-HS), and low fiber-low starch (LF-LS) diets. Values reported are least-square means, the
raw values for time point 0 were 0 for all treatments as would be expected from relative
fluorescence data. High starch diets had greater relative fluorescence in comparison to low starch
diets, but there was no significant effect of fiber or the interaction (Starch P = 0.023; Fiber P =
0.23; Starch x Fiber P = 0.12). The total signal increased linearly with time (P < 0.0001), but
time did not differentially affect fluorescence (Starch P = 0.51; Fiber P = 0.81; Starch x Time P
> 0.10; Fiber x Time P > 0.10; Starch x Fiber x Time P > 0.10). Significance is determined by P
< 0.05 and tendency by P < 0.10.

72
Figure 2.2: Least squares mean relative fluorescence (nm) for each animal, organized by
treatment. Treatments included either a high (HS) or low (LS) rumen degradable starch source
and either a high (HF) or low (LF) rumen degradable fiber source. Animal numbers are arbitrary
and reflect the animal identifier assigned by the farm. These identifiers are included in the legend
to show consistency of animal rankings across diets. Comparisons among animals show that
skeletal muscle metabolic activity, measured by relative fluorescence of skeletal muscle, varied
between individuals (P = 0.003). Significance is determined by P < 0.05 and tendency by P <
0.10.
0
0.1
0.2
0.3
0.4
0.5
0.6
0.7
0.8
0.9
LS-HF LS-LF HS-HF HS-LF
Rel
ativ
e F
luo
resc
ence
Animal 558 Animal 564 Animal 566 Animal 567 Animal 576 Animal 570

73
Figure 2.3: Mean relative fluorescence of each animal mapped against corresponding study
mean dry matter intake (DMI), average daily gain (ADG), and mean feed to gain (F:G). Data
points describe individual animal performance correlated to relative fluorescence. Each color
R² = 0.4598
0.3
0.4
0.5
0.6
0.7
0.8
0.9
1
1.1
1.2
0.3 0.4 0.5 0.6 0.7 0.8
Av
erag
e D
aily
Gai
n, k
g/d
Relative Fluorescence
R² = 0.0233
3.4
5.4
7.4
9.4
11.4
13.4
15.4
0.3 0.4 0.5 0.6 0.7 0.8
Dry
Mat
ter
Inta
ke,
kg/
d
Relative Fluorescence
R² = 0.613
3.4
8.4
13.4
18.4
23.4
28.4
33.4
38.4
0.3 0.4 0.5 0.6 0.7 0.8
Fee
d t
o G
ain
Rat
io, k
g/k
g
Relative Fluorescence
74
corresponds to an individual animal. The dotted line shows a best-fit linear regression of the
performance variable on relative fluorescence. The R2 values presented reflect the coefficient of
determination for each regression. Relative fluorescence tended to correlate with ADG (P =
0.0864) and feed to gain (P = 0.066). Change in fluorescence did not correlate with DMI (P =
0.773). Significance is determined by P < 0.05 and tendency by P < 0.10.
75
REFERENCES
Aschenbach, J.R., N.B. Kristensen, S.S. Donkin, H.M. Hammon, and G.B. Penner. 2010.
Gluconeogenesis in dairy cows: the secret of making sweet milk from sour dough.
IUBMB Life 62:869–877. Doi: 10.1002/iub.400.
Baldwin, R.L. 1968. Estimation of Theoretical Calorific Relationships as a Teaching Technique.
A Review. J. Dairy Sci. 51:104–111. Doi: 10.3168/jds.S0022-0302(68)86928-0.
Ellis, J.L., F. Qiao, and J.P. Cant. 2006. Evaluation of net energy expenditures of dairy cows
according to body weight changes over a full lactation. J. Dairy Sci. 89:1546–1557. Doi:
10.3168/jds.S0022-0302(06)72222-6.
Hardie, L.C., M.J. VandeHaar, R.J. Tempelman, K.A. Weigel, L.E. Armentano, G.R. Wiggans,
R.F. Veerkamp, Y. de Haas, M.P. Coffey, E.E. Connor, M.D. Hanigan, C. Staples, Z.
Wang, J.C.M. Dekkers, and D.M. Spurlock. 2017. The genetic and biological basis of
feed efficiency in mid-lactation Holstein dairy cows. J. Dairy Sci. 100:9061–9075. Doi:
10.3168/jds.2017-12604.
Kentch, K., C.E. Geisler, and B.J. Renquist. 2017. Measuring Metabolic Rate of Embryonic Fish
to Predict Growth Rate. World Aquaculture Society: Aquaculture America. San Antonio,
TX.
Khan, M.A., D.M. Weary, and M.A.G. von Keyserlingk. 2011. Invited review: effects of milk
ration on solid feed intake, weaning, and performance in dairy heifers. J. Dairy Sci.
94:1071–1081. Doi: 10.3168/jds.2010-3733.
Knowles, S.E., I.G. Jarrett, O.H. Filsell, and F.J. Ballard. 1974. Production and utilization of
acetate in mammals. Biochem. J 142:401–411. Doi: 10.1042/bj1420401.
Koch, L.E., N.A. Gomez, A. Bowyer, and G.J. Lascano. 2017. Precision-feeding dairy heifers a
high rumen-undegradable protein diet with different proportions of dietary fiber and
forage-to-concentrate ratios. J. Anim. Sci. 95:5617–5628. Doi: 10.2527/jas1963.222486x.
Lofgreen, G.P., and W.N. Garrett. 1968. A System for Expressing Net Energy Requirements and
Feed Values for Growing and Finishing Beef Cattle. J. Anim. Sci. 27:793–806. Doi:
10.2527/jas1968.273793x.
NRC - National Research Council. 2001. Nutrient requirements of dairy cattle. 7th ed. National
Academy, Washington.
76
Renquist, B.J., C. Zhang, S.Y. Williams, and R.D. Cone. 2013. Development of an assay for
high-throughput energy expenditure monitoring in the zebrafish. Zebrafish 10:343–352.
Doi: 10.1089/zeb.2012.0841.
Shaver, R., and A. Pas. 2010. Factors Influencing Feed Efficiency in Dairy Cattle. Mid-South
Ruminant Nutrition Conference, Arlington, Texas.
Socha, M.T., D.J. Tomlinson and J.M DeFrain. 2007. Measuring and improving feed efficiency
in lactating dairy cows. p.235-246. Proceedings of the Intermoutain Nutrition
Conference, Salt Lake City.
White, C.R., and R.S. Seymour. 2003. Mammalian basal metabolic rate is proportional to body
mass2/3. Proc. Natl. Acad. Sci. USA. 100:4046–4049. Doi: 10.1073/pnas.0436428100.
White, R.R. 2016. Increasing energy and protein use efficiency improves opportunities to
decrease land use, water use, and greenhouse gas emissions from dairy production. Agric.
Syst. 146:20–29. Doi: 10.1016/j.agsy.2016.03.013.
Williams, S.Y., and B.J. Renquist. 2016. High Throughput Danio Rerio Energy Expenditure
Assay. J. Vis. Exp. 107. e53297. Doi:10.3791/53297.
Wiltrout, D.W., and L.D. Satter. 1972. Contribution of Propionate to Glucose Synthesis in the
Lactating and Nonlactating Cow1. J. Dairy Sci. 55:307–317. Doi: 10.3168/jds.S0022-
0302(72)85487-0.

77
CHAPTER THREE
Rumen volatile fatty acid molar proportions, rumen epithelial gene expression, and blood
metabolite concentration responses to ruminally degradable starch and fiber supplies
This chapter will be published as: Beckett, L. A. Bedford, C. Gleason, D. Liebe, T.T. Yohe,
K.M. Daniels, M.B. Hall and R.R. White. 2019. Rumen volatile fatty acid molar proportions,
epithelial gene expression, and blood metabolite concentration responses to ruminally degradable
starch and fiber supplies. Journal of Dairy Science.

78
Running Head: RUMEN RESPONSES TO DEGRADABLE NUTRIENTS
INTERPRETIVE SUMMARY: Beckett et al. (TBD). “Rumen volatile fatty acid molar
proportions, epithelial gene expression, and blood metabolite concentration responses to
ruminally degradable starch and fiber supplies” discusses the influence of starch and fiber
sources on ruminal volatile fatty acid molar proportions, calculated VFA pool size, and flux.
Changes in ruminal volatile fatty acid supplies due to different starch and fiber sources causes
the rumen epithelium to mirror VFA fluctuations, but post-absorptive blood metabolites do not
convey changes in ruminal VFA supplies.
Rumen volatile fatty acid concentration, rumen epithelial gene expression, and blood
metabolite concentration responses to ruminally degradable starch and fiber supplies
L. Beckett1, A. Bedford1, C. Gleason1, D. Liebe1, T.T. Yohe2, K.M. Daniels2, and R. R. White1
1Department of Animal and Poultry Science, Virginia Tech, Blacksburg, VA, USA
2Department of Dairy Science, Virginia Tech, Blacksburg, VA, USA
79
ABSTRACT
The objective of this work is to characterize how rumen VFA concentrations, rumen
epithelial gene expression, and blood metabolite concentrations respond to diets containing
different starch and fiber sources. A partially replicated Latin Square experiment with four
treatments consisting of barley or corn and timothy hay or beet pulp arranged as a 2 x 2 factorial
was used to assess shifts in ruminal VFA and fluid dynamics; epithelial gene expression; and
blood metabolite concentrations. Beet pulp and timothy hay were used to create relative changes
in apparent ruminal fiber degradability; and corn and barley grain were used to create relative
changes in apparent ruminal starch degradability. Six ruminally cannulated yearling Holstein
heifers (BW = 330 ± 11.3 kg) were used. Each period consisted of 3 d of diet adaptation and 15 d
of dietary treatment. In situ degradation of fiber and starch were estimated from bags incubated
in the rumen from d 10 to 14. From d 15 to 17 rumen fluid was collected every h from 0500 to
2300. On d 15 at 0500, a bolus dose of polyethylene glycol was administered and time-series
samples for 12 h were used to estimate fluid passage and pool size. Rumen fluid samples were
pooled by animal/period and analyzed for pH and VFA concentrations. On d 18, 60 to 80
papillae biopsies were cut from the epithelium and preserved for gene expression analysis. Blood
samples were collected from the coccygeal vein for plasma acetate and propionate analysis using
gas chromatography mass spectrometry (GCMS) and colorimetric determination of plasma
glucose, insulin, and beta-hydroxybutyrate (BHB).
In situ ruminal starch degradation rate (barley 7.61 to 10.5 %/h vs corn 7.30 to 8.72 %/h;
P = 0.05) and fiber extent of degradation (timothy hay 22.2 to 33.4 % of DM vs beet pulp 34.4 to
38.7 % of DM P = 0.0007) were affected by starch and fiber source, respectively. Analysis of
molar proportions showed a shift from propionate (P = 0.06) to acetate (P = 0.02) on timothy hay
diets. There was also a shift from valerate (P = 0.10) to isovalerate (P = 0.008) molar proportions

80
on timothy hay diets. Comparing molar proportions on corn versus barley diets, there were trade-
offs between propionate (P = 0.02) and butyrate (P = 0.04) with corn diets favoring propionate
over butyrate. Corn diets also had high molar proportions of valerate (P = 0.049). Neither rumen
fluid volume (Starch P = 0.31; Fiber P = 0.75; Starch x Fiber P = 0.55) nor fluid passage rate
(Starch P = 0.68; Fiber P = 0.80; Starch x Fiber P = 0.30) were affected by treatment. Expression
of 4 genes, heat shock protein 70 (HSP70), beta-hydroxybutyrate dehydrogenase (BDH1),
sodium hydrogen exchanger isoform 3 (NHE3) and monocarboxylate 4 (MCT4), were by
timothy hay. Acetate was the only blood metabolite affected by diet (Starch x Fiber P = 0.067).
Data suggested shifts in VFA molar proportions and epithelial transporters did not necessarily
convey shifts in calculated ruminal VFA pool size or blood metabolite concentrations.
Keywords: rumen epithelium, blood metabolites, VFA concentration

81
Introduction
Volatile fatty acids (VFA) are an innate energy source for ruminants that contribute
approximately 70% to 80% to energy requirements (Bergman, 1990). Ration changes cause
adaptations within the rumen microbial community which alter fermentation patterns and
contribute to changes in rumen VFA. Dietary ingredients can be used to manipulate VFA because
changing dietary ingredients alters the type of substrate provided for fermentation (France and
Dijkstra, 2005). Although there is considerable information available about how specific starch
and fiber sources affect VFA concentrations, Hall et al. (2015) noted that VFA concentrations can
be inaccurate representations of treatment effects on fermentation because they do not account
corresponding shifts in ruminal liquid volume and passage rate. Liquid passage rate, in particular,
has been shown to change with dietary composition, particle size, and other factors (Kuoppala et
al., 2009). Although some studies have concurrently evaluated shifts in VFA concentration and
fluid passage (e.g., Dijkstra et al., 1993), there has been less focus on how diets with different
predicted degradable carbohydrate profiles influence VFA and fluid dynamics.
Rumen liquid volume and passage is quantified using a biological marker (e.g.,
polyethylene glycol, Cr-EDTA, Co-EDTA) and measuring the exponential decay of the marker
over time by taking rumen fluid samples (Krämer et al., 2013). Rumen fluid passage is then used
to estimate the amount of VFA exiting the rumen with rumen fluid (fluid-mediated flux) and
individual VFA pool size. Fluid dynamics also play a factor in carbohydrate disappearance.
Krämer et al. (2013) did not see a difference in ruminal retention time due to fiber type or forage
ratio, but did see changes in total mean retention time suggesting rumen liquid outflow could alter
nutrient retention times in other portions of the gastrointestinal tract. Increased or decreased
nutrient retention times could alter VFA profiles.

82
Previous modeling work has demonstrated that ruminal starch and fiber disappearance are
good predictors of key ruminal factors like microbial N production, efficiency of microbial protein
synthesis (Roman Garcia et al. 2016), and ruminal pH (White et al. 2017). Most studies reporting
relationships between ruminal VFA and degradable carbohydrate supplies focus exclusively on
these aspects of fermentation and do not test the downstream responses of the rumen epithelium
or blood metabolites. More holistic analysis of the animal responses to degradable carbohydrate
supplies may help more completely characterize how rations differing in nutrient degradability
should be formulated to optimize ruminal health and whole-system efficiency.
The objective of this work is to characterize how rumen VFA molar proportions, rumen
epithelial gene expression, and blood metabolite concentrations respond to diets containing
different starch and fiber sources. We hypothesize that corn grain will have slower starch
disappearance than barley grain and will contribute to more balanced fermentation (moderate pH,
lower proportion of propionate). We expect timothy hay to have lower fiber disappearance than
beet pulp, resulting in lower VFA concentrations and higher proportions of acetate. We expect to
detect changes in ruminal VFA transporter gene expression that mirror VFA concentrations. We
also expect that shifts in genes associated with epithelial acetate and butyrate metabolism will
mirror acetate and butyrate concentrations. Because blood metabolite concentrations are subject
to similar fluid kinetic issues as rumen VFA concentrations are (e.g., Hall et al., 2015) blood
metabolite concentrations are incomplete representations of metabolite flux (e.g., Bedford et al. In
Press). Therefore, we do not expect to detect changes in blood metabolite concentrations that
mirror expected shifts in VFA supplies.

83
MATERIALS AND METHODS
Animals and Treatments
All animal use and procedures were in accordance with Virginia Tech Institutional
Animal Care and Use Committee. Six ruminally cannulated yearling Holstein heifers (BW = 330
± 11.3 kg) were used in a partially replicated 4 x 4 Latin square experiment. Treatment diets
were factorially arranged (2 x 2) and were designed to include feedstuffs expected to result in
proportionally different supplies of ruminally degradable starch and fiber. Ground barley and
ground corn were used as starch sources, with barley expected to generate proportionally faster
ruminal starch degradation. Timothy hay and beet pulp were used as fiber sources, with timothy
hay expected to have lower ruminal fiber degradability than beet pulp. Corn silage was the diet
base, and a mixture of soybean meal, blood meal, and corn gluten feed were added to meet
protein requirements and to ensure the diets were isonitrogenous (Table 1). Diets were not
designed to be isoenergetic.
Each animal cycled through the four diets over a four-period time frame. Periods
consisted of 18 d. The first 3 d were for gradual diet adaptation to prevent rumen upset. Heifers
consumed 100% of the treatment diet from d 3 to 18.
Sample Collection
Refusals were collected and heifers were fed via Calan gates (American Calan Inc.
Northwood, NH) once per day at approximately 1000 h from d 1 to 13 of each period. From day
14 to 18, heifers were fed every 2 h starting a 1030 h in an attempt to achieve metabolic steady
state. Diets were hand-weighed and mixed daily prior to feeding. The amounts of feed offered
and refused were weighed daily throughout the experiment and as-fed intake was calculated. Diet
and feed refusal samples were collected on d 6, 12, and 18 of each period and were dried in a 55

84
oC forced-air oven for 48 h to obtain dry matter content of each ration. Daily dry matter intake
was calculated by multiplying daily as-fed intake by average dry matter content of each
treatment ration per heifer. Body weight was measured at the beginning of the experiment and
once between each period (every 18 days). In situ degradability of diets was assessed with a 96 h
incubation occurring from d 10 to 14 of each period. Rumen fluid samples were collected hourly
from 0500 to 2300 h on d 15 through 18 of each period. Blood samples were collected by
coccygeal venipuncture at 0900 h on d 18 of each period. Papillae biopsies were collected
immediately following blood samples.
Feed Analysis
Diet and refusal samples were dried in a 55 oC forced-air oven (Thermo Scientific
Heratherm Advanced Protocol Ovens Model 51028115; Fisher Scientific, Waltham, MA, USA)
for 48 h to analyze for DM content. Samples were ground with a Model 4 Wiley mill (A. H.
Thomas Scientific, Swedesboro, NJ, USA) to pass through a 1-mm screen. Ash was determined
after heating for 8 h in a muffle furnace (500 oC). An Ankom200 fiber analyzer (Ankom
Technology, Macedon, NY, USA) with the addition of heat stable α-amylase and sodium sulfite
was used to determine NDF. Feed ADF content was assessed using the Ankom200 fiber analyzer
(Ankom Technology, Macedon, NY, USA) according to manufacturer specifications. Crude
protein was calculated as N x 6.25 after quantification of total N by combustion analysis (Vario
El Cube CN analyzer, Elementar Americas Inc., Mount Laurel, NJ, USA). Starch concentrations
were determined using the acetate buffer method of Hall (2009) with α-amylase
from Bacillus licheniformis (FAA, Ankom Technology, Macedon, NY, USA)
and amyloglucosidase from Aspergillus niger (E-AMGDF, Megazyme International, Wicklow,
Ireland).

85
In Situ Degradability
Diets were prepared according to Table 1, dried for 48 h at 55 oC, and ground through a 2
mm screen of a Wiley mill (Thomas Scientific, Swedesboro, NJ, USA). A total of 40 Dacron
bags (Ankom R1020; 10 cm x 20 cm; 50 ± 10 micron porosity; Ankom Technology, Macedon,
NY, USA) were filled with 5 g of ground diet samples (DM basis) and heat-sealed. An empty
bag was also included for each diet to serve as a blank sample. In situ bags were placed in mesh
laundry bags (20 Dacron bags per mesh bag) and incubated in the rumen at: -96 h, -48 h, -24 h, -
12 h, -6 h, -3 h, -1.5 h, -1 h, -0.5 h, and 0 h. At time 0 all bags were removed, washed 5 times
with a portable washing machine (SKY2767, Best Choice Products, Irvine, CA, USA). Each
wash cycle consisted of 1 minute of cool water agitation, drainage, and a 2-minute spin. After
washing, bags were dried in a forced-air oven for 48 h at 55 oC. Bags were immediately weighed
post-drying and weighed again after 3 h of air equilibration. Bag contents were then pooled by
animal time-point and subjected to the previously described NDF and starch analysis.
Residual amount of each nutrient (NDF and starch) was calculated as the nutrient
percentage in each bag multiplied by the DM content in each bag to yield residual grams of
nutrient. An exponential decay curve was fitted to the calculated nutrient disappearance (% of
total degraded). The slope of this exponential function was multiplied by 100 to yield the
fractional nutrient disappearance rate (%/h). A theoretical maximal extent of disappearance was
calculated as the nutrient concentration at 96 h minus the nutrient concentration at 0 h divided by
the nutrient concentration at time 0, multiplied by 100.
Rumen Fluid Volume, Passage Rate, and VFA Concentrations
A 250 mL polyethylene glycol (PEG; average MW = 8000; Fisher Scientific)
intraruminal bolus (38.5 g PEG/250 mL of water) was administered at 0500 h on d 15. The bolus

86
was administered by funneling solution directly into the rumen through the cannula. Ruminal
contents were mixed by hand for 1 minute after the bolus was delivered. Immediately before
administration of this bolus, 2 initial (0 h) rumen fluid samples (12 mL per sample) were
collected. An additional 0 h sample (12 mL) was collected immediately following the bolus.
Rumen fluid samples (12 mL) were then collected hourly until 2300 h. Sample collection on d 16
and 17 also occurred hourly between 0500 and 2300 h, as described above. Rumen fluid samples
(12 mL) were collected via polyethylene sampling lines terminating in weighted pot scrubbers,
threaded through holes drilled in the rumen cannula cap, and attached to 60 ml syringes. Samples
(12 mL) were taken from two locations within the ventral lateral portion of the rumen, pooled in
the sampling syringe, and split equally into 3, 5 mL glass vials for storage.
Samples from 0500 to 1700 h of d 15 were analyzed for concentrations of PEG using a
protocol modification (M. B. Hall, personal communication) of Smith (1959). Rumen fluid PEG
concentrations were fitted to an exponential decay curve over time. The slope of this curve was
used to calculate the fractional fluid passage rate (%/h; 100 x slope). The quantity of PEG dosed
to each animal was divided by the intercept of the curve to yield an estimate of fluid volume.
Fluid volume is better measured other ways (e.g., bailing the rumen) but these approaches were
not taken in this study because microbial RNA samples were also collected (data not presented
here) and there was concern about whether repeated bailing of the rumen would disrupt
microbial populations and functionality.
At h 0700 and 1900, rumen fluid (4 mL) was spot sampled for pH prior to storage. No
diurnal patterns were observed in raw rumen pH data obtained from spot sampling and therefore
rumen pH data was averaged within day (3 days of measurements per period). All pH

87
measurements were collected on-farm within 1 minute of sample collection using a calibrated
benchtop pH meter (Fisherbrand Accumet AE150; Fisher Scientific).
Rumen fluid samples were also used to measure rumen VFA concentrations by gas
chromatography (Firkins et al. 1990). 500 ul from each hourly sample obtained within an animal-
period was composited to create 1 sample per animal period that was used for analysis. The
rumen VFA pool sizes were estimated as the VFA concentration (mM) multiplied by the rumen
fluid pool size (L). The fluid-mediated exit of VFA from the rumen was also estimated as the
rumen VFA pool size (mmol) multiplied by the fluid passage rate (%/h).
Blood Metabolite Sample Collection and Analysis
Blood samples were collected from the coccygeal vein at 0900 h on d 18 of each period
into 10 ml sodium heparin vacutainer vials (Becton Dickinson, Franklin Lakes, NJ, USA).
Samples were kept on ice until plasma isolation. Plasma was isolated by centrifuging blood tubes
at 1,500 x g for 10 minutes. Samples were stored at -20°C until VFA derivatization and BHB,
glucose, and insulin analysis. Plasma acetate and propionate plasma concentrations were
derivatized following (Kristensen, 2000) for gas chromatography mass spectrometry analysis
(GCMS). In short, plasma was combined with acetonitrile and 2-chloroethanol before
centrifuging at 1,500 x g for 30 min. After centrifuging, the supernatant, NaOH, and heptane
were combined allowing phase separation. The bottom phase was removed and transferred to a
new vial for the addition of HCl, pyridine, chloroethyl chloroformate, and water. Lastly,
chloroform was added to complete derivatization. 0.80 ul samples were analyzed on a Thermo
Electron Focus Gas Chromatograph (Thermo Scientific, Waltham, MA, USA) working with a
Thermo Electron Polaris Q mass spectrometer (MS; Thermo Scientific, Waltham, MA, USA)
and XCalibur software (version 1.4; Thermo Scientific). Plasma BHB concentrations were

88
measured using B-hydroxybutyrate (Ketone Body) Colorimetric Assay Kit (Cayman Chemical
Item No. 700190, Cayman Chemical, Ann Arbor, MI). Plasma glucose concentrations were
measured using StanbioTM Glucose Liquid Reagent for Diagnostic Set (Fisher Scientific SB-
1070-125). Plasma insulin concentrations were measured using a chemiluminescence assay
(Siemens Immulite 2000 XPi Immunoassay System, Siemens Healthcare, CA, USA).
Papillae Biopsy Sample Collection
Rumen papillae samples were collected on d 18 immediately following blood collection.
During papillae biopsies, heifers were restrained in a head gate and working chute. Biopsies were
collected by cutting 60 to 80 papillae from the ventral surface of the epithelium using cuticle
scissors. To access the epithelium, an assistant firmly grasped the ventral sac of the rumen and
inverted the epithelium through the cannula, exposing it for sampling. Prior to sampling, papillae
were cleaned with 7.0 (pH) phosphate buffered saline (Potassium Phosphate monobasic 210 mg/L;
Sodium Chloride 9000mg/L; Sodium Phosphate dibasic, 726 mg/L; Gibco Life Technologies,
Grand Island, NY, USA). Upon severing the papillae from the epithelium, papillae were
immediately immersed in an RNA preservative solution (RNALater, QIAGEN; Valencia, CA,
USA). After all papillae were collected, papillae and solution were transferred to 2 cryovials and
stored at -80°C until RNA was isolated using an RNA Plus Mini Kit (QIAGEN; Valencia, CA,
USA). cDNA was synthesized using the Applied Biosystem High-Capacity cDNA Reverse
Transcription Kit (ThermoFischer Scientific; Waltham, MA, USA) and a mastercycler. Real-Time
reverse transcription quantitative PCR (Real-Time qRTPCR; method described by Ealy et al.,
2017) was conducted to test several candidate housekeeper genes: ribosomal protein S9, S15 and
S26. This method used ABI MicroAmp Fast Optical 96-well reaction plates (0.1 ml; Fisher 43-
469-07, Fisher Scientific) to hold 1 ul of sample (or housekeeper) cDNA in combination with a
89
primer “Master Mix” for analysis by the Real-Time Fast machine (Applied Biosystems™ 7500
Real-Time PCR; ThermoFischer Scientific, Waltham, MA, USA). The “Master Mix” included 5
ul of SYBR Fast Green Master Mix (Fisher 43-856-12, Fisher Scientific), 0.5 ul reverse and 0.5 ul
of forward primers of the target gene, and 3 ul molecular grade water. The calculated 2(-Delta
Delta cycle threshold) (C(T)) values for these potential housekeeper genes were evaluated.
Ribosomal protein S15 (RPS15) had the highest average 2(-Delta Delta C(T)) value making it the
best option as a housekeeper. As such, it was used for all subsequent analyses. The housekeeper
was plated with each triplicate of genes to serve as a standard. The same Real-Time qRTPCR
protocol (Ealy et al., 2017) was used for individual gene analysis. 14 genes were chosen for
analysis because of their roles in rumen epithelial transport, epithelial integrity, or VFA
metabolism. Genes included: monocarboxylate transporters 1, 2, and 4 (MCT1, MCT2, MCT4),
sodium-hydrogen exchanger isoforms 1, 2, and 3 (NHE1, NHE2, NHE3), Claudin-1 (CLDN1),
gap-junction protein alpha 1 (GJA1), acetoacetyl-CoA synthetase (AACS), 3-hydroxybutyrate
dehydrogenase type 1 (BDH1), 3-hydroxymethyl-3-methylglutaryl-CoA lyase (HMGCL), 3-
hydroxy-3-methylglutaryl (HMGCS2), heat shock protein 70 (HSP70), and serine-threonine
protein kinase (AKT1).
Calculations and Statistical Analysis
All statistical analyses were conducted using the nlme package of R version 3.1.0. (R Core
Team, 2014). Dry matter intake (kg/d), average daily gain (kg/d), VFA concentrations (mM), VFA
molar proportions (% of total VFA), fluid volume (L), fluid passage rate (%/h), calculated VFA
pool sizes (mmol), calculated VFA fluid exit rates (mmol), epithelial gene expression (2(-Delta
Delta C(T))), and blood metabolite concentrations (mM, mg/dL, or uIU/mL) were considered as

90
response variables. The following linear mixed effect model was used for analysis of all response
variables:
ijkl i j ij k l ijklY c d e = + + + + + + ,
where is the overall mean, i is the effect of the ith starch source, j is the effect of the jth fiber
source, ij is the interaction of starch source i and fiber source j, ck is the random effect of animal
k, dl is the random effect of period l, and eijkl is the residual error associated with starch source i,
fiber source j, animal k, and period l.
For each response variable, different residual error variance structures (Unstructured,
Compound Symmetry, and 1st Order Autoregressive) were compared and the model with the
lowest Akaike information criterion (AIC; 1st Order Autoregressive in all cases) was used to test
significance. Analysis of variance and least square means were computed for each model. Despite
a prevailing lack of significant interactions, least square means for each treatment combination are
presented to enable future model-based work, which may benefit from these treatment-specific
values. Treatment effects were considered significant at P ≤ 0.05 and tendencies at 0.05 ≤ P ≥
0.15.
RESULTS AND DISCUSSION
Dry Matter Intake
Average DMI for all treatments throughout all periods is shown in Figure 2. Dry matter
intake was affected by fiber source (P = 0.009) but was unaffected by starch source (P = 0.29) or
the interaction between fiber and starch sources (P = 0.46). Heifers fed beet pulp diets consumed
less than heifers on timothy hay diets (Figure 2). There are several reasons why DMI may have
differed among treatments. First, it is possible that heifers found beet pulp to be less palatable than
timothy hay. We believe palatability may have been an issue because the beet pulp had to be soaked

91
in water prior to ration mixing to entice some animals to consume it. Secondly, it is also possible
that the higher expected energy concentration of beet pulp diets (Estimated ME, Mcal/kg 2.74 to
2.75; Table 1) caused lower DMI. The more degradable fiber in the beet pulp diets may have
contributed to enhanced hepatic oxidation of VFA and subsequent activation of satiety feedback
mechanisms in the brain (Allen et al., 2009). Allen (2000) demonstrated highly fermentable starch
diets decreased DMI, which suggests propionate metabolism provides satiety feedback to the brain
(Allen et al., 2009). Although this dietary regulation of feed intake is most commonly associated
with starch degradation, we did not expect starch degradability to influence feed intake in this
study because the extent of starch degradation did not differ among diets, only the rate of starch
disappearance.
Average Daily Gain
Heifer ADG is shown in Figure 2. Treatments did not affect ADG (Starch P = 0.49; Fiber
P = 0.50; Starch x Fiber P = 0.63). The lack of ADG response is interesting because diets differ in
predicted ME concentration but not in nutrient composition (Table 1). The estimated ME values
for each treatment diet ranged from 2.62 to 2.75 Mcal/kg and are greater than the NRC
recommended ME value of 2.28 Mcal/kg for 350 kg Holstein heifers at 12 months of age (Table
14-16; NRC, 2001). The greater estimated ME values for the treatment diets suggests energy
should not have limited growth. This lack of energy limitation on growth is perhaps why the diets
differing in ME content did not result in differences in ADG throughout the experimental period.
Additionally, we would not expect the number of animals reported here would be sufficient to
detect changes in growth parameters.
92
Nutrient Degradability
Starch and fiber rate and extent of disappearance results for each treatment diet are shown
in Figure 3. Starch source affected the rate of starch disappearance (P = 0.05) but not the extent of
disappearance (P = 0.25). Fiber source did not affect starch disappearance rate (P = 0.58) or extent
of disappearance (P = 0.42) These results were expected because the rumen is the primary location
for starch degradation regardless of the ingredient being described as highly or lowly degradable
in the rumen. Although starch from barley and corn has been thought to have different ruminal
extent of disappearance (Ferreira et al., 2018), the lack of statistical difference in extent of
disappearance could be explained by similar proline content of the endosperm (Kung et al., 2014)
or lack of variation in endosperm vitreousness between these sources of cereal grain (Ferreira et
al., 2018).
Corn diets degraded faster (7.61 to 10.5 %/h) than barley diets (7.30 to 8.52 %/h; Figure
3) which was not expected. The difference in disappearance rate contradicts Ferreira et al. (2018)
which showed corn grain to have a slower disappearance rate than hulled barley. The corn fed to
heifers in the present study was not pelleted and did not go through any high-heat processing. It is
possible that this lack of processing contributed to the faster degradation. The differences between
these studies may be due to testing dietary starch disappearance versus individual ingredient starch
disappearance. Additional work is needed to explain why corn-based diets in the present study had
faster starch disappearance rates than corresponding barley diets.
Calculated fiber disappearance rate was not influenced by starch source (P = 0.98), fiber
source (P = 0.21), or the interaction of starch and fiber sources (P = 0.47). The corn and beet pulp
diet resulted in the numerically fastest fiber disappearance rate, perhaps reflecting an optimized
pairing of starch and fiber sources. The corn and timothy hay diets resulted in the lowest

93
disappearance rate. Varga and Hoover (1983) did not statistically compare timothy hay and beet
pulp degradation rates but reported close values of 6.2 %/h and 5.5 %/h, respectively, which agreed
with the lack of difference in disappearance rate observed in the present work.
Extent of fiber disappearance was impacted by fiber source (P = 0.0007) and starch source
(P = 0.0009). The interaction of starch and fiber source tended to (P = 0.11) influence fiber extent
of disappearance. Beet pulp had higher extent of fiber disappearance than timothy hay diets. This
was expected because beet pulp is a more rapidly degradable fiber source compared to other by-
product feedstuffs (DePeters et al., 1997; Fadel et al., 2000) and timothy hay is known to have a
thicker, denser cell wall than beet pulp (Van Soest et al., 1991). Varga and Hoover (1983) reported
different extents of degradation for beet pulp (68.9 % total NDF) and timothy (47.1 % total NDF),
which are similar to the values calculated in the present study.
Rumen pH
Rumen pH responses are presented in Figure 4. Rumen pH was affected by the fiber source
used in treatment diets (Starch P = 0.13; Fiber P = 0.02; Starch x Fiber P = 0.18). Heifers
consuming timothy hay diets had higher ruminal pH in comparison to beet pulp diets (Figure 4).
This result was expected because the role of forage NDF in maintaining rumen health has been
well-characterized (White et al., 2017a; White et al., 2017b). The more soluble fiber present in
beet pulp is not expected to have the same buffering characteristics as forage NDF. The lack of a
starch source effect is understandable because the extent of starch disappearance was not different
among starch sources. Additionally, by feeding every 2 h diurnal pH fluctuations associated with
different rates of starch disappearance could have been minimized.

94
Volatile Fatty Acid Molar Proportions and Concentrations
Treatment means and P-values for rumen VFA molar proportions and concentrations are
shown in Tables 2 and 3, respectively. The VFA concentrations are reported for coherence with
the previous literature only. Hall et al. (2015) demonstrated that concentrations are unreliable
representations of treatment effects because they fail to account for fluid pool size, absorption, or
passage. As such, only molar proportions, and calculated total VFA pool size and fluid mediated
fluxes are discussed. Isovalerate (% mol) was the only rumen VFA to be influenced by a starch
by fiber interaction (P = 0.05). Heifers consuming the C-TH diet had the highest molar
proportion of isovalerate, contrastingly, heifers consuming the C-BP diet had the lowest molar
proportion of isovalerate. The review by Andries et al. (1987) suggests the catabolism of amino
acids is a primary cause of branched chain volatile fatty acid (BCVFA) production. The
inconsistent fluctuations of isovalerate molar percentage could be explained by varying ruminal
protein degradability within the individual feedstuffs (corn versus barley; TH versus BP) even
though diets were formulated to be isonitrogenous. Molar proportions of ruminal acetate (P =
0.02) and isovalerate (P = 0.008) were greater when animals were fed timothy hay diets in
comparison to BP diets. Ruminal propionate (P = 0.06) and valerate (P = 0.10) molar
proportions also tended to increase when animals were fed BP diets in comparison to TH diets.
This shift in VFA molar proportions from an acetate-based fermentation towards increased
proportions of propionate and valerate is likely due to the increased ruminal degradability of
NDF on the BP diets. Ruminal propionate (P = 0.02) and valerate (P = 0.049) molar percentages
were decreased on barley diets, but butyrate molar percentage increased (P = 0.04) in
comparison to corn diet counterparts. The shift from propionate and valerate to increased

95
butyrate may have been due to the slower apparent starch degradation rate of barley- versus
corn-based diets.
Rumen Fluid Volume
Estimated rumen fluid pool size (rumen fluid volume) and rumen fluid passage rate are
shown in Figure 5. Both estimated rumen fluid volume (L) (Starch P = 0.31; Fiber P = 0.75; Starch
x Fiber P = 0.55) and estimated rate of passage (%/h) (Starch P = 0.68; Fiber P = 0.80; Starch x
Fiber P = 0.30) were unaffected by treatment (Figure 5). Fluid volume and passage rate are
dependent upon water intake and osmolality. Water intake can be influenced by dry matter intake
(Little and Shaw, 1978); however, the significant fiber effect on DMI observed in this study did
not translate to significant differences in fluid volume or passage rate. Osmolality of rumen fluid
was not measured in this study but it is possible that shifts in osmolality offset any potential shifts
in water intake associated with different DMI among diets. Conversely, it is possible that the
differences in water intake and osmolality among diets were insufficient to drive changes in fluid
volume and passage rate. Due to the similarity among diets, we believe the latter is more likely.
Estimated rumen fluid passage (L/h) was also calculated by multiplying estimated rumen
fluid volume by estimated rate of passage. Estimated rate of passage (L/h) was also unaffected by
treatment (Starch P = 0.31; Fiber P = 0.52; Starch x Fiber P = 0.23). Although not statistically
significant, the fluid passage (L/h) data followed a similar pattern to the extent of fiber degradation
data, where the BP-T diet was different from the other diets, suggesting a possible relationship
between the extent of fiber degradation and the fluid movement from the rumen.
Individual VFA Pool Size and Calculated Fluid-Mediated Flux

96
Individual VFA pool size and calculated fluid-mediated flux (from the rumen through
liquid passage) are shown in Table 4. None of the estimated VFA pool sizes were affected by diet
(P > 0.15). This lack of significance further highlights the need to evaluate fermentations in the
context of fluid dynamics. If we had evaluated differences based on concentration or molar
proportion alone, the results may have suggested greater differences among diets than are implied
based on this pool-size analysis.
In contrast to the lack of change in fluid passage rate, TH diets significantly increased
isovalerate passage from the rumen with the fluid fraction (P = 0.05). Barley also tended to result
in greater fluid-mediated exit of isovalerate (P = 0.13) and butyrate (P = 0.14) from the rumen.
These results are a direct product of numerical differences in isovalerate and butyrate
concentrations among diets and fluid passage rates. Interpreting the biological significance of
fluid-mediated VFA exit from the rumen is difficult because most of this VFA is likely absorbed
in downstream portions of the gastrointestinal tract. Thus, its difference from VFA absorbed
directly from the rumen is likely minimal. Future work quantifying post-ruminal VFA absorption
may help clarify the biological importance of this flux.
Gene Expression
Gene name, abbreviation, function, starch source, fiber source, and starch by fiber
interaction P-values are presented in Table 5. Beet pulp tended to promote expression of the BDH1
gene (P = 0.08). This shift in BDH1 expression is likely due to the tendency for higher butyrate
concentrations and molar proportions on BP diets. Increased butyrate availability will likely drive
metabolism of butyrate in the rumen epithelium, resulting in increased expression of genes
involved in that metabolic pathway. Not all genes involved in butyrate metabolism were
differentially expressed on BP diets. This inconsistency may reflect insufficient variation among

97
responses to reliably detect differences between treatments or could indicate that BDH1 is more
rate-limiting that other steps in this pathway.
Sodium hydrogen exchanger isoform 3 expression was higher on TH diets than on BP diets
(P = 0.05) (Table 5). This result is consistent with the rumen pH data, which showed higher pH on
TH diets than on BP diets (Figure 4). Sodium hydrogen exchanger isoform 3 (Figure 1) helps
maintain epithelium homeostasis by transporting sodium into the cell, and transporting protons
into the rumen. The activation of this gene may reflect increased pressure to maintain both ruminal
and epithelial homeostasis on diets with differing pH, as has been suggested by Steele et al. (2011).
Monocarboxylate transporter isoform 4 tended to be affected by fiber source, with
increased relative expression on TH diets (P = 0.06) (Table 5). Monocarboxylate transporter
isoform 4 is responsible for short chain fatty acid (SCFA) transport across the rumen epithelium
and maintenance of epithelium ion homeostasis (Figure 1). It was expected that the apical-most
transporters (MCT4 and NHE3) would be affected by diet because they would have the most
prolonged and abundant contact with feed. However, it was also expected that NHE1 and MCT1
would be affected by treatment because the two types of transporters tend to work in tandem with
different isoforms. The lack of change in NHE1 and MCT1 does support the theory that strata
position of the transporter may be a driving force in regulation of expression.
Timothy hay diets increased expression of HSP70 in comparison to BP counterparts (P =
0.02). Heat shock protein-70 connections to heat stress have been investigated in ruminants and
HSP70 is responsible for the folding and unfolding of other proteins particularly under thermal
stress conditions to prevent protein aggregation (Mishra and Palai, 2014). Heat shock protein-70
also has shown to be maximally expressed at a rumen pH of 6.0 to 6.4 in goats (Hollman et al.,
2013). Timothy hay diets had greater average rumen pH in comparison to their BP counterparts

98
(Figure 4). It is possible TH diets fostered an environment for HSP70 to be upregulated. Hollman
et al. (2013) also investigated the impacts of high energy diets (i.e. rapidly fermentable diets) on
HSP70 expression, which was lowly expressed at the protein level used in their treatments. In the
present study, there was no starch source effect on HSP70 suggesting high energy feedstuffs did
not drive HSP70 expression at the gene level. Additional research is needed to understand why
these diets caused shifts in HSP70.
Blood Metabolites
Table 6 includes plasma concentrations of acetate, propionate, BHB, glucose, and insulin
of the different treatments and the treatment P-values. Acetate was the only metabolite that tended
to be affected by treatment (Starch x Fiber P = 0.067). It was unexpected that acetate
concentrations would be changed due to treatment because we expected blood acetate to be utilized
by peripheral tissues and regulated to some homeostasis before samples were taken at the tail vein.
The B-BP diet had the greatest blood acetate concentration and the C-BP diet had the lowest blood
acetate concentration. The direction and magnitude of blood acetate differences does not map to
VFA pool size data, VFA concentration data, or VFA molar proportions. This discrepancy
highlights challenges with using blood VFA concentrations as a means of representing changes in
metabolite availability associated with treatment. Future work is needed to more thoroughly
understand the relationships between post-absorptive VFA supply and blood VFA concentrations.
Plasma propionate, BHB, glucose, and insulin concentrations were unaffected by starch or
fiber source (Table 6). It was expected that blood propionate concentrations would not change
because propionate is most likely metabolized by the liver prior to sample collection. Previous
work measuring blood propionate concentrations during a jugular propionate infusion also found
that shifts in propionate concentration are not sustained, indicating homeostatic mechanisms to
99
maintain blood propionate concentration (Bedford et al., In Press). Like ruminal VFA
concentrations, blood VFA concentrations only provide a snapshot of biological responses (Hall
et al., 2015). Therefore, additional flux-based work is needed to more completely understand blood
VFA metabolism.
Conclusions
This study demonstrated that nutrient degradability is a factor driving VFA dynamics and
subsequent epithelial responses. The fiber sources used in this study generated more measurable
shifts in fermentation than the starch sources. Additional work on starch sources differing in extent
of degradation is needed to understand whether this relative importance is simply reflecting the
relative importance of extent of ruminal degradation versus rate of degradation. The work also
provides further evidence for the need for more holistic evaluation of how diets influence the
fermentation environment of the rumen, including the epithelium.
Acknowledgements
Research supported by state and federal funds appropriated to Virginia Tech, and by USDA-NIFA
project numbers 2015-03656, 2017-05943.
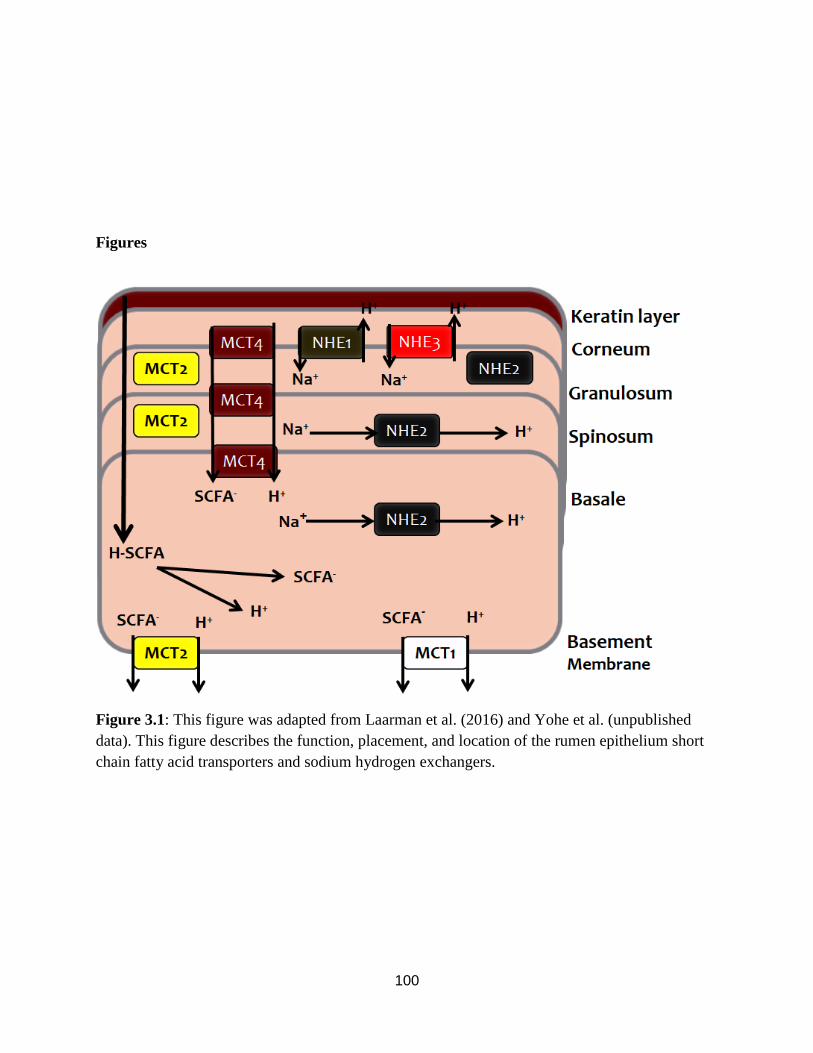
100
Figures
Figure 3.1: This figure was adapted from Laarman et al. (2016) and Yohe et al. (unpublished
data). This figure describes the function, placement, and location of the rumen epithelium short
chain fatty acid transporters and sodium hydrogen exchangers.

101
Figure 3.2: Dry matter intake in kg/d for each treatment diet is shown in the first chart (Starch P
= 0.29; Fiber P = 0.009; Starch x Fiber P = 0.46). Average daily gain in kg/d for each treatment
diet is shown in the second chart (Starch P = 0.74; Fiber P = 0.41; Starch x Fiber P = 0.88). The
minimum and maximum average daily gain ranged from 0.60 kg/d to 0.90 kg/day for all the
treatments, and some animals were either significantly below or above these averages causing a
large SE. Significance is determined by P < 0.05 and tendency by P < 0.15.
B-TH: Ground Barley and Timothy Hay Pellets
B-BP: Ground Barley and Beet Pulp Pellets
C-TH: Ground Corn and Timothy Hay Pellets
C-BP: Ground Corn and Beet Pulp Pellets
11.2910.25
12.0110.29
0
2
4
6
8
10
12
14
B-TH B-BP C-TH C-BP
Dry
Mat
ter
Inta
ke
(kg/d
)
Dry Matter Intake
0.81 0.9
0.6
0.76
0
0.2
0.4
0.6
0.8
1
1.2
1.4
1.6
B-TH B-BP C-TH C-BP
Aver
age
Dai
ly G
ain (
kg/d
)
Average Daily Gain
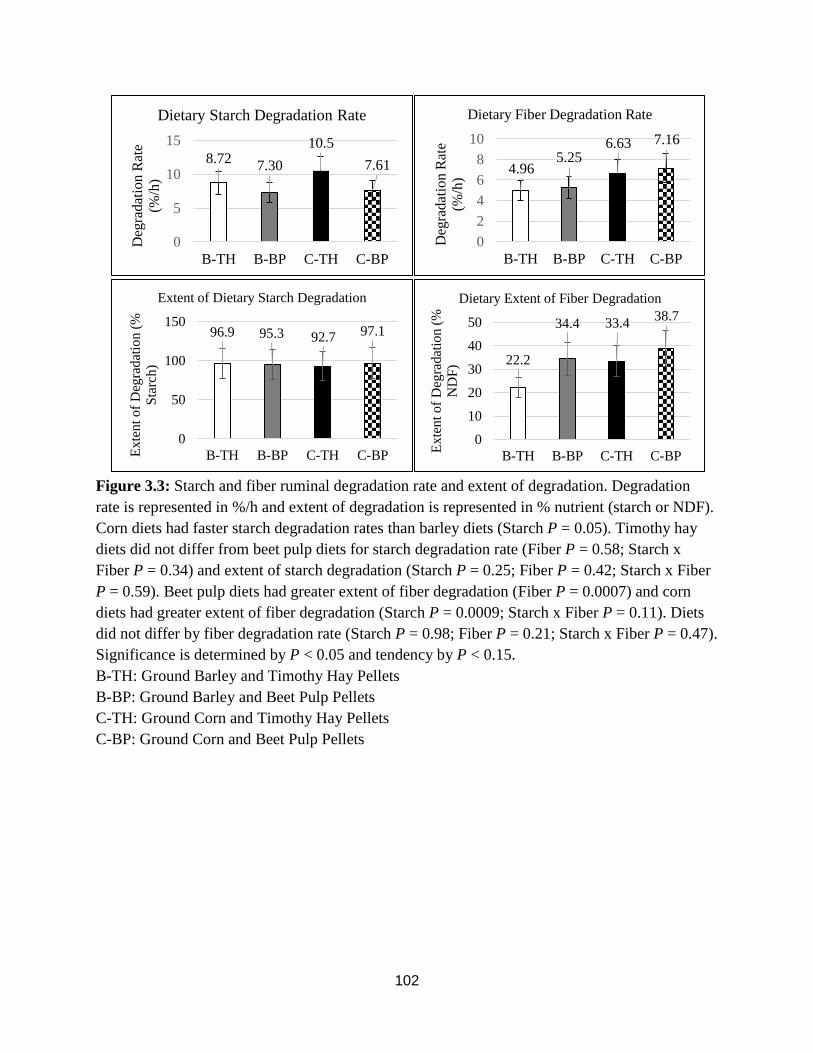
102
Figure 3.3: Starch and fiber ruminal degradation rate and extent of degradation. Degradation
rate is represented in %/h and extent of degradation is represented in % nutrient (starch or NDF).
Corn diets had faster starch degradation rates than barley diets (Starch P = 0.05). Timothy hay
diets did not differ from beet pulp diets for starch degradation rate (Fiber P = 0.58; Starch x
Fiber P = 0.34) and extent of starch degradation (Starch P = 0.25; Fiber P = 0.42; Starch x Fiber
P = 0.59). Beet pulp diets had greater extent of fiber degradation (Fiber P = 0.0007) and corn
diets had greater extent of fiber degradation (Starch P = 0.0009; Starch x Fiber P = 0.11). Diets
did not differ by fiber degradation rate (Starch P = 0.98; Fiber P = 0.21; Starch x Fiber P = 0.47).
Significance is determined by P < 0.05 and tendency by P < 0.15.
B-TH: Ground Barley and Timothy Hay Pellets
B-BP: Ground Barley and Beet Pulp Pellets
C-TH: Ground Corn and Timothy Hay Pellets
C-BP: Ground Corn and Beet Pulp Pellets
8.727.30
10.5
7.61
0
5
10
15
B-TH B-BP C-TH C-BP
Deg
rad
atio
n R
ate
(%/h
)
Dietary Starch Degradation Rate
4.965.25
6.63 7.16
0
2
4
6
8
10
B-TH B-BP C-TH C-BP
Deg
rad
atio
n R
ate
(%/h
)
Dietary Fiber Degradation Rate
96.9 95.3 92.7 97.1
0
50
100
150
B-TH B-BP C-TH C-BPExte
nt
of
Deg
rad
atio
n (
%
Sta
rch
)
Extent of Dietary Starch Degradation
22.2
34.4 33.438.7
0
10
20
30
40
50
B-TH B-BP C-TH C-BP
Exte
nt
of
Deg
rad
atio
n (
%
ND
F)
Dietary Extent of Fiber Degradation

103
Figure 3.4: Average rumen pH for each treatment diet. Ruminal pH was spot sampled every six
hours during d 15 to d 17 of each period. Timothy hay diets had greater rumen pH than beet pulp
diets (P = 0.02). Corn diets tended to have greater rumen pH (P = 0.13) than barley diets. There
was no interaction effect (Starch x Fiber P = 0.18). Significance is determined by P < 0.05 and
tendency by P < 0.15.
B-TH: Ground Barley and Timothy Hay Pellets
B-BP: Ground Barley and Beet Pulp Pellets
C-TH: Ground Corn and Timothy Hay Pellets
C-BP: Ground Corn and Beet Pulp Pellets
6.486.44
6.57
6.45
6.2
6.25
6.3
6.35
6.4
6.45
6.5
6.55
6.6
6.65
6.7
B-TH B-BP C-TH C-BP
pH
Rumen pH

104
Figure 3.5: Rumen fluid pool size (first chart) describes the amount of fluid volume in the rumen in liters. Treatment diets did not
differ in rumen fluid pool size (Starch P = 0.31; Fiber P = 0.75; Starch x Fiber P = 0.55). Rumen fluid passage rate (second chart)
describes the rate of fluid exit out of the rumen in percent per hour (Starch P = 0.68; Fiber P = 0.80; Starch x Fiber P = 0.30). Rumen
fluid passage (third chart) describes the rate of fluid exit out of the rumen in liters per hour (Starch P = 0.31; Fiber P = 0.52; Starch x
Fiber P = 0.23). Significance is determined by P < 0.05 and tendency by P < 0.15.
B-TH: Ground Barley and Timothy Hay Pellets
B-BP: Ground Barley and Beet Pulp Pellets
C-TH: Ground Corn and Timothy Hay Pellets
C-BP: Ground Corn and Beet Pulp Pellets
65.255.0
42.4 43.9
0
20
40
60
80
B-TH B-BP C-TH C-BP
Rum
en F
luid
(L
)Rumen Fluid Pool Size
12.411.3
13.615.7
0
5
10
15
20
B-TH B-BP C-TH C-BP
Flu
id P
assa
ge
Rat
e
(%/h
)
Rumen Fluid Passage Rate
7.64
5.41 5.11 5.68
0
2
4
6
8
10
B-TH B-BP C-TH C-BPFlu
id P
assa
ge
Rat
e (L
/h)
Rumen Fluid Passage

105
Tables
Table 3.1: Diet ingredient and nutrient inclusion for each treatment diet.
Ingredients, % of DM B-TH1 B-BP2 C-TH3 C-BP4
Timothy Hay 19.9 0.02 25.0 1.43
Beet Pulp 6.05 30.2 3.55 32.9
Ground Corn 0.38 0.00 10.5 12.3
Ground Barley 14.1 14.8 0.67 0.31
Corn Silage 34.4 35.6 35.2 29.4
Corn Gluten Feed 3.26 0.00 1.65 7.22
Soybean meal 9.30 17.1 9.95 15.3
Blood Meal 3.78 0.00 4.37 0.04
Nutrient, % of DM5
DM 64.8 73.4 63.9 74.7
NDF 35.0 35.0 35.0 35.0
Starch 20.0 20.0 20.0 20.0
CP 15.9 16.0 15.9 16.0
ME, Mcal/kg 2.63 2.74 2.62 2.75 1B-TH: Ground Barley and Timothy Hay Pellets 2B-BP: Ground Barley and Beet Pulp Pellets 3C-TH: Ground Corn and Timothy Hay Pellets 4C-BP: Ground Corn and Beet Pulp Pellets 5Diets were formulated to have similar nutrient inclusion (% of DM).
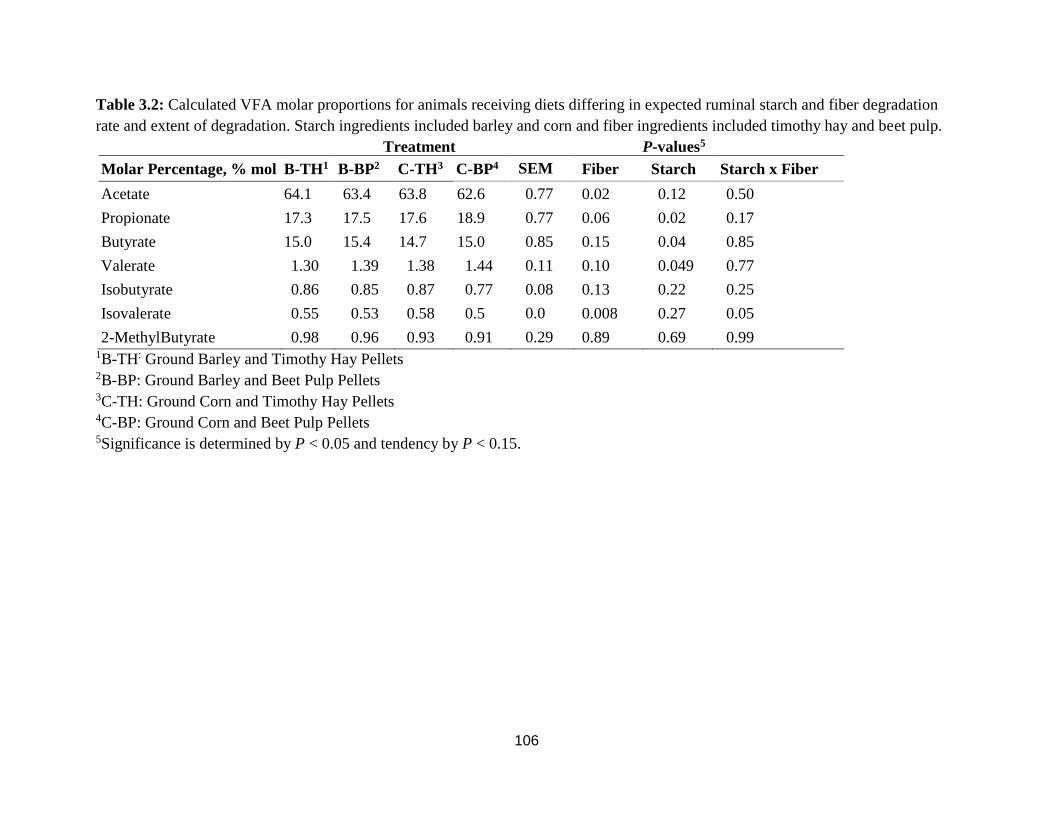
106
Table 3.2: Calculated VFA molar proportions for animals receiving diets differing in expected ruminal starch and fiber degradation
rate and extent of degradation. Starch ingredients included barley and corn and fiber ingredients included timothy hay and beet pulp.
Treatment P-values5
Molar Percentage, % mol B-TH1 B-BP2 C-TH3 C-BP4 SEM Fiber Starch Starch x Fiber
Acetate 64.1 63.4 63.8 62.6 0.77 0.02 0.12 0.50
Propionate 17.3 17.5 17.6 18.9 0.77 0.06 0.02 0.17
Butyrate 15.0 15.4 14.7 15.0 0.85 0.15 0.04 0.85
Valerate 1.30 1.39 1.38 1.44 0.11 0.10 0.049 0.77
Isobutyrate 0.86 0.85 0.87 0.77 0.08 0.13 0.22 0.25
Isovalerate 0.55 0.53 0.58 0.5 0.0 0.008 0.27 0.05
2-MethylButyrate 0.98 0.96 0.93 0.91 0.29 0.89 0.69 0.99 1B-TH: Ground Barley and Timothy Hay Pellets 2B-BP: Ground Barley and Beet Pulp Pellets 3C-TH: Ground Corn and Timothy Hay Pellets 4C-BP: Ground Corn and Beet Pulp Pellets 5Significance is determined by P < 0.05 and tendency by P < 0.15.

107
Table 3.3: VFA concentrations for animals receiving diets differing in expected ruminal starch and fiber degradation rate and extent
of degradation. Starch ingredients included barley and corn and fiber ingredients included timothy hay and beet pulp.
Treatment P-values5
VFA Concentration, mM B-TH1 B-BP2 C-TH3 C-BP4 SEM Fiber Starch Starch x Fiber
Acetate 82.5 79.8 87.0 71.2 8.24 0.009 0.37 0.05
Propionate 22.2 21.8 24.2 21.8 1.87 0.16 0.26 0.28
Butyrate 19.4 19.5 19.8 17.2 2.43 0.14 0.12 0.12
Valerate 1.67 1.76 1.88 1.67 0.28 0.014 0.25 0.05
Isobutyrate 1.10 1.06 1.19 0.85 0.18 0.0031 0.36 0.02
Isovalerate 0.70 0.66 0.80 0.50 0.16 0.47 0.28 0.58
2-MethylButyrate 1.29 1.19 1.29 1.01 0.46 0.28 0.47 0.58
Total VFA 129 126 136 114 14.8 0.02 0.49 0.06
Total BCVFA 4.80 4.70 5.09 4.03 0.79 0.04 0.32 0.09 1B-TH: Ground Barley and Timothy Hay Pellets 2B-BP: Ground Barley and Beet Pulp Pellets 3C-TH: Ground Corn and Timothy Hay Pellets 4C-BP: Ground Corn and Beet Pulp Pellets 5Significance was determined for a P < 0.05 and a tendency P < 0.15.
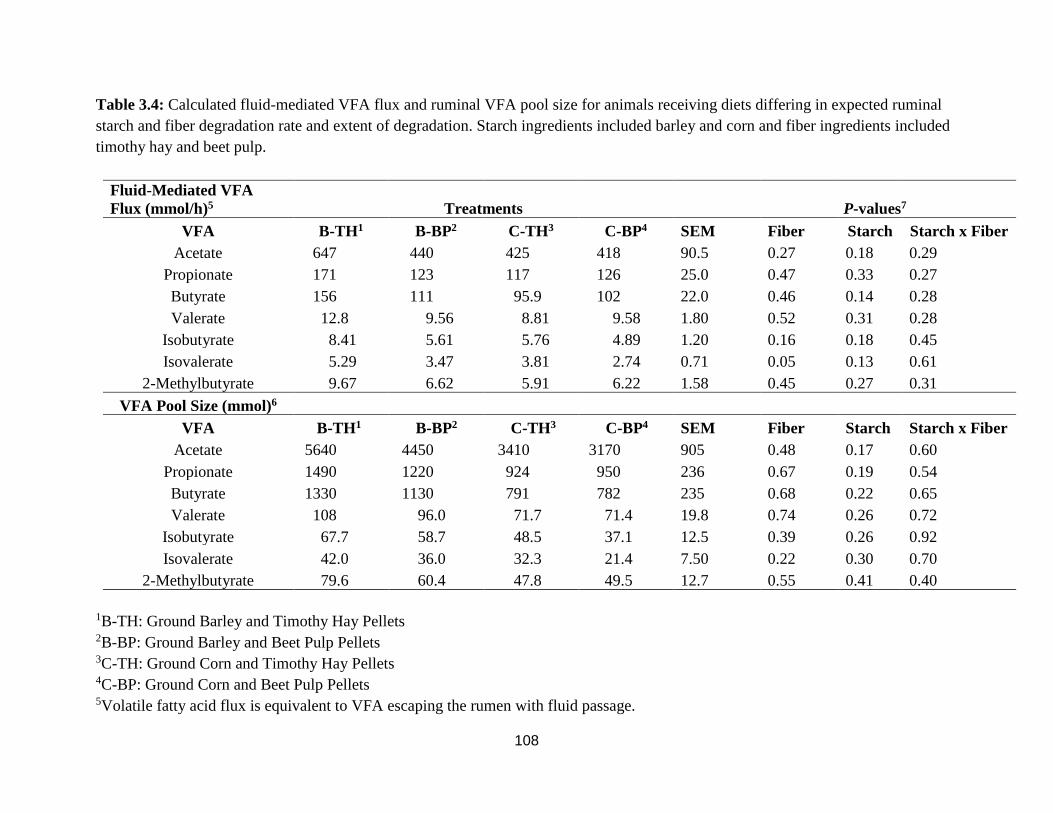
108
Table 3.4: Calculated fluid-mediated VFA flux and ruminal VFA pool size for animals receiving diets differing in expected ruminal
starch and fiber degradation rate and extent of degradation. Starch ingredients included barley and corn and fiber ingredients included
timothy hay and beet pulp.
Fluid-Mediated VFA
Flux (mmol/h)5 Treatments P-values7
VFA B-TH1 B-BP2 C-TH3 C-BP4 SEM Fiber Starch Starch x Fiber
Acetate 647 440 425 418 90.5 0.27 0.18 0.29
Propionate 171 123 117 126 25.0 0.47 0.33 0.27
Butyrate 156 111 95.9 102 22.0 0.46 0.14 0.28
Valerate 12.8 9.56 8.81 9.58 1.80 0.52 0.31 0.28
Isobutyrate 8.41 5.61 5.76 4.89 1.20 0.16 0.18 0.45
Isovalerate 5.29 3.47 3.81 2.74 0.71 0.05 0.13 0.61
2-Methylbutyrate 9.67 6.62 5.91 6.22 1.58 0.45 0.27 0.31
VFA Pool Size (mmol)6
VFA B-TH1 B-BP2 C-TH3 C-BP4 SEM Fiber Starch Starch x Fiber
Acetate 5640 4450 3410 3170 905 0.48 0.17 0.60
Propionate 1490 1220 924 950 236 0.67 0.19 0.54
Butyrate 1330 1130 791 782 235 0.68 0.22 0.65
Valerate 108 96.0 71.7 71.4 19.8 0.74 0.26 0.72
Isobutyrate 67.7 58.7 48.5 37.1 12.5 0.39 0.26 0.92
Isovalerate 42.0 36.0 32.3 21.4 7.50 0.22 0.30 0.70
2-Methylbutyrate 79.6 60.4 47.8 49.5 12.7 0.55 0.41 0.40
1B-TH: Ground Barley and Timothy Hay Pellets 2B-BP: Ground Barley and Beet Pulp Pellets 3C-TH: Ground Corn and Timothy Hay Pellets 4C-BP: Ground Corn and Beet Pulp Pellets 5Volatile fatty acid flux is equivalent to VFA escaping the rumen with fluid passage.

109
6Volatile fatty acid pool size describes the amount present as a function of rumen liquid volume. 7Significance was determined with a P < 0.05 and a tendency P < 0.15.

110
Table 3.5: Gene name, abbreviation, function, and starch, fiber, and starch by fiber P-values for
each gene investigated when animals were fed diet differing in expected fiber and starch
degradation rate and extent of degradation.
P-values1
Gene Name Abbreviation Function Fiber Starch Starch x Fiber
Acetoacetyl-CoA
Synthetase AACS
Converts acetoacetate to
acetoacetyl-CoA 0.17 0.35 0.39
Beta-Hydroxybutyrate
Dehydrogenase BDH1
Converts acetoacetate to
beta-hydroxybutyrate 0.08 0.62 0.14
3-Hydroxymethyl-3-
Methylglutaryl-CoA Lyase HMGCL
Converts 3-hydroxy-3-
methylglutaryl-CoA to
acetyl-CoA and
acetoacetate. 0.44 0.26 0.16
3-Hydroxy-3-
Methylglutaryl-CoA
Synthase 2 HMGCS2
Converts acetoacetyl-
CoA to HMG-CoA 0.79 0.37 0.67
Serine-Threonine Protein
Kinase B AKT1
mTOR signaling; cell
growth and proliferation 0.16 0.16 0.17
Heat Shock Protein 70 HSP70
protein folding and
unfolding 0.05 0.44 0.45
Claudin-1 CLDN1
Properties of epithelial
tight junctions 0.21 0.77 0.51
Gap Junction Protein Alpha
1 GJA1
Encodes Connexin
proteins 0.49 0.38 0.41
Monocarboxylate
Transporter Isoform 1 MCT1
Short chain fatty acid
and proton symporter 0.09 0.95 0.69
Monocarboxylate
Transporter Isoform 2 MCT2
Short chain fatty acid
symporter 0.18 0.20 0.58
Monocarboxylate
Transporter Isoform 4 MCT4
Short chain fatty acid
and proton symporter 0.06 0.15 0.19
Sodium Hydrogen
Exchanger Isoform 1 NHE1
Sodium hydrogen
antiporter 0.77 0.97 0.69
Sodium Hydrogen
Exchanger Isoform 2 NHE2
Intracellular sodium
hydrogen exchanger 0.27 0.71 0.52
Sodium Hydrogen
Exchanger Isoform 3 NHE3
Sodium hydrogen
antiporter 0.05 0.32 0.12
1Significance was determined with P < 0.05 and a tendency P < 0.15.

111
Table 3.6: Blood plasma metabolite concentrations for each treatment diet, which were
formulated based on expected ruminal starch and fiber degradation rate and extent of
degradation. Acetate, propionate, and beta-hydroxybutyrate are presented in mM, glucose in
mg/dL, and insulin uIU/mL.
Treatments P-value5
Metabolite B-TH1 B-BP2 C-TH3 C-BP4 SEM Fiber Starch Starch x
Fiber
Acetate, mM 0.73 1.04 0.87 0.49 0.21 0.71 0.16 0.067
Propionate, mM 0.076 0.079 0.078 0.074 0.005
0.99 0.77 0.46
Beta-
hydroxybutyrate, mM
0.25 0.33 0.35 0.34 0.10 0.33 0.24 0.31
Glucose, mg/dL 86.0 85.9 79.4 62.7 13.5 0.22 0.18 0.47
Insulin, uIU/mL 15.7 14.7 12.2 16.5 2.91 0.47 0.80 0.28
1B-TH: Ground Barley and Timothy Hay Pellets 2B-BP: Ground Barley and Beet Pulp Pellets 3C-TH: Ground Corn and Timothy Hay Pellets 4C-BP: Ground Corn and Beet Pulp Pellets 5Significance was determined with P < 0.05 and a tendency P < 0.15.
112
References
Allen, M.S. 2000. Effects of diet on short-term regulation of feed intake by lactating dairy cattle.
J. Dairy Sci. 83:1598–1624. Doi: 10.3168/jds.S0022-0302(00)75030-2.
Allen, M.S., B.J. Bradford, and M. Oba. 2009. Board Invited Review: The hepatic oxidation theory
of the control of feed intake and its application to ruminants. J. Anim. Sci. 87:3317–3334.
Doi: 10.2527/jas.2009-1779.
Altaner, C.M., L.H. Thomas, A.N. Fernandes, and M.C. Jarvis. 2014. How cellulose stretches:
synergism between covalent and hydrogen bonding. Biomacromolecules 15:791–798.
Doi: 10.1021/bm401616n.
Ardito, F., M. Giuliani, D. Perrone, G. Troiano, and L. Lo Muzio. 2017. The crucial role of protein
phosphorylation in cell signaling and its use as targeted therapy. Int. J. Mol. Med. 40:271–
280. Doi: 10.3892/ijmm.2017.3036.
Bedford, A., L. Beckett, K. Hardin, N.W. Dias, T. Davis, V.R.G. Mercadante, A.D. Ealy, and R.R.
White. 2018. Propionate Affects Insulin Signaling and Progesterone Profiles in Dairy
Heifers. Sci. Rep. 8:17629. Doi: 10.1038/s41598-018-35977-1.
Bergman, E.N. 1990. Energy contributions of volatile fatty acids from the gastrointestinal tract in
various species. Physiol. Rev. 70:567–590. Doi: 10.1152/physrev.1990.70.2.567.
Cho, H., J.L. Thorvaldsen, Q. Chu, and F. Feng. 2001. Akt1/PKBα is required for normal growth
but dispensable for maintenance of glucose homeostasis in mice. J Biol. Chem. Doi:
10.1074/jbc.C100462200.
Deckardt, K., A. Khol-Parisini, and Q. Zebeli. 2013. Peculiarities of enhancing resistant starch in
ruminants using chemical methods: opportunities and challenges. Nutrients 5:1970–1988.
Doi: 10.3390/nu5061970.
DePeters, E.J., J.G. Fadel, and A. Arosemena. 1997. Digestion kinetics of neutral detergent fiber
and chemical composition within some selected by-product feedstuffs. Anim. Feed Sci.
Technol. 67:127–140. Doi: 10.1016/0377-8401(96)01145-5.
Dijkstra, J., H. Boer, J. Van Bruchem, M. Bruining, and S. Tamminga. 1993. Absorption of
volatile fatty acids from the rumen of lactating dairy cows as influenced by volatile fatty
acid concentration, pH and rumen liquid volume. Br. J. Nutr. 69:385–396. Doi:
10.1079/BJN19930041.
Fadel, J.G., E.J. DePeters, and A. Arosemena. 2000. Composition and digestibility of beet pulp
with and without molasses and dried using three methods. Anim. Feed Sci. Technol.
85:121–129. Doi: 10.1016/S0377-8401(00)00136-X.
113
Ferreira, G., Y. Yang, C.L. Teets, W.S. Brooks, and C.A. Griffey. 2018. Technical note: In situ
ruminal starch disappearance kinetics of hull-less barley, hulled barley, and corn grains. J.
Dairy Sci. 101:6150–6154. Doi: 10.3168/jds.2018-14512.
France, J., and J. Dijkstra. 2005. Volatile fatty acid production. Quantitative aspects of ruminant
digestion and metabolism 2:157–175. Doi: 10.1079/9780851998145.0157.
Golder, H.M., P. Celi, A.R. Rabiee, and I.J. Lean. 2014. Effects of feed additives on rumen and
blood profiles during a starch and fructose challenge. J. Dairy Sci. 97:985–1004. Doi:
10.3168/jds.2013-7166.
Graham, C., and N.L. Simmons. 2005. Functional organization of the bovine rumen epithelium.
Am. J. Physiol. Regul. Integr. Comp. Physiol. 288:R173–81. Doi:
10.1152/ajpregu.00425.2004.
Hall, M.B. 2015. Determination of dietary starch in animal feeds and pet food by an enzymatic-
colorimetric method: collaborative study. J. AOAC Int. 98:397–409. Doi:
10.5740/jaoacint.15-012.
Hall, M.B. 2017. Polyethylene Glycol (PEG) in rumen fluid fluorescence analysis. Unpublished
protocol.
Hall, M.B., T.D. Nennich, P.H. Doane, and G.E. Brink. 2015. Total volatile fatty acid
concentrations are unreliable estimators of treatment effects on ruminal fermentation in
vivo1. J. Dairy Sci. 98:3988–3999. Doi: 10.3168/jds.2014-8854.
Hollmann, M., I. Miller, K. Hummel, S. Sabitzer, B.U. Metzler-Zebeli, E. Razzazi-Fazeli, and Q.
Zebeli. 2013. Downregulation of cellular protective factors of rumen epithelium in goats
fed high energy diet. PLoS One 8:e81602. Doi: 10.1371/journal.pone.0081602.
Klusmeyer, T.H., J.H. Clark, J.L. Vicini, M.R. Murphy, and G.C. Fahey. 1987. Effects of Feeding
or Infusing Ammonium Salts of Volatile Fatty Acids on Ruminal Fermentation, Plasma
Characteristics, and Milk Production of Cows1. J. Dairy Sci. 70:50–63. Doi:
10.3168/jds.S0022-0302(87)79979-2.
Krämer, M., P. Lund, and M.R. Weisbjerg. 2013. Rumen passage kinetics of forage- and
concentrate-derived fiber in dairy cows. J. Dairy Sci. 96:3163–3176. Doi:
10.3168/jds.2012-6146.
Kristensen, N.B. 2000. Quantification of Whole Blood Short-chain Fatty Acids by Gas
Chromatographic Determination of Plasma 2-chloroethyl Derivatives and Correction for
Dilution Space in Erythrocytes. Acta Agric. Scand. A Anim. Sci. 50:231–236. Doi:
10.1080/090647000750069421.

114
Kung, L., Jr, M.C. Windle, and N. Walker. 2014. The effect of an exogenous protease on the
fermentation and nutritive value of high-moisture corn. J. Dairy Sci. 97:1707–1712. Doi:
10.3168/jds.2013-7469.
Kuoppala, K., S. Ahvenjärvi, M. Rinne, and A. Vanhatalo. 2009. Effects of feeding grass or red
clover silage cut at two maturity stages in dairy cows. 2. Dry matter intake and cell wall
digestion kinetics. J. Dairy Sci. 92:5634–5644. Doi: 10.3168/jds.2009-2250.
Laarman, A.H., L. Dionissopoulos, O. AlZahal, S.L. Greenwood, M.A. Steele, and B.W. McBride.
2013. Butyrate and subacute ruminal acidosis affect abundance of membrane proteins
involved with proton and short chain fatty acid transport in the rumen epithelium of dairy
cows. Doi:10.3844/ajavssp.2013.220.229.
Laarman, A.H., R.-L.A. Pederzolli, K.M. Wood, G.B. Penner, and B.W. McBride. 2016. Effects
of subacute ruminal acidosis and low feed intake on short-chain fatty acid transporters
and flux pathways in Holstein steers. J. Anim. Sci. 94:3729–3737. Doi: 10.2527/jas.2016-
0638.
Lechartier, C., and J.-L. Peyraud. 2011. The effects of starch and rapidly degradable dry matter
from concentrate on ruminal digestion in dairy cows fed corn silage-based diets with fixed
forage proportion. J. Dairy Sci. 94:2440–2454. Doi: 10.3168/jds.2010-3285.
Little, W., and S.R. Shaw. 1978. A note on the individuality of the intake of drinking water by
dairy cows. Anim. Sci. 26:225–227. Doi: 10.1017/S0003356100039659.
Mrázek, J., K. Tepsic, G. Avgustin, and J. Kopecný. 2006. Diet-dependent shifts in ruminal
butyrate-producing bacteria. Folia Microbiol. 51:294–298. Doi: 10.1007/BF02931817.
Mishra, S.R., and T.K. Palai. 2014. Importance of heat shock protein 70 in livestock-at cellular
level. J Mol Pathophysiol. Doi: 10.5455/jmp.20141028023220.
Muller, L.D. 1987. Branched Chain Fatty Acids (Isoacids) And Valeric Acid For Ruminants. The
Professional Animal Scientist 3:9–12. Doi: 10.15232/S1080-7446(15)32370-6.
NRC - National Research Council. 2001. Nutrient requirements of dairy cattle. 7th ed. National
Academy, Washington.
Oba, M., and M.S. Allen. 2003. Effects of corn grain conservation method on feeding behavior
and productivity of lactating dairy cows at two dietary starch concentrations. J. Dairy Sci.
86:174–183. Doi: 10.3168/jds.S0022-0302(03)73598-X.
Orskov, E.R. 1986. Starch digestion and utilization in ruminants. J. Anim. Sci. 63:1624–1633.
Doi: 10.2527/jas1986.6351624x.

115
Quigley, J.D., 3rd, T.M. Steen, and S.I. Boehms. 1992. Postprandial changes of selected blood and
ruminal metabolites in ruminating calves fed diets with or without hay. J. Dairy Sci.
75:228–235. Doi: 10.3168/jds.S0022-0302(92)77757-1.
Rahman, M.M., M.A.M. Salleh, N. Sultana, M.J. Kim, and C.S. Ra. 2013. Estimation of total
volatile fatty acid (VFA) from total organic carbons (TOCs) assessment through in
vitro fermentation of livestock feeds. Afr. J. Microbiol. Res. 7:1378–1384. Doi:
10.5897/AJMR12.1694.
Smith , R. H. 1959. The development and function of the rumen in milk-fed calves. J. Agr. Sci.
52:72-78. Doi: 10.1017/S0021859600035693.
Svihus, B., A.K. Uhlen, and O.M. Harstad. 2005. Effect of starch granule structure, associated
components and processing on nutritive value of cereal starch: A review. Anim. Feed Sci.
Technol. 122:303–320. Doi: 10.1016/j.anifeedsci.2005.02.025.
Thorup, V.M., D. Edwards, and N.C. Friggens. 2012. On-farm estimation of energy balance in
dairy cows using only frequent body weight measurements and body condition score. J.
Dairy Sci. 95:1784–1793. Doi: 10.3168/jds.2011-4631.
Van Soest, P.J., J.B. Robertson, and B.A. Lewis. 1991. Methods for dietary fiber, neutral detergent
fiber, and nonstarch polysaccharides in relation to animal nutrition. J. Dairy Sci. 74:3583–
3597. Doi: 10.3168/jds.S0022-0302(91)78551-2.
Varga, G.A., and W.H. Hoover. 1983. Rate and Extent of Neutral Detergent Fiber Degradation
of Feedstuffs in Situ1. J. Dairy Sci. 66:2109–2115. Doi: 10.3168/jds.S0022-
0302(83)82057-8.
Wang, B., D. Wang, X. Wu, J. Cai, M. Liu, X. Huang, J. Wu, J. Liu, and L. Guan. 2017. Effects
of dietary physical or nutritional factors on morphology of rumen papillae and
transcriptome changes in lactating dairy cows based on three different forage-based diets.
BMC Genomics 18:353. Doi: 10.1186/s12864-017-3726-2.
White, R.R., M.B. Hall, J.L. Firkins, and P.J. Kononoff. 2017a. Physically adjusted neutral
detergent fiber system for lactating dairy cow rations. I: Deriving equations that identify
factors that influence effectiveness of fiber. J. Dairy Sci. 100:9551–9568. Doi:
10.3168/jds.2017-12765.
White, R.R., M.B. Hall, J.L. Firkins, and P.J. Kononoff. 2017b. Physically adjusted neutral
detergent fiber system for lactating dairy cow rations. II: Development of feeding
recommendations. J. Dairy Sci. 100:9569–9584. Doi: 10.3168/jds.2017-12766.
Yohe, T.T. Unpublished data. Nutritional impacts on rumen growth and development.

116
GENERAL CONCLUSION
The overarching goal to this work was to investigate different ways to increase feed
efficiency. Feed efficiency is affected by multiple factors such as basal metabolic rate, production
level, absorbed profile of energy substrate, genetics, and gut microbial populations. The two
factors investigated in this work were skeletal muscle metabolic rate and VFA dynamics because
these factors are easily measurable, quantifiable, and have a shorter intervention interval (i.e.,
genetics can take years to alter). If skeletal muscle metabolic rate is measured from multiple muscle
types and locations, then basal metabolic rate could be calculated allowing better understanding of
individual animal maintenance requirements. Feed type, substrate source, rumen environment
(e.g., pH), rumen fluid volume and flow, and microbial populations and attachment affect the
fermentation dynamics within the rumen. The work described in this thesis focuses on
investigating different aspects of feed efficiency.
The work described in Chapter 2 focuses on skeletal muscle metabolic activity, evaluating
a strategy for quantifying metabolic activity and determine the correlation of this measurement
with production parameters like growth and efficiency. The objective of this experiment was to
determine the repeatability, practicality, and sensitivity of this assay in quantifying bovine skeletal
muscle metabolic activity. The major conclusions from Chapter 2 are 1) the common cell culture
assay was practical to conduct, 2) the assay could detect diet differences, and 3) the assay was
sensitive enough to rank animals based on skeletal muscle metabolic activity. This assay has
considerable potential to advance our understanding of individual animal maintenance
requirements or stratify animals based on efficiency. Despite promising initial results, repeated
assessment of the relationship between relative fluorescence and productive parameters like
growth and efficiency are needed to confirm the usefulness of this assay.

117
Chapter 3 describes a study that measured the effects of substrate degradability on rumen
fermentation characteristics. The objective of this work was to evaluate VFA, rumen fluid volume,
passage rate, epithelium, and blood metabolite responses to different nutrient degradabilities.
Accurately describing how substrate sources impact fermentation and epithelial gene expression
is important to advancing our knowledge on how to feed animals more efficiently. This study
demonstrated that nutrient degradability is a factor driving VFA dynamics and subsequent
epithelial responses. The fiber sources used in this study generated greater shifts in fermentation
than the starch sources. Additional work on starch sources differing in extent of degradation is
needed to understand whether this relative importance is simply reflecting the relative importance
of extent of ruminal degradation versus rate of degradation. The work also provides further
evidence of the need for more holistic evaluation of how diets influence the fermentation
environment of the rumen, including the epithelium.
Overall, the present work contributes to advancing our understanding of feed efficiency.
One critical advancement was confirming a novel assay could be used to quantify skeletal muscle
metabolic activity. Understanding metabolic rates in an inexpensive, sensitive, and labor-efficient
way will improve the scientific community’s knowledge of individual animal maintenance
requirements to better formulate rations that are beneficial to the animal, maximize available
resources, potentially mitigate harmful environmental effects, and are cost effective to the
producer. The second advancement associated with this work was quantifying the importance of
fiber sources (timothy hay, beet pulp) and starch sources (barley, corn) in regulating VFA
concentrations, molar proportions, and fluxes; fluid volume and passage rate; epithelial gene
expression; and blood metabolite concentrations. Understanding substrate source impacts on VFA
dynamics allows nutritionists to be more specific when choosing feedstuffs. This specificity in
118
selection can help to potentially eliminating more expensive ingredients from a ration while
maintaining or increasing production through enhanced feed efficiency and sustained rumen
health.