Embed Size (px)
Citation preview

Cognitive Psychology 87 (2016) 135–178
Contents lists available at ScienceDirect
Cognitive Psychology
journal homepage: www.elsevier .com/locate/cogpsych
Effects of rhythm on memory for spokensequences: A model and tests of itsstimulus-driven mechanism
http://dx.doi.org/10.1016/j.cogpsych.2016.05.0010010-0285/� 2016 Elsevier Inc. All rights reserved.
⇑ Corresponding author.E-mail address: [email protected] (T. Hartley).
Tom Hartley a,⇑, Mark J. Hurlstone a,b,c, Graham J. Hitch a
aDepartment of Psychology, University of York, Heslington, York YO10 5DD, UKb School of Psychology, University of Western Australia, 35 Stirling Highway, Crawley, WA 6009, AustraliacCentre for Environment and Life Sciences, Commonwealth Scientific and Industrial Research Organisation, Floreat, Australia
a r t i c l e i n f o a b s t r a c t
Article history:Accepted 4 May 2016Available online 1 June 2016
Keywords:Short-term memoryTimingSerial orderSpeech perceptionSpeech production
Immediate memory for spoken sequences depends on their rhythm– different levels of accuracy and patterns of error are seen accord-ing to the way in which items are spaced in time. Current modelsaddress these phenomena only partially or not at all. We investi-gate the idea that temporal grouping effects are an emergent prop-erty of a general serial ordering mechanism based on a populationof oscillators locally-sensitive to amplitude modulations on differ-ent temporal scales. Two experiments show that the effects of tem-poral grouping are independent of the predictability of thegrouping pattern, consistent with this model’s stimulus-drivenmechanism and inconsistent with alternative accounts in termsof top-down processes. The second experiment reports detailedand systematic differences in the recall of irregularly groupedsequences that are broadly consistent with predictions of thenew model. We suggest that the bottom-up multi-scale populationoscillator (or BUMP) mechanism is a useful starting point for a gen-eral account of serial order in language processing more widely.
� 2016 Elsevier Inc. All rights reserved.

136 T. Hartley et al. / Cognitive Psychology 87 (2016) 135–178
1. Introduction
Language is inherently serial, and the representation and control of serial order are fundamentalconsiderations for any model addressing linguistic processes or the interactions of memory and lan-guage. Over half a century ago, Lashley (1951) recognized that the capacity for serial behaviour hadto be reconciled with evidence of parallel processing in the brain, and suggested that rhythmic pat-terns of neural activity could play a mediating role. Since then theoretical approaches to serial orderwithin the language domain have tended to diverge, with a proliferation of models for speech produc-tion (e.g., Dell, Burger, & Svec, 1997; MacKay, 1970; Vousden, Brown, & Harley, 2000), verbal short-term memory (e.g., Botvinick & Plaut, 2006; Brown, Preece, & Hulme, 2000; Burgess & Hitch, 1999;Henson, 1998; Lewandowsky & Farrell, 2008; Page & Norris, 1998), and speech perception (e.g.,Grossberg, 2003). In each area models have incorporated many of Lashley’s (1951) insights, but typ-ically not that of the central and potentially unifying importance of rhythm.
In the present paper, we focus on effects of rhythm and timing in auditory-verbal short-termmem-ory. Recall of rhythmically grouped sequences is typically much better than ungrouped sequences, andthe improvement is associated with characteristic changes in patterns of order errors (Ryan, 1969a,1969b). These phenomena place constraints on theories of serial order in short-term memory andthese in turn have implications for developing an understanding of the broader problem of serial orderin language more generally. We replicate and extend the work of Ryan (1969a) showing groupingeffects for irregular and unpredictable patterns of temporal grouping which, we argue, are inconsis-tent with explanations of grouping in terms of strategic processes such as rehearsal (Broadbent,1975; Chi, 1976; Lewandowsky & Brown, 2005; Parmentier & Maybery, 2008; Wickelgren, 1964,1967), and beyond the scope of current computational models of serial order in short-term memory.Using insights from such models, we propose a new mechanism in which serial order is encoded by apopulation of oscillators driven bottom-up by auditory-verbal input and sensitive to local variation inits temporal structure. Through simulations we demonstrate that many subtle and detailed features ofthe empirical data on short-term memory for grouped sequences can be understood as emergentproperties of this general mechanism. We conclude by discussing the potential of the bottom-upmulti-scale population oscillator (or BUMP) mechanism as a starting point for a more general theoryof serial order in language processing, potentially linking speech perception, speech production andverbal short-term memory through their common dependence on rhythm and timing.
1.1. Verbal short-term memory: structure, function and mechanisms
Although it might initially appear an esoteric skill, the capacity to retain ordered spoken materialover a brief interval is fundamental for many aspects of language processing. Thus, many authors viewverbal short-termmemory as a property of the language processing system (e.g., Allen & Hulme, 2006;Martin & Saffran, 1997; Monsell, 1987), and the capacity for immediate verbal recall has been shownto play a key role in the acquisition of vocabulary and language development (Baddeley, Gathercole, &Papagno, 1998). The mechanisms underpinning verbal short-term memory have principally beenstudied in tasks involving the immediate serial recall of sequences of items such as digits, letters orwords. There is substantial evidence from performance in such tasks that the underlying system isspeech-based. Thus, recall is disrupted when items sound alike (Conrad, 1964) or take longer to say(Baddeley, Thomson, & Buchanan, 1975) or when the memory task is accompanied by irrelevant spo-ken output (Murray, 1967). These effects of phonological similarity, word length and articulatory sup-pression, respectively, fall into a systematic pattern that has been widely interpreted as reflecting theoperation of a store containing transient phonological memory traces that can be refreshed by subvo-cal rehearsal (Baddeley & Hitch, 1974; see also Baddeley, 1986, 2007). Despite its critics (e.g., Jones,Hughes, & Macken, 2007), this account of verbal short-termmemory as a ‘‘phonological loop” has beenhighly influential. However, in its original form it offered no explanation of memory for serial orderand did not address key phenomena such as the shape of serial position curves, the distribution oforder errors, and effects of temporally grouping items during sequence presentation. The following

T. Hartley et al. / Cognitive Psychology 87 (2016) 135–178 137
sections describe these phenomena and the computational models that have attempted to explainthem (for a fuller treatment of data and models, see Hurlstone, Hitch, & Baddeley, 2014).
1.2. Serial order effects in verbal short-term memory
The most basic phenomenon is the serial position curve plotting the accuracy of recalling items as afunction of their position in a sequence. When items are presented at regular intervals, the curve ischaracteristically bow-shaped reflecting a tendency for items at the beginning and end of thesequence to be better recalled than items in the middle. The most common error in recalling asequence of familiar items is a transposition, where an item is recalled at an incorrect position. Theseorder errors obey the locality constraint (Henson, 1996), in that the frequency of transpositionsdecreases as displacement increases. However, different results are seen when sequences are tempo-rally grouped during presentation by inserting extra pauses, typically after every third item. Recall issubstantially more accurate due largely to a reduction in order errors, and the serial position curve ismultiply-bowed, with a bow for each group (Frankish, 1985; Hitch, Burgess, Towse, & Culpin, 1996;Ryan, 1969a, 1969b). The reduction in order errors is largely due to a reduction in the frequency ofadjacent transpositions, especially across group boundaries (Henson, 1999; Maybery, Parmentier, &Jones, 2002). However, grouping increases the frequency of ‘interposition errors’ (Henson, 1996),namely between-group transpositions that preserve their within-group positions (Farrell & Lelièvre,2009; Henson, 1999; Ng & Maybery, 2002, 2005; Ryan, 1969b). These effects of temporal groupingprovide a rich set of constraints on possible mechanisms for serial ordering.
1.3. Models of serial order
In recent years there has been considerable progress in developing computational models of verbalshort-term memory that offer mechanistic accounts of serial order and the associated empirical phe-nomena (see e.g., Botvinick & Plaut, 2006; Brown et al., 2000; Burgess & Hitch, 1999; Farrell, 2012;Farrell & Lewandowsky, 2002; Henson, 1998; Lewandowsky & Farrell, 2008; Lewandowsky &Murdock, 1989; Page & Norris, 1998). We provide a brief overview of the main features of these mod-els below, and we show how temporal grouping effects help discriminate amongst them.
Models of memory for serial order can be regarded as falling into two broad categories dependingon whether order is coded via associations between different items or, alternatively, between itemsand a separate context signal. According to chaining models (Lewandowsky & Murdock, 1989;Murdock, 1995), order is represented through associations between successive items. Serial recall isaccomplished by retrieving the first item, which cues the second item, which cues the third item,and so on and so forth. Chaining is intuitively appealing but has difficulty accounting for the localityconstraint on order errors and paired transpositions—viz. the tendency for items close together in a listto swap places (Farrell, Hurlstone, & Lewandowsky, 2013). Since the chaining mechanism only acti-vates forthcoming items, it cannot readily explain how an earlier item can take the place of a laterone as an error. Chaining is also incompatible with sawtooth error patterns found in serial recall oflists comprising alternating phonemically similar and dissimilar items (Henson, 1996; Henson,Norris, Page, & Baddeley, 1996).1
The other, currently dominant, class of models makes the assumption that each item is associatedwith the current state of an internal context signal that changes gradually during sequence presenta-tion. To recall the sequence, the context signal is replayed and items are reactivated in parallel accord-ing to the similarity between the current state of the signal and the state to which each item wasassociated. This process establishes an activation gradient across the items, such that the correct itemis most active, followed by its near neighbours (which are associated with more similar states of thesignal than more distant neighbours). Context signal models typically involve a competitive queuing(Houghton, 1990) process that translates the simultaneous pattern of activations into a sequential
1 This point has been disputed by Botvinick and Plaut (2006), who present a chaining model that reproduces the above effects.However, as we have noted elsewhere (Hurlstone et al., 2014), their model depends on substantial pretraining in which it learns torely on additional information besides chaining.

138 T. Hartley et al. / Cognitive Psychology 87 (2016) 135–178
output, whereby the most active item is selected, retrieved, and then immediately suppressed. Thisleaves the remaining items to compete for selection when the replay of the context signal moveson to the next serial position, and so on. Errors are modelled by assuming activation levels containa certain amount of noise. Context signal models can comfortably account for the locality constrainton transposition errors as neighbouring items compete more strongly than distant items. Indeed localtranspositions are a characteristic property: if the wrong item is output at one serial position it islikely to come from a neighbouring position, while the correct item will remain in competition atthe next serial position. Context models also provide a natural account for the bowed shape of theserial position curve, as items at the start and end of a sequence have fewer competing neighboursthan items in the middle.
In the simplest models, the context signal is a monotonic marker that is most active at the begin-ning of a list and becomes progressively weaker thereafter, as in the primacy model of Page and Norris(1998). However, such a simple marker cannot readily deal with situations in which the same item isrepeated at different positions. This limitation has been addressed by assuming a richer, two-dimensional context signal. For example, Houghton (1990) and later Henson (1998) assumed thatan additional end-of-list marker becomes increasingly active as the start-of-list marker’s activity diesaway. Such a signal represents approximate position relative to the start and end of the sequence. Thisadded dimension deals with the problem of lists containing repeated items but is insufficient toaccount for temporal grouping effects. The characteristic combination of multiply bowed serial posi-tion curves, reduced adjacent transposition errors and increased interposition errors has been taken toimply that grouped sequences are organised hierarchically (see e.g., McNicol & Heathcote, 1986). Toaccommodate grouping effects, models typically assume a more complex multidimensional contextsignal. For example, in Henson’s (1998) start–end model (SEM) a temporally grouped list is repre-sented via a pair of two-element signals, one that represents the relative position of items withingroups and another that represents the relative position of groups within the list overall. The combi-nation of these two signals produces the necessary similarity structure to reproduce the multiplybowed serial position curves and error patterns typically observed in recall of temporally groupedlists. The higher overall level of recall associated with grouping arises straightforwardly from theincreased discriminability of states of the context signal when it contains more dimensions.
Other models differ chiefly in assuming a context signal that reflects either absolute position fromthe start of the sequence, as in the context-serial-order-in-a-box (C-SOB) model (Farrell, 2006;Lewandowsky & Farrell, 2008) and the model originally proposed by Burgess and Hitch (1992), or atemporal correlate of absolute position, as in the oscillator-based associative recall (OSCAR) model(Brown et al., 2000) and later versions of the Burgess and Hitch model (Burgess & Hitch, 1999,2006). OSCAR is particularly relevant here as it assumes the context signal reflects the combined out-puts of a set of free-running, endogenous oscillators pre-set to run at different rates. To illustrate this,Brown et al. (2000) use an analogy of the rotating hands on a clock face. Thus, for a regularly groupedlist, the seconds, minutes and hour hands might correspond to the rates of presenting individual items,groups and whole lists, respectively. States of the clock face would be more discriminable from oneanother for a grouped list, because of the presence of the extra hand, but by the same token wouldgo through a similar series during the presentation of each group. Once again, therefore, the hierarchi-cal structure of the context signal accounts for the different patterns of recall observed for ungroupedand regularly grouped lists described earlier.
We note that context-based accounts of serial order in immediate memory connect with related-mechanisms in more general accounts of time in memory (Brown, Neath, & Chater, 2007; Howard &Kahana, 2002). The key feature of these models is that they each aim to provide a unifying account oftemporal effects in memory across widely varying timescales (i.e., those involved in episodic memoryand the free recall of supra-span lists). In Brown et al.’s (2007) scale-invariant memory, perception andlearning (SIMPLE) model, the distinctiveness of different events in episodic memory is inverselyrelated to their separation in time. This model provides a particularly parsimonious and unifyingaccount of a wide variety of memory phenomena at different temporal scales, including episodicand free recall as well as immediate serial recall. However, while the SIMPLE model has been appliedsuccessfully to grouping effects seen in regularly timed lists, like the competitive queuing models dis-cussed above, it requires an additional, unspecified mechanism to capture temporal grouping effects.
T. Hartley et al. / Cognitive Psychology 87 (2016) 135–178 139
Howard and Kahana’s temporal context model (TCM; Howard, Fotedar, Datey, & Hasselmo, 2005;Howard & Kahana, 2002; Sederberg, Howard, & Kahana, 2008) provides a more mechanistic accountin terms of a dynamic distributed context signal that can be applied to a similarly wide range of tem-poral phenomena in free recall and episodic memory. Unlike the models reviewed above, the contextsignal in the TCM is sensitive to the content of its input—the activation of items during presentationand retrieval drives the evolution of the context signal. However, the TCM has not been applied totemporal effects in immediate serial recall and, since it contains no mechanism that could accountfor systematic effects of temporal grouping on recall and on non-local transposition errors, it is unclearthat it could accommodate these phenomena.
In summary, regardless of which specific approach is adopted, all context signal models whichaddress temporal grouping effects account for them by assuming that the signal changes in such away as to combine information about the position of items or groups in the list overall, with informa-tion about the position of items within groups. However, none of the models specifies the mechanismthrough which groups are detected and the within-group component of the context signal is reset. Forexample, Burgess and Hitch (1999) assumed that the context signal reflects internal oscillatorsentrained to the rhythms of items and groups, but the processes of entrainment were not imple-mented and the context signal was altered ‘‘by hand” to simulate the recall of grouped and ungroupedlists. This omission is also a characteristic of the SEM (Henson, 1998) and C-SOB models(Lewandowsky & Farrell, 2008). Similarly, in OSCAR (Brown et al., 2000) it was simply assumed thatgrouped presentation recruits an additional repeating component of the context signal and the pro-cesses whereby this takes place were left unspecified. Indeed, Brown et al. (2000) were careful toemphasise that they had not modelled the recruitment of oscillators of appropriate frequency, andthat it may not be straightforward to do this. Thus, while all the models succeed in reproducing theeffects of regular, predictable grouping patterns on serial recall, they beg the question of how it is thatthe context signal changes in response to a rhythmic input (or indeed what processes determine thecontext signal for an ungrouped input).
The absence of detailed implementation is an important limitation as a genuinely useful model willgenerate insights into the representation of serial order for all kinds of verbal sequence, including nat-ural sequences, where the rhythms are typically irregular and vary in their predictability. Presentmodels clearly lack the information needed to do this. An interesting partial exception is the multi-oscillator model developed by Henson and Burgess (1997) in an attempt to account for the depen-dence of interposition errors on relative rather than absolute (i.e. temporal) within-group positionin sequences containing groups of unequal size (Farrell & Lelièvre, 2009; Henson, 1999). These effectschallenge models in which the context signal has a strictly hierarchical structure based on absolutetemporal position. To address them, Henson and Burgess (1997) made use of two important ideas.One is that oscillators are arranged in pairs with the same frequency but different phases 90� apart.The other is that oscillator pairs tuned to different frequencies compete in parallel to represent theinput. Henson and Burgess (1997) used these assumptions to develop a model that was able to repro-duce not only the classic effects of regular temporal grouping but also the subtle effects for sequencescontaining groups of unequal size reported by Ng (1996). However, Henson and Burgess (1997) notedlimitations of their model in that they had to assume prior rhythmic parsing of the input and did notspecify how the phases of different oscillator pairs were synchronised. This lack of implementationdetail means it is not possible to predict how the model will behave when presented with unpre-dictable, irregularly grouped sequences that cannot be parsed in advance.
The model we present here develops insights in the approaches taken by Henson and Burgess(1997) and Brown et al. (2000), but addresses their limitations and those of the other context signalmodels we have been discussing. We do this by meeting the challenge of specifying a genuinely‘‘bottom-up” processing mechanism whereby the context signal is computed ‘‘on the fly” from theinformation in the physical stimulus, as it unfolds in real time. Rather than assuming a set of free-running oscillators (Brown et al., 2000; Henson & Burgess, 1997), which as we have seen raises theunanswered question of how the relevant oscillators for any sequence are recruited, we turn the prob-lem around and assume instead a set of frequency-sensitive detectors that respond to local rhythms inthe stimulus input. We show that a context signal based on the outputs of an array of such detectorshas the desired properties and generates predictions for human data in the recall of irregular or

140 T. Hartley et al. / Cognitive Psychology 87 (2016) 135–178
unpredictably grouped sequences. We go on to describe experiments reporting human data and eval-uate the degree to which our bottom-up serial ordering mechanism can account for them.
To summarize: the most successful models explaining temporal grouping effects assume that serialorder is retained via associations between items and a context signal that changes progressively dur-ing the presentation of a sequence. Although debate has focused on differences between modelsregarding the precise nature of the context signal, a wider concern is that they have concentratedon explaining only a limited set of data on the effects of temporal grouping and none of the modelsis capable of explaining the recall of sequences grouped irregularly or unpredictably. This is a signif-icant problem because, in the general case, and especially in more ecologically realistic circumstances,we cannot anticipate the rate or temporal structure of the words and phonemes we encounter andwhose serial order we must represent. Models capable of representing sequences with arbitrary tim-ing will necessarily be more general, and may provide new insights into language processing outsidethe laboratory where the rate and structure of speech we perceive and produce is neither regular norpredictable. In the next section we outline a model that addresses this limitation by implementing acontext signal that is sensitive to local aspects of sequence timing.
1.4. Current model
The current model’s basic architecture is common to most models of this type, as outlined above.Thus, during presentation, each item is associated with the current state of a temporal context signal.At recall, successive states of the temporal context signal are replayed, and the learned associationsreactivate the items. At each step items compete for selection on the basis of their levels of activationand are then suppressed, so that the selected item is not available for retrieval at the next serialposition.
The model makes use of established signal processing mechanisms to analyse the temporal struc-ture of an auditory input, and assumes a set of neurally-plausible detectors sensitive to local changesin the amplitude envelope of incoming speech. The responses of these hypothetical neurons combineto form the temporal context signal. The property of bottom-up, local sensitivity is crucial for the mod-el’s sensitivity to unpredictable, irregularly grouped input sequences as well as predictable regulartemporal grouping patterns. For brevity, we call this the BUMP (standing for bottom-up multi-scalepopulation oscillator) model.
In the BUMP model, the context signal reflects the activity of a population of cells, each with anintrinsic tuning which causes its activity to oscillate at a specific rate and phase in response to localchanges in the speech envelope (Fig. 1a). This pattern of activity is determined by the neuron’s char-acteristic impulse response, which can be thought of as an ideal signal against which the incomingamplitude modulations are compared. More precisely, the activity of each model neuron is deter-mined by convolving its impulse response with the input signal. If driven by more or less regular fluc-tuations in the amplitude of the speech signal at a rate close to its intrinsic tuning, the amplitude ofthe neuron’s response will be strong and, importantly, its phase will track that of the incoming stimuli.If driven at a markedly different frequency, the amplitude of the response will be much lower. Forexample, a given neuron might be tuned to respond maximally to regular modulations at 2 Hz inphase with peaks in the speech envelope (Fig. 1b, left). Critically, each neuron’s activity will continueto track the phase of amplitude modulations as their rate varies over a substantial range around itsideal tuning, albeit with somewhat reduced amplitude (Fig. 1b, right) but beyond this range the ampli-tude of the neuron’s response falls away. Each neuron thus responds only to local amplitude modula-tions at a specific temporal scale and neurons with similar tunings tend to respond in a coherent wayto amplitude modulations on the relevant scale.
In the current implementation, we use phase-offset pairs of model neurons tuned to the same fre-quency, each pair forming a complex quadrature filter. For each frequency, one member of the pair hasa maximum response aligned with peaks in the speech envelope (0� phase) and the other has a max-imum response offset by 90� (Fig. 2a). The response of such a pair to a sequence of items is determinedby the amplitude modulations associated with its presentation, which we approximate as a series oftriangular pulses. Fig. 2b illustrates the responses of a single pair of neurons with tunings close to thegroup repetition rate during presentation of three groups of three items, as in Ryan (1969b). For easy

0.5s
Firing Rate
ImpulseResponse
Inpu
t Am
plitu
de(a
rbitr
ary
units
)
0 0.5 1 1.5 2 2.5 3 3.5 4
Firin
g R
ate
(arb
itrar
y un
its)
0 0.5 1 1.5 2 2.5 3 3.5 4
Regular input Varying rate
Time (s)
(a) (b)
Fig. 1. (a) Schematic illustration of an individual amplitude modulation (AM) tuned ‘‘neuron” in the BUMP model. The outputactivity (firing rate) is determined by convolving the neuron’s characteristic impulse response with a signal representing thechanging amplitude envelope of an auditory input (see Appendix A for further details). In this example the neuron’s impulseresponse has a wavelength of 0.5 s corresponding to a frequency of 2 Hz. (b) Relationship between input and output for regularand varying rates of AM; the phase of output (bottom axes) tracks the phase of the input (top axes) for both regular (left) andvarying rate (right) inputs. The amplitude of the firing rate changes depends on the match between the impulse response tuningand the current rate of amplitude modulation. In this illustration the varying rate signal moves smoothly from 0.9 to 4.0 Hz,with the largest responses being seen as the rate approaches 2 Hz.
T. Hartley et al. / Cognitive Psychology 87 (2016) 135–178 141
visualisation, the offset responses of each pair have been combined to illustrate the overall pattern ofamplitude and phase responses during sequence presentation with phase represented by hue andamplitude represented by brightness (Fig. 2c). Fig. 2d shows that the phase of the output tracks localchanges in the speech envelope corresponding to groups of items, that is, the phase indicated by thejoint response of the pair goes through one complete cycle for each group of three items in the inputsequence, while the overall amplitude of the response remains more or less constant throughout. Animportant feature of the model is that pairs of neurons tuned to different frequencies will show dif-ferent patterns of output, as described below.
In BUMP, the context signal used to encode a verbal sequence is the output of a population of oscil-lator pairs whose tunings span the range of temporal scales over which amplitude modulations areencountered in typical tasks (Fig. 3). For example in a short, irregularly-timed list of discrete items,there may be slow modulations on a temporal scale corresponding to the length of the entire utter-ance (say 5 s), more rapid fluctuations corresponding to groups or clusters of items (perhaps around1–2 s), and still faster modulations corresponding to presentation of the individual items themselves(0.75 s). In the current simulations, we use 15 pairs of oscillators in the range 0.1–1.3 Hz so as to coversuch fluctuations.
The outputs of oscillator pairs tuned to local amplitude fluctuations on different time-scales willvary during presentation of a list, determined by its temporal structure at different time-scales. Inthe simplest example of an evenly-timed, ungrouped list, oscillators with tunings close to the itempresentation rate will respond strongly and in phase with the items. These oscillators will go throughone cycle per list item. Oscillators with tunings close to the list presentation rate respond to the largerscale amplitude fluctuation associated with presentation of the entire list and are insensitive to therelatively rapid changes associated with individual items. These slower oscillators’ output will gothrough approximately half a cycle during presentation of the list. Oscillators with intermediate tun-ings respond only weakly and their responses are largely restricted to the beginning and end of thesequence. However, for a regularly grouped list, we have already seen that oscillators with tuningsclose to the group presentation rate are also recruited, and go through one cycle per group (seeFig. 2d). A critical advantage of the bottom-up mechanism in the BUMP model, and in particularthe sensitivity of the context signal to local changes in the input, is that it can also deal with irregularlygrouped stimuli. These features are illustrated in Fig. 3 which compares the context signal generated

1.94s Response
AM Input
Time
1.94s
0.52Hz(a) (b)
(d)(c)
Fig. 2. (a) Schematic illustration of a pair of AM tuned ‘‘neurons” in the BUMP model. The phases of their impulse responses areshifted by 90� (constituting a complex quadrature filter). (b) The phase-offset response of the pair (lower trace) duringpresentation of a sequence of 9 items represented by triangular AM pulses as in the simulations described in the present paper(upper trace). (c) At any time the combined output of the two cells can be represented as a point in 2D space defined by therelative activity of the two ‘‘neurons” (grey circle). As time passes the point rotates around the origin. The overall phase of theoutput can be represented by a hue defined by the angle made with the origin, while its amplitude can be represented by thebrightness of the chosen colour. (d) The evolution of the phase and amplitude of the output over time is illustrated with acoloured ribbon. In this instance the cells are tuned to respond to AM modulations with a wavelength of 1.94 s which in thisexample happens to be close to the grouping frequency of the items in the list (b). The phase of the pair’s output goes throughapproximately one cycle per group. (For interpretation of the references to colour in this figure legend, the reader is referred tothe web version of this article.)
142 T. Hartley et al. / Cognitive Psychology 87 (2016) 135–178
for (a) an ungrouped list of nine items, (b) a list with an evenly spaced 3-3-3 grouping pattern and (c)an uneven 2-6-1 pattern.
In the BUMPmodel, grouping tends to be advantageous because it activates a broader population ofoscillators, resulting in a more distinctive representation of serial position that reduces competitionbetween neighbouring items at retrieval, as seen qualitatively in the comparison betweenFig. 3a and b. An important property of the model is that some temporal grouping patterns are morefavourable than others. Regular grouping patterns (3-3-3) powerfully activate oscillators tuned to thegrouping rate, which enhances overall recall, albeit at the expense of interposition errors (as seen inthe similarity of the outputs of filters tuned to the group presentation rate in Fig. 3b). Irregular group-ing patterns similarly favour intergroup transpositions although the correspondence between differ-ent positions is less clear-cut (see Fig. 3c). The inconsistency of group durations means thatoscillators in this range are less strongly activated than would be the case for regularly grouped lists.Context signals associated with different list positions are, on average, less distinctive, though someserial positions (especially those in very short groups or at the beginning or end of longer groups)may be protected relative to those in ungrouped or regularly-grouped lists.
Overall, the BUMP model predicts that certain grouping patterns will be more favourable for serialrecall than others. We report two experiments testing the model. The first addresses its basic assump-tion that the benefit of auditory-verbal grouping depends on bottom-up processing of information
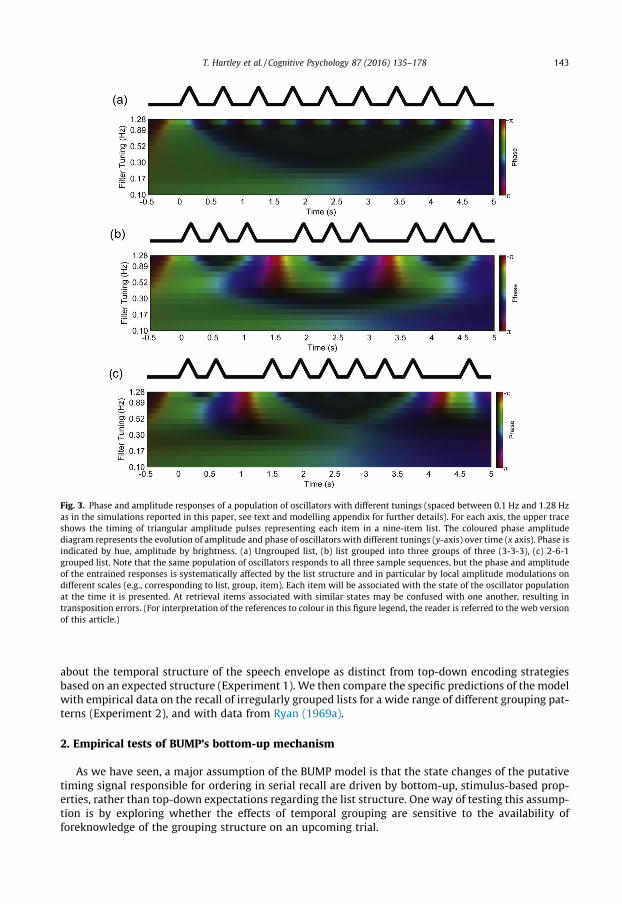
Fig. 3. Phase and amplitude responses of a population of oscillators with different tunings (spaced between 0.1 Hz and 1.28 Hzas in the simulations reported in this paper, see text and modelling appendix for further details). For each axis, the upper traceshows the timing of triangular amplitude pulses representing each item in a nine-item list. The coloured phase amplitudediagram represents the evolution of amplitude and phase of oscillators with different tunings (y-axis) over time (x axis). Phase isindicated by hue, amplitude by brightness. (a) Ungrouped list, (b) list grouped into three groups of three (3-3-3), (c) 2-6-1grouped list. Note that the same population of oscillators responds to all three sample sequences, but the phase and amplitudeof the entrained responses is systematically affected by the list structure and in particular by local amplitude modulations ondifferent scales (e.g., corresponding to list, group, item). Each item will be associated with the state of the oscillator populationat the time it is presented. At retrieval items associated with similar states may be confused with one another, resulting intransposition errors. (For interpretation of the references to colour in this figure legend, the reader is referred to the web versionof this article.)
T. Hartley et al. / Cognitive Psychology 87 (2016) 135–178 143
about the temporal structure of the speech envelope as distinct from top-down encoding strategiesbased on an expected structure (Experiment 1). We then compare the specific predictions of the modelwith empirical data on the recall of irregularly grouped lists for a wide range of different grouping pat-terns (Experiment 2), and with data from Ryan (1969a).
2. Empirical tests of BUMP’s bottom-up mechanism
As we have seen, a major assumption of the BUMP model is that the state changes of the putativetiming signal responsible for ordering in serial recall are driven by bottom-up, stimulus-based prop-erties, rather than top-down expectations regarding the list structure. One way of testing this assump-tion is by exploring whether the effects of temporal grouping are sensitive to the availability offoreknowledge of the grouping structure on an upcoming trial.

144 T. Hartley et al. / Cognitive Psychology 87 (2016) 135–178
We have already noted the widely held assumption that grouping effects in immediate serial recallreflect the implementation of optional strategies such as rehearsal (Broadbent, 1975; Chi, 1976;Lewandowsky & Brown, 2005; Parmentier & Maybery, 2008;Wickelgren, 1964, 1967). This is plausiblewhen one considers that almost all documented studies of temporal grouping have employed eitherthe same pattern of grouping throughout the entire experiment (Farrell & Lewandowsky, 2004;Frankish, 1985, 1989; Henson, 1996; Hitch et al., 1996; Maybery et al., 2002; Parmentier &Maybery, 2008; Ryan, 1969b) or a small set of different patterns presented in blocked fashion(Farrell & Lelièvre, 2009; Henson, 1999). In such cases, participants may be able to capitalize on theirforeknowledge of the locations of the pauses and use them to engage in extra rehearsal of the preced-ing group, thereby strengthening within-group positional codes.
An important but neglected exception to the above generalization is a study by Ryan (1969a;Experiment 2) in which participants received auditorily presented lists of nine digits. Although listswere always presented in three temporal groups, these varied in size to give 28 different grouping pat-terns that varied unpredictably from trial to trial. Even though participants could not anticipate thepattern of grouping on a forthcoming trial, there were systematic differences in recall, with serial posi-tion curves exhibiting scalloped profiles specific to and consistent with the pattern of grouping inquestion. These results suggest that the genesis of grouping effects—in the auditory modality atleast—is attributable to a bottom-up ordering mechanism. Nevertheless, Ryan’s results do not pre-clude the possibility that top-down processes based on foreknowledge of the list structure might mod-ulate the effects of grouping. Thus, it is possible that when the list structure is predictable—as wouldbe the case in a version of Ryan’s experiment in which the different grouping patterns were presentedin separate blocks of trials—the effect of a particular pattern of grouping on serial recall might bestronger. However, since Ryan did not incorporate such a condition in her study, the answer to thisquestion is presently unclear.
In the following experiments, we sought to obtain further evidence for the contention that tempo-ral grouping effects in the auditory modality are attributable to a bottom-up ordering mechanism. Weaccomplished this by manipulating the predictability of the grouping structure of temporally groupedlists.
2.1. Experiment 1
We compared the effects of temporally grouping spoken lists of nine digits into threes whenadvance knowledge of the grouping structure either was or was not available. In one condition (pre-dictable 3-3-3), all lists were temporally grouped into threes. In a second condition (unpredictable 3-3-3), a separate set of participants received lists in which there was wide trial-to-trial variability in thegrouping pattern, rendering it virtually impossible to predict the grouping structure on a forthcomingtrial. Crucially, lists were presented in groups of threes on only a randomly distributed 20% of trials. Ina further baseline condition (ungrouped), another set of participants received lists that were devoid ofany grouping cues. The three conditions were compared by contrasting the recall of lists grouped inthrees in the unpredictable 3-3-3 condition with recall on corresponding experimental trials in thepredictable 3-3-3 and ungrouped conditions.
If advance knowledge of the grouping structure is necessary for the manifestation of groupingeffects then these effects should be absent in the unpredictable 3-3-3 condition. If, on the other hand,advance knowledge simply modulates rather than underpins the effects of grouping, then these effectsshould be present in both grouping conditions, but stronger in the predictable condition. If, however,grouping effects are present in both conditions in equal magnitude then this would support the viewthat such effects have a purely bottom-up locus.
One potential problem of interpretation is that participants might have a default strategy of sub-jectively grouping lists into threes. Subjective grouping is a common strategy with visually presentedungrouped lists (see e.g., Farrell & Lelièvre, 2009; Henson, 1996; Madigan, 1980) and might beexpected to occur with spoken lists too. The problem for interpretation is that if participants wereto subjectively group all lists into threes then performance in the predictable and unpredictable3-3-3 conditions would be very similar, rendering it difficult to determine whether this is due tothe bottom-up nature of grouping or the ubiquity of a subjective 3-3-3 grouping strategy. We

T. Hartley et al. / Cognitive Psychology 87 (2016) 135–178 145
attempted to avoid such ambiguity by including conditions in which any tendency to group subjec-tively using rehearsal would be disrupted by requiring articulatory suppression during list presenta-tion (see e.g., Lewandowsky & Brown, 2005). If the effects of grouping in the predictable andunpredictable 3-3-3 conditions are comparable, then the conclusion that grouping is due tobottom-up processes would be bolstered by the survival of this pattern under articulatorysuppression.
2.1.1. Method2.1.1.1. Participants. Thirty members of the campus community at the University of York took part inthe experiment in exchange for course credit or payment of £4.
2.1.1.2. Stimuli and apparatus. The stimuli were spoken lists consisting of the digits 1–9. Lists weregenerated quasi-randomly according to the following constraints: (1) no ascending or descending runsof more than two digits, (2) no adjacent digits in immediately neighbouring positions, (3) no repeti-tions of the same digit, and (4) no digits in adjacent lists sharing the same within-list position. Digitswere recorded in a monotone male voice with a 16-bit resolution at a sampling rate of 22,050 kHzusing Sony Sound Forge 8.0 software. They were normalized to 0 dB, compressed to a duration of400 ms, and saved as sound files on a Dell Dimension 3100 PC. Stimulus presentation was controlledby the same computer equipped with a 17 in. monitor using software developed in-house. The digitswere presented via Senheisser HD 265 Linear headphones at a sound level of approximately 65 dB.
2.1.1.3. Design. The experiment employed a 3 � 2 mixed factorial design in which list-type (ungroupedvs. predictable 3-3-3 vs. unpredictable 3-3-3) was a between-participant factor, and secondary task(no suppression vs. suppression) was a within-participant factor. Counterbalancing was employedon the latter factor. Ten participants were randomly allocated to each of the three between-participant conditions.
Blocks of 50 lists were constructed as follows. In the ungrouped condition, items were presented ata uniform rate, whilst in the predictable and unpredictable 3-3-3 conditions two extended temporalpauses served to demarcate lists into three groups. In the predictable 3-3-3 condition, the extendedpauses were always located after the third and sixth items so as to create lists that were perceptuallygrouped into threes. In the unpredictable 3-3-3 condition, the locations of the two extended pausesvaried from trial to trial to create 21 different patterns of grouping. These were 3-3-3, 1-6-2, 6-1-2,and all permutations of 2-4-3, 4-4-1, 2-5-2 and 3-5-1. Lists grouped 3-3-3 were presented on trials2, 8, 13, 20, 26, 30, 33, 39, 43 and 48. The 20 irregular grouping patterns each occurred twice in a ran-dom order in the remaining trials.
2.1.1.4. Procedure. Participants were tested individually in a quiet room in the presence of the exper-imenter. In the no suppression condition, a trial began with the presentation of the words ‘‘Get Ready”in the centre of the computer display followed by a fixation cross. A list of nine spoken digits presentedvia the headphones then followed. In the ungrouped condition, the inter-stimulus interval (ISI: offset-to-onset) was 300 ms, whilst in the unpredictable 3-3-3 and predictable 3-3-3 conditions the within-group ISI (the interval separating items within groups) was 150 ms and the between-group ISI (theinterval separating groups) was 750 ms. These timings equated list presentation durations in all con-ditions. At the end of each trial a question mark presented in the central screen position signified thecue to begin recall. Participants subsequently reported the sequence in forward serial order by writingeach item in one of nine locations on a response sheet, where each location represented an item in theto-be-recalled list. The recall interval was 15 s in duration and upon completion the next trial com-menced automatically. To alert participants to the beginning of the next trial a tone sounded 2 s beforethe recall interval expired.
The structure of the trials in the suppression condition was the same as outlined above, except thatthe ‘‘Get Ready” signal was replaced with the word ‘‘Suppress”. At the onset of this signal participantsspoke the word ‘‘the” repeatedly at the rate of two utterances per second until the recall cue appearedon screen. The experimenter monitored participants at all times to ensure compliance with the sup-pression instructions. If participants failed to keep to the rate of two utterances per second they were

146 T. Hartley et al. / Cognitive Psychology 87 (2016) 135–178
encouraged to try harder. Both the no suppression and suppression blocks were preceded by threepractice trials.
2.1.2. ResultsOnly data for trials corresponding to those in which 3-3-3 lists were presented in the unpredictable
condition were subjected to analysis (viz. trials 2, 8 13, 20, 26, 30, 33, 39, 43, and 48 of each condition).Restricting analysis to these trials ensured that comparisons between conditions were based on equalnumbers of observations made at corresponding points. The data were scored using a strict serialrecall criterion: an item was only scored as correct if its output serial position was the same as itsinput serial position.
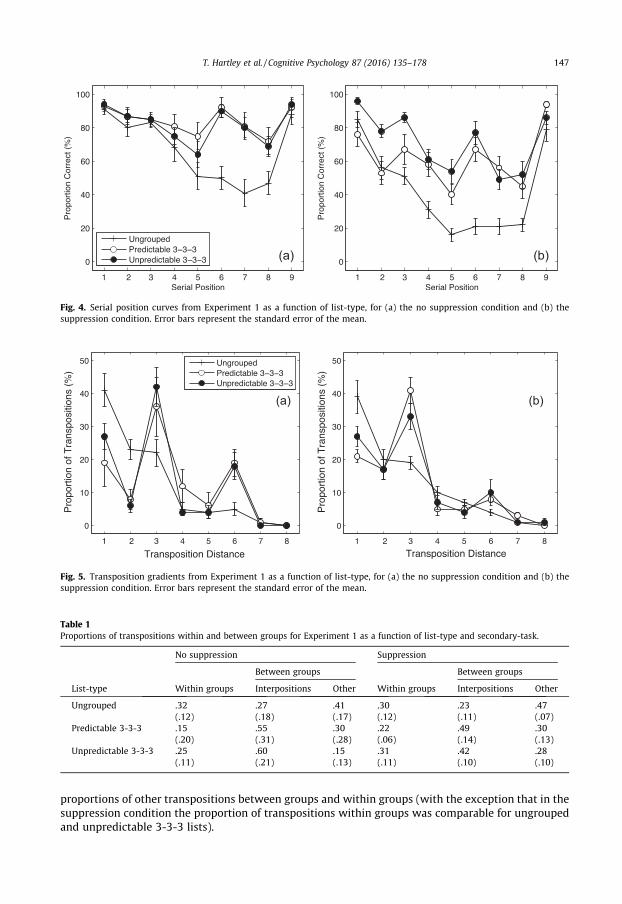
2.1.2.1. Accuracy. Fig. 4 shows the accuracy serial position curves for each list-type for (a) the no sup-pression condition and (b) the suppression condition. Considering first the no suppression condition, itcan be seen that performance was comparable for predictable and unpredictable 3-3-3 lists andgreater than for ungrouped lists. The serial position functions for predictable and unpredictable 3-3-3 lists were characterised by multiple bowing within groups combined with primacy and recencyacross the list as a whole. By comparison, the serial position function for ungrouped lists showed stee-per primacy and recency effects over the list as a whole. The curves for ungrouped lists were alsoslightly scalloped, suggesting some subjective grouping took place. Performance in the suppressioncondition was generally poorer, but the pattern was broadly similar. Thus, the recall advantage forpredictable and unpredictable 3-3-3 lists persisted, as did the multiple bowing of the serial positioncurve. Interestingly, recall of unpredictable 3-3-3 lists was actually slightly better than for predictable3-3-3 lists due to superior recall of items in the first group.
A 3 (list-type: ungrouped vs. predictable 3-3-3 vs. unpredictable 3-3-3) � 2 (secondary-task: sup-pression vs. no suppression) ANOVA revealed a significant main effect of list-type [F(2,27) = 9.08,p < .01], a significant main effect of secondary-task [F(1,27) = 102.6, p < .001], and a significant list-type � secondary-task interaction [F(2,27) = 4.74, p < .05]. The interaction materialized because inthe no suppression condition recall of predictable and unpredictable 3-3-3 lists did not differ signifi-cantly [t(18) < 1], whereas in the suppression condition unpredictable 3-3-3 lists were recalled withgreater accuracy than predictable 3-3-3 lists, although this comparison did not reach conventional sig-nificance levels [t(18) = 1.42, p = .17]. Recall of predictable 3-3-3 lists was significantly better thanungrouped lists both without suppression, [t(18) = 2.58, p < .05], and with suppression [t(18) = 3.20,p < .01]. Recall of unpredictable 3-3-3 lists was also significantly better than ungrouped lists without[t(18) = 3.19, p < .01], and with suppression [t(18) = 6.06, p < .001].
2.1.2.2. Errors. Errors were classified as omissions (items not recalled) and transpositions (itemsrecalled in the wrong serial position). As expected, omissions were much less frequent overall thantranspositions (5% vs 29% of responses), and grouping reduced transpositions (ungrouped: 41%, unpre-dictable 3-3-3: 23%, predictable 3-3-3: 25%). Suppression reduced performance primarily by increas-ing transpositions (from 21% to 38%). Transpositions were further classified according to transpositiondistance, defined as the absolute numerical difference between an item’s input and output serial posi-tions. Fig. 5 shows the transposition gradients for each list-type, for (a) the no suppression conditionand (b) the suppression condition, in terms of the proportion of transpositions as a function of trans-position distance. As can be seen, the curves for predictable and unpredictable 3-3-3 lists exhibit inter-positions, as reflected by larger amplitude peaks at transposition distance 3 and to a lesser extentdistance 6. In contrast, transposition gradients for ungrouped lists showed a much smoother decreasewith increasing transposition distance. However, it is apparent that the gradients for ungrouped listsexhibit small deviations at transposition distances 3 and to a lesser extent distance 6. Such deviationssuggest that, in line with the modest scalloping of the associated serial position curves, some degree ofsubjective grouping into threes took place in this condition.
Table 1 shows the proportions of transpositions within and between groups as a function of list-type and secondary-task. Transpositions between groups are further sub-divided into interpositionsand other between-group transpositions. Inspection of this table reveals that predictable and unpre-dictable 3-3-3 lists were not only associated with larger proportions of interpositions, but also smaller
(a) (b)
Fig. 4. Serial position curves from Experiment 1 as a function of list-type, for (a) the no suppression condition and (b) thesuppression condition. Error bars represent the standard error of the mean.
(a) (b)
Fig. 5. Transposition gradients from Experiment 1 as a function of list-type, for (a) the no suppression condition and (b) thesuppression condition. Error bars represent the standard error of the mean.
Table 1Proportions of transpositions within and between groups for Experiment 1 as a function of list-type and secondary-task.
No suppression Suppression
Between groups Between groups
List-type Within groups Interpositions Other Within groups Interpositions Other
Ungrouped .32 .27 .41 .30 .23 .47(.12) (.18) (.17) (.12) (.11) (.07)
Predictable 3-3-3 .15 .55 .30 .22 .49 .30(.20) (.31) (.28) (.06) (.14) (.13)
Unpredictable 3-3-3 .25 .60 .15 .31 .42 .28(.11) (.21) (.13) (.11) (.10) (.10)
T. Hartley et al. / Cognitive Psychology 87 (2016) 135–178 147
proportions of other transpositions between groups and within groups (with the exception that in thesuppression condition the proportion of transpositions within groups was comparable for ungroupedand unpredictable 3-3-3 lists).

148 T. Hartley et al. / Cognitive Psychology 87 (2016) 135–178
Two 2 (list-type: ungrouped vs. grouped) � 3 (error-type: within-group transpositions vs. interpo-sitions vs. ‘‘other” between-group transpositions) � 2 (secondary task) ANOVAs were carried out onthe log-odds transformed error proportions. The first analysis compared predictable 3-3-3 andungrouped lists, whilst the second compared unpredictable 3-3-3 and ungrouped lists. For the firstANOVA, there was a significant main effect of error-type [F(2,36) = 3.69, p < .05], and importantly asignificant list-type � error-type interaction [F(2,36) = 9.82, p < .001], with grouping increasing theproportion of interpositions [t(9) = 3.10, p < .05], but decreasing the proportion of other between-group transpositions [t(9) = 1.90, p < .10] and within-group transpositions [t(9) = 2.30, p < .05]. Forthe second ANOVA, there was a similar significant list-type � error-type interaction [F(2,36)= 17.15, p < .001]. As before, grouping increased the proportion of interpositions [t(9) = 4.40, p < .01]and decreased the proportion of other between-group transpositions [t(9) = 5.28, p < .001]. However,grouping did not significantly modify the proportion of within-group transpositions [t(9) < 1]. Therewas also a significant error-type � secondary-task interaction [F(2,36) = 3.96, p < .05], which arosebecause articulatory suppression did not significantly influence the proportion of within-group trans-positions [t(9) < 1], or interpositions [t(9) = 1.81], but did significantly increase the proportion of otherbetween-group transpositions [t(9) = 3.19, p < .05].
2.1.3. DiscussionThe main results of the experiment are straightforward. In the no suppression condition, grouping
exerted a multiplicity of effects including an elevation in recall accuracy; effects of primacy andrecency within groups; a reduction in transpositions between groups; and an increase in interposi-tions. These effects were present in equal measure for both predictable and unpredictable 3-3-3 lists.Articulatory suppression depressed performance, as expected, but critically the effects of groupingpersisted for both predictable and unpredictable 3-3-3 lists, suggesting that the corresponding effectsin the absence of suppression were not attributable to participants subjectively rehearsing lists inthrees.
That characteristic grouping effects were observed with unpredictably grouped lists suggests thatadvance knowledge of the grouping structure is not necessary for their manifestation. Furthermore,that recall of predictable 3-3-3 lists was no better than unpredictable 3-3-3 lists—with recall of unpre-dictable 3-3-3 lists actually being superior in the suppression condition—additionally suggests thatforeknowledge of the grouping structure does not modulate the effects of grouping. The presentresults therefore favour the view that—in the auditory modality at least—temporal grouping effectsare largely attributable to a bottom-up mechanism, with little role for top-down driven strategiesbased on foreknowledge of the grouping structure. We note, however, that top-down subjectivegrouping strategies do seem to play a minor role in the recall of ungrouped auditory lists, as evidencedby modest scalloping of the serial position curve and interposition errors of the type associated withtemporally grouped lists.
We note also that the present results do not preclude the possibility that foreknowledge may bebeneficial for other patterns of grouping besides 3-3-3. It is possible that grouping into threes repre-sents a special case, an assumption supported by evidence this is the most beneficial pattern of group-ing (Ryan, 1969a; Wickelgren, 1964, 1967). This may be because the positions of items in groups ofthree can be specified in terms of unambiguous ‘‘beginning”, ‘‘middle”, and ‘‘end” positional codes(Wickelgren, 1964, 1967). One could argue that these codes are sufficiently unambiguous that theydo not benefit from the further elaboration provided by foreknowledge of the list structure. However,for lists containing groups of more than three items such codes require elaboration and advanceknowledge of the grouping pattern might prove beneficial. We sought to explore this possibility inour next experiment.
2.2. Experiment 2
The first aim of Experiment 2 was to extend the generality of the previous results by examining theeffect of foreknowledge of the grouping pattern for a range of irregular patterns besides regular group-ing in threes. To accomplish this, we conducted a replication and extension of the study of Ryan(1969a; Experiment 2). As in Experiment 1, we compared serial recall performance for predictably

T. Hartley et al. / Cognitive Psychology 87 (2016) 135–178 149
and unpredictably grouped lists in a between-participants design, but this time we dropped theungrouped list condition. The unpredictable grouping condition was based on the corresponding con-dition from the previous experiment, except that we increased the number of grouping patterns from21 to 28, each pattern being presented on an equal number of occasions. As before, the presentationorder of the grouping patterns was random, meaning that participants were unable to predict the pat-tern of grouping on a forthcoming trial. Note that this condition is identical to Ryan’s Experiment 2 inall respects, except that she used only two presentations of each grouping pattern, whereas weincreased this number to ten to improve power and permit more detailed analysis of performancefor each pattern. The predictable grouping condition—which Ryan did not include—was identical,except that the different patterns of grouping were presented in blocks of 10 trials, so that within eachblock participants could predict the pattern of grouping on forthcoming trials.
If our previous failure to observe a beneficial effect of foreknowledge of the list structure on theserial recall of lists grouped into threes is attributable to the special status of this grouping patternthen we would expect recall performance for other grouping patterns to be better when the patternis known in advance. We would further expect serial position curves for the different grouping pat-terns lists to exhibit more pronounced scalloping when the pattern is predictable. By contrast, if recallperformance and the degree of scalloping of serial position curves for different grouping patterns areunaffected by predictability this would be further support for a bottom-up account of grouping in theauditory modality.
The second aim of Experiment 2 was to compare recall performance for different grouping patternsagainst predictions of the BUMP model. We discuss this second aspect after having first described themain empirical findings.
2.2.1. Method2.2.1.1. Participants, stimuli, and apparatus. Twenty-eight members of the campus community at theUniversity of York took part in the experiment in exchange for course credit or payment of £6. Theapparatus and stimuli were the same as those used for Experiment 1 except that new quasi-random lists of digits were created for each participant subject to the same constraints outlinedpreviously.
2.2.1.2. Design and procedure. The experiment had a 2 (list-type: predictably grouped vs. unpredictablygrouped) � 28 (grouping pattern) mixed factorial design. List-type was a between participants factorwhilst grouping pattern was partly between and partly within (see below). The 28 patterns of group-ing comprised 3-3-3 and all permutations of 1-1-7, 1-6-2, 1-3-5, 2-2-5, 1-4-4, 2-3-4. In order to ensurethe duration of the experimental session was acceptable to participants whilst obtaining a sufficientnumber of observations for each pattern of grouping, half of them received one subset of 14 patterns(subset A: 1-1-7; 1-5-3; 1-6-2; 1-7-1; 2-2-5; 2-5-2; 2-6-1; 3-1-5; 4-1-4; 4-3-2; 4-4-1; 5-1-3; 5-2-2; 7-1-1), whilst the other half received the other subset (subset B: 1-2-6; 1-3-5; 1-4-4; 2-1-6; 2-3-4; 2-4-3; 3-2-4; 3-3-3; 3-4-2; 3-5-1; 4-2-3; 5-3-1; 6-1-2; 6-2-1). There were 10 lists for each pattern ofgrouping. For unpredictably grouped lists, patterns were assigned to trials in a different random orderfor each participant, whereas for predictably grouped lists, the 14 patterns were presented in blocks of10 trials, each block involving a single pattern. A diagram-balanced Latin Square was used to assignthe 14 grouping patterns to blocks for each of the 14 participants receiving each subset (A or B).
The procedure was identical to that for the no suppression condition of Experiment 1.
2.2.2. Results2.2.2.1. Overall accuracy. Fig. 6 shows accuracy serial position curves, averaged across the differentgrouping patterns, for predictably and unpredictably grouped lists. By inspection performance onthe two list-types was near identical. Also apparent is that the shape of the serial position curvesresembles that expected for ungrouped lists, with a smooth monotonic decrease in recall performancefrom the first position onwards initially, followed by an upturn in the trend line towards the end of thelist. As we will see shortly, the smooth and continuous appearance of these aggregate curves disguisessystematic and substantial variability in the shapes of the curves for the different grouping patterns.The overall performance data were subjected to a 2 (list-type: predictably grouped vs. unpredictably

1 2 3 4 5 6 7 8 9
0.0
0.2
0.4
0.6
0.8
1.0
Serial Position
Pro
port
ion
Cor
rect
(%
)
PredictableUnpredictable
Fig. 6. Serial position curves from Experiment 2, averaged across grouping patterns, as a function of list-type. Error barsrepresent the standard error of the mean.
150 T. Hartley et al. / Cognitive Psychology 87 (2016) 135–178
grouped) � 9 (serial position) ANOVA, which revealed a significant main effect of serial position, [F(8,208) = 104.48, p < .001]. However, crucially, neither the main effect of list-type [F(1,26) < 1], northe interaction between list-type and serial position [F(8,208) < 1], were significant.
2.2.2.2. Accuracy by grouping patterns. The proportion of correct responses for each of the differentgroupings for predictably and unpredictably grouped lists is illustrated in Table 2. It is clear that therewas considerable heterogeneity in recall performance across the different groupings for both list-types, ranging from 51.4% (unpredictable 1-7-1) to 80.2% (predictable 3-3-3). Crucially, however, forthe majority of groupings recall performance was very similar for predictably and unpredictablygrouped lists.
The proportion correct data were subjected to two separate 2 (list-type) � 14 (patterns) ANOVAs,one for subset A the other subset B. We have already established that overall recall performance forpredictably and unpredictably grouped lists did not differ statistically. What is of interest in the pre-sent analyses is whether any interactions between list-type and patterns are significant, indicatingthat, for some groupings at least, recall performance differed significantly between the two list-types. The analyses revealed this was not the case. For subset A, there was a significant main effectof patterns [F(13,156) = 7.24, p < .001], however, importantly neither the main effect of list-type [F(1,12) < 1], nor the list-type � patterns interaction [F(13,156) < 1], reached significance. For subsetB, there was once again a significant main effect of patterns [F(13,156) = 4.23, p < .001], however, oncemore, neither the main effect of list-type [F(1,12) < 1], nor the list-type � patterns interaction [F(13,156) = 1.19], was significant.
To further illustrate the close correspondence between performance in the predictable and unpre-dictable conditions for the different groupings, panel (a) of Fig. 7 shows the scatterplot. As can be seen,there is a strong positive relationship between performance on the different groupings for the two list-types (r = .72). It is also useful to consider the relationship between performance on the differentgroupings in the original study of Ryan (1969a) and performance on the same groupings in the presentstudy. Panel (b) of Fig. 7 shows a scatterplot of Ryan’s data against the present data for predictablygrouped lists, whilst panel (c) shows Ryan’s data against the present data for unpredictably groupedlists. As can be seen, there are strong positive correlations with Ryan’s data in each case (r = .74 forpredictably grouped lists, and r = .72 for unpredictably grouped lists). The similarity of the pairwisecorrelations between these three different data sets is striking.
Interestingly, the product of the group sizes is a good predictor of recall performance across the dif-ferent grouping patterns in each data set (r = .76 for predictably grouped lists, r = .75 for unpredictably

Table 2Proportion of correct responses in Experiment 2 as a function of list-type and pattern of grouping.
List-type List-type
Pattern Predictably grouped Unpredictably grouped Pattern Predictably grouped Unpredictably grouped
117 .608 .611 324 .722 .683126 .646 .649 333 .802 .790135 .624 .681 342 .746 .717144 .722 .678 351 .617 .648153 .640 .641 414 .732 .659162 .581 .562 423 .635 .732171 .532 .514 432 .710 .719216 .608 .630 441 .706 .683225 .724 .644 513 .665 .632234 .746 .671 522 .757 .659243 .697 .675 531 .697 .686252 .665 .657 612 .644 .665261 .552 .579 621 .643 .710315 .632 .675 711 .621 .559
T. Hartley et al. / Cognitive Psychology 87 (2016) 135–178 151
grouped lists and r = .73 for Ryan’s data). Indeed, the predictive value of the product of the group sizesis at the limit set by the reliability of the behavioural data, as reflected by the correlations shown inFig. 7.
2.2.2.3. Serial position curves. Fig. 8 shows sample serial position curves for four different grouping pat-terns for predictably and unpredictably grouped lists: 2-6-1; 4-4-1; 2-3-4 and 3-3-3. Curves for all 28grouping patterns confirm the general picture and can be inspected as Supplementary materials(Figs. S1–S18). In marked departure from the smooth and continuous appearance of the aggregateserial position curves (see Fig. 6), these curves often—but not always—exhibited multiple scallopingconsistent with the pattern of grouping. This was the case for both predictably and unpredictablygrouped lists, with no evidence that the degree of scalloping was any greater when the grouping pat-tern was predictable.
2.2.3. DiscussionThe present results extend the generality of those of the previous experiment by showing—for a
variety of different temporal grouping patterns—that foreknowledge of the grouping structure onan upcoming trial does not benefit serial recall. Unpredictably grouped lists were recalled with levelsof accuracy indistinguishable from predictably grouped lists, and performance on the different group-ing patterns was strongly correlated between the two list-types. The different groupings also exertedsimilar effects on the serial position curves for the two list-types, the curves for both often exhibitingscalloping consistent with the pattern of grouping. These results are a further indication that theimpact of a particular pattern of grouping on serial recall is not modulated by top-down strategiesbased on knowledge of the grouping structure, and provide compelling evidence that in the auditorymodality positional information is encoded by a bottom-up mechanism sensitive to groupingstructure.
Consistent with Ryan’s (1969a) original findings, we observed considerable heterogeneity in recallperformance across the different groupings (see also Supplementary Information, Table S1). Indeed,there was a strong positive correlation not only between performance on the different grouping pat-terns for predictably and unpredictably grouped lists, but also with Ryan’s data. Like Ryan, we foundthat regular grouping into threes was the most effective form of grouping, whilst irregular groupingscontaining one large and two small groups (e.g., permutations of the patterns 7-1-1 and 6-2-1) weregenerally the least effective. Ryan suggested that the efficacy of temporal grouping is a function of theregularity of the grouping. This assertion is supported by our observation that the product of the groupsizes is a potent predictor of recall performance (see also Supplementary Information, Table S2) in thatthis provides a metric for the degree of regularity of the grouping pattern. Small products are associ-ated with irregular groupings where one group is much larger than the others, whereas the largest

50 60 70 80 90 10050
60
70
80
90
100
Exp
2 u
npre
dict
able
− p
ropo
rtion
cor
rect
(%)
Exp 2 predictable − proportion correct (%)50 60 70 80 90 100
50
60
70
80
90
100
Rya
n (1
969)
− p
ropo
rtion
cor
rect
(%)
Exp 2 predictable − proportion correct (%)
50 60 70 80 90 10050
60
70
80
90
100
Rya
n (1
969)
− p
ropo
rtion
cor
rect
(%)
Exp 2 unpredictable − proportion correct (%)
(a) (b)
(c)
Fig. 7. Scatter plots of the proportion of correct responses for the 28 different patterns of grouping used in Experiment 2 and inRyan (1969a). Panel (a) plots proportion correct for the unpredictable and predictable conditions of Experiment 2. Theremaining panels plot proportion correct for Ryan’s experiment against (b) the predictable condition of Experiment 2 and (c) theunpredictable condition of Experiment 2.
152 T. Hartley et al. / Cognitive Psychology 87 (2016) 135–178
product and highest level of recall corresponds to equal groups of three. However, while the ‘‘productrule” provides an excellent empirical yardstick for predicting the overall effectiveness of differentgrouping patterns, it does not explain how such patterns determine overall recall performance, or haveanything to say about more detailed characteristics of recall such as serial position curves and errors.As we shall see shortly, these characteristics are emergent properties of the bottom-up mechanismemployed in the BUMP model. For now, we note that the central finding of the current experi-ment—that predictably and unpredictably grouped lists are recalled with equal efficacy—is consistentwith the bottom-up feature of the BUMP model. However, the plausibility of the model would be fur-ther bolstered if it could be demonstrated that it can provide a quantitative account of the heterogene-ity in recall performance across the different groupings. We turn to this next.
3. Simulations of grouping
The detailed implementation of the BUMP model is described in Appendix A. For simplicity, simu-lations used a minimal implementation of competitive queuing to assess whether the key empirical

(a) (b)
(d)(c)
Fig. 8. Serial position curves from Experiment 2 as a function of list-type, for four of the 28 patterns of grouping tested: (a) 2-6-1, (b) 4-4-1, (c) 2-3-4, and (d) 3-3-3. Error bars represent the standard error of the mean.
T. Hartley et al. / Cognitive Psychology 87 (2016) 135–178 153
phenomena can be explained solely in terms of properties of the context signal. Thus, associationsbetween items and temporal context are stored simply as the mean activation of the context vector(i.e. the activity of the set of idealized ‘‘neurons” in the model) during the presentation of each item.To determine an item’s activation at retrieval we replay the context signal and compare each item’sstored context vector with the current state of the context signal using a Euclidean distance metric:the closer the stored context vector is to the current context, the more active the item becomes. Aseach item’s activation peaks, it competes with the other items to determine which is recalled (we sim-ulate a large number of competitions in which Gaussian noise is added to each item’s activation, lead-ing to occasional errors). Once retrieved, the item’s activation is suppressed which is normallysufficient to prevent it from being reselected—the degree of suppression decays exponentially overtime. We analyse the winning item at each serial position.
Briefly we simulate the retrieval of a temporally structured list by:
(i) Creating an input signal based on amplitude modulations associated with the presentation ofeach item. The timing of the onsets of the items follows that used by Ryan (1969a). The durationof the items is not recorded in the original paper, but in the simulations it is held constant(0.3 s). (Examples of the input signal used for ungrouped, and 3-3-3 and 2-6-1 grouped listswere shown in Fig. 3.)
(ii) The context signal generated by the input signal is calculated. The context signal is the time-varying response of a population of cells, which act as temporal filters with different AM tunings(scales), spanning the range of frequencies encountered in the task. In the simulations reported

154 T. Hartley et al. / Cognitive Psychology 87 (2016) 135–178
here the population comprised 15 log-spaced frequencies ranging from 0.10 Hz to 1.28 Hz (seeAppendix). The precise details are not critical to the model’s key predictions, though the overallspan and log-spacing may have important effects, as we discuss later. Each frequency is repre-sented by two phase-shifted filters. Examples of the evolution of phase and amplituderesponses to ungrouped, and 3-3-3 and 2-6-1 grouped lists were shown in Fig. 3.
(iii) Each item is associated with the state of the context signal during its presentation, which isstored.
(iv) At retrieval the context signal is replayed. Items to be recalled are activated according to thesimilarity between the current state of the context signal and the stored association. Items com-pete to be output, with the most active item being selected at the time points where the sim-ilarity of the current and stored states of the context signal is greatest. However, activation alsoincludes Gaussian noise, which means that the correct item will not always be selected. Afterselection, the activation of the selected item is subject to inhibition which typically preventsit being reselected in immediately following serial positions.
(v) The order of the retrieved items is compared to the correct order, and responses at each serialposition are recorded as correct or incorrect, with transpositions of ±1, ±2, ±3 also being countedseparately.
We simulated 100,000 retrieval attempts for each of the 28 experimental grouping patterns.In the simulations reported next, model parameter values were chosen without fitting to the data
to give overall levels of performance approximately in line with experimental observations (items cor-rect, lists correct, serial position curves) for ungrouped lists: filter depth n = 15; filter spacing k = 1.2;base frequency fb = 0.1 Hz; filter width rb = (1/fb � 0.5) = 5 s (see Appendix A for further explanation).In Appendix B we present a detailed exploration of the effects of varying parameter values on themodel’s performance, including the results of fitting key parameters to our experimental data.
3.1. Results
We focus on comparing simulations of the recall of irregularly grouped lists with data from Ryan(1969a) and from Experiment 2. Before doing so we note that the absence of any effect of the pre-dictability manipulation in Experiment 2 allows us to simplify reporting by pooling data over the pre-dictable and unpredictable grouping conditions.
3.1.1. Error rates for different irregular grouping patternsAs can be seen in Fig. 3, the responses of low frequency oscillators sensitive to overall list position
are qualitatively similar across grouping conditions. Grouping typically leads to the recruitment ofextra oscillators and improves the overall level of recall relative to ungrouped presentation, differ-ences between grouping conditions being largely accounted for through the distinctive pattern ofrecruitment of higher frequency oscillators they engage. As should be clear, however, the degree ofimprovement will depend crucially on the frequencies present in the grouping pattern and the localregularity of delays. In general, patterns with similar group sizes, and therefore a more homogeneousrhythm, will recruit subsets of oscillators more strongly than patterns with disparate group sizes.However, the important question is whether the model can reproduce human data at a more detailedlevel of description.
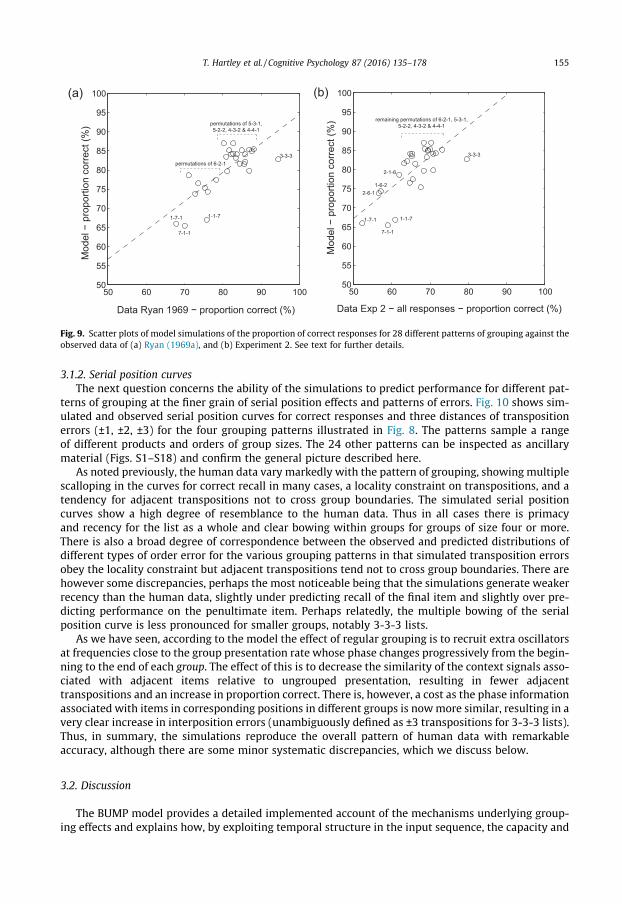
Fig. 9 shows scatterplots of observed vs predicted percent correct recall for the 28 grouping pat-terns. The correlations between the simulated and observed data were r = 0.77 for Ryan’s data andr = 0.74 for the data from Experiment 2. As the correlation between the two sets of empirical datawas only slightly higher at r = 0.78, the simulations can be regarded as an excellent fit. The simulateddata also correlate highly with the product of the group sizes, r = 0.78, which we noted previously is asimple yardstick of the regularity in the grouping pattern. Full data on performance in each groupingcondition from both Ryan (1969a), Experiment 2 and our simulations are presented as Supplementarydata in Table S1. Inter-correlations between these measures are tabulated as Table S2.
50 60 70 80 90 10050
55
60
65
70
75
80
85
90
95
100
Mod
el −
pro
porti
on c
orre
ct (%
)
Data Exp 2 − all responses − proportion correct (%)
1-1-7
1-6-2
1-7-1
2-1-6
2-6-1
3-3-3
7-1-1
remaining permutations of 6-2-1, 5-3-1, 5-2-2, 4-3-2 & 4-4-1
50 60 70 80 90 10050
55
60
65
70
75
80
85
90
95
100M
odel
− p
ropo
rtion
cor
rect
(%)
Data Ryan 1969 − proportion correct (%)
1-1-71-7-1
3-3-3
7-1-1
permutations of 6-2-1
permutations of 5-3-1, 5-2-2, 4-3-2 & 4-4-1
(a) (b)
Fig. 9. Scatter plots of model simulations of the proportion of correct responses for 28 different patterns of grouping against theobserved data of (a) Ryan (1969a), and (b) Experiment 2. See text for further details.
T. Hartley et al. / Cognitive Psychology 87 (2016) 135–178 155
3.1.2. Serial position curvesThe next question concerns the ability of the simulations to predict performance for different pat-
terns of grouping at the finer grain of serial position effects and patterns of errors. Fig. 10 shows sim-ulated and observed serial position curves for correct responses and three distances of transpositionerrors (±1, ±2, ±3) for the four grouping patterns illustrated in Fig. 8. The patterns sample a rangeof different products and orders of group sizes. The 24 other patterns can be inspected as ancillarymaterial (Figs. S1–S18) and confirm the general picture described here.
As noted previously, the human data vary markedly with the pattern of grouping, showing multiplescalloping in the curves for correct recall in many cases, a locality constraint on transpositions, and atendency for adjacent transpositions not to cross group boundaries. The simulated serial positioncurves show a high degree of resemblance to the human data. Thus in all cases there is primacyand recency for the list as a whole and clear bowing within groups for groups of size four or more.There is also a broad degree of correspondence between the observed and predicted distributions ofdifferent types of order error for the various grouping patterns in that simulated transposition errorsobey the locality constraint but adjacent transpositions tend not to cross group boundaries. There arehowever some discrepancies, perhaps the most noticeable being that the simulations generate weakerrecency than the human data, slightly under predicting recall of the final item and slightly over pre-dicting performance on the penultimate item. Perhaps relatedly, the multiple bowing of the serialposition curve is less pronounced for smaller groups, notably 3-3-3 lists.
As we have seen, according to the model the effect of regular grouping is to recruit extra oscillatorsat frequencies close to the group presentation rate whose phase changes progressively from the begin-ning to the end of each group. The effect of this is to decrease the similarity of the context signals asso-ciated with adjacent items relative to ungrouped presentation, resulting in fewer adjacenttranspositions and an increase in proportion correct. There is, however, a cost as the phase informationassociated with items in corresponding positions in different groups is nowmore similar, resulting in avery clear increase in interposition errors (unambiguously defined as ±3 transpositions for 3-3-3 lists).Thus, in summary, the simulations reproduce the overall pattern of human data with remarkableaccuracy, although there are some minor systematic discrepancies, which we discuss below.
3.2. Discussion
The BUMP model provides a detailed implemented account of the mechanisms underlying group-ing effects and explains how, by exploiting temporal structure in the input sequence, the capacity and

Serial Position
Pro
porti
on o
f Res
pons
es (%
)
Experiment 2correct
Simulation(a)
(b)
(c)
(d)
1 2 3 4 5 6 7 8 90
10
20
30
40
50
60
70
80
90
100
1 2 3 4 5 6 7 8 90
10
20
30
40
50
60
70
80
90
100
1 2 3 4 5 6 7 8 90
10
20
30
40
50
60
70
80
90
100
1 2 3 4 5 6 7 8 90
10
20
30
40
50
60
70
80
90
100
1 2 3 4 5 6 7 8 90
10
20
30
40
50
60
70
80
90
100
1 2 3 4 5 6 7 8 90
10
20
30
40
50
60
70
80
90
100
1 2 3 4 5 6 7 8 90
10
20
30
40
50
60
70
80
90
100
1 2 3 4 5 6 7 8 90
10
20
30
40
50
60
70
80
90
100
123
Fig. 10. Simulated serial position curves for correct responses and three categories of transposition error alongside observeddata from Experiment 2 for four of the 28 grouping patterns (a) 2-6-1, (b) 4-4-1, (c) 2-3-4, and (d) 3-3-3. See text for furtherdetails.
156 T. Hartley et al. / Cognitive Psychology 87 (2016) 135–178
fidelity of auditory-verbal memory can be extended. Experimental data clearly show that serial recallcan benefit from such structure in the input, even when it is unpredictable and irregular. This can onlybe possible within a competitive queuing mechanism if the context signal is sensitive to such

T. Hartley et al. / Cognitive Psychology 87 (2016) 135–178 157
structure. In implementing such a general context signal (i.e., one not specialised for a particular pre-specified temporal structure), we extended the competitive queuing framework to these circum-stances. We find that many otherwise unexplained features of serial recall can be understood in termsof the similarity of states of the context signal which are associated with different items. As in all com-petitive queuing models, items associated with similar states tend to transpose with one another. Inthe BUMP model, this is neither a monotonic function of time nor serial position, nor ‘‘hard-wired” fora particular expected structure. It is an emergent property shaped by the temporal structure of theinput and the resonance it produces in an array of oscillators tuned to local fluctuations on a rangeof timescales. This population produces a coherent response, especially when driven by regularlytimed inputs; grouping typically serves to recruit a wider range of oscillators, with some grouping pat-terns producing stronger and more coherent activity than others.
When overall performance on different grouping patterns is compared, the pattern of results clo-sely matches those seen in experiments, with the correlation between data and model being as strongas the consistency between experimental studies. The model also reproduces familiar features of serialmemory: a bowed serial position curve showing primacy and recency, the tendency for local transpo-sitions and interposition errors in regularly grouped sequences. Detailed qualitative features of irreg-ularly grouped list recall are also reflected in the simulations; in particular we see that the serialposition curve within longer groups is clearly bowed so that the shape of the serial position curveis sensitive to the grouping structure. In Appendix B we show that these features are characteristicof the model across a wide range of plausible parameter values indicating that they are emergentproperties of the BUMP mechanism.
In the simulations just reported, we do not see clear bowing of the serial position curve for shortergroups whereas in the empirical data this is often fairly pronounced, leading to a scalloped serial posi-tion curve, especially in regularly grouped lists. We note however, that when the noise parameter inthe model is allowed to vary to fit the experimental data (Appendix B), pronounced scalloping is seenacross a wide range of tuning parameters.
Nonetheless, the model has somewhat reduced recency compared with the experimental data, andits performance on regularly grouped (3-3-3) lists does not benefit as much as that of human partic-ipants. With its current parameters, the model appears to be slightly too sensitive to regular groupingwith a large proportion of oscillators resonating with grouping frequency for regularly grouped lists,leading in turn to a high proportion of interposition errors at all serial positions, which may contributeto some of the differences we observe.
In the preceding simulations we did not vary the range and spacing of neurons in our population,but in Appendix B we systematically investigate the effects of varying these tuning parameters. Crit-ical features of the grouping data are shown to be stable characteristics of the BUMP mechanismwhich emerge over a wide range of plausible parameter values. However, some of the more subtle fea-tures of the model are somewhat sensitive to the range and spacing of its oscillators. In particular, thesimilarity metric used to determine the activation of items at retrieval (and hence their propensity totranspose with one another) weights each oscillator equally. If the population has more low-frequencyoscillators (at or near the list presentation rate) it will be more prone to local transpositions and cor-respondingly less prone to interposition errors. If the population has more mid-frequency oscillators(corresponding to the temporal scale of groups encountered in the input) then the overall response ofthe population will tend to resonate with the group (especially for regularly grouped lists) and inter-position errors will be more likely. At even higher frequencies, the oscillators will go through one cyclefor each item encountered. These oscillators do not contribute to the encoding of serial order at thetimescales involved in serial recall experiments, though they might be useful for encoding phonolog-ical sequences (e.g., nonwords); in serial recall high frequency oscillators make the context-signalassociated with consecutive items more similar and are therefore likely to oppose the effects of group-ing. Clearly by varying the weighting of each oscillator (adding additional free parameters) we couldfit the data from a given experiment better. However, our current motivation is to demonstrate thatthe BUMP mechanism can explain many otherwise puzzling effects of temporal grouping on verbalmemory, in terms of its emergent features, without careful selection of parameters relevant to aparticular task. This leaves open the possibility that the mechanism may have a more general role,a possibility we flesh out further below.
158 T. Hartley et al. / Cognitive Psychology 87 (2016) 135–178
4. General discussion
In the current study, our aims have been to better understand the relationship between rhythmand memory for spoken sequences and to develop an account of a mechanism that can explain thisrelationship. Rhythm has been implicated in the general problem of serial order since it was set outby Lashley (1951), and temporal grouping has been known to have large effects on the serial recall ofverbal materials since the late 1960s (Ryan, 1969a, 1969b). However, despite progress in computa-tional modelling of immediate serial recall, the effects of irregular and unpredictable temporalgrouping have been largely unaddressed. This is a significant problem since the timing of naturalutterances is neither regular nor predictable, and as we showed in Experiments 1 and 2, the effectsobserved by Ryan do not depend on predictability and are highly and reproducibly sensitive to dif-ferent patterns of irregularity. We argue that these data are strongly suggestive of a bottom-upmechanism for the encoding of serial order, meaning one that is sensitive to the timing of spokenitems as they occur.
We described a multi-oscillator filter mechanism (BUMP) that responds to local changes in thespeech signal on a range of timescales, and we showed that it generated predictions for the recallof sequences grouped in a variety of different ways that were a good match to human data. The spec-ification of a plausible stimulus-driven mechanism for determining the context signal makes theBUMP model a significant advance on existing context signal models of short-term memory, and,we suggest, a platform for future investigation and development. In the remaining discussion we con-sider the empirical findings in more detail before moving on to discuss the BUMP model, its implica-tions for current models of serial order in short-term memory and finally broader implications forserial order in language processing more generally.
4.1. Experimental findings
We examined the role of encoding strategies by assessing whether the ability to recall a sequencedepended on whether its grouping pattern could be predicted in advance. We reasoned that if suchstrategies do play a significant role, there should be stronger effects of grouping when the pattern isknown in advance. Experiment 1 showed that this was not the case for regularly grouped (3-3-3)sequences and Experiment 2 extended this result to a wide range of irregular grouping patterns.Results showed large variation in overall levels of recall, serial position curves, and error patternsfor different grouping patterns but no effect of predictability. Thus, it was not simply that fore-knowledge of the grouping pattern had a null effect, which by itself would be difficult to interpret,but predictability had no effect alongside large and systematic variation in recall associated with dif-ferent grouping patterns. These results are consistent with the suggestion that strategies such asrehearsal are not an important mediator of grouping effects for auditory sequences (Frankish,1985; Hitch et al., 1996; Ryan, 1969b). They suggest instead that for auditory-verbal sequences, sen-sitivity to grouping is primarily dependent on bottom-up processes. The importance of bottom-upprocesses does not rule out any contribution of top-down strategies, and indeed it is clear that sub-jective grouping strategies do seem to play a minor role. For example, in Experiment 1, serial posi-tion curves for ungrouped sequences showed modest scalloping, suggesting a spontaneous tendencyto impose a 3-3-3 pattern on the input sequence, consistent with other data (Farrell & Lelièvre,2009; Henson, 1996; Madigan, 1980). Broadly however, our results indicate that the critical varia-tions in accuracy and error distributions for irregularly timed sequences are not explicable in termsof such strategies.
Experiment 2 was also important in showing that Ryan’s (1969a) results for irregular grouping pat-terns were not only highly replicable, but consistent with a rule of thumb whereby sequence memo-rability varies as the product of the group sizes. This empirical relationship places the classic findingthat grouping in threes is optimal on a continuum, in contrast to suggestions that the number threerepresents a special case (e.g., Wickelgren, 1964, 1967). We suggested that the product of group sizesis important because it reflects the regularity of the grouping pattern, which in turn determines theoverall distinctiveness of the context signal in BUMP.
T. Hartley et al. / Cognitive Psychology 87 (2016) 135–178 159
4.2. Evaluation of the BUMP model
The two key features of the model are the assumptions (1) that the serial order of items in asequence is encoded by a bottom-up analysis of the speech input, and (2) that this analysis is achievedby means of a set of filters that respond to local changes in the magnitude and phase of its amplitudeenvelope at different frequencies. As described above, the first assumption is broadly supported by thepresent results. The principal support for the second assumption is the BUMP model’s capacity to pre-dict overall levels of accuracy for different irregular grouping patterns.
Performance varied markedly with grouping pattern in Experiment 2, and the model’s ability topredict this variation was as good as the consistency between the observed data and the previous dataof Ryan (1969a). Our simulations also capture key qualitative properties of the distinctive serial posi-tion curves and distribution of local transposition and interposition errors that are characteristic ofdifferent grouping patterns, effects that we show (Appendix B) are emergent and characteristic prop-erties of the BUMPmechanism, and not strongly dependent on the values of parameters governing therange and spacing of the oscillator population. The mechanistic explanation of these otherwise unex-plained phenomena is persuasive evidence in favour of the involvement of a BUMP-like mechanism inserial memory for spoken sequences.
We note, however, some systematic discrepancies between model and data. For example, themodel over-predicted recall for the least regular 1-1-7, 1-7-1, 7-1-1 patterns and the most regular3-3-3 pattern. Also, although simulated serial position curves for irregularly grouped lists showedmultiple bowing, with order errors obeying the locality constraint but not crossing group boundaries,broadly consistent with the human data, the model tended to predict too little recency, insufficientmultiple bowing and too many interposition errors for 3-3-3 lists. Further simulations (Appendix B)show that the degree of bowing is readily reproduced when the noise level in the model is allowedto vary to fit the experimental data, but the other features appear to be more sensitive to the rangeand spacing of oscillators’ frequency tunings. Thus, these discrepancies could be addressed by modi-fying the distribution of filters, which for simplicity are equally spaced (in terms of log frequency) andequally weighted in the present model. Changing these parameters would fine-tune the balance ofsensitivities to groups of different sizes and improve the fit to human data. However, they wouldnot address the problem of under-predicting recency. This may indicate a structural limitation of con-text signal models as Burgess and Hitch (1999) found it necessary to specify an extra process wherebythe final item has special status to achieve sufficient recency for auditory sequences.
4.3. Relationship of BUMP to other models
We introduced BUMP as a new member of the family of context signal models for serial order inshort-term memory (Brown et al., 2000; Burgess & Hitch, 1992, 1999, 2006; Farrell, 2012;Lewandowsky & Farrell, 2008; Page & Norris, 1998), going beyond them by specifying a mechanismfor generating the context signal from the perceptual input. BUMP shares with other context signalmodels the core serial ordering principles of competitive queuing among simultaneously active ele-ments followed by suppression of the winning element (see Hurlstone et al., 2014).
Historically, BUMP derives from an early attempt to specify an input-driven, speech-specific, con-text signal in Hartley and Houghton’s (1996) model of short-termmemory for unfamiliar phonologicalsequences. A key feature of this model was that the phonological input drove the context signalthrough a cyclical pattern whereby similar states are entered when phonemes occupy correspondingpositions in adjacent syllables. The cyclical element of the context signal was required to account forthe human tendency, in nonword repetition (and in spontaneous speech), for between-syllable pho-neme transpositions to involve phonemes that occupy corresponding within-syllable positions, anal-ogous to interposition errors in immediate serial recall of temporally grouped lists.
The use of quadrature filters to generate a cyclical context signal was discussed by Hartley (1996),and partially implemented in the model proposed by Henson and Burgess (1997), which, like BUMP,assumes that pairs of filters tuned to different frequencies compete to represent the input. However,unlike BUMP, Henson and Burgess did not specify an on-line, stimulus-driven mechanism. Reflectingthis limitation, the grouping pattern had to be known in advance of sequence presentation in order for

160 T. Hartley et al. / Cognitive Psychology 87 (2016) 135–178
the model to generate the appropriate context signal. Thus, the BUMP model represents a significantextension of Henson and Burgess (1997).
A particularly close neighbour is OSCAR (Brown et al., 2000), which also assumes a multi-oscillatorcontext signal. However, the crucial difference between OSCAR and the BUMP model is that in OSCARthe oscillators are free-running and the mechanism whereby appropriate oscillators are recruited forany sequence is not specified, as Brown et al. (2000) themselves noted. Other close neighbours are thecontext signal models of Burgess and Hitch (1999, 2006), and Farrell (2012). These models assume acentral serial ordering mechanism that is not tied to any specific input modality. One way of viewingBUMP is as a front-end to such models that enables them to deal with spoken inputs, which in turnhighlights the importance of specifying corresponding front-ends for other modalities.
While our findings are most easily understood as extending those of earlier models of immediateserial order, such as those discussed above, it is worth noting that the BUMP mechanism may alsoprove compatible with more general models of memory (viz. SIMPLE, TCM), which also involvetime-varying context signals. Our model shows how such context signals might be systematicallyinfluenced by the temporal structure of the input, and thus may have wider implications for episodicmemory and free recall.
Another way that BUMP differs from previous context signal models of short-term memory forserial order (Brown et al., 2000; Burgess & Hitch, 1992, 1999, 2006; Farrell, 2012; Henson, 1998;Lewandowsky & Farrell, 2008; Page & Norris, 1998), is that the context signal is not list-independent. In these earlier models the context signal was generated by an independent mechanismduring encoding and simply replayed using the same mechanism at retrieval. In contrast, the contextsignal in BUMP varies according to the input sequence, raising the question of how the appropriatecontext signal is regenerated at recall. Here an analogy with an orchestra may be helpful. The repre-sentation of item timing is analogous to the score, determining where each instrument plays relativeto the beat. The evolution of the context signal during learning and recall is analogous to the conductorwho controls the tempo and metre of the music through a relatively simple signal. In the model the‘‘conductor signal” that drives the oscillators is a rather simple one-dimensional signal that tracksamplitude modulations during presentation. The current model explains how the score is stored,but leaves open the (much simpler) problem of how the conductor reconstructs its tempo and metre.
We note that, just as the orchestra can still play the score when the conductor adjusts the tempoand metre of a performance, the intrinsically elastic responses of the oscillators to variations in theconductor signal mean that the model’s behaviour is expected to degrade rather gracefully if the con-ductor signal varies somewhat between presentation and testing, so a precise representation of thetiming of the original sequence is not essential (though simulating selection under such circumstanceswould considerably complicate the implementation of the model). Nonetheless, the BUMP modelmight be criticised as merely shifting the problem of how to remember a sequence of items to thatof how to remember (at least coarsely) its temporal structure. While this is a valid point, we feel thatan explanation of the relationship between ‘‘conductor” and ‘‘orchestra” in explaining patterns of errorin serial recall is a significant advance and that the new focus it brings to the character and role of the‘‘conductor” will be useful in spurring new research. For example, one interesting approach will be toinvestigate effects of varying properties of the conductor signal at retrieval.
To the extent that the model’s critical properties prove dependent on reproducing the precisestructure of the conductor signal at retrieval, additional machinery may be required to explain howthis much simpler pattern is stored and retrieved. Here it is interesting to note that a similar problemis already addressed in the TCM account of episodic memory (Howard & Kahana, 2002). Unlike thecompetitive queuing models of serial recall reviewed above, the evolution of context in TCM is notindependent of the content that is encoded. In this limited sense it shares the ‘‘bottom-up” characterof context in the BUMP model. Importantly, and unlike the BUMP model, the recurrent interaction ofcontext and content in the TCM account explains how the initial state of the dynamic context signalmight be reinstated at retrieval from a static cue (e.g., the first item). Incorporating a TCM-like mech-anism into the BUMP model might thus appear to address the problem of reproducing the ‘‘conductorsignal” at retrieval. This is a little like imagining that the conductor is prompted to recall the tempoand metre of the score as the orchestra begin to play. But it seems equally possible (and more parsi-monious) to envisage a simpler situation in which the conductor is able to beat time without the

T. Hartley et al. / Cognitive Psychology 87 (2016) 135–178 161
music. An implementation of this seems compatible with existing models of serial recall (e.g., Burgess& Hitch, 1999, 2006) and would involve an endogenous mechanism where amplitude modulations(rather than distinct items) at encoding are directly associated with states of an elementary (inputindependent and free running) internal clock during learning.
Another important comparison in the literature concerns the distinction between ‘‘time-based” and‘‘event-based” models of serial order. In the former, the context signal changes as a function of abso-lute time, whereas in the latter, the context signal changes only when a new event (e.g., a new item) isexperienced. Two sources of experimental evidence have been used to adjudicate between these twoclasses of models.
The first source of evidence comes from experiments by Ng and Maybery (2002, 2005) who com-pared time-based and event-based accounts on the basis of their predictions regarding the locus ofinterpositions in temporally grouped lists. Time-based accounts predict that interpositions shouldpreserve their temporal within-group position; items that occur at the same time in different groupsshould exchange position with one another. Event-based accounts, by contrast, predict that interpo-sitions should preserve their ordinal within-group position; items that occur in the same ordinal posi-tion in different groups should exchange position with one another. Across four experiments thatvaried the presentation rates of items in different temporal groups, Ng and Maybery (2002, 2005)observed a pattern of between-group confusions consistent with event-based accounts, and at oddswith time-based accounts.
The second source of evidence comes from studies of temporal isolation effects. According to sev-eral time-based accounts, to which BUMP bears a family resemblance (e.g., OSCAR and SIMPLE), thedegree of temporal separation of an item from its neighbours at encoding influences the accuracy withwhich it is recalled. That is, items that are spaced far apart in time should be more distinctive and lessconfusable than items that are spaced close together in time. However, contrary to this prediction, awealth of studies have failed to show evidence of a recall advantage for temporally isolated items inforward serial recall (Lewandowsky & Brown, 2005; Lewandowsky, Brown, Wright, & Nimmo, 2006;Nimmo & Lewandowsky, 2005, 2006; Parmentier, King, & Dennis, 2006; although see Morin, Brown,& Lewandowsky, 2010 for a discussion of boundary conditions).
These results are problematic for existing time-based accounts, such as OSCAR and SIMPLE, and atfirst blush might seem to be at variance with the new model presented here. However, these resultsare less problematic for the BUMP model, since it has characteristics of both time-based and event-based accounts and can be considered a hybrid in this regard. Its time-based characteristics arise fromthe continuous change in the context signal, whereas its event-based characteristics arise from its sen-sitivity to local changes in amplitude of the speech signal. In summary, although further detailedinvestigation of the structure of interposition errors and the apparent absence of temporal isolationeffects is warranted, the main current contribution of the BUMP model is to show that much of theearlier debate around time- or event-based models hinges on what may prove to be a false dichotomy.
4.4. Scope of the BUMP model
At this point, we should perhaps make it explicit that we do not propose the BUMP model, orindeed multiple oscillator systems more generally as a panacea. Indeed, we have deliberately limitedthe scope of the model in order to focus on the explanatory power of the emergent properties of itscontext signal to address otherwise unexplained effects of irregular and unpredictable timing onmemory for auditory-verbal sequences. Many other features of auditory-verbal short-term memoryare not addressed. In broad terms these fall into two clusters: effects of materials and effects associ-ated with executive control processes. Here we identify the main omissions and comment on howthese phenomena might be reconciled with a BUMP-like account of serial order, starting with effectsof materials.
In presenting BUMP as a solution to the ‘‘front-end problem”, we purposefully did not attempt tomodel the way phonological variables influence verbal short-termmemory, in particular the signatureeffects of phonemic similarity and word length and their interactions with articulatory suppression.Given that these effects are empirically separable from the effects of temporal grouping (Hitchet al., 1996) and are reasonably well explained by existing context signal models in terms of item

162 T. Hartley et al. / Cognitive Psychology 87 (2016) 135–178
representations (see e.g., Brown et al., 2000; Burgess & Hitch, 1999, 2006), we would envisage a fullelaboration of BUMP to include phonological representations of items in a broadly similar way.
Another deliberate omission from the BUMP model for the purpose of simplicity was effects ofprior learning in immediate recall, as reflected in well-established effects of variables such as lexicality(Hulme, Maughan, & Brown, 1991) and word-likeness (Gathercole, Willis, Emslie, & Baddeley, 1991).We note that such effects have been simulated in context signal models by including a learning orlong-term memory component (e.g. Burgess & Hitch, 1999, 2006), and thus are not fundamentallyincompatible with BUMP. Related to this, BUMP was not designed to address grouping of inputs onthe basis of familiar patterns or chunks (Miller, 1956), which we argue involves fundamentally differ-ent knowledge-driven processes from those underpinning grouping by perceptual features alone.
Other forms of long-term knowledge affect memory for linguistic stimuli. We note in particular theimportance of prior constraints such as phonotactics, syntax and semantics on the processing of serialorder in language. Constraints of this sort were referred to generically by Lashley (1951) as order sche-mata. To the extent that they are unrelated to the perceptual qualities of speech that drive the oscil-lators in the BUMP model, they clearly fall beyond its scope. We therefore propose BUMP as a keycomponent of the serial ordering mechanism for language but most certainly not the whole story.
We turn next to the issue of executive control processes. Although we have presented strong evi-dence that top-down processes play little or no part in the ability to recall auditory-verbal sequencespresented in various patterns of temporal grouping, this is of course not to deny the importance oftop-down influences in short-term memory more generally. We have already noted the tendency toimpose subjective grouping on a temporally ungrouped input (Experiment 1; see also Farrell &Lelièvre, 2009; Henson, 1996; Madigan, 1980) and it has also been shown that people can subjectivelygroup ostensibly ungrouped sequences in various different ways when instructed to do so(Wickelgren, 1964, 1967). These subjective grouping effects do not challenge our central claim thattop-down processes are unimportant in accounting for memory for temporally grouped auditory-verbal sequences. However, on grounds of parsimony alone one would wish to see them incorporatedin a common theoretical account. One way this might be achieved is by postulating that subjectivegrouping reflects an internal, top-down input to the BUMP mechanism that is effective when theexternal stimulus provides a weak signal. Thus, for an ungrouped list, oscillators at rates correspond-ing to subjective groups could be given a strategic boost during encoding and retrieval. However, anysuch internal boost would be ineffective when oscillators corresponding to objective groups werebeing strongly driven by the external input. More generally, we can imagine top-down modulationof BUMP oscillators could be used to optimize the representation of serial order at different timescales.For example, in the current digit span like tasks, the critical serial structure operates at the level oflexical items, whereas in nonword repetition, finer temporal structure at the scale of phonemesequencing is more critical. These different tasks might depend on the activity of different subsetsof the oscillator population which could be strategically modulated to optimize performance.
Other, related grouping phenomena that we have not addressed in the current study are the non-temporal grouping effects associated with changes in perceptual features such as intonation (Frankish,1995) and spatial location (Parmentier & Maybery, 2008). Such effects are consistent with the assump-tion that grouping reflects bottom-up processes operating on the speech input, but the question iswhether the BUMP mechanism is capable of handling them. Again, we speculate that these non-temporal grouping effects might be reconciled with a BUMP-like mechanism by adding top-downattentional filters which could modulate the degree to which oscillators are engaged by different audi-tory streams, providing an additional grouping cue.
If top-down input can modulate the degree to which auditory stimuli engage the oscillators, wesuspect that such filters will not entirely abolish modulation by unattended streams. We know thatunattended speech disrupts immediate serial recall (Jones & Macken, 1993; Salamé & Baddeley,1982), and in the BUMP model this can be conveniently explained in terms of interference in theentrainment of oscillators by amplitude modulation in the unattended stream. Indeed, it is a clear pre-diction of the BUMPmodel that (in the absence of a wholly effective attentional filter) AM stimuli at ornear speech production rates should be particularly potent disruptors of immediate serial memory,and it should be possible to specify stimuli that are optimal disruptors or which drive specific patternsof serial order error.
T. Hartley et al. / Cognitive Psychology 87 (2016) 135–178 163
A final set of questions concern whether BUMP can address grouping effects for non-verbalsequences. We note firstly that serial recall of sequences in the spatial and visual domains appearsto involve a competitive queuing process (Hurlstone et al., 2014), and that this is broadly consistentwith, but not unique to BUMP. However, given that BUMP is specialised for processing speech input,we would not expect to see detailed correspondences with other modalities. Interestingly, there areindications that empirical effects of temporal grouping in the visual and spatial domains differ slightlyfrom those for spoken sequences, and are influenced by domain-specific perceptual features(Hurlstone & Hitch, 2015; Hurlstone et al., 2014). We favour the general hypothesis that processingserial order involves a common general principle of competitive queuing across domains driven bydomain-specific mechanisms for analysing the perceptual input, but another possibility is that a com-mon context signal (such as BUMP) can be repurposed for different tasks by the application of top-down modulation.
4.5. Broader implications
We now turn to the important question of whether the BUMP mechanism has relevance beyondshort-term memory. We referred earlier to the empirical evidence for a link between phonologicalshort-term memory and vocabulary acquisition (Baddeley et al., 1998) and the idea that it is bestviewed as part of the language system (Allen & Hulme, 2006; Martin & Saffran, 1997; Monsell,1987). The link with vocabulary acquisition has stimulated proponents of computational models ofshort-term memory to regard them as integrative accounts that embrace vocabulary acquisition aswell as immediate serial recall (e.g., Gupta & MacWhinney, 1997; Hartley & Houghton, 1996; Page& Norris, 2009; see also Burgess & Hitch, 2006). These authors argue that the representation of serialorder in immediate memory is crucial for forming long-term representations of familiar words assequences of phonemes. There are also grounds for considering whether a BUMP-like mechanism sup-ports speech production. For example, similarities between error patterns in speech production andimmediate serial recall of verbal sequences have been interpreted as suggesting a common serialordering process (Page, Madge, Cumming, & Norris, 2007). Work by Vousden et al. (2000) is particu-larly relevant in that they show how a multi-oscillator based process similar to that proposed byBrown et al. (2000) might explain a range of phonological constraints on speech errors – in which reor-dered segments typically retain their syllable positions. Their model is broadly compatible with theBUMP mechanism, but lacked a mechanism to explain how the oscillator phases might be entrainedto stimuli so that appropriately structured representations could be learned in the context of natural,continuous speech. However, preliminary work by Hartley (2002) shows that the coherent response ofa BUMP-like mechanism tracks the production of syllables in connected speech such that the overallphase of the population response represents the current syllable position. BUMP therefore has thepotential to provide a link underpinning the control of serial order in nonword repetition (Hartley& Houghton, 1996; Treiman & Danis, 1988), vocabulary acquisition (Gupta & MacWhinney, 1997)and speech production (Vousden et al., 2000).
A further opportunity for broader theoretical integration is with models of speech perception. It isinteresting to note evidence that speech analysis involves multiple oscillators that sample the ampli-tude envelope at different time-scales to allow segmentation at different grain sizes corresponding tophonemes, syllables, etc. (Luo & Poeppel, 2007; Poeppel, Idsardi, & van Wasssenhove, 2008). We notealso recent MEG data demonstrating that speech entrains the phase of low frequency oscillations inauditory cortex and that edges in the speech envelope enhance this entrainment by resetting thephase (Gross et al., 2013). The degree of similarity of this proposal with BUMP is remarkable in thatthe oscillators analysing the speech input operate over a similar range and are sensitive to localchanges in the phase of the input signal. It suggests that the same processes might be involved in bothperceptual segmentation (in terms of the phase of BUMP oscillators—see Hartley, 2002) and theencoding of serially-ordered representations of speech.
A connection between speech perception, rhythm and language learning through a common BUMP-like mechanism might have wider implications for understanding specific disorders of memory andlanguage. We note for example, that deficits in neural oscillators of the type proposed by Poeppeland colleagues have recently been proposed as an integrative theoretical framework for understanding

164 T. Hartley et al. / Cognitive Psychology 87 (2016) 135–178
speech perception difficulties associated with the developmental disorder of dyslexia (Goswami, 2011;Power, Mead, Barnes, & Goswami, 2012). With this in mind, the BUMP mechanism could offer anexplanatory link between observations of perceptual and timing deficits on the one hand and serialmemory and phonological learning deficits on the other. In this view, some developmental disordersof language learning would be expected to derive from an underlying problem in the processing ofamplitude modulation: for example, individuals with more broadly-tuned oscillators are likely to bemore prone to ordering errors in phonological memory, less sensitive to rhythmic structure and lesswell able to exploit temporal cues to forming new and robust representations of verbal sequences.Our current simulations suggest that the pattern of grouping effects seen in auditory-verbal short-term memory may provide a detailed behavioural signature of the operation of oscillatory coding pro-cesses. Investigation of these phenomena in developmental disorders could provide a useful test ofGoswami’s (2011) proposals and the suggested link between mechanisms of short-term memoryand language development.
4.6. Conclusion
We have shown that temporal grouping effects in auditory-verbal short-term memory are consis-tent with the emergent properties of the BUMP model’s, bottom-up multi-oscillator mechanism thatassociates items with the local changes in the phase and amplitude of the speech signal. We havedescribed how this theoretical account is consistent with, but goes substantially beyond current com-petitive queuing models of short-term memory by providing a plausible account of how the contextsignal in suchmodels is derived from the perceptual input. We tentatively propose BUMP as a plausibleinstantiation of Lashley’s (1951) original speculation that serial behaviour, at least in the domain of lan-guage, is mediated by a rhythmic representational system. Although the BUMPmodel is presently lim-ited to short-term memory for auditory-verbal inputs, the observation of similarities in serial orderphenomena across domains leads us to hypothesize that the multi-oscillator system acts as a commonordering mechanism in vocabulary acquisition, speech perception and speech production.
Acknowledgments
Portions of this work were funded by an Economic and Social Research Council (United Kingdom) 1+3 studentship awarded to Mark Hurlstone, and by a small grant awarded to Graham Hitch, MarkHurlstone, and Tom Hartley by the Department of Psychology at the University of York, United King-dom. We are grateful to Alan Baddeley for useful discussions of ideas presented here, and to the editorand anonymous reviewers for their insightful comments on the original version of the manuscript.
Appendix A. BUMP model: formal description
As described in the body of the text, the BUMP model describes a context signal sensitive to thetiming of items based on the envelope of speech.
A.1. Input signal
Each item is modelled as a triangular pulse in amplitude, with the peak halfway between onset andoffset of the stimulus. Input signals for lists with different grouping structures are modelled by varyingthe item onset times in line with the experimental timings, durations are held constant (0.3 s).
A.2. Context signal
The context signal is based on the activity of a population of cells with n different amplitude mod-ulation (AM) tunings ranging from fb to fbk
n�1:
f j ¼ f bkj�1 ðA:1Þ

T. Hartley et al. / Cognitive Psychology 87 (2016) 135–178 165
for j = 1 to n, where fb is the base frequency (lowest rate to which cells will be tuned) and k is a spacingfactor. These are parameters of the model which are set such that the range of frequencies encom-passes the range of relevant frequencies in the task i.e., fb < 1/(list duration), fbkn�1 P 1/(group/itemduration); k must be greater than 1 and is typically less than 2.
Pairs of cells in the context signal are modelled as complex quadrature filters, with sinusoidallymodulated Gaussian form:
FjðxÞ ¼ kjðcosð2pf jxÞe�ðx2=r2jÞ þ i sinð2pf jxÞe�ðx2=r2
jÞÞ ðA:2Þ
where rj is a constant governing the width of the filter, which is inversely proportional to fj so thatrj = rb/kj�1 where rb is the width of the Gaussian used for the base frequency. This ensures that eachFj encompasses the same number of cycles regardless of its frequency tuning fj. The range �rj to rj
always contains the same number of cycles. The normalising factor kj is inversely proportional tothe absolute area under Fj.
The output of the filter Rj at time t is given by the convolution of Fj with the AM input signal h(t):
RjðtÞ ¼Z
FjðuÞhðt þ uÞdu ðA:3Þ
In practice this is implemented numerically using the conv function in MATLAB and FIR filters for Fjwhere the width of the FIR filter window is 6/fb. R is calculated in time steps of 0.01 s in all oursimulations.
A.3. Memory encoding
Item-context associations (Mij) are stored as values of each of the complex elements of thetime-varying filter output Rj which obtain when a particular item i is being presented. As the itemsare extended in time, it is necessary to use an average value, and this is weighted according to theconcurrent input signal between the onset of the item (onseti) and its offset (offseti):
Mij ¼Poffseti
t¼onsetihðtÞRjðtÞPoffseti
t¼onsetihðtÞ
ðA:4Þ
A.4. Memory retrieval
At retrieval the context signal is replayed, and each item is re-activated according to the similaritysi (based on Euclidean distance, di) between the current state of R and the stored association Mi:
diðtÞ ¼ffiffiffiffiffiffiffiffiffiffiffiffiffiffiffiffiffiffiffiffiffiffiffiffiffiffiffiffiffiffiffiffiffiffiffiffiffiffiffiffiffiffiffiffiffiffiffiffiffiffiffiffiffiffiffiffiffiffiffiffiffiffiffiffiffiffiffiffiffiffiffiffiffiffiffiffiffiffiffiffiffiffiffiffiffiffiffiffiffiffiffiffiffiffiffiffiffiffiffiffiffiffiffiffiffiffiffiffiffiffiffiffiffiffiffiffiffiffiffiffiffiffiffiX
jðrealðRjðtÞÞ � realðMijÞÞ2 þ ðimagðRjðtÞÞ � imagðMijÞÞ2
rðA:5Þ
siðtÞ ¼ minðdÞ � di ðA:6Þ
where min(d) refers to the minimum Euclidean distance over all items.Times corresponding to peaks in similarity are identified, and at each peak the current winner(most active item) is selected for serial output. Activation of each item oi is calculated taking intoaccount the suppression of previously selected items (qi) and noise, where m is a parameter governingnoise variance, t is the current time and ui is the time when the item was previously selected (qi = 0 ifthe item has not been previously selected), d is a parameter governing the exponential decay of sup-pression after selection.
g � Nð0; mÞ ðA:7Þ
qiðt;uiÞ ¼ 0:5ðt�uiÞ=d ðA:8Þ
oiðtÞ ¼ siðtÞ � qiðt;uiÞ þ g ðA:9Þ

166 T. Hartley et al. / Cognitive Psychology 87 (2016) 135–178
The selected item at each peak is recorded and compared with the target item to generate serialposition curves, transposition distances, and item accuracy/error scores for comparison with empiricaldata. Retrieval of each list structure is simulated 100,000 times with the mean proportion of itemsproduced at each serial position calculated for each of the 28 grouping patterns.
Parameters used: filter depth n = 15; filter spacing k = 1.2; base frequency fb = 0.1 Hz; filter widthrb = (1/fb � 0.5) = 5 s.
Appendix B. BUMP model: parameter exploration and fitting
The detailed simulations described in the main body of the paper describe the BUMP model’smechanism and key properties with regard to serial order and temporal grouping. The parametersused in these simulations were selected informally.
In this appendix, we explore the effects of systematically varying the model’s parameters on itsperformance to determine the robustness of its behaviour. In brief, these results indicate that the crit-ical emergent properties we describe in the main body of the paper are indeed characteristic of themodel’s behaviour over a wide range of possible parameter values. Note that our key claims as spelledout in the main article relate to these emergent properties (which we have shown generalize overexperiments and which we predict will generalize to other temporal grouping paradigms), rather thanto the model’s capacity to fit data from a specific study or individual when its parameters are carefullyadjusted.
We first carried out exploratory simulations to identify and explain the limits of each parameter’srange. We then carried out more comprehensive simulations in which we varied the minimum andmaximum frequencies of oscillator tunings systematically to understand the performance of themodel over the full range, and establish that the key characteristics reported in the main body ofthe paper are not restricted to a narrow selection of parameter values, but are emergent propertiesof the BUMP mechanism. Finally, we fit the model parameters to group and individual data fromExperiment 2.
In order to efficiently simulate serial encoding and retrieval while varying model parameters (andespecially in order to allow iterative fitting procedures), some additional simplifications are necessary.In particular, it is not feasible to simulate the full time course of encoding/retrieval at 100 Hz resolu-tion while freely varying parameters governing the oscillator population tunings. Instead we precom-pute the similarity between oscillator states at the moment a given item is encoded and when it isselected for retrieval for particular sets of parameter values forming a coarse grid of plausible tuningparameters. For any given selection of parameters and list structure, this yields a 9 � 9 table of (pre-suppression) item activations (representing the activation of each item at each serial position duringrecall). We then interpolate between these points to rapidly obtain these activations for any set ofparameter values. The interpolated activations make it practical to freely vary the model’s parameters(e.g., when fitting data), while remaining consistent with those derived from the full simulation—wefind that the discrepancy is less than 1% for all values tested (95%CI for interpolation errors is symmet-rical, centred on zero, ±0.0071). These raw activations are then used to simulate retrieval under noiseas in the main body of the paper (see also Appendix A, Eqs. (A.5)–(A.9)).
B.1. Parameters and theoretical constraints
The main parameters that affect the model’s behaviour determine the range and resolution of theoscillator population (‘tuning parameters’). For our exploration of the model’s parameters, it is conve-nient to redescribe the range in terms of its limits: minimum frequency (fmin, corresponding to fb inthe detailed simulations and Appendix A), and maximum frequency fmax (fbkn�1). The spacing of oscil-lator tunings (k) is determined by filter depth (n, the number of oscillators), such that k = (fmax/fmin)(1/(n�1)).
Note that tuning parameters are governed by some theoretical constraints summarized in Fig. B.1.The red dot shows the parameters selected for the detailed simulations in the main body of the paper.

T. Hartley et al. / Cognitive Psychology 87 (2016) 135–178 167
Calculating the state of oscillators requires that amplitude modulations be ‘‘buffered” over a win-dow proportional to 1/fmin. Very low values of fmin thus imply increasingly implausible precision andduration of this AM buffer (green region in Fig. B.1). We therefore limit the lowest value considered to0.05 Hz (requiring buffering of AM cycles of up to 20 s). There is no obvious upper limit to the mini-mum frequency, though the range between maximum and minimum frequencies becomes important– as the range narrows, the multiple oscillators are so closely spaced that they track one another andcan provide little additional structural information (yellow region in Fig. B.1). In practice the highestminimum frequency we have considered is 0.2 Hz corresponding to a cycle of 5 s (i.e., short comparedto the lists used in the current task).
The maximum frequency is also limited on theoretical grounds to the range in which amplitudemodulations could conceivably be useful for serial order in speech. Each syllable is associated withan amplitude peak, and these are emitted at a rate of between around 1.5 and 7 per second in fluentspeech. If the maximum frequency is much lower than 1.5 Hz, oscillator states will no longer be cap-able of encoding the most rapid sequences (red region in Fig. B.1). Rapid amplitude fluctuations (�7–16 Hz) are not relevant to the serial order of items in the current tasks, but they could conceivably berelevant to serial order on a finer scale in other tasks (such as non-word repetition and new wordlearning) to which a general serial ordering mechanism for speech might apply. We therefore considera very broad range of maximum frequencies (up to 32 Hz and as low as possible with a spacing factor,k, between 1.01 and 2.00 at the current filter depth and minimum frequency), however the most plau-sible values are in the range 1.5–16 Hz (higher frequencies are indicated by the blue region in Fig. B.1).
B.2. Measures of fit
For a given parameterization, in order to measure the fit of the model to the data, we consider thenumber (or proportion) of correct responses and transpositions of distance 1-, 2- and 3-items occur-ring at each serial position for each grouping pattern in Experiment 2 (as plotted in e.g., Fig. 10). Thiscan be done at group level (collapsing across all participants who experienced a given grouping pat-tern) or at individual level (in which case only grouping patterns which that participant experiencedare included). We then simulate a large number of retrieval attempts, calculating from the simulationresults the long-run probability of each response type at each serial position for each grouping pattern.
To determine the fit of the simulation results to the data, we can either compare the proportions ofresponses of each type in the simulation directly with the corresponding proportions in the data (usingleast-squares) or estimate the probability of the observed number of responses given the model andcalculate the (negative log-) likelihood of the data given the model. The latter method may have someadvantages in that it can take into account the inherent uncertainty in observations based on smallnumbers, but it requires additional assumptions. We have assumed that the observed error counts fol-low a Poisson distribution. For each response type and grouping condition we calculateK, the expectednumber of observations, as the proportion of simulated responses of this typemultiplied by the numberof opportunities for it to occur in the experiment. If a particular response type is observed k times in theexperiment, the negative log likelihood of the data given the model is �ln(Kk/k!)e�K.
The overall fit of the data to the model is given by the sum of these terms over all serial positionsand grouping conditions. Note that this approach provides one convenient approximation of the prob-ability of a given response in the model for the purposes of fitting its parameters, although alternativeapproaches would be possible and might be more realistic.
The best fitting parameters (for group or individual data) can then be determined using gradientdescent methods to vary the parameters in order to minimize either negative log likelihood of theresponse counts given the model, or sum-squared difference in observed and predicted proportionsof each response type (we use MATLAB’s fminsearch which makes use of the Nelder–Mead simplexalgorithm).
B.3. Effects of varying individual parameters
We began our exploration of the model’s parameter space by systematically varying each of thethree tuning parameters, while fixing the others at plausible values, under different degrees of noise.

rang
e to
o na
rrow
slow
er th
an ty
pica
l spe
ech
rate
implies long duration/high precision buffering
fast
er th
an ty
pica
l spe
ech
rate
fmax Hz
fmin
Hz
0.05
0.06
0.07
0.08
0.10
0.12
0.14
0.17
0.20
0.13 0.25 0.50 1.00 2.00 4.00 8.00 16.00 32.00
Fig. B.1. Schematic diagram of theoretical constraints on tuning parameters in the bump model. The minimum frequency(fmin) is plotted vertically, whereas maximum frequency is plotted horizontally. There are four main constraints that affectdifferent combinations of parameter values, see text for details. The red dot shows the parameters used in the main body of thetext. (For interpretation of the references to colour in this figure legend, the reader is referred to the web version of this article.)
168 T. Hartley et al. / Cognitive Psychology 87 (2016) 135–178
In each case these simulations show that as noise increases, the model’s fit to the data initiallyimproves, as it begins to make errors characteristic of human participants. Eventually as the noiselevel increases further, the model begins to make more arbitrary errors (for example, long range trans-positions) that are atypical of human participants, and the fit to the data worsens. When the tuningparameters are held constant and the noise varied, there is a single global minimum in the fit allowingus to determine the noise level that best fits the data.
B.3.1. Filter depth (n)The essential novelty and explanatory power of the BUMP model comes from its inclusion of mul-
tiple distinct input sensitive oscillators. To capture this, we considered a minimum of 5 spanning therange between fmin and fmax. There seems no sensible upper limit to this parameter, since it is quitepossible that a neural population comprising a very large number of AM-sensitive oscillators with dis-tinct tunings could cover a continuous range of frequencies rather than a small number of discretebands.2
In exploratory simulations (Fig. B.2), in which filter depth was increased from 10 to 25 while hold-ing other parameters constant, we found that the number of filter bands between fmin and fmax hadlittle effect on qualitative properties of the model’s behaviour, and that the main quantitative effectswere a marginal improvement in the fit of the model to the data and greater resilience to noise as thenumber of oscillators increases. This pattern is continued when we consider fewer oscillators (as fewas 5), but here it becomes necessary to choose different minimum and maximum frequencies toensure that oscillator tunings are not too widely or narrowly spaced.
2 There is an interesting comparison with grid cells (Hafting, Fyhn, Molden, Moser, & Moser, 2005) which (in rodents) provide aperiodic population code for an animal’s spatial location based on its movements. The temporal oscillator population proposed inthe BUMP model thus bear some similarity with the spatially tuned oscillators in the grid cell population. Interestingly, the spatialscales to which these cells are tuned are organised into discrete bands (Stensola et al., 2012).

noise level (sd)0 0.02 0.04 0.06 0.08 0.1 0.12 0.14 0.16 0.18 0.2
sum
squ
ared
err
or w
rt da
ta
10
20
30
40
50
60
70filter depth=10filter depth=15filter depth=20filter depth=25
noise level (sd)0 0.02 0.04 0.06 0.08 0.1 0.12 0.14 0.16 0.18 0.2
log
likel
ihoo
d (d
ata|
mod
el) 104
0
2
4
6
8
10
12
fmin=0.10Hz, fmax=4.00
x
Fig. B.2. Effect of varying filter depth (n) on fit to data from Experiment 2. Note that fmin and fmax are fixed at 0.1 Hz and4.0 Hz respectively, so that as filter depth increases oscillators spanning this range are increasingly tightly spaced. A largenumber of retrieval attempts are simulated under varying levels of noise. Upper plot shows the total squared error (discrepancybetween observed and expected response proportions) collapsing over all grouping conditions and serial positions inExperiment 2. The lower plot shows the negative log-likelihood of the data given the model.
T. Hartley et al. / Cognitive Psychology 87 (2016) 135–178 169
If we increase the number of oscillators arbitrarily, the signals from neighbouring bands areincreasingly redundant with one another. Theoretically there may be advantages in limiting thisredundancy. In practical terms, simulations with arbitrarily large numbers of oscillators consumemore time and memory. Because it is an integer parameter, it is not possible to minimize filter depthusing gradient descent as is possible for the other model parameters. For these reasons, we chose afixed value of 15 for the filter depth when characterising the other model parameters and when fittingthem to individual level data.
B.3.2. Minimum frequency of oscillators (fb, fmin)Exploratory simulations (Fig. B.3) showed that the model’s performance is rather insensitive to this
parameter when it is varied in isolation (with fmax fixed at 4 Hz). We obtain somewhat better fits togroup data from Experiment 2 as the minimum frequency decreases (while the other parameters areheld constant), but there is little improvement for fmin < 0.1 Hz.
B.3.3. Maximum frequency (fmax)Exploratory simulations (Fig. B.4) show that the model’s behaviour is fairly sensitive to this param-
eter. We obtain better fits to the group data from Experiment 2, over a wider range of noise parame-ters, where the value of fmax is lower. With increasing maximum frequency the oscillator populationcontains a high proportion of oscillators with tunings to durations similar to item durations. The stateof such oscillators does not distinguish items occurring at different serial positions, meaning that thereis greater scope for arbitrary (potentially long-distance) transpositions between items, which is notcharacteristic of serial recall. As the maximum frequency increases beyond typical speech rates, the

noise level (sd)0 0.02 0.04 0.06 0.08 0.1 0.12 0.14 0.16 0.18 0.2
sum
squ
ared
err
or w
rt da
ta
10
20
30
40
50
60
70
fmin=0.05Hzfmin=0.10Hzfmin=0.15Hzfmin=0.20Hzfmin=0.25Hz
noise level (sd)0 0.02 0.04 0.06 0.08 0.1 0.12 0.14 0.16 0.18 0.2
log
likel
ihoo
d (d
ata|
mod
el)
104
0
2
4
6
8
10
12
fmax=4.00Hz, filter depth=15
x
Fig. B.3. Effect of varying minimum frequency (fmin) on fit to data from Experiment 2. Note that fmax is fixed at 4.0 Hz and thefilter depth (n) is fixed at 15. A large number of retrieval attempts are simulated under varying levels of noise. Upper plot showsthe total squared error (discrepancy between observed and expected response proportions) collapsing over all groupingconditions and serial positions in Experiment 2. The lower plot shows the negative log-likelihood of the data given the model.
170 T. Hartley et al. / Cognitive Psychology 87 (2016) 135–178
model’s performance is dominated by these oscillators: item activations become saturated and theorder of selection becomes arbitrary with a correspondingly higher proportion of long-rangetranspositions.
Overall, the model performs most like human participants in the current task where the range ofoscillator tunings is limited to the range of AM frequencies encountered in the task. However, select-ing parameters in this range would be likely to limit the model’s capacity to generalize to new tasks, asany real serial ordering mechanism must.
Having established reasonable theoretical and empirical limits to the ranges of our key parameters,we then investigated the generality of its key explanatory features over this range.
B.4. Generality of key explanatory features
Figs. B.5 and B.6 show the correlation between observed and predicted proportions of correctresponse in group data from Ryan (1969a, 1969b) and Experiment 2 respectively as the tuning param-eters are varied across the full range of plausible values (noise level has been determined by fittingusing negative log likelihood of the data given the model, the filter depth n is held constant at 15).The model’s predictions are strongly and positively correlated with the experimental results acrossthe full range, except where fmax < �0.25 Hz. The strongest positive correlations are found with lowervalues of fmin < �0.12 Hz especially where 0.25 Hz < fmax < 2 Hz.
The overall fit to the data is summarized in Fig. B.7 (lower values indicate better fits).The red dot shows the parameters used in the detailed simulations described in the main body of
the article. It is clear that the quantitative fit seen in these detailed simulations is not atypical of theperformance of the model across the wider range of tuning parameters considered here; good fits are

noise level (sd)0 0.02 0.04 0.06 0.08 0.1 0.12 0.14 0.16 0.18 0.2
sum
squ
ared
err
or w
rt da
ta
0
20
40
60
80fmax=2.00Hzfmax=4.00Hzfmax=8.00Hzfmax=16.00Hzfmax=32.00Hz
noise level (sd)0 0.02 0.04 0.06 0.08 0.1 0.12 0.14 0.16 0.18 0.2
log
likel
ihoo
d (d
ata|
mod
el) 104
0
2
4
6
8
10
12
fmin=0.10Hz, filter depth=15
X
Fig. B.4. Effect of varying maximum frequency (fmax) on fit to data from Experiment 2. Not that fmin is fixed at 0.1 Hz and thefilter depth (n) is fixed at 15. A large number of retrieval attempts are simulated under varying levels of noise. Upper plot showsthe total squared error (discrepancy between observed and expected response proportions) collapsing over all groupingconditions and serial positions in Experiment 2. The lower plot shows the negative log-likelihood of the data given the model.
fmax Hz 0.13 0.25 0.50 1.00 2.00 4.00 8.00 16.00 32.00
fmin
Hz
0.05
0.06
0.07
0.08
0.10
0.12
0.14
0.17
0.20
-1
-0.8
-0.6
-0.4
-0.2
0
0.2
0.4
0.6
0.8
1
Fig. B.5. Effect of varying tuning parameters (fmin and fmax) on correlation between observed (group data, Ryan, 1969b) andpredicted performance (proportion of correct responses) across different grouping patterns (cf., Fig. 9). The model’sperformance is strongly and positively correlated with the behaviour of human participants across a wide range of plausibleparameterizations.
T. Hartley et al. / Cognitive Psychology 87 (2016) 135–178 171

fmax Hz 0.13 0.25 0.50 1.00 2.00 4.00 8.00 16.00 32.00
fmin
Hz
0.05
0.06
0.07
0.08
0.10
0.12
0.14
0.17
0.20
-1
-0.8
-0.6
-0.4
-0.2
0
0.2
0.4
0.6
0.8
1
Fig. B.6. Effect of varying tuning parameters (fmin and fmax) on correlation between observed (group data, Experiment 2) andpredicted performance (proportion of correct responses) across different grouping patterns (cf., Fig. 9). The model’sperformance is strongly and positively correlated with the behaviour of human participants across a wide range of plausibleparameterizations.
Overall Fit -log likelihood (data|model)
fmax Hz 0.13 0.25 0.50 1.00 2.00 4.00 8.00 16.00 32.00
fmin
Hz
0.05
0.06
0.07
0.08
0.10
0.12
0.14
0.17
0.20
5000
5500
6000
6500
7000
7500
8000
8500
9000
9500
Fig. B.7. Effect of varying tuning parameters (fmin and fmax) on overall fit to the data. The colour of each cell indicates thenegative log-likelihood of observed error counts at each serial position for each grouping condition (group data, Experiment 2)given the model with the specified fmin and fmax parameters. The parameters used in the main body of the text are indicatedby the red dot. (For interpretation of the references to colour in this figure legend, the reader is referred to the web version ofthis article.)
172 T. Hartley et al. / Cognitive Psychology 87 (2016) 135–178
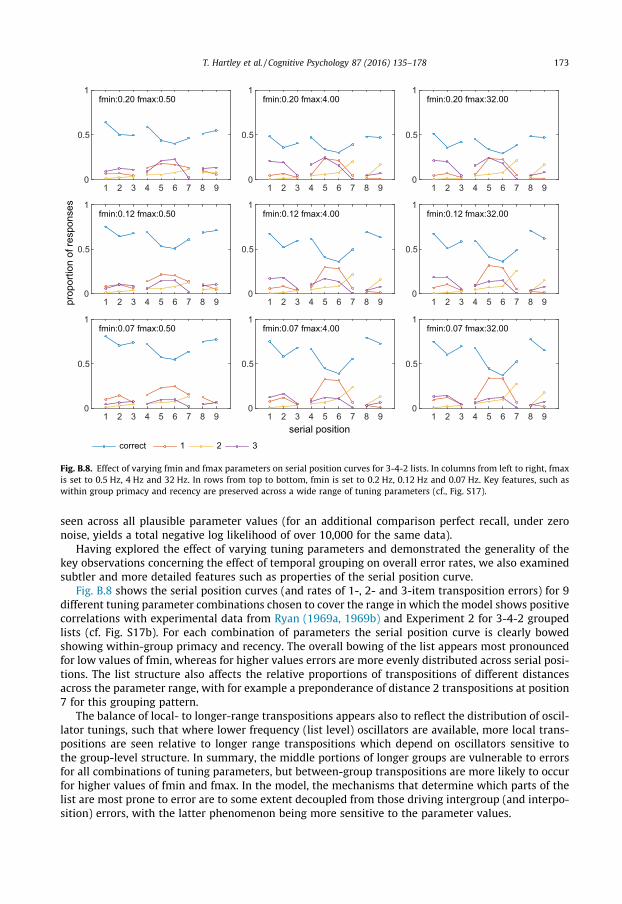
1 2 3 4 5 6 7 8 90
0.5
1fmin:0.07 fmax:0.50
1 2 3 4 5 6 7 8 90
0.5
1fmin:0.07 fmax:4.00
1 2 3 4 5 6 7 8 90
0.5
1fmin:0.07 fmax:32.00
1 2 3 4 5 6 7 8 90
0.5
1fmin:0.12 fmax:0.50
1 2 3 4 5 6 7 8 90
0.5
1fmin:0.12 fmax:4.00
1 2 3 4 5 6 7 8 90
0.5
1fmin:0.12 fmax:32.00
1 2 3 4 5 6 7 8 90
0.5
1fmin:0.20 fmax:0.50
1 2 3 4 5 6 7 8 90
0.5
1fmin:0.20 fmax:4.00
1 2 3 4 5 6 7 8 90
0.5
1fmin:0.20 fmax:32.00
correct 1 2 3
serial position
prop
ortio
n of
resp
onse
s
Fig. B.8. Effect of varying fmin and fmax parameters on serial position curves for 3-4-2 lists. In columns from left to right, fmaxis set to 0.5 Hz, 4 Hz and 32 Hz. In rows from top to bottom, fmin is set to 0.2 Hz, 0.12 Hz and 0.07 Hz. Key features, such aswithin group primacy and recency are preserved across a wide range of tuning parameters (cf., Fig. S17).
T. Hartley et al. / Cognitive Psychology 87 (2016) 135–178 173
seen across all plausible parameter values (for an additional comparison perfect recall, under zeronoise, yields a total negative log likelihood of over 10,000 for the same data).
Having explored the effect of varying tuning parameters and demonstrated the generality of thekey observations concerning the effect of temporal grouping on overall error rates, we also examinedsubtler and more detailed features such as properties of the serial position curve.
Fig. B.8 shows the serial position curves (and rates of 1-, 2- and 3-item transposition errors) for 9different tuning parameter combinations chosen to cover the range in which the model shows positivecorrelations with experimental data from Ryan (1969a, 1969b) and Experiment 2 for 3-4-2 groupedlists (cf. Fig. S17b). For each combination of parameters the serial position curve is clearly bowedshowing within-group primacy and recency. The overall bowing of the list appears most pronouncedfor low values of fmin, whereas for higher values errors are more evenly distributed across serial posi-tions. The list structure also affects the relative proportions of transpositions of different distancesacross the parameter range, with for example a preponderance of distance 2 transpositions at position7 for this grouping pattern.
The balance of local- to longer-range transpositions appears also to reflect the distribution of oscil-lator tunings, such that where lower frequency (list level) oscillators are available, more local trans-positions are seen relative to longer range transpositions which depend on oscillators sensitive tothe group-level structure. In summary, the middle portions of longer groups are vulnerable to errorsfor all combinations of tuning parameters, but between-group transpositions are more likely to occurfor higher values of fmin and fmax. In the model, the mechanisms that determine which parts of thelist are most prone to error are to some extent decoupled from those driving intergroup (and interpo-sition) errors, with the latter phenomenon being more sensitive to the parameter values.

1 2 3 4 5 6 7 8 90
0.5
1fmin:0.07 fmax:0.50
1 2 3 4 5 6 7 8 90
0.5
1fmin:0.07 fmax:4.00
1 2 3 4 5 6 7 8 90
0.5
1fmin:0.07 fmax:32.00
1 2 3 4 5 6 7 8 90
0.5
1fmin:0.12 fmax:0.50
1 2 3 4 5 6 7 8 90
0.5
1fmin:0.12 fmax:4.00
1 2 3 4 5 6 7 8 90
0.5
1fmin:0.12 fmax:32.00
1 2 3 4 5 6 7 8 90
0.5
1fmin:0.20 fmax:0.50
1 2 3 4 5 6 7 8 90
0.5
1fmin:0.20 fmax:4.00
1 2 3 4 5 6 7 8 90
0.5
1fmin:0.20 fmax:32.00
correct 1 2 3
serial position
prop
ortio
n of
resp
onse
s
Fig. B.9. Effect of varying fmin and fmax parameters on serial position curves for 3-3-3 lists. In columns from left to right, fmaxis set to 0.5 Hz, 4 Hz and 32 Hz. In rows from top to bottom, fmin is set to 0.2 Hz, 0.12 Hz and 0.07 Hz. Key features, such as‘scalloping’ within groups and relatively high proportions of interposition errors (transposition distance 3) are preserved acrossa range of parameterizations (cf., Fig. 10, Fig. S16).
174 T. Hartley et al. / Cognitive Psychology 87 (2016) 135–178
Although simulations in the main body of the text did not show prominent ‘‘scalloping” in regularlytimed 3-3-3 lists, this is a fairly common feature across the parameters tested, when (as in this appen-dix) the noise parameter is allowed to vary to best fit the data (as shown in Fig. B.9, cf. Fig. 10d andFig. S16b). Interestingly the ‘‘scalloped” pattern seems to be largely due to the increased prevalenceof short range transpositions at central within-group positions: between-group interposition errorsappear more likely to affect the start or end positions, at least for some tuning parameters.
B.5. Individual participants
The preceding sections demonstrate that key features of grouping data can be accounted for asemergent properties of our bottom-up model that are insensitive to the precise choice of tuningparameters. However, we have until now focused on characteristics of the group data. The modelmight also capture systematic individual differences in performance, in which case a better fit tothe overall dataset might be obtained by treating each participants’ data separately. Further, sincewe have used a between-subject design (Experiment 2), it remains possible that there are differencesin the best fitting parameters that would apply to those in the predictable and unpredictable groupingconditions.
There are some technical difficulties that hamper the fitting of individual data.
(i) As we have seen in the group data, the main features of the model are fairly insensitive to itsparameterization.
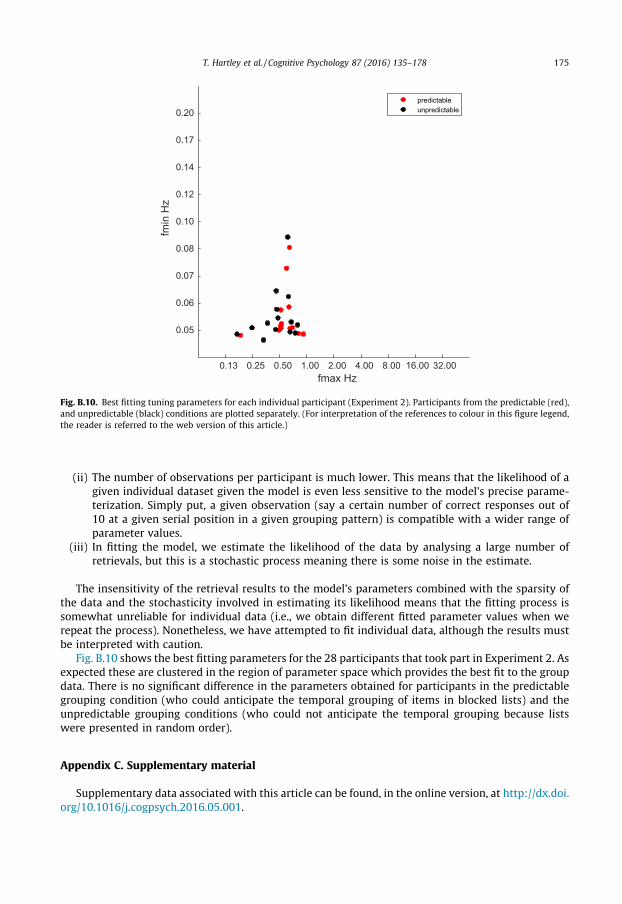
fmax Hz 0.13 0.25 0.50 1.00 2.00 4.00 8.00 16.00 32.00
fmin
Hz
0.05
0.06
0.07
0.08
0.10
0.12
0.14
0.17
0.20predictableunpredictable
Fig. B.10. Best fitting tuning parameters for each individual participant (Experiment 2). Participants from the predictable (red),and unpredictable (black) conditions are plotted separately. (For interpretation of the references to colour in this figure legend,the reader is referred to the web version of this article.)
T. Hartley et al. / Cognitive Psychology 87 (2016) 135–178 175
(ii) The number of observations per participant is much lower. This means that the likelihood of agiven individual dataset given the model is even less sensitive to the model’s precise parame-terization. Simply put, a given observation (say a certain number of correct responses out of10 at a given serial position in a given grouping pattern) is compatible with a wider range ofparameter values.
(iii) In fitting the model, we estimate the likelihood of the data by analysing a large number ofretrievals, but this is a stochastic process meaning there is some noise in the estimate.
The insensitivity of the retrieval results to the model’s parameters combined with the sparsity ofthe data and the stochasticity involved in estimating its likelihood means that the fitting process issomewhat unreliable for individual data (i.e., we obtain different fitted parameter values when werepeat the process). Nonetheless, we have attempted to fit individual data, although the results mustbe interpreted with caution.
Fig. B.10 shows the best fitting parameters for the 28 participants that took part in Experiment 2. Asexpected these are clustered in the region of parameter space which provides the best fit to the groupdata. There is no significant difference in the parameters obtained for participants in the predictablegrouping condition (who could anticipate the temporal grouping of items in blocked lists) and theunpredictable grouping conditions (who could not anticipate the temporal grouping because listswere presented in random order).
Appendix C. Supplementary material
Supplementary data associated with this article can be found, in the online version, at http://dx.doi.org/10.1016/j.cogpsych.2016.05.001.

176 T. Hartley et al. / Cognitive Psychology 87 (2016) 135–178
References
Allen, R., & Hulme, C. (2006). Speech and language processing mechanisms in verbal serial recall. Journal of Memory andLanguage, 55, 64–88.
Baddeley, A. (1986). Working memory.New York: Oxford University Press.Baddeley, A. D. (2007). Working memory, thought and action.Oxford: Oxford University Press.Baddeley, A. D., Gathercole, S. E., & Papagno, C. (1998). The phonological loop as a language learning device. Psychological Review,
105, 158–173.Baddeley, A. D., & Hitch, G. J. (1974). Working memory. In G. A. Bower (Ed.). The psychology of learning and motivation: Advances
in research and theory (Vol. 8, pp. 47–89). New York: Academic Press.Baddeley, A. D., Thomson, N., & Buchanan, M. (1975). Word length and the structure of short-term memory. Journal of Verbal
Learning and Verbal Behavior, 14, 575–589.Botvinick, M., & Plaut, D. C. (2006). Short-term memory for serial order: A recurrent neural network model. Psychological Review,
113, 201–233.Broadbent, D. (1975). The magic number seven after 15 years. In A. Kennedy & A. Wilkes (Eds.), Studies in long term memory
(pp. 3–18). New York: Wiley.Brown, G. D. A., Neath, I., & Chater, N. (2007). A temporal ratio model of memory. Psychological Review, 114, 539–576.Brown, G. D. A., Preece, T., & Hulme, C. (2000). Oscillator-based memory for serial order. Psychological Review, 107, 127–181.Burgess, N., & Hitch, G. J. (1992). Toward a network model of the articulatory loop. Journal of Memory and Language, 31, 429–460.Burgess, N., & Hitch, G. J. (1999). Memory for serial order: A network model of the phonological loop and its timing. Psychological
Review, 106, 551–581.Burgess, N., & Hitch, G. J. (2006). A revised model of short-term memory and long-term learning of verbal sequences. Journal of
Memory and Language, 55, 627–652.Chi, M. T. H. (1976). Short-term memory limitations in children: Capacity or processing deficits? Memory & Cognition, 4,
559–572.Conrad, R. (1964). Acoustic confusion in immediate memory. British Journal of Psychology, 55, 75–84.Dell, G. S., Burger, L. K., & Svec, W. R. (1997). Language production and serial order: A functional analysis and a model.
Psychological Review, 104, 123–147.Farrell, S. (2006). Mixed-list phonological similarity effects in delayed serial recall. Journal of Memory and Language, 55, 587–600.Farrell, S. (2012). Temporal clustering and sequencing in short-term and episodic memory. Psychological Review, 119, 223–271.Farrell, S., Hurlstone, M. J., & Lewandowsky, S. (2013). Sequential dependencies in recall of sequences: Filling in the blanks.
Memory & Cognition, 41, 938–952.Farrell, S., & Lelièvre, A. (2009). End anchoring in short-term order memory. Journal of Memory and Language, 60, 209–227.Farrell, S., & Lewandowsky, S. (2002). An endogenous model of ordering in serial recall. Psychonomic Bulletin & Review, 9, 59–60.Farrell, S., & Lewandowsky, S. (2004). Modelling transposition latencies: Constraints for theories of serial order memory. Journal
of Memory and Language, 51, 115–135.Frankish, C. (1985). Modality-specific grouping effects in short-term memory. Journal of Memory and Language, 24, 200–209.Frankish, C. (1989). Perceptual organization and precategorical acoustic storage. Journal of Experimental Psychology: Learning,
Memory, and Cognition, 15, 469–479.Frankish, C. R. (1995). Intonation and auditory grouping in immediate serial recall. Applied Cognitive Psychology, 9, 5–22.Gathercole, S. E., Willis, C., Emslie, H., & Baddeley, A. D. (1991). The influences of number of syllables and wordlikeness on
children’s repetition of nonwords. Applied Psycholinguistics, 12, 349–367.Goswami, U. (2011). A temporal sampling framework for developmental dyslexia. Trends in Cognitive Sciences, 15, 3–10.Gross, J., Hoogenboom, N., Thut, G., Schyns, P., Panzeri, S., Belin, P., & Garrod, S. (2013). Speech rhythms and multiplexed
oscillatory sensory coding in the human brain. PLoS Biology, 11, 1–14.Grossberg, S. (2003). Resonant neural dynamics of speech perception. Journal of Phonetics, 31, 423–445.Gupta, P., & MacWhinney, B. (1997). Vocabulary acquisition and verbal short-term memory: Computational and neural bases.
Brain and Language, 59, 267–333.Hafting, T., Fyhn, M., Molden, S., Moser, M. B., & Moser, E. I. (2005). Microstructure of a spatial map in the entorhinal cortex.
Nature, 436(7052), 801–806.Hartley, T. (1996). The role of syllable structure in verbal short-term memory (Unpublished Doctoral Thesis). University of London.Hartley, T. (2002). Syllabic phase: A bottom-up representation of the structure of speech. In J. Bullinaria & W. Lowe (Eds.), 7th
Neural computation and psychology workshop. Singapore: World Scientific.Hartley, T., & Houghton, G. (1996). A linguistically constrained model of short-term memory for nonwords. Journal of Memory
and Language, 35, 1–31.Henson, R. N. A. (1996). Short-term memory for serial order (Unpublished Doctoral Thesis). Cambridge, UK: Cambridge
University.Henson, R. N. A. (1998). Short-term memory for serial order. The Start-End Model. Cognitive Psychology, 36, 73–137.Henson, R. N. A. (1999). Positional information in short-termmemory: Relative or absolute?Memory and Cognition, 27, 915–927.Henson, R. N., & Burgess, N. (1997). Representations of serial order. In J. A. Bullinaria, D. W. Glasspool, & G. Houghton (Eds.), 4th
Neural computation and psychology workshop. London: Springer.Henson, R. N. A., Norris, D. G., Page, M. P. A., & Baddeley, A. D. (1996). Unchained memory: Error patterns rule out chaining
models of immediate serial recall. Quarterly Journal of Experimental Psychology, 49A, 80–115.Hitch, G. J., Burgess, N., Towse, J. N., & Culpin, V. (1996). Temporal grouping effects in immediate recall: A working memory
analysis. Quarterly Journal of Experimental Psychology, 49A, 140–158.Houghton, G. (1990). The problem of serial order: A neural network model of sequence learning and recall. In R. Dale, C. Mellish,
& M. Zock (Eds.), Current research in natural language generation (pp. 287–319). London: Academic Press.Howard, M. W., Fotedar, M. S., Datey, A. V., & Hasselmo, M. E. (2005). The temporal context model in spatial navigation and
relational learning: Toward a common explanation of medial temporal lobe function across domains. Psychological Review,112, 75–116.

T. Hartley et al. / Cognitive Psychology 87 (2016) 135–178 177
Howard, M. W., & Kahana, M. J. (2002). A distributed representation of temporal context. Journal of Mathematical Psychology, 46,269–299.
Hulme, C., Maughan, S., & Brown, G. D. A. (1991). Memory for familiar and unfamiliar words: Evidence for a long-term-memorycontribution to short-term-memory span. Journal of Memory and Language, 30, 685–701.
Hurlstone, M., & Hitch, G. J. (2015). How is the serial order of a spatial sequence represented? Insights from transpositionlatencies. Journal of Experimental Psychology: Learning, Memory, and Cognition, 41, 295–324.
Hurlstone, M., Hitch, G. J., & Baddeley, A. (2014). Memory for serial order across domains: An overview of the literature anddirections for future research. Psychological Bulletin, 140, 339–373.
Jones, D. M., Hughes, R. W., & Macken, W. J. (2007). The phonological store abandoned. Quarterly Journal of ExperimentalPsychology, 60, 505–511.
Jones, D. M., & Macken, W. J. (1993). Irrelevant tones produce an irrelevant speech effect: Implications for phonological codingin short-term memory. Journal of Experimental Psychology: Learning, Memory, and Cognition, 19, 369–381.
Lashley, K. S. (1951). The problem of serial order in behavior. In L. A. Jeffress (Ed.), Cerebral mechanisms in behavior: The Hixonsymposium. New York: John Wiley.
Lewandowsky, S., & Brown, G. D. A. (2005). Serial recall and presentation schedule: A micro-analysis of local distinctiveness.Memory, 13, 283–292.
Lewandowsky, S., Brown, G. D. A., Wright, T., & Nimmo, L. M. (2006). Timeless memory: Evidence against temporaldistinctiveness models of short-term memory for serial order. Journal of Memory and Language, 54, 20–38.
Lewandowsky, S., & Farrell, S. (2008). Short-term memory: New data and a model. The psychology of learning and motivation, 49,1–48.
Lewandowsky, S., & Murdock, B. B. (1989). Memory for serial order. Psychological Review, 96, 25–57.Luo, H., & Poeppel, D. (2007). Phase patterns of neuronal responses reliably discriminate speech in human auditory cortex.
Neuron, 54, 1001–1010.MacKay, D. G. (1970). Spoonerisms: The structure of errors in the serial order of speech. Neuropsychologia, 8, 323–350.Madigan, S. A. (1980). The serial position curve in immediate serial recall. Bulletin of the Psychonomic Society, 15, 335–338.Martin, R., & Saffran, E. M. (1997). Language and auditory-verbal short-term memory impairments: Evidence for a common
system. Cognitive Neuropsychology, 14, 641–682.Maybery, M., Parmentier, F. B. R., & Jones, D. M. (2002). Grouping of list items reflected in the timing of recall: Implications for
models of serial verbal memory. Journal of Memory and Language, 47, 360–385.McNicol, D., & Heathcote, A. (1986). Representation of order information: An analysis of grouping effects in short-term memory.
Journal of Experimental Psychology: General, 115, 76–95.Miller, G. A. (1956). The magical number 7, plus or minus 2: Some limits on our capacity for processing information.
Psychological Review, 63, 81–97.Monsell, S. (1987). On the relation between lexical input and output pathways for speech. In A. Allport, D. G. MacKay, W. Prinz,
& E. Scheerer (Eds.), Language perception and production: Relationships between listening, speaking, reading and writing(pp. 273–311). London: Academic Press.
Morin, C., Brown, G. D. A., & Lewandowsky, S. (2010). Temporal isolation effects in recognition and serial recall. Memory &Cognition, 38, 849–859.
Murdock, B. B. (1995). Developing TODAM: Three models for serial order information. Memory & Cognition, 23, 631–645.Murray, D. J. (1967). The role of speech responses in short-term memory. Canadian Journal of Psychology, 21, 263–276.Ng, L. H. (1996). Are time-dependent oscillators responsible for temporal grouping effects in short-term memory? (Unpublished
honours thesis). Nedlands, Western Australia, Australia: University of Western Australia.Ng, L. H., & Maybery, M. T. (2002). Grouping in verbal short-term memory: Is position coded temporally? Quarterly Journal of
Experimental Psychology: Human Experimental Psychology, 55A, 391–424.Ng, L. H., & Maybery, M. T. (2005). Grouping in short-term memory: Do oscillators code the positions of items? Journal of
Experimental Psychology: Learning, Memory, and Cognition, 31, 175–181.Nimmo, L. M., & Lewandowsky, S. (2005). From brief gaps to very long pauses: Temporal isolation does not benefit serial recall.
Psychonomic Bulletin & Review, 12, 999–1004.Nimmo, L. M., & Lewandowsky, S. (2006). Distinctiveness revisited: Unpredictable temporal isolation does not benefit short-
term serial recall of heard or seen events. Memory & Cognition, 34, 1368–1375.Page, M. P. A., Madge, A., Cumming, N., & Norris, D. G. (2007). Speech errors and the phonological similarity effect in short-term
memory: Evidence suggesting a common locus. Journal of Memory and Language, 5, 49–64.Page, M. P. A., & Norris, D. (1998). The primacy model: A new model of immediate serial recall. Psychological Review, 105,
761–781.Page, M. P. A., & Norris, D. (2009). A model linking immediate serial recall, the Hebb repetition effect and the learning of
phonological word forms. Philosophical Transactions of the Royal Society B, 364, 3737–3753.Parmentier, F. B. R., King, S., & Dennis, I. (2006). Local temporal distinctiveness does not benefit auditory verbal and spatial serial
recall. Psychonomic Bulletin & Review, 13, 458–465.Parmentier, F. B. R., & Maybery, M. T. (2008). Equivalent effects of grouping by time, voice and location on response timing in
verbal serial memory. Journal of Experimental Psychology: Learning, Memory, and Cognition, 34, 1349–1355.Poeppel, D., Idsardi, W. J., & van Wasssenhove, V. (2008). Speech perception at the interface of neurobiology and linguistics.
Philosophical Transactions of the Royal Society B, 363, 1071–1086.Power, A. J., Mead, N., Barnes, L., & Goswami, U. (2012). Neural entrainment to rhythmically presented auditory, visual, and
audio-visual speech in children. Frontiers in Psychology, 3, 216.Ryan, J. (1969a). Grouping and short-term memory: Different means and pattern of grouping. Quarterly Journal of Experimental
Psychology, 21, 137–147.Ryan, J. (1969b). Temporal grouping, rehearsal and short-term memory. Quarterly Journal of Experimental Psychology, 21,
148–155.Salamé & Baddeley, A. D. (1982). Disruption of short-term memory by unattended speech: Implications for the structure of
working memory. Journal of Verbal Learning and Verbal Behavior, 21, 150–164.

178 T. Hartley et al. / Cognitive Psychology 87 (2016) 135–178
Sederberg, P. B., Howard, M. W., & Kahana, M. J. (2008). A context-based theory of recency and contiguity in free recall.Psychological Review, 115, 893–912.
Stensola, H., Stensola, T., Solstad, T., Frøland, K., Moser, M. B., & Moser, E. I. (2012). The entorhinal grid map is discretized. Nature,492(7427), 72–78.
Treiman, R., & Danis, C. (1988). Short-term memory errors for spoken syllables are affected by the linguistic structure of thesyllables. Journal of Experimental Psychology: Learning, Memory, and Cognition, 14, 145–152.
Vousden, J. I., Brown, G. D. A., & Harley, T. A. (2000). Serial control of phonology in speech production: A hierarchical model.Cognitive Psychology, 41.
Wickelgren, W. A. (1964). Size of rehearsal group and short-term memory. Journal of Experimental Psychology, 68, 413–419.Wickelgren, W. A. (1967). Rehearsal grouping and hierarchical organisation of serial position cues in short-term memory.
Quarterly Journal of Experimental Psychology, 19, 97–102.