Embed Size (px)
Citation preview
Report of Investigations 8896
Effects of Repeated Blasting on a Wood-Frame House
By Mark S. Stagg, David E. Siskind, Michael G. Stevens, and Charles H. Dowding
,'" .,., -~ 0 • '• ' •
- .. ·- ,,
US Department of Interior Office of Surface Mining Reclamation and Enforcement
UNITED STATES DEPARTMENT OF THE INTERIOR
William P. Clark. Secretary
BUREAU OF MINES Robert C. Horton, Director
Kenneth K. Eltschlager Mining/Blasting Engineer
3 Parkway Center Pittsburgh, PA 15220
Phone 412.937.2169 Fax 412.937.3012 [email protected]
Library of Congress Calalogmg in Publication Data:
Effects of repeated blasting on a wood·frame nouse.
(Report of investigations ; 8896)
Biblio8raphy: p. 55·59.
Supt. of Docs, no.: I 28.B:8896.
1. Earth movements aP.d building. 2. Blast effect. 3. Structural dynamics, I. Stagg, MarkS. II. Series: Report of investigations (United States. Bureau of Mines) ; 8896.
TN23.U43 [TH 1094] 622s [690'.21] 84-7651

CONTENTS
Abstract • ....•....•.•.•..•.•....••••.••.•.....••........••.•. • • • • • • • • • • • • • • Introduction ••••.••••.••••••••• . . . . . . . . . . . . . . . . . . . . . . . . . . . . . . . . . . . . . . . . . . . . Background . ..••...•..•.••.•.•....•.••.....••.•..••••.. • • • • .. • • • • • • · • • • • • • • • • • • •
Origins of cracks . .•...•........•........•....•..•.........•..•........ •. • • • • Rates of crack occurrences in residential structures •••••••••••••••••••••••••
Acknowledgments . ••.•.•.•.••.•..•.•...••.•..•...•..•.••..••.••. • . • • . • • • • • • • • • • • • Experimental procedure • ••••..•••••.••••.•..•••••.••.•••.••••.•.•.••.•..•..••..•
Design and construction of test house•••••••••••••••••••••••••••••••••••••••• Monitoring program ••. .•.••..•..•.•.••.•.•..•..•.•...••.•••..•••.•..•..•...•..
Low-level blasting tests . ...........•..........••........•.........•....•.. High-level blasting tests •••.•••••••••••••••••••••••••••••••••••••••••••• •. Mechanical vibration tests••••••••••••••••••••••••••••••••••••••••••••••••• Laboratory failure tests on wallboard and maeonry walls ••••••••••••••••••••
Instrumentation and measurement~ at test house .•••••••••••••••••••••••••••••• Ground ·;i' . . . . . . . . . Wearh~r envi~onment. . . . . . . . . . . . . . . . . . . . . Household activities ••••••••••••••••••••• Structure vibration response •••••••••••••
................................. ~ ................... . . . . . . . . . . . . . . . . . . . . . . . . . . . . . . . . . . . . . . . . . . . . . . . . . . . . . . . . . . . . . . . . . . . . .
Set t 1 eme n t .•.••.•..•..........•..•.•.•..•.••...•.•..•..•.•• • .•.. • • • • • • • • • • • Static strain and deformation ••••••••••••••••.••••••••••••••••••••••••••••• Dynamic strain ••••••••••••••••••••••••••••.••.••••••••••••••••••••••••••••• Visual inspection ••••••••••• ~···•••••••••••••••••••••••••••••••••••••••••••
Results ••••••••••••••••••••••••••••••••••••••••••••••• • • • • • • • • • • • • • • • • • • • • • • • • • Structure response to natural phenomena •••.••••••••••••••••••••••••••••••••••
Response to daily environmental changes •••••••••••••••••••••••••••••••••••• Response to monthly environmental changes •••••••••••••••••••••••••••••••••• Response to household activities •••••••••••••••••••••••••••••••••••••••••••
Structure response to blast vibrations••••••••••••••••••••••••••••••••••••••• Shaker-induced response•••••••••••••••••••••••••••••••••••••••••••••••••••••• Cracking observed in test house••••••••••••••••••••••••••••••••••••••••••••••
Blast-induced cracking••••••••••••••••••••••••••••••••••••••••••••••••••••• Shaker-induced cracking•••••••••••••••••••••••••••••••••••••••••••••••••••• Long term cracking observations••••••••••••••••••••••••••••••••••••••••••••
Summary and conclusions •••••••••••••••••••••••••••••••••••••••••••••••••••••••• References • ••••••••••••••••••••••••••••••••••••••••••••••••••••••••••••••• • • • • • Appendix A.--Failure of wallboard and masonry walls •••••••••••••••••••••••••••• Appendix B.--Design details of test house••••••••••••••••••••••••••••••••••••••
1. 2. 3. 4.
s. 6. 7. 8. 9.
10. 11.
ILLUSTRATIONS
Tensile stress strain-deformation curve for 1/2-in-thick wallboard •••••••• Strain gauge locations in sonic boom study (3), house 1 ••••••••••••••••••• Building age versus crack occurrences ••••••• ~••••••••••••••••••••••••••••• Weekly comparison of crack occurrences to sonic boom amplitudes of 134 dB
and to relative humiditY•••••••••••••••••••••••••••••••••••••••••••4••••• Test house and shot locations ••••••••••••••••••••••••••••••••••••••••••••• Front view of test house•••••••••••••••••••••••••••••••••••••••••••••••••• House relationship to pit (south view) •••••••••••••••••••••••••••••••••••• House relationship to pit (north view)•••••••••••••••••••••••••••••••••••• Roof joist preparation for mechanical shaker installation ••••••••••••••••• Installed south-end shaker•••••••••••••••••••••••••••••••••••••••••••••••• North-end shaker support••••••••••••••••••••••••••••••••••••••••-••••••••••
1 2 2 3 5 9
10 10 12 12 14 14 15 18 20 20 20 22 22 23 23 27 28 28 30 32 34 34 40 47 48 49 so 54 55 60 77
4 6 7
8 11 12 13 14 16 16 17

ii
12. 13. 14. 15.
ILLUSTRATIONS--Continued
Ceiling joists being bolted to wall studs •••••••••••••••••••••••.••..•.. Accelerometer and strain system measurement locations on main floor ••••• Accelerometer and strain system neasurement locations in basement ••••••• Semimonthly strain, temperature, and humidity measurement locations, and
Page ------=-
17 18 20
survey p0ints on main floor............................................ 21 16. Semimonthly strain, measurement locations, and survey points in
17. 18. 19. 20. 21. 22. 23. 24. 25. 2o. 27.
28.
29. 30. 31.
32. 33. 34. 35. 36. 37. 38. 39.
40. A-1. A-2. A-3. A-4. A-5.
A-6.
A-7. A-8.
A-9. A-10. A-ll. A-12. A-13.
basement .•...• ....•.....•.•.•...•....•..•..•..•.••. $' •••••••••••••••••••
Extensometer .•••••.•...•..•.•........•.•••....••.•.••..•..••..•.••...... Groove compari tor . ...••..••..•...•.•.•...•....•.....••.••.•...••.•.•.... Kaman displacement syste@ (top) and 124-mm strain gauge ••••••••••••••••• L VDT • •••••••••••••••••• , •••••••••••••••••••••••••••••••••••••••••••••••• Stratn-leaf measurement system •..••••.•••.•••••.•••••.•••••••.••..•••.•. Measurement systems in master bedroo~ ••••••••••••••••••••••••••••.•••••• Strain and environmental factors versus time, site K1••••••••••••••••••• Strain and environmental factors versus time, site K2••••••••••••••••••• Strain versus maximum ground vi b1·ati"' leve 1 site K2 ••••••••••••••••••• Strain versus maximum ground v_Jra~ ,l level, site S1••••••••••••••••••• Typical ground vibration and structure response waveforms for shot 34 with corresponding spectra ••••••••.•.•••••••••••••••••••••••••••••••••.
Typical ground vibration and structure response waveforms for shot 123 with corresponding spectra •.••••.•••••.••••••••••••••••••••••••••••••••
Low- and high-corner responses versus maximum ground vibration •••••••••• Corner and midwall amplification factors •••••••••••••••••••••••••••••••• Wallboard strain versus airblast level at test house, with comparison to sonic boom response •••••••••••.••••••••••••••••••••••••••••••••••••••••
Shear and flexure response of walls ••••••••••••••••••••••••••••••••••••• Wallboard and plaster strain versus maximum ground vibration •••••••••••• Wallboard tape joint strain vers~s maximum ground vibration ••••••••••••• Block joint strain versus maxik~.u ground vibration, ••••••••••••••••••••• Brick veneer joint strain versus maximum ground vibration ••••••••••••••• Fireplace brick strain versus maximum ground vibration •••••••••••••••••• Resonance frequencies versus applied dynamic force during shaker tests •• Number of cracks and blasts >0.50 in/s and >1.0 in/s versus inspection
period . ••.•.••..•.••..••.••.••.•.•...•••••.••••.•••.••••.••••••.••.•.•. Histogram of peak ground vibration levels recorded at test house •••••••• Instron TM 100-kg universal testing machine ••••••••••••••••••••••••••••• MTS 250-kip electro-hydraulic loading frame ••••••••••••••••••••••••••••• Wallboard test specimen and strain instrumentation •••••••••••••••••••••• Details of post·-mounted strain system ••••••••••••••••••••••••••••••••••• Effect of paper orientation on tensile failure curves for 1/2-in-thick
22 25 25 26 26 27 28 29 30 31 36
37
38 39 39
• 1
4? 43 44 45 46 47 48
52 52 62 62 63 64
wall board. . . . . . . . . . . . . . . • • . . . . . . . . . . • . . . . . . . • . . . • . . • . • . . • . . • . . . • . • . . . . . 64 Comparison of tensile failure displacement data for 1/2-in-thick
wallboard • ..•.•••••.•...•.•............•.•..•..•....•...•.•.•.•..•..•.. Wallboard specimen and strain systems tested under load control ••••••••• Stress level versus number of cycles to failure for 1/4-in-thick hard-board in tension •••••••••••••••••••••••••••••••••••••••••••••••••••••••
Stress level versus time to failure for 1/4-in-thick hardboard •••••••••• Response of wallboard during a period of nonblasti'"lg •••••••••••••••••••• In-place 5- hy 5-ft masonry block wall •••••••••••••••••••••••••••••••••• In-place angle wall . •.....•.....•...•.......................•........... Typical LVDT global displacement and strain gauge locations with pretest
67 68
68 69 71 71 72
crack observations..................................................... 73
A-14. A-15. B-1. B-2. B-3. B-4. B-5. B-6. B-7.
ILLUSTRATIONS--Continued
Loading orientations of angle wall •••••••••••••••••••••••••••••••••••••• Response of concrete block crack widths to environmental factors •••••••• North and west side elevation views ••••••••••••••••••••••••••••••••••••• South and east side elevation views ••••••••••••••••••••••••••••••••••••• Main floor plan ...•....•...•......•.....•..................•..•.....•.•. Basement floor plan .......•....•......•.•......•.•........•......•.•••.• Design details ...................................•...................... Roof framing after modifications ••••.•••.•.••.•••••••••.••.•• ~···••••••• Structural modifications of main floor and basement to accept shakers •••
TAEl..ES
iii
74 75 77 78 79 79 80 81 82
1. Maximum strains in wallboard from blasting, household activities, and
~.
3. 4.
5. 6.
7.
8.
9. 10. 11. 12. 13. 14.
A-1. A-2. A-3. A-4.
A-5. A-6. A-7. A-8.
environmental factors ••...•............•..•.....•..•..•.••••.•.•.•••... Crack rates for houses subjected to scnic booms ••••••••••••••••••••••••• ·1eclLanical shaker and drivP. system ~ '-- atiorth ••••••••••••••••••••••• Field measurement program for assessing strains and cracking from blast-ing, household activities, and environmental factors •••••••••••••••••••
Dynamic strain measurement systems •••••••••••••••••••••••••••••••••••••• Comparison of strain levels induced by daily environmental changes, household activities, and blasting •••••••••••••••••••••••••••••••••••••
Coefficients and statistics for strain induced by relative humidity,
7 9
15
19 24
29
temperature, and wind.................................................. 31 Predicted increase in strains at sites K1 and K2 (fig. 13) from maximum observed changes in relative humidity, temperature, and wind •••••••••••
Human activities and equivalent ground vibration levels ••••••••••••••••• Mechanical shaker program description ••••••••••••••••••••••••••••••••••• Cracks observed after blasting ........ q•••••••••••••••••••••••••••••••••
Cracks observed after shaker excitati~n••••••••••••••••••••••••••••••••• Cracks observed during semimonthly insper'- 1 0~s ••••••••••••••••••••••••••
Crack rate versus blast vibration level ••••••••••••••••••••••••••••••••• Failure characteristics of plasteL, wallboard, and hardboard •••••••••••• Effect of gauge length on wallboard strain measurement •••••••••••••••••• Results of laboratory tensile failure tests on 1/2-in-thick wallboard ••• Comparison of strain readings from wallboard test specimen and from
32 35 42 49 50 51 54 61 62 65
loading frame.......................................................... 65 Results Results Failure Masonry
of tensile failure tests on wallboard paper..................... 65 of cyclic load tests on 1/2-in-thick wallboard.................. 66 characteristics of block and brick walls........................ 70 wall test parameters............................................ 75

dB
ft
ft/lbl/2
ft/s 2
G
h
Hz
hp
in
in/min
in/s
lb
lbf
lbf/ft 2
lbf/in2
lbf/in
UNIT OF MEASURE ABBREVIATIONS USED IN THIS REPORT
degree Celsius
decibel
degree Fahrenheit
foot
square foot
foot per square-root pound (scaled distance)
foot per square second
gravity (32.2 ft/s2)
hour
hertz
horsepower
inch
inch per minute
inch per second
pound
pound (force)
pound (force) per square foot
pound (force) per square inch
pound (force) per inch
kg kilogram
kgf•m kilogram (force) meter
kHz kilohertz
kW kilowatt
m meter
mi mile
mi/h mile per hour
min
11in/in
mm/°C
mm/s
N
pet
s
v
V/mm
yr
minute
millimeter
millimeter per degree Celsius
millimeter per second
Newton
Newton per square millimeter
percent
second
volt
volt per millimeter
year
EFFECTS OF REPEATED BLAST lNG ON A WOOD-FRAME HOUSE
By Mark S. Stagg, 1 David E. Siskind, 2 Michael G. Stevens, 3
and Charles H. Dowding 4
ABSTRACT A..i-L"'>'H.,~£
The Bureau-of Mines arranged to have a wood-frame test house built in the path of an advancing surface c.oal mine so it could investigate the effects of repeated blasting on a residential house. Structural fatigue and damage were assessed over a 2-yr period. The house was subjected to vibrations from 587 production blasts with parti~le velocities that varied from 0.10 to 6.94 in/s. Later, the entire house was shaken mechanically to produce fatigue cracking. Failure strain characteristics of construction materials were evaluated as a basis for comparing strains induced by blasting and shaker loading to those induced by weather and household activities.
Cosmetic or hairline cracks 0.01 tc 0.10 mm wide occurred during construction of the house and also during periods when no blasts were detonated. The formation of cosmetic cracks increased from 0.3 to 1.0 cracks per week when ground motions exceeded 1.0 in/s. Human activity and changes in temperature and humidity caused strains in walls that were equivalent to those produced by ground motions up to 1.2 in/s. When the entire structure was mechanically shaken, the first crack appeared after 56,000 cycles, the equivalent of 28 yr of shaking by blast-generated ground motions ,f 0.5 in/s twice a day.
1civil engineer, Twin Cities Research Center, Bureau of Mines, Minneapolis, MN. 2supervisory geophysicist, Twin Cities Research Center. 3Mining engineer, Twin Cities Research Center (now with Bureau of Land Reclamation,
u.s. Department of the Interior, Denver, CO). 4Associate professor of civil engineering, Northwestern University, Evanston, IL.
2
INTRODUCTION
Ground vibrations fro~ surface mine blasting can be a serious problem for the mining industry, governmental agencies responsible for regulating their adverse environmental effects, and the public which is subjected to them. The Bureau of Mines re~ently completed two major studies which determined the ground vibration and airblast levels that correspond to structural vibration response and cracking of interior walls (1-2).5 These studies established levels forboth airblast and ground vibrations above which the probability of blast-produced damage increases-. They included a study of 58 residences and 9 other related blasting studies. They were, by design, short term stu<:'~~~ .,... -~, -.ti.ely high vibration values.
The cracks observed in these previous studies were primarily extensions or inceptions of cosmetic cracks (0.01 to 0.1 mm wide) in older plaster·walls. However, the initial building distortion and preexisting wall strains were unknown, and little could be learned about fatigue effects from repeated blasts. In addition, these studies demonstrated that even when a peak vibration criterion is not exceeded, complaints are still possible and often are accompanied by claims of damage attributed to fatigue.
Several authors have postulated that repeated low-level vibrations accelerate the normal cracking process caused by environmental factors such as age, settlement, wind, temperature, humidity, and human activities (3-6). Research results on fatigue and failure of materials used
in residential construction have been limited and inconsistent (2, 4-10). They do, however, suggest that fatigue effects are possible both from vibrations and natural causes (7-10 •
To assess (1) the fatigue behavior of structural materials when repeatedly loaded by blast-induced vibrations and (2) the role of naturally occurring stresses, the Bureau conducted a long term field and laboratory study. Researchers studied the vibration and strain response of a typical contractorbuilt home in the path of an advancing surface coal mine over a 2-yr period. Upon completion of the blasting tests, mechanical shakers were used to simulate an incre~~P in the total number of load cycles well beyond that expected from natural stress-inducing phenomena and blasting to ensure a complete fatigue assessment.
Bureau researchers also conducted a parallel laboratory program to obtain ryasic failure properties of wallboard and masonry walls. The failure characteristics of wallboard in shear, tension, and bending and of waflboard paper in tension were evaluated. These analyses provided the basis for using strain readings to asse_3 the relative impact of blastinduced stresses to those of human activities and naturally occurring stresses. Through a Bureau contract, the National Bureau of Standards (NBS) performed similar property tests on masonry block walls (11). This report describes both the field and laboratory studies and presents the findings from both.
BACKGROUND
Cracking in structures from repeated blasting vibrations involves many aspects that have been previously studied, such as criteria and construction details to prevent cracking; causes of cracking,
Sunderlined numbers in parentheses refer to items in the list of references preceding the appendixes.
including effects of construction, material condition, and building environment and age; and the rate of new cracks from ambient causes. Since cracks are generally unexpected and their acceptance varies with width, location, and extent, the role of human perception has also been investigated.

ORIGINS OF CRACKS
Current house-building practices address basic human safety. Many of these practices were derived from allowable deflection criteria in which material cracking potential is considered (12-14). In 1948, Whittemore (15) discussedthe problem of the lack oy- guidelines for vibrations of floors and pointed out that "deflection and vibration can be decreased, but only at an increase in price." Crist (16) echoed Whittemore's conclusion in proposing a static criterion based on the risk of cosmetic cracking. He dev~loped a model performance criterion for floors in line with human acceptability (with respect to vibrations) according to the Internation-31 S~andards Organization's (ISO) proposed standard, which has since been updated (17). More recently, weighting factors 1have been developed for curves from the ISO standard to include effects of the impulsive shock (blast) as perceived in buildings (~).
The detection of cracking is dependent on the type of material covering the walls as well as environmental loads (including vibration). Consequently, it is important to know how the mechanical strength properties of wall coverings influence cracking characteristics. All structures, including residential buildings, are subjected to a variety of stresses which are continually changing. Examples are shrinkage during material curing, annual and daily humidity and temperature expansion and contraction, and frost- and water-induced soil settlement and heave. Deformations also result from human activities (such as jumping, door closings, and walking) and wind gusts; or they may be attributable to vibro-acoustic sources such as blasting, vehicle traffic, aircraft, and internal machinery.
Masonry load are
walls and wallboard usually assessed linearly
under by a
3
proportional dimension change (strain)6 until plastic deformation or creep occurs; i.e., the strain increases rapidly, and ultimately the load-carrying capacity or the stress drops to zero. Because most materials tests involve strain measurements, values of strain are typically used to classify materials deformation tolerances, i.e., linear response range. The nonlinear strain response point or initial yield is easily monitored by strain detection systems. Observations of material cracks occur at strain readings beyond the initial yield point primarily due to eye resolution limitations.
The Bureau's laboratory analyses of wallboard and masonry walls, which are detailed in appendix A, showed the fc-'low~- .:_·
For wallboard--
• The gypsum core fails at ~ 350 ~in/ in in tension and at ~ 1,000 ~in/in in bending, based on the nonlinear response points.
• For visual cracking, paper failure if the controlling factor. Its nonlinear response point occurs at ~ 1,000 to 1,200 ~in/in (fig. 1). However, visual observation of buckling or cracking is not possible until a slightly higher strain level is reached.
• Strain rate seems to affect ultimate or total failure, but the paper yield point is relatively constant. This allows comparison of various loading factors (e.g., blasting versus other activities and environmental factors).
6Axial strain is defined as ~1/t, where ~1 is the deformation and 1 is the original length. Axial stress, o, can be related to strain, E, by Young's modulus (E): 0 = EE.

4
(\J
s ' -..0
0 <t 0 ...J
125
100
75
50
25
Visual paper failure
Total failure
0 200 400 600 800 1,000 1,2 00 1,400 1,600 1,800 2,000 2,200 2,400 2,600 2,800
STRAIN, f-Lin/in
FIGURE 1. • Tensile stress strain-deformation curve for 1/2-in·thick wallboard.
• Once the wallboard cracked, cyclic opening and closing of up to 0.1 mm was observed, and these movements were unaffected by blasting activities.
• Data on cyclic loading behavior of wallboard are limited, but results of tests on wood products indicate that fatigue effects can occur at stress (or strain) levels equivalent to 50 pet of static failure condi-tions, but over 100,000 cycles are required.
For masonry walls--
• Hairline cracks occur primarily at the mortar-and-block interface.
• Observations of tensile cracks at a strain-monitored site showed that such cracks are first detected at strain levels well above the first nonlinear response point because of naked eye limitations (~ 0.01 to 0.1 mm).
• Use of strain gauge readings to describe crack growth to visual widths and beyond can be misleading since the measured strain is dependent on the strain gauge length. For example, strains read at the threshold of visual cracking using different gauge lengths give a different overall strain reading, as illustrated below.
Based on the equation M.
€: ==R. ,
bu ...
0.01 mm 13 mm
0.01 mm 150 mm
770 llin/in,
= 67.0 llin/in,
where R. is the gauge length, and the visible crack width is 0.01 mm. Be-cause strain gauge readings can be misleading, crack growth is properly described in terms of displacements.
• Local site strains across the wall vary considerably from global strains. For inplane shear failure, global strain is measured or calculated across the wall diagonally.
• Two cases of cracking due to inplane shear testing were observed:
1. Limited site-specific cracks that can occur at low global strains. These cracks opened and closed up to the point of maximum load and were difficult to distinguish from existing mortar-block separations caused by workmanship and shrinkage.
2. Cracks that propagated across the wall prior to ultimate failure in a steplike pattern along mortar-block interfaces. The global strain approach appears reasonable for failure assessment, but inplane shear failure was shown to be unlikely for homes because of the high compressive loads required.

Cosmetic cracks result when the blasting vibration-induced strain, Ed, added to some preexisting strain, EP' exceeds the critical strain, Ec• Various criteria such as peak particle velocity, vector sum velocity, pseudo spectral response velocity, displacement, and integrated energy have been suggested for predicting or estimating the potential for blast-induced cracking in structures. However, these criteria provide only an index of blast-induced strains {Ed). They cannot be related uniformly to the critical wall strain necessary for development or propagation of existing cracks because they do not explicitly consider existing strains (and the corresponding fatigue strength reduction). Monitoring strain, which directly represents material defc~tion and thus cracking potential, avoids these problems. However, identifying critical measuring locations and their corresponding prestrains is itself a problem, as mentioned in a previous Bureau report, RI 8507 {l).
Differential foundation settlement, excessive structural loads, and material shrinkage induce strains resulting in random and/or patterned cracking. For analyzing blasting effects, these straininducing forces are considered static and the resulting strains are called/ prestrains. For example, consolidation of foundation soil by the transpiration processes of nearby trees {19) causes differential settlement induced prestrain. The walls of residential structures are always under some strain, although cracking may not be apparent. The cracks commonly seen in old homes are manifestations of such prestrains.
Several references present excellent summaries of the multiple origins of cracks {20-23). Basically, cracks are caused by-one or a combination of the following:
1. Differential thermal expansion.
2. Structural overloading.
3. Chemical changes in mortar, bricks, plaster, and stucco.
5
4. Shrinkage and swelling of wood and wood-paper products.
5. Fatigue and aging of wall coverings.
6. Differential foundation settlement.
Another source of strains and cracking--one not usually considered--is everyday household activities. Early in the testing program described in this report, the response of the test house to typical human activity was compared with the response to blasting. Additional human activity data is also available from Andrews' study {3) of the house diagramed in figure 2. Table 1 shows the Bureau's and Andrews' data on wallboard strains resulting frA~ various human activities. Door slammin5 produced strains greater than those produced from blasting vibrations up to 0.5 in/s. All the strains shown in table 1 are dynamic strains induced by the specified activities; they do not include any prestrains.
Data on prestrain from changes in normal household relative humidity and temperature are limited to paper. These factors have been shown to generate prestrains of ~ 100 to 200 ~in/in in unprotected paper {24-26). For cyclic changes in rela~ive humidity above 65 pet, up to 40 pet paper swelling and shrinkage can occur (26).
RATES OF CRACK OCCURRENCES IN RESIDENTIAL STRUCTURES
Structures crack naturally over time, and this section reports the results of several studies wherein the rates of crack occurrences were measured. Holmberg (~) recently analyzed inspection reports to estimate a crack rate for apartment buildings in Sweden. Two apartment buildings were inspected for cracks three times between 1968 and 1980. The number of observed cracks is plotted as a function of time in figure 3. An average of 12 to 13 new cracks per year occurred for these particular structures.

6
FIGURE 2. • Strain gouge locations in sonic boom study @), house 1. {Italic letters identify locations listed in table 1.)
8

7
TABLE 1. - Maximum strains in wallboard from blasting, household activities, and environmental factors, microinches per inch
Human activities Wind Strain location Mine Heel Door slams Nail Walkii'.Z and/or
blasts Jumps drops Entrance,Sliding pounding 1st ,, Attic thunder-glass floor storm
BUREAU OF MINES TEST HOUSE Over sliding 1 22,;.:: 15 24 9.2 13 22 21 Low NM NM glass door.
Over south win- 318 42 20 12 19 9.3 9.1 NM NM dow in master bedroom.
Over large door- 424 511 , 17 6.1 8.3 6.2 28 Low NM NM way in living room. -
Over picture 433 17 11 21 3.6 32 3.2 NM NM window.
Over entrance dvor. 436 543 • 13 5.8 1 !,O Low Low I Low ~Thf w.f -- -- -·-· . ·-. ·~ .. ~ ··--~-~----::-::-~:-ANDREWS 1 SONIC BOOM STUDY (3), HOUSE 1
From figure 2, location: A • • • • • • • • • • • • • • NM NM NM B • •• • • • • • • • • •. • NM NM NM c .••.•...••..•. NM NM NM D • • • • • • • • • • • • • • NM NM NM E • • • • • • • • • • • • • • NM NM NM F • • • • • • • • • • • • • • NM NM NM G • • • • ••• • • • • • • • NM NM NM H • • • • • • • • • • • • • • NM NM NM
NM Not measured. lFrom peak ground vibration of 0.30 in/s. 2From peak ground vibration of 0.21 in/s.
(f)
~ (.) <{ 0:: (.)
200.---------~~--------~,--------~
KEY 8 o Apartment house I o Apartment house 2
0
:5 100- -0:: w !Il ::!!: :::> z
0 0
0
o~--------~~--------~'--------~
39.1 NM NM NM 10.2 2.36 17.0 NM NM NM NM 2.18 17.1 NM NM NM NM Lew 13.4 NM NM NM 3.43 3.63 11.5 NM NM NM NM 1.11 12.5 NM NM NM 66.4 2.38
NM NM NM NM 59.0 5.15 12.5 NM NM NM NM 1.89
3From peak ground vibration of 0.29 in/s. 4From peak ground vibration of 0.39 in/s. 5From peak ground vibration of 0.32 in/s.
1965 1970 1975 1980
The.crack rate depends upon the type of structure. Rates for 11 wood frame houses that were subjected to 26 weeks of sonic booms and 13 weeks when there were no booms (3) are listed in table 2. Crack rates- at homes 1-4, which were studied during both periods, were generally lower during the 13-week nonboom period. The investigators also found evidence of a possible relationship wherein rela~ive humidity and the number of booms may together have an effect on the occurrence of cracks, as shown in figure 4. They concluded, "This investigation has not exonerated sonic booms as a factor influencing the rate of structure deterioration, but neither has it established a direct cause and effect relationship between sonic booms and
FIGURE 3. - Building age versus crack occurrences, after Holmberg (27).

8
(f) 1-(.) w LL. w 0
-0 a.
>-1-a :E :::> ::c w > 1-<(
..J w a::
o::'"' ooo _::.:: o::o w< 1-0:: ZO -...., LL. 0 0:: w al ::E :::) z
80
0 2 4 6
Average area relative humidity
• \ . • • •
8 10
•
12
• •• • • • • •
• • •
• •• • • • • •
Number of interior defects (cracks)
14 16 WEEKS
18
• • • • • • • • • • • • • • • • •
20 22
• • • •
24
q (\J I\ I
15 ~ 0 0 m lL
10 ° a:: w m ~ :::>
sz
0
26
FIGURE 4. • Weekly comparison of crack occurrences to sonic boom amplitudes of 134 dB and to relative humidity (at homes 3 and 4 as shown in table 2).

9
TABLE 2. - Crack rates for houses subjected to sonic booms (2)
Number Number of cracks per House of Area, Foundation Age, Finish Occu- week
stories ft2 yr Interior Exterior pied Boonr Non boom period period
1 ••• 1 1,560 Concrete 5 Wallboard •• Brick ••• Yes •• 3.7 1.9 slab.
2 ••• 2 1,750 •• • do •••••• New ••• do • ••••• •• • do ••• No ••• 8.2 3.3 3 ••• 1 1,470 . • • do •••..• 8 .• . do ...... .. • do .•• No ••• 8.8 1.5 4 .•• 1 1,160 Concrete 18 . . . do • ••... •• .. do • •• No ••• 6.1 1.8
stem wall. 5 ••• 2 2,870 Masonry >50 Plaster Asbestos No ••• NM 23
stem wall. and lath. siding. 6 ••• 1 1,100 Concrete 25 .. • do • • ~ ..• Stone ••• Yes •• NM 2.6
- stem wall. -
7 ••• 1 1,090 •• • do •••••• 30 Lath and Wood lap Yes •• NM 1.4 wallboard.
8 • •• 1 1,280 •• • do •••••• 30 Plaster and Brick ••• Yes •• NM 3.3 lath.
9 . •• 2 2,000 Masonry 40 Paper on Wood lap Yes •• NM 3.0 stem wall. plaster
and lath. 10 ••• 2 2,370 Concrete 35 Plaster and • •. do ••• Yes •• NM 14
stem wall. lath. 11 ••• 1 1,330 Concrete 8 Wallboard •• Brick ••• Yes •• NM 2.2
slab. NM Not measured.
defects discov.ared at the test houses." The crack rates of 1.4 to 23 cracks per week during the nonboom period are quite high compared to the rate observed by Wall (28) in a study of 43 single-story concrete-block houses over a 26-week ~eriod; he reported a crack rate of 2.5 cracks per day for the 43 houses (<1 crack per week per house).
The large range in the crack rates reported in the separate studies by Holmberg, Andrews (table 2), and Wall is indicative of the wide range of susceptibility of houses to cracking. The rates ranged from near zero to 23 cracks per week. (The cracks-per-year rate reported by Holmberg indicates a cracksper-week rate of near zero.) None of the
investigators reported crack rates of zero. The large differences in the rates reported are partially a result of the difficulty of defining cracks. For example, in Wall's report, shrinkage cracks were ignored, and only new cracks in the moderate (easily distinguishable) range were reported.
These data point out that new cosmetic cracks are likely to occur when months pass between pre- and post-inspections. Therefore, any post-blast inspection is likely to find new cracks that are the result of natural aging. The time frame for inspections and difficulties of observing cracks are discussed in the "Results" section.
ACKNOWLEDGMENTS
The authors acknowledge the cooperation and assistance provided by AMAX Coal Co., Indianapolis, IN, and employees of its Ayrshire Mine (site of the test house)
near Evansville, IN. with special thanks expressed to Daniel Lanning, community relations manager; George Martin, general mine manager; Mike Padgett, senior

10
drilling and shooting supervisor; and John Smith, manager of drilling and shooting. Valuable technical support and advice on strain gauge instrumentation and mechanical problems encountered during this blasting research were provided
by Alvin Engler, electrical engineer; Kevin King, electrical engineering student; and G. Robert Vandenbos, electronics technician, employees of the Bureau's Twin Cities Research Center, Minneapolis, MN.
EXPERIMENTAL PROCEDURE
The fatigue research investigation, from June 1979 to December 1981, was based on measurements of structural conditions, dynamic and static responses, and cracking at a full-scale test house located near an operating surface mine. Following the field studies, complementary laborator~ tests (appendix A) were performed.
The investigation consisted of the following ?hases:
1. Design and construction of the test house and installation of monitoring systems for vibration strain, static deformation, and environmental conditions.
2. Long-term monitoring of low strain levels resulting from blasting and other phenomena.
3. High-strain-level blasting as coal mining reached the experimental structure.
4. Extended fatigue loading using mechanical vibrators.
5. Laboratory measurements of the strength and failure characteristics of construction materials.
DESIGN AND CONSTRUCTION OF TEST HOUSE
The experimental plan called for a residential test structure typical of models currently built in the test-site area. The plan also specified the use of common construction materials of the type commonly claimed to have been damaged by blasting. Although plumbing and interior finish work 9Uch as inside doors and cupboards were not included, structural
integrity required heating and cooling for a realistic home environment.
The Bureau chose a location at the Ayrshire Mine near Evansville, IN, for construction of the test house, and siting of the house there was made possible through an agreement with AMAX Coal Co., the owner of the mine. Figure 5 shows the test-site location and the locations of the blasts relative to the house during the 2-yr test period. The site location allowed a response of at least 1 yr to natural stress-inducing influences before the blast vibrations would reach a level of about 0.75 in/s, the lowest level at which a probability of cracking wallboard had been observed in previous research (~) •
After site selection, the Bureau contacted the local carpenters' union to establish the typical house design, then chose a split-level model. The 1,144-ft2 test ~0use (fig. 6) had a concrete block basement, brick veneer, and a brick fireplace. Interior walls were 1/2-in wallboard with taped and plastered joints. The kitchen-dining room area received an additional 3/16-in coat of veneer plaster. Plumbing, cupboards, finish molding, and interior doors were not installed, but 7 5 concrete blocks were used to simulate normal household loads. Design details are shown in appendix B. Ed Scheesele & Sons, a local contractor, built the structure between June and October 1979. As a cost-saving measure, the Bureau arranged for a local engineering firm, VME-Nitro Consult, Inc. (VME), to conduct con~truction inspections at the completion of the following stages: (1) footings--before pouring, (2) foundation, (3) frame and masonry, (4) electrical, and (5) finish.

211 .----~·--------.---------·---~--~----~---~
210
209
208
::
. l.lJ 1- 206 <t z 0 0:: 0 0 (,)
J: 1-6 205 (/) I
J: 1-0:: 0 z
204
203
202
201
•93
•73 •91 •90 •72
•92 •BO,sa •110 •94 ' 89 •79 •67
•Ill •95 •88 •78 •112 •96 "66
•87 •77 •65 •25
\
est house "113 •97 86
•76 ,64 •53 •114 •98 • •75 6" • •54•52
•115 •99 •85 • ... 55 127• •104•100 ' 74 •62 "51
128, 126• 105 '101 •84 •60 •56 •50 129• •1;5 •1d~2•83 •59 •5 7 •49
107 58 •48 12'!'108'"·106 •82 • •47 •5 •3
122• l23 •81 •46 •4 •2
121• •120 •119 •118 •117 •116
•109 •24 •45 •I
•22 •23
•29 32:31
•33 35•"34
39:~f •40
41•
•42 43··44
•6 •7 •8
•IS
•19
•13
Shots Coordinates off qroph North South
30 204,664 396,271 38 2 t 8,498 404,250
71• 70•
69• 61•
•9 •10 •II •12
200~-------------------L--------------------L----------------399 400 401
EAST-WEST COORDINATES, 103ft
FIGURE 5, ~ Test house end shot .locations.
402
11

12
FIGURE 6. ~ Front view of test house.
There was one major deviation from the construction plan. The roof framing was changed by the contractor to follow local building practices (fig. B-6). The inspection at construction completion revealed a number of hairline cracks, assumed to be from shrinkage, in wallboard corners and basement block joints.
MONITORING PROGRAM
A multifaceted monitoring program measured the effects of both natural forces and blasting vibrations on the test house. Bureau personnel installed the monitoring instrumentation at the start of the program and operated the systems at critical periods. At other times, VME (under contract) collected the recordings and shipped them to the Bureau's Twin Cities Research Center for processing. Both Bureau and VME personnel were onsite for the final blasts and mechanical fatigue tests, in addition to an engineer from another company, who was responsible for the mechanical vibrator systems.
Low-Level Blasting Tests
During the early phases of the study, static and slowly varying influences were studied. Seasonal weather conditions and effects of settlement and inside
environment on static strains and deformations were measured semimonthly at 67 locations within the house. Detailed damage inspections were conducted during the semimonthly testing.
Continuous monitoring of all blasting and weather conditions (both inside and outside environment) was started on October 30, 1979, and continued throughout the study. A Dallas Instruments, Inc., model ST-4 self-triggered seismograph? recorded outside vibrations and airblast. Six L\llstrak 30-day chart recorders (Gultan Industries, Inc.) monitored temperature, humidity, wind, and, later in the study, two channels of differential displacement (strain). The authors expected that the annual temperature and humidity cycle, as well as daily temperature changes, would introduce cycles of slowly varying stress and consequent strain. They also anticipated that the annual changes (i.e., cross-grain wood shrinkage) would show up in the semimonthly strain measurements. To test for daily variations, a Kaman Sciences Corp. displacement system was used as described later in the "Dynamic Strain" section.
?Reference to specific not imply endorsement by Mines.
products does the Bureau of

The semimonthly evaluations were made for the Bureau by VME, which was required to do the following for each visit:
1. Perform an elevation survey (transit level loop) of the outside of the test house.
2. Change chart recorder tapes each month for--
Temperature, outside and inside.
Humidity.
Wind speed and direction.
3. Change the ST-4 seismograph tapes.
4. Conduct r.-~.,·
ing--
Groove comparitor.
Extensometer.
rc: •Jtiliz-
13
5. Inspect the structure for cracking; perform mapping and photographing; and note crack lengths and approximate widths.
Periodically during the low-vibrationlevel phase, dynamic measurements were made of strain and vibration responses,. particularly when the mining cycle brought the blasting relatively close to the test house.
The duration of the low-level vibration phase was 16 months, during which the test house was subjected to 645 mining blasts with ground vibrations of <0.75 in/s peak particle velocity. An attempt was made to hold the vibration level of blast3 during this period to that level (<0.75 in/s), which is the recommended pnak level for Drywall houses (2). Only one shot exceeded this level, -by 0.03 in/s, which was within the tolerance of the seismograph's calibration (±10 pet). The house's response to shots 1 to 44 (fig. 5) was recorded during this period.
FIGURE 7. • House relationship to pit (south view).

14
High-Level Blasting Tests
In March 1981, the mining operation brought the blasting close enough to the house for the vibrattons at the test house to exceed 0.75 in/s. Blasting at the working-face area (figs. 7-8) took approximately 1 week to pass by the house during the month-long traverse of the mile-long highwall. During that 1-week period, detailed dynamic measurements and damage inspections were performed. For each blast, strain and vibration time histories were recorded throughout the house (particularly at critical areas near doorways, windows, and corners). At times, as many as 50 FM tape recorder channels were used to record the data.
Structure response and cracking mea-~ments were made periodically over the
" __ t 9 months. The house was subjected to approximately 108 blasts >0.5 in/s and one as high as 6.94 in/s. Blasts within 300 to 700 ft and scaled distances of 11 to 30 ft/lb 112 caused the highest ground vibrations.
Mechanical Vibration Tests
The blastinb phase of the study ceased when the hig~wall had reached to within
300 ft of the test house. Although the house had sustained blast-induced cracking by this time, cracking was hairline (excef~ at one corner of the basement) and "ltructural stability had not been affected. Since major damage had not yet occurred, a decision was made to examine fatigue effects by using mechanical shakers to simulate the effects of repeated loading from mine blasts. While results using short-term continuous cyclic loading would probably not be the same as results from long-term repeated loading from mine blasts, they were nonetheless expected to provide an indication of potential fatigue problems. The house had been subjected to as many blasts as are typically received by a structure near an advancing coal mine. However, cases involving long-term (quarry) blasting indicated that further investigation of cyclic loading was warranted.
Two main study options were considered. The first was relocation of the house and continuation of the blasting tests; the second was accelerated fatigue induced by a mechanical shaker. Relocation was considered impractical because of operational constraints that would have been imposed on the mining cycle, costs, and likely additional damage. The main
FIGURE 8.- House relationship to pit (north view).

problem with shaker-induced fatigue testing was the time available for testing. There were only two weeks after the final blas~ing tests in which to set up and conduct the shaker study before the presence of the house would interrupt dragline operations.
An experimental plan had been prepared for the final series of tests, and a contract was let with ANCO Engineers, Inc., to provide and operate the mechanical shaking system. ANCO provided dualsynchronized shakers developed during a previous study of North Sea oil drilling platforms. These_shakers were used in the house for accelerated fatigue tests with excitation levels based upon the structure response measured during the bl~Q~ing tests. Shakers were installed on pljw~od bolted across the ceiling joists pictured in figure 9, at each end of the test house. Figure 10 shows the installed shaker at the south end of the test house. Table 3 presents the specifications of the shaker system. To avoid stressing the ceiling joists, the shaker weight was transmitted to the foundation by additional column supports (figs. 11 and B-7). In addition, ceiling joist and wall stud connections near the shakers
15
were bolted (fig. 12) to ensure efficient horizontal load transmission during the more than 100,000 loading cycles. The tests involved inducing equivalent structure response until fatigue cracking was observed in the wallboard or until 100,000 cycles was reached at each level of vibration.
Laboratory Failure Tests on Wallboard and Masonry Walls
During the field test program, laboratory support was required in several a~~as. Special strain-measuring devices were designed, built, tested, and calibrated. Effects of temperature on strain gauges were measured in a cold room. Effects of mounting methods and sensing lPngths were also measured. The >::ra::i. •. ..J.easuring apparatus and mounting procedures adopted are described in appendix A.
Strength and critical strain levels of wallboard and concrete block walls were also measured in the laboratory to complement the full-scale field tests. The results of these tests and tests by other investigators are reported in appendix A.
TABLE 3. - Mechanical shaker and dri.ve system specifications
Description •••••••••••••••••
Operating frequency range ••• Frequency control ••••••••••• Force output, maximum ••••••• Force range adjustment •••••• Weight including drive motor Size •••••••••••••••••••••••• Drive motors ••••••••••••••••
Electrical requirements:
2 identical units capable of being driven at speed and in phase to deliver directional sinusoidal forces at 2 different locations.
1. 5-1 5. 0 Hz • 1.0-0.2 pet over operating range. 10,000 lbf (44,500 N) per shaker. Q-100 pet of maximum at any given frequency. 1,300 lb (590 kg). 24 by 24 by 24 in (0.6 by 0.6 by 0.6 m). 5.0-hp synchronous induction type, explosionproof.
Power••••••••••••••••••••• 7.6 kW. Voltage................... 230 V. Type•••••••••••••••••••••• 3 phase.

16
FIGURE 9. • Roof joist preparation for mechanical shaker installation.
FIGURE 10. • Installed south·end shaker.

17
FIGURE 11.- North-end shaker support.
FIGURE 12. • Ceiling joists being bolted to wall studs.

18
INSTRUMENTATION AND MEASUREMENTS AT TEST HOUSE
A large variety of measurement techni~ues was needed to quantify strainproducing environmental changes with cyclic periods that ranged from 0.02 s (e.g., blasting) to 1 yr (e.g., seasonal
temperature and humidity). Table 4 summarizes the instruments used in the monitoring progr,:!m.. The listed accuracies represent the combined limitations of the instruments and the least division of the chart papei:s. Locations of all instrumentation are shown in figures 13-16.
KEY Measurement locations for: A Accelerometer K Kaman sensor L LVOT S Strain leaf
FIGURE 13. • Accelerometer and strain system measurement locations on main floor.

TABLE 4. - Field measurement program for assessing strains an~ cracking from blasting, household activities, and environmental factors
Measurement
Blast-vibrations and airblast.
Wind speed and direction.
Humidity: Inside •••••••
Outside •••••• Temperature:
Inside •••••••
Outside ••••••
Structure vibration response.
Settlement •••••
Strain: Semimonthly ••
Do ••••••••• Every 3 h ••••
Dynamic ••••••
Instrumentationl
Dalias Instruments , Inc. , ST..;;-4; Geo Space Corp. , VLF-LP-3D; Vibra•Metrics Inc., MP-120; Validyne Engineering Corp., DP-7.
Weather Measurement Corp., Recording Wind System w 224.
American Instruments Co., Hygrosensor L15-1810D with Hygrodynamics Inc., Hygrometer Indicator 15-3001; recorded on Gultan Industries, Inc., Rustrak chart recorder 228.
(Data from Dress Regional Airport, Evansville, IN).
Gultan, Rustrak temperature recorder 2133F137 with temperature sensor 1334.
Gultan, Rustrak temperature recorder 2144 with temperature sensor 1332.
Vibra•Metrics, MB 120 transducers •••••••••••••••••• Bruel & Kjaer Instruments, Inc., 4370 accelerometers with 2635 charge amplifier-integrator.
Unholtz Dickie Corp., 1000PA accelerometer with 2216 II signal conditioner.
E. Lietz Inc., B-2 Philadelphia automatic level rod with vernier.
Interapid, groove comparitor ••••••••••••••••••••••• Slope Indicator Co., tape extensometer 51855 ••••••• Kaman Sciences Corp., KD-2611 recorded on Gultan Rustrak chart recorder 388.
Kaman, KD-2611 displacement system; Schaevitz Engi-neering, displacement transducer; Vishay Intertechnology, Inc., Micro Measurement strain gauges; BLH Electronics strain gauges; Strain-leaf dis-placement system.
Household (Same as for structure vibration response and
Accuracy
See text ••••••••
2 mi/h, 1 .so 'Ii ••
3 pet •••••••••••
Not known •••••••
1° F ••••••••••••
2° F ••••••••••••
See text ••••••••
o.oo ft ••.••... I
0.0005 in ••••••• 0.003 in •••••••• See table 5 •••••
• •• do •••••••••••
See taxt ••••••••
activities. dynamic strain.) (Ins ections).. (Mas and hoto ra hs)••••••••••••••••••••••••••••• NAp. ·•••••••••• NAp Not applicable. lNumbers and letter-number combinations identify specific models.
Number of readings SemimonthlyiEvery 3 h!Dynamic
1,060 - I 129
1,830 133 NAp
83 133 NAp
96 133 NAp
85 133 NAp
85 133 NAp
NAp NAp 1,372
470 NAp NAp
} 1,359 NAp NAp
NAp 133 NAp
NAp NAp l, 975
NAp NAp 360
48 NAp 258
!-' ..0

20
KEY Measurement locations for:
A Accelerometer L LVDT S Strain leaf
FIGURE 14.- Accelerometer and strain system measurement locations in basement.
Ground Vibration and Airblast
As mentioned earlier, a self-triggered three-component seismograph and airblast monitor recorded every blast from the house-construction phase to field study completion. At times during the study, other instruments were used either next to this reference transducer or at the opposite corner of the house. Up to 12 channels of ground vibration time histories were recorded on magnetic tape for later analysis. This instrumentation is described in detail in two earlier Bureau reports, RI 8506 (29) and RI 8508 (30).
Weather Environment
Weather conditions an essential part
monitoring was of this study.
Temperature sensors were located both inside and outside the structure. Humidity was measured inside, and wind speed and direction gauges were located on the chimney. All devices were connected tv 3Q-day chart recorders which sampled at 2-s intervals. Additional data were obtained from the Evansville Dress Regional Airport, 5 mi from the test structure.
Household Activities
The dynamic measurement systems also responded to human household activities. Measurements were made of the vibration and strain produced by a variety of normal activities such as walking, jumping, door slamming, and nail pounding.

SP
KEY [J] Measurement locations for:
E Extensometer G Groove comparitor H Humidity T Temperature
SP Survey point
FIGURE 15. • Semimonthly strain, temperature, and humidity measurement locations, and survey points on main floor.
21

22
£16
KEY Measurernent locations for:
£ E xtensometer G Groove comparitor SP Survey point
FIGURE 16. • Semimonthly strain, measurement locations, and survey points in basement.
Structure Vibration Response
Structural vibrations produced by blasting and other transient phenomena were monitored using methodology that was similar to, but more complete than, that used in the studies described in RI 8485 (1) and RI 8507 (2). Inside the house, vibration responses were measured at corners (high and low points) and at midwall, midfloor, and midceiling locations. A total of 14 recorder channels was used to record structural vibration. Varying the transducer configuration raised the total number of measuring points to 20. These points are shown in figures 13 and 14 as the accelerometer measurement locations (At, A2, A3, etc.). At each corner location, up to four measurements were made; these were designated as .. high" or .. low" (near the ceiling or near the floor) and according to their direction
(north, east, etc.). The large number of channels allowed a more complete analysis than was possible in previous studies. Measurements in opposite corners allowed determination of rotational versus translation vibrational modes.
Settlement
Differential settlement of the structure was determined by measuring elevations at the survey points (SP) shown in figures 15 and 16. The elevation rod rested on a stainless steel sphere which was welded to a stainless steel stud and grouted into the top course of the block wall. A brass bench mark obtained from the u.s. Geological Survey was installed 50 ft from the house so that each elevation survey would complete a closed loop around the house and thereby identify any differential settlement.

Static Strain and Deformation
Long tPrm changes in static structural strain measurements are affected by gauge length, mounting method, and the long term stability of the equipment. The laboratory tests of gauge length and mounting method described in appendix A indicated a need for a wide range of instrumentation.
The extensometer (fig. 17) and groove comparitor (fig. 18) measured the distance between set reference points ~ 10 to 30 ft apart and ~ 3 in apart, respec~ tively. The ref~rence points for these two devices were permanently mounted stainless steel spheres and dimpled steel blocks. They were installed over critic~l areas of interest as detailed in figures 15 and 16 (points c1 , G2, GJ, etc.). Differences in length, between that measured initially and at any later time, were divided by the initial length to obtain the strain values. A 45° rosette was employed at each groove comparitor location on wallboard; and for masonry joints, both the vertical and horizontal axes of the block or brick were instrumented. (Sites G13-G16 (masonry locations) are not shown because the reference blocks dislodged after 2 months; however, these sites were promptly replaced by sites c17-c20 • c21 -c23 were additional sites instrumented during installation of the replacement sites.) In all, a total of 49 groove comparitor measurements and 17 extensometer measurements were made each semimonthly data collection period. (Use of site E14 was discontinued after 3 months due to loosening of the reference sphere.) Readings were corrected for temperature differences as determined with Invar-bar standards.
Dynamic Strain
Strain measurements were made at 26 locations throughout the test house (points K1-K2, L1-L9, 81-813• and 815-816 in figures 13 and 14; the gauge at site 814 failed). All major perimeter walls were monitored with gauges on inside surfaces. Gauges were also mounted over those doorway arches and window openings that were assumed to be areas of highest
23
stress concentrations. Differential motion at the corners was measured by displacement gauges. Strain systems were also mounted across brick and block mortar joints at the fireplace (upstairs and downstairs) and on the outside across the brick veneer mortar joints.
The dynamic strain instrumentation is described in detail in table 5. The Kaman sensor, linear variabledifferential transformers (LVDT's), and stain-leaf displacement systems required mounting fixtures. These devices are shown in figures 19-21, respectively. Resistance-wire strain gauges were applied directly to the wall covering materials. Time and care were required to mount the strain gauges. Even with a dummy gauge, constant balanr.ing was necessary co adjust for terupe.L'ac;.. ... e ~nd electronic drift. Such requirements made field use of the strain gauges tedious and difficult. These problems were reduced by using a system of four strain gauges installed on a metal leaf in a complete bridge arrangement; these gauges were employed in a 45° rosette pattern to allow calculation of principal strains at wallboara locations.
Two LVDT's with custom-made amplifiers were used to record differential movement across block and brick joints and crack openings, especially outside the house. Low-gain amplifiers were required to boost output voltages to desired levels.
Two Kaman systems, which are inherently stable against temperature changes and electronic drift, were used during the last 6 months of the study. They documented displacement measurements on chart recorders (hourly measurements) and recorded vibrations from blasting (dynamic measurements). Earlier efforts to monitor hourly strain failed because of LVDT drift and lack of sensitivity of the groove comparitor. Calibration of the Kaman system for temperature changes consisted of mounting the system on an aluminum bar and comparing theoretical and measured values for length change at various known temperature differences. Over temperature range of interest, 50° to 90° F, errors were less than 10 pet.
II

TABLE 5. - Dynamic strain measurement systems
(Millimeters except where otherwise specified)
-- Nominal Frequency Sensor Model linear range Sensitivity range, Hz Linearity
Schaevitz LVDTl. 050 GCD ±1.25 2 ..... 8 V/mm •••• 3o- 100 4 <±0.00625 250 GCD ±6 ""1.6 V/mm •• o- 100 <±.015 050 HCD ±1.24 2...,8 V/mm •••• 0- 500 4<±.00625
Kaman KD-2611: Eddy current •• 0.25S 0.25 ""10 V/mm ••• 0-50,000 <±.00125
Displacement 1U 1 ""1 V/mm •••• 0-50,000 <± .005 system.
BLH: Strain gauge •• A-9-3UF-120 40,000 Jlin/in ~.005 V/JJ.£ NA REF
Semiconductor SPBI-35-500 S75 Jlin/in ~.02 V/J.!£. NA REF strain gauge.
Micromeasurement Ea-13-125Bz ±0.10 6~.005 V/mm >0- 100 NA strain leaf -350 system.
---
NA Not available. REF Reference company specifications. V/Jl£ Volt per microstrain. lLinear variable differential transformer. 2With Bureau amplifier output up to 80 V/mm. 3Upper frequency limit specified at 10 Hz; shake table calibrated to 100 Hz. 4rndividual test • ±0.002 mm. 5Limlted to amplifier output. 6with Bureau amplifier output from 25 to 250 V/mm.
Thermal s,ensitivity,
mm/°C
0.0063 .0013 .0063
<±.004
<±.004
REF
REF
NA
Resolu- Stabil-tion ity
0.000635 0.00318 .000635 .0159
NA .00318
.0001 <±.003
.0001 <±.001
NA REF
NA REF
<.0002 NA
N .p-
Effective length
25 25 25
25-90
25-90
~124
~
15-90
-

FIGURE 17. • Extensometer.
FIGURE 18. • Groove comparitor.
25 i i

26
FIGURE 19.- Koman displacement system (top) and 124-mm strain gauge.
FIGURE 20 •• L VDT.
27
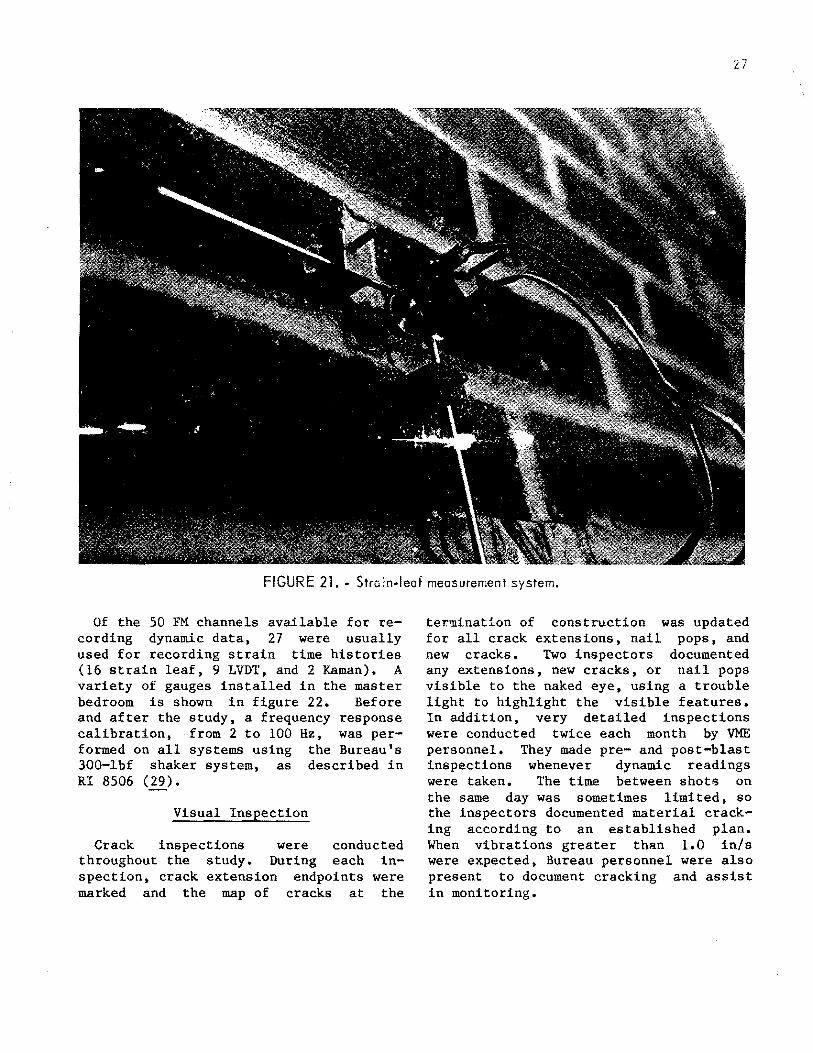
FIGURE 21. • Stro:n-leof measurement system.
Of the 50 FM channels available for recording dynamic data, 27 were usually used for recording strain time histories (16 strain leaf, 9 LVDT, and 2 Kaman). A variety of gauges installed in the master bedroom is shown in figure 22. Before and after the study, a frequency response calibration, from 2 to 100 Hz, was performed on all systems using the Bureau's 300-lbf shaker system, as described in RI 8506 (~).
Visual Inspection
Crack inspections were conducted throughout the study. During each inspection, crack extension endpoints were marked and the map of cracks at the
te~nation of construction was updated for all crack extensions, nail pops, and new cracks. Two inspectors documented any extensions, new cracks, or nail pops visible to the naked eye, using a trouble light to highlight the visible features. In addition, very detailed inspections were conducted twice each month by VME personnel. They made pre- and post-blast inspections whenever dynamic readings were taken. The time between shots on the same day was sometimes limited, so the inspectors documented material cracking according to an established plan. When vibrations greater than 1.0 in/s were expected, Bureau personnel were also present to document cracking and assist in monitoring.

28
FIGURE 22. • Measurement systems in master bedroom.
RESULTS
The results of this study are discussed with the following objectives:
1. To compare strain levels produced by blasting with those induced by natural events.
2. To describe how these natural and manmade events combine to cause cracking in a house.
3. To document the effect of blasting on the crack rate for the test house.
STRUCTURE RESPONSE TO NATURAL PHENOMENA
Insight into the potential of blasting to induce cracking was gained from
comparison of strains produced by vibrations and natural events with the strain level at which wallboard failure occurs. The strain level required for wallboard failure was determined from laboratory testing. Previous research and the latest Bureau tests (appendix A) show first cracking of composite wallboard to occur around 1,000 to 1,200 ~in/in, regardless of the mode of failure (bending or tension) and rate of loading. Table 6 lists the strains induced in the test house walls in response to various natural (i.e., nonblast) events; for each event, it also lists the corresponding blast vibration level. A detailed discussion of the structure responses to the events listed in table 6 follows.

200 ~ 150 .: "4. 100
90
TABLE 6. - Comparison of strain levels induced by daily environmental changes, household activities, and blasting
Induced Corresponding Loading phenomena Sitel strain, blast vibra-
pin/in tion level,2 l in/s
Daily environmental Kl 149 1.2 changes. K2 385 3.0
Household activities: Walking •••••••••••• s2 9.1 .03 Heel drop •••••••••• s2 20.0 .03 Jumping •••••••••••• s2 37.3 .28 Door slam •••••••••• sl 48.8 .50 ~ounding a nail •••• S12 88.7 .88
lFrom figure 13. 2Based on envelope line of st~ain versus ground
vit-... .,.tio1"'1 nl_f'Ot;,
29
t; 80 ... UJ ~,: 70
.... _____ _ - ... ,~utside ,.~t---- ... ----... ----.. ____ ~.Jill----....----....._ ____ •
.......... .,., .......... , ~" t-1-<( - 60 _,g w::l 50 O:::l
............ ......... _.,.,,. ............ ......,., ..... ---
Inside
:I: 40
~ 10 1-z E 5 ......... <( • 0 ... ' ~ 0 ~~, ' ~~~r.:~~~~--~~----5 ~ -5 ____ ... ' __ ........ ___ _ __ ........__ I'
(I) Cl. '~----·-------- -- ........ , ,/ ~~-torr Eost-west ....... ,_ . /'
:!!: -15 ....... .,/'
~ -20L-~--i~----~~----~1----~1~--~l ----~~~--~~--~~~~---71----~1~--~~----~~~--~1~--~~~--~~ 3(7118) 6 9 12 15 18 21 24 3(7/19) 6 9 12 15 18 21 24
North- south
TIME.
FIGURE 23. - Strain and environmental factors versus time, site K 1•

30
Response to Daily Environmental Changes
The Kaman displacement system, which has high stability with respect to temlerature changes and electronic drift, was used to monitor prestrain resulting from cyclic changes in temperature, humidity, and wind. Two monitoring locations were chosen across taped joints (Kl and K2 in figure 13). Site K2 was in an area of possible high stress concentrations.
Readings were taken in 3-h increments. Figures 23 and 24 display the data for a 2-day period. Because the strain was produced by at least four environmental factors, multiple linear regression analysis was used to quantify the factors.
~~~ain = C0 + c1x1 + c2x2 + v4A4, where Co and c,, c2, c3,
are the intercept and coefficients and X1 , X2 , x3 , and X4 are the humidity, temperature, wind, and ground vibration data, respectively. Assuming normal distribution, a t-test was applied at the 10-pct significance level to eliminate factors. (That is, when t values were greater than 1.71 for site K1 and 1.65 for site K2 , the null hypothesis that the coefficient of the factor = 0 was rejected.) The t-test statistically evaluated wind, temperature, humidity, and vibration for their degree-of-fit with the resulting strain. If one of these factors did not fit 90 pet of the time. it was dropped from the equation. Several combinations were investigated, including humidity as a time-delayed effect. When variables could be eliminated, coefficients were recalculated. C.)effi.cients .ittd statistics for the three equations with the best correlations are
ti ----.... ·-----... ·---------•,, _____ .. l.aJ a. 80 ',..putslde ,.,""" '
1111
~ )-... ' ,,.... _____ ............... ',, ,~~' 1- 1- 70 ... _ .. ' , <( Q ----.. ,"" '------- ....," .J - 60 ------ -----w ~ I ___ _._J~~------.-----~---+-----~----.----4----~----~----~--~----~------~----. a: ~ 50+- Inside
40L---~----~----~--~----~----~----L---~-----L----~----L---~-----L----~--~
::- 90 &.J _____ ... ......._...., Inside
It 80~--------~~~~~~~,~~~-~-~-:.-!:-~-~-:.:~::::~--~~---.~~~~~=-==-=-=-~~=-=-=-=-~·=-~-~-~-~~~.._---.__. i= .,., Outlide --.. _____ ..,_ ____ ._ ____ ...,..... ''-... <[ ____ _.... ...
Q: ----... w 0.. ~ w 1-
.&:
' ._e :i . ._o 5 :::: -5 UlO.. Will a::o
z
......_ __ ------~--_ ... ____ .... ___ .,..,.,.-.,. ... -.. - ,, --.......... ,, --..... ,, -- ..... ____ _. ____ _...,..,' ' ', _.. .. East-west
' ....... --.. -""" i -20L---~-----L----~---~L----L----~----L---~----~----~----L---~~---L----~--~
3(8/10) 6 9 12 15 18 21 24 3(8/11) 6 9 12 15 18 21 24
TIME
FIGURE 24.- Strain and environmental factors versus time, site K1J·

given in table 7. For example, the microstrain (~£) at site K2 from equation 2 is equal to
- 4010 + 6.28 (RHI) + 9.24 (RH0 )
+ 21.0 (TI) + 18.9 (T 0 ) + 8.24 (WN-s)
- 2.28 (WE-w) ±86.0 (Z),
with
where
R = O. 7 524,
RH1 = relative humidity inside, pet,
RH0 = rel~tive humidity outside, pet,
Tl =temperature inside, °F,
T0 = temperature outside, °F,
WN-S = wind speed from north to south, mi/h,
WE-w = wind speed from east to west, mi/h,
Z = number of standard deviations,
and R = correlation coefficient.
31
The ground vibration factor dropped out of the equations because the data were taken during periods of little blast activity. The best fit for site K2, equation 3, with R = 0.7653, utilized a lag of the inside humidity; i.e., the 3, 6, and 9 o'clock readings became the 6, 9, and 12 o'clock readings, etc. Equation 2 provided a comparison of the strains at sites K1 and K2 based on the unlagged data. Although some environmental variables dropped out for site K1 (equation 1), they were all present at K2 (equations 2 and 3~. The correlations were apparently valid because the wind perpendicular to the wall produced the major strain response (shear) at the monitored interior walls.
::>~ ".J.n resulting from each environmental factor can be predicted by multiplying the range of the factor by the factor's coefficient. For example, the 13-pct change in relative hu~idity could produce a maximum strain
( 15.5 ~€ ) of 202 ~in/in RH, pet x 13 pet •
Ranges of each factor and corresponding maximum strains are presented in table 8.
TABLE 7. -Coefficients and statistical for strain induced by relative humidity, temperature, and wind
Factor Equation 1 Equation 2 c + s t-value c + s t-value
Relative humidity: Inside •••••••••• 15.5 ± 1. 61 9.61 6.28 ± 2.65 2.37 Outside ••••••••• NAp NAp 9.24 ± 1.12 8.26
Temperature: Inside •••••••••• NAp NAp 21.0 ± 4.93 4.25 Outside ••••••••• 6.40 ± 1.16 s. 54 18.8 ± 2.15 8.76
Wind: North-south ••••• NAp NAp 8.24 ± 2.60 3.17 East-west ••••••• 1.77 ± 0.867 2.04 -2.28 ± 1.20 -1.90
C Coefficient. S Standard deviation. NAp Not· applicable; i.e., factor not statistically significant. 1Equation statistics:
Intercept ± s .. Correlation coefficient •••
Equation 1 -1,240 ± 25.7
0.7822
Equation 2 -4,010 ± 86.0
o. 7 524
Equation 3 c + s t-value
29.40 ± 2.82 3.33 9.31 ± 1.09 8.55
18.3 ± 4.81 3.80 19.7 ± 2.08 9.48
6.24 ± 2.68 2.33 -3.02 ± 1.20 -2.50
Equation 3 -4,030 ± 83.8
o. 7653
2Inside relative humidity for equation 3 was best fit by lagging data 1 period.
' ,~;u_, 4;:--'w;:> ? ""'' ., .. ~?' \' ',ji:.:. '-,.... ~\\.-- ·l
'......:;:, .:;· "}!'- t: - ~ / \vJ::. ~-
32
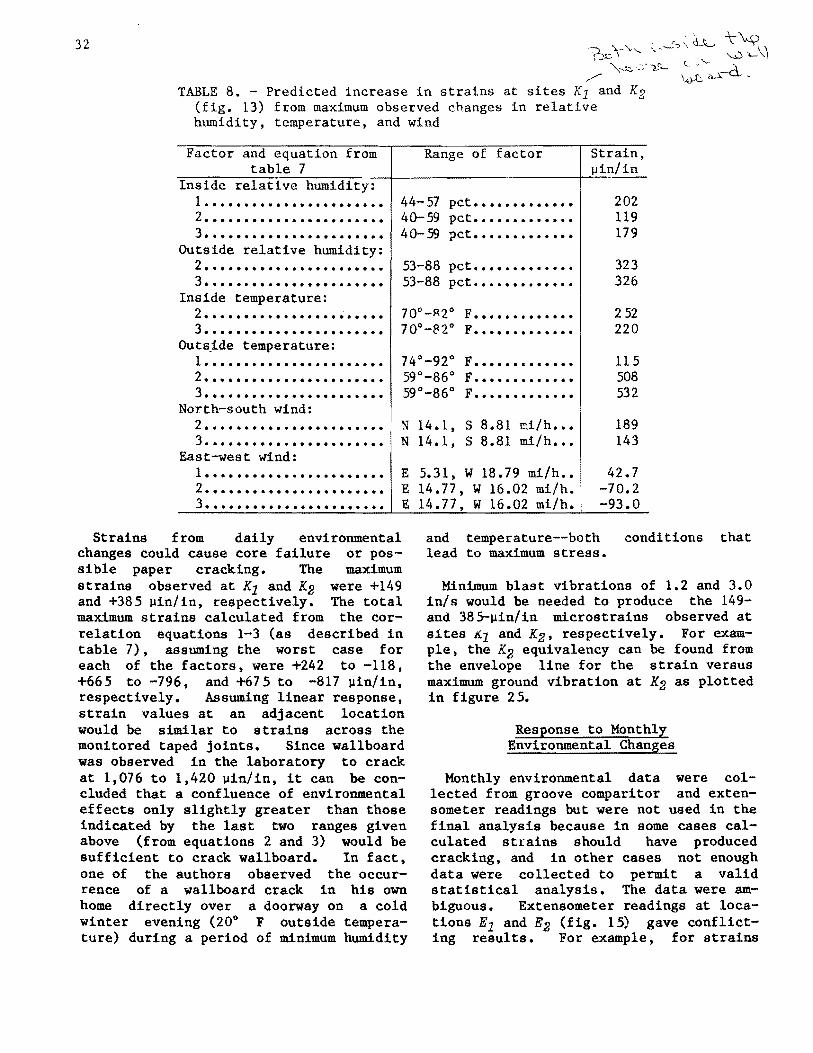
TABLE 8. - Predicted increase in strains at sites K1 and K2 (fig. 13) from maximum observed changes in relative humidity, temperature, and wind
Factor and equation from table 7
Inside relative humidity:
Range of factor Strain, J.lin/in
1 • . . • • • • • • • • • • • . • • • • • • . • 44- 57 pet. • • • . . • . • • • • • 2 02 2. ••• • . •• • • •• •••.• ••• • • • 4Q-59 pet............. 119 3 • • • • • • • • • • • • • • • • • • • • • • • 4 o- 59 pc t. . . . . . . . . . . . • 17 9
Outside relative humidity: 2....................... 53-88 pet............. 323 3 ••••••••••••••••••••••• 53-88 pet............. 326
Inside temperature: 2 •..•••...•.••...• ~ ..•.• 70°-R2° F............. 252 3••••••••••••••••••••••• 70°-82° F............. 220
OutsJde temperature: 1••••••••••••••••••••••• 74°-92° F............. 115 2....................... 59°-86° F............. 508 3....................... 59°-86° F............. 532
North-south wind: 2 ••••••••••••••••••••••• N 14.1, S 8.81 ~i/h... 189 3 ••••••••••••••••••••••• N 14.1, S 8.81 mi/h... 143
East-west wind: 1 ••••••••••••••••••••••• E 5.31, W 18.79 mi/h •• 2 ••••••••••••••••••••••• E 14.77, W 16.02 mi/h. 3 ••••••••••••••••••••••• E 14.77, W 16.02 mi/h.
42.7 -70.2 -93.0
Strains from daily environmental changes could cause core failure or possible paper cracking. The maximum strains observed at K1 and K2 were +149 and +385 ~in/in, respectively. The total maximum strains calculated from the correlation equations 1-3 (as described in table 7), assuming the worst case for each of the factors, were +242 to -118, +665 to -796, and +675 to -817 ~in/in, respectively. Assuming linear response, strain values at an adjacent location would be similar to strains across the monitored taped joints. Since wallboard was observed in the laboratory to crack at 1,076 to 1,420 ~in/in, it can be concluded that a confluence of environmental effects only slightly greater than those indicated by the last two ranges given above (from equations 2 and 3) would be sufficient to crack wallboard. In fact, one of the authors observed the occurrence of a wallboard crack in his own home directly over a doorway on a cold winter evening (20° F outside temperature) during a period of minimum humidity
and temperature--both conditions that lead to maximum stress.
Minimum blast vibrations of 1.2 and 3.0 in/s would be needed to produce the 149-and 385-~in/in microstrains observed at sites KJ and K2, respectively. For example, the K2 equivalency can be found from the envelope line for the strain versus maximum ground vibration at K2 as plotted in figure 2 5.
Response to Monthly Environmental Changes
Monthly environmental data were collected from groove comparitor and extensometer readings but were not used in the final analysis because in some cases calculated strains should have produced cracking, and in other cases not enough data were collected to permit a valid statistical analysis. The data were ambiguous. Extensometer readings at locations E1 and E2 (fig. 15) gave conflicting results. For example, for strains

33
0 400
3 50 Envelope line
300 I
0 I I 0
c I .. .......... 250 I c I ::t.. I 0 .. I z - 0 I <(
200 I 0::: 0 1-
0 I en
0 I I
150 0 'o 0
I 0 0 I
0 0 I I
100 000 I
0 I 0 I 0 0 I
0 I I
50 I I I I I
0 2 3 4 5 6 7 MAXIMUM GROUND VIBRATION, in/s
FIGURE 25.- Strain versus maximum ground vibration level, site K~.
34
read over virtually the same structural area, multiple linear regression analysis eliminated the settlement factor for location E2 but not for E1• This should net occur for sites on the same wall.
The accuracy of the readings depended largely on operator efficiency, attachment apparatus, and mounting techniques. The groove comparitor readings were highly suspect because of limited gauge accuracy (±100 ~in/in) and methodology. Questions arose as to whether comparitor tip alignment was done in the same manner from one period to another and the possibility of foreign matter settling on the blocks where the measuring tips rested. The extensometer required 40 lb of applied tension on the measurement tape, and this <'" 1
, " • e affected strain readings, depending on how well the attachment points were anchored into the wall. The comparitor and extensometer systems were designed to display displacements caused by differential settlement. The results of the levelloop surveying showed that differential settlements observed across the walls were negligible (~ 0.01 in). Because of these uncertainties, long term effects were examined with respect to crack rate changes, which are described in a later section ("Long Term Cracking Observations").
Response to Household Activities
Several human activities such as jumping, door slamming, walking, and nail pounding were monitored at the test house. The results showed that these activities induced strains similar to those induced by ground motions from blasting. Table 9 lists the equivalent ground vibration levels based on comparative strain or structure-motion response. These ground motion equivalencies are based on a worst-case analyses (using an
envelope line as shown in figure 26) and on a least-squares regression-line analyses. For exaP'ple, the strain recorded at location Sz (fig. 13) by slamming the sliding door was 48.8 ~in/in. The equivalent ground vibration levels were read from the plot presented in figure 26, which shows strain versus peak ground vibration at site 81• The envelope- and regression-line equivalent blast vibration levels are 0.50 and 1.40 in/s, respectively, as indicated by the broken lines in figure 26. The 0.50-in/s value is a worst-case prediction based on strain-producing ground vibration being the independent variable. Blast vibration levels equivalent to human activities are up to 0.88, 0.59, and 0.92 in/s based on envelope analysis (worst case) of strain, structure motion, and midwall response, rPQnectively; and similarly, up to 1.44, 0.90, and 2.16 in/s based on regression-line analysis.
STRUCTURE RESPONSE TO BLAST VIBRATIONS
The strain and structure motion induced in a house by blast vibrations are der~ndent on the transfer of ground vibration energy through the foundation and the house's wooden framework (superstructure) to the attached wall covering. Airblast induces additional strain and structure motion as it shakes the superstruct~re. Typical structural strain and velocity time histories measured at corner, midwall, and ground-level locations are shown in figures 27 and 28. High-corner east-wall velocity waveforms A4 and A1 are out of phase, indicating that shot 123 subjected the superstructure to torsional motion. Both translational and torsional response were measured, regardless of shot location. Figure 27 illustrates the similarity of waveforms that resulted from the ground m.otion and those that resulted from the induced structure motion.

.I 3s ,I
TABLE 9. - Human activities and equivalent ground vibration levels
~Induced strain Activity Locationl (!lin/in) or Ground vibration equivalency, in/s
structure Envelope2 Regression line3 motion (in/s)
Walking •••••••• A4' low corner, 0.16 in/ s ••••• 0.07 0.29 south wall.
A4, low corner, 0.039 in/ s •.•• .005 .07 east wall.
82 • ••••••••••••• 9.1 llin/in •••• .03 .09 Heel drop •••••• A4, low corner, 0.14 in/ s ••••• .06 .24
south wall. A2, Midwall ••••• 0.65 in/ s ••••• .06 .17 s2 • ••••••••••••• 20 llin/in., ••• .03 .20
Low jump ••••••• A4, low corner, 0.12 in/ s .. ... .05 .18 ·south wall.
A2, midwall ••••• 1. 8 i~/s •••••• .26 .92 High jump •••••• A4, low corner, 0.31 in/s ••••• .29 .74
south wall. A2, midwall ••••• 1.2 in/s.CI•••• .15 .52 82 • ••••••••••••• 42 llin/in ••••• .28 .62
Entrance door A4, low corner, 0.18 in/s ••••• .09 .22 slam. east wall.
A3, midwall ••••• 1.3 in/s •••••• .13 .52 s 8 • ••••••••••••• 21 llin/in ••••• .27 .60
Sliding glass Al, high corner, 0.87 in/s ••••• .51 .90 door slam. east wall.
sl •••••••••••.•• 48.8 llin/in ••• .so 1.40 Sinking nails A4, low corner, 0.51 in/s ••••• .38 .so for pictures. east wall.
A.s, low corner, 0.67 in/s ••••• .59 .89 west wall.
A2, midwall ••••• 3.9 in/ s •••••• .92 2.16 sl •••••••••.•.•• 21 llin/in ••••• .18 .41 sa •••••.••..•••• 32 llin/in ••••• .38 .87
S12 • • • • • • • • • • • • • 88.7 llin/in ••• .88 1.44
1 From figure 13. 2Based on envelope of strain or structure motion versus ground vibration data. 3Based on regression line through strain or structure motion versus ground vibra
tion data.
I

36
c: :.::::.: c:
:1.. .. z <t 0:: t-(/)
300~----~----~----~----~-----,------,---~
270
240
210
180
150
120
90
60
30
0
0
0 oo 0
0 0
2 3
Envelope line
0 0
0
4
0
5 MAXIMUM GROUND VIBRATION, in/s
FIGURE 26. • Strain versus maximum ground vibration level, site SJ.
6 7
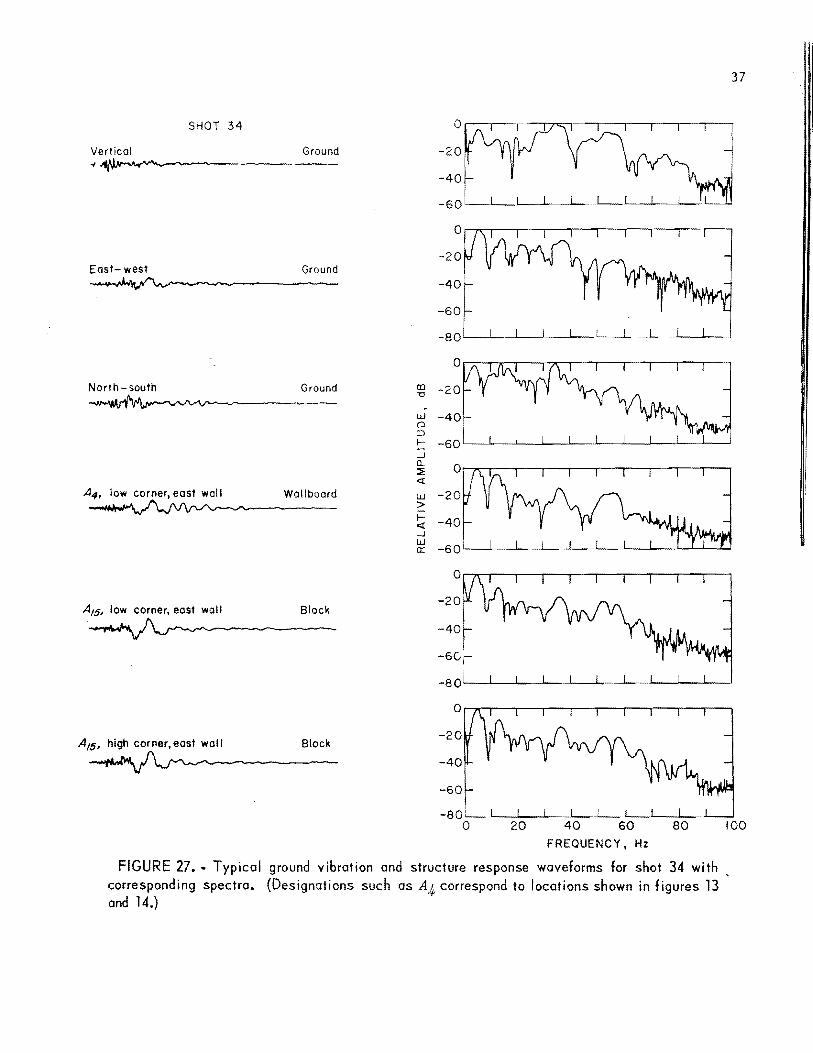
SHOT 34
Vertical
East- west
North-south
A4, low corner, east wall
A15, low corner, east wall
A 15, high corner,eost wall
Ground
Ground
Ground
Wallboard
Block
Block
:~::~ ;::: -60 I I I I I I I I I I I ...J a. ~ <(
w > 1-<( ...J w a::
37
-so~: --L-~--~~--~--L--L--~~--~ 0 20 60 100
FREQUENCY, Hz
FIGURE 27. • Typical ground vibration and structure response waveforms for shot 34 with corresponding spectra. (Designations such as A4- correspond to locations shown in figures 13 and 14.)
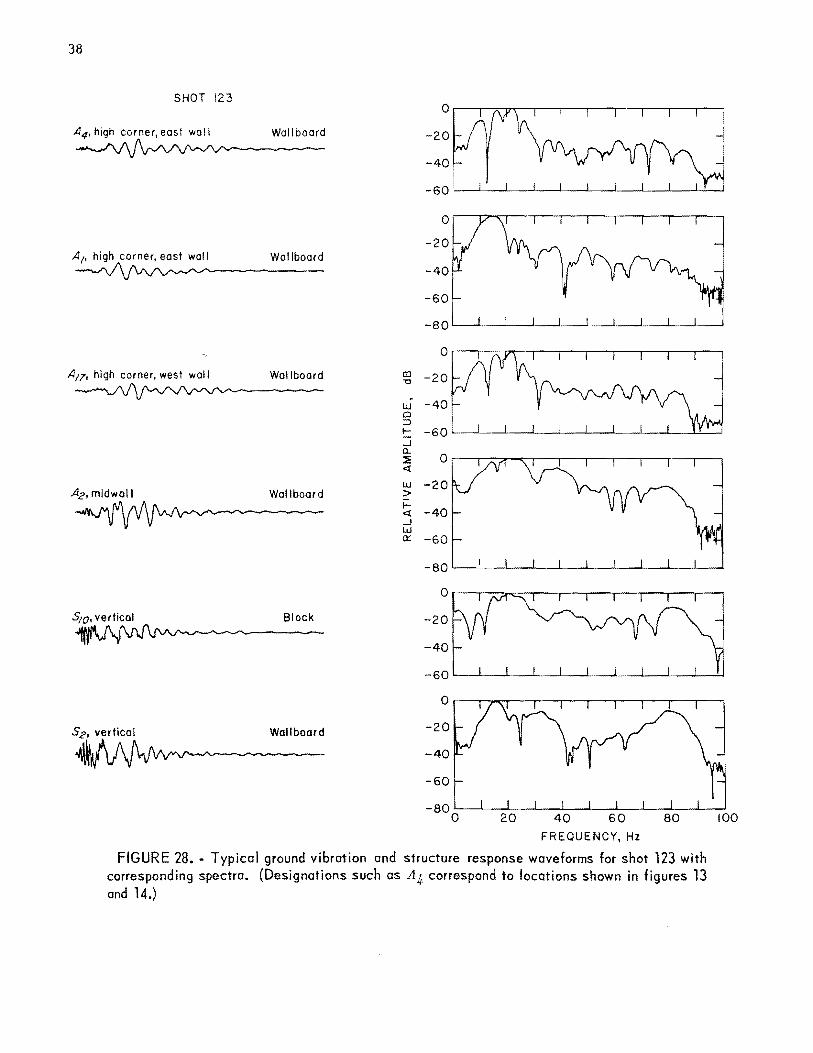
38
SHOT 123
A4 , high corner, east wall Wallboard
A1, high corner, east wall Wallboard
A17, high corner, west wall Wallboard
A2,midwall Wallboard
S;o. vertical Block
s2, vertical Wallboard
OVf\ -20.
-40 I
-60~-L--L-~--~~L--L--~~--~~
o--~~.--.---.--.-~--~~---.~
-20
-40
-60
-80L--L--~~--~--L--L--~~--~~
~ -20
w 40 0 :::> 1-_J
a.. ~ 0.--.~~~.--.--.---.--.--.---,--, <!
w -20 > ~ -40 _J
w 0:: -60
-ao~--~--~--L-~--~--L--L--~--L-~
o~~--~--~-r--~--~~--~--~~
-20
-40
-60~~--~--L-~--~--L-~--~--~~
0.--.~~----.---.--.--.--.--.-~
-20
-40
-60
FREQUENCY, Hz
FIGURE 28. • Typical ground vibration and structure response waveforms for shot 123 with corresponding spectra. (Designations such as A4 correspond to locations shown in figures 13 and 14.)

Low- and high-corner responses are plotted against maximum ground vibration (ground peak particle velocity) in figure 29. A large difference exists in the slopes of the envelopes of the high- and
z Q 1-0 :::!! LLJ 0:: ::l I(.)
::l 0:: 1-CJ)
High corner
0
5 0 0
4
0
0
0 0
8 0
I" g 0
8 0
0 o I
0
0
• 0
0
0
8 8
0
0
0
0 0
0
0
0
8
0
0
0
5r-----.-----r-----r-----r-----r-----r---~
4
3
2
Low corner
0 0
3
0
0
0
0
4 5 MAXIMUM GROUND VIBRATION, in/s
0
6 7
FIGURE 29. • Low· and hinh·corner responses versus maximum ground vibration.
39
low-corner responses and in the scatter of data. The slope of the envelope of structure motion versus maximum ground vibration is a good approximation of the maximum amplification factor. Structure response depends on the freq~ency of the excitation. The large scatter of data in figure 29 resulted from the wide variation in excitation frequencies, which resulted in different amounts of amplifica~ion. The effect of excitation frequency on amplification factors is shown in figure 30.
6
4
i
:t ·~
Corner
9 ,.--------.---,-
MidwoU
e
6
4
0
" 0 0
0
0
0
" 0
KEY o l ~ slorv stnJcTur;:
6 2- s1ory strucfufe
0 0
A 0 0
KEY
o 1- $tory tttucture
ti 2-storv structure
0 0
o o £J8o l::t. o A o 0 ~
0 0 0 A ool!. 8 'A A
0 oo
0 g. "0
QL-----~--~-L-~-L~~~----~--~-L-L-L~~
I 10
GROUND VIBRATION fREQUENCY, Hz
FIGURE 30. • Corner and midwall amplifica· t ion factors @.
100
40
Strains in walls from airblast are shown in figur.e 31. Based on the worstcase env2lopes of airblast and ground vibration versus strain, an airblast of
132 dB produces the same wall strains as a ground vibration of 1 in/s. This equality applies only to airblasts whose peak amplitudes occur at frequencies within the range of the frequencies of the structure's midwalls. Otherwise, typical airblasts in these tests induced strains of less than 25 ~in/in, even for airblasts approaching 132 dB. The measured strains were equivalent to those produced by a ground vibration of 0.25 in/s. In the tim~ histories, the maximum strain responses usually coincided with the arrival of frequencies near the structure's natural frequency. Figure 31 ~lso includes the induced strains re~ -ied iT" one of the houses in the pre,.riously discussed sonic-boom study (3). The larger structure response from the mine blasts is the result of a better match of the frequency content of the confined blasts to the natural frequency of the wall panels.
As illustrated in figure 32, strain response is a combination of both shear and flexural deformation of the walls. Plots of strain versus maximum ground vibration are shown for wallboard and plaster, wallboard tape joints, block joints, and brick veneer, and fireplace brick joints in figures 33-37, respectively. The graph of peak wallboard and plaster strain (fig. 33) shows a large scatter of data again (as in figure 29) due to differences in excitation frequency and mode at the same maximum vibration level, or peak particle velocity. Wallboard and taped joints were exposed to maximum strains of 250 to 550 ~in/in, which is considerably below the 1,000 ~in/in necessary for visible cracking. However, these are dynamic strains, and they do not include prestrains. Since no cracks were observed in the wallboard, the prestrains were probably less than 500 ~in/in.
Wallboard crack resistance is influenced by flexibility in end constraints such as nails. These end constraints do not efficiently transfer vibration energy from the superstructure to the wallboard. Accordingly, it was observed that cracks developed primarily in the plastered joints at wall corners and in plaster coverings over nailheads.
The strain level at first cracking of masonry walls is 770 to 7,700 ~n/in using a visual displacement nmge of 0.01 to 0.10 mm for joints 13 mm wide. For site strains observed at the test house to reach the 3,270-~in/in level observed by Crawford during a blast (31), particle velocities would have to exceed 0.75 in/s. It is not known whether a st~ain displacement cr.a...:~:_;_on _,~lvlLd
~· ~d f~. the propagation of steplike cracks across a wall, but research planned for 1984 by the National Bureau of Standards should provide additional insights.
SHAKER-INDUCED RESPONSE
The shaker program began immediately uron completion of the blasting work. Because of time constraints and the superstructure's resistance to low-level blast vibrations, plans were to operate the shakers at levels that would produce a structure response equivalent to the response caused by ground vibrations of 0.5 to 2.0 in/s. The response of the transducer at location A4 , high corner, east wall, was used to set shaker force. (See ff.gures 13 and 28.) Strain levels and the number of cycles to cracking were of primary interest, so each test was run until cracking was observed or ~ 100,000 cycles was reached. The house was shaken at a constant amplitude with a frequency sweep from 2 to 12 Hz before and after each test to find any changes in dynamic properties of natural frequency and damping.

22
20
18
16
c 14
' c
:1.. ~ 12 z
c::t 0::: t-(f) I 0
8
6
2
0
116 122 125
0
0
§
8 0
0 0
0
1.74 3.47 0.521
128
6.94
0
dB
130
0 · •.
. . ..
8.68
131 132 134
KEY
o Test house peak-to-peak response
135
Q Test house in-time response
• Sonic boom house I, strain gouge I ocotion H shown in figure 2,
peak-to-peak response
. . . · ....
10.4 12.2 13.9 15.6
AIR PRESSURE, lbf /in2x I0-3
41
17.4
FIGURE 31.- Wallboard strain versus airblast level at test house, with comparison to sonic boom
response.

42
I I
/.J-..~-,.._ I __ l___ .. .-- ..........
---FIGURE 3.(..- Sh"'"'' · ' "
..........
---
Bending
Shear (racking)
;e "'' walls (~).
Table 10 displays the shaker fatigue data in the order in
sweep and which the
tests were run. The house's response to sweeps 1 and 2 provided initial frequency and amplitude data which were used to estimate shaker force settings and confirm the type of superstructure and foundation excitation. Equivalent ground motions are also given in table 10; for each run, one equivalent is based on the response at A4 (high corner, east wall), and the other on the response at x8 (fig. 13). Based on the responses to the first 40 shots, a ground vibration amplification factor of 3 was employed (i.e., if a 0.5-in/s ground vibration equivalency was desired, the output at A4 , high corner, east wall, had to be 1.5 in/s). At frequencies other than resocance, the amplification factor would be less than .j.
TABLE 10. - Mechanical shaker program description
Ground vibra- Number Resonance Damp- Acceleration, G Test tion equiva- of Mode frequency, ing, At At Cycles
lency, 1 in/ s shakers excited Hz pet north south achieved A4 Ka gauge gauge
Sweep 1. NAp NAp 2 Translation 7.40 11.2 NA 0.15 8,000 Sweep 2. NAp NAp 2 Torsion •••• 9.35 5.9 NA .36 8,000 Sweep 3. NAp NAp 2 Translation 7.20 10.5 NA .28 8,000 Run 1 ••• 0.44 0.61 2 •• • do •••••• 7.20 NA 0.18 .26 100,192 Sweep 4. NAp NAp 2 • •• do •••••• 6.95 11.0 NA .26 8,000 Sweep 5. NAp NAp 2 Torsion •••• 8.65 NA NA .35 8,000 Run 2 ••• .55 • 71 2 •• • do •••••• 8.65 NA .31 .35 100,171 Sweep 6. NAp NAp 2 •• • do •••••• 8.30 NA NA .41 8,000 Sweep 7. NAp NAp 2 Translation 6.80 6.2 NA .42 8,000 Run 3 ••• .30 .29 21 Torsion •••• 7.00 NA .12 .24 60,000 Sweep 8. NAp NAp 21 ••• do •••••• 6.65 NA NA .36 8,000 Sweep 9. NAp NAp 21 ••• do •••••• 6.45 NA NA .46 8,000 Run 4 ••• .73 .49 21 •• • do ......... 6.45 NA .21 .44 60,070 Sweep 10 NAp NAp 21 •• • do •••••• 6.25 12.5 NA .42 8,000 Sweep ll NAp NAp 21 ••• do •••••• 5.90 NA NA .58 8,000 Run 5 ••• 1.1 .53 21 ••• do •••••• 5.90 NA NA .58 36,240 NA Not available. NAp Not applicable.
lBased on envelope line of strain (at site K2 in figure 13) or structure motion (at site A4 in figure 13; high corner, east wall) versus ground vibration data.
2At south end of test house only.

43
300~----~----~----~----~----~------~--~
0 0
250 0
0
200 0 c:
' c: 0 0 0 0 :::l
z 150 -
0 00
oo 0 0 0 0
<( ()""'
1-(/)
100
'b 0 0
£ 0 0 cl'
roo 0 0 0
8 0 0 8 0 0
0 0 Cb 0 oO 00 0 0 ooo oCb 00 0 00 o8 0 0
0 ~ 0 0 0 0 o oo ~ ese oo o o 0 0 0
o og o o o ~ 0 0
~ 8~ osc§ o ~ o 0 0 0 @ 0 0 ·tiia' 8 0 0 0 0 8 0 0
:~ ~<9' ~ 0
0 0 0
50
0 2 3 4 5 6 7 MAXIMUM GROUND VIBRATION, in/s
FIGURE 33 •• Wallboard and plaster strain versus maximum ground vibration.
Later cyclic tests varied from the planned approach because the shaker at the north end of the house failed prior to run 3. The level of excitation was readjusted for response variances caused by one driving shaker. While the desired 0.5Q-in/s ground vibration equivalency was attained for runs 1 and 2, the eccentricity of the only operating shaker (southend) was not changed for subsequent
runs, and the vibration equivalency dropped to - 0.30 in/s for run 3 (table 10). Runs 4 and 5 were also performed with only one shaker and hence produced predominately torsion. Thus, the responses at A4 , high corner, east wall, and K2 were not similar since K2 was located close to the instantaneous center of rotation.

44
600.-----~----~----~----~------~----~----~
c: ....... c: ::t.
500
400
~ 300 z <! a::: 1-(j)
100
0
0
0 0
0 0 OQ)
0 0
0
0
0
0
0 00
I 2 3
0 0 0
c -
0 0 0
4
0 0
0
0
0
0
5 6 7 MAXIMUM GROUND VIBRATION, in/s
FIGURE 34. • Wallboard tape joint strain versus maximum ground vibmtion.
The superstructure decreased in stiffness, as shown by the drop in natural frequency plotted in figure 38. In addition, flexure was observed at the small
areas of dimpled wallboard around nailheads; as previously indicated, the nailheads limited the transfer of energy to the strain-monitored sites.

14,000~----~----~----~----~----~----~----~
0
12,000
10,000 0
c:: ·-.......... 8,000 c::
:::t. ..
z -<l: 0
0:: :,coo t-
0 (j) 0
0 0 0
4,000 0 0 0 ~ 0
0 Co 0 cP 0
o o0 oo COoo 0 0 0 0 0 ~0 0 0 2,000 0 0 ooo
00 ° 8 ooocg?~g> 0 0
oO 0 0
0 ~i!~ & 0
8
0 2 3 4 5 6 7 MAXIMUM GROUND VIBRATION, in Is
FIGURE 35. • Block 1oint strain versus maximum ground vibration.

46
iO,OOO~----~----~----~----~------~----,-----~
9,000 0
8,000 0
7,000
6,000 ....
......... c: :t. 0
0 - 5,000 z -<r 0:::: 1-(/) 0 0
4,000 0 0 0 0 0
0 0 0
0 ('I 0
3,000 0 0 0
0
0 0 0 0 0
2,000 0 0
0 Oo 0 0 0
8 0 0
o oo 0ooo 0
0 0
I ,000 0 0 9 0 0 0
0 0 o o
oo o
0 2 3 4 5 6 7 MAXIMUM GROUND VIBRATION, in/s
FIGURE 36. • Brick veneer joint strain versus maximum ground vibration.

47
800~----~----~----~----~------~----~----~
700
600
c 500 ......... c :l
... z <{ 0::: 1-(f)
400
300
200
100
0
0 0
0
0
0
0
oo
0
0 0
0
0
0 0
0
o 0 o
2
0 0
0
0
0
0
0
0
0
0
0
3
0
0
0
0 0
0
0 0
4 5 6 7
MAXIMUM GROUND VIBRATION, in/s FIGURE 37. • Fireplace brick joint strain versus maximum ground vibration.
CRACKING OBSERVED IN TEST HOUSE
The methods used to observe cracking in the house depended on a number of factors. Regardless of the material, the first cracks became visible at widths of
around 0.01 to 0.1 mm. The minimum widths at which cracks were detected varied, depending on the inspector and whether or not the trouble light was properly used. Cracks were difficult to find without proper sidelighting, and

48
N J:
~ u z w ::> 0 w 0:: Ll...
10
9
8
7
6
I I 1KEY
I
\ 6. Lowest torsional
1-frequency -
5s 0 Lowest translational
5f\Rz frequency
5 Frequency sweep
- R Run -
~ 53 ·R 1- 5~7 -
~9 58 R
1- 5~s,,-
I I I I
1,000 2,000 3,000 4,000 5,000 APPLIED DYNAMIC FORCE PER SHAKER, lbf
FIGURE 38. • Resonance frequencies versus app I ied dynamic force during shaker tests.
many that were found probably would not have been noticed by homeowners. With normal environmental cycling, these cracks widened over time and became claarly visible without sidelighting. CraCking at block joints was extremely difficult to quantify, since most areas already had shrinkage separation at the joints, as was found during the initial inspection. During blasting, one inspector examined specific areas in the concrete block basement for cracks, but various inspectors performed the semimonthly observations over the whole area. As a consequence, the concrete block craCking reports were disregarded for the semimonthly analysis.
Blast-Induced Cracking
Cracks observed from blasting are listed in table 11. These were determined
from preblast and postblast inspections conducted within 1 h of shooting. Corner crack extensions appeared after shot 89, which produced a peak ground vibration of 0.88 in/s. With respect to cracking, wallboard corner joints were found to be the weakest areas in the test house. As previously mentioned, corner cracks are also caused by human activity in conjunction with material drying and shrinkage. At peak ground vibrations ranging from ~ 1.8 to 2.2 in/s, cracking of wallboard was limited to joint compound over nailheads.
Local cracks in masonry walls were observed at interfaces of mortar joints and bricks or concrete blocks at peak ground vibrations of ~ 3.4 and 6.2 in/s, respectively (table 11). A diagonal steplike crack in th~ southeast basement wall, starting at ground height and proceeding upwards, was observed after shot 48. At the time shots 45-48 were detonated, their vibration levels (ranging from ~ 1.0 to 1.5 in/s) were the highest recorded in the study. But because observation of cracks in masonry is difficult, it remains unknown whether blasting or other events caused this steplike crack.
Widening of wallboard and masonry cracks was observed to occur from both blasting and natural events. Often, barely visible cracks became clearly visible due to overnight environmentally induced stresses or upon inspection following a shot. It was not until shot 126 that blasting widened a crack beyond the width that would have occurred in the absence of a blast. The peak ground vibration for this shot was 6.94 in/s.

49
TABLE 11. - Cracks observed after blasting
Shot Ground vibration level, in/s Crack observation Vertical East-west North-souch
45 . ..••.•••.• 46 . .•.•.••.•• 4 7 ••••••••••• 48 . •••.....••
82 • ••••••••••
83 . ..••...••• 84 . ...•••.•••
86 . •••.•..••• 89 • ....•..••. 97 • •••..•••••
101 • •••••••••• 102 • •••••••••• 114 • •••••••••• 115 • •••••••••• 126 ••••.••••.•
0.38 .44 .48 .48
2.21
3.05 2.17
-
• 85 .40
1.17
3.12 4.77 3.33 6.19 6.19
NA Not available.
1.03 0.54 1.32 .71 1.47 .71
.96 .49
1.41 1.75
2.75 1.64 2.01 1.44
1.34 1.15 .88 .78
1.11 1.81
3.52 2.19 3.21 4.25 3.43 NA 6.22 3.52 6.94 5.27
Diagonal steplike crack in concrete block wall. Found during detailed inspection after shot 48; unknown if existed prior to shots 45-58.
Crack in joint compound over nailhead.
Corner crack extension. Crack in joint compound over nailhead.
2 corner crack extensions • Corner crack extension. Crack in joint compound over nailheaCI.
Corner crack extension. Plywood subfloor crack.l Brick veneer mortar joint crack. Basement block mortar joint cracks. Chimney mortar cracks, all sides. Basement block mortar joint separa-tion; minor damage.
lTest house had subfloor only--no underlaymen~ or finish floor.
Shaker-Induced Cracking
Cracking produced by mechanical cyclic loading is presented in table 12. As noted in the discussion of shaker-induced structure response, most wallboard cracking (other than at the corners) was limited to joint compound over nailheads. Additionally, one taped joint failed, and several brick and block mortar-joint crack extensions occurred. The total number of cycles for each occurrence of craCking, the last column of table 12, is based on the estimated total cycles induced by 2 yr of daily environmental changes (700), human activities (300),
blasting at levels >- 0.5 in/s (500), and sweep tests (2,500/sweep at levels >- 0.5 in/s).
Since no strain gauges were installed at the site of the taped-joint crack, the dynamic shaker strain and prestrain levels are not known. However, data from the shaker tests (table 12) and the single fatigue test of wallboard discussed in appendix A (table A-6) confirm that many loading cycles are needed fatigue when wallboard is cyclically loaded at vibration levels equivalent to < 1 in/s ground vibration.

50
TABLE 12. - Cracks observed after shaker excitation
Shaker vibration equivalency 1 and crack description
Run 1, ~ 0.5 in/s: Entryway tape joint crack •••••••••••• Crack in joint compound over nailhead in master bedroom .•.••..••..........
Fireplace mortar joint crack extension3••••••••••••••••••••••••••
Run 2, ~ 0.5 in/s: Chimney trim broken loose from siding3 .........••......••.•..•..•..
Mortar joint crack at top of chimney. Run 3, ~ 0.3 in/s:
Brick veneer mortar joint cracks ••••. 4 cracks-in joint compound over nailheads ••••••••••.••••••••••••••••
Run 4, ~ 0.75 in/s: Vertical crack through brick veneer morta: ••••••••••••••••••••••••••••••
Cracks in joint compound over nailheads ••••••••••••••••••••••••••.
Basement block mortar joint crack extensions ••••• ~••••••••••••••••••••
Run 5, ~ 1.0 in/s: Brick veneer mortar falling out •••••• Basement block mortar joint crack extensions ••••••••••••••••••••••••••
Crack in wallboard •••••••••••••••••••
Number of cycles at cracking Run Tota1 2
52' 000
52,000
52,000
>1 >1
15,000
25,000
14' soc
60,000
>1
>1
>1 22,000
56,000
56,000
56,000
>1 08' 500 > 108' 500
229' 500
239,000
293,500
339,500
>339' 500
>339,500
>339, 500 361' 500
lBased on envelope response from plot of ground vibration versus structure motion at site A4 (fig. 13), high corner, east wall, as structure was at resonance.
2At vibration equivalency of~ 0.~ in/s; including cycles induced by blasting and frequency sweeps.
3cracking suspect becausr superstructure was racked against normally foundation-driven fireplace.
Shaker-induced masonry cracking occurred at brick or block mortar-joint interfaces. As mentioned, visible cracking is observed at displacements of 0.01 to 0.1 mm, which correspond to strains of 770 and 7,700 ~in/in across joint widths of 13 mm. As is discussed in appendix A, overall wall integrity is heavily dependent on workmanship, and cracks of this width (0.01 to 0.1 mm) will inevitably be found after construction (32-34). Additional causes of cracks thig- size are mortar shrinkage, natural events, and/or vibrations. No steplike crack propagations were observed across brick or block walls. The existing st~plike crack in the southeast basement wall (discussed in
"Blast-Induced Cracking" section) functioned as an area of strain relief during shaker runs. Energy transmitted by the shakers into the superstructure and foundation was dissipated in areas of previous cracking. Therefore, new cracks observed during the shaker tests were primarily extensions of cracks that had already occurred.
Long Term Cracking Observations
Cracks observed in the test house during the semimonthly inspections are listed in table 13. Th~ crack rate, or number of new cracks per inspection, along with the number of blasts that produced

51
TABLE 13. - Cracks observed during semimonthly inspections
Brick Fireplace Wallboard Nail Inspection period Date veneer chimney Wallboard joints Corners pops
joints joints Initial •••••••••• 10/18/79 20 21 3 2 6 5
1 ••••••••••••••• 10/30/79 ND 8 ND ND ND ND 2 • •••••••••••••• 11/13/79 ND ND ND ND 6 ND 3 ••••••••••••••• 11/27/79 ND ND ND ND ND ND 4 • •••••••••••••• 12/13/79 ND ND ND ND ND ND 5 • •••••••••••••• 12/28/79 ND ND 1 ND ND ND 6 • •••••••••••••• 1/ 9/80 3 ND ND ND 4 ND 7 • •••••••••••••• 1/24/80 ND ND ND ND ND ND 8 • •••••••••••••• 2/12/80 ND ND ND ND ND ND 9 • •••••••••••••• 2/26/80 ND ND ND ND ND ND
10 • ••••••••••••• .,_ 3/13/80 ND ND 1 3 ND ND 11 • •••••••••••••• - 3/27/80 ND 1 ND ND 3 ND 12 • •••••••••••••• 4/10/80 ND ND ND ND 1 ND 13 • •••••••••• 1o ••• 4/25/80 ND ND ND ND ND ND 14 • •••••••••••••• 5/ 7/80 ND ND ND ND 2 ND ' - 5/22/80 6 I''•) NT: 1 38 ND ~ .............. 16 • •••••••••••••• 6/ 6/80 ND ND ND ND 1 ND 17 • •••••••••••••• 6/25/80 ND ND ND ND 1 ND 18 • •••••••••••••• 7/15/80 ND ND ND ND 0 ND 19 • •••••••••••••• 7/30/80 ND ND ND ND 1 ND 20 • •••••••••••••• 8/19/80 ND ND ND 1 2 ND 21 • •••••••••••••• 8/28/80 ND ND ND ND 1 ND 22 • •••••••••••••• 9/15/80 ND ND ND ND 5 ND 23 • •••.••••••••.• 9/30/80 ND ND ND ND ND ND 24 • •••••••.•••••• 10/10/80 ND ND ND ND 1 ND 25 • •••••••••••••• 10/24/80 ND ND ND ND ND ND 26 ••••••••••••••• 11/11/80 ND ND ND ND ND ND 27 ••••••••••••••• 11/21/80 ND ND 1 ND 5 ND 27 1 •••••••••••••• 12/ 1/80 ND ND ND ND 2 ND 28 ••••••••••••••• 12/ 9/80 ND ND ND ND 5 ND 29 • .••••••••••••• 12/17/80 ND ND ND ND 2 ND 30 ••••••••••••••• 1/13/81 ND ND 1 ND 1 ND 31 ••••••••••••••• 1/27/81 ND ND 2 1 ND ND 32 •• ••••••••.•••• 2/13/81 6 ND ND ND ND ND 33 ••••••••••••••• 3/ 3/81 ND ND ND ND ND ND 34 ••••••••••••••• 3/18/81 ND ND ND ND ND 1 35 ••••••••••••••• 4/14/81 ND ND ND ND ND ND 36 ••••••••••••••• 4/28/81 5 1 ND ND ND ND 37 ••••••••••••••• 5/28/81 ND ND ND ND ND ND 38 ••••••••••••••• 6/18/81 ND ND ND ND ND ND 39 ••••••••••••••• 7/ 1/81 ND ND ND ND ND ND 40 ••••••••••••••• 7/16/81 ND ND ND ND ND ND 41 • •••••••••••••• 7/30/81 ND ND ND ND ND ND 42 1 •••••••••••••• 8/14/81 ND ND ND ND 1 ND 42 ••••••••••••••• 8/18/81 ND ND ND ND 1 ND 43 ••••••••••••••• 8/28/81 ND ND ND ND ND ND 44 ••••••••••••••• 9/17/81 ND ND ND ND ND ND 441 •••••••••••••• 9/23-25/81 8 ND ND ND 3 1 45 ••••••••••••••• 10/ 1/81 ND ND ND ND 1 ND 46 •••••••..•••••• 10/15/81 ND ND ND ND ND ND 4 7 ••••••••••••••• 11/ 3/81 ND ND ND ND 2 5
ND None detected. 1Dynamic blast inspection.
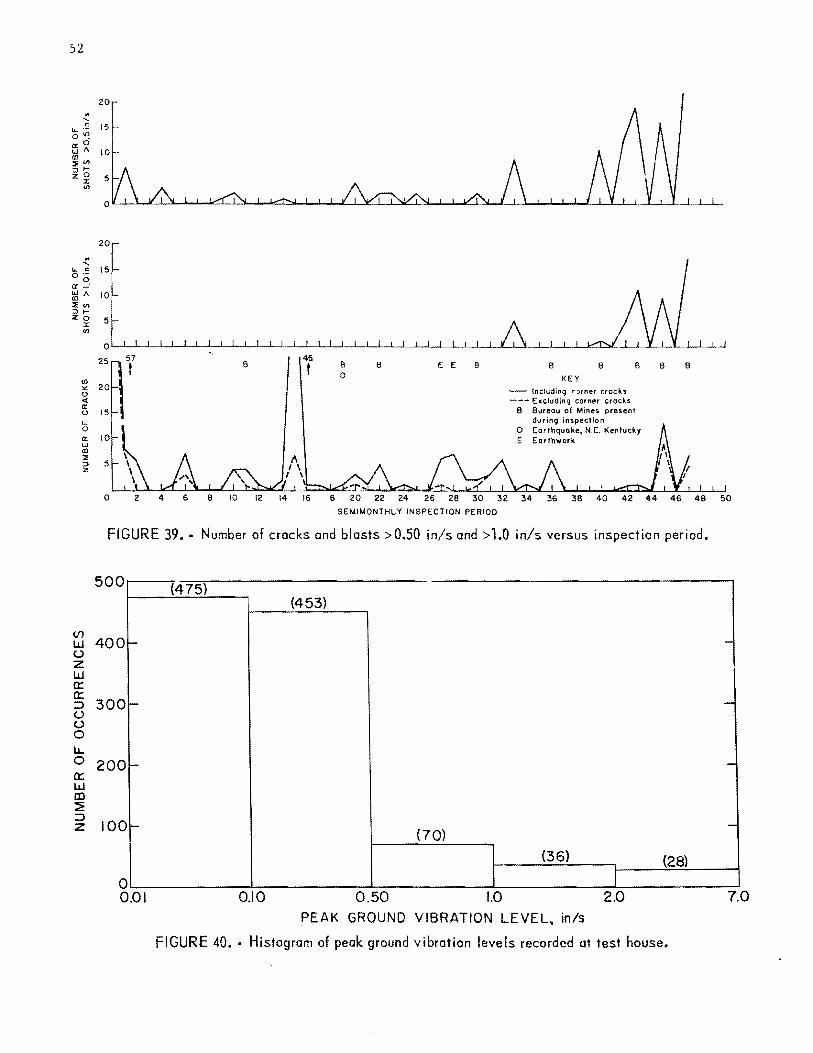
52
.. ' " I.L ·-
o"< a:O w" "' ::."' ::::>1-zO
:X:
"'
.. .... I.L " 0 ·-
0 a:....:
~" ::.., ::::>1-z ~ 5
"'
<f}
"' ()
< a: u u. 0 a: w
"' ::. ::::> z
0
B 45
t B 0
B E E B
SEMIMONTHLY INSPECTION PERIOD
8 B
KEY
- Including ; ::~rner crocks --- E -.eluding corner crocks
B Bureau of Mines present during Inspection
B
0 Earthquake, N.E. Kentucky E Earthwork
B B
FIGURE 39. • Number of crocks and blasts >0.50 in/sand> 1.0 in/s versus inspection period.
(/')
w u z w a:: a:: =.l u u 0 lJ... 0 a:: w lD ::?! =.l z
500
400 I-
300 1--
200 -
100 1-
0 0.01
(475) (453)
(70)
(36) (28) J
0.10 0.50 1.0 2.0 PEAK GROUND VIBRATION LEVEL, in/s
FIGURE 40. • Histogram of peak ground vibration levels recorded at test house.
50
-
-
-
-
7.0

ground vibrations >0.50 in/s and >1.0 in/s, is shown in figure 39. The histogram of all peak ground vibration levels is shown in figure 40. The ground vibratiun levels were either recorded by the self-triggering equipment or back calculated using propagation equations in the 0.01- to 0.10-in/s range. (Of the 475 vibration levels in this range, 250 were calculated.)
Some of the crack rates shown in figure 39 include small hairline corner cracks, and some do not. The majority of corner cracks occurred in the first 8 months. Cracks were found in nearly every corner in the house, but were ignored up to inspection period 15. Then it was decided to rigorously observe them despite their miniscule size. Corner cracks are an inevitable consequence of the curing of the tape compound and are enhanced by dynamic strains induced by human activity.
Differences were found in the number of cracks observed by the two teams of inspectors (VME and Bureau personnel) during periods 1, 15, and 36. The most pronounced difference was for period 15. The decision to include small corner cracks was made after VME had completed ita inspection for that period but before the Bureau had completed its inspection for period 15. Otherwise, differences in the number of cracks observed were an inevitable consequence of the difficulty of observing hairline-width (0.01 to 0.1 mm) cracks. Periods 1, 15, and 36 were omitted in calculations of crack rates. Periods with unusual external influences, including an earthquake and soil removal by a scraper 40 ft from the test house, were included. The selftriggering seismograph recorded a 0.06-in/s vibration for the scraper activity but did not trigger during the earthquake. Strain measurements did not vary from normal fluctuations during the earthquake.
53
Crack rates during periods of high- and low-level ground vibration are compared in table 14. Two methods were used for interpreting this data. In the first, it was assumed that blasting is fatiguedamaging in nature (i.e., it lowers strain levels necessary for failure). In the second method, it was assumed that blasting produces a triggering strain (which when added to an existing strain exceeds the critical strain). The first method required investigation of consecutive inspection periods, since high crack rates may occur even during nonblast periods. For both methods, a ground vibration level of 0.5 in/s was chosen as the lowest vibration level for study because a 0.59-in/s vibration was found to produce the same strain level as normal household activities (table 9). Avelocity of 1.n in/s was chosen for the upper bound because there were insufficient data at higher levels.
The number of new cracks per week did not increase with time, indicating that blast vibrations do not cause fatiguerelated damage. Results interpreted using the second method indicated that ground ~ibrations >1.0 in/s were associated with crack rates of 1.8 cracks per week, while vibrations <1.0 in/s were associated with rates of 0.9 cracks per week. The increase in crack rate with 6round vibration level indicates that blasting does produce a triggering strain, at about 1.0 in/s.
The low crack-formation rates reported are reasonable since the test house was new, showed no differential settlement, and was not regularly occupied. These conditions result in low natural crackformation rates, which allow the greatest sensitivity to the appearance of only a few blast-related cracks. In other words, the low natural crack rates found in these tests allowed a few blastrelated cracks to significantly affect crack-formation rates.

54
TABLE 14. - Crack rate versus blast vibration level
Blast vibration level, in/s Inspection periods! Number of cracks per week2
Total I Excluding corner cracks
METHOD 1 (FATIGUE DAMAGING; ACCUMULATIVE WEAKENING OF MATERIAL) >1.0 ••••••••••••••••••••••••• 40-47 <1.0......................... 1-14
16-32 >0.5, <1.0................... 1-14
20-32
1.4 0.88 1.2 (0.96) .61 (0.35) 1.1 .35 1.2 (.96) .61 (.35) 1.4 .46
METHOD 2 (TRIGGERING EFFECT; SUM OF DYNAMIC AND EXISTING STRAIN IN EXCESS OF THRESHOLD)
>1.0 ••••••••••••••••••••••••• 33, 40, 42-43, 45, 47 ~1.0 ••••••••••••••••••••••••• 1-14, 16-32, 34-35, 37-39,
1.8 .94 (0.86)
1.0 .38 (0.29)
- 41, 44, 46 >0.5, <1.0.................... 1, 4, 9-10, 14, 20, 22-23, 1.2 ( .89) .70 (.33)
25, 30 <.so ••••••••••••••••••••••••• 2-3, s-s, 11-13, 16-19, 21, .84 .28
24, 26-29, 31-32, 34-35, . 1 3/-39, til, 44, 46
--~1P~e-r~i~ods listed in table 13; 2 weeks each. 2values in parentheses are rates calculated without period-! data to account for
cracks resulting from curing after construction.
SUMMARY AND CONCLUSIONS
A full-scale residential test house was subjected to 2 yr of vibration produced by ~adjacent surface mining. For the first time, the strain response of a house was fully documented. Long term strain measurements allowed the blastinduced strains to be compared with those produced by changes in environmental factors such as temperature, humidity, and human activity. Continued visual inspections for cracks during the 2-yr period allowed the calculation of crackformation rates for correlation with vibration levels. After the study of blast-induced cracks was completed, the entire house was shaken mechanically to determine the threshold of fatigue cracking of the wall coverings. Laboratory tests were conducted to aid in evaluation of the field observations. The following conclusions are based upon the observations made during this full-scale field study:
Crack Appearance
Numerous hairline cracks, ~ 0.01 to 0.1 mm wide, appeared in the test house during construction. Cracks of this size
are difficult to see and are usually not noticed by the homeowner. Wallboard cracks from blasting occurred primarily in corners and around nailheads in the joint compound. One hairline crack in a wall corner extended after a blast that produced a peak ground vibration of 0.88 in/s. This was the lowest observed vibration that modified an existing crack pattern. Wallboard cracks also appeared, widened, and/or extended during periods of no blasting. Thus, other phenomena also caused, widened, and extended these cracks. Therefore, observations of cracking are better evaluated in terms of the number of new cracks observed per time interval rather than the · number of cracks seen at a single inspection.
Blast-induced local masonry cracking along mortar joint and block interfaces was hard to distinguish from the numerous preexisting cracks that resulted from shrinkage and workmanship. A diagonal steplike crack across the southeast basement wall, which was found after four shots ranging from 1.0 to 1.5 in/s, was more readily observed.

Strains Associated With Cracking
Laboratory tests and previous studies indicate that the initial paper failure of gypsum wallboard occurs at a strain of approximately 1,000 ~in/in and that visible cracks appear at strains slightly beyond this point. Concrete block shows visible localized cracks at mortar-joints strains of approximately 3,000 ~in/in when a gauge width of 13 mm is used. Global strain appears to be the best predictor of diagonal steplike cracks. Confirmation of these results and further definition of threshold levels are anticipated from wall testing planned by the National Bureau of Standard (NBS) for fiscal 1984.
Wa'1 Strains Associated With .C:nv .l..conmental Factors
Temperature- and humidity-induced strains across wallboard taped joints were as high as 149 and 385 ~in/in. Door slamming produced strains of up to 140 ~in/in in wallboard.
Wall Strains Associated With Blasting
The smallest ground vibrations that would produce the equivalent of environmental and door-slamming strains in walls are 1.2 and 0.5 in/s, respectively.
Fatigue Tests--Wall Board
Mechanical vibration cracked a wallboard tape joint after 52,000 cycles of
55
motion at strain levels in the house equivalent to those resulting from a blBst with a peak ground vibration of ~ 0.5 in/s. Adding 4,000 cycles for environmentally induced strains brings the number of cycles at failure to 56,000. Assuming 200 workdays per year x 2 shots per day x 5 cycles per shot, this shaking was equivalent to subjecting the house to 28 yr of blasting twice a day.
Fatigue Tests--Masonry Walls
Because of the cracked condition of the masonry walls at the test ho1.tRe, cyclic tests were conducted with NBS using other test walls. Fatigue effecte appeared minor untll stress levels were near ultimate cdpacity, but further analysis awaits the 1984 tests mentioned €oai:lieL •
Crack Rate
Threshold-type cracks appeared with and without blasting. Therefore, changes in the rate of threshold crack occurrences are better indicators of the effects of blasting on cracking than observations of individual cracks. The tate of thres~old cracking when ground motions were <0.5 in/s was not significantly different than when motions were between 0.5 and 1.0 in/s. However, when ground motions exceeded 1.0 in/s, the rate of crack formation was more tha~ three times the rate observed when motions were <1.0 in/s.
REFERENCES
1. Siskind, D. E., V. J. Stachura, M. S. Stagg, and J. W. Kopp. Structure Response and Damage Produced by Airblast From Surface Mining. BuMines RI 8485, 1980, 111 pp.
2. Siskind, D. E., M. S. Stagg, J. W. Kopp, and C. H. Dowding. Structure Response and Damage Produced by Ground Vibration From Surface Mining Blasting. BuMines RI 8507, 1980, 74 pp.
3. Andrews, D. K., G. W. Zumwalt, R. L. Lowery, J. W. Gillespie, and D. R. Low. Structure Response to Sonic Booms. (U.S. FAA contract FA-64-AC-6-526, Andrews Associates Inc. and Hudgins, Thompson, Ball and Associates Inc., Oklahoma City, OK). Rep. AD610822, Feb. 5, 1965, 228 pp.; available from Defense Documentation Cent., Cameron Sta., Bldg. 5, 5010 Duice St., Alexandria, VA 22314.

56
4. Crockett, J. H. Presentation of Structural Failures by Repeated Vibration Loading. Paper in Proc. Int. Conf. on Performance of Building Structures, Glasg:w Univ., Mar. 31-Apr. 1, 1976. Pentech Press, 1976, pp. 201-228.
5. Dowding, C. H., W. K. Beck, and D. K. Atmatzidis. Blast Vibration Implications of Cyclic Shear Behavior of Model Plaster Panels. Geotech. Testing J., ASTM, v. 3, No. 2, June 1980, PP• 80-88.
6. Leigh, B. R. Lifetime Concept of Plaster Panels Subjected to Sonic Boom. University of Toronto, Canada, UTIASTN-191, July 1947-, 78 pp.
7. Hidalgo, P. A., R. L. Mayes, H. D. McGiven, R. W. Clough. Cyclic Loading
~s of MasonrJ Single Piers. Height to Width Ratio of 0.5, v. 3. Coll. Eng., Univ. CA, Richmond, CA, Rep. UCB/EERC-79/12 (to Natl. Sci. Found., May 1979, 144 pp.; NTIS PB 301 321.
8. Koerner, R. M., and J. L. Rosenfarb. Feasibility of Fatigue Assessment of Block Walls From Laboratory Scale Methods. (contract J0285013). BuMin~s OFR 144-80, 1980, 96 pp.; NTIS PB 81-140139.
9. Mayes, R. L., Y. Omote, and R. w. Clough. Cyclic Shear Tests of Masonry Piers. Test Results, v. 1. Col!. Eng., Univ. CA, Berkeley, CA, Rep. EERC 76-8 (to Natl. Sci. Found.), May 1976, 84 pp.; Springfield, VA, NTIS PB 264 424.
10. McNatt, J. Dobbin. Design Stresses for Hardboard-Effect of Rate, Duration, and Repeated Loading. For. Prod. J., v. 20, No. 1, PP• 53-59.
11. Woodward, K. A., and F. Rankin. Behavior of Concrete Block Masonry Walls Subjected to Repeated Cyclic Displacements. NBSIR 83-2780, 1983, 178 pp.; NTIS PB 84-122092.
12. Sabnis, G. M. Vibrations of Concrete Structures. Introduction and Background. Am. Concrete Inst., SP-60, 1979, pp. 1-12.
13. Tuomi, R. L., and W. J. McCutcheon. Testing of a Full-Scale House Under Simulated Snowloads and Windloads. USDA Forest Service Res. Paper FPL 234, 1974, 32 pp.
14. Warwaruk, J. Vibrations of Concrete Structures. Defection Requirements--History and Background Related to Vibrations. Am. Concrete Inst., SP-60, 1979, PP• 13-41.
15. Whittemore, H. L., J. B. Cotter, A. H. Stang, and v. B. Phelan. Strength of Houses--Application of Engineering Principles to Structural Design. NBS Bldg. Mater. and Structures Rep. BMS 109, Apr. 1948, 131 pp.; NTIS Com-73-10986.
16. Crist, R. A., and J. A. Shaver. ~' • 1-~ >:ms Concrete Structures. Deve~-~ment of Model Performance Criteria for Deflection of Concrete Floors. Am. Concrete Inst., SP-60-3, 1979, pp. 43-66.
17. International Standards Organization. Guide for the Evaluation of Human Exposure to Whole-Body Vibration. ISO 2631-1978 (E), 1978, 15 pp.
18. American National Standards Institute. Guide to the Evaluation of Human Exposure to Vibration in Buildings. ANSI S3.29-1983 (Acoust. Soc. Am., ASA 48-1983), 1983, 10 PP•
19. Beck, w. K. Fatigue Cracking of Drywall To Model Blast Loading. M.S. Thesis, Northwestern Univ., Evanston, IL, June 1979, 131 PP•
20. Building Research Cracking in Buildings. 1975, pp. 1-7.
Establishment. Dig. 75, Oct.
21. Thoenen, J. R., and S. Seismic Effects of Quarry BuMines 442, 1942, 83 pp.
L. Windes. Blasting.
22. Wiggins, J. H., Jr. Effects of Sonic Boom. J. H. Wiggins, July 1969, 174 pp.

23. Brun, R. w., R. C. Speck, W. C. McCann, and 0. S. Cecil. Survey of Ground Surface Conditions Affecting Str'lCtural Response to Subsidence. (contract J0295014, GAl Consultants, Inc.). BuMines OFR 12-84, 1983, 602 pp.; NTIS PB 84-1555860.
24. Byrd, V. Effect of Relative Humidity Changes During Creep on Handsheet Paper Properties. Tappi, v. 55, No. 2, pp. 247-252.
25. Effect of Relative Humid-ity Changes on Compressive Creep Response of Paper. Tapp~, v. 55, No. 11, pp. 1612-1613.
26. Wink, W. A. tive Humidity and Properties. Tappi, 171A-178A.
The Effect of RelaTemperature on Paper v. 44, No. 6, pp. ·
27. Holmberg, R., N. Lundberg, and G. Rundqvist. Ground Vibration and Damage Criteria. Construction Res. Council, Stockholm, Sweden, Rep. R 85:81, 1981, 30 pp.
28. Wall, J. R., Jr. Seismic-Induced Architectural Damage to Masonry Structures at Mercury, Nevada. Bull. Seismol. Soc. Am., v. 57, No. 5, PP• 991-1007.
29. Ground graph 1980,
Stagg, M. s., and A. J. Engler. Vibration Measurement and SeismoCalibration. BuMines RI 8506,
62 pp.
30. Stachura, V. J., D. E. Siskind, Airblast Instrumenta
Techniques for SurBuMines RI 8508,
and A. J. Engler. tion and Measurement face Mine Blasting. 1981, 53 PP•
31. Crawford, R., and H. S. Ward. Dynamic Strains in Concrete and Masonry Walls. Can. Natl. Res. Council, Div. Bldg. Res., Ottawa, Ontario, Bldg. Res. Note 54, Dec. 1965, 13 PP•
32. Cranston, w. B. Masonry Research and Codes in the United Kingdom. Paper in Earthquake Resistant Masonry Construction: National Workshop (NBS, Boulder,
57
CO, Sept. 13-16, 1976), ed. by R. A. Crist and L. E. Cattaneo, NBS Bldg. Sci. Series 106, Sept. 1977, pp. 166-176.
33. Green, D. G., I. A. Macleod, and w. G. Stark. Observation and Analysis of Brick Structures on Soft Clay. Paper in Proc. Int. Conf. on Performance of Building Structures, Glasgow Univ., Mar. 31-Apr. 1, 1976. Pentech Press, 1976, PP• 321-336.
34. Wroth, c. P. General Report Session IliA: Response of the Structure to Foundation Movements. Paper in Proc. Int. Conf. on Performance of Building Structures, Glasgow Univ., Mar. 31-Apr. 1, 1976. Pentech Press, 1976, pp. 489-508.
35. Wiss, ~. F., and H. R. Nicholls. A Study of Damage to a Residential Structure From Blast Vibrations. Res. Council for Performance of Structures, ASCE, New York, 1974, 73 PP•
36. Scott, J. L. (U.S. Gypsum Co.). Physical Properties--1/2" Gypsum Panels. Private communication, 1982; available upon request from M. S. Stagg, BuMines, Minneapolis, MN.
37. Brezinski, J. P. The erties of Paper. Tappi, v. PP• 116-128.
Creep Prop-39, No. 2,
38. Coleman, B. D. Time Dependance of Mechanical Breakdown Phenomena. J. Appl. Phys., v. 27, No. 8, pp. 862-866.
39. Coleman, E. I. Application of the Theory of Absolute Reaction Rates to the Creep Failure of Polymeric Filaments. J. Polym. Sci., v. 20, 1956, pp. 447-455.
40. Fulmer, G. E., and J. L. Guthrie. Flex Life and Long Term Strength of Composite Materials. J. Appl. Polym. Sci., v. 13, 1969, pp. 445-458.
41. Guthrie, G. E., and G. E. Fulmer. Characterization of Saturated Cellulosic Webs by the Creep Failure Method. Tappi, v. 52, No. 11, pp. 2181-2190.

58
42. Kallmes, 0., G. Bernier, M. Perez. A Mechanistic Theory of the LoadElongation Properties of Paper (in four parts). Pap. Techno!. and Ind., v. 18, Nos. 7-10, 1977, pp. 222-228, 243-246, 283-285, 328-331.
43. Prevorsek, D., and W. James Lyons. Fatigue Fracture in Fibrous Polymers as a Brittle, Crack-Nucleation Process. J. Appl. Phys., v. 35, No. 11, PP• 3152-3164.
44. Seth, R. S. Measurement of Fracture Resistance of Paper. Tappi, v. 62, No. 7, PP• 92-9?~
45. R. H. Akker.
Wink, w. A., K. W. Hardacker, Van Eperen, and J. A. Van Den The Effect of Initial Soan on the
Ht:a~:>Ur~d T~::~: __ _ . ,_,;: Paper. Tappi, v. 47, No. 1, pp. 47-54.
46. Fattal, S. G. The Capacity of Unreinforced Masonry Walls Under Membrane Loads. Paper in Earthquake Resistant Masonry Construction: National Workshop (NBS, Boulder, CO, Sept. 13-16, 1976), ed. by R. A. Crist and L. E. Cattaneo, NBS Sci. Series 106, Sept. 1977, pp. 177-197.
47. Fattal, s. G., and L. E. Cattaneo. Structural Performance of Masonry Walls Under Compression and Flexure. NBS Bldg. Sci. Series 73, June 1976, 65 PP•
48. Hegemier, G. A., G. Kushnamoorthy, and R. 0. Nunn. An Experimental Study of Concrete Masonry Under Seismic-Type Loading. Paper in Earthquake Resistant Masonry Construction: National Workshop (NBS, Boulder, CO, Sept. 13-16, 1976), ed. by R. A. Crist and L. E. Cattaneo, NBS Sci. Series 106, Sept. 1977, PP• 114-153.
49. Mayes, R. L., and R. W. Clough. State-of-the-Art in Seismic Shear Strength of Masonry--An Evaluation and Review. Coll. Eng., Univ. CA, Berkeley, CA, Rep. EERC 75-21 (to Nat. Sci. Found., Oct. 1975, 137 pp.; NTIS PB 249 040.
50. Mayes, R. L., R. W. Clough, andY. Omote. Seismic Research on Masonry. Paper in Earthquake Resistant Masonry Construction. National Workshop (NBS, Boulder, CO, Sept. 13-16, 1976), ed. by R. A. Crist and L. E. Cattaneo, NBS Sci. Series 106, Sept. 1977, pp. 61-90.
51. Mayes, R. L., R. W. Clough, Y. Omote, and S. W. Chen. Expected Performance of Uniform Building Code Designed Masonry Buildings. Paper in Earthquake Resistant Masonry Construction: National Workshop (NBS, Boulder, CO, Sept. 13-16, 1976), ed. by R. A. Crist and L. E. Cattaneo, NBS Sci. Series 106, Sept. 1977, PP• 91-113.
5~. Omote, Y., R. L. Mayes, S. W. Chen, and R. W. Clough. A Literature Survey--Transverse Strength of Masonry Walls. Coll. Eng., Univ. CA, Berkeley, CA, Rep. UCB/EERC-77/07 (to U.S. Dep. Hous. and Urban Dev.), Mar. 1977, 137 pp.; NTIS PB 277 933.
53. Whittemore, H. L., A. H. Stang, and D. E. Parsons. Structural Properties of Six Masonry Wall Constructions. NBS Eldg. Mater. and Structures Rep. BMS 5, Nov. 1938, 31 pp.; NTIS Com-73-10943.
54. Structure Properties of Two Brick-Concrete-Block Wall Constructions and a Concrete-Block Wall Construction. (Sponsored by Natl. Concr. Masonry Assoc.). NBS Bldg. Mater. and Structures Rep. BMS 32, Nov. 2, 1939, 21 pp.; NTIS COM-73-10948.
55. Yokal, F. Y., R. G. Mathey, and R. D. Dikkers. Strength of Masonry Walls Under Compressive and Transverse Loads. NBS Bldg. Sci. Series 34, Mar. 1971, 74 pp.
56. Mayes, R. L., and R. W. Clough. A Literature Survey--Compressive, Tensile, Bond and Shear Strength of Masonry. Col!. Eng., Univ. CA, Berkeley, CA, Rep. EERC 75-15 (to Nat. Sci. Found.), June 1975, 199 pp.; NTIS Service, Springfield, VA, PB 246 292.
57. Haldane, D. The Importance of Cracking in Reinforced Concrete Members. Paper in Proc. Int. Conf. on Performance of Building Structures, Glasgow Univ., Mar. 31-Apr. 1, 1976. Pentech Press, 1976, PP• 99-109.
58. wood. fects neer, 546.
Edwards, A. T., and T. D. NorthExperimental Studies of the Ef
of Blasting on Structures. Engiv. 210, Sept. 30, 1960, PP• 538-
59. Northwood, T. D., R. Crawford, A. T. Edwards. Blasting Vibrations Building Damage. Engineer, v. 215, 5601, May 31, 1963, pp. 973-978.
and and No.
60. Atkins, K. P., Jr., and D. E. Dixon. Vibrations of Concrete Structures. Concrete Structures and Construction Vibrations. Am. Concrete lnst., SP-60-10, 1979, pp. 213-247.
61. Woodward, K. (NBS). Private communication, 1983; available on request
59
from M. S. Stagg, BuMines, Minneapolis, l1N.
62. Nelson, W. H. Movement of Building Element Cracks in Six Mercury Nevada St~uctures. (U.S. AEC contract At(26-1)-99, John A. Blume and Associates, Res. Div.). Rep. NVD-99-20, Dec. 1957, 45 pp.
63. Lenczner, D. Creep and Moisture Hovements in Brickwork and Blockwork. Paper in Proc. Int. Con£. of Building Structures, Mar. 31-Apr. 1, 1976. 1976, pp. 369-383.
on Performance Glasgow Uni v. , Pentech Press,
64. Thomas, K. The Performance of High Rise Masonry Structures. Paper in Proc. Int. Conf. on Performance of Build-ing Jtructures, Glasgow Univ., Apr. 1, 1976. Pentech Press, 87-98.
Mar. 31-1976, PP•

60
APPENDIX A.--FAILURE OF WALLBOARD AND MASONRY WALLS
Analysis of wallbord failure data for a previous study (2) produced several questions. An expanded wallboard testing program was developed to identify core failure and examine the large variation of strain readings, the effect of strain rate and measurement method on strain readings, cyclic response, and the relative strength contributions of the composite materials. Additionally, cyclic and monotonic shear tests were conducted with the National Bureau of Standards (NBS) on 5- by 5-f t masonry walls and corner walls wit~ 3-1/2-ft legs (!!). Each material is discussed below with regard to elastic response to failure and nonlinear response during the crP-:.:ks were widening to the whic~l ,.~ ~ual ob~·ervation became
Wallboard
time when point at possible.
Modern houses typically have interior walls .of gypsum wallboard, also called gypsum board, Sheetrock, and Drywall. Wallboard is a composite material consisting of a core of gypsum plaster of variable thickness bonded on both sides by smooth 0.015-in-thick paper. Although not considered a structural material, wallboard is often stressed and sometimes visibly cracked. Table A-1 lists bending, shear, and tensile strains of wallboard and related materials at failure as reported in previous studies (2, 6, 10, 35-36). Core failure for both bending T34r-and tensile stresses (2) was identified at~ 1,000 v.in/in in -RI 8507 (2). Tensile failure tests on gypsum core conducted by Beck (19) showed failure to occur at ~ 350 v.in/in. Because of these differences, additional data were sought by running further tests on both wallboard and wallboard paper.
Paper tests were conducted following American Society for Testing and Materials (ASTM) standard test method D 828-60, "Tensile Breaking Strength of Paper and Paperboard," using an Ins tron model TM 100-kg, universal testing machine (fig. A-1). Wallboard and wallboard paper
samples were kept in the same environment for 2 months prior to testing. This allowed a relative evaluation of failure properties.
Wallboard tensile tests were conducted on a 250-lbf MTS Systems Corp. electrohydraulic Servocontrol loading frame (fig. A-2). Load rates varied from 0.00008 to 0.2 in/s. Conversion of failure time to frequency, assuming 1/4 wavelength at failure, gave frequencies of 5 t~ 0.002 Hz. Strain detectors were mounted across the center of the speci:nen (fig. A-3), and output was recorded and processed on the system described in RI 8507. Tests were run on notched and unnotched samples. Notched ~nm~leR were u~ed to aetermine effects of gauge length and positioning; the specimens were notched to induce failure at the strainsensing location. Unnotched samples gave the data used to determine absolute failure levels. Specimen size was based on end constraints that exist in a house (i.e., panel size over a doorway or window of approximately 12 by 16 in) and the loading frame's size limitations. Strain gauges were glued to the sample with adhesive, and mounting bases for the str~in-leaf and Kaman displacement systems were attached with a fast-drying epoxy. The cyclic response of the loading frame system and test apparatus was limited to 2 Hz, and the maximum strain produced was ~ 50 v.in/in.
Cyclic strain readings from the measurement systems with varying gauge lengths are listed in table A-2. Although the various methods and lengths gave consistent results, an increase in load induced core failure and resulted in strain localization in the paper covering. The post-mounted strain systems produced reasonable results, but some error resulted because of the relatively large size of the mounting base. A smaller diameter mounting base would increase the accuracy but would be difficult to install. Figure A-4 shows the details of the post-mounted sy~tem.

TABLE A-1. -Failure characteristics of plaster, wallboard, and hardboardl
Investigator and type I Material of failure
Leigh (.§._), tensile •••••••••• I Plaster beam •••••••••••••••••••••••••• • • • do ••••••••••••••••••••••••••••••••• • • • do • ...................................
Wiss (35), bending •••••••••• J GypaUlll wallboard, longitudinal section .... do ....................................... .
Beck {l!), shear ••••••••••••
Bureau of Mines {!), tensile
U.S. Gypsum Co. {36): Tensile ........ :: ........ .
Shear ................ • ... • Compressive •••••••••••••••
McNatt {lQ), tension ••••••••
• • • do •••• ............................... • . • do •.•••• , ........................... . Gypsum wallboard, transverse section •• .. .. • do • ..................................... • • • do ••• ...................... • • • · ....... ••• do ••••••••••••••••••••••••••••••••• Gypsum wallboard •••••••••••••••••••••• Gypsum wallboard core with paper lami-nate removed •••••••••••••••••••••••••
• • • do • ........ , ........................... . .•• do •••••••••••••••••••••••.•.•••.••• • • • do •• .................................. ••• do •••••••••••••••••••• ~•••••••••••• • • • do •••• .................... • • • • • • • • • • Gypsum wallboard •••••••••.•••••••••••• ••• do ••••••••••••••••••••.•••.••..•••• ••• do •• ••••••••• • • ••••• ,. • • • • • • • • • • • • • • ••• do •••••••••..••.••••.•••.•••••.•••• • • • do • ••••••.•••••.•••••.••• • • • • • ... • • • • • ,do • ..................... • ... • • • • • ..... • ••• dO•••••••••••••••••••c••••·••••••• • • • do • •••••••••..•••••.••••••..••..•••
Gypsum wallboard, transverse a~ction •• Gypsum wallboard, longitudinal section Gypsum wallboard •••••••••••••••••••••• • • • do • ••••••••••••••••••• • • • •••• • • • • • • Tempered hardboard •••••••••••••••••••• • • • do • ••••••••••••••••••••• • • • • •. • • • • • • • • do • •••••••••••••••••••••••••••• • • • • ••• do ••••.••••••••••.••••.••.••••.•••• • • • do • •••••••• , ••••••••••••••••••••••• • • • do •••• •••••••••••••••••••••••••••• , • • • do • •••••••• , ........................ , ••• • • • do ••• ••••••••••••••••• • • ...... • • • • • • • • • do ••• ............... • •• • • ••••••• •. • • ••• do •••••••••••••••••••••••••••••••••
.. • • do ....... ,.
...do ....... . • , .do ....... , NA (blasting)
1/4 (static.). 51,000 ..... .. 518,000 ..... . 5330 ........ . 51,900 ..... .. 58,500 ..... .. 1/4 (static), • •• do ••••• , .. ... do ...... .. ... do ...... .. • • • do ....... . ... do ...... .. ... do ....... . ... do ...... ..
• •• do ....... . ••• do., ••• , •• ••• do •••••••• ••• do •••••••• • •• do •••••••• • •• do ........ .
NA • NA • NA. NA.
NA. 1.67 min, 30 min. 33 s. 3.17 min, 14.2 min. NA, NA • NA, NA • NA • NA • NA • NA.
NA, NA • NA. NA • 4.17 min. 15 min • 7 5 min • 2~ .6 h • 12.7 days • 81.0 days • 347 days • 6.6 a • 30 s • 1.33 min • 7.83 min. 1.39 h. 5.56 h. 20.3 h.
0'1 r-'

62
FIGURE A-1.- lnstron TM 100-kg universal testing machine with test specimen.
FIGURE A-2 •• MTS 250-lbf electro-hydraulic loading frame with test specimen.
TABLE A-2. - Effect of gauge length on wallboard strain measurement
Strain Locationl system
A • • • • • • • • Gauge. B. • • • • • • • •• do •• c ......•. Leaf •• D. • • • • • • • Gauge. E • • • • • • • • •• do •• lsee figure A-3. 2cycled at 3.5 Hz.
Effective length, mm
3.18 124 378
3.18 3.18
Cyclic strain,2 Initial After
4.45 h 80 82 50 65 77 86 69 69 50 45
3center-to-center distance between posts.
!lin/in Increased
load 470
58 105 320 340

r , ...
10" I
l A
1 ...
Front
7"
I B C
9"
.. ,
I D
~I KEY
A Strain gauge
B Strain gauge
C Strain-leaf system
D Strain gauge
E Strain gauge
Bock
I E
FIGURE A-3. • Wallboard test specimen and strain instrumentation.
The yield point and ultimate paper failure data at varying strain rates are listed in table A-3. The loading frame load versus deformation data for tests with different paper orientations are presented in figure A-5. Typically, the yield point, point A in figure A-5, was assumed to be the point of initial core failure; point B represents ultimate paper failure. For a given sample, when output from the strain measuring systems (table A-4) and their corresponding loaddeformation curves (fig. A-6) are compared, discrepancies arise. Analysis of the readings in table A-4 points out that--
• Core failure, point A0 on the strain time histories (fig. A-6), occurs at ~ 300 to 400 pin/in and may not be visible on the load-deformation curve.
• The initial yield point at A in figures A-5 and A-6, often attributed to core failure, is actually the first yield point of paper, although visual (naked
63
eye) buckling or cracking occurs slightly beyond this point.
• Strain r~te and orientation (transverse versus longitudinal) appear to affect ultimate failure, point B, but the strain at point A is relatively constant, ~ 790 to 840 pin/in for notched samples (and 1,000 to 1,400 pin/in for unnotched samples, as shown in table A-3).
• Cracking was visually observed at strain levels slightly beyond the yield strain.
Paper is the controlling factor for visual cracking in wallboard, and therefore its failure characteristics were further examined. Filament and paper failure have been discussed by several
at:hors (37-42). For filament and paper sheets, there-is a question as to the variation of the total elongation at break caused by strain rate (43-45). As shown in table A-5, average-failure strains can reach ~ 13,000 and 20,000 pin/in for longitudinal and transverse paper samples, respectively. But for longitudinal and transverse wallboard samples (table A-3), the initial yield point does not vary appreciably nor does the ultimate failure typically reach the 3 magnitudes. Once the core cracks, the p~ner strain localizes across the crack, and further elongation is limited until a break occurs. The average load at failure of wallboard paper, from table A-5, agreed with the failure load for unnotched wallboard in tests; i.e., 89 lb/in (longitudinal direction) x 2 (for both sides) is approximately equal to the average of the load-per-width values in table A-3, 176 lb/in, and values reported by the U.S. Gypsum Co. (table A-1). However, the transverse load test data did not agree; i.e., 2 x 20.7 lb/in for paper as compared to 58 lb/in for wallboard (table A-3) versus 80 lb/in (U.S. Gypsum, also for wallboard). Sample preparation alone could account for the variation (26).

64
-Y-0.125 diam
'_s0.25
0.175
2jt~ 4 holes, 0.19 deep
_j_ ...
0.50 0.125 diam f
-j0.60t-
0191bf~'9, ' -- A 0.50 ~ .. -
' o --.--i I
· • 'Lo·25 O.l 25 dwm · 2-56 head 2 holes
3.50 0.012UL-
0.024_]1
O.IOj ji.OOl ~.75 diom
u -a-0.125 diom
All dimensions in inches
FIGURE A-4, • Detailt of post-mounted strain system,
Fatigue assessment was limited to a cursory look at the hardboard data presented in table A-1 and a limited fatigue test. Table A-2 displays the results for cyclic tests of wallboard under displacement control. As cyclic strain data were sought, strain systems were balanced to zero out baseline shift due to system drift and paper creep. Absolute displacement was not available. Load control was then utilized. Figure A-7 shows a wallboard test specimen, and the test results are listed in table A-6. System response on load control limited strain output to about 50 ~in/in at an upper frequency of 2 Hz. The test was stopped at 66 h, after 475,000 cycles. Since the apparatus limited further tests, hardboard creep and fatigue data are presented, in table A-1, as a generalization of the response of wood products to cyclic and long term loads (10). Load versus number of cycles to failure (fatigue) is plotted in figure A-8, and load versus
:!! 0 <(
0 _J
1,200 r------r------.------.-----~----~
1,000 Longitudinal
800
600
400
200
0 0.20
500,----
400 Transverse
300
200
0.40
0.20
8
0.60 0.80
KEY
A Yield point 8 Ultimate paper
failure
8
0.30 0.40
DISPLACEMENT, mm
1.00
0.50
FIGURE A·S, • Effect of paper orientation on ten• sile failure curves for 1/2·in•thick wallboard,

65
TABLE A-3. - Results of laboratory tensile failure tests on 1/2-in-thick wallboard
'Yield pointl Ultimate failure Load Time to Specimen Length, Width, Load, Strain, Load, Strain, Load rate, failure,
in in lb llin/in lb Jlin/in lb/in in/s s width
Longitudinal: With notch ••••• 10 6 528 1,180 703 3 '770 117 0.000079 480
10 7 585 945 899 2, 700 128 .00157 17 10 7 618 787 956 2,460 137 .0157 1.6
Without notch •• 10 9 NA NA 1,800 11,560 180 .00984 12 10 9 618 1,260 NA NA NA NA NA 10 9 607 1,420 NA NA NA NA NA 16 9 618 1,076 1,550 8,860 172 .00984 14
Transverse: With notch ••••• 10 7 360 906 365 1,540 52.1 .00394 4.0
10 7 332 866 371 1, 810 53.0 .00394 14.6 10 7 NA NA 332 1,420 45.7 .197 .072 10 7 NA NA 410 925 59.0 .197 .047 1() 7 349 846 380 1,610 54.0 .00394 4.3
I
10 I 354 g.;) 377 1,620 53.4 .000787 21 Without notch •• 10 9 512 1,100 490 1,540 56.9 .00394 3.9
10 9 512 1.100 I 490 1,540 56.9 .00394 3.9 10 9 517 1,160 540 1,500 60.0 .00394 3.8
NA Not available. 1Nonlinear response point of locd-deformation curve.
TABLE A-4. - Comparison of strain readings from wallboard test specimen and from loading frame
Gauge location1 Measuring system Effective gauge i Strain, \lin/in length, mm.
Loading frame •••••• LVDT •••••••••••• 0.254 1 •••••••••••••••••• Strain leaf •••••
';)
~ , i. as 2 •••••••••••••••••• 'Kaman • •••••••••• 3 51.2 3 •••••••••••••••••• Strain gauge •••• 12.7 NA Not available. lsee figure A-6, diagram of test specimen. 2see figure A-6, plots of strain responses. 3Center-to-center distance between mounting posts.
2point A0 2Point A NA 787
352 724 376 839 334 817
TABLE A-5. - Results of tensile failure tests on wallboard paper
Sample Number Failure Load, Time to Sample Number Failure Load, group of strain, lb/in failure, group of strain, lb/in
samples \lin/in 8 samples Jlin/in A(L) •• 10 12,600 88 14.0 E(T) •• 1 22,500 21 A(T) •• 1 25,300 20 29.0 F(L) •• 7 11,700 87 B(L) •• 9 15,000 97 16.6 F(T) •• 2 21,100 18.5 B(T) •• 3 24,700 28 28.3 G(L) •• 9 13,200 90 C(L) •• 12 11,900 87 13.4 G(T) •• 1 21 '900 18 D(L) •• 5 14,600 92 13.7 H(L) •• 7 12,600 81 D(T) •• 8 22,900 20 26.1 H(T) •• 5 20,800 19 E(L) •• 7 13,300 90 13.8 (L) Longitudinal. (T) Transverse.
2Point B 2,460
NA NA NA
Time to failure,
s 26.0 12.6 23.0 14.5 25.3 13.8 23.6

66
TABLE A-6. - Results of cyclic load tests on 1/2-in-thick wallboard
Strain Locationl system
A • • • • • • • • • Gauge ••• B • • • • • • • • • ••• do ••• c ......... Leaf •••• D • • • •• • • •• Kaman ••• E • • • • • • • • • ••• do ••• NA Not available. lsee figure A-7. 2cycled at 2 Hz.
Effective gauge
length, mm 12.7 12.7
376.35 319.75 76.70
Cyclic strain,2 vin/in ~ ' Initial After After After
18.5 h 45.5 h 66 h 42 39 40 41 51 50 51 51 64 64 66 65 53 53 53 53 55 53 NA 56
3center-to-center distance between mounting posts.
time to failure-{creep) is plotted in figure A-9. Also plotted on the creep curve (fig. A-9) is the number of cycles to failure (from figure A-8) converted to
The ratio of creep stress to ~atigue stress appears to be independent of the time to failure and is ~ 1.5, lending itself to static design. Under repeated cyclic loading, the failure stress will be 0.67 times (~ 70 pet) that of static loading. By analyzing envelope data obtained at the test house, it was found that a ground vibration level of 1.0 in/s would induce a strain of ~ 100 vin/in in wallboard. This is only 10 pet of the strain required for failure, meaning that a large prestrain is needed to attain the cyclic failure stress level. Cyclic environmental factors are therefore the major strain producer, not blasting. Several assumptions were made in pointing out that blasting does not cause fatigue failure; however, the paper fatigue tests did point out that a large number of cycles are required to produce failure. Figure A-10 shows Wiss' measurements on gypsum wallboard (35) during an interlude in a program to- deliberately induce cracking by blasting. Daily environmental cycles induced opening and closing of cracks of up to 0.1 mm. Wiss found the cyclic widening and closing of cracks to be unaffected by blasting activity.
Masonry Walls
The response of masonry walls to shear, flexure, and/or compressive loads has
been studied by others (46-55). These investigators have indicate~ that the strength of a masonry wall depends on the mode of f~ilure, compressive load, ~ cngth-to·-"'o' e;ht ratio, amount of reinforcement, bond strength, rate of loading, grouting, and quality of workmanship. Workmanship alone can affect the wall strength by 60 to 80 pet (56).
The definition of cracks in brick and block walls is being debated. Cranston (32), Green (33), and Wroth (34) note that all brick-and block walls have small 0.1-mm cracks upon completion. Green stated that 0.1-mm cracks are difficult to see and "therefore do not cause concern." Up to load failure, elastic approxi~ation of the global deformation response appears reasonable (55). However, after cracking at local -sites, the material is no longer a continuum, and the theory of elasticity does not apply. In lieu of using strain, a crack-width criteria has been proposed for cosmetic cracks that do not affect load-carrying capacity (33). However, the acceptability of crack widths varies with material. For concrete, 0.25 mm is the limit of acceptability (57), while 1 mm is the -limit of acceptability for brickwork (34). The acceptability of crack widths also depends on who is making the judgment of acceptability; the public will generally accept cracks up to 0.2 mm wide in concrete, but the limit for engineers is 0.25 mm (1r)•
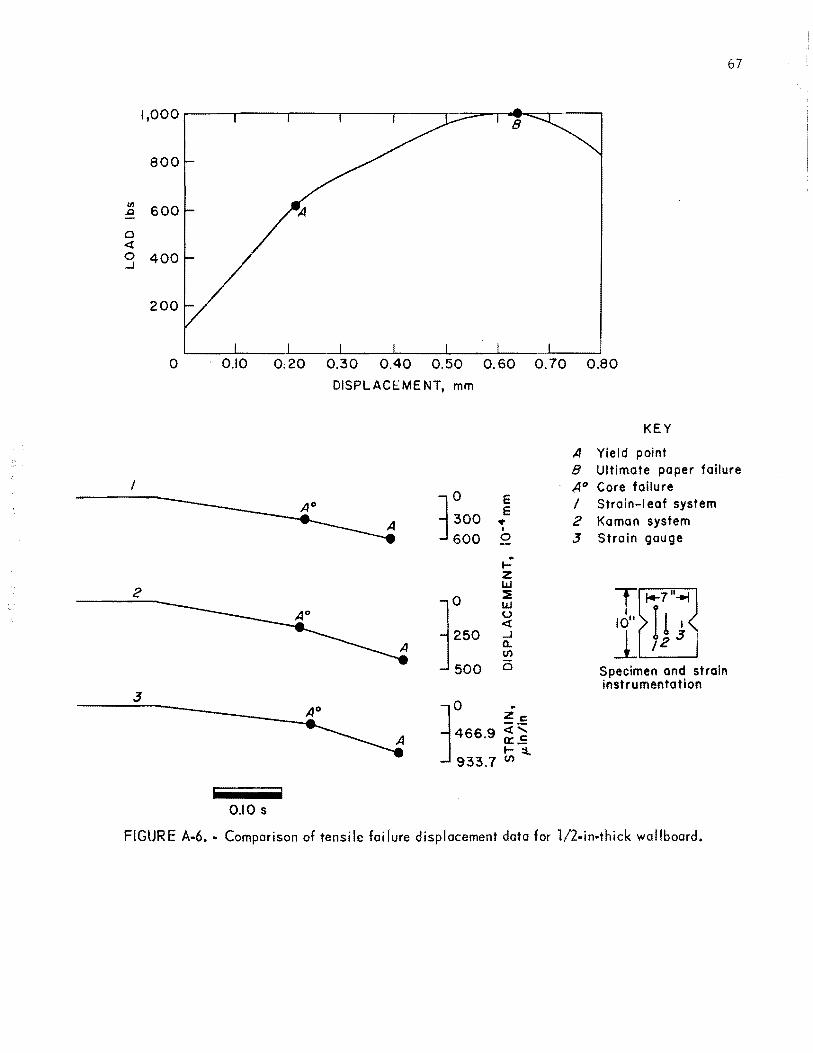
1,000
800
en 600 ..c
0 <t 0 400 ..J
200
0 - 0.10
I
2
0.10 s
67
0;20 0.30 0.40 0.50 0.60 0. 70 0.80
DISPLACEMENT, mm
l~oo J 600
E E .,. I
0
.. 1-z w :::E w u <t ..J Q. tl)
0
jo ..
Zc
466.9 ~~ 1-:t.
933.7 tl)
KEY
A Yield point 8 Ultimate paper failure A° Core failure I Strain-1 eaf system 2 Kaman system 3 Strain gauge
Specimen and strain instrumentation
FIGURE A·6 ... Comparison of tensile failure displacement data for 1/2-in·thick wallboard.

68
Front Back
r f..-- -7" •I
I r r 10" I I
l A 8 D
c E
lc 9" .I KEY
A Strain gauge
8 Strain gauge
c Strain -leaf system
D Kaman system
E Kaman system
FIGURE A-7. • Wallboard specimen and strain systems tested under load contra I.
Masonry block and brick wall failure data from several sources are presented in table A-7, for both blasting- and laboratory-induced failure. A wide range of strain valueB is evident from these data. Variations were caused by use of different strain descriptors (global versus local strains) and strain gauges of different lengths. Crawford (31) reported dynamic strains of 300 ~in/in across block mortar joints and 30 ~in/in on the block at failure; but the author, correcting for gauge length, calculated a dynamic strain of 3,270 ~in/in across ~~e joints at failure. The calculated value was based on the assumptton that the differential displacement occurs at thP. mortar joint-block interface, not uniformly over the entire 6-in strain gauge length. Using a joint width of 0.5 i-, t:. JOO- ... dH/in reading was auJUSt:ed by subtracting the 5.5 in of ~ 30 ~n/in strain, converting to true displacement by multiplying by the 6-in gauge length, and then calculating strain by dividing by the 0.5-in joint width, i.e.,
90
-(.) a. 80
....1 w
70 > w ....1 (f) 60 (f)
w 0::
50 1-(f)
40
30 I 10 103 104 105
CYCLES TO F AlLURE
KEY
o Sample I A Sample 2 'V Sample 3
FIGURE A-8. • Stress levt:l versus number of cycles to failure for 1/4-in-thick hardboard 1n tension (10).

69
150
140 Rate-ofloading data KEY
-u 0.
....J w > w ....J
(f) (f)
w 0::: 1-(f)
130
120
II 0
100
90
80 ~
70
60
50
40
0
0
c:
0
o Fatigue points o Points used in computing
equations of curves
30 0.001 0.01 0.1 10 102 103 104 105 106
TIME TO FAILURE, s FIGURE A-9. • Stress level versus time to failure for 1/4-in-thick hardboard {10).
(300 ~in/in - 30 ~in/in x 5.5 * 6) 6 in 0.5 in
The uniformity of strain readings at joints throughout the wall and the relationship to global strain was studied in tests conducted under contract at the National Bureau of Standards (NBS) TriDirectional Test Facility.
Fatigue Testing of Masonry Walls
NBS (Structure Division, Center for Building Technology) carried out the
fatigue testing of masonry block walls. A synopsis of this investigation follows. Woodward (11), in an NBS report, discusses this contract investigation in greater detail. The investigators studied loaddeformation response up to first cracking and nonlinear response during crack width growth. Additionally, fatigue effects were examined because previous research results (7-9, 46-56, 60) were limited.
Tests were run on ten planar 64- by 64-in walls (fig. A-ll) and five angle walls 64 in high with 48-in-long legs
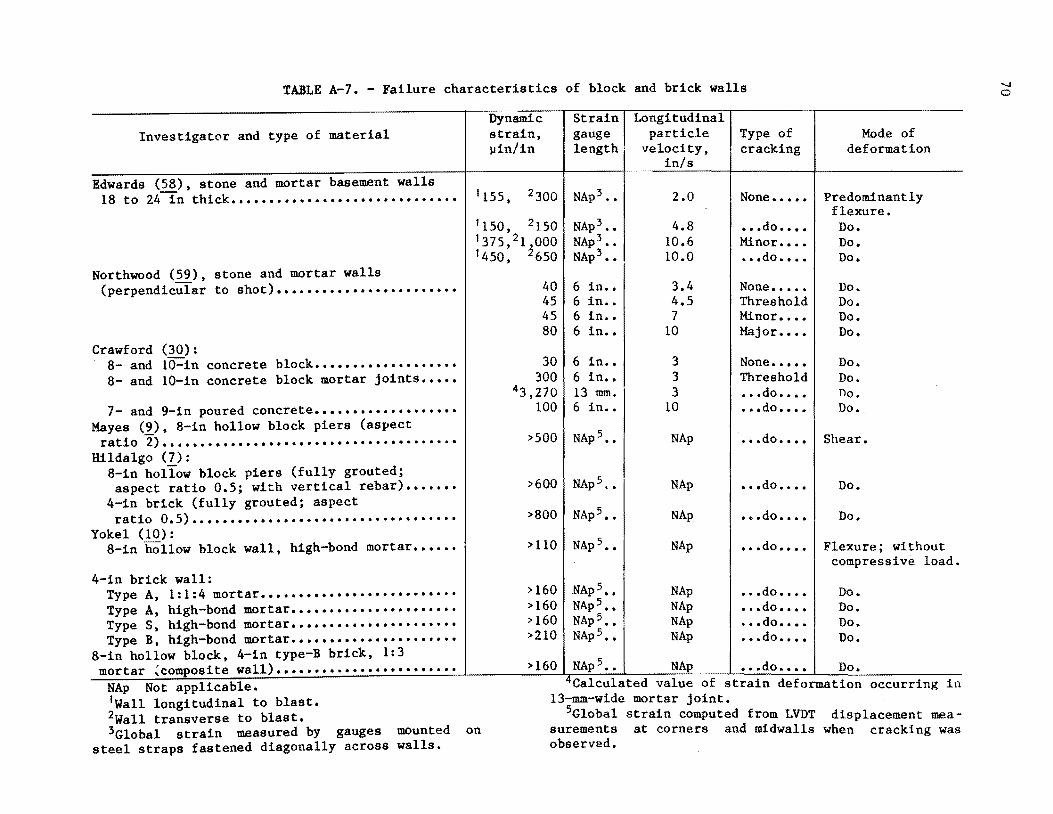
TABLE A-7. -Failure characteristics of block and brick walls
Investigator and type of material
Edwards (58), stone and mortar basement walls 18 to 24in thick ••••••••••••••••••••••••••••••
Northwood (59), stone and mortar walls (perpendicular to shot) ••••••••••••••••••••••••
Crawford (30): 8- and 10-in concrete block ••••••••••••••••••• 8- and 10-in concrete block mortar joints •••••
7- and 9-in poured concrete ••••••••••••••••••• Mayes (9), 8-in hollow block piers (aspect
ratio 2) ........................... • · · • · · · · • · · · · Hildalgo (7):
8-in hollow block piers (fully grouted; aspect ratio 0.5; with vertical rebar) •••••••
4-in brick (fully grouted; aspect ratio 0.5) •••••••••••••••••••••••••••••••••••
Yokel (10): 8-in hollow block wall, high-bond mortar ••••••
4-in brick wall: Type A, 1:1:4 mortar •••••••••••••••••••••••... Type A, high-bond mortar •••••••••••••••••••••• TypeS, high-bond mortar •••••••••••••••••••••• Type B, high-bond mortar ••••••••••••••••••••••
8-in hollow block, 4-in type-B brick, 1:3 mortar (composite wall) ••••••••••••••••••••••••
NAp Not applicable. 1Wall longitudinal to blast. 2Wall transverse to blast. 3Global strain measured by gauges
steel straps fastened diagonally across mounted walls.
Dynamic strain, pin/in
Strain1 Longitudinal gauge 1 particle lengthi velocity,
in/s
Type of cracking
Mode of deformation
1155, 2 300 NAp 3 •• 2.0 I None ••••• I Predominantly flexure.
1150, 2 150 NAp 3 •• 4.8 •• • do •••• Do. 1375, 21 000 1450, 2650
NAp 3 ••
NAp 3 •• 10.6 Minor •••• Do.
on
10.0 •• • do •••• Do.
40 6 in •• 3.4 None ••••• Do. 45 6 in •• 4.5 Threshold Do. 45 6 in •• 7 Minor •••• Do. 80 6 in •• 10 Major •••• Do.
30 6 in •• 3 None ••••• Do. 300 6 in •• 3 Threshold Do.
43,270 13 mm. 3 . • • do •••• no. 100 6 in •• 10 •.. do .••• Do.
>500 NApS •• NAp .• • do •••• Shear.
>600 I NAps,. NAp • • • do •••• I Do.
>800 I NApS •• NAp • • • do •.•• I Do.
>110 I NAps •• NAp I ••• do •••• I Flexure; without compressive load.
>160 NApS •• NAp •• • do •••• Do. >160 NApS •• >160 NApS ••
NAp •. • do •••• Do. NAp •• • do ..•. Do.
>210 NApS •• NAp .• . do •••• Do.
>160 I NAps •• NAp • •• do • ••• I Do. 4calculated value of strain deformation occurring in
13-mm-wide mortar joint. 5Global strain computed from LVDT displacement mea
surements at corners and midwalls when cracking was observed.
........ 0

+0006r------------.------------.-------------.-----------~
+.004 c ~
:r: +.002 t-o 3: ~ (.)
<! -.002 a: (.)
-.004
KEY + Crock opened - Crock closed
-.006~----------~----------~~----------~----------~
+0.1 5
+.I 0
+.05
0
-.05
-.10
-.15 72 96 120
TIME, r. 144 168
FIGURE A-10.- Response of wallboard during a period of nonblosting (35).
FIGURE A-11. • In-place 5- by 5-ft masonry block wall at NBS Tridirectional Test Facility.
71
E E
:r: 1--0
3: ~ u <! r..r. u
(fig. A-12). Both figures show an epoxied in-place wall. Walls were laid in running bond,1 and standard ASTM tests
were run on mortar (mortar type N) and prisms (3 blocks stacked vertically). All walls were manufactured 30 days prior to testing.
1Blocks were laid overlapping 50 pet, with head joints in alternate courses in vertical alignment.

72
FIGURE A-12 ... In-place angle wall with 4-ft-!ong legs at NBS Tridirectional Test Facility.
Strains were measured across the joints and assessed by LVDT global displacements of the wall. Voltage outputs frm'l the Bureau of Mines strain systems were digitized by NBS for direct readouts ui strain. Initial tests at 26 strain sites revealed that vertical gauges would not pick up any shear displacement. Consequently, only 15 gauges were needed for the remainder of the tests. These were primarily horizontal except for vertical gauges monitoring flexure stress and a gauge on the block. Figure A-13 shows a typical test sample, including the strain gauge locations, LVDT global displacement, and pretest crack locations. Pretest cracks were mapped to delineate the extent of shrinkage and · workmanship cracking from one specimen to another. Cracking observed was similar in all walls, but the extent varied. Crack inspections were conducted at 1/2-h intervals or when major strain changes were observed. These midtest inspections required the aid of an eyepiece with a magnification of 7 X to easily distingu:l.sh
cracks of 0.1 mm. Upon completion of the test, at ultimate failure, a map of the major cracking pattern was drawn.
The test program was varied to define under what conditions blasting could induce failure. Initially, global displacement and strain characteristics at cracking were assessed. Cyclic tests were then conducted, with and without prestrains, depending on previously observed failure displacements. Each test was used to define limiting conditions, and therefore few replicate in-plane shear tests were run. The tests were conducted as follows:
• The walls were epoxied in place to the upper and lower footing by lowering the upper crosshead on the bedded epoxy until a load of 500 to 1,500 lbf was sensed. The initial set took 1 h, and no tests were run until it had hardened at least 16 h. Loading was applied by the upper crosshead in the direction of the LVDT arrows in figures A-13 and A-14.

74
DIAGONALLY DISPLACED
IN-PLANE DISPLACED, ONE LEG
FIGURE A-14. • loading orientations of angle wall along the diagonal and in-plane (one leg).
• Cyclic response started at 0.001 in global displacement, producing ±50 ~in/in as measured at a local site, and continued for 100,000 cycles. Because of variations of strains at local sites, global displacements were used to control the tests. Global cyclic limits were set at 0.005 and 0.011 in. Due to time
limitations and a lack of cracking, the amplitude was increased until a diagonal crack ~ 0.06 in wide occurred. Displacement levels were beyond those expected from blasting (i.e., assuming simple harmonic motion and that displacement only occurs at the upper corner of the basenent wall, a 1.0-in/s ground motion gives a displacement of 0.024 in at 6.5 Hz).
• A prestrain was then added by displacing the wall from 0.002 to 0.044 in. Cycling resumed at ±0.003 in displacement for 100,000 cycles or to failure.
• Similar monotonic and cyclic tests were conducted on the angle walls. The first wall was failed monotonically along the diagonal (fig. A-14). The wall displayed failure displacement levels equal to the resultant of the inplane resistance of each leg. Consequently, remaining tests were conducted inplane along one leg (fig. A-14). The outstanding leg was found to have little effect on the in-plane leg's wall capacity or failure mode.
The observations of cracking "ersus local strain readings tests are described below.
Cracking
and global from these
All cracks initially observed were at eye threshold limits, ranging in width from 0.01 to 0.1 mm. Even over limited wall areas, local cracking was hard to distinguish from existing shrinkage and workmanship cracks. Areas where strain readings were high allowed for threshold observation of local cracking. When strains reached ~ 700 ~n/in, cracks -0.01 mm wide could be observed with the aid of a 7-power magnifying eyepiece. Local cracks occurred randomly at mortarblock interfaces before the major fail·,lre crack appeared in each wall. These cracks, which ran diagonally along mortar-block interfaces from corner to corner of the wall, formed just prior to reaching the ultimate load capacity (maximum in-plane load) shown in table A-8. The diagonal steplike cracks were not affected by localized cracking and are
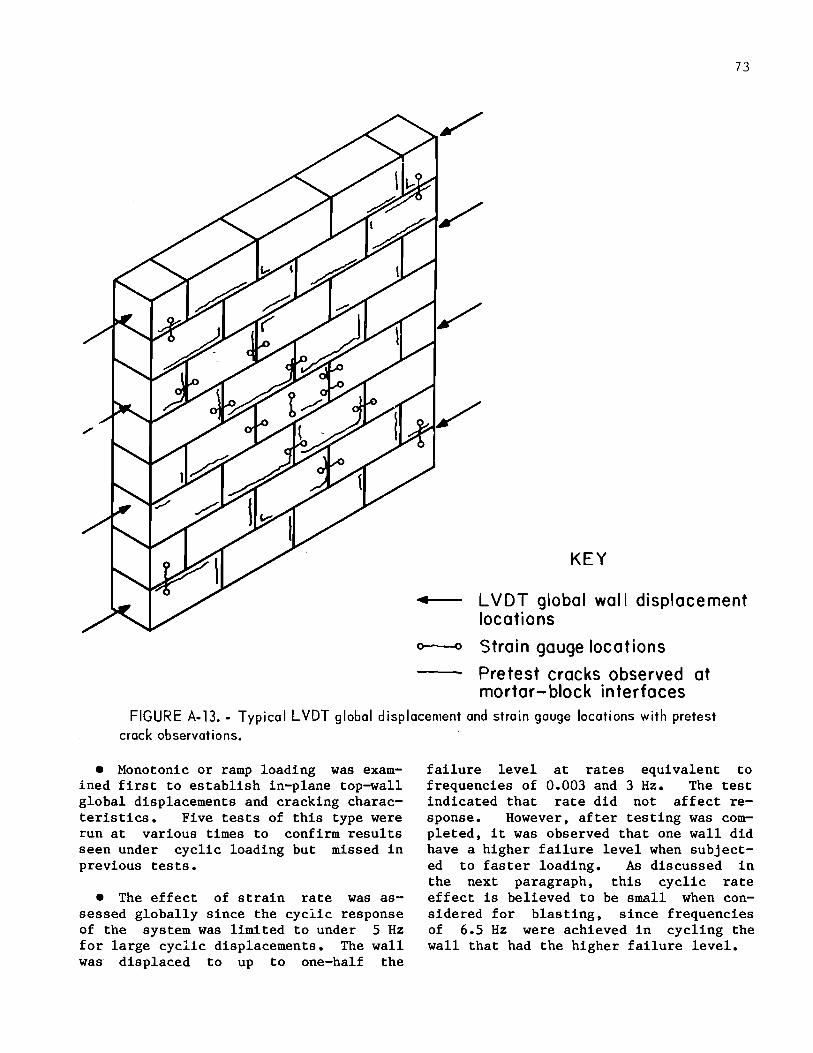
73
KEY
4 L VDT global wall displacement locations
~ Strain gauge locations
Pretest cracks observed at mortar- block interfaces
FIGURE A-13 •• Typical LVDT global displacement and strain gauge locations with pretest
crack observations.
• Monotonic or ramp loading was examined first to establish in-plane top-wall global displacements and cracking characteristics. Five tests of this type were run at various times to confirm results seen under cyclic loading but missed in previous tests.
• The effect of strain rate was assessed globally since the cyclic response of the system was limited to under 5 Hz for large cyclic displacements. The wall was displaced to up to one-half the
failure level at rates equivalent to frequencies of 0.003 and 3 Hz. The test indicated that rate did not affect response. However, after testing was completed, it was observed that one wall did have a higher failure level when subjected to faster loading. As discussed in the next paragraph, this cyclic rate effect is believed to be small when considered for blasting, since frequencies of 6.5 Hz were achieved in cycling the wall that had the higher failure level.

75
TABLE A-8. - Masonry wall test parameters (l!)
Precompression Loading history Wall axial load, and type
lbf 1 •• 14 Cyclic, pres train 2 •• 14 Monotonic, ramps. 3 •• 14 Cyclic, pres train 4 •• 14 ••• do •••••••••••• 5 •• 4 Cyclic, reversed. 6 •• 5 Monotonic, ramps. 7 •• 18 Cyclic, pres train 8 •• 13 Cyclic, reversed. 9 •• 16 Cyclic, pres train
10 •• 16 ••• do •••••••••••• 11 •• 16 Monotonic •••••••• 12 •• 16 ••• do ••••••••••••
lMaximum. 26~ Doint of maximum in-plane load.
similar to the one observed in the southeast basement wall of the test house. However, a crack·of this kind would not be generated in a house by in-plane shear alone because the large vertical compressive loads needed to produce this type of failure (>65 lb/in2) are not present in a typical residential house.
Strains
Strains read at local sites showed an inflection point at ~ 100 ~in/in, but visual cracking occurred anywhere from 500 to 1,000 ~in/in. Allowing for variations in mortar thickness and strain
+0.0090
.e oo +.0045 ooo oo ..
00 •• o. :X: J- • • ... 0 • c ~0 ... 0 • 3t 0 ...
I 0
0 ~
I 0
0
~ -0045 76°-69° F (.)
In-plane Axial I In-plane displacement, 2 in load, load, 2 Ram Wall
• 0
lbf l lbf 24.4 28.8 0.087 o.oso 22.2 29.6 .226 .073 21.2 36.6 .135 .061 27.0 35.9 .162 .106 17.5 16.9 .082 .053 27.3 33.0 .167 .129 30.0 37.2 .131 .087 19.4 21.8 .093 .063 23.2 54.1 .256 .136 21.7 35.5 .138 .080 19.1 31.7 .129 .084 17.6 30.6 .129 .084
gauge inaccuracies, this compares to the predicted visual threshold of 700 to 7,000 ~in/in. Most of the strain occurred across joints, which had an assumed average width of 13 mm. Strains measured on the walls varied considerably from tension to compression. Therefore, readings had to be assessed over the enti.re wall to predict what diagonal path the major failure crack would follow. As it turned out, predicting the exact diagonal for final faiure was difficult, due to both loading history and overall differences in sample condition. There appeared to be a minimal global displacement or strain at which the major
+0.23 KEY
• Inside E o Outside +.115 E
+ Crock opened .. :::c
- Crock closed · J-• c • • • 0 • • • • • • • 0 3: 00
0 0 0 ? ~ 0 0 0 (.) 0
I -.115 < 68°-48° F 0::: 76°-46° F 71°-59°· F 68°-51° F
0
-.009 0 '----------'--------'------'-------''-------'-----' -.23 12pm 4pm · 8pm 12om 4om Sam 12pm
TIME
FIGURE A-15. • Response of concrete block crack v:idths to environmental factors (28).

76
diagonal crack occurred (~ 600 ~in/in). Cycling at low global strains (50 to 100 ~in/in) appeared not to affect the global failure strain necessary for cracking. Cycling at 50 to 100 ~in/in about an offset displacement near the global failure level appeared to shift the absolute global failure strain to a higher value. While in-plane shear failure is not applicable for houses due to the high compressive loads it requires, the strain results are still valid. Research at NBS scheduled for fiscal 1984 will continue examination of masonry wall failure (~).
Widening of cracks in masonry joints has been discussed by others (28, 62). Figure A-15 shows Wall's (28) measurements of changes in crack width in concrete block walls with daily temperature variations in a desert environment. As in houses with wallboard, daily environmental cycling induced crack width changes of up to 0.1 mm. Long term changes in brickwork piers are affected by moisture, fluctuating temperatures, type of brick and mortar, and the presence of a dampproof course (63-64).

77
APPENDIX B.--DESIGN DETAILS OF TEST HOUSE
1'-0"
NORTH ELEVATION
WEST ELEVATION
FIGURE B-1.- North and west side elevation views {orchitectts drawing).
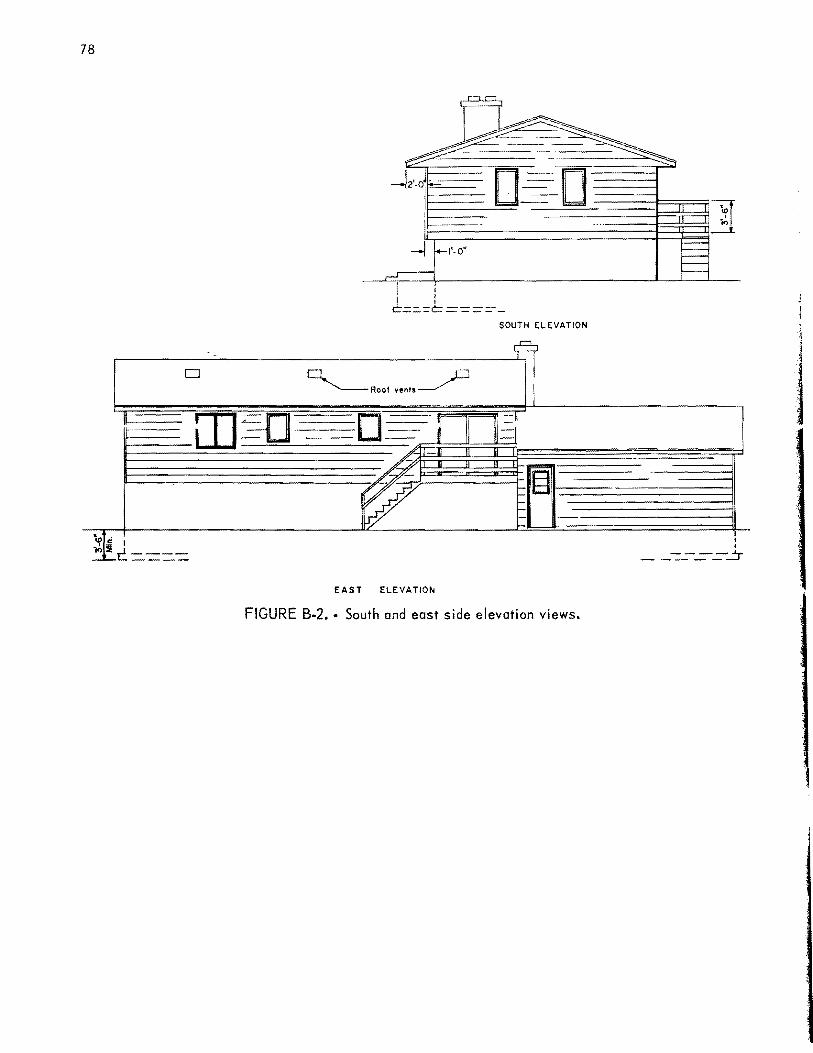
78
SOUTH ELEVATION j --
D ~Roo! vents__? I
rnm D-==-- -:II
~ II ~-1 #_ ell Jl Ill -
§ v ~ 1--t-
j
I
~~I I I
c=-==-= - --:::_--=-- :.::r
EAST ELEVATIO!It
FIGURE B-2. • South and east side elevation views.

79
00 ~ Moster
' -- Dinin9 room Kitchen Bath bedroom -
rl -· r -Hall
;-- '- Ill -. . "" ' ~
Bedroom ''1'
--, ,...- Down P-- F o y e r
I - I - -· I 2-24~48C 4-20xi60C 10'-o" I 8 1-0"
q•_o~~ 41--0lt 2f-4U 13'-8"
24'-o" 20'-0" 81-0if 1s'-o" -·· FIGURE B-3 •• Main floor plan.
68' o· -
24' .. olt 44'-o'
16'-6' 17'-4" 10'-2"
2() 281 T
(20x281 - ·- ·- ·-n ··.~-~ ~ ~ ··" .,.,, .. " . G6xB Cone. ft~s lie IO"Conc blks I ~I
I I 3' -6' Below Qround 18•8 Cone. fli• I !\I II a• Cone. blks 3 :['Cone floor
I ~~ 'o I 1 4" Cone. curb
I 2x6 at 16'0.C. ~
_\ 4' Cone. curb 9'-6" .it•8 Cone. ftas
9 ritJ= -2I 211 2.1.
'o ... UNEXCAVATED ' "' - -1{')
2-2 •16 l- "' ...-r-.-- 22. II ~r-..
'o , :9 _, <D ~
,.., 2•4 at 16"0.C. I
I
.I-~ 5• IO"Conc. blks \r.;l 9 I : i ll8•8 Cone. !las ~~~ '-- . '
.. I r--:r r== --1\ l -ur l~l ,_,~ _9 Line of joist 4-20i36C
cantUeY<er obove B'-<l" 10'-o·
20'-0' I B'-0" IE', " I -,
FIGURE B-4. • Basement floor plan.

80
4'-0" Min.
7 R•s 3-2 X 10
3 i"Conc. floor
FIGURE B-5 •• Design details.
-Roiling 36" high

4 ·bolts (3)
81
(', KEY
t", ',':\ I I
<<',',,~, ,-;"' 4 x 8 sheet plywood ond ',~;::~;\_/ additional bracing as needed
NOTE: Trusses ond joists 2"x 6".
FIGURE B-6. • Roof framing after modifications.
All joists under plywood sheet bolted to top plate os in insert.

82
FIGURE B-7. • Structural modifications of main floor and basement to accept shakers. (Modifications shown as darkened features.)
nu.s. GPO: 1984-705-020/S036 !NT .-BU.O F MIN ES,PGH.,P A. 27627

FRO~I : D. E. SiSkind + Assoc. PHONE NO. : 612 929 44<33 Mar. 09 1999 07:53PM P1
lD>JJl .. SJ[SJI{1ND&ASSOCilATJES~LJLC .. 5812 Thomas Circle
Minneapolis, MN 55410-2936, USA Tel/Fax (612) 929-4498
FAX TRANSMITTAL D ate_z::J:::!! __ Tim e_1_:_!_!:_!_ rt
Company/Agency ___ ~?~ ----------------Fax_1g_::_f!~::_ J tJ J ~Phone ____________ __
From: DESA, D. E. Siskind & Associates, (612) 929·4498 Note: In Faxing DESA, can tranBmit immediately, or, if get voice massage. dial 55 and then transmit.
Comments _ _f'.b.TI.!.tz£..11l'.i?..?.E'_ {t:?_s:f_!!$ ~I'2~ To ,4.J!!.e!!!=._IPJ.11!~~-Id~J-b -~c?__p_L/t.ffil.IJ:Lf2rJ!J..C!..._FI ~Lf.'tf..fl_l!~!!.S_l'i .. !~l? .. £!..~l~l!Efl..f!!.l'.!!.l~-:!_/)_:!'!_(!
__ 7_R_!f:4_: __ )j~_..fi.!.!fCP.!l.t:;_!_!~--1:1. F?~T..,.. _ft.c ~J!f..~~~-!:~
J.f!p_T.fi/l:Y __ ~ _ _f±;._tcrr:_.f!.'!~r.P...'t.Et?.. __ z_lfiL~!?!Y-rd-~~~ ~iff •
_____ l.:iEr?E[ __ A-__ t:l_fil:! ___ P:!! IV !!!.Y_..L_..f!_~f!.(!?.E.R._~-----------
________________________ ..__ _________________________________ _
-----------------~-------~------------------------------
NUMBER OF PAGES 3 including this cover


FROM : D.E.5iSkind +Assoc. PHONE NO. 612 929 4498 Mar. 09 1999 07:54PM P2
USBM REPEATED BLASTING (FATIGUE) TEST PROGRAM, 1975-1984 Overall results were PIJblished. in USBM RI~889B, 1984.
DESA, !2-26-99
PROJECT PHASES 1. Wallboard room, US ARMY CERL1 1975 2. Drexel University, CE Department, Dr. Koerner, 1978-1980 3. Northwestern Univ. Tests on waflboard, CE Dept, 1979-1983 4. USBM laboratory tests on wallboard strength, 1979-1983 5. Test house: coal mine blasts, 1980-1983 6. Test house: mechanical shaking (w. ANCO engineering), 1983 7. Test house: non blast responses; 1983 8. National Bureau of Standards. block walls. Kyle Woodward,1 0-83
1. TESTS ON A SMALL WALLBOARD STRUCTURE: US ABMY CORPS OF ENGINEERS RESEARCH lABJ CHAMPAIGN. JL. 8-76. Test structure on shaketable subjected to repeated blasts 1, 5, 10, 60, 1 00, 500 ublasts" at each vibration level Results: 666 blasts at 0.5 in/sec: no damage
666 blasts at 1.0 In/sec: no damage 666 blasts at 2.0 In/sec: no damage 6 blasts at 4.0 in/sec: sliding and nails pulling out at 16 in/sec: corner crack at window opening
2. PREXEL UNIVEBSITY. CE DEPT.:.~ DR. 8. M. KOERNER Tests on 1f4 .. scale concrete block walls Results: fatigue failure could be produced at a PPV of 2.6 to 3.8 in/sec after 34,000 to 450,000 cycles. The higher number of cycles was for the non-resonance case.
3 &4. LAB TESTS OF WALLBOARD SEQTIONS AT USBM & NWU Tests of failure under In-plane shear and tension Results: initial failure of plaster core: 300 1.!8
crack visible on surface: 1 ,000 J.LE
Note:on a 15x8 ft wall and a frequency of 8 Hz. 300 Jf£ is equal to a structure response vibration of 3.53 In/sec.

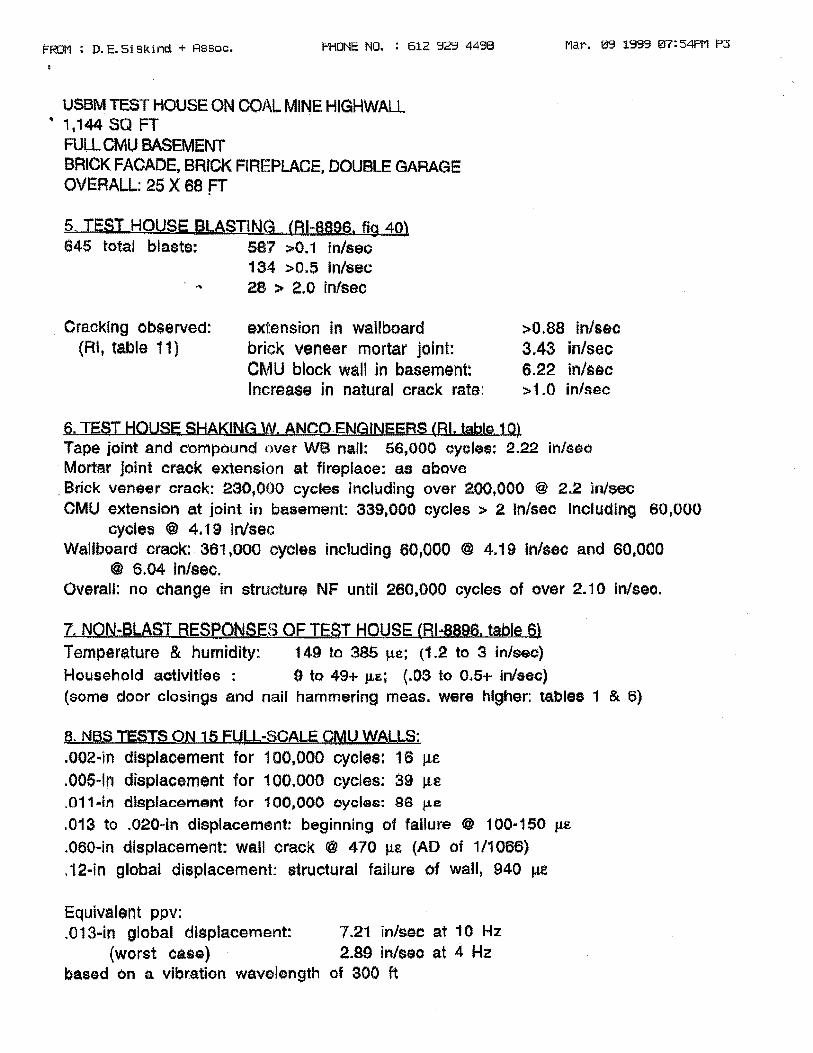
FROM: D.E.SiSkind +ASSoc. PHONE NO. : 612 929 4498
USBM TEST HOUSE ON COAL MII\IE HIGHWALL ~ 1,144 SQ FT
FULL CMU BASEMENT BRICK FACADE. BRICK FIREPLACE. DOUBLE GARAGE OVERALL: 25 X 68 fT
5. TEST HOUSE BLASTING (RI-8896. fig 4Q). 645 total blasts: 587 ::;.0.1 in/sec
134 >0.5 in/sec 28 > 2.0 in/sec
. Cracking observed: (AI, table 11)
extension in wallboard brick veneer mortar joint: CMU block wall in basement Increase in natural crack rate:
6. TEST HOUSE SHAKING W. ANCQ.ENGINEERS (81. table 10)
Mar. 09 1999 07:54PM P3
>0.88 in/sec 3.43 in/sec 6.22 in/sec >1.0 in/sec
Tape joint and compound ovsr WB nail: 56,000 cycles: 2 . .2.2 in/seo · Mortar joint crack extension at fireplace: as above Brick veneer crack; 230,000 cycles including over 200,000 @ 2.2 in/sec CMU extension at joint in basement: 339,000 cycles > 2 In/sec including 60,000
cycles @ 4.19 In/sec Wallboard crack: 361 1000 cycles including 60,000 @ 4.19 in/sec and 60,000
@ 6.04 in/sec. Overall: no change in structure NF until 260.000 cycles of over 2.10 in/sec.
7. NQN-BLAST RESPONSES OF TEST HOUSE (81~8896. table 6.) Temperature & humidity! 149 to 385 J.te; (1.2 to 3 in/sec) Household activities : 9 to 49+ fJ.£; (.03 to 0.5+ in/sec) (some door closings and nail hammering meas. were higher: tables 1 & 6)
B. NEtS TESTS ON 15 FULL-SCALE CMU WALLS:
.002-in displacement for 1 00.000 cycles: 16 Jle
.005-ln displacement for 1 00.000 cycles: 39 J.L2
.011-in dispfacGment for 100,000 cycles: 99 1.1s
.013 to .020-in displacement: beginning of failure @ 100·150 p.s
.060-in displacement: wall crack @ 470 J.LS (AD of 1/1066)
.12-in global displacement: structural failure of wall, 940 tre
Equivalent ppv: . 0 13-in global displacement: 7.21 in/sec at 1 0 Hz
(worst case) 2.99 in/seo a.t 4 Hz based on a vibration wavelength of 300 ft