Embed Size (px)
Citation preview

Remote Sens. 2015, 7, 10164-10183; doi:10.3390/rs70810164
remote sensing ISSN 2072-4292
www.mdpi.com/journal/remotesensing
Article
Effects of Precipitation Intensity and Temperature on
NDVI-Based Grass Change over Northern China during the
Period from 1982 to 2011
Xiuliang Yuan 1,3, Longhui Li 2,*, Xi Chen 1 and Hao Shi 2
1 State Key Laboratory of Desert and Oasis Ecology, Xinjiang Institute of Ecology and Geography,
Chinese Academy of Sciences, Urumqi 831001, China;
E-Mails: [email protected] (X.Y.); [email protected] (X.C.) 2 School of Life Sciences, University of Technology Sydney, Sydney 2000, Australia;
E-Mail: [email protected] 3 Graduate School, University of Chinese Academy of Sciences, Beijing 100100, China
* Author to whom correspondence should be addressed; E-Mail: [email protected];
Tel./Fax: +86-991-788-5401.
Academic Editors: Clement Atzberger and Prasad S. Thenkabail
Received: 1 June 2015 / Accepted: 3 August 2015 / Published: 10 August 2015
Abstract: The knowledge about impacts of changes in precipitation regimes on terrestrial
ecosystems is fundamental to improve our understanding of global environment change,
particularly in the context that heavy precipitation is expected to increase according to the
5th Intergovernmental Panel on Climate Change (IPCC) assessment. Based on observed
climate data and the Advanced Very High Resolution Radiometer (AVHRR) Global
Inventory Modeling and Mapping Studies (GIMMS) satellite-derived normalized
difference vegetation index (NDVI), here we analyzed the spatio-temporal changes in
grassland NDVI, covering 1.64 × 10⁶ km2, in northern China and their linkages to changes
in precipitation and temperature during the period 1982–2011. We found that mean
growing season (April–October) grass NDVI is more sensitive to heavy precipitation than
to moderate or light precipitation in both relatively arid areas (RAA) and relatively humid
areas (RHA), whereas the sensitivities of grass NDVI to temperature are comparable to
total precipitation in RHA. Heavy precipitation showed the strongest impacts in more than
half of northern China (56%), whereas impacts of light precipitation on grass NDVI were
stronger in some areas (21%), mainly distributed in northwestern China, a typical arid and
OPEN ACCESS

Remote Sens. 2015, 7 10165
semi-arid area. Our findings suggest that responses of grasslands are divergent with respect
to changes in precipitation intensities.
Keywords: climate change; GIMMS; NDVI; precipitation intensity
1. Introduction
The response of terrestrial ecosystems to climate change is one of the important themes in current
global environmental change research [1–3]. Vegetation, as an active component of ecosystems, which
links soil and atmosphere through energy and mass transports [4,5], is taken as a comprehensive
indicator of global change. Grassland in northern China is one of the world’s three largest prairies and
is regarded as typical vegetation in responding to climate changes [6]. Previous studies showed that the
climate in this region has experienced dramatic change in the past several decades, leading to
significant vegetation changes [7,8]. The amount of annual precipitation is identified as the most
important factor for annual variations in normalized difference vegetation indices (NDVI) [9,10].
NDVI can sensitively reflect the growth conditions of vegetation and the biophysical or biochemical
characteristics of ecosystems [11]. Thus, NDVI has been widely used to investigate the impacts of
climate variables on ecosystem functioning and dynamics. Previous studies indicated that responses
of grassland NDVI to precipitation in China differed across biome types and the amount of
precipitation [12] and also differed at different time-scales [13,14]. Grasslands in arid regions may be
more sensitive to precipitation fluctuations than those grasslands in humid regions [15], and this
sensitivity becomes weak as the altitude increases [16]. At an annual time-scale, precipitation is the
main factor of driving grass NDVI changes [14,17]. At seasonal time-scale, the sensitivity of grass
NDVI to precipitation is higher in summer than in other seasons [10,18]. Effects of precipitation on
vegetation show obvious time lag as well, which can last several days to several months [17,19–21].
The preceding winter precipitation also influences the following growing season NDVI in
northwestern China [22]. Besides precipitation, temperature is another important factor influencing
vegetation activity [1,17]. Over northern China, the positive effects of temperature on the growth of
grasslands decrease as temperature rises, implying that the sensitivity of vegetation growth to
temperature in high-cold regions may decline under global warming [23]. In high altitude regions,
temperature rather than precipitation controls vegetation growth [16]. In North America, the increasing
trend of spring vegetation greening stalled or reversed maybe due to the corresponding reverse trend of
spring temperature [24]. The response of grass NDVI to temperature shows high latitudinal
dependence, and the importance of temperature increases with the increase in latitude [25].
Additionally, grass NDVI could show significant correlation with other factors, such as winter snow
depth [26], potential evapotranspiration [10], and nutrient availability [27].
An increasing trend of grass NDVI is observed in northern China [8,18,28], characterized as the
advancement of greening or extension in growing season period [8]. To reveal the responses of
vegetation to climate change in northern China, many studies have investigated the relationships
between grass NDVI and climate factors, particularly precipitation [14,23,29]. However, most of these
studies focused mainly on how grass NDVI varies with the total growing-season or annual precipitation.

Remote Sens. 2015, 7 10166
Precipitation is characterized not only by the total amount of precipitation but also by the frequency
(number of precipitation events in a year) and the intensity (amount in each precipitation event) [30].
Joint effects of frequency and intensity cause variations of precipitation in a given time period. In
northern China, changes in annual precipitation are mainly caused by heavy precipitation, particularly
in northwestern China [30–33]. Therefore, significant changes in precipitation intensity are expected to
have important effects on terrestrial ecosystems. In this paper, we used observed climate data and
satellite derived NDVI to investigate the sensitivities of grass NDVI changes to growing season
temperature (GST) and precipitation intensity in northern China during the period 1982–2011. The
specific goal is to reveal the divergent effects of precipitation of different intensities, in conjunction
with temperature, on grassland vegetation activities, which will improve our understanding in
interactions between terrestrial ecosystem and climate.
2. Data and Methods
2.1. Study Area
The study area encompasses 13 provinces in northern China (31°N–54°N, 73°E–136°E; Figure 1),
and the grassland area of these regions is 1.64 × 10⁶ km2, comprising nearly 17% of China’s
territory [23]. The grassland area was extracted by using the MODIS (Moderate Resolution Imaging
Spectroradiometer) land cover type product (MCD12C1.005) in 2005 at a spatial resolution of 0.05°
and the classification method was according to the International Geosphere—Biosphere Program
(IGBP) (Figure 1A), and the agriculture and other land cover types were removed. The area covers
three types of climate, i.e., temperate monsoon climate, temperate continental climate and alpine
climate. The northeast of the study region (NE) is strongly influenced by temperate monsoon climate,
where the rain season occurs in summer (June–August). The annual precipitation is about above
450 mm and the annual mean temperature varies from −3 °C to 9 °C in NE [34]. The altitude was
lower than 1000 m and grassland is dominated by meadow steppes. The northwest of this study region
(NW) is characterized by temperate continental climate. The annual precipitation decreases from east
to west precipitation, ranging from more than 400 mm in the east to less than 100 mm in the west and
the annual mean temperature ranges from −5 to 15 °C. Following this east-to-west precipitation
gradient, the grass types change from typical steppes to desert steppes. Altitude ranges from −150 m in
Qaidam basin to more than 2000 m in mount Tianshan. The southwest of the study region (SW) is
located in Qinghai Plateau, strongly influenced by alpine climate. The mean altitude was 4054.3 m,
which leads to annual mean temperature lower than 0 °C, and the annual mean precipitation ranges
from 100 to 700 mm from southeast to northwest and grass type is characterized by alpine steppes and
alpine meadow [35].
2.2. GIMMS Data and Processing
The latest version of GIMMS (Global Inventory Modeling and Mapping Studies) NDVI3g dataset
at a spatial resolution of 1/12 degree and a 15-day time-step was downloaded from the Ecological
Forecasting Lab at NASA Ames Research Center [36]. The NDVI dataset covered from January 1982
to December 2011, and 720 images were used in this study. The dataset is well known for its long time

Remote Sens. 2015, 7 10167
series and high quality, which has been processed by radiometric and geometric crude correction,
geometric refined correction and bad lines removing. Therefore, the data have been widely used in
studies on global and regional vegetation dynamics [37,38]. To further reduce the contamination of
clouds, atmosphere, and non-grassland vegetation, the method of maximum value composite [39] was
used to extract monthly NDVI and the cells with mean annual NDVI values of less than 0.1 were ignored.
Figure 1. Distribution of grasslands (A) and aridity index (AI) (B) in northern China. The
green color area represents grasslands extracted from the MODIS global land cover dataset
in 2005 and the gray lines represent elevation contour. The red color triangles indicate
weather stations. The study area was divided into three climate zones, the northeastern part
(NE), influenced by temperate monsoon climate, the northwest part (NW), influenced by
temperate continental climate and the southwest part (SW), influenced by alpine climate.
2.3. Meteorological Data and Processing
The station observed daily precipitation and temperature data from 1982 to 2011 were obtained
from China Meteorological Data Sharing Service System [40]. Meteorological stations established
after 1982 were discarded and finally 629 well spatially distributed stations in China were used. In
addition, 271 stations are located within our study area (Figure 1B). The dataset consists of daily
measurements of precipitation and temperature, so precipitation intensities and frequencies can be
easily calculated. In order to explore the spatio-temporal variations of precipitation and temperature
and the relationships between grass NDVI and precipitation and temperature, the inverse distance and
elevation weighting (IDEW) method was used to interpolate site-measured climate data to a spatial
domain at a 1/12 degree resolution, for consistency with NDVI dataset. Further information on the
spatial interpolation method can be found in Liston et al. [41]. For daily interpolation, the IDEW
method has been proved to be satisfactory in northern China, where the elevation has wide ranges from
−150 to 8000 m [42,43].
2.4. Definition of Precipitation Intensity
Precipitation intensity was defined as the amount of precipitation in one day. According to the value
of daily precipitation, it was grouped into three levels: light, moderate and heavy precipitation. There
are many different approaches for defining precipitation intensity levels. The first approach is to use
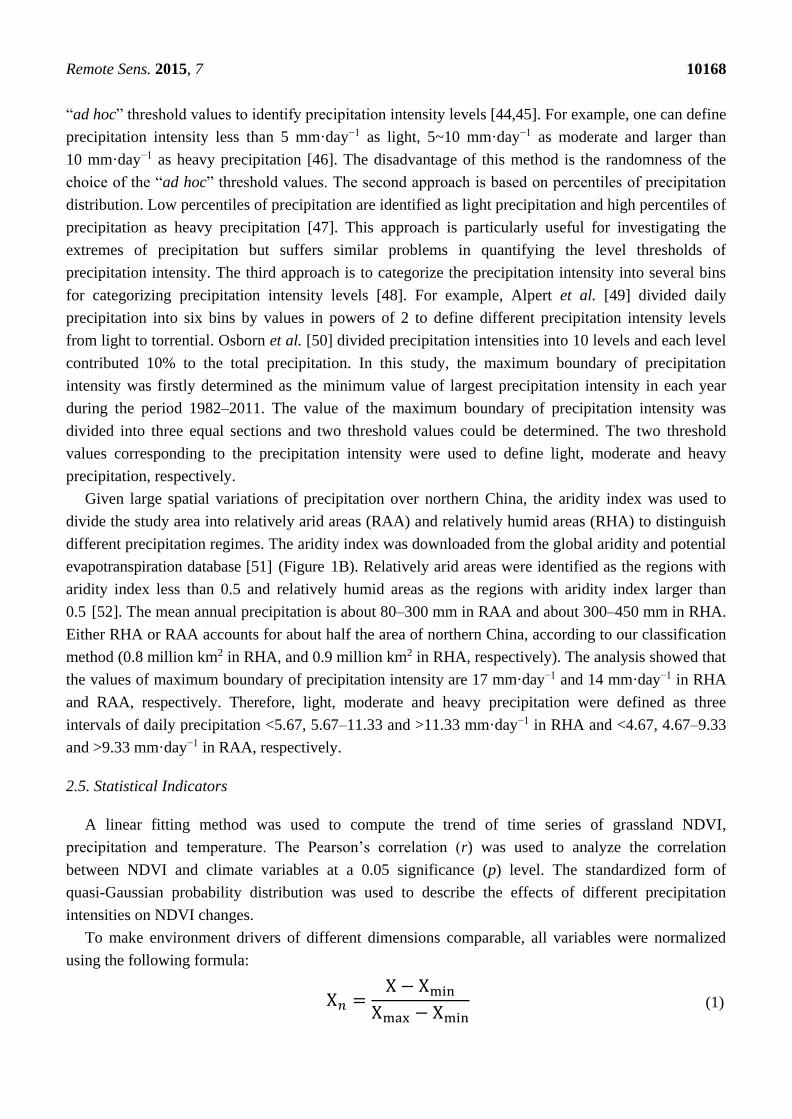
Remote Sens. 2015, 7 10168
“ad hoc” threshold values to identify precipitation intensity levels [44,45]. For example, one can define
precipitation intensity less than 5 mm·day−1 as light, 5~10 mm·day−1 as moderate and larger than
10 mm·day−1 as heavy precipitation [46]. The disadvantage of this method is the randomness of the
choice of the “ad hoc” threshold values. The second approach is based on percentiles of precipitation
distribution. Low percentiles of precipitation are identified as light precipitation and high percentiles of
precipitation as heavy precipitation [47]. This approach is particularly useful for investigating the
extremes of precipitation but suffers similar problems in quantifying the level thresholds of
precipitation intensity. The third approach is to categorize the precipitation intensity into several bins
for categorizing precipitation intensity levels [48]. For example, Alpert et al. [49] divided daily
precipitation into six bins by values in powers of 2 to define different precipitation intensity levels
from light to torrential. Osborn et al. [50] divided precipitation intensities into 10 levels and each level
contributed 10% to the total precipitation. In this study, the maximum boundary of precipitation
intensity was firstly determined as the minimum value of largest precipitation intensity in each year
during the period 1982–2011. The value of the maximum boundary of precipitation intensity was
divided into three equal sections and two threshold values could be determined. The two threshold
values corresponding to the precipitation intensity were used to define light, moderate and heavy
precipitation, respectively.
Given large spatial variations of precipitation over northern China, the aridity index was used to
divide the study area into relatively arid areas (RAA) and relatively humid areas (RHA) to distinguish
different precipitation regimes. The aridity index was downloaded from the global aridity and potential
evapotranspiration database [51] (Figure 1B). Relatively arid areas were identified as the regions with
aridity index less than 0.5 and relatively humid areas as the regions with aridity index larger than
0.5 [52]. The mean annual precipitation is about 80–300 mm in RAA and about 300–450 mm in RHA.
Either RHA or RAA accounts for about half the area of northern China, according to our classification
method (0.8 million km2 in RHA, and 0.9 million km2 in RHA, respectively). The analysis showed that
the values of maximum boundary of precipitation intensity are 17 mm·day−1 and 14 mm·day−1 in RHA
and RAA, respectively. Therefore, light, moderate and heavy precipitation were defined as three
intervals of daily precipitation <5.67, 5.67–11.33 and >11.33 mm·day−1 in RHA and <4.67, 4.67–9.33
and >9.33 mm·day−1 in RAA, respectively.
2.5. Statistical Indicators
A linear fitting method was used to compute the trend of time series of grassland NDVI,
precipitation and temperature. The Pearson’s correlation (r) was used to analyze the correlation
between NDVI and climate variables at a 0.05 significance (p) level. The standardized form of
quasi-Gaussian probability distribution was used to describe the effects of different precipitation
intensities on NDVI changes.
To make environment drivers of different dimensions comparable, all variables were normalized
using the following formula:
X𝑛 =X − Xmin
Xmax − Xmin (1)

Remote Sens. 2015, 7 10169
where X is a variable (NDVI, GST, annual precipitation and different precipitation intensities), Xn is
the normalized value, and Xmax and Xmin are the maximum and minimum values of variables,
respectively, during the period 1982–2011. The temporal interval accounting for NDVI and
temperature is the growing season (April–October), whereas the temporal interval for precipitation
counted from last November to this October in a specific year. This was to take into account the
lagging effect of precipitation on vegetation [12].
To assess the sensitivity of grass NDVI to GST and precipitation intensity, we regressed the
normalized NDVI with normalized GST and precipitation intensities (H, M, and L are normalized
heavy, moderate and light precipitation, respectively):
NDVI = a1H + a2M + a3L + a4 GST + ε1 (2)
where a1, a2, a3 and a4 are regression coefficients, and ε1 is the residual error.
In order to examine the effects of total precipitation and GST on NDVI, a multiple linear regression
was also performed using normalized NDVI and total precipitation (P) and GST:
NDVI = b1P + b2GST + ε2 (3)
where b1 and b2 are regression coefficients, and ε2 is the residual error. We defined the regression
coefficients as the sensitivities of grass NDVI to different climate variables, respectively.
3. Results
3.1. Temporal and Spatial Trends of NDVI, Precipitation and GST
Figure 2 shows the temporal trend of mean growing season NDVI, annual precipitation, GST, and
heavy precipitation during the period from 1982 to 2011. NDVI increased significantly (r2 = 0.22,
p < 0.01, Figure 2A) from 0.32 in 1982 to 0.35 in 2011 with an increasing rate of 0.0005 year−1. Total
precipitation showed a slight but not significant decrease r2 = 0.19, p = 0.43, Figure 2B), whereas
heavy precipitation showed a slight increase (r2 = 0.02, p = 0.46, Figure 2C) though not significant.
Mean growing season temperature increased significantly over the past three decades, with an average
increase of 0.05 °C·year−1 (r2 = 0.68, p < 0.01, Figure 2D).
Figure 3 illustrates the spatial change rates of grassland NDVI, precipitation and GST during the
period 1982–2011. The majority of grassland in northern China (69% pixels) experienced an increase
in NDVI, and 31.2% pixels were significantly mostly in southwest NE and northwest NW. The rate of
increase in NDVI could exceed 0.004 year−1 in some pixels. About one third of grasslands underwent a
decrease in NDVI, but only 5% pixels were significant, such as in a small regions of northeast of NE.
The rate of decrease in NDVI was relatively low at a value of −0.002 year−1 (Figure 3A). For
precipitation, there were two contrasting trends between the east and the west of northern China.
In the east, precipitation was dominated by a decreasing trend (13% pixels), with an average rate of
−1.9 mm·year−1, such as the entire NE and the east of NW, while in the west, precipitation showed an
increasing trend (12% pixels), with an average rate of 1 mm·year−1 such as the entire SW and the west
of NW. GST increased over the study area (99% pixels) at the average rate 0.05 °C·year−1.

Remote Sens. 2015, 7 10170
Figure 2. Dynamics of mean growing season (April–October) NDVI (A); annual
precipitation (B); mean growing season temperature (C); and heavy precipitation (D) over
northern China during the period 1982–2011. Straight lines indicate linear regressions of
NDVI, precipitation, temperature and heavy precipitation against the time period, respectively.
Figure 3. Changes in mean growing season NDVI (A); annual precipitation (P) (B);
growing season temperature (GST) (C); and the corresponding statistical p values for
NDVI change (D); precipitation change (E); and GST change (F), respectively, in northern
China during the period 1982–2011.

Remote Sens. 2015, 7 10171
3.2. Response of NDVI to Precipitation and GST
Figure 4 shows the spatial r values and corresponding p values between the change in mean
growing season NDVI and the change in precipitation and temperature during the period from 1982 to
2011. It was found that 82.6% of grass NDVI showed positive response to precipitation and 30.2%
pixels were significant (p < 0.05 pink, red and light blue in Figure 4B). In addition, 17.4% of grass
NDVI showed negative correlation with precipitation but only 0.8% pixels were significant (p < 0.05).
The positive r values were mainly distributed in NE, NW and northeast of SW. The negative r values
were mainly located in the southwest of SW, where the average altitude is higher than 4000 m where
positive correlation between NDVI and GST was located. Furthermore, 66% of grass NDVI showed
negative correlation with GST, but only 2% of pixels were significant (p < 0.05, light blue in
Figure 4D), mainly distributed in the northeast of NE and northwest of NW.
Figure 4. The distribution of spatial correlation coefficients (r) (A) and the corresponding
p values (B) between mean growing season grass NDVI and annual precipitation (P), and
the distribution of spatial r (C) and corresponding statistical p values (D) between mean
growing season grass NDVI and mean growing season temperature (GST).

Remote Sens. 2015, 7 10172
3.3. Sensitivities of NDVI to GST and Precipitation Intensity
Table 1 shows the sensitivities of NDVI to different precipitation intensities and GST. The
sensitivity of NDVI to heavy precipitation was larger than to moderate or light precipitation. The
sensitivities of NDVI to light and moderate precipitation were almost equivalent in both RAA and
RHA. In RAA, the sensitivity of NDVI to temperature (0.13) was less than that to any of precipitation
intensities (0.23, 0.2 and 0.37 for light, moderate and heavy precipitation, respectively) and also less
than that to total precipitation (0.39). In contrast, in RHA, the sensitivity of NDVI to temperature
(0.21) was larger than that to any of precipitation intensities (0.06, 0.11 and 0.19 for light, moderate
and heavy precipitation, respectively), but it (0.21) was comparable to that of total precipitation (0.24).
As shown in Figure 4A, grassland NDVI could be either positively or negatively correlated with
precipitation in different regions. The r between NDVI and precipitation ranged from −0.68 to 0.83 for all
pixels, and showed a quasi-Gaussian probability distribution with a mean r value of 0.16 (±0.23) and
0.37 (±0.21), respectively, in RHA and RAA (Figure 5Bottom). The majority of r values (92.7% in
RAA and 70.2% in RHA) were positive (p < 0.01), indicating that NDVI was positively correlated
with precipitation. The mean r values between NDVI and heavy precipitation was 0.17 (±0.20) and
0.3 (±0.20) in RHA and RAA, respectively, comparable with mean r values between NDVI and total
precipitation (Figure 5Top). This indicated that heavy precipitation played an almost equivalent role as
the total precipitation in explaining NDVI variations. In contrast, moderate and light precipitation
produced quasi-Gaussian probability distribution with a mean r of 0.04 and 0.09 in RHA
(Figure 5Left) and 0.16 and 0.17 in RAA (Figure 5Right). As shown in Figure 5, both moderate and
light precipitation fitted Gaussian curves were visibly shifted to the left (p < 0.05), indicating that the
correlation between grassland NDVI and precipitation became weak. The two fitted curves from
moderate and light precipitation were obviously different from the curves from heavy precipitation or
total annual precipitation. It suggested that heavy precipitation had stronger impacts than moderate or
light precipitation on NDVI in some areas.
Table 1. Sensitivities (mean ± standard deviation) of normalized difference vegetation
index (NDVI) to different intensity precipitation (heavy precipitation, a1; moderate
precipitation, a2; light precipitation, a3) and growing season temperature (GST) (a4),
acquired by equation (2), and sensitivities of NDVI to total precipitation (b1) and GST (b2)
acquired by equation (3) in relative humid areas (RHA) and relative arid areas (RAA),
respectively. The p values were calculated pixel-by-pixel for each equation, and the
percentage (Perc) of pixels of significance at p < 0.05 was listed.
Region Precipitation Intensities and GST Total Precipitation and GST
a1 a2 a3 a4 Perc b1 b2 Perc
RAA 0.37± 0.23 0.2 ± 0.21 0.23 ± 0.25 0.13 ± 0.26 57% 0.39 ± 0.22 0.13 ± 0.25 64%
RHA 0.19 ± 0.23 0.11 ± 0.24 0.06 ± 0.29 0.21 ± 0.3 47% 0.24 ± 0.29 0.21 ± 0.3 56%
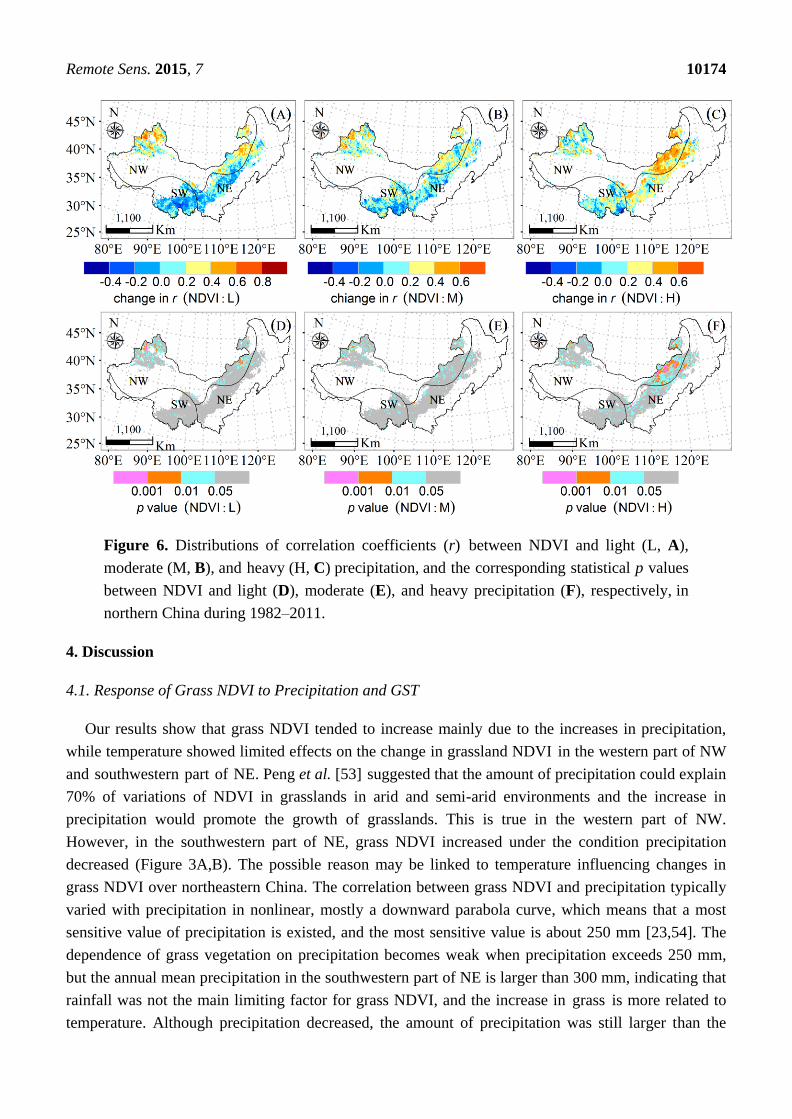
There are also a large number of pixels showing higher r values between NDVI and light or
moderate precipitation than that between NDVI and heavy precipitation (Figure 6). Those pixels with
higher r (21%) between NDVI and light precipitation were mainly distributed in northwestern NW,

Remote Sens. 2015, 7 10173
and the pixels with higher r (23%) between NDVI and moderate precipitation were distributed
irregularly compared with r values between NDVI and heavy precipitation (Figure 6A–C). Over
northern China, more pixels (56%) showed higher r between NDVI and heavy precipitation than that
between NDVI and light or moderate precipitation, which were mainly distributed in the east of NW
and NE. Spatial patterns of r between NDVI and heavy precipitation (Figure 6C) were very similar to
those of r between NDVI and total precipitation (Figure 4A), and the positive r accounted for 82.5% of
pixels, very close to total precipitation (82.6%). In contrast, light and moderate precipitations
contributed 67% and 70% of pixels with positive r. Those pixels with negative r between NDVI and
precipitation were mainly distributed in SW, where the mean altitude is higher than 4000 m. However,
pixels in these high altitude regions, showed positive r values between NDVI and temperature,
accounting for 34% of northern China (Figure 4C), indicating that the temperature was the main factor
of driving grass NDVI changes in high altitude areas.
Figure 5. Gaussian probability distributions (Prob(r)) of Pearson correlation coefficient (r)
between the mean growing season NDVI and different intensities of precipitation (PI)
(heavy precipitation, H; light precipitation, L; top panel. Total precipitation, P; moderate
precipitation, M; bottom panel). Light, moderate and heavy precipitations were defined as
the amount of received precipitation of less than 5.67 mm per day, between 5.67 and
11.33 mm per day, and larger than 11.33 mm per day, respectively, in relatively humid
areas (RHA) (Left). Light, moderate and heavy precipitations were defined as the amount
of received precipitation of less than 4.67 mm per day, between 4.67 and 9.33 mm per day,
and larger than 9.33 mm per day, respectively, in relative arid areas (RAA) (Right). The
red, and blue lines at top panel indicate fitted Gaussian probability distributions curve lines
for r between grass NDVI and heavy and light precipitation, respectively; the green and
black lines at bottom panel indicate fitted Gaussian probability distributions curve lines for
r between grass NDVI and total and moderate precipitation, respectively.
Remote Sens. 2015, 7 10174
Figure 6. Distributions of correlation coefficients (r) between NDVI and light (L, A),
moderate (M, B), and heavy (H, C) precipitation, and the corresponding statistical p values
between NDVI and light (D), moderate (E), and heavy precipitation (F), respectively, in
northern China during 1982–2011.
4. Discussion
4.1. Response of Grass NDVI to Precipitation and GST
Our results show that grass NDVI tended to increase mainly due to the increases in precipitation,
while temperature showed limited effects on the change in grassland NDVI in the western part of NW
and southwestern part of NE. Peng et al. [53] suggested that the amount of precipitation could explain
70% of variations of NDVI in grasslands in arid and semi-arid environments and the increase in
precipitation would promote the growth of grasslands. This is true in the western part of NW.
However, in the southwestern part of NE, grass NDVI increased under the condition precipitation
decreased (Figure 3A,B). The possible reason may be linked to temperature influencing changes in
grass NDVI over northeastern China. The correlation between grass NDVI and precipitation typically
varied with precipitation in nonlinear, mostly a downward parabola curve, which means that a most
sensitive value of precipitation is existed, and the most sensitive value is about 250 mm [23,54]. The
dependence of grass vegetation on precipitation becomes weak when precipitation exceeds 250 mm,
but the annual mean precipitation in the southwestern part of NE is larger than 300 mm, indicating that
rainfall was not the main limiting factor for grass NDVI, and the increase in grass is more related to
temperature. Although precipitation decreased, the amount of precipitation was still larger than the

Remote Sens. 2015, 7 10175
most sensitive value of precipitation (250 mm), and increased temperature also advances the beginning
of the vegetation growing season and accelerates vegetation growth [8]. Consequently, the mean
grassland NDVI still showed an increasing trend. In those areas where precipitation increased, the
increase in grassland NDVI was deemed as a result of the increase in precipitation in the western part
of northern China, typically arid and semi-arid regions.
4.2. Response of Grass NDVI to Precipitation Intensity
Several model-based and experimental studies have shown that the growth of grassland responds
strongly to extreme or heavy precipitation [15,46,55], which are consistent with our results but not true
in areas at high altitudes, especially in Tianshan mountains, Altai mountains and Qinghai Plateau. The
effects of temperature and precipitation on vegetation growth are different in different geographic
regions or different grasslands [18,56]. In high altitude regions, the growing season NDVI was
significantly and more strongly correlated with the GST rather than annual precipitation (Figure 5),
implying that temperature is the dominant climate factor regulating vegetation growth in these areas.
This result is consistent with previous findings by Mohammat et al. [16]. The reason may be that lower
temperatures lead to less evaporation and weakened photosynthesis. Therefore, the dependence of
growth of vegetation on precipitation decreased, especially for Qinghai Plateau, where the mean
elevation is 4054.3 m.
Furthermore, it is generally believed that if heavy precipitation contributes the majority of total
precipitation, it is easy to deduce a higher r between heavy precipitation and NDVI compared with r
between NDVI and moderate or light precipitation. So we calculated the proportions of different
intensity precipitation in the total precipitation (Table 2). The heavy precipitation accounted for only
25.9% and 37% in RHA and RAA respectively, while the light precipitation accounted for most,
46.3% and 39.9% in RHA and RAA, respectively. The mean values of r between grass NDVI and total
precipitation, 0.37 (±0.21) in RAA, 0.16 (±0.23) in RHA, are comparable with r values between grass
NDVI and heavy precipitation, 0.3 (±0.20) in RAA, 0.17 (±0.20) in RHA. In addition, the sensitivities
of grass NDVI to total precipitation are 0.37 (±0.23) in RAA and 0.19 (±0.23) in RHA, which are
comparable to sensitivities of grass NDVI to heavy precipitation with 0.39 (±0.22) in RAA and
0.24 (±0.29) in RHA. Both correlation values and sensitivities between grass NDVI and total or heavy
precipitation are larger than those between grass NDVI and light or moderate precipitation. Our
analysis shows that different intensity of precipitation (light, moderate, and heavy precipitation) exerts
divergent impacts on grass NDVI, and heavy precipitation had stronger effect on grass NDVI than
light or moderate precipitation. The results indicated that heavy precipitation played an almost
equivalent role as total precipitation in explaining grass NDVI variation in our study.
Our studies indicated that light precipitation (4.67 mm and 5.67 mm in RAA and RHA,
respectively) had limited effects on NDVI, consistent with previous report that lower than 5 mm of
precipitation had no significant influence on grass NDVI [57]. In most parts of northern China,
vegetation growth is limited by water availability [58,59]. Associated high temperature and solar
radiation led to high atmospheric evaporation demand, and evaporated that water of light precipitation
events directly from land surface, so light precipitation was essentially ineffective for grass
growth [57,60]. Previous studies have reported that soil moisture below 20 cm of the soil surface did

Remote Sens. 2015, 7 10176
not significantly change when precipitation was less than 15 mm [60], which is in support of the
results derived in this study. In addition, the annual precipitation frequencies for light and moderate
precipitation account for 87% and 9% in RHA, and 86.2% and 8.4% in RAA respectively, which are
much larger than heavy precipitation frequencies with 3.7% in RHA and 5.4% in RAA (Table 2). In
contrast, heavy precipitation has a much larger cumulative effect on increasing soil moisture,
extending periods of wet soil and hence promoting grass growth. However, the response of grass
NDVI to different precipitation intensity varies spatially. In some pixels of northwest of NW, the
correlation values between light precipitation and grass NDVI are higher than those between heavy or
moderate precipitation and grass NDVI, which indicated that light precipitation has stronger impact
than moderate or heavy precipitation. The reason is that annual total precipitation in the region was
mostly less than 150 mm and heavy precipitation is rare [61], but same threshold values (compared to
the entire RAA) for defining precipitation intensity levels were used.
Table 2. The composition and frequency of different intensity precipitation in annual total
precipitation in relative humid areas (RHA) and relative arid areas (RAA) respectively.
Composition indicates that precipitation total quantity (mm) in one year and frequency
indicates that the number of precipitation events in one year for each precipitation
intensity. These statistics were based on daily field measurements from weather stations with
164 stations in relative humid areas and 107 stations in relative arid areas.
Intensity
RHA RAA
Composition Frequency Composition Frequency
Quantity Percentage Number Percentage Quantity Percentage Number Percentage
Light 187.7 46.3% 139.3 87% 107.9 39.9% 102.8 86.2%
Moderate 112.4 27.8% 14.8 9% 62.5 23.1% 10 8.4%
Heavy 104.8 25.9% 6 3.7% 100 37% 6.4 5.4%
Precipitation excluding or enhancement experiments have shown that variations of precipitation
intensity significantly altered the grass growth and production [2,62]. In fact, changes in precipitation
also show large variations in different regions, with respect to precipitation amount, frequency or
intensity. Both historical and projected climate data show that extreme weather including the increase
in heavy precipitation will become more frequent in the next decades [63–65]. In our study, the
increase of heavy precipitation was not significant, due to the limited length of the study period,
whereas a significant increasing trend was found when the period was extended to the 1960s
(Figure S1). Effects of precipitation on vegetation are exerted in the form of charging soil water which
is normally deducted by surface runoff, soil and canopy evaporations. Changes in different features
(frequency, intensity or both) of precipitation may lead to substantially different effects on grasslands.
The 5th IPCC report [66] projects an increase in heavy precipitation events in northern China, and our
study shows that grass NDVI is more sensitive to heavy precipitation than light or moderate
precipitation, implying positive effects on grasslands, particularly on those arid or semi-arid grasslands.
However, northern China is an environmentally fragile region, especially in the northwestern part.
Soil erosion is becoming more and more serious, resulting from reclamation of natural vegetation
areas. Heavy precipitation is considered as an important factor to trigger soil erosion, particularly from

Remote Sens. 2015, 7 10177
July to September, when a sharp reduction in vegetation coverage occurs after wheat harvesting [67].
Therefore, only appropriate land-use shifts from agricultural lands to natural vegetation lands can
ensure that vegetation in northern China benefits from more heavy precipitation events in the future.
4.3. Outlook and Uncertainties in the Study
In this study, we investigated the effects of precipitation and growing season temperature on
grassland NDVI in northern China. The results showed that heavy precipitation had stronger influence
on grass NDVI than moderate and light precipitation. However, different levels of temperature are
expected to have different effects on grass growth, particularly for extremely hot and cold temperature.
For example, extreme heat waves have widely caused productivity reduction in Europe [68,69]. In
North America, the cooling trend of spring temperature caused NDVI decreased obviously [24]. With
the increasing trend of extreme days in northern China [59], more efforts should be focused on the
response of vegetation to different levels of temperature as well. Besides, biological aspects in both the
timing of precipitation event and their regularities could also play vital roles in influencing vegetation
growth. Water demand for vegetation growth in summer is much larger than in spring or autumn [28],
and summer drought has caused significant decrease in NDVI in inner Asia [16].
Other factors, including grazing activities and the accuracy of interpolated spatial climate data, may
distort the responses of NDVI to changes in precipitation and temperature. Grazing was typically to
decrease the aboveground biomass of grasslands but may also promote grass regrowth in some
cases [70]. The area with strong grazing activities accounts for only 10%–20% of grasslands in our study
region [71], so we assume that grazing will not significantly impact the result of our analysis.
Inaccuracy of interpolated climatic data can also be an important source of bias of the results. We
quantified uncertainty between interpolated data and observed values, showing that relative errors of
interpolation vary from 7% to 21% for annual precipitation, and from 5% to 18% for annual
temperature. Finally, spatial resolution of remote sensing dataset may also influence the response of
NDVI to climate. Coarse remote sensing data are able to reveal changes in vegetation cover and yield
comparable results regarding the temporal trends and spatial patterns compared with fine resolution
data [72,73]. Fine resolution data indeed provides additional information to identify vegetation
changes. However, disadvantages, both large data storage and long time required for image processing
may prohibit its application in large regions [74].
In addition, many other vegetation indices (VIs) can be used for researching vegetation changes in
response to climate change. NDVI is one of the most widely used indices, as it enables the elimination
of topographic effects and variations in the sun illumination angle, as well as other atmospheric
elements such as haze [11]. As well known, NDVI is easily saturated in densely vegetated regions,
indicating that derived signals are of high uncertainties [75,76]. Some other VIs, such as enhanced
vegetation index (EVI) [11], soil adjusted vegetation index (SAVI) [77], and atmospherically resistant
vegetation index (ARVI) [78], may reveal more in understanding the response of grass NDVI to
different levels of precipitation and temperature. Applications of these VIs into grassland ecosystems
in response to change in climate, and inter-comparisons between different VIs (including NDVI),
should be emphasized in future researches.

Remote Sens. 2015, 7 10178
5. Conclusions
A long time series of GIMMS NDVI dataset was used to correlate with precipitation intensity and
temperature in northern China. Growing season NDVI significantly increased at a rate of 0.0005 year−1
during the period from 1982 to 2011 and precipitation, to a great extent, could reflect the changes in
NDVI in relative arid areas. Changes in grassland NDVI were more sensitive to heavy precipitation
than light and moderate precipitation. The sensitivities of changes in grassland NDVI to heavy
precipitation were 0.37 and 0.19 in relative arid areas and relative humid areas, respectively, which
were very close to the sensitivities to total precipitation. We concluded that changes in grassland
NDVI were strongly impacted by heavy precipitation in 56% of northern China, but temperature
played a comparable role to precipitation in relative humid areas. In high altitude areas, temperature
was the main limiting factor for grass NDVI rather than precipitation.
Acknowledgments
This research was supported by the National Natural Science Foundation of China (Grant No.
U1403382 and 41171094) and an Australian Research Council Discovery Early Career Researcher
Award project (DE120103022).
Author Contributions
Longhui Li designed the study. Xiuliang Yuan processed the data. Xi Chen and Hao Shi gave
comments and suggestions on the manuscript. All authors interpreted the results and wrote the manuscript.
Conflicts of Interest
The authors declare no conflict of interest.
References
1. Braswell, B.H.; Schimel, D.S.; Linder, E.; Moore, B. The response of global terrestrial ecosystems
to interannual temperature variability. Science 1997, 278, 870–872.
2. Fay, P.A.; Kaufman, D.M.; Nippert, J.B.; Carlisle, J.D.; Harper, C.W. Changes in grassland
ecosystem function due to extreme rainfall events: Implications for responses to climate change.
Global Chang. Biol. 2008, 14, 1600–1608.
3. Piao, S.L.; Wang, X.H.; Ciais, P.; Zhu, B.; Wang, T.; Liu, J. Changes in satellite-derived
vegetation growth trend in temperate and boreal Eurasia from 1982 to 2006. Global Chang. Biol.
2011, 17, 3228–3239.
4. Ichii, K.; Kawabata, A.; Yamaguchi, Y. Global correlation analysis for NDVI and climatic
variables and NDVI trends: 1982–1990. Int. J. Remote Sens. 2010, 23, 3873–3878.
5. Pettorelli, N.; Vik, J.O.; Mysterud, A.; Gaillard, J.M.; Tucker, C.J.; Stenseth, N.C. Using the
satellite-derived NDVI to assess ecological responses to environmental change. Trends Ecol.
Evol. 2005, 20, 503–510.

Remote Sens. 2015, 7 10179
6. Lee, R.; Yu, F.; Price, K.P.; Ellis, J.; Shi, P. Evaluating vegetation phenological patterns in Inner
Mongolia using NDVI time-series analysis. Int. J. Remote Sens. 2002, 23, 2505–2512.
7. Myneni, R.B.; Keeling, C.D.; Tucker, C.J.; Asrar, G.; Nemani, R.R. Increased plant growth in the
northern high latitudes from 1981 to 1991. Nature 1997, 386, 698–702.
8. Zhou, L.M.; Tucker, C.J.; Kaufmann, R.K.; Slayback, D.; Shabanov, N.V.; Myneni, R.B.
Variations in northern vegetation activity inferred from satellite data of vegetation index during
1981 to 1999. J. Geophys. Res.-Atmos. 2001, 106, 20069–20083.
9. Xiao, X.; Ojima, D.S.; Parton, W.J.; Chen, Z.; Chen, D. Sensitivity of Inner Mongolia grasslands
to climate change. J. Biogeogr. 1995, 22, 643–648.
10. Yang, L.M.; Wylie, B.K.; Tieszen, L.L.; Reed, B.C. An analysis of relationships among climate
forcing and time-integrated NDVI of grasslands over the US northern and central Great Plains.
Remote Sens. Environ. 1998, 65, 25–37.
11. Huete, A.; Didan, K.; Miura, T.; Rodriguez, E.P.; Gao, X.; Ferreira, L.G. Overview of the
radiometric and biophysical performance of the MODIS vegetation indices. Remote Sens.
Environ. 2002, 83, 195–213.
12. Fang, J.Y.; Piao, S.L.; Zhou, L.M.; He, J.S.; Wei, F.Y.; Myneni, R.B.; Tucker, C.J.; Tan, K.
Precipitation patterns alter growth of temperate vegetation. Geophys. Res. Lett. 2005, 32, L21411.
13. Chamaille-Jammes, S.; Fritz, H.; Murindagomo, F. Spatial patterns of the NDVI-rainfall
relationship at the seasonal and interannual time scales in an African savanna. Int. J. Remote Sens.
2006, 27, 5185–5200.
14. Zhang, G.L.; Xu, X.L.; Zhou, C.P.; Zhang, H.B.; Ouyang, H. Responses of grassland vegetation
to climatic variations on different temporal scales in Hulun Buir Grassland in the past 30 years.
J. Geogr. Sci. 2011, 21, 634–650.
15. Yang, Y.H.; Fang, J.Y.; Ma, W.H.; Wang, W. Relationship between variability in aboveground
net primary production and precipitation in global grasslands. Geophys. Res. Lett. 2008, 35,
L23710.
16. Mohammat, A.; Wang, X.H.; Xu, X.T.; Peng, L.Q.; Yang, Y.; Zhang, X.P.; Myneni, R.B.;
Piao, S.L. Drought and spring cooling induced recent decrease in vegetation growth in Inner Asia.
Agric. For. Meteorol. 2013, 178, 21–30.
17. Wang, J.; Rich, P.M.; Price, K.P. Temporal responses of NDVI to precipitation and temperature in
the central Great Plains, USA. Int. J. Remote Sens. 2003, 24, 2345–2364.
18. Dai, L.; Zhang, L.; Wang, K.; Wang, R.L. Response of vegetation to climate change in the
drylands of East Asia. IOP Conf. Ser.: Earth Environ. Sci. 2014, 17, doi:10.1088/1755-1315/
17/1/012081.
19. Justice, C.O.; Holben, B.N.; Gwynne, M.D. Monitoring East-African vegetation using AVHRR
data. Int. J. Remote Sens. 1986, 7, 1453–1474.
20. Onema, J.M.K.; Taigbenu, A. NDVI-rainfall relationship in the Semliki watershed of the
equatorial Nile. Phys. Chem. Earth 2009, 34, 711–721.
21. Piao, S.L.; Fang, J.Y.; Zhou, L.M.; Guo, Q.H.; Henderson, M.; Ji, W.; Li, Y.; Tao, S. Interannual
variations of monthly and seasonal normalized difference vegetation index (NDVI) in China from
1982 to 1999. J. Geophys. Res.-Atmos. 2003, 108, D144401.

Remote Sens. 2015, 7 10180
22. Zhao, X.; Tan, K.; Zhao, S.; Fang, J. Changing climate affects vegetation growth in the arid
region of the northwestern China. J. Arid Environ. 2011, 75, 946–952.
23. Piao, S.L.; Mohammat, A.; Fang, J.Y.; Cai, Q.; Feng, J.M. NDVI-based increase in growth of
temperate grasslands and its responses to climate changes in China. Global Environ. Chang.-Hum.
Policy Dimens. 2006, 16, 340–348.
24. Wang, X.H.; Piao, S.L.; Ciais, P.; Li, J.S.; Friedlingstein, P.; Koven, C.; Chen, A.P. Spring
temperature change and its implication in the change of vegetation growth in North America from
1982 to 2006. Proc. Natl. Acad. Sci. USA 2011, 108, 1240–1245.
25. Park, H.S.; Sohn, B.J. Recent trends in changes of vegetation over East Asia coupled with
temperature and rainfall variations. J. Geophys. Res.-Atmos. 2010, 115, D14101.
26. Peng, S.S.; Piao, S.L.; Ciais, P.; Fang, J.Y.; Wang, X.H. Change in winter snow depth and its
impacts on vegetation in China. Global Chang. Biol. 2010, 16, 3004–3013.
27. Del Grosso, S.; Parton, W.; Stohlgren, T.; Zheng, D.L.; Bachelet, D.; Prince, S.; Hibbard, K.;
Olson, R. Global potential net primary production predicted from vegetation class, precipitation,
and temperature. Ecology 2008, 89, 2117–2126.
28. Peng, S.S.; Chen, A.P.; Xu, L.; Cao, C.X.; Fang, J.Y.; Myneni, R.B.; Pinzon, J.E.; Tucker, C.J.;
Piao, S.L. Recent change of vegetation growth trend in China. Environ. Res. Lett. 2011, 6.
doi:10.1088/1748-9326/6/4/044027.
29. Ni, J. Estimating net primary productivity of grasslands from field biomass measurements in
temperate northern China. Plant Ecol. 2004, 174, 217–234.
30. Zhai, P.M.; Zhang, X.B.; Wan, H.; Pan, X.H. Trends in total precipitation and frequency of daily
precipitation extremes over China. J. Clim. 2005, 18, 1096–1108.
31. Qian, W.; Lin, X. Regional trends in recent precipitation indices in China. Meteorol. Atmos. Phys.
2005, 90, 193–207.
32. Wu, F.T.; Fu, C.B. Change of precipitation intensity spectra at different spatial scales under
warming conditions. Chin. Sci. Bull. 2013, 58, 1385–1394.
33. Song, S.; Li, L.; Chen, X.; Bai, J. The dominant role of heavy precipitation in precipitation
change despite opposite trends in west and east of northern China. Int. J. Climatol. 2015,
doi:10.1002/joc.4290.
34. Zhang, L.; Guo, H.; Jia, G.; Wylie, B.; Gilmanov, T.; Howard, D.; Ji, L.; Xiao, J.; Li, J.;
Yuan, W.; et al. Net ecosystem productivity of temperate grasslands in northern China: An
upscaling study. Agric. For. Meteorol. 2014, 184, 71–81.
35. Yang, Y.H.; Fang, J.Y.; Fay, P.A.; Bell, J.E.; Ji, C.J. Rain use efficiency across a precipitation
gradient on the Tibetan Plateau. Geophys. Res. Lett. 2010, 37, doi:10.1029/2010GL043920.
36. Dataset of Global Inventory Modeling and Mapping Studies NDVI3g. Available online:
http://ecocast.arc.nasa.gov/data/pub/gimms/3g/ (accessed on 25 Septemper 2014).
37. Hogda, K.A.; Tommervik, H.; Karlsen, S.R. Trends in the start of the growing season in
Fennoscandia 1982–2011. Remote Sens. 2013, 5, 4304–4318.
38. Wang, J.B.; Dong, J.W.; Liu, J.Y.; Huang, M.; Li, G.C.; Running, S.W.; Smith, W.K.; Harris, W.;
Saigusa, N.; Kondo, H.; et al. Comparison of gross primary productivity derived from GIMMS
NDVI3g, GIMMS, and MODIS in Southeast Asia. Remote Sens. 2014, 6, 2108–2133.

Remote Sens. 2015, 7 10181
39. Holben, B.N. Characteristics of maximum-value composite images from temporal Avhrr data.
Int. J. Remote Sens. 1986, 7, 1417–1434.
40. Dataset of Daily Precipitation and Temperature from China Meteorological Data Sharing Service
System. Available online: http://cdc.cma.gov.cn (accessed on 5 Septemper 2012).
41. Liston, G.E.; Elder, K. A meteorological distribution system for high-resolution terrestrial
modeling (MicroMet). J. Hydrometeorol. 2006, 7, 217–234.
42. Ly, S.; Charles, C.; Degre, A. Different methods for spatial interpolation of rainfall data for
operational hydrology and hydrological modeling at watershed scale. A review. Biotechnol.
Agron. Soc. Environ. 2013, 17, 392–406.
43. Masih, I.; Maskey, S.; Uhlenbrook, S.; Smakhtin, V. Assessing the impact of areal precipitation
input on streamflow simulations using the SWAT model. J. Am. Water Resour. Assoc. 2011, 47,
179–195.
44. Qian, W.H.; Fu, J.K.; Yan, Z.W. Decrease of light rain events in summer associated with a
warming environment in China during 1961–2005. Geophys. Res. Lett. 2007, 34, L11705.
45. Zhai, P.M.; Sun, A.J.; Ren, F.M.; Liu, X.N.; Gao, B.; Zhang, Q. Chances of climate extremes in
China. Clim. Chang. 1999, 42, 203–218.
46. Peng, S.S.; Piao, S.L.; Shen, Z.H.; Ciais, P.; Sun, Z.Z.; Chen, S.P.; Bacour, C.; Peylin, P.;
Chen, A.P. Precipitation amount, seasonality and frequency regulate carbon cycling of a semi-arid
grassland ecosystem in Inner Mongolia, China: A modeling analysis. Agric. For. Meteorol. 2013,
178, 46–55.
47. Karl, T.R.; Knight, R.W. Secular trends of precipitation amount, frequency, and intensity in the
United States. Bull. Am. Meteorol. Soc. 1998, 79, 231–241.
48. Liu, B.; Xu, M.; Henderson, M. Where have all the showers gone? Regional declines in light
precipitation events in China, 1960–2000. Int. J. Climatol. 2011, 31, 1177–1191.
49. Alpert, P.; Ben-Gai, T.; Baharad, A.; Benjamini, Y.; Yekutieli, D.; Colacino, M.; Diodato, L.;
Ramis, C.; Homar, V.; Romero, R.; et al. The paradoxical increase of Mediterranean extreme daily
rainfall in spite of decrease in total values. Geophys. Res. Lett. 2002, 29, 101536.
50. Osborn, T.J.; Hulme, M.; Jones, P.D.; Basnett, T.A. Observed trends in the daily intensity of
United Kingdom precipitation. Int. J. Climatol. 2000, 20, 347–364.
51. Dataset of Global Aridity and Potential Evapotranspiration. Avaiable online: http://www.cgiar-
csi.org/data/global-aridity-and-pet-database (accessed on 5 April 2014).
52. UNEP (United Nations Environment Programme). World Atlas of Desertification 2ED; UNEP:
London, UK, 1997.
53. Peng, J.; Dong, W.J.; Yuan, W.P.; Zhang, Y. Responses of grassland and forest to temperature
and precipitation changes in Northeast China. Adv. Atmos. Sci. 2012, 29, 1063–1077.
54. Yuan, X.; Li, L.; Chen, X. Increased grass NDVI under contrasting trends of precipitation change
over North China during 1982–2011. Remote Sens. Lett. 2015, 6, 69–77.
55. Bai, Y.F.; Wu, J.G.; Xing, Q.; Pan, Q.M.; Huang, J.H.; Yang, D.L.; Han, X.G. Primary production
and rain use efficiency across a precipitation gradient on the Mongolia plateau. Ecology 2008, 89,
2140–2153.
56. Piao, S.L.; Fang, J.Y.; Zhou, L.M.; Ciais, P.; Zhu, B. Variations in satellite-derived phenology in
China’s temperate vegetation. Global Chang. Biol. 2006, 12, 672–685.

Remote Sens. 2015, 7 10182
57. Li, F.; Zhao, W.Z.; Liu, H. The response of aboveground net primary productivity of desert
vegetation to rainfall pulse in the temperate desert region of Northwest China. PLoS ONE 2013, 8,
doi:10.1371/journal.pone.0073003.
58. Nemani, R.R.; Keeling, C.D.; Hashimoto, H.; Jolly, W.M.; Piper, S.C.; Tucker, C.J.; Myneni, R.B.;
Running, S.W. Climate-driven increases in global terrestrial net primary production from 1982 to
1999. Science 2003, 300, 1560–1563.
59. Piao, S.L.; Nan, H.J.; Huntingford, C.; Ciais, P.; Friedlingstein, P.; Sitch, S.; Peng, S.S.;
Ahlstrom, A.; Canadell, J.G.; Cong, N.; et al. Evidence for a weakening relationship between
interannual temperature variability and northern vegetation activity. Nat. Commun. 2014, 5,
doi:10.1038/ncomms6018.
60. He, Z.; Zhao, W.; Liu, H.; Chang, X. The response of soil moisture to rainfall event size in
subalpine grassland and meadows in a semi-arid mountain range: A case study in northwestern
China’s Qilian Mountains. J. Hydrol. 2012, 420–421, 183–190.
61. Li, Q.H.; Chen, Y.N.; Shen, Y.J.; Li, X.G.; Xu, J.H. Spatial and temporal trends of climate change
in Xinjiang, China. J. Geogr. Sci. 2011, 21, 1007–1018.
62. Heisler-White, J.L.; Blair, J.M.; Kelly, E.F.; Harmoney, K.; Knapp, A.K. Contingent productivity
responses to more extreme rainfall regimes across a grassland biome. Global Chang. Biol. 2009,
15, 2894–2904.
63. Easterling, D.R.; Meehl, G.A.; Parmesan, C.; Changnon, S.A.; Karl, T.R.; Mearns, L.O. Climate
extremes: Observations, modeling, and impacts. Science 2000, 289, 2068–2074.
64. Karl, T.R.; Knight, R.W.; Plummer, N. Trends in high-frequency climate variability in the
20th-century. Nature 1995, 377, 217–220.
65. Shi, Y.F.; Shen, Y.P.; Kang, E.; Li, D.L.; Ding, Y.J.; Zhang, G.W.; Hu, R.J. Recent and future
climate change in northwest China. Clim. Chang. 2007, 80, 379–393.
66. Stocker, T.; Qin, D.; Plattner, G.; Tignor, M.; Allen, S.; Boschung, J.; Nauels, A.; Xia, Y.;
Bex, V.; Midgley, P. IPCC 2013: Climate change 2013: The physical science basis. In
Proceedings of the Contribution of Working Group I to the Fifth Assessment Report of the
Intergovernmental Panel on Climate Change, Stockholm, Sweden, 23–26 September 2013;
Cambridge University Press: Cambridge, UK; New York, NY, USA, 2014; pp. 213–214.
67. Wang, T.M.; Kou, X.J.; Xiong, Y.C.; Mou, P.; Wu, J.G.; Ge, J.P. Temporal and spatial patterns of
NDVI and their relationship to precipitation in the Loess Plateau of China. Int. J. Remote Sens.
2010, 31, 1943–1958.
68. Ciais, P.; Reichstein, M.; Viovy, N.; Granier, A.; Ogee, J.; Allard, V.; Aubinet, M.;
Buchmann, N.; Bernhofer, C.; Carrara, A.; et al. Europe-wide reduction in primary productivity
caused by the heat and drought in 2003. Nature 2005, 437, 529–533.
69. Reichstein, M.; Ciais, P.; Papale, D.; Valentini, R.; Running, S.; Viovy, N.; Cramer, W.; Granier, A.;
Ogee, J.; Allard, V.; et al. Reduction of ecosystem productivity and respiration during the
European summer 2003 climate anomaly: A joint flux tower, remote sensing and modelling
analysis. Global Chang. Biol. 2007, 13, 634–651.
70. Luo, G.P.; Han, Q.F.; Zhou, D.C.; Li, L.; Chen, X.; Li, Y.; Hu, Y.K.; Li, B.L. Moderate grazing
can promote aboveground primary production of grassland under water stress. Ecol. Complex.
2012, 11, 126–136.

Remote Sens. 2015, 7 10183
71. Kang, L.; Han, X.; Zhang, Z.; Sun, O.J. Grassland ecosystems in China: Review of current
knowledge and research advancement. Philos. Trans. R. Soc. Lond. B Biol. Sci. 2007, 362,
997–1008.
72. Stellmes, M.; Udelhoven, T.; Röder, A.; Sonnenschein, R.; Hill, J. Dryland observation at local
and regional scale—Comparison of Landsat TM/ETM+ and NOAA AVHRR time series.
Remote Sens. Environ. 2010, 114, 2111–2125.
73. De Beurs, K.M.; Wright, C.K.; Henebry, G.M. Dual scale trend analysis for evaluating climatic
and anthropogenic effects on the vegetated land surface in Russia and Kazakhstan. Environ. Res.
Lett. 2009, 4, doi:10.1088/1748-9326/4/4/045012.
74. Lu, D.S. The potential and challenge of remote sensing-based biomass estimation. Int. J. Remote
Sens. 2006, 27, 1297–1328.
75. Mróz, M.; Sobieraj, A. Comparison of several vegetation indices calculated on the basis of
a seasonal SPOT XS time series, and their suitability for land cover and agricultural crop
identification. Tech. Sci. 2004, 7, 39–66.
76. Asner, G.P.; Nepstad, D.; Cardinot, G.; Ray, D. Drought stress and carbon uptake in an Amazon
forest measured with spaceborne imaging spectroscopy. Proc. Natl. Acad. Sci. USA 2004, 101,
6039–6044.
77. Huete, A.R. A soil-adjusted vegetation index (SAVI). Remote Sens. Environ. 1988, 25, 295–309.
78. Kaufman, Y.J.; Tanre, D. Atmospherically resistant vegetation index (ARVI) for EOS-MODIS.
IEEE Trans. Geosci. Remote Sens. 1992, 30, 261–270.
© 2015 by the authors; licensee MDPI, Basel, Switzerland. This article is an open access article
distributed under the terms and conditions of the Creative Commons Attribution license
(http://creativecommons.org/licenses/by/4.0/).