Embed Size (px)
Citation preview
Biochemistry 1982, 21, 3327-3334
Effects of pH on Low-Salt Transition of Chromatin Core Particles?
Louis J. Libertini and Enoch W. Small*
ABSTRACT: The low-salt transition of chicken erythrocyte core particles containing uniform 145 base pair DNA was studied as a function of pH and of salt concentration. Intrinsic tyrosine fluorescence was used to follow the changes. Potassium salts of the anions C1-, H2P04-, and S042- were indistinguishable in their ability to affect the transition. Divalent cations (Mg2+, Mn2+, CaZ+) were effective at 36-fold lower total concentration than monovalent cations (Li', Na+, K+, Tris'), but no sig- nificant differences were observed within the two classes of cations. These results indicate that cation binding to the core particle is involved in the transition. At pH 9 the transition was broadened and shifted to higher monovalent cation con- centration as compared to that at pH 6. At both pHs the
C h r o m a t i n structure consists of successive levels of DNA organization mediated by a number of proteins. At the lowest level is the nucleosome that contains a core of two each of the four inner histones (H2a, H2b, H3, and H4)' about which is wrapped up to 200 base pairs of DNA [for a review, see McGhee & Felsenfeld (1980)l. A ninth histone molecule (Hl) binds to the outside of this structure and is implicated in the formation of higher order structures, including a 10-nm fila- ment as well as a 30-nm fiber (McGhee & Felsenfeld, 1980; Suau et al., 1979; McGhee et al., 1980). Higher orders of folding also occur such as the 400-nm fiber, which has been observed in mitotic chromosome fragments (Bak et al., 1977).
Transcription and replication of the DNA must require at least partial disruption of this organization. A possible model of such a change is provided by a transition from the 30-nm filament to the 10-nm form, which occurs as the salt con- centration is lowered (Suau et al., 1979; Thoma et al., 1979; McGhee et al., 1980; Butler & Thomas, 1980). Another transition that has been studied extensively occurs when chromatin core particles (145 base pairs of DNA and the eight inner histones) are exposed to very low salt concentrations. This change has been studied by a number of physical tech- niques [see references cited in McGhee & Felsenfeld (1980); see also Burch & Martinson (1980a,b), Dieterich & Cantor (1981), and Harrington (1981)l and has been characterized as an opening up or unfolding of the core particle. Such a change, if it occurs in vivo, would be expected to increase the local accessibility of the DNA to polymerases and other en- zymes and to contribute to the disruption of higher order structure.
We previously reported (Libertini & Small, 1980) that the fluorescence polarization of the intrinsic tyrosine residues within the core particle is sensitive to the changes occurring at very low salt. Tyrosine fluorescence changes reflect changes in the protein component of core particles and thus compliment techniques such as circular dichroism, which reports mainly on the DNA, and sedimentation, which reflects properties of the particle as a whole. Furthermore, the approach does not
'From the Department of Biochemistry and Biophysics, Oregon State University, Corvallis, Oregon 97331. Received November 3, 1981. This work was supported by National Institutes of Health Grant GM 25663.
0006-2960/82/042 1 -3327%0 1.2510
3327
fluorescence changes could be resolved into two steps by nu- merical least-squares analysis. On the basis of what is known about histone-histone interactions, a two-step mechanism is suggested, involving changes in the interactions between dimers of histones 2a and 2b with a tetramer of histones 3 and 4. The pH-induced changes appear to be correlated with a structural transition, which was detected as a function of pH at near physiological ionic strength (0.1 M). This structural change was accompanied by a small decrease in the tyrosine fluorescence anisotropy. An apparent pK, value near 7 is indicated, suggesting that the structural changes involved may be of physiological significance.
require modifications of the histones, which may significantly perturb the structure under investigation (Spiker & Isenberg, 1977; Lewis & Chiu, 1980; Windgender et al., 1981). We report here on further studies of chromatin core particles at low salt, including effects of pH and of different ions on the transition.
Materials and Methods
Core particles were prepared from chicken erythrocytes as described (Libertini & Small, 1980). Electrophoretic analysis of the DNA length and protein content indicated a narrow DNA distribution centered at 145 bp and the four core histones in equal proportions.
For experiments at very low ionic strength, a concentrated core particle stock solution (2 mL, A260 - 80) was dialyzed at 4 "C for 6, 12, and 24 h against successive 1000-mL vol- umes of 1 mM potassium phosphate, pH 7.0, and 0.5 mM 2-mercaptoethanol. The conductivity of the dialyzed sample was typically 4-6 times that of the final dialysis buffer, in- dicating that the extent or rate of dialysis was limited by the polyelectrolyte character of the core particles. It was assumed that the unbound potassium ion concentration in the sample was higher by the same proportion as the difference in con- ductivity. The estimated K+ concentration (-8 mM) corre- sponds to about 200 potassium ions per particle, a number equal to the overall negative charge (not considering bound counterions) that can be estimated for core particles near pH 7 (Wu et al., 1979). Dialysis to lower ionic strength has not been pursued since this would require lower buffering capacity in the dialysis with the accompanying risk of low pH values resulting from carbon dioxide absorption.
Unless otherwise indicated, the parameter [M'] indicates the total monovalent cation concentration, including potassium ions added with the core particles and any buffer components (e.g., Tris-H+ ions) added to give different pH values, as well as salts added to vary [M+] over a range.
Abbreviations: bp, base pairs; H1, H2a, H2b, H3, and H4, the respective histones; r , anisotropy; I , intensity; p, ionic strength; Tris, tris(hydroxymethy1)aminornethane; EDTA, ethylenediarninetetraacetic acid.
0 1982 American Chemical Society

3328 B I O C H EM IS T R Y L I B E R T I N I A N D S M A L L
-4 -3 -2 - 1 3 I
FIGURE 1: Effect of salt concentration on tyrwine fluorescence. intensity (A) and anisotropy (B) of core particles. Two separate experiments at low (0) and at high (0) salt concentrations have been combined. The data at low salt (pH 7) were obtained as described under Materials and Methods. The high-salt results were obtained with a core particle concentration of 0.5 MM (A260 = l) , buffered with 0.01 M Tris-HC1, pH 7.5. The total monovalent cation concentration, [M'], was varied with KCI.
Tyrosine fluorescence intensity and anisotropy were mea- sured on a computer-interfaced fluorescence anisotropy spectrometer (Ayers et al., 1974). Excitation was at 280 nm with emission at 325 nm (Libertini & Small, 1980). The cuvette used was of suprasil quartz and measured 3 mm X 3 mm (X24-mm height); the small path lengths minimize both inner filter effects and the amount of sample needed (100 pL). Temperature was maintained at 20 OC.
Each data point in the figures corresponds to an individual sample prepared by diluting and rapidly mixing the core particle stock (A2@ = 80) into a solution of volume and com- position such as to give the indicated final [M+] and pH. The final core particle concentration was normally 1 pM (A260 = 2), although lower concentrations were used where indicated. Generally fluorescence was measured 1 h after preparing the sample, followed immediately by direct determination of the sample pH with an MI-410 microcombination pH probe (Microelectrodes, Inc., Londonderry, NH). The pH of the core particle stock solution was 7.0, but when diluted into water or unbuffered salt solution, the resulting pH was between 5.5 and 6.2 (depending on the salt concentration). The low pH values are presumably due to the carbon dioxide content of the water. To obtain higher or lower pH values, we included minimal concentrations of either Tris base or acetic acid.
Results Effect of Ionic Strength on Core Particle Tyrosine
Fluorescence. Figure 1 illustrates the sensitivity of core particle tyrosine fluorescence to ionic strength in the range 0.2 mM to nearly 4 M. At salt concentrations correlated with disso- ciation of the histones from the DNA (0.6-2 M Burton et al., 1978; Jorcano & Ruiz-Carrillo, 1979), the fluorescence in- tensity ( I ) increases by 150%. This change is accompanied by a decrease in the anisotropy ( r ) between 0.6 and 1.4 M salt, followed by an increase in r above 1.4 M. The increase from 1.4 to 4 M salt is also observed with core histones separated from DNA (unpublished observations), which suggests that it results from the known association of histones to the octamer at very high salt [see, for example, Godfrey et al. (1980) and references cited therein].
A much smaller increase in I (-20%) is seen as the salt concentration is decreased below 5 mM. This change is ac- companied by a decrease in r of magnitude comparable to that observed at very high salt. The changes in r and I do not reach a plateau even at 0.2 mM salt, in agreement with earlier observations (Libertini & Small, 1980).
log [M*l 2 4 6 8 1 0 1 2
[M'l FIGURE 2: Effect of different monovalent cations and anions and divalent ion on low-salt transition of core particles. The filled circles represent the anisotropy obtained without added salt. The following salts were tested: (A) LiCl (0), NaCl (A), and KC1 (0); (B) Tris-HC1 (0), Na2S0, (A), and KH2P04 (0). The pH varied between 6.1 and 6.3. Note that this figure shows the dependence of r on [M'] while all other figures are plotted against log [MI, The solid curves in A and B are identical.
Distinct changes in the core particle sedimentation coeffi- cient accompanied by changes in the circular dichroism of the DNA have been reported for salt concentrations between 6 mM and 0.6 M (Wilhelm & Wilhelm, 1980). The tyrosine fluorescence is relatively insensitive to these changes although, on a more expanded scale than in Figure 1, small changes in this region are observed (see below).
The remainder of this report will be limited to changes observed at very low salt concentrations. Further studies on the high-salt dissociation will be reported separately.
Time Dependence of Low-Salt Transition. The core par- ticles used in these experiments were prepared by dilution of a concentrated stock solution at a salt concentration well above the range over which transition is observed. The time de- pendence of the fluorescence parameters was determined after such dilution to an ionic strength of about 0.1 mM. In the pH range 4.3-8.7 the half-time of the transition was less than 5 min; thus the transition was complete within 30 min, and no further change was apparent for up to 5 h. In one ex- periment at pH 7, fluorescence was determined 1 and 4 h after dilution to ionic strengths covering the full range of the low-salt transition. No differences in the results for the two times were observed. For the results that are presented here, the fluorescence and sample pH were determined 1 h after dilution of the core particles to the indicated ionic conditions.
Effects of Different Ionic Species on Low-Salt Transition. We reported previously (Libertini & Small, 1980) that there was no difference between NaCl, KC1, and Tris-HC1 in their effect on the low-salt transition at pH 7 . 5 . We have repeated those measurements at pH 6.2 and extended them to LiCl, Na2S04, and KH2P04. The results are presented in Figure 2 . Although LiCl and Tris-HC1 appear to give somewhat higher values of r at a given concentration than NaCl and KC1, the differences are small. Changing the anion to H2P04- or to the divalent anion S042- also has a negligible effect on the shape or position of the transition. Also, K-EDTA was found to give results very similar to those of KCl at pH 7 (results not shown).
The effect of salts containing divalent cations on the low-salt transition is shown in Figure 3. Little difference is apparent between MgC12, MnCI2, and CaCI,. However, as has been reported (Wu et al., 1979), the divalent cation induced changes occur at concentrations much lower than those observed with monovalent cations. Figure 3A also shows an effect of divalent cation concentration on the pH of the core particle solution. Over the range of salt concentration that affects the low-salt

P H E F F E C T S O N C H R O M A T I N C O R E P A R T I C L E S
I I -6 -5 -4 -3
log CM"1 FIGURE 3: Effect of divalent cations on sample pH (A) and on core particle tyrosine fluorescence intensity and anisotropy (B) at very low salt concentrations. The salts tested were MgCl, (0, O), MnC12 (0, m), and CaC1, (A, A). The solid curve drawn through the anisotropy data is a simulation by using the result in Table I1 with nl = 3 and n2 = 3.
l " " " 1
d P 1 ' ' ' ' ' i
! 4 5 6 7 8 9
DH FIGURE 4: Effect of pH on tyrosine fluorescence intensity (A) and anisotropy (B) of core particles at very low salt [about 0.1 mM KCI (O!, at 10 mM KCl (A), and at 100 mM KCl ( O ) ] . The pH was varied by adding low concentrations (0.01-1 mM) of Tris base or of acetic acid. The core particle concentration was 0.5 pM (A,,, = 1).
transition (0-20 pM), the pH of the sample was essentially constant. Above 20 pM a distinct shift in the pH occurs, centered near 50 pM Mz+. In the absence of core particles (by using the buffer against which the core particle stock solution had been dialyzed, with an appropriate dilution), no pH change is obtained on adding 1 mM MgCI,. The mag- nitude of the pH change in Figure 3A indicates a decrease in hydrogen ion concentration at low salt of about 2 pM. Since the core particle concentration was 1 pM (Azao = 2.0), the binding of at least two H+ ions per core particle is indicated. The uncertainty arises from the unknown buffering capacity of the core particle solution within the pH range observed. A much broader pH change analogous to that in Figure 3A is observed when K+ is used to titrate the transition. For both types of cations little change in either the fluorescence intensity or anisotropy is observed as the pH shift occurs.
Effects of p H on Core Particle. The effect of pH on the core particle tyrosine fluorescence properties is shown in Figure 4 for three salt concentrations. At 10 and 100 mM ionic strength (triangles and squares, respectively), the anisotropy indicates a transition centered near pH 7 and having a shape that suggests a simple titration. This transition has been characterized in greater detail (at 0.1 14.12 M salt) and was found to also result in a small change in DNA circular di- chroism without significant effect on the histone circular di-
V O L . 2 1 , N O . 1 4 , 1 9 8 2 3329
r I
I J
-4 -3 -2 - I
log [MI FIGURE 5 : Effect of pH on low-salt transition of core particles. The samples were prepared and analyzed as described under Materials and Methods by using KC1 to vary [M']. (A) Results near pH 6 (no added buffer); the pH was constant at 6.0 through the transition but dropped to 5.6 as [M'] increased from 2 to 100 mM. (B) Results near pH 7 (with 0.1 mM Tris base); the pH varied between 6.7 and 7.0. (C) Results near pH 9 (with 0.2 mM Tris base); the pH increased with [M'] from 8.6 to 9.0 over the range of the transition and then to 9.2 between 10 and 100 mM. The effect of [M+] on pH in (B) and (C) is probably due to salt effects on the buffer. At pH 6 (A) the change in pH above [M'] = 2 mM is related to a change in the core particles (see Figure 3 and related text). The solid lines drawn through the anisotropy data are simulations based on the results in Table I1 with (A) n, = 1 and n2 = 3, (B) n1 = 2 and n2 = 4, and (C) nl = 3 and n2 = 3. In (D) the three curves are drawn together to permit direct comparison. The curves through the intensity data are not simulations.
chroism or on the core particle sedimentation coefficient (L. J. Libertini and E. W. Small, unpublished results). At very low cation concentration (about 0.1 mM; circles in Figure 4), the transition is still apparent but less distinct and possibly shifted to a higher pH. Below pH 4 the fluorescence changes accompany precipitation of the core particles as indicated by light scattering measurements at 400 nm. Between pH 4 and pH 6, at 10 and 100 mM ionic strength, little change in the fluorescence intensity or anisotropy is observed. Decreasing the pH at 0.1 mM ionic strength below 6, on the other hand, results in a sharp rise in the anisotropy centered near pH 5 and accompanied by an equally sharp drop in the intensity. The magnitudes of these latter changes are comparable to

3330 B I O C H E M I S T R Y L I B E R T I N I A N D S M A L L
those obtained with increasing salt at pH 6 (see also Figure 5A) such that, near pH 4, no effect of salt concentration is apparent. Thus it appears that proton binding to the core particle can prevent the transition from the high-salt to the low-salt form. Zama et ai. (1978) observed a core particle transition with decreasing pH centered near 5. Their transition was characterized by a large increase in DNA circular di- chroism with decreasing pH and a smaller change in histone circular dichroism.
The dependence of the tyrosine fluorescence parameters on salt concentration is illustrated in Figure 5 for pH values close to 6, 7, and 9 (panels A, B, and C of Figure 5, respectively). In Figure 5D, the curves drawn through the anisotropy date are combined to facilitate comparison. These curves were calculated on the basis of the data analysis described in the next section. The dashed curves through the intensity data were fitted by eye. The effect of increasing pH is a shift to higher ionic strength accompanied by a broadening of the transition. The minimum and maximum anisotropies change with pH as can also be seen in Figure 4.
Discussion Hi-
stone-histone interactions, as exemplified by formation of the strongly associated H2a-H2b dimer and the H3-H4 tetramer, do not typically result in changes in I even as large as 20% (D'Anna & Isenberg, 1974a,b). Correlation between the 2.5-fold increase in intensity (above 0.6 M salt in Figure 1A) with dissociation of the histones from the DNA clearly suggests that DNA-histone interactions are responsible for the fluorescence quenching. A likely mechanism for such quenching is Forster radiationless energy transfer from the excited tyrosine residues to the nonfluorescent DNA bases; calculations by Montenay-Garestier (1 976) suggest that such transfer will be efficient over distances greater than 15 A. Considering the large number of nucleotides that surround the core histones, it is somewhat surprising that the quenching is not even more effective than is observed.
The significance of the small intensity change observed at very low salt can best be understood by comparison with the effect of urea on I . At 0.015 M NaCl, addition of 5-6 M urea increases the intensity by only 40% (Libertini & Small, 1980). At 6 M, urea does not dissociate histones from the DNA but is known to severely disrupt histone secondary structure in core particles (Zama et al., 1977). Thus the observed 20% increase in I at very low ionic strength is consistent with extensive rearrangements within the core particle. Models that have been proposed for the low-salt transition (Gordon et al., 1978; Wu et al., 1979; Harrington, 1981) would require such ex- tensive changes.
In order to appreciate the magnitude of the anisotropy changes in Figure 1 B, it is necessary to know something about the maximum changes in r that are likely. Core particles disrupted by urea maintain a surprisingly high anisotropy of 0.12 (Libertini & Small, 1980), which can be taken as a lower limit. The absolute upper limit with excitation at 280 nm is 0.26 [the value for tyrosine in frozen solution (Weber, 1960a)l .2 However, proteins like the histones, which contain multiple tyrosine residues, have been found to have limiting anisotropies (measured at -77 K with 280-nm excitation) as
Interpretation of Tyrosine Fluorescence Changes.
Weber (1960a.b) gives fluorescence polarization values rather than anisotropies. The anisotropy ( r ) can be calculated from the polarization @) by the relation r = 2 p / ( 3 - p ) . The polarization values reported by Weber also need correction due to the use of an unpolarized excitation (Weber, 1960a).
low as 0.18, a fact that has been attributed to radiationless energy transfer between residues (Weber, 1960b). Therefore, the anisotropy change from 0.12 to 0.18 may correspond to a change from a highly disorganized DNA-histone complex to a tightly organized particle in which the tyrosine side chains are fully immobilized. In comparison, the anisotropy change observed for the low-salt transition (from 0.14 to 0.17) may also indicate major rearrangements within the core particle.
Analysis of Low-Salt Transition. The driving force for the low-salt transition is probably electrostatic repulsion within the core particle, resulting from a large excess negative charge at near neutral pH (Wu et al., 1979). The electrostatic po- tential energy of a polyelectrolyte (the core particle) will be affected by salt concentration in two ways (Manning, 1969): electrostatic (Debye-Hiickel) shielding by the ions in solution and binding of counterions to the polyelectrolyte. If electro- static shielding alone were responsible for the low-salt tran- sition, then both monovalent and divalent cations should induce the transition at the same ionic strength ( p ) , which is not observed. Also, when plotted against log p, the effects of divalent ion concentration are much sharper than those with monovalent ions. Therefore cation binding to the core particle is involved in the low-salt transition. Since no differences were observed between the anions tested, anion binding is unlikely to be involved.
A simple model for the transition assumes that the core particle can exist in two states, a high-salt form (A) and a low-salt form (C) in a thermodynamic equilibrium that in- cludes a number ( n ) of salt cations
A s C + n M (la)
where K is an apparent equilibrium constant. The model will be referred to as the one-step model. The dependence of the observed fluorescence intensity (Iobsd) and the product of the intensity and the anisotropy (Iobsdrobsd) will be given by
where the subscripts a and c designate quantities associated with species A and C and the square brackets ( [ I ) designate concentrations. The anisotropy is given by
Iobsdrobsd robsd = - Iobsd = ( raF + . c ) / (
( lb)
where K' = (Zc/Za)K. Wu et al. (1979) applied the one-step model to analyze changes in the reduced electric dichroism of core particles at very low salt. Their approach involved transformation of the results to a form that could be analyzed by linear regression. However, such an approach cannot be extended to more complicated models, and we have taken the alternative of computer fitting the experimental data to eq lb. The goodness of fit was estimated by calculation of a root mean square (rms) value
N
i= 1 (rmsI2 = (l/wX(robsd - r)i2
where N is the number of experimental data points, r is the experimental anisotropy at [MIi, and robsd is given by eq lb.
P H E F F E C T S O N C H R O M A T I N C O R E P A R T I C L E S
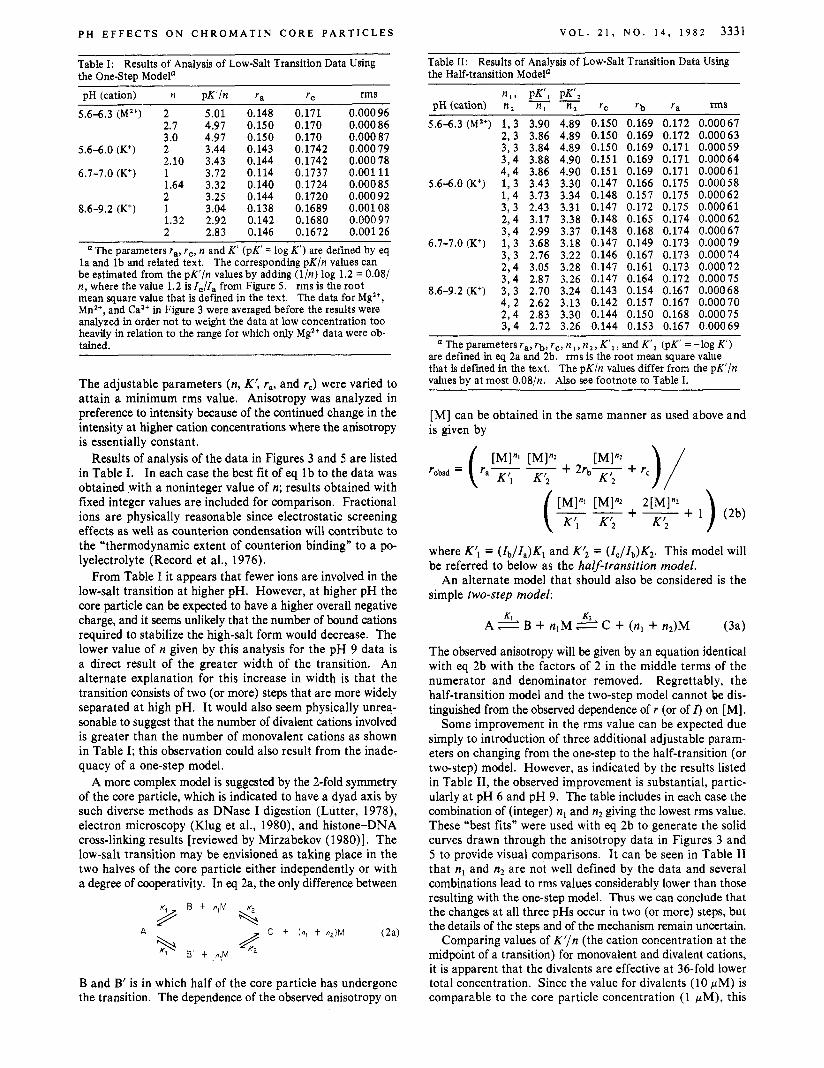
Table I : Results of Analysis of Low-Salt Transition Data Using the One-Stea Modela pH (cation) n p K ’ / n r , rC rms
5 . 6 2 2 (M2+) 2 2.7 3.0
2.10 6.7-7.0 (K’) 1
1.64 2
8.6-9.2 (K’) 1 1.32 2
5.6-6.0 (K’) 2
5.01 4.97 4.97 3.44 3.43 3.72 3.32 3.25 3.04 2.92 2.83
0.148 0.150 0.150 0.143 0.144 0.114 0.140 0.144 0.138 0.142 0.146
0.171 0.170 0.170 0.1742 0.1742 0.1737 0.1724 0.1720 0.1689 0.1680 0.1672
0.000 96 0.000 86 0.000 87 0.000 79 0.000 78 0.001 11 0.000 85 0.000 92 0.001 08 0.000 97 0.001 26
The parameters ra, rc, n and K ’ (pK’ = log K ‘ ) are defined by eq la and lb and related text. The corresponding p K / n values can be estimated from the p K ‘ / n values by adding ( l /n) log 1.2 = 0.08/ n , where the value 1.2 isIc/Ia from Figure 5. rms is the root mean square value that is defined in the text. The data for MgZ+, Mn2+, and Calf in Figure 3 were averaged before the results were analyzed in order not to weight the data at low concentration too heavily in relation to the range for which only MgZ+ data were ob- tained.
The adjustable parameters (n, K’, ra, and rc) were varied to attain a minimum rms value. Anisotropy was analyzed in preference to intensity because of the continued change in the intensity at higher cation concentrations where the anisotropy is essentially constant.
Results of analysis of the data in Figures 3 and 5 are listed in Table I. In each case the best fit of eq 1 b to the data was obtained with a noninteger value of n; results obtained with fixed integer values are included for comparison. Fractional ions are physically reasonable since electrostatic screening effects as well as counterion condensation will contribute to the “thermodynamic extent of counterion binding” to a po- lyelectrolyte (Record et al., 1976).
From Table I it appears that fewer ions are involved in the low-salt transition at higher pH. However, at higher pH the core particle can be expected to have a higher overall negative charge, and it seems unlikely that the number of bound cations required to stabilize the high-salt form would decrease. The lower value of n given by this analysis for the pH 9 data is a direct result of the greater width of the transition. An alternate explanation for this increase in width is that the transition consists of two (or more) steps that are more widely separated at high pH. It would also seem physically unrea- sonable to suggest that the number of divalent cations involved is greater than the number of monovalent cations as shown in Table I; this observation could also result from the inade- quacy of a one-step model.
A more complex model is suggested by the 2-fold symmetry of the core particle, which is indicated to have a dyad axis by such diverse methods as DNase I digestion (Lutter, 1978), electron microscopy (Klug et al., 1980), and histone-DNA cross-linking results [reviewed by Mirzabekov (1 980)]. The low-salt transition may be envisioned as taking place in the two halves of the core particle either independently or with a degree of cooperativity. In eq 2a, the only difference between
B t n,M
B and B‘ is in which half of the core particle has undergone the transition. The dependence of the observed anisotropy on
V O L . 2 1 , N O . 1 4 , 1 9 8 2 3331
Table 11: Results of Analysis of Low-Salt Transition Data Using the Half-transition Modela
n , , P K ‘ , P K ’ , -- pH (cation) n , n , n , rc r b r, rms 5.6-6.3 (Mz+) 1 , 3 3.90 4.89 0.150 0.169 0.172 0.00067
2, 3 3.86 4.89 0.150 0.169 0.172 0.00063 3, 3 3.84 4.89 0.150 0.169 0.171 0.00059 3 , 4 3.88 4.90 0.151 0.169 0.171 0.00064 4 , 4 3.86 4.90 0.151 0.169 0.171 0.00061
5.6-6.0 (K’) 1, 3 3.43 3.30 0.147 0.166 0.175 0.00058 1 , 4 3.73 3.34 0.148 0.157 0.175 0.00062 3, 3 2.43 3.31 0.147 0.172 0.175 0.00061 2 , 4 3.17 3.38 0.148 0.165 0.174 0.00062 3 , 4 2.99 3.37 0.148 0.168 0.174 0.00067
3 , 3 2.76 3.22 0.146 0.167 0.173 0.00074 2 , 4 3.05 3.28 0.147 0.161 0.173 0.00072 3 , 4 2.87 3.26 0.147 0.164 0.172 0.00075
4 , 2 2.62 3.13 0.142 0.157 0.167 0.00070 2 , 4 2.83 3.30 0.144 0.150 0.168 0.00075 3 . 4 2.72 3.26 0.144 0.153 0.167 0.00069
6.7-7.0 (K’) 1, 3 3.68 3.18 0.147 0.149 0.173 0.00079
8.6-9.2 (K+) 3, 3 2.70 3.24 0.143 0.154 0.167 0.00068
‘ The parameters ra, rb, r,., n , , n , , K ’ l , and K ’ , (pK’ =-log K ’ ) are defined in eq 2a and 2b. rms is the root mean square value that is defined in the text. The p K / n values differ from the p K ’ / n values by at most 0.08/n. Also see footnote to Table I.
[MI can be obtained in the same manner as used above and is given by
[ M p [M]Q 2[M]”* + - + 1 ) (2b)
where KrI = (Ib/Za)K1 and K12 = (Zc/Zb)K2. This model will be referred to below as the halj-transition model.
An alternate model that should also be considered is the simple two-step model:
K’,
K A & B + nlM 2 C + (nl + n2)M (3a)
The observed anisotropy will be given by an equation identical with eq 2b with the factors of 2 in the middle terms of the numerator and denominator removed. Regrettably, the half-transition model and the two-step model cannot be dis- tinguished from the observed dependence of r (or of I ) on [MI.
Some improvement in the rms value can be expected due simply to introduction of three additional adjustable param- eters on changing from the one-step to the half-transition (or two-step) model. However, as indicated by the results listed in Table 11, the observed improvement is substantial, partic- ularly at pH 6 and pH 9. The table includes in each case the combination of (integer) nl and n2 giving the lowest rms value. These “best fits” were used with eq 2b to generate the solid curves drawn through the anisotropy data in Figures 3 and 5 to provide visual comparisons. I t can be seen in Table I1 that n, and n2 are not well defined by the data and several combinations lead to rms values considerably lower than those resulting with the one-step model. Thus we can conclude that the changes at all three pHs occur in two (or more) steps, but the details of the steps and of the mechanism remain uncertain.
Comparing values of K’/n (the cation concentration at the midpoint of a transition) for monovalent and divalent cations, it is apparent that the divalents are effective at 36-fold lower total concentration. Since the value for divalents (10 pM) is comparable to the core particle concentration (1 pM), this

3332 B I O C H E M I S T R Y L I B E R T I N I A N D S M A L L
result in terms of the free cation concentration will be an underestimate; the actual ratio will be higher since the free divalent cation concentration may be reduced by displacement of monovalent counterions from many sites on the core particle.
Interpretation of Effects of pH. At 10 and 100 mM salt, the core particles undergo a pH-dependent structural change centered near pH 7 (Figure 4B), which is accompanied by a small decrease in the anisotropy with increasing pH. The anisotropy changes were analyzed by the approach described in the previous subsection with the one-step model (eq l a and 1 b with M replaced by H'). A minimum rms value was found for n = 1.6, but values of one or two protons gave very similar fits due to the large dispersion in the data relative to the total change in r. The midpoint of the transition was pH 6.8-6.9. The structural change indicated by this transition is also re- flected in Figure 5D by the change in the maximum anisotropy at the three pHs studied. In addition, the pH affects the width and position of the low-salt transition. Clearly the pH-induced structural changes observed near neutrality are accompanied by changes in the stability of the particle at very low ionic strength,
In a highly simplified form the effects of low salt concen- tration on core particles near pH 7 could be represented by the equilibria
HzA A t 2Ht
lI 11 H2C f nlMt C t 2Ht t n2M'
where H2A and H2C represent protonated forms of the high-salt and low-salt conformations of the core particle (the symmetry of the particle suggests two protons are involved). The actual situation would be considerably more complex, not only because of the subtle multistep character with salt con- centration but also because three forms of the core particle may exist-fully protonated, half-protonated, and not pro- tonated. Dieterich & Cantor (1981) found that the kinetics of the low-salt transition near pH 7 were complex but could also be approximated by using a four-state cyclic mechanism. Our results suggest that a simplification of the kinetics may be obtained about pH 8.
With a pK, below 7, the data at pH 9 (Figure 5C) will reflect changes in the unprotonated core particles. It is in- teresting that the best fit to these data consists of a two-step transition in which each step is of about the same magnitude (Ar) and involves dissociation of the same number of ions ( n l = n2 = 3 in Table 11). This result provides good evidence for the half-transition model although other less symmetrical possibilities give fits that are only somewhat worse.
The rather complex changes in the shape of the low-salt transition as the pH is decreased to 7 and to 6 can best be attributed to contributions from both protonated and un- protonated cores. The changes at both pHs are still fit best by a two-step mechanism, but the distinct absence of any symmetry between the two steps would be expected to result from the contributions from a superposition of changes for two distinct populations of core particles. The only conclusion that may be drawn is that the transition of the protonated core particle occurs at a lower overall salt concentration and is considerably narrower than that of the unprotonated cores.
Studies at a pH below 6 would have allowed a better characterization of the transition of protonated cores, but a secondary effect of pH interferes. The fluorescence changes at low salt centered near pH 5 (Figure 4, circles) suggest that the presence of a sufficient concentration of hydrogen ions can
prevent transition to the low-salt form. It is curious that the concentration of protons at the midpoint of this effect (pH 5 or 10 pM protons) is closer to that for the divalent cations than for the monovalents. (Such a result might be related to the very large diffusion coefficient of protons in aqueous solution.) Alternatively, a further titration on the order of that that occurs near pH 7 may be responsible if the low-salt transition is thereby shifted to cation concentrations well below these obtained here.
Possible Mechanisms of Transition. Since cross-linking the core protein at moderate salt concentration prevents the low- salt transition (Gordon et al., 1978, 1979; Wu et al., 1979), disruption of histonehistone interactions is clearly implicated. Although the strengths of these interactions within the core particle have not been well characterized, much is known about them in the absence of DNA. In 2 M salt the four inner histones dissociate from the DNA as an equimolar complex, which is probably an octamer (Eickbush & Moudrianakis, 1978). Several studies suggest that the histone octamer in chromatin is comparable to this high-salt complex. For ex- ample, histone interactions as indicated by histone cross-linking products (Thomas & Kornberg, 1975) and by the protein structure as studied by Raman spectroscopy (Thomas et al., 1977) are the same for free octamer, core particles, and chromatin. Thus histone interactions within the free octamer may suggest which interactions within the core particle are the weakest and thus likely to be disrupted at very low ionic strength.
Eickbush & Moudrianakis (1978) found that weak inter- actions within the free histone octamer can be disrupted by decreasing the total histone concentration, lowering the salt concentration to 1 M, raising or lowering the pH from neu- trality, raising the temperature, or adding low concentrations of denaturing agents. The only subcomplexes detected were equimolar complexes of histones 2a and 2b and of histones 3 and 4, which probably correspond to the H2a-H2b dimer (D'Anna & Isenberg, 1974a) and the H3-H4 tetramer (Kornberg & Thomas, 1974; D'Anna & Isenberg, 1974b); the histones in these subcomplexes are strongly associated even at quite low ionic strengths. In contrast, the dimer and tet- ramer interact weakly with one another only at high salt concentrations (Eickbush & Moudrianakis, 1978; Godfrey et al., 1980). A number of other pairwise interactions of varying strengths have been characterized [for example, a strongly associated dimer of H 2 b H 4 (D'Anna & Isenberg, 1973); see Isenberg (1979) for a review], but none of these have been isolated from chromatin.
Does the transition reflect the persistence within the core particle of strong associations within the dimer and the tet- ramer and weak dimer-tetramer interactions? This possibility is supported by a number of observations. The H2a-H2b dimer dissociates as a unit from the core particle (Burton et al., 1978; Simon & Felsenfeld, 1979) and from chromatin (Bartley & Chalkley, 1972) at a lower salt concentration than is required for the H3-H4 tetramer. Also, core particles can be reconstituted at low salt concentrations by adding H2a-H2b to a complex of H3-H4 and DNA (Klevan et al., 1978; Ruiz-Carrillo et al., 1979); Crimisi & Yaniv (1980), in a study of replicating SV-40 DNA, suggest that this order of assembly may also occur in vivo. The possibility that the low-salt transition involves disruption of the dimer-tetramer association is further supported by the cross-linking results of Martinson et al. (1979), who found that, at very low ionic strength, specific H2a-H2b contacts persist while H 2 b H 4 contacts are lost.

P H E F F E C T S O N C H R O M A T I N C O R E P A R T I C L E S
FIGURE 6 Diagrammatic representations of molecular models for low-salt transition discussed in the text. The tetramer of histones 3 and 4 is represented as a black wedge, and the dimers of histones 2a and 2b are represented as smaller stippled wedges. These sham were chosen for convenience in the representation of the transition, not to imply anything about the internal arrangement of the protein core except as discussed in the text
We have presented evidence that the low-salt transition, most notably at high pH, occurs in two steps and have sug- gested that the steps correspond to successive changes in the two halves of the particle. The evidence cited above indicates that such a half-transition is likely to involve separation of H2a-H2b dimers from the H3-H4 tetramer. Structural models that incorporate these observations are presented in Figure 6.
At the top of the figure is a diagrammatic representation of the core particle at high salt. The histone core is illustrated as a cylinder 60 .& high by 70 .& in diameter and the DNA is shown as a tube 20 .& in diameter with helical striations to suggest the periodicity of 10.4 bp. The 145 bp of DNA are wrapped about the protein as a 1.75-turn left-handed super- helix with a pitch of 28 .& and an outside diameter of 110 .& [see McGhee & Felsenfeld (1980) and Mirzahekov (1980) for reviews of results that support such a representation]. The manner in which the protein core is divided into H2a-H2b dimers (stippled) and an H3-H4 tetramer (black) was chosen for simplicity of illustration and to agree generally with the results of histoneDNA cross-linking studies (Mirzabekov et al., 1978; Belyavsky et al., 1980).
Structures B and C in Figure 6 represent members of a continuum of possible half-opened forms of the core particle in which separation of the H2a-H2b dimer from the H3-H4 tetramer has occurred. Since the interactions between the histones and DNA appear to be mainly electmstatic in nature, it is likely, as is illustrated, that little change in the binding of the histone complexes to the DNA will occur at low ionic strength. Structure B is based on the results of Wu et al. (1979) in which electric dichroism measurements indicated that the DNA in the fully open form of the core particle approximates 0.9 turn with a diameter of 170 .&.’ Model C is suggested by the report (Eshaghpour et al., 1980) that the ends of the DNA do not move much relative to the position of the sulfhydryl group on H3. At present further distinction between these two models, in spite of rather extreme differ- ences, is not possible. However, they do point out the fact that the mechanism we are suggesting for the low-salt transition (two half-transitions involving separation of H2a-H2b dimers
It might be argued, since the half-transition modeled by structure C reliwcp most of the electrostatic repulsion between the superhelical turns of the DNA, that there is little -n for the other half of the core particle to open also. However. the separation between the turns of the DNA (about 8 A) and exposure to the solvent will allow effective di- elcetric shielding of electrostatic interactions between them. On the other hand, the low dielectric constant of the protein core will result in rela- tively strong electrostatic repulsion for a charge distribution wrapped about the core. Thus, although opening of half the core particle will affect the electrostatic interactions in the second half, the driving force for opening the second half would not be eliminated.
V O L . 2 1 , N O . 1 4 , 1982 3333
from the H3-H4 tetramer within the core particle) will be in agreement with a rather wide range of possible shapes for the low-salt form.
Conclusions Tyrosine fluorescence intensity and anisotropy are very
sensitive to structural rearrangements within the m e particle, which occur as a function of pH and ionic strength. At very low salt, changes in the fluorescence properties were found to be independent of the anion present, irrespective of the ionic charge. Divalent cations affect the low-salt transition at 36- fold lower concentrations than monovalent cations with the exception of hydrogen ions, which appear to affect the tran- sition at about 10 ~ L M (pH 5 ) , very similar to the divalent cations. Otherwise, little difference between the several salts tested was observed.
Near physiological ionic strength, changes in the tyrosine fluorescence anisotropy with pH indicate a structural change resulting from the titration of a single type of functional group with a pK, somewhat below 7. This structural change may be responsible for differences in the low-salt transition at pH 6 and 9. At both pHs the low-salt transition is more consistent with a two-step than with a one-step equilibrium.
The existence of a dyad axis in the core particle, along with known interactions between histones, histone oligomers, and DNA, suggests a likely explanation for the low-salt transition involving the separation of H2a-H2b dimers from an H3-H4 tetramer. This suggestion leads naturally to a transition 00
curring in two steps corresponding to half-transitions of the core particle. The driving force for such a change could be an increase in electrclstatic repulsion between superhelical turns of the DNA enhanced by the low electrostatic shielding or by the dissociation of one or more cations from the core particle.
Ref ere n ce s Ayres, W. A,, Small, E. W., & Isenberg, I. (1974) Anal.
Bak, A. L., Zeuthen, J., & Crick, F. H. C. (1977) Proc. Natl.
Bartley, J. A,, & Cbalkley, R. (1972) J. Biol. Chem. 247,
Belyavsky, A. V., Bavykin, S. G., Goguadze, E. G., & Mir- zabekov, A. D. (1980) J. Mol. Biol. 139, 519-536.
Burch, J. B. E., & Martinson, H. G. (1980a) Fed. Proc., Fed. Am. Soc. Exp. Biol. 39,2007.
Burch, J. B. E., & Martinson, H. G. (1980b) Nucleic Acids Res. 8, 4969-4987.
Burton, D. R., Butler, M. J., Hyde, J. E., Phillips, D., Skid- more, C. J., & Walker, I. 0. (1978) Nucleic Acids Res. 5, 3643-3663.
Butler, P. J. G., & Thomas, J. 0. (1980) J. Mol. Biol. 140, 505-529.
CrEmisi, C., & Yaniv, M. (1980) Biochem. Biophys. Res.
DAnna, J. A,, Jr., & Isenberg, I. (1973) Biochemistry 12,
D’Anna, J. A,, Jr., & Isenberg, I. (1974a) Biochemisfry 13,
DAnna, J. A,, Jr., & Isenberg, I. (1974b) Biochemisfry 13,
Dieterich, A. E., & Cantor, C. R. (1981) Biopolymers 20,
Eickbush, T. H., & Moudrianakis, E. N. (1978) Biochemistry
Eshaghpour, H., Dieterich, A. E., Cantor, C. R., & Crothers,
Biochem. 58, 361-367.
Acad. Sci. U.S.A. 74, 1595-1599.
3647-3655.
Commun. 92, 1117-1123.
1035-1043.
2098-2 104.
4992-4997.
111-127.
17,4955-4964.
D. M. (1980) Biochemistry 19, 1797-1805.

3334 Biochemistry 1982, 21, 3334-3343
Godfrey, J. E., Eickbush, T. H., & Moudrianakis, E. N. (1980) Biochemistry 19, 1339-1346.
Gordon, V. C., Knobler, C. M., Olins, D. E., & Schumaker, V. N. (1978) Proc. Natl. Acad. Sci. U.S.A. 75,660-663.
Gordon, V. C., Schumaker, V. N., O h , D. E., Knobler, C. M., & Horowitz, J. (1979) Nucleic Acids Res. 6 , 3845-3 858.
Harrington, R. E. (1981) Biopolymers 20, 719-752. Isenberg, I. (1979) Annu. Rev. Biochem. 48, 159-191. Jorcano, J. L., & Ruiz-Carrillo, A. (1979) Biochemistry 18,
Klevan, L., Dattagupta, N., Hogan, M., & Crothers, D. M.
Klug, A., Rhodes, D., Smith, J., Finch, J. T., & Thomas, J.
Kornberg, R. D., & Thomas, J . 0. (1974) Science (Wash-
Lewis, P. N., & Chiu, S. S . (1980) Eur. J . Biochem. 109,
Libertini, L. J., & Small, E. W. (1980) Nucleic Acids Res.
Lutter, L. C. (1978) J. Mol. Biol. 124, 391-420. Manning, G. S. (1969) J . Chem. Phys. 51, 924-933. Martinson, H. G., True, R. J., & Burch, J. B. E. (1979)
McGhee, J. D., & Felsenfeld, G. (1980) Annu. Rev. Biochem.
McGhee, J. D., Rau, D. C., Charney, E., & Felsenfeld, G.
Mirzabekov, A. D. (1980) Q. Rev. Biophys. 13, 255-295. Mirzabekov, A. D., Shick, V. V., Belyavsky, A. V., & Bavykin,
768-774.
(1978) Biochemistry 17, 4533-4540.
0. (1980) Nature (London) 287, 509-516.
ington, D.C.) 184, 865-868.
369-376.
8, 3517-3534.
Biochemistry 18, 1082-1089.
49, 1115-1156.
(1980) Cell (Cambridge, Mass.) 22, 87-96.
S.G. (1978) Proc. Natl. Acad.Sci. U.S.A. 75,4184-4188. Montenay-Garestier, T. (1 976) in Excited States of Biological
Molecules (Birks, J. B., Ed.) pp 207-216, Wiley, New York. Record, M. T., Jr., Lohman, T. M., & DeHaseth, P. (1976)
J . Mol. Biol. 107, 145-158. Ruiz-Carrillo, A., Jorcano, J . L., Eder, G., & Lurz, R. (1979)
Proc. Natl. Acad. Sci. U.S.A. 76, 3284-3288. Simon, R. H., & Felsenfeld, G. (1979) Nucleic Acids Res.
Spiker, S., & Isenberg, I. (1 977) Biochemistry 16, 18 19-1 826. Suau, P., Bradbury, E. M., & Baldwin, J. P. (1979) Eur. J .
Thoma, F., Koller, T., & Klug, A. (1979) J . Cell Biol. 83,
Thomas, G. J., Jr., Prescott, B., & O h , D. E. (1 977) Science
Thomas, J. O., & Kornberg, R. D. (1975) Proc. Natl. Acad.
Weber, G. (1960a) Biochem. J . 75, 335-344. Weber, G. (1960b) Biochem. J . 75, 345-352. Wilhelm, M. L., & Wilhelm, F. X. (1980) Biochemistry 19,
Windgender, E., Maass, K., & Bode, J. (1981) Znt. J . Biol. Macromol. 3, 114-1 20.
Wu, H.-M., Dattagupta, N., Hogan, M., & Crothers, D. M. (1979) Biochemistry 18, 3960-3965.
Zama, M., Bryan, P. N., Harrington, R. E., Olins, A. L., & O h , D. E. (1977) Cold Spring Harbor Symp. Quant. Biol.
Zama, M., Olins, D. E., Prescott, B., & Thomas, G. J. (1978)
6, 689-696.
Biochem. 97, 593-602.
403-427.
(Washington, D.C.) 197, 385-388.
Sci. U.S.A. 72, 2626-2630.
4327-4331.
42, 31-41.
Nucleic Acids Res. 5. 3881-3897.
Deoxyribonucleic Acid Synthesis in Isolated Chloroplasts and Chloroplast Extracts of Maize? Wolfgang Zimmermann and Arthur Weissbach*
ABSTRACT: Isolated chloroplasts are capable of synthesizing chloroplast DNA in the presence of Mg2+ and deoxynucleoside triphosphates. The in vitro reaction proceeds for at least 60 min and is inhibited by KCl and N-ethylmaleimide. Stretches of several hundred nucleotides in length are synthesized within an hour. Little or no inhibition is shown by aphidicolin (an inhibitor of eukaryotic DNA polymerase a), dideoxythymidine triphosphate (an inhibitor of eukaryotic DNA polymerases P and y), nalidixic acid, or rifampicin. Ethidium bromide is a moderate inhibitor of DNA synthesis in the isolated chloro-
Eukaryo t i c cells are characterized by compartmentalization of those cellular components which contain their own genetic apparatus. In animal cells, the nuclear compartment has a genomic organization and DNA replication machinery which is apparently quite different from that in the other cellular compartment, the mitochondria (Kasamatsu et al., 1974). Higher plant cells contain three, rather than two, cellular compartments (Olson, 198 1) since they contain another au-
t From the Roche Institute of Molecular Biology, Nutley, New Jersey 071 10. Received January 26, 1982.
plast. Soluble extracts of chloroplasts will copy exogenously added recombinant plasmid circular DNA containing frag- ments of chloroplast DNA, and this reaction is strongly in- hibited by ethidium bromide. Copying of the plasmid DNA takes place on the relaxed circular or linear forms of the DNA, but no specific initiation sites on the chloroplasts’ DNA fragments of the recombinant plasmids have been detected. Our data are consistent with a repair mechanism operating in vitro but may also represent incomplete replicative DNA synthesis.
tonomous organelle, the plastid, of which the chloroplast is the best known example (Schnepf, 1980). In each case, the various cell compartments cooperate and communicate with each other in unknown ways to achieve the proper symbiosis.
The genome of the eukaryotic organelles is considered prokaryotic in nature since both mitochondrial and chloroplast DNAs exist as naked double stranded supercoiled circular DNA molecules (Bedbrook & Kolodner, 1979). This view is tempered by the observation that Chlamydomonas chloroplast DNA and yeast mitochondrial DNA contain intervening se- quences (Rochaix & Malnoe, 1978; Borst & Grivell, 1981).
0006-2960/82/0421-3334$01.25/0 0 1982 American Chemical Society