Embed Size (px)
Citation preview

EFFECTS OF PERCHLORATE EXPOSURE ON RESTING
METABOLISM, PEAK METABOLISM, AND THYROID
FUNCTION IN THE PRAIRIE VOLE (Microtus ochrogaster)
by
JOHN P. ISANHART, B.S.
A THESIS
IN
ENVIRONMENTAL TOXICOLOGY
Submitted to the Graduate Faculty of Texas Tech University in
Partial Fulfillment of the Requirements for
the Degree of
MASTER OF SCIENCE
Approved
unairperg^ or tne UQtnmittee
Accepted
Dean of the Graduate School
August, 2004
ACKNOWLEDGMENTS
This research was funded by the Strategic Environmental Research and
Development Program (SERDP). I thank J.E. Canas, S.A. Severt, T. Kaviani,
and L. Perlmutter for assistance with collecting metabolic rate data, animal care,
and analytical work. I also thank Dr. Anne McNabb for her assistance with the
thyroid gland content radioimmunoassay and guidance throughout the study. I
would also like to thank my advisor Dr. Phil Smith, and other committee members
Dr. Todd Anderson and Dr. Michael Hooper for their support and suggestions
throughout my first two years of graduate studies. Most of all, I am grateful for
the encouragement that I received from my parents and Dr. Vickie McDonald,
who taught me to pursue the things I loved, as well as provided me with
opportunities that suited my interests.

TABLE OF CONTENTS
ACKNOWLEDGMENTS i
ABSTRACT Iv
LIST OF TABLES vi
LIST OF FIGURES vii
CHAPTER
I. INTRODUCTION 1
II. MATERIALS AND METHODS 6
Drinking Water Solutions 6
Experimental Groups 6
Resting Metabolism 8
Peak Metabolic Rate (cold-stress) 9
Animal Euthanasia and Sample Collections 11
Plasma Hormone Analysis 11
Thyroid Gland T4 Content 12
Tissue Perchlorate Analysis 13
Statistical Methods 14
III. RESULTS 16
Perchlorate Intake 16
Thyroxine Pellet Effects on Metabolism 16
Perchlorate Effects on Metabolism 17
Thyroid Hormone Concentrations 17
Other Physiological Indices 19
IV. DISCUSSION 40
REFERENCES 50

APPENDIX 54
Body mass, body mass change, water consumption
and food consumption of prairie voles implanted with
21 -day thyroxine-releasing pellets 54

ABSTRACT
Perchlorate is the oxidizer component in most solid rocket propellant
formulations. It is known to reduce the production and output of the thyroid
hormones, triiodothyronine (T3) and thyroxine (T4). Thyroid hormones regulate
metabolism in endothermic organisms and are responsible for maintenance of
body temperatures above that of the environment. Little is known about the
effects of perchlorate on metabolic capacity. The objectives of this study were to
1) determine if subchronic (51 days; 0, 1, and 10 mg/kg/day) and chronic (180
days; 0.75 mg/kg/day) perchlorate exposure in adult male prairie voles {Microtus
ochrogaster) would alter resting metabolic rates as a result of decreased
circulating thyroid hormone concentrations, and 2) determine if perchlorate
exposure disrupts thermogenesis in mammals challenged with cold-stress.
Voles exposed to perchlorate for 51 or 180 days experienced no significant
alterations in resting metabolic rates at any point during the exposure period.
Additionally, there was no treatment effect on peak metabolic rates or plasma
thyroid hormone concentrations. Mean peak metabolic rates were 10.17 ± 0.85,
10.17 ± 1.50, and 9.37 ± 0.89 mL oxygen consumed per gram of body mass per
hour for 0, 1, and 10 mg/kg/day groups, respectively. Mean plasma T4
concentrations were 3.01 ± 0.83, 2.74 ± 1.36, and 1.70 ± 0.91 pg/dL, and mean
plasma T3 concentrations were 109.29 ± 15.05, 94.83 ± 13.36, and 95.57 ± 5.92
ng/dLforO, 1, and 10 mg/kg/day treatment groups, respectively. However,
thyroid gland thyroxine concentrations, 704.62 ± 372.62, 454.20 ± 290.52, and
iv

219.54 ± 196.76 ng T4 per thyroid gland for 0, 1, and 10 mg/kg/day treatment
groups, respectively, were significantly lower in perchlorate-exposed voles than
controls indicating that thyroid gland thyroxine content is a more sensitive
endpoint for assessing perchlorate exposure in prairie voles. This study
indicates that perchlorate-induced alterations in thyroid function do not
necessarily translate into alterations in metabolic rate and/or decreases in
thermogenic response. Overall, this study did not provide evidence for energetic
alterations associated with perchlorate exposure at concentrations that are
higher than those typically found in water in the environment. It may require a
longer duration of exposure or higher dose to see a significant effect on resting
metabolic rate and/or cold-tolerance. This is also the first study to present data
on cold-induced PMR in a helox atmosphere in prairie voles and to show that
thyroid gland thyroid T4 decreases are the most sensitive measure of thyroid
function in mammals in comparison to plasma thyroid hormone concentrations.

LIST OF TABLES
3.1 Mean perchlorate intake and food and water consumption for subchronic (0, 1, and 10 mg/kg/day) and long-term (0.75 mg/kg/day) treatment groups 20
3.2 Weekly mean oxygen consumption rates of prairie voles implanted with 21-day thyroxine releasing pellets 22
3.3 Weekly mean resting metabolic rates and peak metabolic rates of prairie vole treatment groups 23
3.4 Mean prairie vole plasma T4, T3 and thyroid gland T4 concentrations following 51 days of exposure or 180 days exposure to perchlorate in drinking water 27
3.5 Mean body mass and body mass change for subchronic and long-term treatment groups 32
3.6 Mean prairie vole tissue masses following 51 days of exposure or 180 days exposure to perchlorate in drinking water 35
5.1 Mean body mass, body mass change, and water and food consumption over a 3- week period of prairie voles implanted with 21-day thyroxine-releasing pellets 54
VI

LIST OF FIGURES
3.1 Mean perchlorate intake for 0.75, 1, and 10 mg/kg/day treatment groups 21
3.2 Mean oxygen consumption rates of prairie voles implanted with 21-day thyroxine releasing pellets 22
3.3 Weekly resting metabolic rates of prairie voles exposed to perchlorate in the drinking water for 6 weeks at target doses of 0, 1, and 10 mg/kg/day 24
3.4 Resting metabolic rates of prairie voles exposed to perchlorate at a target dose of 0.75 mg/kg/day for 180 days 25
3.5 Peak metabolic rates of prairie voles in helox atmosphere following 51 or 180 days of perchlorate exposure in drinking water 26
3.6 Plasma T4 concentrations (A) and thyroid gland T4 content (B) per treatment group after 51 days of exposure to 0, 1.0, and 10.0 mg/kg or 180 days to 0.75 mg/kg in drinking water 28
3.7 Plasma T3 concentrations of prairie voles exposed to perchlorate in the drinking water at doses of 0, l .and 10 mg/kg/day 29
3.8 Regression analysis expressing changes of peak metabolic rate in prairie voles exposed to perchlorate as a function of plasma T4 concentration 30
3.9 Regression analysis expressing changes of peak metabolic rate in prairie voles exposed to perchlorate as a function of thyroid gland T4 concentration 31
3.10 Regression analysis expressing changes of plasma T4 concentrations in prairie voles exposed to perchlorate as a function of thyroid gland T4 concentrations 32
3.11 Mean body mass of voles during subchronic perchlorate exposure or long-term exposure 33
3.12 Mean body mass change as a percent of initial of voles during subchronic perchlorate exposure or long-term perchlorate exposure... 34
VII

3.13 Kidney mass of voles following perchlorate exposure at target concentrations of 0, 1, and 10 mg/kg/day for 51 days and 0.75 mg/kg/day for 180 days 36
3.14 Liver mass of voles following perchlorate exposure at target concentrations of 0, 1, and 10 mg/kg/day for 51 days and 0.75 mg/kg/day for 180 days 37
3.15 Food consumption of prairie voles during subchronic perchlorate exposure or long-term perchlorate exposure 38
3.16 Water consumption of prairie voles during subchronic perchlorate exposure or long-term perchlorate 39
5.1 Mean body mass of prairie voles that received 21 day thyroxine-releasing pellets 55
5.2 Mean increases in body mass for prairie voles that received 21 day thyroxine releasing pellets 56
5.3 Mean water consumption of prairie voles that received 21 day thyroxine releasing pellets 57
5.4 Mean food consumption of prairie voles that received 21 day thyroxine releasing pellets 58
VIII

CHAPTER I
INTRODUCTION
Perchlorate has become a contaminant of concern for state and federal
regulatory agencies since it was detected in drinking water sources in Utah,
California, and Nevada in 1997 (1). Much of the contamination occurs near
military bases and ammunitions manufacturing sites where perchlorate is
handled (2), however contamination has become more widespread due to its
persistence and high mobility in aquatic systems (3).
Ammonium perchlorate is a powerful oxidizer used in solid propellant
formulations intended for fireworks and explosives. Perchlorate salts are also
used in the manufacture of matches and road flares. In the past, potassium
perchlorate was used as a therapeutic agent for the treatment of hyperthyroidism
resulting from Grave's disease and amiodarone-induced thyrotoxicosis.
Perchlorate is a competitive inhibitor of iodide transport across the
basolateral membrane of the thyroid gland (4). Because of its similarity in size
and charge, perchlorate competes with iodide for uptake into the thyroid gland at
the sodium-iodide symporter. At therapeutic doses, the result is reduced
secretion of the thyroid hormones (thyroxine (T4) and triiodothyronine (T3)) and
the resulting increase in secretion of thyrotropin-stimulating hormone from the
pituitary gland. Prolonged exposure to perchlorate may result in
histopathological effects in the thyroid gland, including hyperplasia, hypertrophy,

and colloid depletion (5, 6). In birds, high doses of perchlorate have been shown
to cause a reduction in thyroid hormone content within the thyroid gland (7).
Wildlife inhabiting perchlorate-contaminated sites may be exposed via
drinking water or food items derived from contaminated matrices (8, 9). Recent
research has shown that in addition to aquatic organisms, terrestrial species can
also be exposed to perchlorate in the environment (8, 9, 10). Since perchlorate
reduces thyroid hormone production, and thyroid hormones are required for the
regulation of metabolism in endothermic organisms and play an important role in
adaptive heat production (11), exposed terrestrial endotherms may experience
altered metabolic function and reduced capacity for thermoregulation. Many
small mammals such as the prairie vole have evolved to cope with cold
temperature stress, but they have a limited ability to increase their insulation;
therefore, behavioral avoidance and thermogenesis become the most important
means for maintaining a relatively narrow range of body temperatures (12).
Urbansky (2) found groundwater and surface water perchlorate
contaminations ranging from 8 ng/mL to 3.7 mg/mL associated with military
bases in several western states and Smith et al. (8) found perchlorate
concentrations of 30-31 mg/L in one holding pond on the Longhorn Army
Ammunition Plant (LHAAP) in Karnack, Texas. However, groundwater and
surface water perchlorate contamination is typically encountered at <500 pg/mL
(2). In Utah, Urbansky (2) reported perchlorate contamination in groundwater
ranging from 4-200 ng/mL, Smith et al. (8) reported perchlorate concentrations in

all water, sediment, and soil samples, with the exception of one pond, less than
85 ng/mL, and Smith et al. (9) reported water perchlorate concentrations ranging
from 0.15 - 1.04 pg/mL with a mean concentration of 0.45 ± 0.08 pg/mL at the
Las Vegas Wash, Nevada. Two of the three previous sites are considered to be
highly perchlorate-contaminated sites. Considering that a prairie vole, the
species used in this study, typically consumes approximately 0.29 ± 0.02 SE g
water/g body mass/day (13), has a body mass of 40 g, and then assuming a daily
exposure to perchlorate in water at concentrations ranging from 0.5 - 500 pg/mL;
the expected perchlorate exposure would range from 0.145 - 145 mg
perchlorate/kg body mass/day.
Data collected on perchlorate contamination in aquatic and terrestrial
plants suggest a different scenario. Smith et al. (8) reported perchlorate
concentrations in bullrushes {Scirpus sp.) growing in a highly contaminated pond
(water perchlorate concentrations of 30 pg/mL) ranging from 840 ± 410 - 7620 ±
1460 ng/g dry weight. Perchlorate was also detected in seeds from goldenrod
{Solidago sp.) and crabgrass {Digitaria sp.) at the LHAAP at concentrations of
184 and 1880 pg/g dry weight, respectively (8). Another study reported
perchlorate in aquatic and terrestrial broadleaf and grass at concentrations
ranging from below detection limits (100 ng/g) to 4460 pg/g, with a mean of 290 ±
94 pg/g dry weight (9). Considering that a prairie vole consumes approximately
0.13 g rodent chow/g body mass/day, and assuming a daily exposure to
perchlorate in plant food items at concentrations ranging from 300 - 5000 pg/g

dry weight, the expected perchlorate exposure would range from 39 - 650 mg
perch lorate/kg body mass. However, this calculation assumes the vole is
consuming dry rodent chow versus wet plant food items (grasses, roots, and
seeds) that are likely to be consumed in the environment. Therefore, food
consumption will likely increase and plant perchlorate concentrations will likely
decrease because previous perchlorate concentrations were reported on a dry
weight basis. Other factors, such as perchlorate bioavailability in water versus
food items, may alter the exposure scenario.
Perchlorate-induced alterations in thyroid function may be significant in
organisms inhabiting regions with wide seasonal temperature ranges and/or daily
temperature fluctuations. Individuals that are susceptible or responsive to
decreased thyroid hormones may be placed at a disadvantage when faced with
cold ambient temperatures. Disturbances in an animal's overall metabolic and
thermogenic capacity may have the potential to influence whether the individual
can survive, grow, and reproduce, as well as where it can colonize. Ultimately,
these disturbances may set limitations on sensitive individuals and affect the
abundance of a species.
To our knowledge, no studies have assessed the impact of perchlorate on
metabolism in endothermic organisms. In general, overcoming the effects of
toxic chemicals is metabolically costly, and there is a prediction that metabolic
rate should increase with increasing levels of toxicants until irreversible
pathological effects impair metabolism itself (14). However, perchlorate is

excreted virtually unchanged in both the rat and in man (15). Therefore, it is
possible that there are very little or no energetic costs associated with
biotransformation of the toxicant, and any alterations in metabolic rate will most
likely be attributed to perchlorate-induced reductions in thyroid hormones.
The purpose of this study was to examine the effects of perchlorate on
resting metabolic rates, facultative thermogenesis as measured by peak
metabolic rate, and thyroid function in prairie voles. We hypothesized that
perchlorate exposure would result in a decrease in thyroid gland hormone
content and circulating thyroid hormone concentration, therefore reducing the
resting metabolic rates of voles. We further hypothesized that perchlorate
exposure would disrupt thermogenesis in voles, ultimately decreasing their ability
to cope with cold-stress. Another objective of our study was to investigate the
relative sensitivity of the different thyroid variables, plasma thyroid hormone and
thyroid gland T4 concentrations, for detecting an alteration in thyroid function.

CHAPTER II
MATERIALS AND METHODS
Drinking Water Solutions
Drinking water solutions containing ammonium perchlorate (NH4CIO4,
CAS No. 7790-98-9) were prepared in milli-Q water on a weekly basis during the
study. The concentration of perchlorate in the drinking water was adjusted
weekly for each treatment group, based on daily measured body weights and
water consumption, to achieve desired dosage levels. Weekly dosage was
calculated by using weekly mean treatment group values for body mass and
treatment group means for water consumption. Dilutions (1:10) of the dosing
solutions were prepared and passed through 0.45 pm Acrodisc® filters (Pall
Gellman, Ann Arbor, Ml). Filtered samples were then analyzed for perchlorate by
ion chromatography using a preconcentration/preelution method (16).
Experimental Groups
Twenty-one adult male prairie voles were acquired from a breeding colony
located at Texas Tech University and individually housed in acrylic Nalgene
rodent cages (25 x 15 x 11 cm) partially filled with Aspen shavings. All animal
activities were performed under protocols approved by the Texas Tech Animal
Care and Use Committee. Prolab rabbit chow (5P26; Purina Mills, Richmond, IN,
USA) and water were provided ad libitum. Voles were maintained in a

temperature controlled room at 25-26°C and 30-40% relative humidity on a
12h:12h light:dark photoperiod. All animals were weighed daily between 1200
and 1500 hours and food and water consumption were monitored on a daily
basis during pre-exposure (one week) and exposure periods. Seven voles
received continuous exposure to ammonium perchlorate via the drinking water at
target dosage levels of 0, 1, or 10 mg perchlorate/kg body mass/day for 51 days.
Five voles received continuous exposure via the drinking water at target dosage
levels of 0.75 mg perchlorate/kg body mass/day for 180 days.
Prior to perchlorate exposure experiments, twelve voles were acquired
from the same breeding colony and assigned to one of three dosing groups to
take part in a short-term experiment studying the effects of thyroxine on vole
resting metabolic rate. L-thyroxine hormone releasing pellets (1.5 mm diameter)
were subcutaneously implanted into the lateral side of the neck (between ear and
shoulder) of each vole. The pellets were designed to release thyroxine at a
constant rate over 21 days (Innovative Research of America, Sarasota, FL,
USA). In order to implant the pellets, voles were sedated and the pellet
implanted before the animal awakened. Pellets were implanted with a 10 gauge
trochar. Trochars were appropriately sterilized by dipping them into a 2%
chlorhexidine solution and then rinsing the trochar with milli-Q water to remove
any residual disinfectant. Voles in the control group received placebo pellets,
voles in the low dose group received a 0.5 mg pellet (daily dose = 0.0238 mg/day

or 0.437 mg/kg body mass/day), and the high dose group received a 1.5 mg
pellet (daily dose = 0.0714 mg/day or 1.29 mg/kg body mass/day).
Resting Metabolism
All animals were allowed free access to food and water prior to being
placed into metabolic chambers. For all resting metabolic rate (RMR)
measurements, voles were weighed and then placed in gas-tight metabolic
chambers (modified plastic rodent cages; volume 2.1 L). Chambers were fitted
for inlet and outlet tubes. Gas-cylinder air (dry grade; 20.95% oxygen) was
metered into an incubator, where it was then channeled through a mass flow
controller and a gas multiplexer (G245 and G244, respectively; Qubit Systems,
Ontario, Canada). Gas then flowed into the animal chambers and excurrent air
was rendered dry by passing it through a dessicant-filled column (magnesium
perchlorate). A subsample of air (60 mL/min) from the excurrent air stream was
rendered carbon dioxide free by passing through a soda lime column, and then
routed into a differential oxygen analyzer (DOX) (SI04; Qubit). Before reaching
the soda lime columns, half of the subsample of air was pulled through a carbon
dioxide analyzer (SI 54; Qubit) so that the sample reached the analyzers
simultaneously. Metered air was directed to a single animal chamber for
measurement, while simultaneously flushing air through 3 other unmeasured
chambers. Airflow rates were adjusted to 850 mL/min (standard temperature
and pressure conditions) for all vole chambers. During each trial, the automated
8

respirometry system was programmed to measure oxygen consumption and
carbon dioxide production for each vole at 1 second intervals for 15 minutes per
chamber and then switched to the next chamber in series. All data were
collected by Labview 6.0 (National Instruments, Austin, TX) and imported into
separate Microsoft Excel files for each gas channel. Before beginning
measurements on the next vole in series, chambers were flushed with air for 15
minutes to ensure that residual gases had been removed from the system. Gas
concentrations were measured in an empty chamber to obtain baseline levels
passing through experimental chambers. Behavioral criteria and a video camera
inside the temperature cabinet were used to determine whether animals were
inactive during measurement of oxygen consumption. RMR testing occurred
weekly for 4 weeks for thyroxine pellet experiments and 7 weeks for voles in the
0, 1, and 10 mg perchlorate/kg body mass treatment groups. Voles in the 0.75
mg perchlorate/kg body mass treatment group were tested on exposure days,
55, 90, 135, and 170. Resting metabolic rate was designated as the metabolic
rate of an inactive vole measured during the rest phase of its daily cycle. It was
calculated as the lowest measured rate of oxygen consumption averaged over a
continuous 5-minute period at 28°C between 0730 and 1500 h.
Peak Metabolic Rate (cold-stress)
Maximal oxygen consumption during cold stress was determined after
exposing voles to a respiratory gas mixture of approximately 80% helium and

20% oxygen (helox) (17). For sliding cold exposure tests, individual animals
were exposed to a series of declining temperatures in helox. Cold stress
temperatures were held at 12°C for 20 minutes followed by a continuous drop in
temperature (~0.5°C per minute) until reaching 5°C. Helox tests were conducted
for one hour or until the vole became hypothermic. These tests were conducted
between 1200 and 1600 h on voles which were allowed free access to food and
water prior to metabolic tests. Flow rates were maintained at 1000-1050 mL/min
for measurements of peak metabolic rate. The mass flow monitor was calibrated
for helox gas with the use of a wet cell calibrator (Gilian Gilibrator 2; Sensidyne;
Clearwater, FL). Voles were weighed to the nearest 0.01 grams before and after
testing. Metabolic chambers (volume 850 mL) consisted of a borosilicate glass
tube capped on both ends fitted with an inlet and outlet. One end of the tube
contained an electrical fan (velocity of 6.3 ft^/min) that aided in circulating air
inside the metabolic chamber. One animal from each group was tested at a time.
Before animals were tested, all chambers (2 blanks and 1 animal) were flushed
with helox for at least 5 minutes at flow rates of 1000-1050 mL/min. Colonic
temperature was measured before cold exposure and within 60 seconds after
being taken out of the chamber. Peak metabolic rates (PMR) were calculated as
the average of the highest rate of oxygen consumption over a 2-min period.
Voles in the 0, 1, and 10 mg/kg body mass treatment groups were tested
following 51 days of perchlorate exposure, while voles in the 0.75 mg/kg body
mass group were tested on exposure day 180.
10

Animal Euthanasia and Sample Collections
One day after peak metabolic rate experiments, animals were weighed
and then anesthetized in a saturated carbon dioxide chamber. Blood samples
were then collected from each vole, placed into microcentrifuge tubes, and
centrifuged until plasma had been separated. Plasma was then transferred to
labeled tubes and frozen at -80°C until analysis. Following blood sampling, all
animals were euthanized and necropsied. Livers, kidneys, and thyroid glands
were collected and frozen at -80°C until analysis.
Plasma Hormone Analysis
Vole plasma total thyroxine (TT4) and total triiodothyronine (TT3) were
measured using clinical radioimmunoassay (RIA) kits (Diagnostic Products Coat-
A-Count; TKT4X and TKT3X, respectively). The assay procedures for plasma
that accompanied the kits were followed, except for the inclusion of additional
calibration points. Calibration points for the T4 standard curve were 0, 0.2, 0.4,
0.6, 1,4, 10, 16, 24 pg/dL. Plasma samples (35 pL) were analyzed in duplicate.
Calibration points for the T3 standard curve were 0, 5, 10, 15, 20, 50, 100, 200,
and 600 ng/dL. Plasma samples (125 pL) were analyzed in duplicate. Both TT4
and TT3 radioimmunoassay kits were validated for prairie vole plasma by testing
various volumes of plasma against the standard curve for parallelism, and
11

spiking plasma samples of known T4 or T3 concentration with standards from the
RIA kit.
Thyroid Gland T4 Content
Total T4 content in vole thyroid glands was also measured by the method
of McNabb and Cheng (7, 18). In brief, this involved radioimmunoassay of
ethanol extracts of thyroid gland homogenates that had been digested with
Pronase solution. The digestion mixture consisted of Tris-base (1.21 g),
glutathione (153 mg), propylthiouracil (42.55 mg), Triton-X (1 mL), and milli-Q
water (100 mL). All chemicals were obtained through Sigma Chemical Co., St.
Louis, MO. Protease {Streptomyces griseus; Sigma) was added to the digestion
mixture in an amount that equaled five times the mass of each vole thyroid gland.
From this Pronase digestion solution, 350 pL was pipetted into each 2.0-mL
microcentrifuge tube containing gland tissue from one vole. Each sample was
vortexed and then incubated in a 37°C water bath for 24 hours. Following
incubation, 1 mL of ice cold 100% ethanol was added to each tube, samples
were vortexed, and tubes stored at -20X for 24 hours. The following day,
samples were centrifuged at 13,500 g for 5 minutes in a Beckman centrifuge
(Allegra 21R; Beckman Coulter, Inc., Fullerton, CA). The supernatant was
decanted into 1.5-mL microcentrifuge tubes and the pellet discarded. Extracts
were stored at -20°C until RIA analysis.
12

The same clinical RIA kit used for plasma thyroid hormone analysis was
used to determine total thyroid gland T4. Calibration standards were made in
100% ethanol and points for the standard curve were 0, 1.0, 5.0, 10.0, 15.0, and
25.0 pg/dL. Samples from extracts (25 pL) were analyzed in triplicate. The T4
RIA kit was validated for gland extracts by testing various dilutions of extract
samples against the standard curve for parallelism, and spiking sample extracts
of known concentration with T4 standards prepared in ethanol. Thyroxine spike
recoveries from vole thyroid gland extracts were 97.38%.
Tissue Perchlorate Analysis
Ion chromatography was used to analyze vole liver and kidney tissues for
perchlorate. Tissue samples were allowed to thaw, and a wet weight for each
was recorded. Samples were allowed to air-dry for approximately 48 hours and
reweighed. Perchlorate was extracted from the samples (entire tissue) using an
accelerated solvent extractor (ASE; ASE 200, Dionex Corporation). The
following operating conditions were used: milli-Q water as extraction solvent,
1500 psi, 1 cycle, 60% flush, 5 minute preheat, 5 minute static, and 100°C oven.
Total extraction time was 15 minutes per sample. Total volume of extract
collected (~22 ml) was measured and recorded. A 1:10 dilution of each sample
extract was prepared. Samples were then cleaned using silica and C^ solid
phase extraction (SPE) cartridges. Extracts were then filtered through 0.45 pm
Acrodisc® filters (Pall Gellman, Ann Arbor, Ml) and then analyzed via a
13

preconcentration/preelution ion chromatography method (16). Samples were
concentrated on a Dionex TAC-LP1 with 10 mM sodium hydroxide eluent for 2.5
minutes and then injected into the separation system. Ion separation occurred on
an analytical column (Dionex lonPac AS16) using 100 mM sodium hydroxide.
Total run time was 12.5 minutes with a 0.92 mL/min flow rate and 1000 pL
injection volume. Retention times were used to identify perchlorate and the peak
area was used for quantification. A standard curve was generated from
calibration standards of 4, 50, 100, 150, and 300 ng/mL to determine sample
concentrations. The tissue detection limit was 133 ppb in liver tissue and 980
ppb in kidney tissue on a wet tissue weight basis.
Statistical Methods
Measures of central tendency are expressed as mean + standard error.
Effects of exposure on thyroid hormone concentrations and thyroid hormone
content were tested using analysis of variance (ANOVA). Peak metabolic rates
were analyzed using ANOVA after log transformation. Any differences between
group means were further analyzed using Duncan's multiple-range test. The
effect of thyroxine or perchlorate dose on resting metabolic rates over time was
tested with repeated measures analysis of variance using a general linear model
procedure. Kidney mass (wet weight) was analyzed using analysis of
covariance, using body mass at time of euthanasia as the covariate. Body mass
was not a significant covariate for kidney mass; thus, the effects of exposure on
14

kidney mass were analyzed with ANOVA. When nongaussian distribution or
heterogeneity of variance was observed, nonparametric tests were chosen for
subsequent analyses. Liver mass (wet weight), mean body mass per week, and
mean water and food consumption per week were analyzed using Wilcoxon's
signed-ranks test. Weekly mean water and food consumption values per
treatment group were calculated from an average weekly value per individual.
Pearson's correlation coefficient and linear regression analysis were used to
assess potential relationships between plasma T4 or thyroid gland content and
peak metabolic rate in voles, as well as plasma T4 and thyroid gland content
concentrations. All statistical analyses were performed with SAS 8.02 (SAS
Institute, Gary, NC, USA). Statistical tests were considered significant when
p<0.05.
15
CHAPTER III
RESULTS
Perchlorate Intake
Following ion chromatography analysis of dosing solutions, actual mean
perchlorate dose rates were calculated on a mg/kg/day basis. Mean perchlorate
intake rates were 0, 0.93 ± 0.21, 1.33 ±0.10, and 11.68 ± 1.28 mg/kg/day/vole
for the nominal 0, 0.75, 1, and 10 mg/kg/day/vole groups, respectively (Table 3.1;
Figure 3.1). Mean perchlorate concentrations in water were 0, 2.16 ± 0.04, 2.91
± 0.07, and 19.79 ± 0.99 mg/L for 0, 0.75, 1, and 10 mg/kg/day treatment groups,
respectively.
Thyroxine Pellet Effects on Metabolism
Mean resting metabolic rates were not significantly different between any
of the treatment groups during the pre-implant measurement period or post-
implant periods (Table 3.2; Figure 3.2). However, there was a noticeable dose-
response relationship between thyroxine dose and metabolic rate at day 7 post-
implantation. The dose-response diminished on weeks 2 and 3, but both the 0.5
and 1.5 mg T4 pellet groups continued to have higher resting metabolic rates
than control voles. Although differences between groups were not significant on
any of the days post-implantation, the trend was apparent that thyroxine
administration increased metabolic rate in a dose-dependent fashion.
16

Perchlorate Effects on Metabolism
There were no significant differences in RMR between any of the
treatment groups during pre-exposure measurements (n=20, F=0.53, p=0.6049).
There was no treatment effect on RMR during any of the 6 weeks of exposure
(Table 3.3; Figure 3.3), nor was there a trend in RMR to decrease or increase for
the long-term exposure group (0.75 mg/kg for 180 days). Mean RMR of the low
(1 mg/kg) and high (10 mg/kg) exposure groups were higher than mean RMR of
the control group through the first 4 weeks of exposure. Following that period,
there was an increase in mean RMR of the control, low, and high exposure
groups for the fifth week, and even further increases in mean RMR for control
and high exposure groups during the sixth week. The reason for the increase
was unknown. Mean RMR of voles in the 0.75 mg/kg group remained relatively
constant throughout the 180 day exposure duration, with means of 1.66 ± 0.11,
1.58 ± 0.11, 1.72 ± 0.09, and 1.48 ± 0.06 mL/g/h for exposure days 55, 90, 135,
and 170, respectively (Figure 3.4). There were also no significant differences in
PMR among treatment groups on exposure day 51 (n=20, F=0.19, p=0.827;
Table 3.3; Figure 3.5), and the mean PMR of the 0.75 mg/kg treatment group
was comparable to the 10 mg/kg group (Figure 3.5).
Thyroid Hormone Concentrations
Mean plasma T4 concentrations from perchlorate-exposed voles
decreased in an apparent dose-dependent manner, however there were no
significant differences among the perchlorate treatment groups (n=20, F=2.83,
17

p=0.0871; Table 3.4; Figure 3.6A). Thyroxine concentrations from the long-term
exposure group were comparable with concentrations from the 1 mg/kg
treatment group (Table 3.4; Figure 3.6A). Likewise, plasma T3 levels did not
differ among the treatment groups following 51 days of exposure (n=15, F=0.40,
p=0.678; Table 3.4; Figure 3.7). Plasma volumes were not sufficiently large for
both T4 and T3 analysis for all 0.75 mg/kg treatment voles, two voles from the
control and 10 mg/kg groups, and one vole from the 1 mg/kg group.
Mean thyroid gland T4 concentrations from perchlorate-exposed voles
decreased in a dose-dependent manner (Table 3.4; Figure 3.6B). There were
significant differences in mean thyroid gland T4 concentrations among 51-day
exposure treatment groups (Fig. 3.6; n=20, F=4.50, p=0.0268). Post-hoc
analysis revealed that thyroid gland thyroxine concentrations from the 10.0 mg/kg
treatment group were significantly lower than control group concentrations.
Thyroid gland thyroxine concentrations from the long-term exposure group were
comparable with concentrations from the 1.0 mg/kg treatment group (Table 3.4;
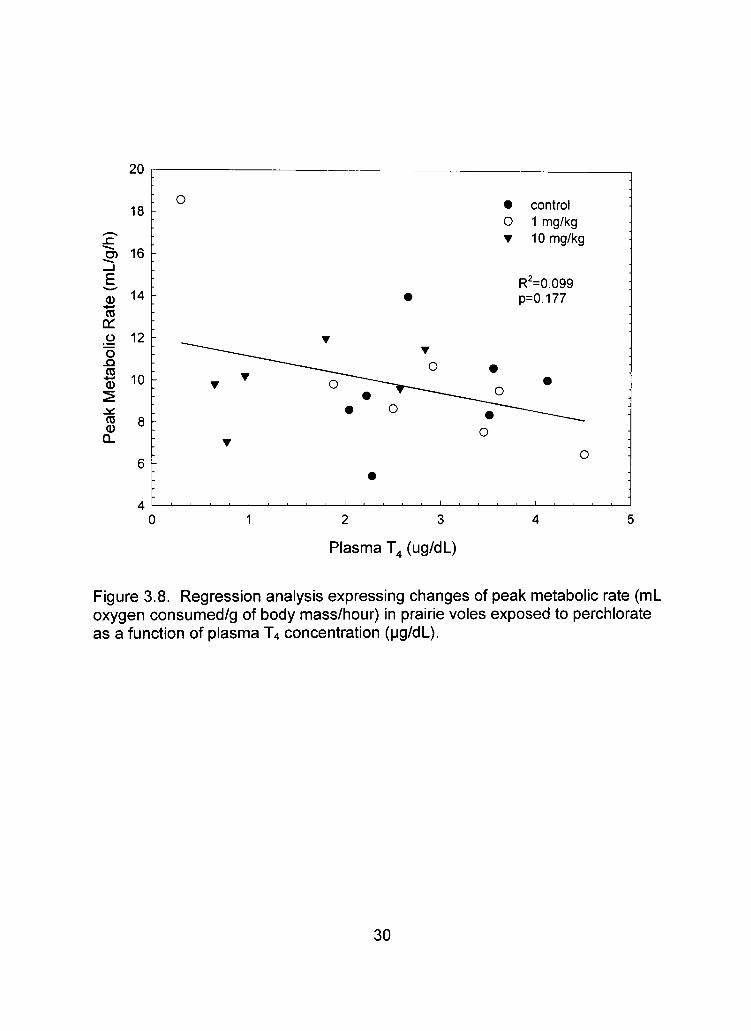
Figure 3.6B). Circulating T4 levels and thyroid gland T4 concentrations were not
significantly correlated with peak metabolic rate (n=20, r^=0.099, p=0.177; Figure
3.8; n=20, r^=0.023, p=0.520; Figure 3.9, respectively). There was a significant
relationship between circulating T4 levels and thyroid gland T4 concentrations
from 51-day exposure treatment group voles (n=20, r^=0.621, p<0.0001; Figure
3.10).
18

other Physiological Indices
Mean body mass did not differ among treatment groups for any of the
monitored weeks (Table 3.5; Figure 3.11). Voles from the 0, 1, and 10
mg/kg/day treatment groups had a mean decrease in body mass from the time
period between first perchlorate-exposure and animal euthanasia, while voles
from the 0.75 mg/kg/day group had a mean increase in body mass (Table 3.5;
Figure 3.12). Analysis of vole kidney and liver masses from the 6-week exposure
study indicated that there were significant differences in kidney mass among
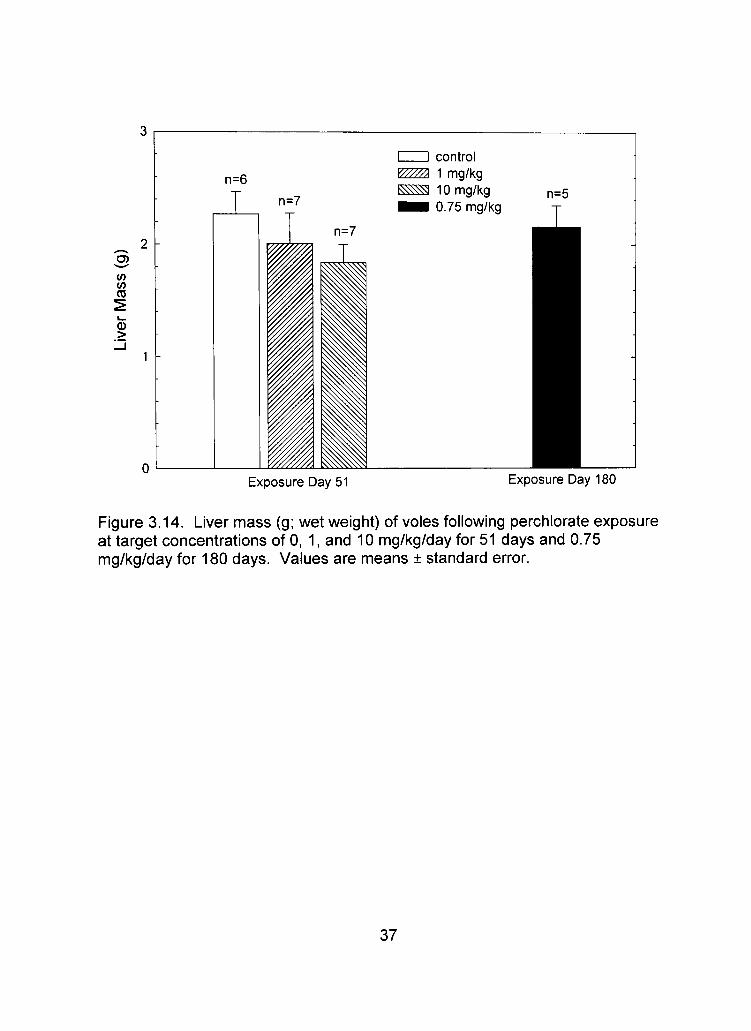
treatment groups (n=20, F=4.00, p=0.038; (Table 3.6; Figure 3.13), however no
significant differences in liver mass among treatment groups (n=20; x^=4.212,
p=0.122; Table 3.6; Figure 3.14). Both control and 1 mg/kg treatment groups
had significantly higher kidney wet weights than those of the 10 mg/kg group.
Vole livers and kidneys contained no detectable levels of perchlorate
(concentrations <133 and <980 ng perchlorate/g tissue, respectively). Both
mean liver and kidney masses from the long-term exposure group were
comparable to control or 1.0 mg/kg treatment groups (Table 3.6; Figures 3.13,
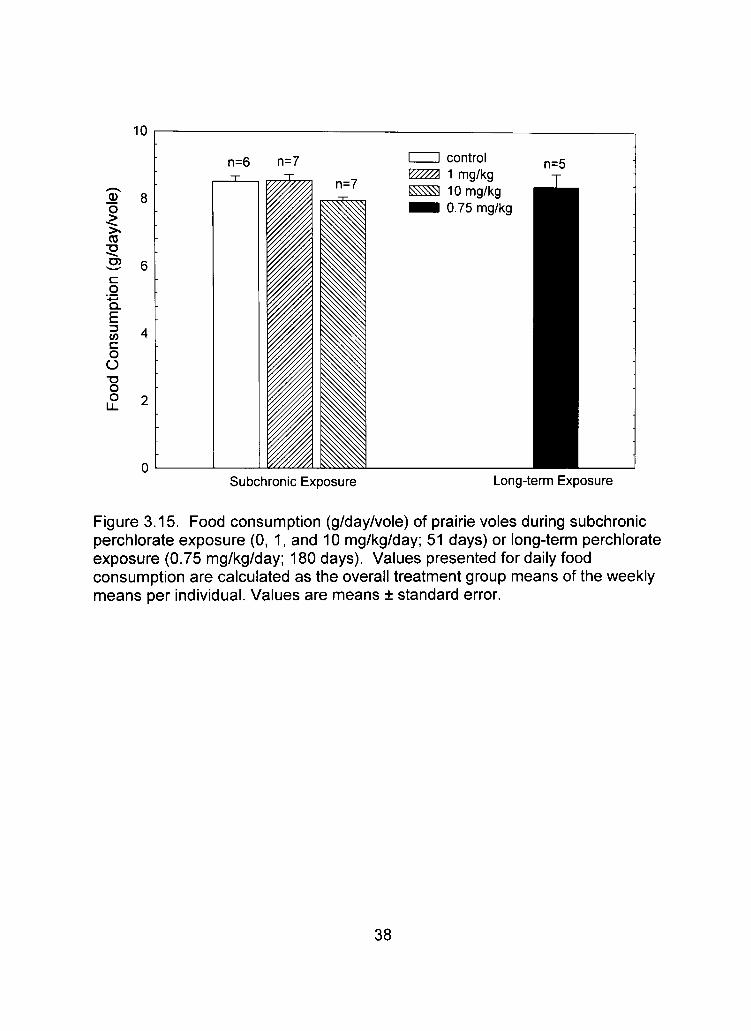
3.14). There were no significant differences in food or water consumption among
groups for any of the monitored weeks (Table 3.1; Figures 3.15, 3.16).
19

Table 3.1. Mean (±SE) perchlorate intake (mg/kg/day/vole) and food and water consumption (g/day/vole) for subchronic (0, 1, and 10 mg/kg/day/vole) and long-term (0.75 mg/kg/day/vole) treatment groups. Values presented for daily perchlorate intake are calculated as the overall treatment group means of the individual means as determined from 51 or 180 data points. Values presented for daily food and water consumption are calculated as the overall treatment group means of the weekly means per individual. Means for subchronic dosing groups are over a 51 day period, while means for the long-term dosing group are over a 180-day period.
Treatment
0 mg/kg/day
0.75 mg/kg/day
1 mg/kg/day
10 mg/kg/day
CIO4" intake (mg/kg/day/vole)
0
0.93(0.21)
1.33(0.10)
11.68(1.28)
Food consumption (g/day/vole)
8.52(0.16)
8.38 (0.38)
8.55(0.17)
7.97(0.10)
Water consumption (g/day/vole)
19.86(0.64)
21.66(3.44)
23.22 (0.48)
20.15(0.29)
20

0.75 1 10
Target Exposure (mg/kg/day/vole)
Figure 3.1. Mean (±SE) perchlorate intake (mg/kg/day) for 0.75, 1, and 10 mg/kg/day treatment groups. The 0.75 mg/kg/day treatment group was exposed for 180 days, while 1 and 10 mg/kg/day treatment groups were exposed for 51 days. Values presented for daily perchlorate intake are calculated as the overall treatment group means of the individual means as determined from 51 or 180 data points.
21

Table 3.2. Weekly mean (±SE) oxygen consumption rates of prairie voles implanted with 21-day thyroxine releasing pellets. Units of oxygen consumption rates are expressed as mL of oxygen consumed per gram of body weight per hour (mL/g/h).
Week
Treatment
placebo
0.5 mg
1.5 mg
0
1.49(0.09)
1.52(0.05)
1.47(0.07)
1
1.62(0.07)
1.76(0.17)
1.93(0.10)
2
1.55(0.12)
1.72(0.11)
1.72(0.01)
3
1.57(0.22)
1.72(0.16)
1.66(0.24)
O)
c g Q.
E v> c o O c C3)
X
O
i ri
li I
J placebo (0 mg T4 pellet)
l??????l 0.5 mg T4 pellet R^^^ 1.5 mgT4 pellet
1 ii
1
TI
[ Weeks Post-Implantation
Figure 3.2. Mean oxygen consumption rates (mL/g/h) of prairie voles implanted with 21-day thyroxine releasing pellets. Values are means ± standard error for the 4 individuals each measured once during the indicated week.
22

Table 3.3. Weekly mean resting metabolic rates (mL/g/h; days 0-42) and peak metabolic rates (mL/g/h; day 51) of prairie vole treatment groups. Metabolic rates are in units of mL oxygen consumption per gram of body mass per hour (mL/g/h). Standard errors are given in parentheses.
Exposure day
0
7
14
21
28
35
42
51
Control
1.68(0.08)
1.80(0.14)
1.50(0.12)
1.68(0.14)
1.54(0.13)
1.67(0.12)
1.93(0.21)
10.13(0.85)
1 mg/kg
1.78(0.07)
2.08 (0.23)
1 .77(0.11)
1.94(0.13)
1.60(0.07)
1.76(0.12)
1.71 (0.06)
10.17(1.50)
10 mg/kg
1.77(0.12)
1.92(0.10)
1.75(0.09)
1.87(0.14)
1.58(0.06)
1.70(0.11)
1.86(0.06)
9.37 (0.89)
23

5 c
Q.
E (0 c o O c (U D) 5^ X
O
li I
I I control ^ ^ LOmgClOVkg ^^^ lO.OmgCIO^/kg
T I
T T
14 21 28 35 42
Days Post Dose
Figure 3.3. Weekly resting metabolic rates (mL/g/h) of prairie voles exposed to perchlorate in drinking water for 6 weeks at target doses of 0, 1.0, and 10 mg/kg/day, with sample sizes of 6, 7, and 7, respectively. Values are means ± standard error.
24

Exposure Day
Figure 3.4. Resting metabolic rates of prairie voles (n=5) exposed to perchlorate at a target dose of 0.75 mg/kg/day for 180 days. Pre-exposure metabolic rate was not measured. Values are means ± standard error.
25

Exposure day 51 Exposure day 180
Figure 3.5. Peak metabolic rates (mL/g/h) of prairie voles in helox atmosphere following 51 days (0, 1.0, and 10.0 mg/kg; n=7/treatment) or 180 days (0.75 mg/kg; n=5/treatment) of perchlorate exposure in drinking water. Temperature in metabolic chamber held at 12°C for 20 minutes followed by a drop in temperature to S'C for a maximum duration of 60 minutes. Values are means ± standard error. One vole in the control group died prior to peak metabolic rate experiments.
26
Table 3.4. Mean (±SE) prairie vole plasma T4 (pg/dL), T3 (ng/dL) and thyroid gland T4 (ng T4/thyroid gland) following 51 days of exposure (0, 1, 10 mg/kg/day) or 180 days exposure (0.75 mg/kg/day) to perchlorate in the drinking water.
Plasma T3 Thyroid Gland T4 Treatment Plasma T4 (pg/dL) (ng/dL)' (ng T4/ thyroid gland)
a 0 mg/kg/day 3.01(0.83) 109.29(15.05) 704.62(372.62)
0.75 mg/kg/day 2.69(0.41) NA 464(182.05)
1 mg/kg/day 2.74(1.36) 94.83(13.36) 454.20(290.52)'"
10 mg/kg/day 1.7(0.91) 95.57(5.92) 219.54(196.76)" *n=15 Values with different letters differ significantly (p<0.05).
27

U)
m
0.75 0 1.0 10.0
CIO4" in Drinking Water (mg/kg)
Figure 3 6 Plasma T4 concentrations (pg/dL) (A) and thyroid gland T4 content (nq T4/thyroid gland) (B) per treatment group after 51 days of exposure to 0, 1.0, and 10 0 mg/kg (n=7/treatment) or 180 days to 0.75 mg/kg (n=5) in dnnking water Values are means ± standard error. One vole in the control group died prior to peak metabolic rate experiments. Bars with different letters differ significantly (p<0.05).
28

c
i -
140
120
100
0 1 10
CIO4 in Drinking Water (mg/kg)
Figure 3.7. Plasma T3 (ng/dL) concentrations of prairie voles exposed to perchlorate in the drinking water at doses of 0, 1, and 10 mg/kg/day. Values are means ± standard error.
29
20
18 -
D) 16 in E ^ 14 CD
a: ^ 12 o
CD
o
o o
• control O 1 mg/kg T 10 mg/kg
R'=0.099 p=0.177
0 1 2 3 4 5
Plasma T^ (ug/dL)
Figure 3.8. Regression analysis expressing changes of peak metabolic rate (mL oxygen consumed/g of body mass/hour) in prairie voles exposed to perchlorate as a function of plasma T4 concentration (pg/dL).
30

_ JZ ^
E, (D *-• CD a: o "o .a
Met
;
j ^ CD
a.
i.\j
18
16
14
12
10
8
6
A
-•
•
-. •
:
_
-
•
. i l l
o
•
T
. , 1
T
• ^ ^
•
1 1 1
~v~ o
, 1 ,
•
T
o»
•
o
•
o T
R^=0.023 p=0.520
O
. . 1 . . . . 1 . .
control 1 mg/kg 10 mg/kg
•
•
1 . . . .
0 200 400 600 800 1000 1200 1400
Thyroid Gland T^ (ng T^/thyroid gland)
Figure 3.9. Regression analysis expressing changes of peak metabolic rate (mL oxygen consumed/g of body mass/hour) in prairie voles exposed to perchlorate as a function of thyroid gland T4 concentration (ng T4/thyroid gland).
31

^ 3
CO E w m
Q.
2 -
1 -
R^=0.621 p=0.0001
O
-
"
T
^y^
^ ^
• T
T
O , , , , 1 . . . . 1 . .
o
^ .
. 1 .
9
O T / ^
•
. 1 1 1 1 1 1
•
o T
, 1 . . . . 1
o ^
^ / ^
•
-
.
-
control 1 mg/kg/day 10 mg/kg/day
. , , , 1 . , . .
200 400 600 800 1000
Thyroid Gland T^ (ng T^/gland)
1200 1400
Figure 3.10. Regression analysis expressing changes of plasma T4 concentrations (pg/dL) in prairie voles exposed to perchlorate as a function of thyroid gland T4 concentrations (ng T4/thyroid gland).
Table 3.5. Mean (±SE) body mass(g) and body mass change for subchronic (0, 1, and 10 mg/kg/day) and long-term (0.75 mg/kg/day) treatment groups. Means for subchronic dosing groups are over a 51 day period, while means for the long-term dosing group are over a 180 day period.
Treatment Body mass (g) Body mass change (g)
0 mg/kg/day
0.75 mg/kg/day
1 mg/kg/day
10 mg/kg/day
49.96 (0.62)
53.02 (4.68)
43.20 (0.24)
42.28 (0.28)
-2.71 (1.71)
+1.51 (1.04)
-1.78(1.04)
-3.18(0.76)
32

O)
70
60
50
(/> (A CD ^
T3 O GO
40
30
20
10
n=6
I I control ^ ^ 1 mg/kg R^^^ 10 mg/kg m?^ 0.75 mg/kg
n=5
n=7 n=7
Subchronic Exposure Long-term Exposure
Figure 3.11. Mean (±SE) body mass (g) of voles during subchronic perchlorate exposure (0, 1, and 10 mg/kg/day; 51 days) or long-term exposure (0.75 mg/kg/day; 180 days).
33

(A
CD
c o (U
Q_
100
80
O 00 -S 60 CD
40
20
n=6 T
n=7 n=7
I I control P? ?? 1 mg/kg R^^^ 10 mg/kg g^^^^ 0.75 mg/kg
n=5
Subchronic Exposure Long-term Exposure
Figure 3.12. Mean body mass change as a percent of initial of voles during subchronic perchlorate exposure (0, 1, and 10 mg/kg/day; 51 days) or long-term perchlorate exposure (0.75 mg/kg/day; 180 days). Initial body mass was calculated as the mean of one-week of pre-exposure measurements. Values are means ± standard error.
34

Table 3.6. Mean (±SE) prairie vole tissue masses (g; wet weight) following 51 days of exposure (0, 1, 10 mg/kg/day) or 180 days exposure (0.75 mg/kg/day) to perchlorate in drinking water.
Tissue Mass (g)
Treatment Liver Kidney
0 mg/kg/day 2.27 (0.20) 0.51 (0.03)'
0.75 mg/kg/day 2.16 (0.19) 0.52 (0.08)
1 mg/kg/day 2.01 (0.27) 0.50 (0.03)'
10 mg/kg/day 1.84(0.16) 0.41 (0.03)^ Values with different letters differ significantly (p<0.05).
35

0.7
0.6
0.5 -
C3)
(fl 0.4 CD
^ 0.3 • g
0.2
0.1
0.0
r control
a
T
VTTTTA 1 mg/kg 1^^^^ 10 mg/kg ^ • i 0.75 mg/kg
Exposure Day 51 Expsosure Day 180
Figure 3.13. Kidney mass (g; wet weight) of voles following perchlorate exposure at target concentrations of 0, 1, and 10 mg/kg/day for 51 days and 0.75 mg/kg/day for 180 days. Sample sizes are 6, 7, 7, and 5 for 0, 1, 10, and 0.75 mg/kg/day treatment groups. Values are means ± standard error. Bars with different letters differ significantly (p<0.05).
36
3 (A to CD
0) >
H control
n=6
n=7
VZ^^ 1 mg/kg ^ ^ 10 mg/kg ^ • i 0.75 mg/kg
n=5
n=7
Exposure Day 51 Exposure Day 180
Figure 3.14. Liver mass (g; wet weight) of voles following perchlorate exposure at target concentrations of 0, 1, and 10 mg/kg/day for 51 days and 0.75 mg/kg/day for 180 days. Values are means ± standard error.
37
10
O 8 O
CD
S 6 c g *—» a. E ^ 4 c o O TJ O O 9
n=6 H control g??^ 1 mg/kg ^ ^ 10 mg/kg ^ • 1 0.75 mg/kg
n=5
Subchronic Exposure Long-term Exposure
Figure 3.15. Food consumption (g/day/vole) of prairie voles during subchronic perchlorate exposure (0, 1, and 10 mg/kg/day; 51 days) or long-term perchlorate exposure (0.75 mg/kg/day; 180 days). Values presented for daily food consumption are calculated as the overall treatment group means of the weekly means per individual. Values are means ± standard error.
38

30
o
I 20 c g Q. E w c o O k -
j5
15
10
c D control
JL.
t???^ 1 mg/kg ^^^^ 10 mg/kg • ^ 0.75 mg/kg
Subchronic Exposure Long-term Exposure
Figure 3.16. Water consumption (g/day/vole) of prairie voles during subchronic perchlorate exposure (0, 1, and 10 mg/kg/day; 51 days) or long-term perchlorate exposure (0.75 mg/kg/day; 180 days). Values presented for daily water consumption are calculated as the overall treatment group means of the weekly means per individual. Values are means ± standard error.
39

CHAPTER IV
DISCUSSION
This study indicates that perchlorate-induced alterations in thyroid function
do not necessarily translate into alterations in metabolic rate and/or decreases in
thermogenic response. Initially we expected to see an increase in vole metabolic
rate after first exposure, followed by a gradual drop in metabolic rate during the
last weeks of exposure. We hypothesized that initial exposure would cause the
hypothalamus-pituitary-thyroid (HPT) axis to compensate for any reductions in
thyroid hormone secretion from the thyroid gland. An increase in circulating
thyroid hormones usually results in increased metabolic rate, as numerous
studies have documented among thyroid hormone-administered rodents and
birds (19, 20, 21). With severe and/or prolonged perchlorate exposure and/or
iodine deficiency in the thyroid, HPT activation will be unable to maintain
euthyroid status, causing decreased levels of circulating thyroid hormones and
eventually reduced metabolic rate. However, despite reductions in thyroid
hormone concentrations in exposed groups, the trend of decreased RMR was
not evident in our data over the six-week exposure period.
We also hypothesized that it might take a longer time than 6-7 weeks to
see perchlorate-induced changes in plasma or thyroid gland T4 and/or T3
concentrations. The mammalian thyroid gland has an ability to store large
amounts of hormone (22); therefore, physiological effects of thyroid hormone
40

deficiency may not be observed for weeks or months, depending on the
organism's capacity to store hormone. Additionally, it may take a longer
exposure duration to see any potential perchlorate-induced reductions in RMR.
Although we did observe slight reductions in both plasma and thyroid gland
thyroxine concentrations in the long-term exposure group (0.75 mg/kg/day for
180 days) there were no alterations in RMR throughout the exposure period.
RMR values for prairie voles from this study are consistent with data from
other studies (23, 24). Mean RMR of prairie voles collected from the field during
summer and winter ranged from 1.40 ± 0.15 to 2.16 ± 0.34 mL/g/h, respectively,
with mean summer body masses of 48.5 ± 8.7 and winter body masses of 38.5 ±
4.5 g (23). The overall mean RMR of control voles calculated from 7 weeks of
data from this study was 1.68 ± 0.06 mL/g/h, with a mean body mass of 49.96 ±
0.62 g. Therefore, the absolute RMR data collected from this study likely reflect
the true RMR of prairie voles.
Perchlorate exposure had no effect on RMR in this study, but that did not
necessarily imply that there would be no effect on metabolic rate under
conditions of cold exposure. Peak aerobic performance under cold-challenge
was used as an ecologically relevant indicator of thermogenic response in
perchlorate-exposed organisms. Since there have been no reports of any
species of Microtus showing torpor either on a seasonal basis or for a shorter
term, they must always expend energy for thermoregulation. Therefore,
thermoregulation is a major maintenance cost for wild voles, as well as other
41

rodent species with similar behavior (25). Our data did not demonstrate a
marked reduction in the ability of perchlorate-exposed animals to deal with cold-
stress tests. Again, it may require a longer duration of exposure or higher dose
to see such an effect on cold-tolerance. Some of the voles in the high exposure
group showed signs that they were able to deal with cold temperatures as well as
control animals. Three of the seven voles in the high exposure group were able
to sustain peak metabolic rate until completion of the 60 min cold exposure, and
following removal from the chamber, their internal body temperature had only
decreased 2°C. These voles also had metabolic rates higher than those of the
mean control vole metabolic rate; however, other voles in the high dose group
had substantially lower peak metabolic rates than control or low dose voles. This
is most likely due to variability in individual response to perchlorate exposure and
variability in fur thickness and subcutaneous fat reserves, which may ultimately
influence thermal conductance and sensitivity to cold temperatures. It also
appears that long-term perchlorate exposure may have little effect on a prairie
vole's capacity for facultative thermogenesis.
This is the first study to present data on cold-induced PMR in a helox
atmosphere in prairie voles. Other studies have presented data for
norepinephrine (NE)-induced non-shivering thermogensis in prairie voles, as well
as oxygen consumption of prairie voles exposed to 5°C in air in a laboratory
setting (23, 25). It was not determined whether those values represented PMR in
prairie voles. One study reported NE-induced non-shivering thermogeneis
42

metabolic rates ranging from approximately 1.80 - 4.20 mL/g/h (25). Oxygen
consumption of prairie voles exposed to 5°C in air was reported as 2.72 ± 0.40
mL/g/h (23). Mean PMR of prairie voles from our study was approximately six-
times higher than mean RMR, while NE-induced and cold air temperature-
induced thermogenesis metabolic rate values were approximately 42% and 27%
of PMR values from our study, respectively. Therefore, it is likely that PMR was
not achieved in these other studies, and our study presents data on the true
thermogenic capacity of prairie voles.
Several studies have suggested that an increase in thermogenic capacity
may be expected with an increase in brown adipose tissue deposits (23, 26, 27).
Although, vole carcasses were not investigated for presence of brown adipose
tissue deposits, several carcasses among treatment groups contained high levels
of intraperitoneal white fat deposits. White adipose tissue functions as a heat
insulator, as its thermal conductance is only approximately one-third of that of
other tissues, as well as an energy source, whereas brown adipose tissue
primarily serves in heat generation for mammalian non-shivering thermogenesis.
An increase in brown adipose tissue may coincide with the growth of white
adipose cells; therefore it may be expected that some voles with higher levels of
brown adipose tissue could have increased thermoregulatory capabilities. In
most scenarios, insulation will suffice to meet most summer cold stress since
these should be moderate relative to winter cold stress. In winter at the lowest
temperature stresses, insulation needs met by white adipose tissue alone may
43

not suffice to combat heat loss; therefore, prairie voles have increased levels of
thermogenesis and must have high energetic turnover.
Voles in our study were provided with a formulated rabbit chow, which
should provide them with sufficient nutrients to maintain or exceed the daily
energy needs of a caged rodent. Past studies have shown that animals that are
well fed in the laboratory may maintain high body temperatures as a result of
increase metabolic turnover rate (ie. turnover rate of chemical energy in an
animal's body) (23, 27). However, wild voles are primarily grass feeders and
food quality and perhaps food quantity may vary seasonally, thus shifting
metabolic turnover rate and demanding higher total energy needs for winter
animals over summer animals. Given that voles do not have the important
adaptive pattern of torpor, which allows an animal to store energy and reduce
foraging activity during coldest conditions, that other rodents express, they must
continue to forage through some of the coldest conditions. Foraging in times of
cold temperatures and reduced food quality may place additional stress on an
animal that may be expensive in terms of energy. This may ultimately influence
compensatory mechanisms to cold-stress, such as the growth of white and
brown adipose tissue, as well as an animal's sensitivity to cold temperatures and
thermogenic response.
Our data did not show a marked reduction in plasma T3. Small sample
size (n=15) for T3 analysis may explain why there were no statistically significant
differences. Although the results were not statistically significant, we did observe
44
a dose-response pattern in plasma T4 levels (Figure 3.6A). We also found
statistically significant reductions in thyroid gland thyroxine content in high dose
treatment groups compared to controls (Figure 3.6B). Despite a reduction in T4,
T3 is the biologically active thyroid hormone and any reduction in T4 may not
have an impact on T3 concentrations. A change in T4 concentration that does not
have an impact on deiodination processes would not impact the levels of T3 (28).
Cellular metabolism and the generation of ATP are tied to concentrations of T3,
which were not found to be affected by perchlorate exposure. It is logical that
resting metabolic rates as well as peak metabolic rates would not be affected
either.
Alterations in plasma thyroid hormone concentrations could have been
ameliorated by the HPT axis, which tends to restore circulating thyroid hormones
to euthyroid levels. To our knowledge, there have been no other studies
investigating perchlorate effects on metabolic rate in endothermic organisms;
however, another endocrine disrupter acting on the thyroid gland, Tapazole,
yielded decreases in serum T4 concentrations, but had no effect on standard
metabolism (29).
Reductions in thyroid hormones are often related to perchlorate exposure
and thyroid hormones are key players in metabolic capacity, however, we found
no relationship between peak metabolic rate and plasma thyroxine
concentrations or thyroid gland content. Therefore, despite reductions in thyroid
45

hormone concentrations, it may be possible that these animals were able to
overcome any potential effects of exposure.
It is also important to note that iodine was not limited in the rodent diet, as
the rodent chow contains an average value of 0.48 ppm iodine
(www.labdiet.com). With sufficient or high iodine or iodide in the diet, the HPT
axis may be able to maintain a euthyroid status (30).
Although results were not statistically comparable, a 180-day exposure to
perchlorate at 0.93 mg/kg caused similar effects on thyroid function as did a 42-
day exposure at 1.33 mg/kg. It is noteworthy that such a strong relationship
existed between plasma and thyroid gland T4 concentrations. With sufficient
competition between iodide and perchlorate at the sodium-iodide symporter,
there may be reduced T4 production within the gland and therefore less secretion
into the blood. Perhaps it may be important to investigate various duration and
dose combinations to determine how long and what doses it would take to cause
a biologically meaningful depletion of thyroid gland thyroid hormone. Such an
effect may have severe implications for an animal's thermogenic capacity and
response to cold temperatures.
One of the most often used indices of exposure has been plasma thyroid
hormone level, which is probably the most variable measure of thyroid function.
This is most likely due to the dynamic adjustment ability of the HPT axis (7, 30).
This study showed that glandular T4 content may be a more sensitive indicator of
perchlorate-induced alterations in thyroid function in prairie voles than plasma
46

hormone concentrations. This is the first study to document such a finding in
mammals. Current research is also proving that this technique may be a better
indicator of perchlorate exposure than plasma thyroid hormone concentrations, at
least in avian species (7), and perhaps in rodents as well, pending further
research.
The indication of no difference in RMR among treatments groups and the
large variability among weeks within a treatment group may also have been
attributable to an increase in activity within the metabolic chamber. High
vanability of peak metabolic rate between animals of the same treatment and low
sample sizes may have obscured differences as well. The configuration of the
respirometry system and confounding factors such as long wash times (time
taken for recirculation of gas in a chamber) made the process of collecting
metabolic rates relatively difficult. The number of animals that could be run
simultaneously (three per day) was low due to arrhythmic activity of voles, and
thus limited the sample sizes at each metabolic rate sampling period. In some
cases, test voles may have rested for a total of 30 minutes in the metabolic
chamber per 7-8 hour test period. Other species, such as Peromyscus sp., may
be better models to use when investigating contaminant effects on metabolic
function (31, 32). Future studies of this nature must find a balance between
designing experiments that incorporate larger sample sizes, while still making the
procedures of measuring oxygen consumption a relatively time and cost efficient
process.
47

Energy expenditure, as measured by oxygen consumption, has been a
useful endpoint in linking environmental contaminant exposure to a measure of
individual performance. For example, terrestrial organisms exposed to
contaminants such as polychlorinated biphenyls incur greater maintenance costs
and may be adversely affected by cold-stress (32, 33, 34). However, this study
did not provide evidence for energetic costs associated with perchlorate
exposure at the individual level. It also did not provide evidence that rodents
exposed to perchlorate in water at concentrations that were much higher than
those typically found in surface or groundwater are adversely affected by short-
term cold exposure. The perchlorate concentrations used in our study may
reflect those of highly perchlorate contaminated sites, such as the LHAAP in
Texas and Las Vegas Wash in Nevada.
There are issues that must be taken into consideration before drawing
any conclusions on whether perchlorate exposure can induce alterations in
metabolic rate, and more importantly thermoregulatory capabilities. First, we
must continue to investigate how the HPT axis responds to perchlorate exposure
at varying levels. Another issue concerns the complex hormonal control of
thermogenesis in endothermic organisms. Although thyroid hormones are key
players in heat production, adaptive thermogenesis is primarily controlled by the
sympathetic nervous system via norepinephrine (35). Because animals often
have the ability to adapt behaviorally or physiologically under conditions of
toxicant stress, there should be an emphasis on the need for further evaluation of
48

the interaction between perchlorate exposure and adaptive strategies. For
instance, small mammals in temperate climates often compensate for thermal
stress in winter by increasing their resting metabolic rate and activity of
nonshivering thermogenesis (36). Rodents can also respond to cold exposures
by inducing growth of brown adipose tissue (37). Prairie voles also show a
higher weight-specific rate of oxygen consumption in winter than in summer
which may allow tolerance to lower thermal exposures (23). Given that rodents
have these physiologically controlled adaptive responses to cold-conditions, it is
possible that low, environmentally-relevant concentrations of perchlorate
exposure will have little or no effect on an animal's ability to deal with cold-stress
or cause alterations in metabolic rate.
49

REFERENCES
1. Urbansky, E.T. (2000). Perchlorate ir) tlie environment. New York, NY, USA: Kluwer Academic/Plenum Publishers.
2. Urbansky, ET. (1998). Perchlorate chemistry: implications for analysis and remediation. Bioremediation Journal, 2, 81-95.
3. Jackson, W.A., Anandam, S., Anderson T.A., Lehman, T., Rainwater, K., Rajagopalan, S., Ridley, M., Took, W.R. (2004). Perchlorate occurrence in the Texas southern high plains aquifer system. Ground Water Monit Remed, in press.
4. Wyngaarden, J.B., Wright, B.M., Ways, P. (1952). The effect of certain anions upon the accumulation and retention of iodide by the thyroid gland. Endocrinology, 50, 537-549.
5. Siglin, J.C, Mattie, D.R., Dodd, D.E., Hildebrandt, P.K., Baker, W.H. (2000). A 90-day drinking water toxicity study in rats with the environmental contaminant ammonium perchlorate. Toxicol Sci, 57, 61-74.
6. Thuett, K.A., Roots, E.H., Mitchell, L.P., Gentles, B.A., Anderson, T.A., Kendall, R.J., Smith, E.E. (2002). Effects of/n utero and lactational ammonium perchlorate exposure on thyroid gland histology and thyroid and sex hormones in developing deer mice {Peromyscus maniculatus) through postnatal day 21. J Toxicol Environ Health A, 65, 2119-2130.
7. McNabb, F.M.A., Larsen, C.T., Pooler, P.S. (2004). Ammonium perchlorate effects on thyroid function and growth in bobwhite quail chicks. Environ Toxicol Chem, 23, (4), 997-1003.
8. Smith, P.N., Theodorakis, C.W., Anderson, T.A., Kendall, R.J. (2001). Preliminary assessment of perchlorate in ecological receptors at the Longhorn Army Ammunition Plant (LHAAP), Karnack, TX. Ecotoxicology, 10,305-313.
9. Smith, P.N., Yu, L., McMurry, S.T., Anderson, T.A. (2004). Perchlorate in water, soil, vegetation, and rodents collected from the Las Vegas Wash, Nevada, USA. Environ Pollut, in press.
50

10. U.S. Army Corps of Engineers (USACE). (2004). Final Report: Bosque and Leon River Watersheds Study, http://www.swf.usace.army.mil/ppmd/ Perchlorate/lndex.html.
11. McNabb, F.M.A. (1995). Thyroid hormones, their activation, degradation, and effects on metabolism. J Nutr, 125, 1773-1776.
12. Scholander, P.E. (1955). Evolution of climatic adaptation in homeotherms. Evolution, 9, 15-26.
13. United States Environmental Protection Agency (EPA). (1993). Wildlife Exposure Factors Handbook, Vol I. EPA/600/R-93/187.
14. Calow, P. (1989). Physiological ecotoxicology: theory, practice, and application. Paper presented at the Proceedings of the First European Conference on Ecotoxicology, Lyngby, Denmark, pp. 23-25.
15. Wolff, J. (1998). Perchlorate and the thyroid gland. Pharmacol Rev, 50, 89-105.
16. Tian, K., Dasgupta, P.K., Anderson, T.A. (2003). Determination of trace perchlorate in high-salinity water samples by ion chromatography with online preconcentration and preelution. Anal Chem, 75, 701-706.
17. Rosenmann, M., Morrison, P. (1974). Maximum oxygen consumption and heat loss facilitation in small homeotherms by He-02. Am J Physiol 226, (3), 490-495.
18. McNabb, F.M.A., Cheng, M.F. (1985). Thryoid development in ring doves, Streptopelia risoria. Gen Comp Endocrinol, 58, 243-251.
19. Oh, S.S., Murray, L.K. (1994). Early treatment of obese(ob/ob) mice with triiodothyronine increases oxygen consumption and temperature and decreases body fat content. Society for Experimental Biology and Medicine, 207, 260-267.
20. Hwang-Bo, J., Muramatsu, T., Okumura, J. (1990). Relative biopotency of triiodothyronine and of thyroxine for inducing oxygen consumption in young chicks. Poultry Science, 69,1027-1029.
21. Banta, M.R., Holcombe, D.W. (2002). The effects of thyroxine on metabolism and water balance in a desert-dwelling rodent, Merriam's kangaroo rat {Dipodomys merriami). J Comp Physiol B, 172, 17-25.
51

22. Guyton,A.C.,Hall, J.E. (2001). Textbook of Medical Physiology 10*^ ed. Philadelphia, PA, USA: W.B. Saunders Company.
23. Wunder, B.A., Dobkin, D.S., Gettinger, R.D. (1977). Shifts of thermogenesis in the prairie vole {Microtus ochrogaster), strategies for survival in a seasonal environment. Oecologia, 29, 11-26.
24. Bradley, S.R. (1976). Temperature regulation and bioenergetics of some microtine rodents. Unpubl. Ph.D. dissert., Cornell Univ., Ithaca, New York 153 pp.
25. Tamarin, R.H. (1985). Biology of New World Microtus. Special Publication No. 8, ed. Provo, Utah: American Society of Mammologists.
26. Lynch, G.R. (1973). Seasonal changes in thermogenesis, organ weights, and body composition in the white-footed mouse, Peromyscus leucopus. Oecologi, 13, 363-376.
27. Rosenmann, M., Morrison, P., Feist, D. (1975). Seasonal changes in the metabolic capacity of red-backed voles. Physiol Zool, 48, 303-310.
28. Hulbert, A.J., Hinds, D.S., MacMillen, R.E. (1985). Minimal metabolism, summit metabolism and plasma thyroxine in rodents from different environments. Comp Biochem Physiol, 81, 687-693.
29. Hudson, J.W. (1980). The thyroid gland and temperature regulation in the prairie vole, Microtus ochrogaster, and the chipmunk, Tamias striatus. Comp Biochem Physiol, 65A, 173-179.
30. McNabb, F.M.A. (1992). Thyroid hormones. Englewood Cliffs, NJ, USA: Prentice Hall.
31. French, J.B. Jr, Voltura, M.B., Tomas, T.E. (2001). Effects of pre- and postnatal polychlorinated biphenyl exposure on metabolic rate and thyroid hormones of white-footed mice. Environ Toxicol Chem, 20, 1704-1708.
32. Voltura, M.B., French, J.B. Jr. (2000). Effects of dietary polychlorinated biphenyl exposure on energetics of white-footed mouse, Peromyscus leucopus. Environ Toxicol Chem, 19, 2757-2761.
33. Seo, B-W., Meserve, L.A. (1995). Effects of maternal ingestion of Arochlor® 1254 (PCB) on the developmental pattern of oxygen consumption and body temperature in neonatal rats. Bull Environ Contam Toxicol, 55, 22-28.
52

34. Tori, G.M., Mayer, L.P. (1981). Effects of polychlorinated biphenyl exposure on the metabolic rates of mourning doves exposed to low ambient temperatures. Bull Environ Contam Toxicol, 27, 678-682.
35. Silva, J.E. (1993). Hormonal control of thermogenesis and energy dissipation. Trends Endocrinol Metab, 4, 25-32.
36. Tomasi, T.E., Mitchell, D.A. (1994). Seasonal shifts in thyroid function in the cotton rat, {Sigmodon hispidus). J Mammal, 75, (2), 520-528.
37. Heldmaier, G. (1975). The effect of short daily cold exposures on development of brown adipose tissue in mice. J Comp Physiol, 98, 161-168.
53
APPENDIX
Body Mass, Body Mass Change, Water Consumption and Food Consumption of
Prairie Voles Implanted with 21 Day Thyroxine-
Releasing Pellets
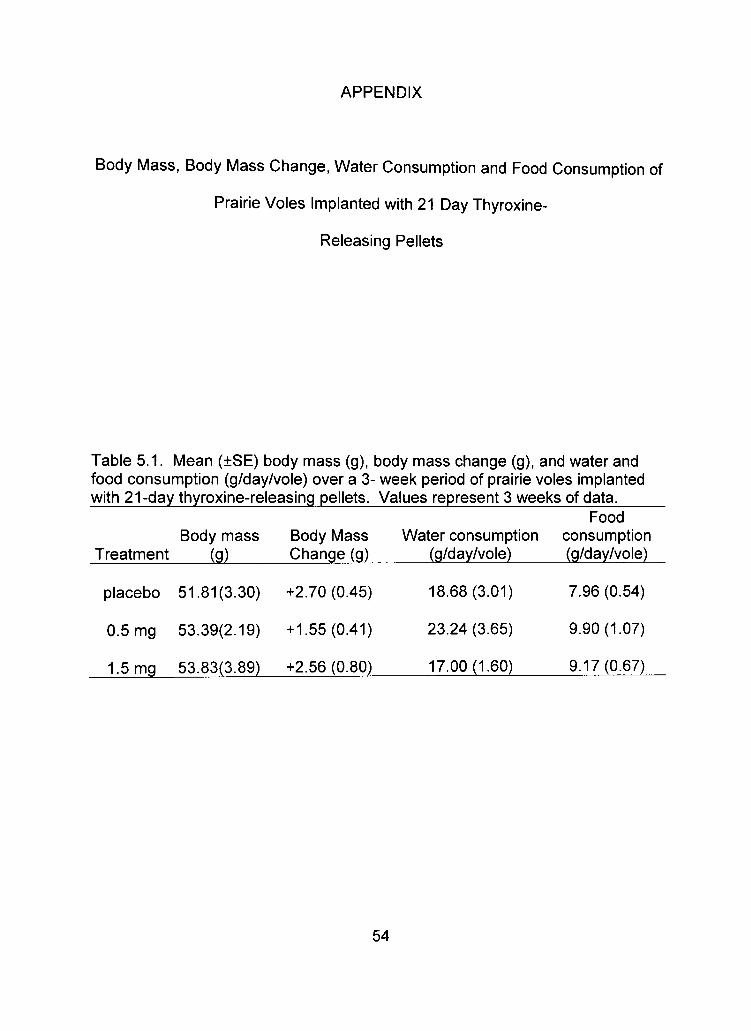
Table 5.1. Mean (±SE) body mass (g), body mass change (g), and water and food consumption (g/day/vole) over a 3- week period of prairie voles implanted with 21-day thyroxine-releasing pellets. Values represent 3 weeks of data.
Food Body mass Body Mass Water consumption consumption
Treatment (g) Change (g) (g/day/vole) (g/day/vole)
placebo 51.81(3.30) +2.70(0.45) 18.68(3.01) 7.96(0.54)
0.5 mg 53.39(2.19) +1.55(0.41) 23.24(3.65) 9.90(1.07)
1.5 mg 53.83(3.89) +2.56(0.80) 17.00(1.60) 9.17(0.67)
54

placebo 0.5 mg
T4 Pellet Dose
1.5 mg
Figure 5.1. Mean (±SE) body mass (g) of prairie voles that received 21-day thyroxine-releasing pellets. Values represent 3 weeks of data.
55

3 (A (A CD
•D O
GQ
a) (A CD
cu
placebo 0.5 mg
T. Pellet Dose 4
1.5 mg
Figure 5.2. Mean (±SE) increases in body mass (g) for prairie voles that received 21-day thyroxine-releasing pellets. Values represent 3 weeks of data.
56
placebo 0.5 mg
T4 Pellet Dose
1.5 mg
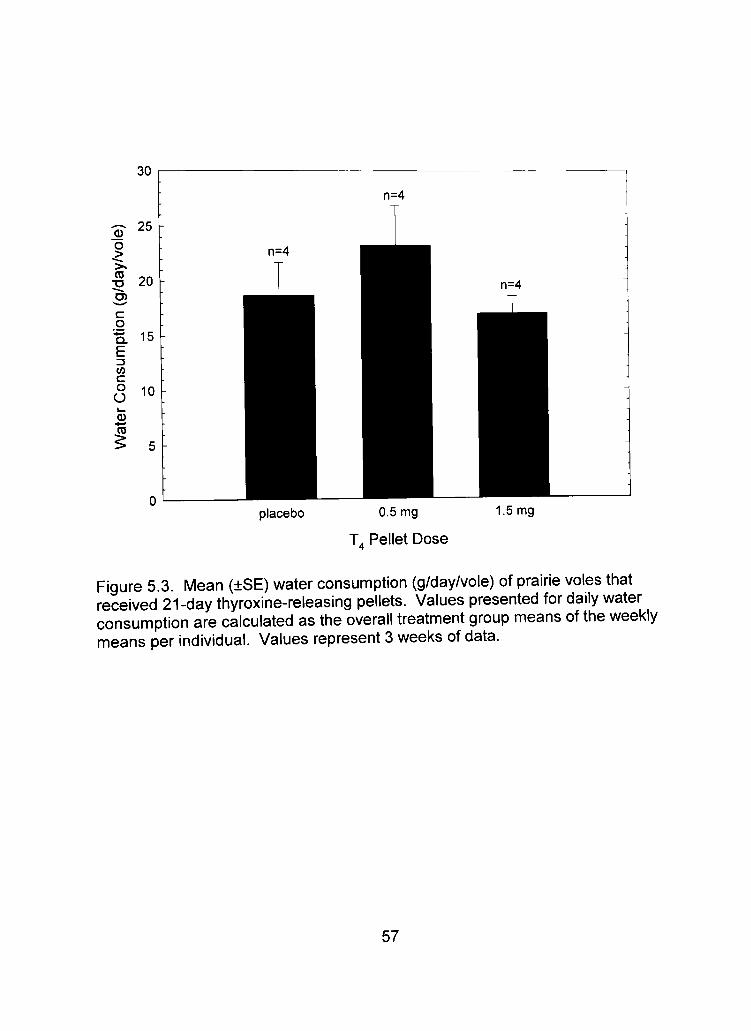
Figure 5.3. Mean (±SE) water consumption (g/day/vole) of prairie voles that received 21-day thyroxine-releasing pellets. Values presented for daily water consumption are calculated as the overall treatment group means of the weekly means per individual. Values represent 3 weeks of data.
57

placebo 0.5 mg
T4 Pellet Dose
1.5 mg
Figure 5.4. Mean (±SE) food consumption (g/day/vole) of prairie voles that received 21-day thyroxine-releasing pellets. Values presented for daily food consumption are calculated as the overall treatment group means of the weekly means per individual. Values represent 3 weeks of data.
58

PERMISSION TO COPY
In presenting this thesis in partial ftzlfilhnent of the requirements for a master's
degree at Texas Tech University or Texas Tech University Health Sciences Center, I
agree that the Library and my major department shall make it freely available for
research purposes. Permission to copy this thesis for scholarly purposes may be
granted by the Director of the Library or my major professor. It is understood that any
copying or publication of this thesis for financial gain shall not be allowed without my
further written permission and that any user may be liable for copyright infringement.
Agree (Permission is granted.)
Sftdent Signaturf^ Date
Disagree (Permission is not granted.)
Student Signamre Date