Embed Size (px)
Citation preview

EFFECTS OF ORGANIC ACIDS AND HEAVY METALS ON THE BIOMINING
BACTERIUM: ACIDITHIOBACILLUS CALDUS STRAIN BC13
by
John Earl Aston
A dissertation submitted in partial fulfillment
of the requirements for the degree
of
Doctor of Philosophy
in
Engineering
MONTANA STATE UNIVERSITY
Bozeman, Montana
April 2010

©COPYRIGHT
by
John Earl Aston
2010
All Rights Reserved
ii
APPROVAL
of a dissertation submitted by
John Earl Aston
This dissertation has been read by each member of the dissertation committee and
has been found to be satisfactory regarding content, English usage, format, citation,
bibliographic style, and consistency and is ready for submission to the Division of
Graduate Education.
Dr. Brent M. Peyton
Approved for the Department of Chemical and Biological Engineering
Dr. Ron Larsen
Approved for the Division of Graduate Education
Dr. Carl A. Fox

iii
STATEMENT OF PERMISSION TO USE
In presenting this dissertation in partial fulfillment of the requirements for a
doctoral degree at Montana State University, I agree that the Library shall make it
available to borrowers under rules of the Library. I further agree that copying of this
dissertation is allowable only for scholarly purposes, consistent with “fair use” as
prescribed in the U.S. Copyright Law. Requests for extensive copying or reproduction of
this dissertation should be referred to ProQuest Information and Learning, 300 North
Zeeb Road, Ann Arbor, Michigan 48106, to whom I have granted “the exclusive right to
reproduce and distribute my dissertation in and from microform along with the non-
exclusive right to reproduce and distribute my abstract in any format in whole or in part.”
John Earl Aston
April 2010

iv
ACKNOWLEDGEMENTS
I would like to thank my parents Earl and Barbara Aston for, among other things,
keeping me alive until I turned 18, but also for teaching by example. I want to thank my
Wife‟s parents, Jack and Becky Millstein, for raising such a wonderful daughter.
Speaking of whom, I owe so much gratitude to my wife. Flower – you‟re basically all-
round great, but in the context of graduate school, I especially appreciate your tolerance,
patience, and good food … you spoil me.
There are two other people that made this dissertation possible. First, my advisor,
Dr. Brent Peyton – among many, many things, you have always made time, been patient,
provided honest and straight-forward advice, and taught by example. I also thank Dr.
William Apel – you gave me the opportunity to work on this project, and the time I spent
at the Idaho National Laboratory was invaluable, but even more so, your constant support
and interest in my project was very much appreciated. I consider myself unreasonably
fortunate to have the two of you as mentors.
In addition, thanks to Brady Lee for always being willing to contribute ideas and
review my work. I also extend thanks to Drs. Robin Gerlach, Ross Carlson, and Abbie
Richards for providing advice and assistance when sought. Drs. Matthew Fields, Brian
Bothner, and Walid Maaty deserve thanks for mentoring me during IGERT rotations.
The IGERT program deserves special mention. It was a great opportunity and
learning experience, namely because of the effort that went into it, so thank you to Drs.
William Inskeep and Christine Foreman.
Last but not least, to those that befriended Flower and me in Bozeman … thanks!
v
TABLE OF CONTENTS
1. INTRODUCTION ....................................................................................................... 1
Outline......................................................................................................................... 1
Acidithiobacilli ............................................................................................................ 3
Classification ............................................................................................................. 3
Natural Habitat .......................................................................................................... 4
Mineral Sulfide Oxidation ........................................................................................... 5
Applications ................................................................................................................ 6
Acid-Mine Drainage .................................................................................................. 6
Biomining .................................................................................................................. 7
Acidithiobacillus Caldus ............................................................................................... 8
Importance of Acidithiobacillus Caldus in Acid-Mine Drainage
and Biomining .......................................................................................................... 8
Previous Work ............................................................................................................ 8
Scope of Present Work................................................................................................ 9
References .................................................................................................................. 11
2. TOXICITY OF SELECT ORGANIC ACIDS TO THE SLIGHTLY
ddTHERMOPHILIC ACIDOPHILE, ACIDITHIOBACILLUS CALDUS
STRAIN BC13 .......................................................................................................... 17
Abstract ...................................................................................................................... 17
Introduction ................................................................................................................ 17
Materials and Methods ................................................................................................ 19
Microorganism, Media, and Growth Conditions ........................................................ 19
Determination of Organic Acid Toxicity .................................................................. 20
Organic Acid Analysis ............................................................................................. 21
PLFA Analysis......................................................................................................... 21
Cell Imaging ............................................................................................................ 22
Statistical Analyses .................................................................................................. 23
Results ........................................................................................................................ 23
Organic Acid Toxicity .............................................................................................. 23
Changes to Organic Acid Concentrations .................................................................. 28
PLFA Analysis and Cell Imaging .............................................................................. 29
Discussion ................................................................................................................... 31
Organic Acid Toxicity ............................................................................................... 31
Changing Organic Acid Concentrations ..................................................................... 33
PLFA Analysis and Cell Imaging ............................................................................... 34
Conclusions ............................................................................................................... 35
References .................................................................................................................... 36

vi
TABLE OF CONTENTS - CONTINUED
3. GROWTH EFFECTS AND ASSIMILATION OF ORGANIC ACIDS IN
aaCHEMOSTAT AND BATCH CULTURES OF ACIDITHIOBACILLUS
CALDUS STRAIN BC13 ........................................................................................... 39
Abstract ...................................................................................................................... 39
Introduction ................................................................................................................ 40
Materials and Methods ................................................................................................ 41
Microorganism, Media, and Growth Conditions ........................................................ 41
Chemostat Culturing ................................................................................................. 42
Organic Acid Measurement ...................................................................................... 43
Dissolved Oxygen and Inorganic Carbon Measurement ............................................ 44
Dry-Cell Weight and Carbon Composition Measurements ........................................ 44
Batch Growth with Pyruvate as the Sole Carbon Source ........................................... 45
Growth Effects of Organic Acids in Batch Cultures ................................................... 45
16S rRNA Culture Analysis ....................................................................................... 46
Statistical Analysis .................................................................................................... 46
Results ......................................................................................................................... 47
Test for Heterotrophic Growth ................................................................................... 47
Test for Mixotrophic Growth ..................................................................................... 47
Batch Growth with Pyruvate as the Sole Carbon Source ............................................ 50
Toxicity of Organic Acids in Batch Cultures .............................................................. 50
Discussion ................................................................................................................... 53
Conclusions ............................................................................................................... 56
References ................................................................................................................... 57
4. LEAD, ZINC, AND COPPER TOXICITY TO ACIDITHIOBACILLUS
CALDUS STRAIN BC13 ............................................................................................ 60
Abstract ...................................................................................................................... 60
Introduction ................................................................................................................ 61
Materials and Methods ................................................................................................ 62
Microorganism, Media, and Growth Conditions ........................................................ 62
Determining Single Metal Toxicity ........................................................................... 63
Determining Combined Metal Toxicity ..................................................................... 63
Determining Effects of Previous Metal Exposure ...................................................... 64
Determining Metal Chloride Toxicity ....................................................................... 65
Modeling Metal Complexation and Precipitation ...................................................... 65
Results ......................................................................................................................... 66

vii
TABLE OF CONTENTS - CONTINUED
Single Metal Toxicity ................................................................................................ 66
Combined Metal Toxicity .......................................................................................... 67
Effects of Ferrous Iron on Metal Toxicity .................................................................. 69
Effect of Previous Exposure on Metal Toxicity .......................................................... 70
Comparison of Metal Chloride and Metal Sulfate Toxicity ........................................ 72
Metal Complexation and Precipitation ....................................................................... 74
Discussion ................................................................................................................... 75
Single Toxicity of Lead, Zinc, and Copper ................................................................. 75
Comparisons with Other Acidithiobacilli ................................................................... 76
Effects of Combined Metals ....................................................................................... 76
Effects of Inoculum History ....................................................................................... 77
Metal Chloride versus Metal Sulfate Toxicity ............................................................ 78
Conclusions ............................................................................................................... 79
References ................................................................................................................... 80
5. EFFECTS OF CELL CONDITION, PH, AND TEMPERATURE ON
LEAD, ZINC, AND COPPER SORPTION TO ACIDITHIOBACILLUS
CALDUS STRAIN BC13 ............................................................................................ 84
Abstract ...................................................................................................................... 84
Introduction ................................................................................................................ 85
Materials and Methods ................................................................................................ 86
Culture and Cell Preparation ..................................................................................... 86
Measurement of Aqueous Metal Concentrations ....................................................... 87
Calculation of Sorption Parameters ........................................................................... 88
Calculation of the Heat of Sorption ........................................................................... 89
Desorption Experiments ............................................................................................ 89
Mixed Metal Sorption ............................................................................................... 90
Modeling Metal Speciation ....................................................................................... 90
Statistical Analysis and Controls ............................................................................... 91
Results ........................................................................................................................ 91
Effect of pH on Lead, Zinc, and Copper Sorption...................................................... 91
Temperature Effects .................................................................................................. 96
Desorption Experiments ............................................................................................ 96
Mixed Metal Sorption ............................................................................................... 98
Discussion ................................................................................................................ 100
Sorption of Lead, Zinc, and Copper to BC13 .......................................................... 100
Temperature Effects ................................................................................................ 103
Mixed Metal Sorption ............................................................................................. 103
Comparisons to Previous Work with Acidithiobacilli .............................................. 104
viii
TABLE OF CONTENTS – CONTINUED
Conclusions ........................................................................................................... 105
References ............................................................................................................... 107
6. EFFECTS OF ORGANIC ACIDS AND METALS ON PROTEIN
EXPRESSION OF ACIDITHIOBACILLUS CALDUS STRAIN BC13 ..................... 110
Abstract .................................................................................................................... 110
Introduction .............................................................................................................. 111
Materials and Methods .............................................................................................. 112
Microorganism, Media, and Growth Conditions ...................................................... 112
MALDI Analysis ..................................................................................................... 113
Determining the Toxicity of Metals in Spent Medium ............................................. 114
One-Dimensional Gel Analysis ............................................................................... 114
Protein Identification ............................................................................................... 115
Two-Dimensional Gel Analysis ............................................................................... 115
Results ...................................................................................................................... 117
MALDI Analysis .................................................................................................... 117
Gel Analysis ........................................................................................................... 119
Discussion ................................................................................................................ 122
Conclusions ............................................................................................................ 124
References ................................................................................................................ 125
7. SUMMARY ............................................................................................................ 127
Conclusions ............................................................................................................. 127
Future Work ............................................................................................................ 129
References ............................................................................................................... 133
APPENDICES ............................................................................................................. 135
APPENDIX A: Ability of Acidithiobacillus Caldus Strain BC13 to
Grow Using Various Electron Donor/Acceptor Pairs ........................ 136
APPENDIX B: Precipitation of Covellite in the Growth Medium of
dddddddddddddd Acidithiobacillus Caldus Strain BC13 .............................................. 149
APPENDIX C: Components of Growth Medium Rates ............................................ 162
APPENDIX D: Calculating Specific Growth ............................................................ 164
APPENDIX E: Chapter 2 Raw Data ......................................................................... 168
APPENDIX F: Chapter 3 Raw Data ......................................................................... 226
APPENDIX G: Chapter 4 Raw Data ......................................................................... 309
ix
TABLE OF CONTENTS – CONTINUED
APPENDIX H: Chapter 5 Raw Data ......................................................................... 408
APPENDIX I: Chapter 6 Raw Data ......................................................................... 459
APPENDIX J: Protocols for Protein Separation and Analyses ................................. 467
APPENDIX K: 16S Sequence of the Strain Used in Experiments ............................. 475

x
LIST OF TABLES
Table Page
1. PLFA Analysis of BC13 Grown in the Presence of Organic Acids ...................... 30
2. Percent of Organic Acids Protonated at the Medium pH ...................................... 31
3. Percent of Pyruvate Consumed and Converted to Biomass by BC13 ................... 50
4. Toxicity of Lead, Zinc, and Copper to BC13 ....................................................... 67
5. The Heat of Sorption for Lead, Zinc, and Copper ................................................ 98
6. Percent of Lead, Zinc, or Copper that Desorbed from BC13 Cells
in a 5 mM Nitriloacetic Acid Wash at Equilibrium .............................................. 99
7. Effects of Organic Acids and Heavy Metals on Protein Expression by
BC13 ................................................................................................................ 117

xi
LIST OF FIGURES
Figure Page
1. Typical Effect of Various Organic Acid Concentrations on the
Growth of BC13 .................................................................................................. 24
2. Effect of Organic Acids on the Specific Growth Rate of BC13 ............................. 25
3. Acid Strength Plotted versus the Calculated IC50s ................................................ 26
4. Combined Toxicity of Organic Acids ................................................................... 27
5. Changes in Organic Acid Concentrations during Batch Cultures .......................... 28
6. Field Emission Scanning Electron Micrographs of BC13 Cells
Exposed to Organic Acids .................................................................................... 30
7. Growth of BC13 in a Chemostat Culture under Mixotrophic Conditions .............. 48
8. Oxygen Consumption by BC13 in a Chemostat Reactor under
Mixotrophic Conditions ....................................................................................... 49
9. BC13 Growth Using Pyruvate as the Sole Carbon Source .................................... 51
10. Effect of Previous Exposure on the Specific Growth Rate of BC13 ..................... 52
11. Single Toxicity of Lead, Zinc, and Copper to BC13 ............................................ 66
12. Combined Toxicity of Lead, Zinc, and Copper to BC13 ...................................... 68
13. Effect of Ferrous Iron on the Toxicity of Lead, Zinc, and Copper to BC13 .......... 69
14. Effect of Previous Exposure on Metal Toxicity to BC13 ..................................... 71
15. Growth of BC13 Cells Following Exposure to Minimal Inhibitory
Concentrations of Lead, Zinc, and Copper........................................................... 72
16. Comparison of Metal Sulfate and Metal Chloride Toxicity toBC13 ..................... 73
17. Additive Effects of Metal and Chloride Toxicities ............................................... 74
xii
LIST OF FIGURES - CONTINUED
Figure Page
18. Lead, Zinc, and Copper Sorption to BC13 .......................................................... 92
19. Lineweaver-Burk Plot used to Calculate Sorption Parameters ............................ 92
20. Effect of pH on Lead, Zinc, and Copper Sorption to BC13 ................................. 93
21. Relationship Between pH, Metal Complexation, and Sorption............................ 94
22. Relationship Between pH and Metal Complexation ............................................ 95
23. Effect of Temperature on Lead, Zinc, and Copper Sorption to BC13 .................. 97
24. Mixed Metal Sorption to BC13 ........................................................................ 100
25. Toxicity of Spent Metal Media ......................................................................... 118
26. One-Dimensional Gel of Peripheral Membrane Proteins from
Pyruvate Treated Cells ..................................................................................... 119
27. One-Dimensional Gel of Integral Membrane Proteins from
Pyruvate, Lead, Zinc, or Copper Treated Cells ................................................. 120
28. Two-Dimensional Gel of Soluble Proteins from BC13 ..................................... 121

xiii
ABSTRACT
Acidithiobacillus caldus is an important microorganism to biomining and acid-
mine formation. However, its degree of characterization is not commensurate to its
significance in such systems. Specifically, studies enumerating effects of organic acids
and metals on this microorganism are limited. The work presented in this dissertation
improves understanding of At. caldus with respect to interactions with these compounds.
All experiments discussed in this dissertation used At. caldus strain BC13.
The organic acids; pyruvate, acetate, 2-ketoglutarate, succinate, fumarate,
malate, and oxaloacetate were each toxic to At. caldus strain BC13. Depending on the
organic acid tested, concentrations between 250 and 5,000 M completely inhibited the
growth of At. caldus strain BC13 (chapter two). Subsequent experiments, reported in
chapter three, showed that At. caldus strain BC13 used pyruvate as a sole carbon source.
Chapter four discusses the toxicities of the heavy metals; lead, zinc, and copper to At.
caldus strain BC13. Lead was by far the most toxic metal tested, with an observed
minimum inhibitory concentration of 7.5 mM. Conversely, zinc and copper had
minimum inhibitory concentrations of 75 and 250 mM, respectively. The sorption of
lead, zinc, and copper was also studied, and is discussed in chapter 5. Between pH 5.5
and 7.0, zinc and copper sorbed to At. caldus strain BC13 with similar capacity and
affinity as that observed to other acidithiobacilli, however at pH 2.0, significant sorption
of zinc and copper to viable cells was observed, whereas previous work did not report
sorption of zinc or copper to viable acidithiobacilli cells below pH 3.0. Chapter six
reports efforts to qualify changes in protein expression of At. caldus strain BC13 when
exposed to organic acids or heavy metals. Matrix assisted laser desorption ionization
mass spectrometry and one-dimensional gel electrophoresis qualified the up-regulation of
an integral membrane protein with a molecular weight of approximately 25 kDa. Efforts
to identify up-regulated proteins were not successful, but any proteins that are regulated
in response to organic acids or heavy metals in biomining microorganisms would likely
be of commercial application.

1
CHAPTER ONE
INTRODUCTION
Outline
The goal of this dissertation is to further characterize the interactions of organic
acids and metals with the biomining bacterium, Acidithiobacillus caldus. This work
constitutes an important contribution towards understanding this microorganism and its
role in microbial communities.
Previous work has suggested that At. caldus is important in acid-mine systems,
however it is not as well understood as similar microorganisms, even though At. caldus
may represent a dominant metabolic guild in certain systems. To that end, the
experiments reported in this dissertation, using At. caldus strain BC13, help to fill gaps in
understanding this bacterium, and lay the groundwork for future research with At. caldus
(from this point on “BC13” will refer specifically to At. caldus strain BC13). Chapters
two through five summarize journal articles that were submitted for publication. Chapter
two discusses the effects of the organic acids pyruvate, acetate, 2-ketoglutarate,
succinate, fumarate, malate, and oxaloacetate on the growth of BC13 under batch
conditions. Chapter three investigates the ability of BC13 to assimilate these organic
acids under both heterotrophic and mixotrophic conditions in a chemostat. In addition,
the ability of this bacterium to use pyruvate as a sole carbon source under batch
conditions was investigated. Also, the ability of BC13 to adapt to organic acids through
subsequent culturing is discussed. Chapter four reports the effects of lead, zinc, and

2
copper on BC13 growth, including single and combined toxicity studies, as well as a
report on the effects of ferrous iron on metal toxicity to BC13. As in chapter three, the
effects of subsequent culturing are discussed. Chapter five reports the ability of At.
caldus to sorb lead, zinc, and copper, examining the effects of cell condition, pH, and
temperature. Chapter six builds on the observations made in chapters two through five,
and discusses the effect of both organic acids and heavy metals on the expression of
proteins by BC13. Because this bacterium has commercial applications, as discussed
below, any proteins that can be up-regulated to improve its metabolic activity are of
special significance. Finally, the findings and significance of chapters two through six
are summarized in chapter seven.
Additional experiments that were not central to the topic of this dissertation are
included in the Appendices. Appendix A discusses attempts to culture BC13
anaerobically; and Appendix B discusses the potential biogenically catalyzed
precipitation of covellite in the presence of BC13. Each chapter contains an introduction,
materials and methods, results, and discussion section relevant to the work discussed.
However, to provide better context for the work in this dissertation, the remainder of this
chapter introduces topics relevant to At. caldus, including a description of the
acidithiobacilli genus, natural occurrence, a description of industrial and environmental
processes relevant to At. caldus, and a description of previous studies on At. caldus.

3
Acidithiobacilli
Classification
The genus acidithiobacilli falls under the γ-proteobacteria class and currently
contains four named species: Acidithiobacillus albertensis [1], Acidithiobacillus caldus
[2], Acidithiobacillus ferrooxidans [3], and Acidithiobacillus thiooxidans [4]. In addition,
a fifth species has been proposed, Acidithiobacillus cuprithermicus, although its 16S
phylogeny is very similar to At. caldus [5]. The genus was formed when the former
Thiobacillus genus was split into the genera Acidithiobacillus, Alothiobacillus and
Thermithiobacillus, based on 16S rRNA gene sequencing [6]. The members of the genus
are acidophilic, motile, gram-negative rods. At. albertensis, At. ferrooxidans, and At.
thiooxidans are mesophilic microorganisms, however At. caldus and At. cuprithermicus
are slightly thermophilic, growing best between 40 and 50°C [2,5]. All of the
acidithiobacilli are chemolithotrophic autotrophs that can fix carbon dioxide as a carbon
source, and use inorganic compounds as electron donors. Each is capable of oxidizing
reduced sulfur compounds [1-5], and in addition, At. ferrooxidans can oxidize ferrous
iron [3]. At. ferrooxidans and At. thiooxidans are by far the most studied and best
characterized of the acidithiobacilli, particularly At. ferrooxidans, which is represented by
a number of well characterized strains [7-10]. There is very little work characterizing At.
albertensis and the potentially new species, At. cuprithermicus. The subject of this
dissertation is At. caldus, which was first characterized by Hallberg and Lindstrom in
1994 [2]. There have been several strains identified, including the type strain, KU, and
others [11-15], and although there are serotype variations within these strains [16], there
4
have not been significant differences identified in the physiology and metabolism from
strain to strain.
Natural Habitat
The ability of acidithiobacilli to use various reduced inorganic sulfur compounds
or ferrous iron as an electron donor, coupled to their acidophilic properties, make them
important organisms in metal sulfide deposits world-wide, associated waste waters, and
locally acidic marine environments [17-19]. Only At. ferrooxidans has been observed to
use a terminal electron acceptor other than oxygen, as it is capable of reducing elemental
sulfur and ferric iron [3]. This may relegate At. thiooxidans, At. caldus, At. albertensis,
and At. cuprithermicus to aerobic environments, and may limit their activity in sub-
surface and deep-ore systems.
The ability of this genus to fix carbon dioxide as a sole carbon source allows them
to thrive in environments where organic carbon is limited. In fact, the presence of low-
molecular weight organic acids has been observed to decrease the catabolic behavior of
chemolithotrophic autotrophs in biomining environments [20-24], and a review by Matin
documents the toxicity of these compounds to the acidithiobacilli [25]. However, At.
ferrooxidans and At. caldus are capable of mixotrophic growth, providing them with a
mechanism to degrade organic carbon [2,26]. This is especially significant as
heterotrophic and mixotrophic activity has been reported to increase mineral leaching
kinetics in biomining applications [27-31].
5
Mineral Sulfide Oxidation
Acidithiobacilli are believed to facilitate metal solubilization from mineral
sulfides by contributing to mineral oxidation [32-34], for which a direct and an indirect
mechanism have been proposed [35,36]. The indirect mechanism suggests that the
mineral is oxidized by ferric iron or protons. Subsequently, the ferric iron is reduced to
ferrous iron, and the proton is reduced to water or molecular hydrogen. Iron oxidizers,
such as At. ferrooxidans catalyze oxidation of the mineral surface by replenishing ferric
iron; and sulfur oxidizers, such as At. caldus catalyze the production of protons by
producing sulfuric acid during the oxidation of reduced sulfur compounds [34]. In
addition, it has been hypothesized that sulfur oxidizers play an important secondary role
by oxidizing solid-sulfur layers from the mineral surface by oxidizing them to soluble
sulfur compounds, such as tetrathionate and sulfate [34], making the mineral surface
available for ferric iron or proton attack.
Interestingly, Sand et al. [36] and Schippers and Sand [37] proposed a model
suggesting that two types of sulfides require two different indirect leaching mechanisms.
This model proposes that sulfides with valence bands derived from metal electron orbitals
can be oxidized by ferric iron. Examples of such sulfides include molybdenum disulfide,
pyrite, and tungstenite. However, sulfides with valence bands derived from metal and
sulfur electron orbitals could be oxidized by either ferric iron or proton attack. Covellite,
chalcocite, and sphalerite are examples of this type of mineral.
The direct mechanism suggests that microorganisms would oxidize minerals
during direct contact, with either secreted enzymes or membrane bound electron carriers.

6
Applications
The primary interest in acidithiobacilli in industrial and environmental
applications relates to their ability to facilitate the solubilization of metals from mineral
sulfides, and their ability to produce sulfuric acid. Because of this, acidithiobacilli
activity is beneficial to the extraction of valuable metals from sulfide minerals [27-31].
However, this same process contributes to acid-mine formation, which is environmentally
detrimental [i.e. 38-43]. In addition, At. ferrooxidans and At. thiooxidans are reported to
increase the rate of concrete corrosion fifteen-fold, via the formation of sulfuric acid
[44,45]. However, their production of sulfuric acid has at least one medical application.
A study using At. thiooxidans, showed that these microorganisms may be able to dissolve
urinary stones in vivo [46].
Acid-Mine Drainage
The oxidation of reduced sulfur compounds leads to the acidification of surface
and ground waters, where pH values as low as -3.6 have been observed [38]. This
acidification also results in the solubilization of several environmentally harmful metals,
including iron, copper, zinc, lead, chromium, and arsenic [38]. Although solubilization
may occur abiotically, the presence of sulfur- and iron-oxidizing acidophiles has been
observed to increase the rate of acidification over 1,000,000-fold [33].
In general, acid-mine drainage is hazardous to living organisms, as it concentrates
heavy metals in an acidic solution. Following exposure to acid-mine effects, species

7
diversity and abundance in marine and fresh waters decreased and remain lower for
several years after remediation [47,48].
Biomining
As described earlier, the oxidation of ferrous iron and reduced sulfur compounds
contributes to the leaching of metals in sulfide ores. This process is known as biomining,
and although the exact percentage of metals harvested in this manner is unknown, it is
believed to contribute significantly to the solubiliztion of economically important metals
such as iron, zinc, copper, and gold [49]. This process occurs at many different scales,
from incidental (dump-leaching) to highly designed (reactor-leaching) [34]. Typically,
dump-leaching is applied to large ore heaps, with undefined and highly variable spatial
and temporal properties (i.e. temperature, nutrient availability, and pH) [34]. These
systems typically contain diverse biotic activity of a complexity too difficult to
characterize completely. However, it may be possible to use dominant microorganisms
of specific functional guilds to approximate metabolisms important to the system [50].
Efforts to optimize microbial activity in these systems are often limited to general
aeration and nutrient inoculation [34]. Conversely, precious metals, such as gold, may be
leached in specifically designed reactors using more controlled processes designed to
maximize the efficiency of a relatively small, defined microbial community [34].

8
Acidithiobacillus Caldus
Importance of Acidithiobacillus Caldus in Acid-Mine Drainage and Biomining
The harsh conditions found in acid-mine environments limit the diversity of
microorganisms that are found in these environments [34]. Studies have enumerated the
importance of two genera in particular; the leptospirulii and the acidithiobacilli. Within
the acidithiobacilli, At. caldus, At. albertensis, and At. curprithermicus are the least
characterized. However; previous work has suggested that At. caldus may significantly
improve mineral leaching rates when added to microbial cultures already containing iron-
and sulfur-oxidizers [27-31]. The incomplete understanding, and potential significance,
of this bacterium make it an ideal candidate for further research. In addition, the ability
of At. caldus to grow at warm temperatures (up to 50°C) make it even more important, as
it is a dominant sulfur-oxidizer in many high-temperature ore heaps and reactors [34].
Previous Work
At. caldus was isolated and characterized by Hallberg and Lindstrom in 1994 [2].
The initial characterization, using strain KU, identified At. caldus as a chemolithotrophic
autotroph capable of oxidizing reduced-sulfur compounds and growing mixotrophically
on sulfur or tetrathionate and yeast extract or glucose under aerobic conditions [2]. At.
caldus was also characterized as a moderately thermophilic acidophile growing at
temperatures between 32-50°C (45°C optimum) and from pH 1-4 (2.5 optimum) [2].
Since its initial characterization, At. caldus has been isolated from a variety of locations,
from natural geothermal springs to bioleaching process systems in Africa [51-54].

9
Studies of At. caldus suggest that it contributes significantly to the biomining of
metal sulfides. Its role in arsenopyrite bioleaching was investigated by Dopson and
Lindstrom [27], who proposed that At. caldus plays three beneficial roles in the process:
1) removal of inhibitory sulfur layers from the mineral surface, 2) facilitation of
heterotrophic and /or mixotrophic growth within the microbial community through the
release of organic metabolites, and 3) solubilization of solid sulfur via the production of
surface wetting agents. Edwards [28] and McGuire [30] observed that At. caldus
decreased inhibitory sulfur layers on sulfide minerals by over 99%, and increased
leaching of arsenopyrite ten-fold when compared to experiments carried out without At.
caldus. Dopson et al. [55] observed resistance to arsenate, arsenite, and antimony via an
inducible, chromosomally encoded resistance mechanism that induced active transport of
arsenate and arsenite across the cell membrane against a concentration gradient.
Recently, the genome of At. caldus was annotated with a focus on metabolism
related genes [56]. Genes consistent with the Calvin-Benson carbon dioxide fixation
pathway, an incomplete tricarboxylic acid cycle (lacking 2-ketoglutarate dehydrogenase),
hydrogen oxidation, sulfur oxidation (SOX pathway), and iron uptake were identified.
Sulfur reduction, ferrous iron oxidation, and nitrogen fixation genes were not identified.
Scope of Present Study
Organic compounds and metals have significant effects on biotic activity in acid-
mine environments [20-24,57-60]. Therefore it is surprising that studies examining the
interactions of At. caldus and organic acids have not been reported, in addition,
interactions between At. caldus and metals have been largely limited to the metalloid

10
arsenic [55]. The goal of this dissertation is to elucidate these interactions to increase
understanding of the role and potential of At. caldus in biomining and remediation
applications.
11
References
1. Bryant, RD, McGroarty KM, Costerton JW, Laishley EJ (1983) Isolation and
characterization of a new acidophilic Thiobacillus acidophile (T. albertis). Can J
Microbiol 29:1159-1170.
2. Hallberg KB, Lindstrom EB (1994) Characterization of Thiobacillus caldus sp.
Nov., a moderately thermophilic acidophile. Microbiology 140:3451-3456.
3. Temple KL, Colmer AR (1951) The autotrophic oxidation of iron by an new
bacterium, Thiobacillus ferrooxidans. J Bacteriol 62:605-611.
4. Waksman SA, Joffe JS (1922) Microorganisms concerned in the oxidation of
sulfur in the soil II. Thiobacillus thiooxidans, a new sulfuroxidizing organism
isolated from the soil. J Bacteriol 7:239-256.
5. Ann Louw L (2009) Analysis of an 18kb accessory region of plasmid pTcM1
from Acidithiobacillus caldus MNG. Stellenbosch Univ.
6. Kelly DP, Wood AP (2000) Reclassification of some species of Thiobacillus to
the newly designated genera Acidithiobacillus gen. nov., Halothiobacillus, gen.
nov. and Thermithiobacillus gen. nov. International Journal of Systematic
Evolution and Microbiology 50:511-516.
7. Iwahori K, Kammura K, Sugio T (1998) Isolation and some properties of
cytochrome c oxidase purified from a bisulfite ion resistant Thiobacillus
ferrooxidans. Biosci, Biotechnol, and Biochem 62:1081-1086.
8. Sugio T, Fujioka A, Tsuchiya M, Shibusawa N, Iwahori K, Kamimura K (1998)
Isolation and some properties of a strain of the iron-oxidizing bacterium
Thiobacillus ferrooxidans resistant to 2,4-dinitrophenol. J Ferm Bioeng
9. Sugio T, Kougami T, Tano T, Imai K (1982) Glutathione transport system in
Thiobacillus ferrooxidans strain AP-44. Agricul Biolog Chem 46:2919-2924.
10. Bengrine A, Guiliani N, Appia Ayme C, Jedlicki E, Holmes DS, Chippaux M,
Bonnefoy V (1998) Sequence and expression of the rusticyanin structural gene
from Thiobacillus ferrooxidans ATCC33020 strain. Biochem Biophys Acta
1443:99-112.
11. Groot P, Deane SM, Rawlings DE (2003) A transposon-located arsenic resistance
mechanism from a strain of Acidithiobacillus caldus isolated from commercial,
arsenopyrite biooxidation tanks. Hydrometallurgy 71:115-123.

12
12. Kamimura K, Sawada R, Sugio T (2002) Mechanism of oxidation of reduced
sulfur compounds by sulfur-grown Acidithiobacillus caldus strain GO-1.
Okayama Univ 91:23-29.
13. Nan DJ, Lin ZR, Jian K, Gui ZC, Ling WX, Zhou QG (2008) Identification and
cadmium (II) resistance of strain YN12, Acidithiobacillus caldus. Chinese J
Nonferrous Met 18:342-348.
14. Tuffin M, Groot P, Deane SM, Rawlings DE (2004) Multiple sets of arsenic
resistance genes are present within the highly arsenic-resistant industrial strains of
the biomining bacterium, Acidithiobacillus caldus. Comp Physiol Biochem
1275:165-172.
15. Van Zyl LJ, Deane SM, Louw LA, Rawlings DE (2008) Presence of a family of
plasmids (29 to 65 kilobases) with a 26-kilobase common region in different
strains of the sulfur-oxidizing bacterium Acidithiobacillus caldus. Appl Enviorn
Microbiol 74:4300-4308.
16. Hallberg KB, Lindstrom EB (1996) Multiple serotypes of the moderate
thermophile Thiobacillus caldus, a limitation of immunological assays for
biomining microorganisms. Appl Environ Microbiol 62:4243-4246.
17. Karavaiko GI, Turova TP, Kondrat‟eva TF, Lysenko AM, Kolganova TV,
Ageeva SN, Muntyan LN, Pivovarova TA (2003) Phylogenetic heterogeneity of
the species Acidithiobacillus ferrooxidans. Int J Syst Evol Microbiol 53:113-119.
18. Gonzalez-Toril E, Llobet-Brossa E, Casamayor EO, Amann R, Amils R (2003)
Microbial ecology of an extreme acidic environment, the Tinto River. Appl
Environ Microbiol 69:4853-4865.
19. Kamimura K, Higashino E, Moriya S, Sugio T (2003) Marine acidophilic sulfur-
oxidizing bacterium requiring salts for the oxidation of reduced inorganic sulfur
compounds. Extremophiles 7:95-99.
20. Burckhard SR, Schwab AP, Banks MK (1995) The effects of organic acids on the
leaching of heavy metals from mine tailings. J Hazard Mat 41:135-145.
21. Marchland EA, Silverstein J (2003) The role of enhanced heterotrophic bacterial
growth on iron oxidation by Acidithiobacillus ferrooxidans. Geomicrobiol J
20:231–244.
22. Olson GJ, Brierley JA, Brierley CL (2003) Bioleaching review. Part B: Progress
in bioleaching: Applications of microbial processes by the mineral industries.
Appl Microbiol Biotechnol 63:249–257.

13
23. Gu XY, Wong JWC (2004) Identification of inhibitory substances affecting
bioleaching of heavy metals from anaerobically digested sewage sludge. Eniviron
Sci Technol 38:2934-2939.
24. Gu XY, Wong JWC (2007) Degradation of inhibitory substances by heterotrophic
microorganisms during bioleaching of heavy metals from anaerobically digested
sewage sludge. Chemosphere 69:311–318.
25. Matin A (1978) Organic nutrition of chemolithotrophic bacteria. Annu Rev
Microbiol 32:433-468.
26. Pronk JT, Mejer WM, Hazeu W, van Dijken JP, Bos P, Kuenen JG (1991)
Growth of Thiobacillus thiooxidans on formic acid. Appl Environ Microbiol
57:2057-2062.
27. Dopson M, Lindstrom EB (1999) Potential role of Thiobacillus caldus in
arsenopyrite bioleaching. Appl Environ Microbiol 65:36-40.
28. Edwards KJ, Bond PL, Banfield JF (2000) Characteristics of attachment and
growth of Thiobacillus caldus on sulphide minerals: a chemotactic response to
sulphur minerals? Environ Microbiol 2:324-332.
29. Fu B, Zhou H, Zhang R, Qiu G (2008) Bioleaching of chalcopyrite by pure and
mixed cultures of Acidithiobacillus spp. and Leptospirillum ferriphilum. Int J
Biodeteriat and Biodegrad 62:109-115.
30. McGuire MM, Edwards KJ, Banfield JF, Hamers RJ (2001) Kinetics, surface
chemistry, and structural evolution of microbially mediated sulfide mineral
dissolution. Geochem Cosmochim Acta 65:1243-1258.
31. Zhou QG, Bo F, Bo ZH, Xi L, Jian G, Fei LF, Hau CH (2007) Isolation of a strain
of Acidithiobacillus caldus and its role in bioleaching of chalcopyrite. World J
Microbiol Biotechnol 23:1217-1225.
32. Colmer AR, Hinkle ME (1947) The role of microorganisms in acid mine
drainage: A preliminary report. Science 106:253-256.
33. Singer PC, Stumm W (1970) Acidic mine drainage: The rate-determining step.
Science 167:1121-1123.
34. Rawlings DE. (2002) Heavy metal mining using microbes. Annu Rev Microbiol
56:65-91.
14
35. Silverman MP, Ehrlich HL (1964) Microbial formation and degradation of
minerals. Advan Appl Microbiol 6:153-206.
36. Sand W, Gehrke T, Jozsa PG, Schippers A (2001) (Bio) chemistry of bacterial
leaching – direct vs. indirect bioleaching. Hydrometallurgy 59:159-175.
37. Schippers A, Sand W (1999) Bacterial leaching of metal sulfides proceeds by two
indirect mechanisms via thiosulfate or via polysulfides and sulfur. Appl Environ
Microbiol 65:319-321.
38. Nordstrom DK, Alpers CN, Ptacek CJ, Blowes DW (2000) Negative pH and
extremely acidic mine waters from Iron Mountain, California. Environ Sci
Technol 34:254-258.
39. Canovas CR, Olias M, Nieto JM, Sarmiento AM, Ceron JC (2007)
Hydrogeochemical characteristics of the Tinto and Odiel Rivers (SW Spain).
Factors controlling metal contents. Sci Total Environ 373:363-382.
40. Lefebvre R, Hockley D, Smolensky J, Gelinas P (2001) Multiphase transfer
processes in waste rock piles producing acid mine drainage 1: Conceptual model
and system characterization. J Contam Hydrol 52:137-164.
41. Lefebvre R, Hockley D, Smolensky J, Lamontagne A (2001) Multiphase transfer
processes in waste rock piles producing acid mine drainage 2: Applications of
numerical stimulations. J Contam Hydrol 52:165-186.
42. Olias M, Nieto JM, Sarmiento AM, Ceron JC, Canovas CR (2004) Seasonal water
quality variations in a river affected by acid mine drainage: the Odiel River
(South West Spain). Sci Total Environ 333:267-281.
43. Vigneault B, Campbell PG, Tessier A, De Vitre R (2001) Geochemical changes in
sulfidic mine tailings stored under a shallow water cover. Water Res 35:1066-
1076.
44. Maeda T, Negishi A, Komoto H, Oshima Y, Kamimura K, Sugio T (1999)
Isolation of iron-oxidizing bacteria from corroded concretes of sewage treatment
plants. J Biosci Bioeng 88:300-305.
45. Sand W (1987) Importance of hydrogen sulfide, thiosulfate, and methylmercaptan
for growth of thiobacilli during simulation of concrete corrosion. Appl Environ
Microbiol 53:1645-1648.
46. Nishio S, Aoki K, Yokoyama M (2003) A new method using a bacterium for
dissolution of urinary stones. Aktuelle Urol 34:253-255.
15
47. Demchak J, Skousen J, McDonald LM (2004) Longevity of acid discharges from
underground mines located above the regional water table. J Environ Qual
33:656-668.
48. Younger PL (1997) The longevity of minewater pollution: a basis for decision-
making. Sci Total Environ 194:457-466.
49. Rawlings DE, Johnson DB (2007) The microbiology of biomining: development
and optimization of mineral-oxidizing consortia. Microbiology 153:315-324.
50. Taffs R, Aston JE, Brileya K, Jay Z, Klatt CG, McGlynn S, Mallette N, Montross
S, Gerlach R, Inskeep WP, Ward DM, Carson RP (2009) In silico approaches to
study mass and energy flows in microbial consortia: a syntrophic case study.
BMC Syst Biol 3: 10.1186/1752-0509-3-114.
51. Burton NP, Norris PR (2000) Microbiology of acidic, geothermal springs of
Montserrat: environmental rDNA analysis. Extremophiles 4:315-320.
52. Okibe N, Gericke M, Hallberg KB, Johnson DB (2003) Enumeration and
characterization of acidophilic microorganisms isolated from a pilot plant-stirred
tank bioleaching operation. Appl Environ Microbiol 69:1936-1943.
53. Simmons S, Norris PR (2002) Acidophiles of saline water at thermal vents of
Vulcano, Italy. Extremophiles 6:201-207.
54. Kinnunen PHM, Puhakka JA (2004) Characterization of iron- and sulphide
mineral-oxidizing moderately thermophilic acidophilic bacteria from an
Indonesian auto-heating copper mine waste heap and a deep South African gold
mine. J Ind Microbiol Biotechnol 31:409-414.
55. Dopson M, Lindstrom EB, Hallberg KB (2001) Chromosomally encoded
arsenical resistance of the moderately thermophilic acidophile Acidithiobacillus
caldus. Extremophiles 5:247-255.
56. Valdes J, Quatrini R, Hallberg K, Dopson M, Valenzuela PDT, Holmes DS
(2009) Draft genome sequence of the extremely acidophilic bacterium
Acidithiobacillus caldus ATCC 51756 reveals metabolic versatility in the genus
Acidithiobacillus. J Bact 191:5877-5878.
57. Dopson M, Baker-Austin C, Koppineedi PR, Bond PL (2003) Growth in sulfidic
mineral environments: metal resistance mechanisms in acidophilic micro-
organisms. Microbiology 149:1959-1970.
16
58. Soon AO, Chye ES, Poh, EL (2007) Influence of heavy metal on activated sludge
activity: DO and SOUR monitoring. J Eng Res Edu 4:20-24.
59. Sampson MI, Phillips CV (2001) Influence of base metals on the oxidizing ability
of acidophilic bacteria during the oxidation of ferrous sulfate and mineral sulfide
concentrates, using mesophiles and moderate thermophiles. Min Eng 14:317-340.
60. Nurmi P, Ozkaya B, Kaksonen AH, Tuovinen OH, Puhakka JA (2009) Inhibition
kinetics of iron oxidation by Leptospirillum ferriphilum in the presence of ferric,
nickel, and zinc ions. Hydrometallurgy 97:137-145.

17
CHAPTER TWO
TOXICITY OF SELECT ORGANIC ACIDS TO THE SLIGHTLY THERMOPHILIC
ACIDOPHILE, ACIDITHIOBACILLUS CALDUS STRAIN BC13
Abstract
At. caldus is a thermophilic acidophile relevant to commercial biomining and
acid-mine drainage. Previous work characterized At. caldus as a chemolithotrophic
autotroph capable of oxidizing reduced sulfur compounds under aerobic conditions. This
chapter reports the toxic effects of pyruvate, acetate, 2-ketoglutarate, succinate, fumarate,
malate, and oxaloacetate to BC13 under batch conditions. All organic acids tested
exhibited some toxic effect. Oxaloacetate was observed to completely inhibit growth at a
concentration of 250 M, whereas other organic acids were completely inhibitory at
concentrations between 1,000 M and 5,000 M. In these experiments, the measured
concentrations of organic acids decreased with time, indicating uptake, transformation, or
assimilation by the cells. Phospholipid fatty acid analyses indicated an effect of organic
acids on the cellular envelope. Notable differences included an increase in trans fatty
acids in the presence of organic acids, indicating possible instability of the cellular
envelope. This was supported by field emission scanning electron micrographs that
showed sloughing in cells grown in the presence of organic acids.
Introduction
At. caldus is a thermophilic acidophile originally characterized as

18
Thiobacillus caldus [1], and later reclassified as an acidithiobacilli [2]. Compared to the
more commonly studied At. thiooxidans [3] and At. ferrooxidans [4], relatively little is
known about At. caldus. As with all acidithiobacilli, At. caldus thrives at low pH
(optimum 2.0 - 3.0), however, unlike other acidithiobacilli, At. caldus grows well at
moderately high temperatures with optimum growth at 45°C [1]. At. caldus is a
chemolithotrophic autotroph capable of oxidizing sulfur and reduced sulfur compounds
[1,5,6]. However, At. caldus strain KU can grow mixotrophically with sulfur or
tetrathionate and either glucose or yeast extract [1].
The conditions at which At. caldus thrives, coupled with its ability to oxidize
reduced sulfur compounds make it prevalent in acid mine systems [7,8], where it is
believed to contribute to metal solubilization. Dopson and Lindstrom [9] proposed that
At. caldus assists metal leaching by oxidizing sulfur layers from the mineral surface.
They also suggested At. caldus releases metabolites that facilitate heterotrophic and
mixotrophic growth of other community members [9]. In addition, Edwards et al. [10]
and McGuire et al. [11] showed Sulfobacillus thermosulfidooxidans co-cultured with At.
caldus removed more sulfur from sulfide mineral surfaces than when grown alone.
The toxicity of small organic acids to microorganisms is well documented. These
effects are enhanced at low pH where the acids are highly protonated. In this neutral
state, organic acids diffuse into the cytoplasm, where they dissociate and acidify the near-
neutral cytoplasm [12], reducing the proton motive force. A loss of integrity in the
cellular envelope of acidophilic chemolithotrophs has also been observed in the presence
of organic acids [7,13].
19
The research presented here demonstrates the effect of several relevant organic
acids on BC13. The organic acids used in the present study were: pyruvate, acetate, 2-
ketoglutarate, succinate, fumarate, malate, and oxaloacetate. These organic acids were
chosen because of their presence in spent At. ferrooxidans medium, and their toxicity to
these microorganisms at low concentrations (< 50 M) [14-16].
Materials and Methods
Microorganism, Media, and Growth Conditions
BC13 (ATCC 51757) was grown in the basal salts medium used by Hallberg and
Lindstrom [1]. Nanopure water (17.4 M ) was added to volume and the medium was
autoclaved for 15 min at 121°C and 22 psig. After the medium cooled to room
temperature, 1 ml L-1
of a filter sterilized (0.2 m) trace element solution [1] was added
to the medium. The pH was adjusted to 2.5 using 6N sulfuric acid. Filter sterilized (0.2
m) potassium tetrathionate was added to a final concentration of 5 mM to provide an
electron donor, and ambient carbon dioxide provided a carbon source. Cells preserved at
4°C in nanopure water (17.4 M with the pH adjusted to 3.0 using 6N sulfuric acid,
provided the initial inoculum. An organic acid stock solution in growth medium was
prepared daily and filter sterilized (0.2 m) into the medium to give the desired final
organic acid concentration.
Cells were grown in 250-ml Erlenmeyer flasks (100 ml medium volume) fitted
with foam stoppers and shaken at 150 rotations per minute (rpm) in a temperature
controlled incubator at 45°C. To better replicate in situ conditions where microbial
20
metabolism may expose cells to organic acids continuously; cells were pre-conditioned to
organic acids through two transfers (transferred during late exponential growth). After
the second transfer, cell concentration measurements were used to calculate specific
growth rates. In experiments where organic acid concentrations completely inhibited
growth, inoculum was supplied from cells cultured through two transfers at the highest
organic acid concentration tested that still allowed for growth.
Determination of Organic Acid Toxicity
Cell concentrations were determined via direct cell counts using a Petroff-Hauser
counting chamber and a transmitted-light microscope (Zeiss, Thornwood, NY, U.S.A.).
Cell- and substrate-free experiments were used as controls. Experiments were stopped
after several consecutive measurements indicated exponential cell growth had ceased.
All experiments were carried out in triplicate and average cell concentrations, specific
growth rates and 95% confidence intervals were calculated. Linear regressions between
the organic acid concentrations that bracketed a concentration that reduced the observed
specific growth rates by 50% were used to calculate the half-maximal inhibitory
concentrations (IC50s).
In addition to quantifying the toxicity of individual organic acids, it was
hypothesized that combinations of organic acids may exhibit an additive effect. In
separate experiments, organic acids were mixed to determine if an additive toxic effect
would be observed. Concentrations were mixed to give an “effective concentration,” Ce,
defined as
Ce = ∑i CI (2.1)
21
where CI represents the concentration of the ith organic acid in the mixture and
CI = IC50i / n (2.2)
Where IC50i represents the IC50 of the ith
organic acid in the experiment and n represents
the total number of organic acids added to the mixture. These equations are adapted from
similar work focusing on metal toxicity [17]. Concentrations of 0.25, 0.5, 1.0, 1.5, 2.0,
and 10.0 times the Ce were tested. In this manner, experiments were carried out with a
mixture of all seven organic acids, as well as the pairs: oxaloacetate/2-ketoglutarate and
succinate/malate. The observed specific growth rates were compared with a predicted
specific growth rate, p, the specific growth rate that would be observed assuming
additive toxicity (Equation 2.1) of the individual organic acids.
Organic Acid Analysis
Samples for organic acid quantification were filtered (0.2 m) and
measured using ion chromatography (Dionex DX-500, Sunnyvale, CA, U.S.A.) at 254
nm on a Dionex AS-11 column. Potassium tetraborate (PT) eluent was used in a gradient
from 0.35 mM (100% 40%) to 100 mM (0% 60%) over 20 minutes. Standards
were used to calibrate all measurements.
PLFA Analysis
Cells were grown in the presence of each of the organic acids for phospholipid
fatty acid (PLFA) analysis. The initial organic acid concentrations were set to the
previously calculated IC50 values. Culture samples were collected during late-
exponential growth after the second transfer, and 100 ml were sent overnight on ice to

22
Microbial Insights (Rockford, TN, U.S.A.). Cells were pre-conditioned so that PLFA
analysis would reflect adaptations as well as physiological effects of organic acid
exposure. Lipids were recovered using a modified Bligh and Dyer method [18].
Extractions were performed using a single-phase chloroform-methanol-buffer extractant.
Lipids were recovered in chloroform, then fractionated on disposable silicic acid columns
into neutral-, glycol-, and polar-lipid fractions. The polar lipid fraction was trans-
esterified under alkaline conditions to recover the PLFA as methyl esters in hexane. The
PLFA were then analyzed by gas chromatography with peak confirmation performed by
electron impact mass spectrometry.
Cell Imaging
Cells that had been exposed to various concentrations of organic acids were
imaged using field emission scanning electron microscopy (FESEM) (Supra 55VP Zeiss,
Peabody, MA, U.S.A.). To observe structural effects of organic acid exposure on the
cellular envelope, cells were not pre-adapted to the organic acids. The organic acids were
added to organic acid-free cultures just as they began exponential growth. After 24 h,
during mid-exponential growth, a sample of each culture was syringe-filtered onto a 0.2
m polycarbonate filter. The filter was placed onto a stub using carbon tape and allowed
to dry for 15 min at 45°C. In cases where single cells were imaged, 10 l was pipeted
onto a silica chip and allowed to dry. Samples were coated with iridium for 90 s at 20
mA, placed onto a carousel and viewed with an SE2 detector at an aperture diameter of
30 m and an accelerating voltage of 1 keV.

23
Statistical Analyses
With the exception of PLFA analysis, all experiments were carried out in
triplicate and average cell concentrations, specific growth rates, and 95% confidence
intervals were calculated. The specific growth rates were plotted versus the organic acid
concentrations that the cells were exposed to and linear regressions were calculated using
Microsoft Excel. From the resulting equation, the organic acid concentration that
decreased the specific growth rate by 50% (IC50) and associated 95% confidence intervals
were calculated. All error bars and ± values represent 95% confidence intervals. PLFA
analyses of cultures exposed to organic acids produced similar results regardless of the
acid, with the exception of oxaloacetate. Because of this, PLFA results of cells exposed
to pyruvate, acetate, 2-ketoglutarate, succinate, fumarate, and malate were averaged and
95% confidence intervals were calculated. These values were then compared to cells that
were not exposed to organic acids and to cells exposed to oxaloacetate.
Results
Organic Acid Toxicity
All organic acids tested exhibited inhibitory effects on BC13. In addition to
decreasing the specific growth rate, total cell yields decreased with increasing organic
acid concentration. Figures 1a and b illustrate this, using succinate and malate as
examples. These growth curves were used to calculate specific growth rate curves,
shown in Figure 2, from which IC50 values were calculated.
24
Elapsed time (h)
0 20 40 60 80 100 120 140
Ce
ll d
en
sity
(ce
lls m
L-1
)
0.0
5.0e+6
1.0e+7
1.5e+7
2.0e+7
2.5e+7
3.0e+7
3.5e+7
Succinate Free Control
50 M
100 M
250 M
500 M
1,000 M
a
Elapsed time (h)
0 20 40 60 80 100 120 140
Ce
ll d
en
sity
(ce
lls m
L-1
)
0.0
5.0e+6
1.0e+7
1.5e+7
2.0e+7
2.5e+7
3.0e+7
3.5e+7
Malate Free Control
50 M
100 M
250 M
500 M
1,000 M
5,000 M
b
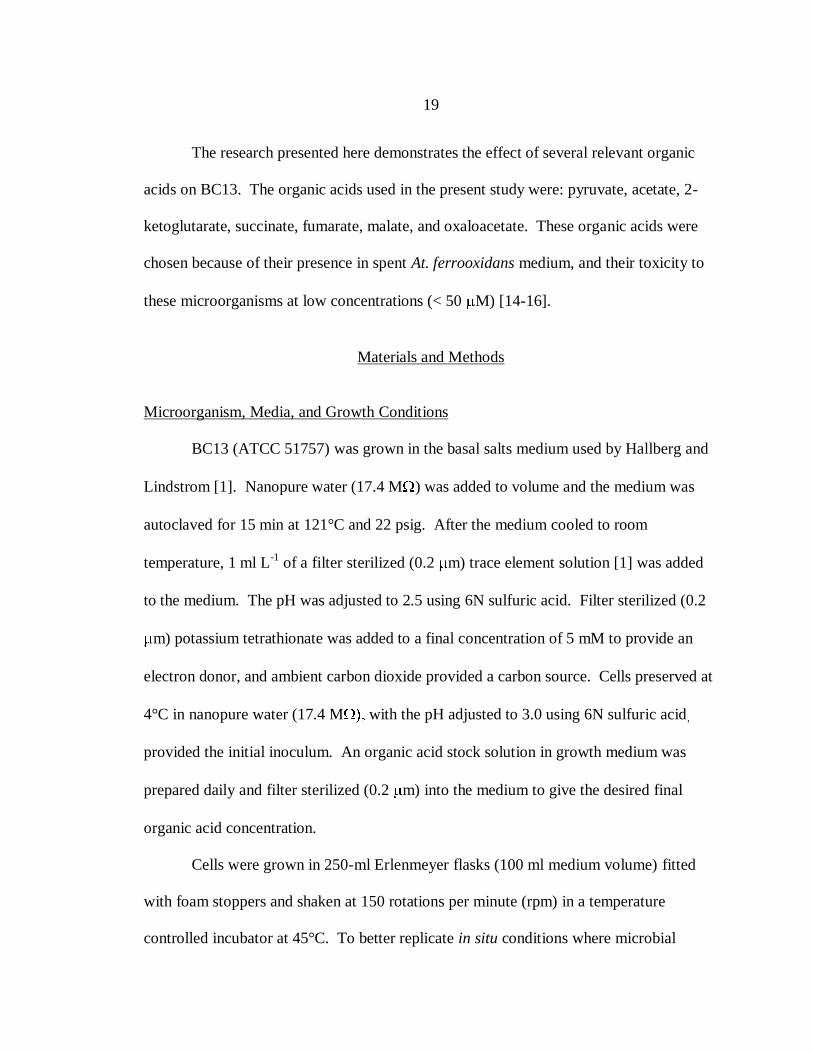
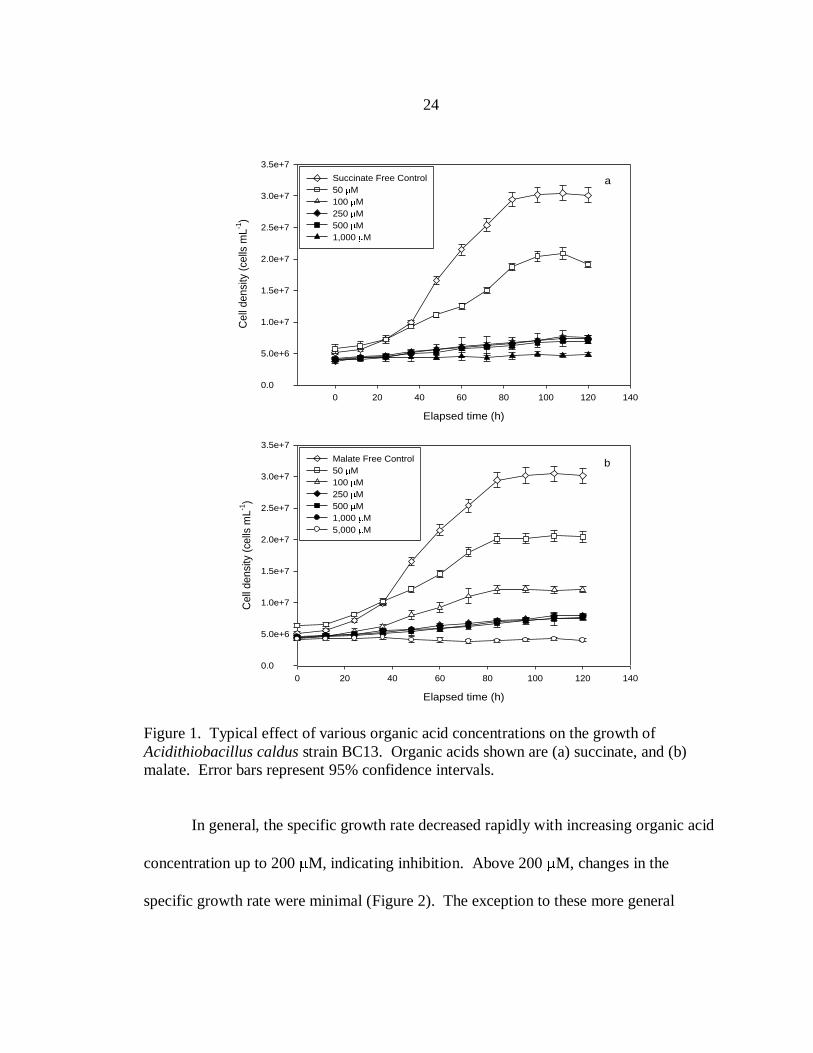
Figure 1. Typical effect of various organic acid concentrations on the growth of
Acidithiobacillus caldus strain BC13. Organic acids shown are (a) succinate, and (b)
malate. Error bars represent 95% confidence intervals.
In general, the specific growth rate decreased rapidly with increasing organic acid
concentration up to 200 M, indicating inhibition. Above 200 M, changes in the
specific growth rate were minimal (Figure 2). The exception to these more general
25
observations was oxaloacetate, where inhibition was severe at 100 M and complete at
250 M.
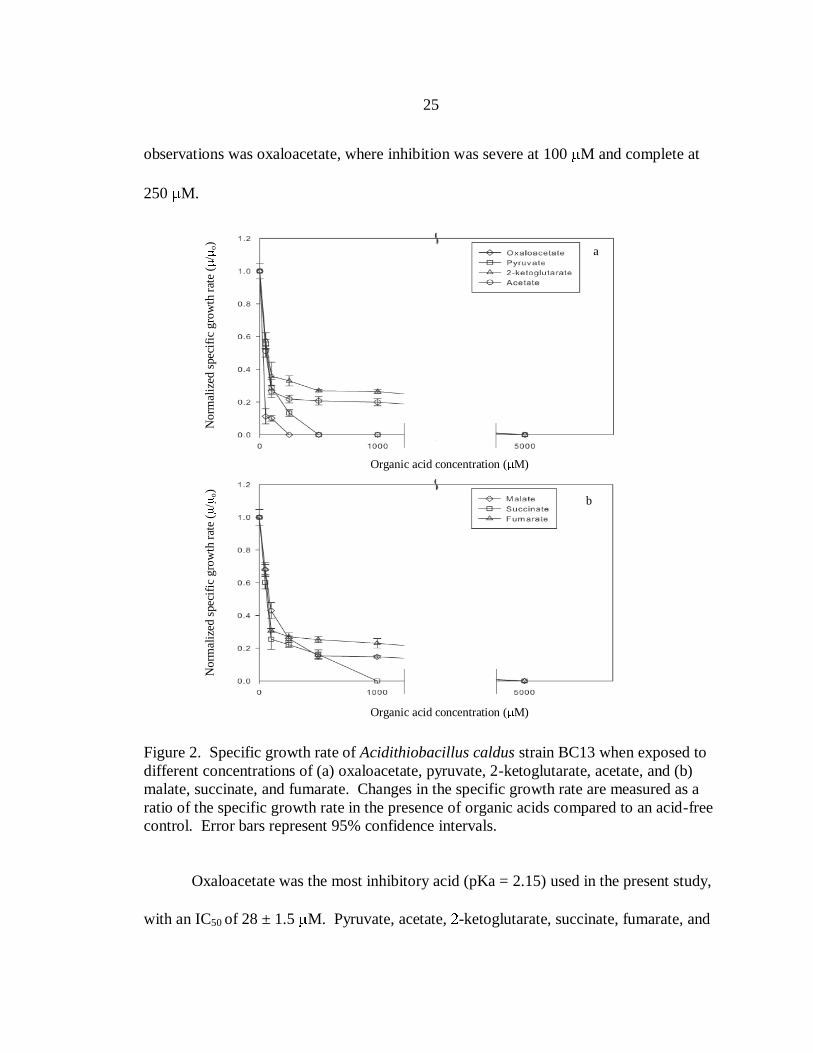
Figure 2. Specific growth rate of Acidithiobacillus caldus strain BC13 when exposed to
different concentrations of (a) oxaloacetate, pyruvate, 2-ketoglutarate, acetate, and (b)
malate, succinate, and fumarate. Changes in the specific growth rate are measured as a
ratio of the specific growth rate in the presence of organic acids compared to an acid-free
control. Error bars represent 95% confidence intervals.
Oxaloacetate was the most inhibitory acid (pKa = 2.15) used in the present study,
with an IC50 of 28 ± 1.5 M. Pyruvate, acetate, -ketoglutarate, succinate, fumarate, and
Organic acid concentration ( M)
Organic acid concentration ( M)
Norm
aliz
ed s
pec
ific
gro
wth
rat
e (
/o)
Norm
aliz
ed s
pec
ific
gro
wth
rat
e (
/o)
b
a
26
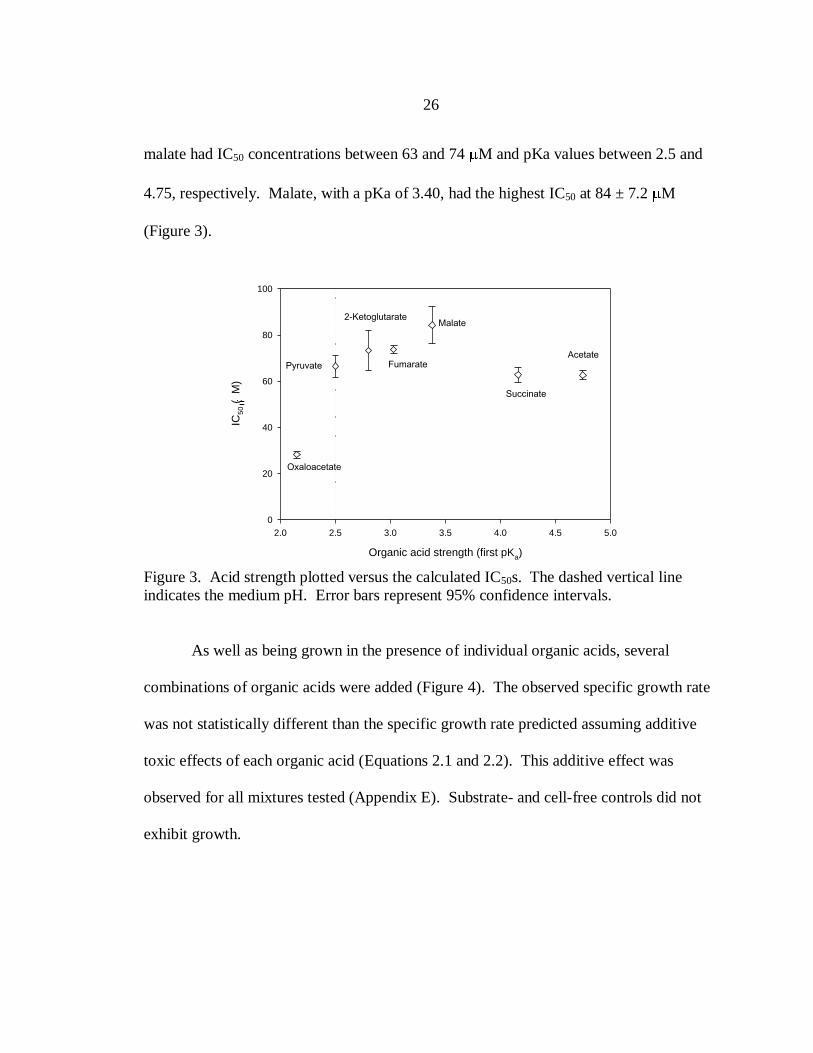
malate had IC50 concentrations between 63 and 74 M and pKa values between 2.5 and
4.75, respectively. Malate, with a pKa of 3.40, had the highest IC50 at 84 ± 7.2 M
(Figure 3).
Organic acid strength (first pKa)
2.0 2.5 3.0 3.5 4.0 4.5 5.0
IC5
0 (
M)
0
20
40
60
80
100
Oxaloacetate
Pyruvate
2-Ketoglutarate
Fumarate
Malate
Succinate
Acetate
Figure 3. Acid strength plotted versus the calculated IC50s. The dashed vertical line
indicates the medium pH. Error bars represent 95% confidence intervals.
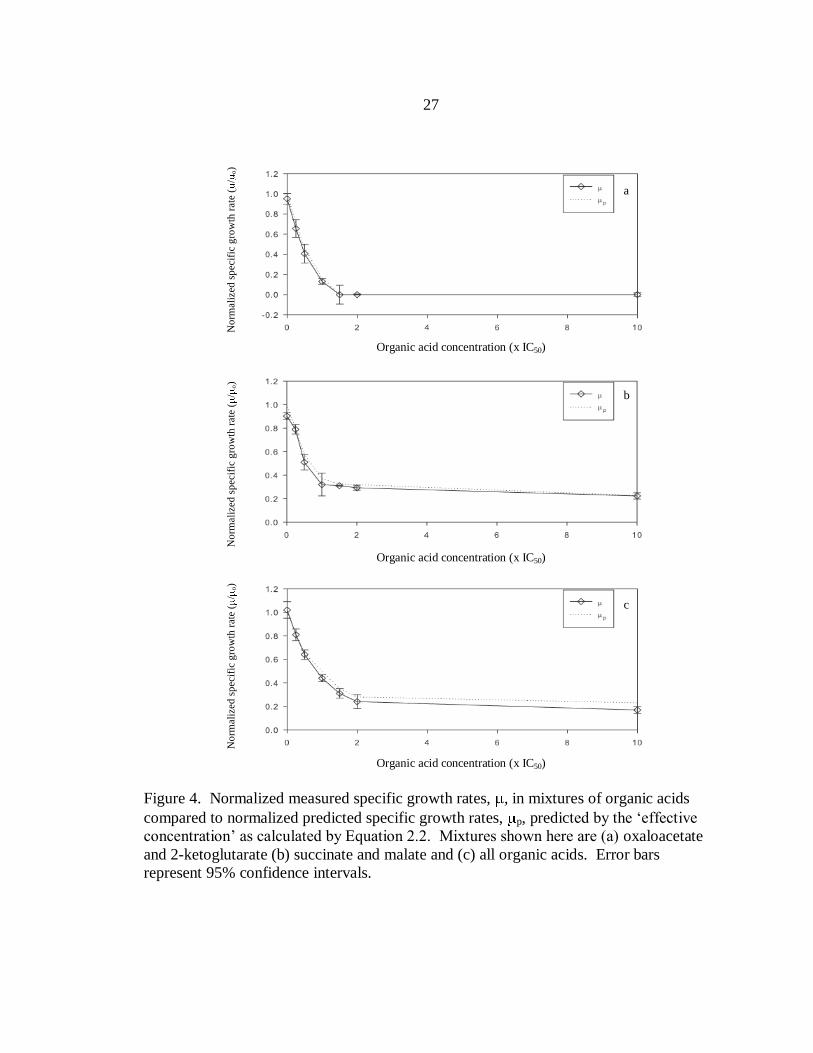
As well as being grown in the presence of individual organic acids, several
combinations of organic acids were added (Figure 4). The observed specific growth rate
was not statistically different than the specific growth rate predicted assuming additive
toxic effects of each organic acid (Equations 2.1 and 2.2). This additive effect was
observed for all mixtures tested (Appendix E). Substrate- and cell-free controls did not
exhibit growth.
27
Figure 4. Normalized measured specific growth rates, , in mixtures of organic acids
compared to normalized predicted specific growth rates, p, predicted by the „effective
concentration‟ as calculated by Equation 2.2. Mixtures shown here are (a) oxaloacetate
and 2-ketoglutarate (b) succinate and malate and (c) all organic acids. Error bars
represent 95% confidence intervals.
a
c
b
No
rmal
ized
sp
ecif
ic g
row
th r
ate
(/
o)
No
rmal
ized
sp
ecif
ic g
row
th r
ate
(/
o)
No
rmal
ized
sp
ecif
ic g
row
th r
ate
(/
o)
Organic acid concentration (x IC50)
Organic acid concentration (x IC50)
Organic acid concentration (x IC50)

28
Changes to Organic Acid Concentrations
Figure 5. Normalized concentrations of (a) oxaloacetate, pyruvate, 2-ketoglutarate,
acetate, and (b) malate, succinate, and fumarate during batch growth of Acidithiobacillus
caldus strain BC13. Co equals the concentration at which the specific growth rate was
reduced by 50% (IC50) values (oxaloacetate = 28.2 M, pyruvate = 66.5 M, 2-
ketoglutarate = 73.3 M, acetate = 62.7 M, malate = 84.3 M, succinate = 62.8 M, and
fumarate = 73.8 M). Error bars represent 95% confidence intervals.
a
b
Elapsed time (h)
Elapsed time (h)

29
As shown in Figures 5a and b, organic acid concentrations decreased in the
medium by varying amounts during batch growth. The final concentrations of
oxaloacetate and pyruvate were the highest, at over 50% of their initial concentration in
the medium (53.9 ± 7.3% and 58.0 ± 4.3% respectively, Figure 5a). 2-ketoglutarate,
malate, succinate, and fumarate had final medium concentrations of between 29% and
35% of the initial concentrations. The acetate concentration decreased the most with a
final medium concentration of 22.9 ± 11.2% of the starting concentration (Figure 5a). A
negligible decrease in organic acid concentrations was observed in cell-free controls over
a 120 hour period.
PLFA Analysis and Cell Imaging
PLFA analysis indicated differences between cells grown in the absence and
presence of organic acids. Results from an organic acid-free control were compared to
the average of results observed from cells grown in the presence of each of the acids
individually, and with results from cells grown in the presence of oxaloacetate alone
(Table 1). There was no statistically significant variation (p ≤ 0.05), with the exception
of the trans to cis monoenoic fatty acid compositions, and cyclic to straight chained fatty
acid ratios.
In addition, FESEM images showed that exposure to organic acid concentrations
that completely inhibited growth also resulted in severe physical changes to the cellular
envelope (Figure 6). Images of only malate-exposed cells are shown here to facilitate
comparison of the effect of changing concentration. However, when other organic acids
were used, similar effects were seen.

30
Table 1. Phospholipid fatty acid (PLFA) analysis of Acidithiobacillus caldus strain
BC13. Values shown are percent composition. The “Control” column contains PLFA
analysis of cells not exposed to organic acids. The “Organic Acids with out
Oxaloacetate” is an average of results obtained from cultures grown in the presence of
acetate, pyruvate, 2-ketoglutarate, malate, succinate, or fumarate. The ± values represent
95% confidence intervals. The “Oxaloacetate” column contains data from cells grown in
the presence of oxaloacetate. All organic acids were added to the IC50 concentration.
Control Oxaloacetate Organic acids with out
oxaloacetate ± 95%
Terminally branched saturates 4.06 4.55 4.39 ± 1.33
Monoenoic 66.95 68.32 69.22 ± 24.89
Normal saturates 25.80 22.96 19.98 ± 7.84
Physiological status
Cyclic/cis 1.54 1.67 1.94 ± 0.21
Trans/cis 0.00 0.32 0.43 ± 0.04
Figure 6. Micrographs of Acidithiobacillus caldus strain BC13 cells when grown in (a)
the absence of organic acids and (b) 5,000 M malate. Note the increased roughness of
the cells exposed to malate. These cells were filtered through a 0.2 m carbonate filter.
Also shown are individual cells representative of cultures grown in (c) the absence of
organic acids, and (d) 5,000 M malate. Note the sloughing of the cell exposed to
malate. These cells were aliquoted onto a silicon wafer where the medium evaporated.
31
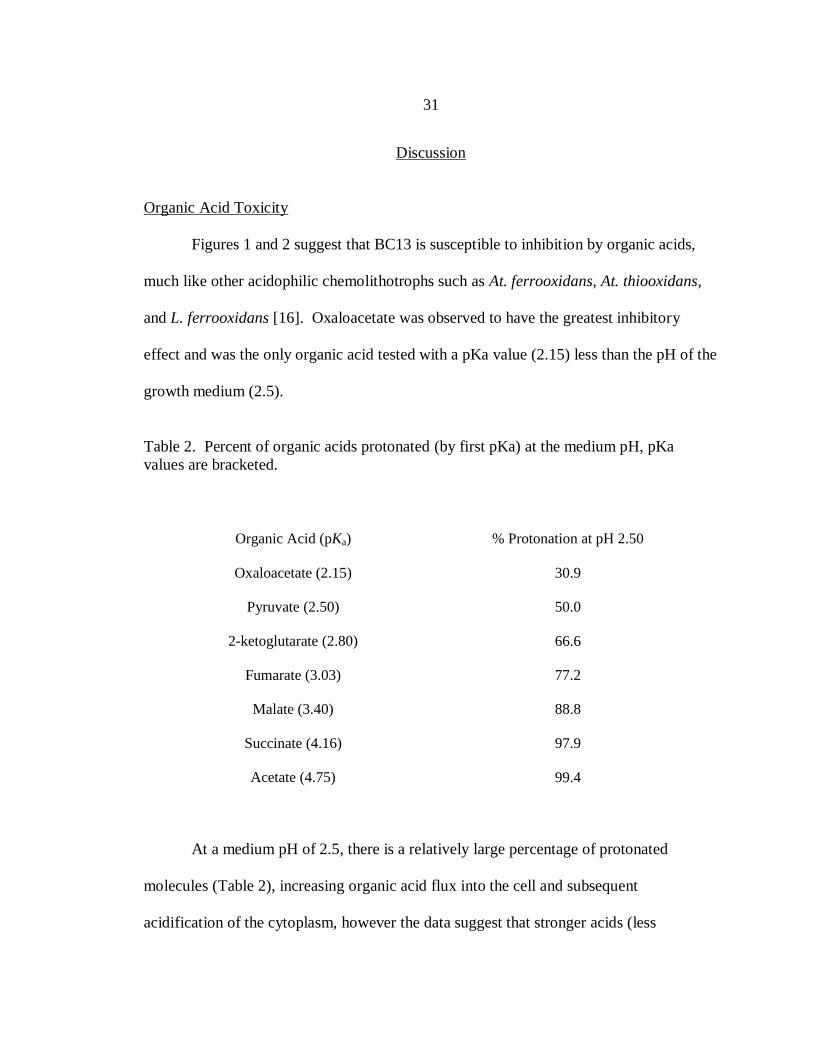
Discussion
Organic Acid Toxicity
Figures 1 and 2 suggest that BC13 is susceptible to inhibition by organic acids,
much like other acidophilic chemolithotrophs such as At. ferrooxidans, At. thiooxidans,
and L. ferrooxidans [16]. Oxaloacetate was observed to have the greatest inhibitory
effect and was the only organic acid tested with a pKa value (2.15) less than the pH of the
growth medium (2.5).
Table 2. Percent of organic acids protonated (by first pKa) at the medium pH, pKa
values are bracketed.
Organic Acid (pKa)
% Protonation at pH 2.50
Oxaloacetate (2.15) 30.9
Pyruvate (2.50) 50.0
2-ketoglutarate (2.80) 66.6
Fumarate (3.03) 77.2
Malate (3.40) 88.8
Succinate (4.16) 97.9
Acetate (4.75) 99.4
At a medium pH of 2.5, there is a relatively large percentage of protonated
molecules (Table 2), increasing organic acid flux into the cell and subsequent
acidification of the cytoplasm, however the data suggest that stronger acids (less

32
protonated) are still more toxic than weaker acids (more protonated). Previous studies
have also reported that stronger acids are more inhibitory. Xian-Yang and Wong [19]
grew At. ferrooxidans in anaerobically digested sewage sludge and observed IC50 values
of 63 and 230 M for formate and acetate respectively, whereas simple sugars (weak
acids) such as fructose and glucose had IC50 values of 126 to 491 mM. Similarly, Matin
reported that pyruvate was a stronger inhibitor to At. thiooxidans then weaker acids [16].
As discussed by Escher and Schwarzenbach [20], the dependence of toxicity on pKa may
be due to the protonation of organic acids at lower pH. Greater inhibition by stronger
acids may suggest that the extent of de-protonation within the cytoplasm plays a more
significant role than the rate of diffusion into the cell. However, for this to be the case,
cells could not be inhibited until cytoplasmic pH decreases significantly, as the degree of
de-protonation of the organic acids used in these experiments would be within 10% until
the cytoplasmic pH drops below 5.5. This paradox is interesting, and warrants future
study.
When organic acids were mixed, the specific growth rates matched those
predicted by quation 2.1, which assumes organic acid toxicity is additive when
normalized to the IC50. We were unable to find published studies on the additive toxic
effects of organic acids, but this may suggest that the organic acids tested inhibit the
growth of BC13 through a similar mechanism.
This is the first report of single or combined organic acid toxicity to At. caldus.
Results reported here are comparable to those of the related bacteria At. ferrooxidans and
At. thiooxidans. At. thiooxidans, was completely inhibited at concentrations (in M) of
33
pyruvate (40), acetate (100), -ketoglutarate (100), succinate (1,000), and malate (100).
Concentrations that resulted in complete inhibition of At. ferrooxidans for pyruvate,
acetate, succinate, fumarate, and oxaloacetate were reported to be 2,000 to 10,000 M
[16]. It appears that At. caldus may be somewhat more resistant to organic acids than At.
thiooxidans, and equally or slightly less resistant than At. ferrooxidans.
Changes in Organic Acid Concentrations
During batch experiments, acetate, 2-ketoglutarate, succinate, fumarate, and
malate concentrations decreased by varying amounts (Figure 5). Oxaloacetate and
pyruvate, the most inhibitory compounds tested, retained the highest relative
concentration in the medium throughout batch growth. The diffusion of oxaloacetate and
pyruvate into the cells was likely hindered, since they were the strongest acids tested and
therefore the least protonated in the medium (Table 2). This may further indicate that the
extent of intracellular de-protonation determines inhibition. The ability of BC13 to
reduce the concentration of organic acids may be an important benefit to bioleaching
microbial communities and warrants further study.
Acidithiobacilli have not been reported to reduce organic acid concentrations
under batch conditions, however, At. ferrooxidans and Thiobacillus acidophilus have
been observed to oxidize formate and pyruvate, respectively, in chemostat [21,22] at
concentrations ≤ 50 M. At. caldus has not been shown to use carbon compounds under
heterotrophic growth conditions; however, it has been reported to grow mixotrophically
on glucose and yeast extract in the presence of tetrathionate [1]. The ability for BC13 to

34
assimilate organic acids is examined in chapter 3, as it has implications in biomining
environments. For example, Marchand and Silverstein [23] observed increased iron
oxidation by At. ferrooxidans in soluble ferrous iron media only after glucose had been
largely removed by the heterotroph, Acidiphilium acidophilum. Similarly, increased
bioleaching kinetics in an anaerobically digested sewage sludge were observed following
the removal of acetate and propionate by heterotrophs [24]. In addition, Olson et al.
reported that heterotrophic degradation of organic acids was observed to increase pyrite
leaching by chemolithotrophic bacteria [25].
PLFA Analysis and Cell Imaging
Given the relatively high inhibition of oxaloacetate when compared to the other
organic acids tested, the PLFA data from cells exposed to oxaloacetate were compared to
an acid-free control and the average of PLFA results for cells grown with each of the
other acids individually. The lack of straight chained trans monoenoic fatty acids in cells
not exposed to organic acids compared to cells exposed to organic acids is interesting,
since some work has indicated that a high trans/cis ratio may indicate cell wall instability
[26]. Direct observation of the cellular membrane using FESEM supports this possibility,
as increased roughness and sloughing was seen in cells exposed to organic acids (Figure
6). This has been previously observed using microscopy with At. ferrooxidans grown in
the presence of organic acids [13]. In addition, the increase in cyclic fatty acids in all
cultures exposed to organic acids is not surprising, as high cyclic/cis ratios are indicative
of slow/inhibited growth, and have been observed in other extremophiles under high
stress conditions [27,28].

35
The growth inhibition of BC13 observed in the current batch studies may be
greater than that observed in natural environments. The growth of cells in planktonic
culture on a soluble substrate limits the formation of biofilms, and may have limited the
formation of extrapolymeric substances [28], leading to greater exposure of cells to
organic acids. Because of this, observations reported here may represent a more intrinsic
view of organic acid toxicity to BC13.
Conclusions
Pyruvate, acetate, 2-ketoglutarate, succinate, fumarate, malate, and oxaloacetate
were all toxic to BC13 when presented singly. When combined, the toxicities appeared
to be additive. The inhibition observed here was similar to that observed in previous
work with the acidithiobacilli [15,16]. PLFA analysis suggested membrane instability,
and FESEM imaging supported this possibility, as blebbing and sloughing of the cellular
envelope was observed when cells were exposed to concentrations of organic acids that
completely inhibited growth. Finally, the concentrations of organic acids were observed
to decrease with time during batch growth of BC13. As previously discussed, At. caldus
is prevalent in commercial bioleaching processes [7,8], therefore, any ability of BC13 to
transform organic acids in the extracellular environment may benefit biomining
communities and indirectly improve leaching kinetics in commercial processes. The
work presented here contributes to further understanding of At. caldus and lays the
ground work for future work to investigate the metabolic capabilities of this important
biomining microorganism.
36
References
1. Hallberg KB, Lindstrom EB (1994) Characterization of Thiobacillus caldus sp.
Nov., a moderately thermophilic acidophile. Microbiology 140:3451-3456.
2. Kelly DP, Wood AP (2000) Reclassification of some species of Thiobacillus to
the newly designated genera Acidithiobacillus gen. nov., Halothiobacillus, gen.
nov. and Thermithiobacillus gen. nov. Int J Systematic Evol and Microbiol
50:511-516.
3. Waksman SA, Joffe JS (1922) Microorganisms concerned in the oxidation of
sulfur in the soil. II. Thiobacillus thiooxidans, a new sulfur-oxidizing organism
isolated from the soil. J Bacteriol 7:239-256.
4. Temple KL, Colmer AR (1951) The autotrophic oxidation of iron by a new
bacterium, Thiobacillus ferrooxidans. J Bacteriol 62:605-611.
5. Hallberg KB, Lindstrom EB (1996) Multiple serotypes of the moderate
thermophile Thiobacillus caldus, a limitation of immunological assays for
biomining microorganisms. Appl Environ Microbiol 62:4243-4246.
6. Dopson M, Lindstrom EB, Hallberg KB (2002) ATP generation during reduced
inorganic sulfur compound oxidation by Acidithiobacillus caldus is exclusively
due to electron transport phosphorylation. Extremophiles 6:123-129.
7. Rawlings DE (2002) Heavy metal mining using microbes. Annu Rev Microbiol
56:65-91.
8. Okibe N, Gericke M, Hallberg KB, Johnson DB (2003) Enumeration and
characterization of acidophilic microorganisms isolated for a pilot plant stirred-
tank bioleaching operation. Appl Environ Microbiol 69:1936-1943.
9. Dopson, M, Lindstrom EB (1999) Potential role of Thiobacillus caldus in
arsenopyrite bioleaching. Appl Environ Microbiol 65:36-40.
10. Edwards KJ, Bond PL, Banfield JF (2000) Characteristics of attachment and
growth of Thiobacillus caldus on sulphide minerals: a chemotactic response to
sulphur minerals? Environ Microbiol 2:324-332.
11. McGuire MM, Edwards KJ, Banfield JF Hamers RJ (2001) Kinetics, surface
chemistry, and structural evolution of microbially mediated sulfide mineral
dissolution. Geochem Cosmochim Acta 65:1243-1258.

37
12. Ingledew WJ, Poole RK (1982) Thiobacillus ferrooxidans: The bioenergetics of
an acidophilic chemolithotroph. Biochem Biophys Acta 683:89-117.
13. Tuttle JH, Dugan PR, Apel WA (1977) Leakage of cellular material from
Thiobacillus ferrooxidans in the presence of organic acids. Appl Environ
Microbiol 33:459-469.
14. Schnaitman C, Lundgren D (1965) Organic compounds in the spent medium of
Ferrobacillus ferrooxidans. Can J Microbiol 1:23-27.
15. Borischewski RM (1967) Keto acids as growth-limiting factors in autotrophic
growth of Thiobacillus thiooxidans. J Bacteriol 93:597-599.
16. Matin A (1978) Organic nutrition of chemolithotrophic bacteria. Annu Rev
Microbiol 32:433-468.
17. Gikas P (2008) Kinetic responses of activitated sludge to individual and joint
Nickel (Ni(II)) and Cobalt (Co(II)): An isobolographic approach. J. Haz. Mater.
143:246-256.
18. White DC, Davis WM, Nickels JS, King JD, Bobbie J (1979) Determination of
the sedimentary microbial biomass by extractable lipid phosphate. Oceologia
40:51-62.
19. Xiang-Yang F, Wong WCJ (2004) Identification of inhibitory substances
affecting bioleaching of heavy metals from anaerobically digested sewage sludge.
Environ Sci Technol 38:2934-2939.
20. Escher BI, Schwarzenbach RP (2002) Mechanistic studies on baseline toxicity
and uncoupling of organic compounds as a basis for modeling effective
membrane concentrations in aquatic organisms. Aqua Sci 64:20-35.
21. Pronk JT, Meijer WM, Van Dijken JP, Kuenen JG (1991) Growth of Thiobacillus
ferrooxidans on formic acid. Appl Environ Microbiol 57:2057-2062.
22. Pronk JT, Meesters Van Dijken JP, Bos P, Kuenen JG (1990) Heterotrophic
growth of Thiobacillus acidophilus in batch and chemostat cultures. Arch
Microbiol 153:392-398.
23. Marchand EA, Silverstein J (2003) The role of enhanced heterotrophic bacterial
growth on iron oxidation by Acidithiobacillus ferrooxidans. Geomicrobiol J
20:231-244.

38
24. Xiang-Yang F, Wong WCJ (2007) Degradation of inhibitory substances by
heterotrophic microorganisms during bioleaching of heavy metals from
anaerobically digested sewage sludge. Chemosphere 69:311-318.
25. Olson GJ, Brierley JA. Brierley CL (2003) Bioleaching review part B: progress in
bioleaching: applications of microbial processes by the mineral industries. Appl
Microbiol Biotechnol 63:249-257.
26. Loffeld B, Keweloh H (1996) cis/trans isomerization of unsaturated fatty acids as
possible control mechanism of membrane fluidity in Pseudomonas putida P8.
Lipids 31:811-815.
27. Aston JE, Peyton BM (2007) Response of Halomonas campisalis to saline stress:
changes in growth kinetics, compatible solute production and membrane
phospholipid fatty acid analysis. FEMS Microbiol Lett 274:196-203.
28. Brown GR, Sutcliffe IC, Bendell D, Cummings SP (2000) The modification of
the membrane of Oceanomonas baumannii when subjected to both osmotic and
organic solvent stress. FEMS Microbiol Lett 189:149-154.
29. Neis DH (1999) Microbial heavy-metal resistance. Appl Microbiol Biotechnol
51:730-750.

39
CHAPTER THREE
GROWTH EFFECTS AND ASSIMILATION OF ORGANIC ACIDS IN CHEMOSTAT
AND BATCH CULTURES OF ACIDITHIOBACILLUS CALDUS STRAIN BC13
Abstract
The ability of BC13 to grow aerobically using pyruvate, acetate, citrate, 2-
ketoglutarate, succinate, and malate as either an electron donor and carbon source
(heterotrophic growth), or as a carbon source when potassium tetrathionate was added as
an electron donor (mixotrophic growth), was tested in chemostat cultures. Under both
heterotrophic and mixotrophic conditions, organic acids were added to a sub-lethal
concentration (50 M). Under mixotrophic conditions, potassium tetrathionate was
added to an excess concentration (10 mM). No cell growth was observed under
heterotrophic conditions; however effluent cell concentrations increased over three-fold
when pyruvate was coupled with potassium tetrathionate. Under these conditions, the
effluent pyruvate concentration was reduced to below the detection limit (2 M), and
oxygen consumption increased by approximately 100%. Although pyruvate provided a
carbon source in these experiments, ambient carbon dioxide was also available to the
cells.
To test whether BC13 could grow mixotrophically using pyruvate as a sole carbon
source and potassium tetrathionate as an electron donor, cells were batch cultured in a
medium free of dissolved inorganic carbon, and with no carbon dioxide in the headspace.

40
These experiments showed that BC13 converted between 65 ± 8 and 82 ± 15% of the
pyruvate carbon to cellular biomass, depending on the initial pyruvate concentrations.
This work is the first to identify a defined organic-carbon source, other than
glucose, that At. caldus can assimilate. This has important implications, as mixotrophic
and heterotrophic activity has been shown to increase mineral leaching in acidic systems.
Introduction
Compared to the more commonly studied At. thiooxidans [1] and At. ferrooxidans
[2], relatively little is known about At. caldus. As with all acidithiobacilli, At. caldus
thrives at low pH (optimum 2.0 - 3.0); however, unlike other acidithiobacilli, At. caldus
grows well at moderately high temperatures, with optimum growth at 45°C [3]. At.
caldus oxidizes sulfur and reduced sulfur compounds for energy, and can fix carbon
dioxide as a sole carbon source [4,5]. At. caldus has also been reported to grow
mixotrophically using sulfur or tetrathionate as an electron donor and either glucose or
yeast extract as a carbon source [3]. The conditions at which At. caldus thrives, coupled
with its ability to oxidize reduced sulfur compounds, make it important in many acid-
mine systems around the world [6,7], where it may stimulate mineral sulfide leaching [8-
12].
There are many considerations affecting the bioleaching of metals in acid-mine
environments, one of these is the presence and concentration of organic acids [13-17].
The toxicity of low-molecular weight organic acids to microorganisms is well
documented. These effects may increase at low pH where acids are more protonated and
41
can more easily diffuse across the cell membrane, weakening the proton motive force
[18]. In addition, Tuttle et al. observed a loss of integrity in the cellular envelope of
acidophilic chemolithotrophs when exposed to inhibitory concentrations of organic acids
[19]. Because of these effects, heterotrophic or mixotrophic activity in carbon-limited
bioleaching systems can improve leaching efficiency by reducing organic acid
concentrations [14-17].
In the present study, the ability of BC13 to use pyruvate, acetate, citrate, 2-
ketoglutarate, succinate, and malate as an electron donor and carbon source
(heterotrophic growth) and as a carbon source coupled with the inorganic electron donor,
potassium tetrathionate (mixotrophic growth), was studied in chemostat and batch
cultures. These organic acids were chosen because of their presence in the spent medium
of acidophilic sulfur-oxidizing autotrophs [20], and their toxicity to acidithiobacilli [21-
23].
Materials and Methods
Microorganism, Media, and Growth Conditions
BC13 (ATCC 51757) was grown in the basal salts medium and trace elements
used by Hallberg and Lindstrom [3]. To prepare the medium, nanopure water (17.4 M )
was added to the salts to volume, and the medium was autoclaved for 15 min at 121°C
and 22 psig. After the medium cooled to room temperature, 1 mL L-1
of the filter
sterilized (0.2 m) trace element solution was added [3], and the pH was adjusted to 2.5
using 6N sulfuric acid. Cells preserved at 4°C in nanopure water (17.4 M with the pH

42
adjusted to 3.0 using 6N sulfuric acid, provided the initial inoculum. An organic acid
stock solution was prepared the same day and filter sterilized (0.2 m) into the medium
to give the desired final organic acid concentration.
Chemostat Culturing
Pronk et al. showed Thiobacillus acidophilus could oxidize pyruvate in chemostat
cultures, but not in batch cultures [24]. Because of this, chemostat cultures were used in
the initial experiments discussed here. Prior to inoculation into a continuous-flow
system, BC13 cells were grown in 500-mL serum bottles (350 mL medium volume) fitted
with butyl-rubber stoppers. Filter sterilized (0.2 m) potassium tetrathionate was added
to a concentration of 10 mM as the electron donor, and carbon dioxide provided the sole
carbon source. The serum bottles were placed in a temperature controlled incubator at
45°C, and shaken at 150 rotations per minute (rpm). During the late-exponential growth
phase, pyruvate, acetate, citrate, 2-ketoglutarate, succinate, or malate was added to a
concentration of 10 M to pre-adapt the cells to each organic acid. Cells were harvested
using centrifugation (7,000 g) during the late-exponential growth phase, and were washed
three times in pH 3.0 nanopure water (17.4 M ) to minimize substrate transfer. An
aliquot of cells that provided between 5.0 x 10⁷ and 5.5 x 10
7 cells mL
-1 was inoculated
into 500 mL of fresh growth medium in a continuous-flow SIXFORS reactor (ATR,
Columbia, MD, U.S.A.), maintained at 45°C, and agitated using a magnetic stir bar
rotating at 200 rpm.

43
To test for heterotrophic growth, pyruvate, acetate, citrate, 2-ketoglutarate,
succinate, or malate were added to the influent to a sub-lethal concentration of 50 M
[21]. To test for mixotrophic growth, parallel experiments were run, using an influent
medium containing 10 mM potassium tetrathionate, in addition to the organic acids, to
provide an inorganic electron donor. In either case, the influent was added at 5 mL hr-1
,
setting the dilution rate at 0.01 h-1
. An adjacent SIXFORS pump removed the effluent,
maintaining a constant medium volume in each chemostat.
Cell concentrations were measured by direct counts using a Petrof-counting
chamber (Hausser Scientific, Horsham, PA, U.S.A.), and a phase-contrast microscope at
1,000X (Zeiss, Thornwood, NY, U.S.A.). Cultures were monitored until cell
concentrations either reached steady-state, or washed out. Effluent samples were then
saved at 4°C for measurement of organic acid concentrations.
Organic Acid Measurement
Samples collected for organic acid measurements were concentrated using a
CentriVap Concentrator (LABCONCO, Kansas City, MO, U.S.A.). Concentrations were
measured using capillary electrophoresis (CE) (BioRad 4000, Hercules, CA, U.S.A.)
against an anion buffer (Agilent, Santa Clara, CA, U.S.A.). A capillary cartridge 104 cm
in length, with an inside diameter of 50 m, was washed with nanopure water (17.4 mΩ)
and the buffer solution between each sample run. Samples were injected at 50 mbar for 6
seconds, and run positive to negative at 30 kV. Absorbance was measured at 350 nm.

44
Dissolved Oxygen and Inorganic Carbon Measurement
The dissolved oxygen concentrations were measured using an HQ40d dissolved
oxygen probe (HACH, Loveland, CO, U.S.A.). The probe was calibrated using nanopure
water (17.4 M ) at 22 and 45ºC. To measure dissolved inorganic carbon, samples were
collected using a 3-mL syringe and filtered (0.2 m) into a 30-mL serum bottle, capped
with a butyl-rubber stopper, that had been purged with filter sterilized (0.2 m) ultra-pure
nitrogen gas for 5 minutes to remove ambient carbon dioxide. A 1-mL syringe was then
used to transfer the samples to a carbon analyzer (Dohrmann, St. Cloud, MN, U.S.A.).
The UV-light apparatus, normally used to cleave organic compounds into dissolved
inorganic carbon, was turned off, so that only dissolved inorganic carbon was measured.
Dry-Cell Weight and Carbon Composition Measurement
It was necessary to measure the carbon composition of BC13 cells to determine
carbon yield on pyruvate during mixotrophic growth. A 50-mL effluent sample from a
chemostat culture at steady state was collected and centrifuged. Cells were dried in a
Samdri-795 critical point dryer (Tousimis, Rockville, MD), and then placed in an oven at
80ºC for 48 hours. Dry weights were recorded and correlated with direct-cell counts to
calculate a specific dry-cell weight. The cell pellet was re-suspended in 10 mL of
nanopure water (17.4 m ) and agitated for 30 seconds using a Branson 1020 sonicator
(Danbury, CT, U.S.A.). This sample was introduced into the carbon analyzer, with the
UV-light apparatus turned on. After the specific dry-cell weight and carbon mass was
measured, the percent carbon composition of BC13 was calculated.
45
Batch Growth with Pyruvate as the Sole Carbon Source
Inorganic carbon was removed from the growth medium by sparging 350 mL of
heated (80ºC) medium, in a 500-mL serum bottle fitted with a butyl-rubber stopper, with
carbon dioxide-free air for 30 minutes. Because chemostat experiments showed that
BC13 could not use pyruvate as a sole electron donor, potassium tetrathionate was added
to a concentration of 10 mM and pyruvate was added to a concentration of 5, 10, 15, or
20 M. Controls showed the dissolved inorganic carbon concentration in the medium
was below the detection limit (approximately 1 M). The medium was then inoculated
with cells that were pre-adapted to pyruvate. To adapt the cells to pyruvate, cells were
harvested during the late-exponential growth phase of a growth cycle, and washed using
the methods described earlier. Cells were then re-inoculated into fresh medium
containing the same initial organic acid concentration. This process was repeated a total
of three times.
Cell concentrations were measured using direct counts (described earlier) and the
specific growth rates were calculated. Samples were collected at the end of the
exponential growth phase to measure pyruvate concentrations using the methods
described earlier. The growth of these cultures was compared with potassium
tetrathionate-free, pyruvate-free, and pyruvate plus carbon dioxide controls.
Growth Effects of Organic Acids in Batch Cultures
In separate experiments, the toxicity of organic acids was determined at
concentrations at and below 50 M. BC13 was grown in 125-mL serum bottles (75 mL

46
medium volume) fitted with butyl-rubber stoppers. Potassium tetrathionate was added to
a concentration of 10 mM as an electron donor. Prior to inoculation, pyruvate, acetate,
citrate, 2-ketoglutarate, succinate, or malate was added to a concentration of 5, 10, 20, 30,
or 50 M. Ambient carbon dioxide was also available as a carbon source. Cells
preserved at 4°C in pH 3.0 nanopure water (17.4 M ) provided the initial inoculum. The
serum bottles were placed in a temperature controlled incubator at 45°C and shaken at
150 rpm. To calculate specific growth rates, cell concentrations were measured by direct
counts. This experiment was repeated in parallel with cultures that had been pre-adapted
to organic acids through subsequent transfers, using the methods described earlier.
16S rRNA Culture Analysis
After chemostat cultures had reached steady-state, and after batch cultures had
reached late-log phase growth, DNA was extracted using a DNA soil extraction kit
(Promega, Madison, WI, U.S.A.). A polymerase chain reaction (PCR) was carried out in
an Eppendorf master cycler gradient thermocycler (New York, NY, U.S.A.) using 8F and
1492R primers, to amplify the 16S rRNA gene, and a PCR master mix from PROMEGA.
The amplicons were sequenced at the Bioinformatics laboratory at Idaho State
University. The sequence results were analyzed with BLAST software, and had a 99%
percent similarity to several uncultured At. caldus 16S clones.
Statistical Analysis
All experiments were carried out in triplicate, and average values and 95%
confidence intervals are reported. A single carboy was used to supply influent medium to

47
three continuous-flow reactors, preventing statistical analysis of influent substrate
concentrations.
Results
Test for Heterotrophic Growth
When acetate, citrate, 2-ketoglutarate, succinate, or malate were added as a
carbon source and sole electron donor, there were no statistically significant differences
between effluent cell concentrations and a theoretical washout curve calculated from an
unsteady state mass balance that assumed a specific growth rate of zero. The organic
acid concentrations were nearly constant between the influent and effluent at steady state.
In addition, the dissolved oxygen concentration remained steady between the influent and
effluent, at 185 M. In comparison, when potassium tetrathionate was added as an
electron donor, and ambient carbon dioxide provided the sole carbon source, cultures
reached steady state between 360 and 412 hours, or 3.60 to 4.12 residence times, at 7.40
x 106 ± 1.90 x 10
6 cells mL
-1, and the effluent dissolved oxygen concentration decreased
to 139.4 ± 1.8 M (Appendix F).
Test for Mixotrophic Growth
Figure 7a shows changes in the effluent cell concentrations over time when
potassium tetrathionate was present with the organic acid. There was little difference in
the steady state effluent cell concentrations between cultures containing acetate, citrate,
2-ketoglutarate, succinate, or malate coupled with potassium tetrathionate, and cultures
containing only potassium tetrathionate. These effluent cell concentrations ranged

48
between 5.60 x 10⁶ ± 9.17 x 10
5 (citrate) and 7.67 x 10
6 ± 1.40 x 10
6 cells mL
-1 (acetate).
However, when pyruvate was added, steady state cell concentrations reached 2.07 x 10⁷ ±
0.06 x 10⁷ cells mL
-1.
Figure 7. (a) Effluent cell concentrations of Acidithiobacillus caldus strain BC13 grown
in chemostat under mixotrophic conditions. Each respective organic acid supplied a
possible electron donor (50 M), in addition to potassium tetrathionate (10 mM), and
supplemented ambient carbon dioxide as a potential carbon source. A potassium
tetrathionate only control and theoretical washout are presented for comparison. It can be
seen that the chemostat comes to steady state between 264 and 336 hours. (b) Influent
and steady state effluent concentrations of organic acids corresponding to plot (a). Error
bars represent 95% confidence intervals.
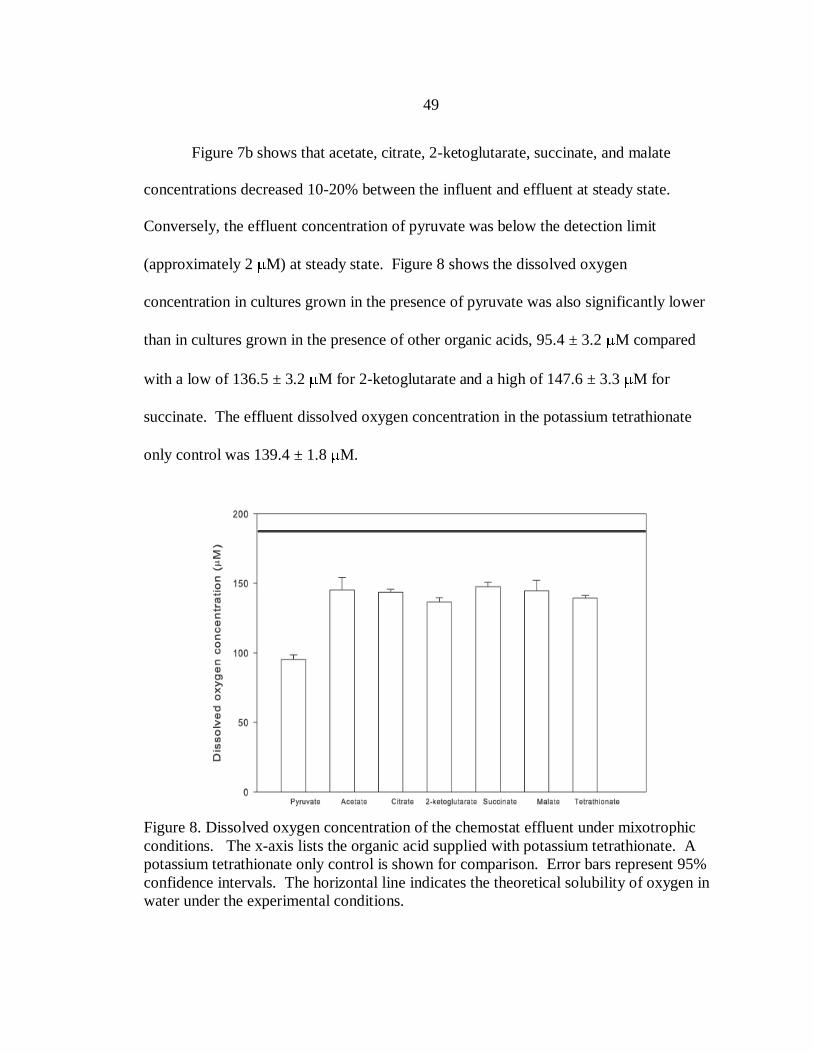
49
Figure 7b shows that acetate, citrate, 2-ketoglutarate, succinate, and malate
concentrations decreased 10-20% between the influent and effluent at steady state.
Conversely, the effluent concentration of pyruvate was below the detection limit
(approximately 2 M) at steady state. Figure 8 shows the dissolved oxygen
concentration in cultures grown in the presence of pyruvate was also significantly lower
than in cultures grown in the presence of other organic acids, 95.4 ± 3.2 M compared
with a low of 136.5 ± 3.2 M for 2-ketoglutarate and a high of 147.6 ± 3.3 M for
succinate. The effluent dissolved oxygen concentration in the potassium tetrathionate
only control was 139.4 ± 1.8 M.
Figure 8. Dissolved oxygen concentration of the chemostat effluent under mixotrophic
conditions. The x-axis lists the organic acid supplied with potassium tetrathionate. A
potassium tetrathionate only control is shown for comparison. Error bars represent 95%
confidence intervals. The horizontal line indicates the theoretical solubility of oxygen in
water under the experimental conditions.
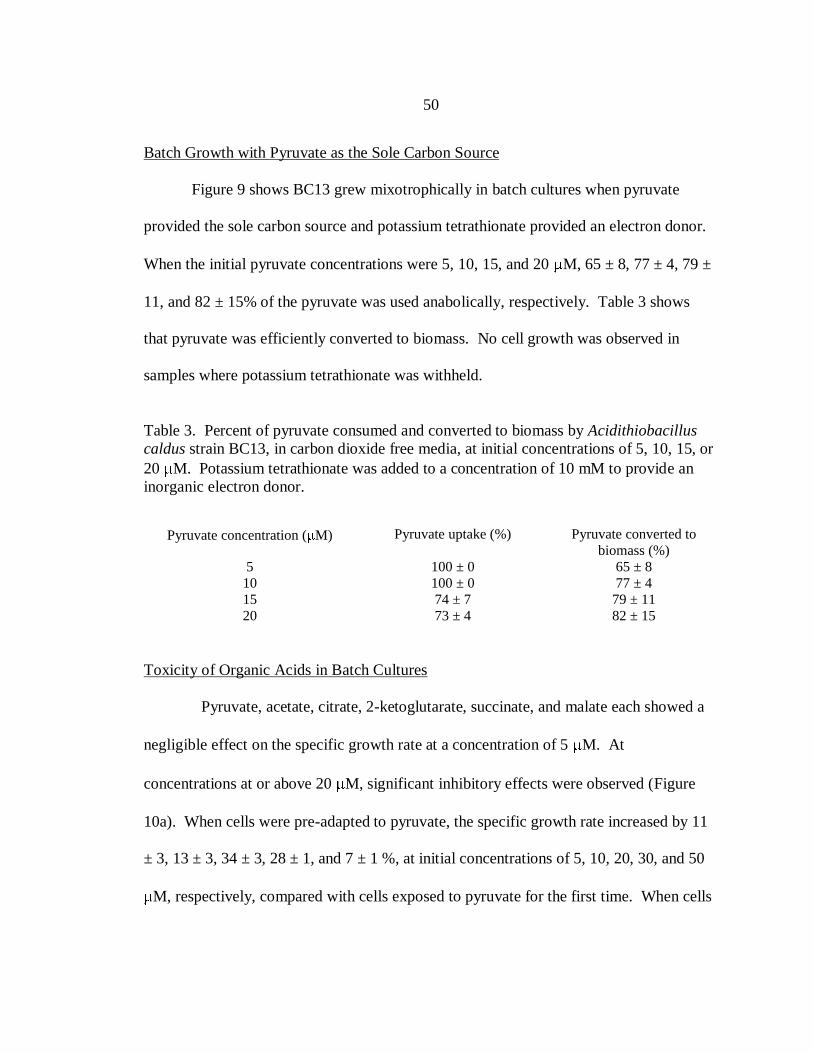
50
Batch Growth with Pyruvate as the Sole Carbon Source
Figure 9 shows BC13 grew mixotrophically in batch cultures when pyruvate
provided the sole carbon source and potassium tetrathionate provided an electron donor.
When the initial pyruvate concentrations were 5, 10, 15, and 20 M, 65 ± 8, 77 ± 4, 79 ±
11, and 82 ± 15% of the pyruvate was used anabolically, respectively. Table 3 shows
that pyruvate was efficiently converted to biomass. No cell growth was observed in
samples where potassium tetrathionate was withheld.
Table 3. Percent of pyruvate consumed and converted to biomass by Acidithiobacillus
caldus strain BC13, in carbon dioxide free media, at initial concentrations of 5, 10, 15, or
20 M. Potassium tetrathionate was added to a concentration of 10 mM to provide an
inorganic electron donor.
Pyruvate concentration ( M) Pyruvate uptake (%) Pyruvate converted to
biomass (%)
5 100 ± 0 65 ± 8
10 100 ± 0 77 ± 4
15 74 ± 7 79 ± 11
20 73 ± 4 82 ± 15
Toxicity of Organic Acids in Batch Cultures
Pyruvate, acetate, citrate, 2-ketoglutarate, succinate, and malate each showed a
negligible effect on the specific growth rate at a concentration of 5 M. At
concentrations at or above 20 M, significant inhibitory effects were observed (Figure
10a). When cells were pre-adapted to pyruvate, the specific growth rate increased by 11
± 3, 13 ± 3, 34 ± 3, 28 ± 1, and 7 ± 1 %, at initial concentrations of 5, 10, 20, 30, and 50
M, respectively, compared with cells exposed to pyruvate for the first time. When cells
c
d
a
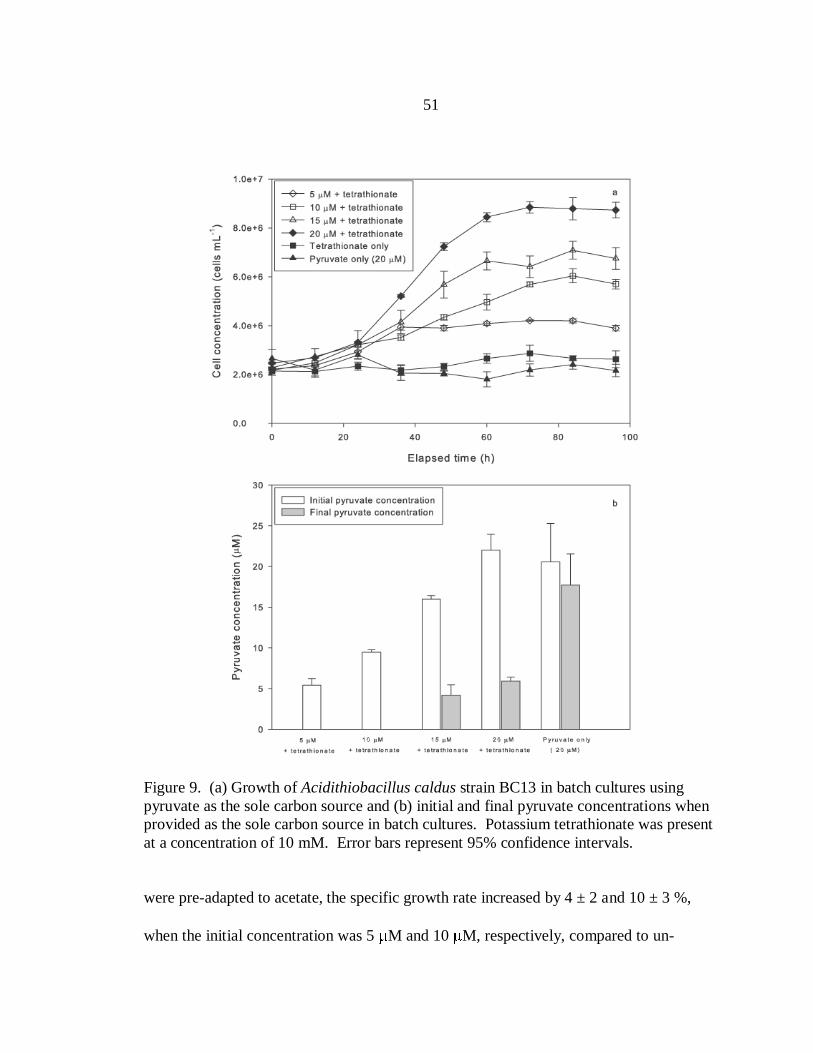
51
Figure 9. (a) Growth of Acidithiobacillus caldus strain BC13 in batch cultures using
pyruvate as the sole carbon source and (b) initial and final pyruvate concentrations when
provided as the sole carbon source in batch cultures. Potassium tetrathionate was present
at a concentration of 10 mM. Error bars represent 95% confidence intervals.
were pre-adapted to acetate, the specific growth rate increased by 4 ± 2 and 10 ± 3 %,
when the initial concentration was 5 M and 10 M, respectively, compared to un-
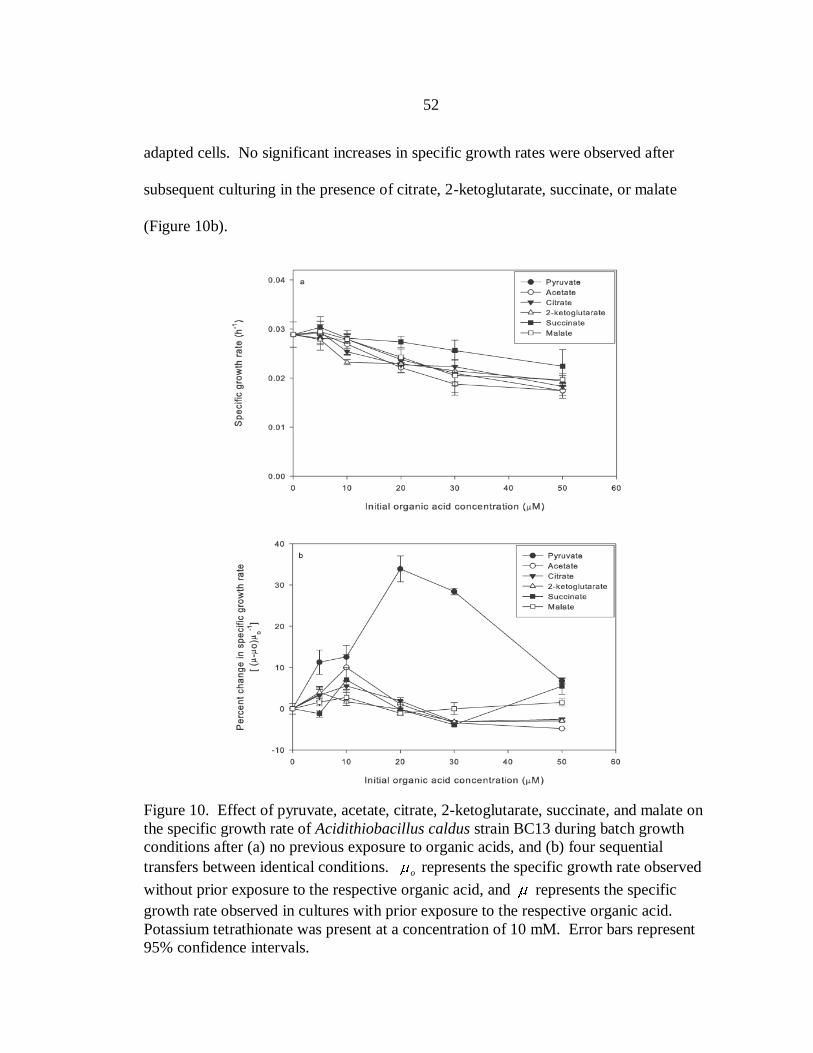
52
adapted cells. No significant increases in specific growth rates were observed after
subsequent culturing in the presence of citrate, 2-ketoglutarate, succinate, or malate
(Figure 10b).
Figure 10. Effect of pyruvate, acetate, citrate, 2-ketoglutarate, succinate, and malate on
the specific growth rate of Acidithiobacillus caldus strain BC13 during batch growth
conditions after (a) no previous exposure to organic acids, and (b) four sequential
transfers between identical conditions. o represents the specific growth rate observed
without prior exposure to the respective organic acid, and represents the specific
growth rate observed in cultures with prior exposure to the respective organic acid.
Potassium tetrathionate was present at a concentration of 10 mM. Error bars represent
95% confidence intervals.
53
Discussion
The work presented here shows that BC13 can grow mixotrophically using
pyruvate as a carbon source and potassium tetrathionate as an electron donor, under
aerobic conditions (Figures 7 and 8). Conversely, acetate, citrate, 2-ketoglutarate,
succinate, and malate were not used as a significant carbon source.
Because carbon dioxide was available to the cells in the chemostat experiments,
separate experiments were designed to determine whether BC13 is capable of
mixotrophic growth on pyruvate in a carbon dioxide limited system. Using media free of
dissolved inorganic carbon, we confirmed that BC13 grew while using pyruvate as the
sole-carbon source in batch cultures (Figure 10). Coupled with the inability of BC13 to
grow in the absence of potassium tetrathionate, this further suggests that pyruvate was
primarily used for anabolic growth, rather than being oxidized solely as an electron
donor.
This is not the first report of mixotrophic growth by At. caldus, as Hallberg and
Lindstrom reported that At. caldus strain KU could grow using sulfur or potassium
tetrathionate and either glucose or yeast extract [3]. However, this work is significant
because pyruvate has been identified in the spent medium filtrate of acidophilic
chemolithophic autotrophs [20], and is toxic to chemolithotrophic autotrophs at low
concentrations under acidic conditions [21,23]. In addition, previous work has shown
that removing inhibitory organic acids can significantly increase metal-leaching rates [14-
17].

54
Recent studies may provide clues for how BC13 can assimilate pyruvate as a
carbon source. Valdes et al. used whole-genome shotgun sequencing to assemble a draft
genome for At. caldus strain KU and predict proteins from coding sequences [25,26].
Sequences coding for pyruvate dehydrogenase and phosphoenolpyruvate synthase were
identified. Pyruvate dehydrogenase catalyzes the oxidation of pyruvate to carbon dioxide
and acetyl-CoA. Carbon dioxide could then be fixed via the Calvin cycle, and acetyl-
CoA could be used as a precursor for lipid synthesis, for which the necessary genes were
also identified [26]. This mechanism would be similar to the anabolic oxidation of
formate by At. thiooxidans [27], where formate was oxidized to carbon dioxide, which
could then be fixed for anabolic growth. In addition, phosphoenolpyruvate synthase
converts pyruvate to phosphoenolpyruvate, and Valdes et al. did predict that At. caldus
strain KU possesses the necessary enzymes to convert phosphoenolpyruvate into five-
carbon sugars important for anabolic growth using gluconeogenesis and the pentose
phosphate pathway [26].
In this study, pyruvate in particular showed a significant increase in specific
growth rates following adaptation (Figure 10). This suggests that the expression of
enzymes that may facilitate pyruvate metabolism, such as those discussed above, or
proteins that aid in resisting organic acid toxicity, increased with prior exposure.
Valdes et al. also identified the presence of an incomplete TCA cycle (lacking 2-
ketoglutarate dehydrogenase) [25,26]. However, the present study indicates that BC13
does not assimilate external organic acids used in the TCA cycle (citrate, 2-ketoglutarate,

55
succinate, and malate), suggesting that it may lack the required transport mechanisms, or
cannot use the concentrations of these acids tested in this study.
It is interesting that under mixotrophic conditions, the effluent cell concentrations
in chemostat cultures containing acetate, 2-ketoglutarate, succinate, or malate did not
differ statistically from cultures containing only potassium tetrathionate given that they
were not used as a carbon source and are toxic at the concentrations measured in the
effluent (Figures 7 and 10). However, the dilution rate used in these chemostat studies
(0.01 h-1
) was lower than the specific growth rates observed in batch cultures that
contained acetate, citrate, 2-ketoglutarate, succinate, or malate (0.016 to 0.023 h-1
at 50
M), and there have been several studies that report a correlation between bacterial
growth phase and the toxicity of a given inhibitor [i.e. 28,29]. By fixing the specific
growth rate in the chemostat at 0.01 h-1
, the toxic effect of the organic acids may be
reduced, or masked by the already low specific growth rate. A previous study with
Thiobacillus acidophilus reported a similar effect, where, although no growth was
observed in batch cultures containing pyruvate, cells grew and oxidized pyruvate in a
chemostat culture [24].
No cell growth was observed when organic acids were supplied as the sole
electron donor in either chemostat or batch cultures. Therefore, it is possible that the
slight decrease in the concentration of organic acids between the influent and the effluent
at steady state (Appendix F) was due to chemiosmosis [18]. It is also possible that a
portion of this decrease in organic acids was due to anabolic maintenance, but because
the dissolved oxygen concentration remained nearly constant, this would have been an

56
energetically limited process. These results were not surprising, as no acidithiobacilli
have been observed to grow using organic acids as a sole energy source.
Conclusions
The work presented here shows that BC13 can use pyruvate for anabolic growth
under mixotrophic conditions. In addition, prior exposure to pyruvate significantly
increased the specific growth rate of BC13 when pyruvate was added to batch cultures.
However, BC13 could not grow when pyruvate was the sole electron donor, nor could it
use acetate, citrate, 2-ketoglutarate, succinate, or malate as energy or carbon sources to a
significant extent at the concentrations and dilution rates used in this study. This work is
an important contribution towards understanding the metabolic capabilities of At. caldus,
and its role in microbial communities and industrial and environmental applications.

57
References
1. Waksman SA, Joffe JS (1922) Microorganisms concerned in the oxidation of
sulfur in the soil II. Thiobacillus thiooxidans, a new sulfuroxidizing organism
isolated from the soil. J Bacteriol 7:239-256.
2. Temple KL, Colmer AR (1951) The autotrophic oxidation of iron by an new
bacterium, Thiobacillus ferrooxidans. J Bacteriol 62:605-611.
3. Hallberg KB, Lindstrom EB (1994) Characterization of Thiobacillus caldus sp.
Nov., a moderately thermophilic acidophile. Microbiology 140:3451-3456.
4. Dopson M, Lindstrom EB, Hallberg KB (2002) ATP generation during reduced
inorganic sulfur compound oxidation by Acidithiobacillus caldus is exclusively
due to electron transport phosphorylation. Extremophiles 6:123-129.
5. Hallberg KB, Lindstrom EB (1996) Multiple serotypes of the moderate
thermophile Thiobacillus caldus, a limitation of immunological assays for
biomining microorganisms. Appl Environ Microbiol 62:4243-4246.
6. Rawlings DE. (2002) Heavy metal mining using microbes. Annu Rev Microbiol
56:65-91.
7. Okibe N, Gericke M, Hallberg KB, Johnson DB (2003) Enumeration and
characterization of acidophilic microorganisms isolated for a pilot plant stirred-
tank bioleaching operation. Appl Environ Microbiol 69:1936-1943.
8. Dopson M, Lindstrom EB (1999) Potential role of Thiobacillus caldus in
arsenopyrite bioleaching. Appl Environ Microbiol 65:36-40.
9. Edwards KJ, Bond PL, Banfield JF (2000) Characteristics of attachment and
growth of Thiobacillus caldus on sulphide minerals: a chemotactic response to
sulphur minerals? Environ Microbiol 2:324-332.
10. Fu B, Zhou H, Zhang R, Qiu G (2008) Bioleaching of chalcopyrite by pure and
mixed cultures of Acidithiobacillus spp. and Leptospirillum ferriphilum. Int J
Biodeteriat and Biodegrad 62:109-115.
11. McGuire MM, Edwards KJ, Banfield JF, Hamers RJ (2001) Kinetics, surface
chemistry, and structural evolution of microbially mediated sulfide mineral
dissolution. Geochem Cosmochim Acta 65:1243-1258.
58
12. Zhou QG, Bo F, Bo ZH, Xi L, Jian G, Fei LF, Hau CH (2007) Isolation of a strain
of Acidithiobacillus caldus and its role in bioleaching of chalcopyrite. World J
Microbiol Biotechnol 23:1217-1225.
13. Burckhard SR, Schwab AP, Banks MK (1995) The effects of organic acids on the
leaching of heavy metals from mine tailings. J Hazard Mat 41:135-145.
14. Gu XY, Wong JWC (2004) Identification of inhibitory substances affecting
bioleaching of heavy metals from anaerobically digested sewage sludge. Eniviron
Sci Technol 38:2934-2939.
15. Gu XY, Wong JWC (2007) Degradation of inhibitory substances by heterotrophic
microorganisms during bioleaching of heavy metals from anaerobically digested
sewage sludge. Chemosphere 69:311–318.
16. Marchland EA, Silverstein J (2003) The role of enhanced heterotrophic bacterial
growth on iron oxidation by Acidithiobacillus ferrooxidans. Geomicrobiol J
20:231–244.
17. Olson GJ, Brierley JA, Brierley CL (2003) Bioleaching review. Part B: Progress
in bioleaching: Applications of microbial processes by the mineral industries.
Appl Microbiol Biotechnol 63:249–257.
18. Ingledew WJ, Poole RK (1982) Thiobacillus ferrooxidans: The bioenergetics of
an acidophilic chemolithotroph. Biochem Biophys Acta 683:89-117.
19. Tuttle JH, Dugan PR, Apel WA (1977) Leakage of cellular material from
Thiobacillus ferrooxidans in the presence of organic acids. Appl Environ
Microbiol 33:459-469.
20. Schnaitman C, Lundgren D 1965 Organic compounds in the spent medium of
Ferrobacillus ferrooxidans. Can J Microbiol 1:23-27.
21. Aston JA, Apel WA, Lee BD, Peyton BM (2009) Toxicity of select organic acids
to the slightly thermophilic acidophile Acidithiobacillus caldus. Environ Toxicol
Chem 28:279-286.
22. Borischewski RM (1967) Keto acids as growth-limiting factors in autotrophic
growth of Thiobacillus thiooxidans. J Bacteriol 93:597-599.
24. Matin A (1978) Organic nutrition of chemolithotrophic bacteria. Annu Rev
Microbiol 32:433-468.
59
25. Valdes J, Pedroso I, Quatrini R, Holmes DS (2008) Comparative genome analysis
of Acidithiobacillus ferrooxidans, A. thiooxidans and A. caldus: insights into their
metabolism and ecophysiology. Hydrometallurgy 94:180-184.
26. Valdes J, Quatrini R, Hallberg K, Dopson M, Valenzuela PDT, Holmes DS
(2009) Draft genome sequence of the extremely acidophilic bacterium
Acidithiobacillus caldus ATCC 51756 reveals metabolic versatility in the genus
Acidithiobacillus. J Bact 191:5877-5878.
27. Pronk JT, Mejer WM, Hazeu W, van Dijken JP, Bos P, Kuenen JG (1991)
Growth of Thiobacillus thiooxidans on formic acid. Appl Environ Microbiol
57:2057-2062.
28. Richard HT, Foster JW (2003) Acid resistance in Escherichia coli. Adv Appl
Microbiology 52:167-184.
29. Yilmaz EI (2003) Metal tolerance and biosorption capacity of Bacillus circulans
strain EB1. Res Microbiology 154:409-415.
30. Pronk JT, Meesters PJW, van Dijken JP, Bos P, Kuenen JG (1989) Heterotrophic
growth of Thiobacillus acidophilus in batch and chemostat cultures.
Microbiology 153:392-398.

60
CHAPTER FOUR
LEAD, ZINC, AND COPPER TOXICITY TO ACIDITHIOBACILLUS CALDUS
STRAIN BC13
Abstract
This study reports the single and combined toxicity of lead, zinc, and copper to
BC13. The observed IC50s, ± 95% confidence intervals, for lead, zinc, and copper were
0.9 ± 0.1 mM, 39 ± 0.5 mM, and 120 ± 8 mM, respectively. The observed minimum
inhibitory concentrations (MIC) for lead, zinc, and copper were 7.5 mM, 75 mM, and 250
mM, respectively. When metals were presented in binary mixtures, the toxicities were
less than additive. For example, when 50% of the lead MIC and 50% of the copper MIC
were presented together, the specific growth rate was inhibited by only 59 ± 3%, rather
than 100%. In addition, the presence of ferrous iron in the growth media decreased lead
and zinc toxicity to BC13.
The importance of inoculum history was evaluated by pre-adapting cultures
through subsequent transfers in the presence of lead, zinc, or copper at their respective
IC50s. After pre-adaptation, cultures had specific growth rates 39 ± 11, 32 ± 7, and 28 ±
12% higher in the presence of lead, zinc, and copper IC50s, respectively, compared to
cultures that had not been pre-adapted. In addition, when cells exposed to the MIC of
lead, zinc, or copper were harvested, washed, and re-inoculated into fresh, metal-free
medium, they grew at near normal growth rates, showing that the cells remained viable
with no observed residual toxicity.
61
Finally, metal chlorides showed more toxicity than metal sulfates, and studies
using sodium chloride or a mixture of metal sulfates and sodium chloride suggested that
this was due to an additive combination of the metal and chloride toxicities.
Introduction
At. caldus is a Gram-negative bacterium that oxidizes sulfur and reduced sulfur
compounds for energy, and can fix carbon dioxide as a sole carbon source [1-2]. At.
caldus grows from pH 1-4, with optimal growth between pH 2 and 3, and from 32-50°C,
with optimal growth at 45°C [1]. These traits make At. caldus well suited for growth in
many biomining systems [3-6], where recent studies suggest that it may play a significant
role in metal mobilization. McGuire et al. (2001) reported that microbial communities
containing At. caldus were observed to leach more iron from pyrite, arsenopyrite, and
marcasite than communities without At. caldus [7]. Dopson and Lindstrom (1999)
reported that twice as much iron was leached from arsenopyrite when an iron oxidizer,
Sulfobacillus thermosulfidooxidans, was co-cultured with At. caldus, as compared to
when S. thermosulfidooxidans was cultured alone [8]. In addition, At. caldus was
observed to enhance copper recovery by oxidizing sulfur formed during the biomining of
chalcopyrite [9]. These studies suggest an important role for At. caldus in commercial
biomining, yet there have been few direct studies of metal interactions and toxicities to
At. caldus.
The toxicity of metals to microorganisms has been well documented and there
have been several general reviews written covering this subject [i.e. 10-15]. Specific to
62
the work presented here, multiple studies have reported that the related microorganisms,
At. ferrooxidans and At. thiooxidans, have relatively high tolerance to zinc and copper
when presented individually [16-21], or combined [18,22]. However, toxicity studies
with At. caldus have largely been limited to the metalloid arsenic [23-25]. Recent work
by Watkin et al. compared iron, copper, zinc, nickel, and cobalt tolerances of several new
isolates to those of several known strains, including At. caldus strain KU, but in depth
inhibition studies were not done [26].
The present study is a comprehensive report on the effects of lead, zinc, and
copper on the growth of BC13, including; 1) effects of single versus combined metal
toxicity, 2) effects of high ferrous iron concentrations on lead, zinc, and copper toxicity,
3) effects of prior exposure to lead, zinc, and copper, and 4) comparisons of metal sulfate
and metal chloride toxicity. This report significantly increases the current understanding
of At. caldus, an important microorganism to biomining and acid-mine drainage.
Materials and Methods
Microorganism and Growth Conditions
BC13 (ATCC 51757) was grown in a basal salts medium [1]. The medium was
autoclaved for 15 minutes at 121°C and 22 psig, and the pH was then adjusted to 2.5
using 6N sulfuric acid. A filter sterilized (0.2 m) metal sulfate solution (lead, zinc, or
copper) was added from a stock solution. The concentrations of metal in the stock
solutions were adjusted to ensure that an equal volume could be added to each flask. A
filter sterilized (0.2 m) solution of potassium tetrathionate was then added to a

63
concentration of 5 mM, as an electron donor, and ambient carbon dioxide provided the
sole carbon source. Cells preserved at 4°C in nanopure water (17.4 M with the pH
adjusted to 3.0 using 6N sulfuric acid, provided the initial inoculum. Aliquots that
provided initial cell densities of approximately 5 x 10⁷ cells mL
-1 were used. Cells were
cultured in 125-mL Erlenmeyer flasks (75 mL medium volume), fitted with foam
stoppers, and shaken at 150 rpm in a temperature controlled incubator at 45°C. Cell
concentrations were measured at 12 hour intervals, and each experiment was repeated in
triplicate so that average values and 95% confidence intervals could be calculated.
Determining Single Metal Toxicity
Cell concentrations were measured using direct cell counts with a Petroff-
counting chamber (Hausser Scientific, Horsham, PA, U.S.A.) and a phase-contrast
microscope (Zeiss, Thornwood, N.Y., U.S.A.). The observed specific growth rates were
used to quantify inhibition. Linear regressions were used to calculate IC50s and
corresponding 95% confidence intervals. In addition, the no observable effect
concentration (NOEC), lowest observable effect concentration (LOEC), and MIC were
determined graphically.
Determining Combined Metal Toxicity
To determine combined metal toxicity, binary mixtures of lead and zinc, lead and
copper, and zinc and copper were prepared. Concentrations were proportional to their
respective MICs and, assuming additive toxicities, mixed to produce a total metal
concentration proportional to an effective MIC. For example, to produce a mixture
64
containing lead and zinc equivalent to 50% of an effective MIC, the final growth medium
would contain:22
5.0 ZnPb MICMIC. Linear regressions were used to calculate
expected toxicities using the LINEST function in Microsoft Excel. From these
regressions, estimated contributions towards the total effective toxicity from each metal
were calculated.
Similar experiments were conducted to determine if ferrous iron affected the
toxicity of lead, zinc, or copper to BC13. Each metal was added to a concentration equal
to its previously calculated IC50, and ferrous iron sulfate was added to concentrations of
0, 25, 50, 75, or 100 mM. The concentration of ferrous iron in each stock was adjusted
so that an equal volume was added to each flask. Lead, zinc, and copper-free controls
were performed to determine if ferrous iron alone affected BC13 in the absence of lead,
zinc, or copper.
Determining Effects of Previous Metal Exposure
Cells were prepared as described earlier and inoculated into growth medium
containing lead, zinc, or copper concentrations equal to the previously calculated IC50.
During the late-log growth phase, cells were harvested and washed as previously
described, then inoculated into fresh medium containing the same metal concentration.
This process was repeated three subsequent times to allow cells to adapt to lead, zinc, or
copper. During the fourth growth cycle, cell concentrations were measured using direct
counts as described previously, and the specific growth rates were calculated.

65
Determining Metal Chloride Toxicity
Cells were prepared as described previously, but metal chlorides were used
instead of metal sulfates. Chloride salts of lead, zinc, or copper were introduced at initial
concentrations equal to the previously calculated IC50s of the respective metal sulfate
counterparts. To determine if chloride ions contributed directly to cell inhibition, sodium
chloride was added to metal-free growth media at concentrations of 0, 50, 100, and 200
mM. In control experiments, lead, zinc, or copper sulfates were added at the previously
calculated IC50s, and sodium chloride was also added to concentrations of 0, 50, 100,
150, or 200 mM. In these experiments, cell concentrations were measured as described
previously, and specific growth rates were calculated for comparison.
Modeling Metal Complexation and Precipitation
Visual MINTEQ (version 2.53) software was used to predict complexation and
precipitation of media components using activities from the Debye-Huckel Equation and
the default MINTEQA2 thermodynamic database. The temperature was set to 45°C and
the proton concentration was calculated from the pH, which was set at 2.50. The
saturation index (defined as the log of the ion activity divided by the solubility product)
was used to predict metal precipitation. Compounds with a positive saturation index
were set to infinite saturation, to allow for their precipitation. Each experimental medium
condition tested was modeled in this manner.
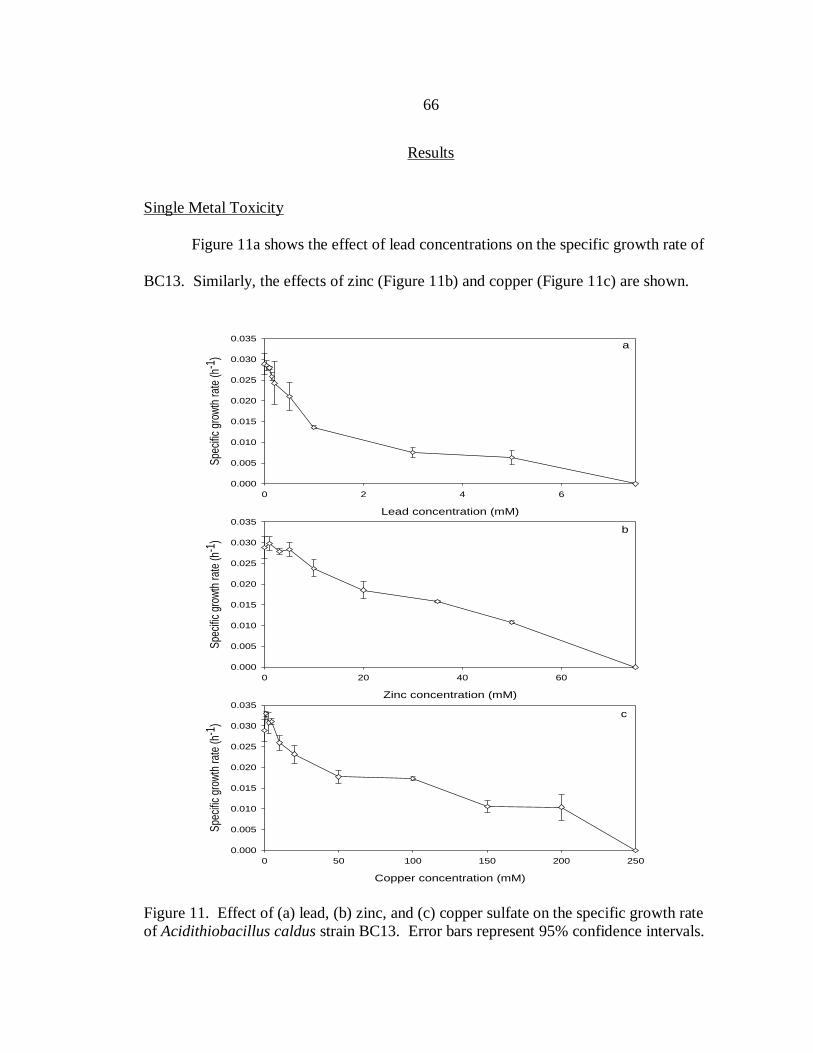
66
Results
Single Metal Toxicity
Figure 11a shows the effect of lead concentrations on the specific growth rate of
BC13. Similarly, the effects of zinc (Figure 11b) and copper (Figure 11c) are shown.
Copper concentration (mM)
0 50 100 150 200 250
Spe
cific
gro
wth
rat
e (h
-1)
0.000
0.005
0.010
0.015
0.020
0.025
0.030
0.035c
Zinc concentration (mM)
0 20 40 60
Spe
cific
gro
wth
rat
e (h
-1)
0.000
0.005
0.010
0.015
0.020
0.025
0.030
0.035b
Lead concentration (mM)
0 2 4 6
Spe
cific
gro
wth
rat
e (h
-1)
0.000
0.005
0.010
0.015
0.020
0.025
0.030
0.035a
Figure 11. Effect of (a) lead, (b) zinc, and (c) copper sulfate on the specific growth rate
of Acidithiobacillus caldus strain BC13. Error bars represent 95% confidence intervals.
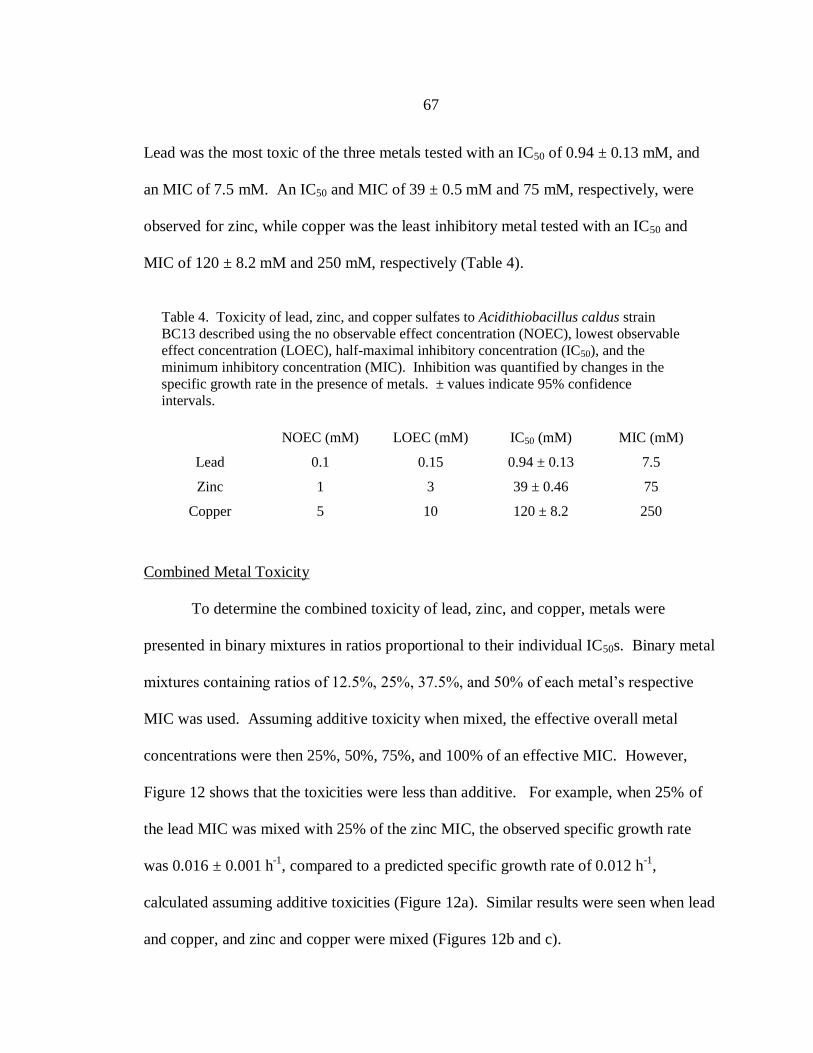
67
Lead was the most toxic of the three metals tested with an IC50 of 0.94 ± 0.13 mM, and
an MIC of 7.5 mM. An IC50 and MIC of 39 ± 0.5 mM and 75 mM, respectively, were
observed for zinc, while copper was the least inhibitory metal tested with an IC50 and
MIC of 120 ± 8.2 mM and 250 mM, respectively (Table 4).
Table 4. Toxicity of lead, zinc, and copper sulfates to Acidithiobacillus caldus strain
BC13 described using the no observable effect concentration (NOEC), lowest observable
effect concentration (LOEC), half-maximal inhibitory concentration (IC50), and the
minimum inhibitory concentration (MIC). Inhibition was quantified by changes in the
specific growth rate in the presence of metals. ± values indicate 95% confidence
intervals.
NOEC (mM) LOEC (mM) IC50 (mM) MIC (mM)
Lead 0.1 0.15 0.94 ± 0.13 7.5
Zinc 1 3 39 ± 0.46 75
Copper 5 10 120 ± 8.2 250
Combined Metal Toxicity
To determine the combined toxicity of lead, zinc, and copper, metals were
presented in binary mixtures in ratios proportional to their individual IC50s. Binary metal
mixtures containing ratios of 12.5%, 25%, 37.5%, and 50% of each metal‟s respective
MIC was used. Assuming additive toxicity when mixed, the effective overall metal
concentrations were then 25%, 50%, 75%, and 100% of an effective MIC. However,
Figure 12 shows that the toxicities were less than additive. For example, when 25% of
the lead MIC was mixed with 25% of the zinc MIC, the observed specific growth rate
was 0.016 ± 0.001 h-1
, compared to a predicted specific growth rate of 0.012 h-1
,
calculated assuming additive toxicities (Figure 12a). Similar results were seen when lead
and copper, and zinc and copper were mixed (Figures 12b and c).

68
Effective metal concentration of zinc-copper mixture assuming additive toxicity (% of MIC)
0 20 40 60 80 100
Speci
fic g
row
th r
ate
inhib
ition (
%)
0
20
40
60
80
100 Observed inhibition
Expected inhibition assuming additive toxicity
c
Effective metal concentration of lead-copper mixture assuming additive toxicity (% of MIC)
0 20 40 60 80 100
Speci
fic g
row
th r
ate
inhib
ition (
%)
0
20
40
60
80
100 Observed inhibition
Expected inhibition assuming additive toxicity
b
Effective metal concentration of lead-zinc mixture assuming additive toxicity (% of MIC)
0 20 40 60 80 100
Speci
fic g
row
th r
ate
inhib
ition (
%)
0
20
40
60
80
100 Observed inhibition
Expected inhibition assuming addittive toxicity
a
Figure 12. Observed inhibition compared to predicted inhibition, assuming additive
toxicity, of binary mixtures of (a) lead and zinc, (b) lead and copper, and (c) zinc and
copper to strain Acidithiobacillus caldus BC13. The x-axis represents the percentage of
the minimum inhibitory concentration (MIC) calculated assuming additive effects. Error
bars represent 95% confidence intervals. The MIC concentrations for lead, zinc, and
copper were 7.5, 75, and 250 mM, respectively.

69
Effect of Ferrous Iron on Metal Toxicity
Ferrous iron gave significant protection to BC13 from lead and zinc toxicity.
Figure 13 shows that cultures exposed to a concentration of lead equal to the IC50,
exhibited specific growth rates of 0.014 ± 0.001, 0.032 ± 0.001, and 0.030 ± 0.001 h-1
when ferrous iron was added to concentrations of 0, 50, and 100 mM, respectively.
Similarly, the observed specific growth rates of cultures in the presence of the zinc IC50
were 0.016 ± 0.001, 0.023 ± 0.001, and 0.028 ± 0.001 h-1
when ferrous iron was added to
0, 50, and 100 mM, respectively. However, when this experiment was
Iron-only Lead + iron Zinc + iron Copper + iron
Specific
gro
wth
rate
(h
-1)
0.000
0.005
0.010
0.015
0.020
0.025
0.030
0.035
0 mM Iron (II)
25 mM Iron (II)
50 mM Iron (II)
75 mM Iron (II)
100 mM Iron (II)
Figure 13. The effect of ferrous iron added to concentrations of 0, 25, 50, 75, or 100 mM
on lead, zinc, and copper toxicity to Acidithiobacillus caldus strain BC13 when added at
concentrations equal to the previously calculated half-maximal inhibition concentrations
(0.94 mM, 39 mM, and 120 mM for lead, zinc, and copper, respectively). Error bars
represent 95% confidence intervals.
70
performed using copper, the effect was significantly decreased, as observed specific
growth rates were 0.017 ± 0.001, 0.014 ± 0.000, and 0.019 ± 0.001 h-1
when ferrous iron
was added to concentrations of 0, 50, and 100 mM, respectively (Figure 13). In separate
control experiments, ferrous iron was added to concentrations of 0, 50, and 100 mM with
no lead, zinc, or copper added. At these concentrations, the observed specific growth
rates were 0.030 ± 0.001, 0.030 ± 0.001, and 0.028 ± 0.001 h
-1; suggesting that ferrous
iron did not significantly affect the growth of BC13 by itself (Figure 13). MINTEQ
modeling predicted that over 96% of the iron remained as aqueous ferrous iron at the
concentrations used in this study.
Effect of Prior Metal Exposure on Metal Toxicity
Figure 14 shows that the specific growth rate increased 39 ± 11, 32 ± 7, and 28 ±
12% when cultures were pre-adapted, through subsequent transfers, to lead, zinc, or
copper, respectively. In addition to increased specific growth rates, the lag phase of
cultures pre-adapted to lead, zinc, or copper decreased by 12, 24, and 48 hours,
respectively (Appendix G).
Figure 15 shows that cells collected from media containing the MIC of lead, zinc,
or copper were able to resuscitate and grow in fresh, metal-free, medium. After being
exposed for 120 hours to the MIC of lead, then re-inoculated into fresh, metal-free
medium, cultures grew with no residual inhibition, and attained a final cell concentration
of 107 ± 7% of the final cell concentration observed for cultures that had not been
exposed to lead. However, when cells were collected from medium containing the MIC
of zinc or copper after 120 hours of exposure, and re-inoculated into fresh, metal-free
71
Lead Zinc Copper
Specific
gro
wth
rate
(h
-1)
0.000
0.005
0.010
0.015
0.020
0.025
No previous exposure
Previous exposure
Figure 14. Effect of prior exposure to lead, zinc, and copper on the specific growth rate
of Acidithiobacillus caldus strain BC13. Cells were adapted through subsequent
culturing and transfers in the presence of the half-maximal inhibitory concentrations of
lead, zinc, or copper (0.94 mM, 39 mM, and 120 mM, respectively). Error bars represent
95% confidence intervals.
medium, the cultures grew to final cell concentrations of only 83 ± 1% and 83 ± 23% of
the final cell concentration observed in cultures with no prior exposure to zinc or copper,
respectively. The observed specific growth rates of cells exposed to MICs of lead, zinc,
and copper for 120 hours were 0.032 ± 0.003, 0.028 ± 0.002, and 0.030 ± 0.003 h-1
,
respectively, after being re-inoculated into fresh, metal-free medium. Cells that had not
been pre-treated by the MICs of lead, zinc, or copper, exhibited an observed specific
growth rate of 0.029 ± 0.003, suggesting that there were no significant residual affects on
the observed specific growth rates (Appendix G).
72
Elapsed time (h)
0 20 40 60 80 100 120
Ce
ll co
nce
ntr
atio
n (
cells
mL
-1)
0.0
5.0e+7
1.0e+8
1.5e+8
2.0e+8
2.5e+8
3.0e+8
3.5e+8
4.0e+8
No previous metal exposure
Exposed to the lead MIC
Exposed to the zinc MIC
Exposed to the copper MIC
Figure 15. Growth of Acidithiobacillus caldus strain BC13 in metal-free cultures after
cells were harvested from cultures containing minimum inhibitory concentrations of lead,
zinc, or copper, or 7.5, 75, and 250 mM, respectively. Error bars represent 95%
confidence intervals.
Comparison of Metal Chloride and Metal Sulfate Toxicity
Figure 16 shows that when lead, zinc, and copper chlorides were added at
concentrations equal to the IC50s of their respective sulfates, the observed specific growth
rates were lower than those observed for the metal sulfates. For lead, this difference was
relatively minor, 0.012 ± 0.001 h-1
versus 0.014 ± 0.000 h-1
, respectively. However, in
the case of zinc and copper, the differences were more pronounced. The specific growth
rate observed when zinc chloride was used was 0.012 ± 0.001 h-1
, compared to 0.016 ±
0.000 h-1
when zinc sulfate was added. Similarly, the specific growth rate observed when
copper chloride was added was 0.012 ± 0.000 h-1
, compared to 0.017 ± 0.001 h-1
when
copper sulfate was used.
73
Lead Zinc Copper
Specific
gro
wth
rate
(h
-1)
0.000
0.002
0.004
0.006
0.008
0.010
0.012
0.014
0.016
0.018
0.020
MeSO4
MeCl
MeSO4 + NaCl
Figure 16. Effect of lead, zinc, and copper on the specific growth rate of
Acidithiobacillus caldus strain BC13 when added as either metal sulfates, metal
chlorides, or as metal sulfates with a corresponding concentration of sodium chloride. In
each case, metals were added to concentrations equal to previously calculated half-
maximal inhibition concentrations for the corresponding metal sulfates, or 0.94 mM, 39
mM, and 120 mM, for lead, zinc, and copper, respectively. Error bars represent 95%
confidence intervals.
The specific growth rate of BC13 also decreased when only sodium chloride was
added to metal-free medium. When sodium chloride was added to concentrations of 0,
50, 100, and 200 mM, the specific growth rates were 0.029 ± 0.002, 0.027 ± 0.001, 0.023
± 0.001, and 0.021 ± 0.001h-1
, respectively. In other experiments, lead, zinc, and copper
sulfate was added to concentrations equal to their respective IC50s, and the sodium
chloride concentration was varied. The inhibition observed in these tests suggested that
the metal-chloride toxicity effects are additive (Figure 17).
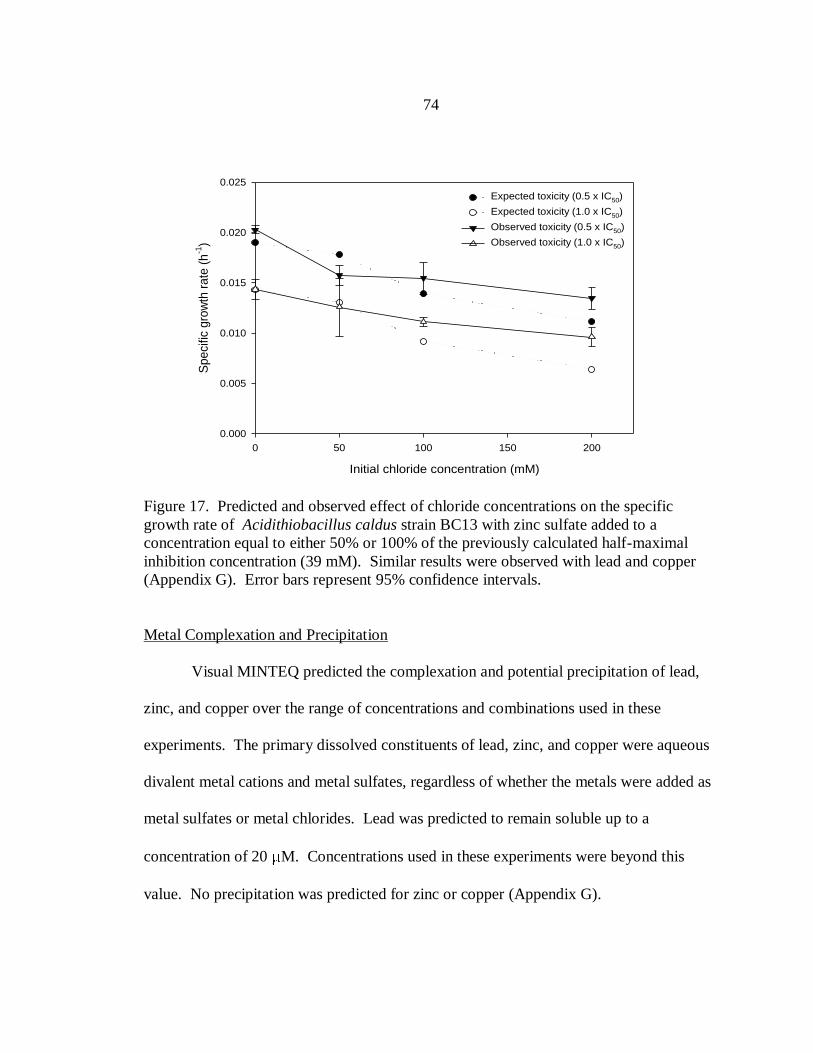
74
Initial chloride concentration (mM)
0 50 100 150 200
Sp
ecific
gro
wth
ra
te (
h-1
)
0.000
0.005
0.010
0.015
0.020
0.025
Expected toxicity (0.5 x IC50)
Expected toxicity (1.0 x IC50)
Observed toxicity (0.5 x IC50)
Observed toxicity (1.0 x IC50)
Figure 17. Predicted and observed effect of chloride concentrations on the specific
growth rate of Acidithiobacillus caldus strain BC13 with zinc sulfate added to a
concentration equal to either 50% or 100% of the previously calculated half-maximal
inhibition concentration (39 mM). Similar results were observed with lead and copper
(Appendix G). Error bars represent 95% confidence intervals.
Metal Complexation and Precipitation
Visual MINTEQ predicted the complexation and potential precipitation of lead,
zinc, and copper over the range of concentrations and combinations used in these
experiments. The primary dissolved constituents of lead, zinc, and copper were aqueous
divalent metal cations and metal sulfates, regardless of whether the metals were added as
metal sulfates or metal chlorides. Lead was predicted to remain soluble up to a
concentration of 20 M. Concentrations used in these experiments were beyond this
value. No precipitation was predicted for zinc or copper (Appendix G).

75
MINTEQ modeling results and the multi-variant statistical software MINITAB,
and compared against changes in the corresponding observed specific growth rates.
Matrix plots and primary component analyses suggested that for all the metals, only
changes in the total metal concentrations correlated strongly with changes in observed
specific growth rates, and that speciation was not a significant factor (Appendix G).
Discussion
Single toxicity of Lead, Zinc, and Copper
BC13 grew in millimolar concentrations of lead, zinc, and copper, with lead being
the most inhibitory metal tested, with an MIC of 7.5 mM. Interestingly, At. caldus has
not been isolated from environments containing high levels of galena [27]; and results
reported here suggest that these environments may contain lead concentrations too high
for significant At. caldus activity (Figure 11a). BC13 exhibited relatively high tolerances
for zinc and copper, with MICs of 75 and 250 mM (Figures 11b and c). This is not
surprising as many of the environments where At. caldus has been identified have high
concentrations of zinc and copper [4,27-29].
Previous work with At. caldus strain KU reported MIC values of 65 g L-1
(993.9
mM) for zinc, and only 1.5 g L-1
(23.6 mM) for copper [26], suggesting a zinc tolerance
significantly higher than that observed here, and a copper tolerance significantly lower.
The previous work did not report methods for quantifying growth, or describe the growth
medium used [26], making a direct comparison difficult. These differences may be due
to strain to strain variance in metal tolerance, medium composition, or possibly inoculum
76
history. Regardless, it is apparent that BC13 and strain KU are quite tolerant to zinc and
copper.
Comparisons with Other Acidithiobacilli
High resistance to zinc and copper is not unprecedented among the
acidithiobacilli. Aside from previous work with At. caldus strain KU [26], At.
ferrooxidans has been observed to grow on ground sulfur in a medium containing 100
mM copper [30], and can facilitate spalerite leaching in the presence of 25 mM zinc, and
chalcopyrite leaching in the presence of 10-25 g L-1
of copper (158-397 mM) [18,30].
Barreira et al. [16] and Chen et al. [17] made similar observations while working with At.
thiooxidans.
With observed MIC values of 75 mM and 250 mM for zinc and copper,
respectively, the present study suggests that BC13 has a similar level of tolerance to zinc
and copper as At. ferrooxidans and At. thiooxidans. However, it is important to note key
differences between this work and previous work with acidithiobacilli. First, the present
study used a soluble substrate (tetrathionate). Conversely, previous work with
acidithiobacilli species used solid substrates, which may encourage the formation of
biofilms and provide some protection from metals [31]. Secondly, the present study
characterized inhibition with respect to cell growth, rather than leaching kinetics.
Effects of Combined Metals
Metals presented in binary mixtures exhibited less than additive toxicity towards
BC13, suggesting an aspect of competitive inhibition (Figure 12). In addition, the
77
apparent dampening effect of ferrous iron on lead, zinc, and copper toxicity (Figure 13) is
also quite interesting, given that many environments where At. caldus has been isolated
from also contain high concentrations of iron, both reduced and oxidized, relevant to the
concentrations used in this study [i.e. 4,27-29]. This suggests that BC13 may exhibit
catabolic activity (i.e. leaching) in environments containing lead, zinc, and copper
concentrations higher than the respective MIC values reported here. Previous studies
have also observed less than additive toxicity effects of binary-metal systems. Gikas et
al. observed that nickel(II) and cobalt(II) exhibited similar individual toxicities to
microbes growing in an activated sludge, however when presented in combination, their
toxicities were significantly reduced [32].
Effect of Inoculum History
One aspect of cell culturing that is often overlooked in toxicity studies is
inoculum history. In the current study, pre-adaption to lead, zinc, or copper increased
specific growth rates of BC13 significantly when subsequently exposed to heavy metals
(Figure 14). Similar results have been observed by others [i.e., 33-35], and may indicate
higher tolerances in in situ environments where species have had prolonged exposure to
metals.
Another aspect of prior metal exposure examined here was the effect of prior
exposure to the MIC of lead, zinc, and copper. Cells harvested from these conditions did
grow when re-inoculated into fresh, metal-free medium (Figure 15), suggesting that lead,
zinc, and copper may simply slow cell growth, perhaps through increased energy
requirements. However, when cells were collected from MIC exposures to zinc or

78
copper, they did not grow as well as cells collected from MIC exposure to lead (Figure
15). This may be due to residual metal strongly bound to the cells. As is discussed in
chapter five, BC13 has larger sorption capacities for zinc and copper than lead. The
ability of BC13 to adapt to heavy-metals, and be resuscitated from exposure to heavy-
metal MICs may suggest that cells are viable and metabolically active in environments
containing lead, zinc, or concentrations significantly higher than the MICs observed
when these metals are presented individually.
Metal Sulfate versus Metal Chloride Toxicity
Figure 16 shows the increased toxicity of metal chlorides over metal sulfates, and
Figure 17 suggests that this is due to additive toxicity, as additional experiments showed
that chloride itself was inhibitory to BC13. This may explain why lead chloride toxicity
was not significantly different than lead sulfate, as corresponding the chloride
concentration would have been only 1.9 mM, which was not observed to be toxic when
sodium chloride was added in the absence of lead, zinc, or copper (Appendix G).
Conversely, the chloride concentrations associated with zinc and copper chlorides (78
and 240 mM) were toxic even in the absence of metals. This idea is supported by past
work that reported chloride inhibition towards the acidithiobacilli [36], and although the
chloride concentrations necessary to achieve this effect are not necessarily relevant to
natural environments containing At. caldus [28,29], these results do emphasize the
importance of metal salts chosen for inhibition studies.

79
Conclusions
This is the first comprehensive report on lead, zinc, or copper toxicity to At.
caldus, and the first study reporting the toxicity of lead to any acidithiobacilli. The order
of toxicity observed here was copper < zinc < lead, and the relatively high tolerance
observed to zinc and copper were comparable to those observed in other acidithiobacilli
[16-18,30]. Additional studies using binary-metal mixtures and high ferrous iron
concentrations were carried out to better relate the single metal toxicity observations to in
situ realities. Interestingly, these studies suggested that binary-metal mixtures, and the
presence of ferrous iron, significantly decreased the toxicity of lead and zinc to BC13. In
addition, inoculum history was an important factor in metal tolerance, as cells adapted to
lead, zinc, and copper through subsequent culturing showed significantly increased
tolerance to these metals. Combined, these results may suggest that BC13 may grow and
be metabolically active in in situ environments containing lead, zinc, or copper
concentrations higher than the MICs observed here when these metals were presented
individually.
Finally, a comparison of metal sulfate versus metal chloride toxicity suggested
that metal sulfates were much less toxic to BC13, as chloride ions exhibited an inhibitory
effect of their own, which was approximately additive with that of lead, zinc, or copper.
Acidophilic chemolithoautotrophs play important roles in acid-mine systems due
to their tolerance [37] and mobilization of metals [38,39]. This study improves the
understanding of one such microorganism, BC13, and may lead the way for future
research of specific toxicity mechanisms and metal-regulated protein expression.
80
References
1. Hallberg KB, Lindstrom EB (1994) Characterization of Thiobacillus caldus sp.
nov., a moderately thermophilic acidophile. Microbiology 140:3451-3456.
2. Dopson M, Lindstrom EB, Hallberg KB (2002) ATP generation during reduced
inorganic sulfur compound oxidation by Acidithiobacillus caldus is exclusively
due to electron transport phosphorylation. Extremophiles 6:123-129.
3. Burton NP, Norris PR (2000) Microbiology of acidic, geothermal springs of
Montserrat: environmental rDNA analysis. Extremophiles 4:315-320.
4. Druschel GK, Baker BJ, Gihiring TM, Banfield JF (2004) Acid mine drainage
biogeochemistry at Iron Mountain, California. Geochem Trans 5:12-32.
5. Goebel BM, Stackebrandt E (1994) Cultural and phylogenetic analysis of mixed
microbial populations found in natural and commercial bioleaching environments.
Appl Environ Microbiol 60:1614-1621.
6. Okibe N, Gericke M, Hallberg KB, Johnson DB (2003) Enumeration and
characterization of acidophilic microorganisms isolated for a pilot plant stirred-
tank bioleaching operation. Appl Environ Microbiol 69:1936-1943.
7. McGuire MM, Edwards KJ, Banfield JF, Hamers RJ (2001) Kinetics, surface
chemistry, and structural evolution of microbially mediated sulfide mineral
dissolution. Geochem Geophys Geosyst 65:1243-1258.
8. Dopson M, Lindstrom EB (1999) Potential role of Thiobacillus caldus in
arsenopyrite bioleaching. Appl Environ Microbiol 65:36-40.
9. Zhou QG, Bo F, Bo ZH, Xi L, Jian G, Fei LF, Hau CH (2007) Isolation of a strain
of Acidithiobacillus caldus and its role in bioleaching of chalcopyrite. World J
Microbiol Biotechnol 23:1217-1225.
10. Gadd GM, Griffiths AT (1978) Microorganisms and heavy metal toxicity.
Microb Ecol 4:303-317.
11. Nies DH (1999) Microbial heavy-metal resistance. Appl Microbiol Biotechnol
51:730-750.
12. Nies DH (2000) Heavy metal-resistant bacteria as extremophiles: molecular
physiology and biotechnological use of Ralstonia sp CH34. J Bacteriol
182:1390-1398.
81
13. Nies DH (2003) Efflux-mediated heavy metal resistance in prokaryotes. FEMS
Microbiol Rev 23:313-339.
14. Silver S (1996) Bacterial resistance to toxic ions - a review. Gene 179:9-19.
15. Wood JM, Wang HK (1983) Microbial resistance to heavy metals. Environ Sci
Technol 17:582-590.
16. Barreira RPR, Villar LD, Garcia O (2005) Tolerance to copper and zinc of
Acidithiobacillus thiooxidans isolated from sewage sludge. World J Microbiol
Biotechnol 21:89-91.
17. Chen BY, Chen YW, Wu DJ, Cheng YC (2003) Metal toxicity assessment upon
indigenous Thiobacillus thiooxidans BC1. Environ Eng Sci 20:375-385.
18. Das A, Modak JM, Natarajan KA (1997) Studies on multi-metal ion tolerance of
Thiobacillus ferrooxidans. Miner Eng 10:743-749.
19. Leduc LG, Ferroni GD, Trevors JT (1997) Resistance to heavy metals in different
strains of Thiobacillus Ferrooxidans. World J Microbiol Biotechnol 13:453-455.
20. Natarajan KA, Sudeesha K, Rao GR (1994) Stability of copper tolerance in
Thiobacillus ferrooxidans. Antonie van Leeuwenhoek 66:303-306.
21. Tuovinen OH (1974) Studies on the growth of Thiobacillus ferrooxidans. II.
Toxicity of uranium to growing cultures and tolerance conferred by mutation,
other metal cations and EDTA. Arch Microbiol 95:153.
22. Hong-mei L, Jia-jun K (2001) Influence of Ni2+
and Mg2+
on the growth and
activity of Cu2+
-adapted Thiobacillus ferrooxidans. Hydrometallurgy 61:151-
156.
23. Dopson M, Lindstrom EB, Hallberg KB (2001) Chromosomally encoded
arsenical resistance of the moderately thermophilic acidophile Acidithiobacillus
caldus. Extremophiles 5:247-255.
24. Kotze AA, Tuffin IM, Deane SM, Rawlings DE (2006) Cloning and
characterization of the chromosomal arsenic resistance genes from
Acidithiobacillus caldus and enhanced arsenic resistance on conjugal transfer of
ars genes located on transposon TnAtsArs. Microbiology 152:3551-3560.
25. Tuffin M, Hector SB, Deane SM, Rawlings DE (2006) Resistance determinants of
a highly arsenic-resistant strain of Leptospirillum feriphilum isolated from a
commercial biooxidation tank. Appl Environ Microbiol 72:2247-2253.

82
26. Watkin ELJ, Keeling SE, Perrot FA, Shiers DW, Palmer ML, Watling HR (2009)
Metals tolerance in moderately thermophilic isolates from a spent copper sulfide
heap, closely related to Acidithiobacillus caldus, Acidimicrobium ferrooxidans
and Sulfobacillus thermosulfidooxidans. J Ind Microbiol Biotechnol 36:461-465.
27. Rawlings DE (2002) Heavy metal mining using microbes. Ann Rev Microbiol
56:65-91.
28. Banks D, Younger PL, Arnesen RT, Iversen ER Banks SB (1997) Mine-water
chemistry: the good, the bad and the ugly. Environ Geology 32:157-174.
29. Benner SG, Blowes DW, Gould WD, Herbert RB, Ptacek CJ (1999)
Geochemistry of a permeable reactive barrier for metals and acid mine drainage.
Environ Sci Technol 33:2793-2799.
30. Alvarez S, Jerez C (2004) Copper ions stimulate polyphosphate degradation and
phosphate efflux in Acidithiobacillus ferrooxidans. Appl Environ Microbiol
70:5177-5182.
31. Xu KD, McFeters GA, Stewart PS (2000) Biofilm resistance to antimicrobial
agents. Microbiology 146:547-549.
32. Gikas P (2007) Kinetic response of activated sludge to individual and joint nickel
(Ni(II)) and cobalt (Co(II)): an isobolographic approach. J Haz Mat 143:246-256.
33. Oorts KK (2006) Discrepancy of the microbial response to elevated copper
between freshly spiked and long-term contaminated soils. Environ Toxicol Chem
25:845-853.
34. Oorts KK (2007) Leaching and aging decrease nickel toxicity to soil microbial
processes in soils freshly spiked with nickel chloride. Environ Toxicol Chem
26:1130-1138.
35. Maderova L, Dawson JJC, Paton GI (2009) Cu and Ni mobility and
bioavailability in sequentially conditioned soils. Water Air Soil Pollut DOI
10.1007/s11270-009-0224-4
36. Kawabe Y, Chihiro I, Tadashi C (2000) Relaxation of chloride inhibition on the
biochemical activity of Thiobacillus ferrooxidans by Diatomaceous Earths. J
Mining and Mat Process Inst of Japan 116:198-202.
37. Dopson M, Baker-Austin C, Koppineedi PR, Bond PL (2003) Growth in sulfidic
mineral environments: metal resistance mechanisms in acidophilic
microorganisms. Microbiol 149:1959-1970.
83
38. Gadd GM (2000) Bioremedial potential of microbial mechanisms of metal
mobilization and immobilization. Cur Opin Biotech 11:271-279.
39. Veglio F, Beolchini F (1997) Removal of metals by biosorption: a review.
Hydrometallurgy 44:301-316.
84
CHAPTER 5
EFFECTS OF CELL CONDITION, PH, AND TEMPERATURE ON LEAD, ZINC,
AND COPPER SORPTION TO ACIDITHIOBACILLUS CALDUS STRAIN BC13
Abstract
This study describes the effects of cell condition, pH, and temperature on lead,
zinc, and copper sorption to BC13 with a Langmuir model. Copper exhibited the highest
loading capacity, 4.76 ± 0.28 mmol g-1
, to viable cells at pH 5.5. The highest binding-site
affinity observed was 61.2 ± 3.0 L mmol-1
to dehydrated cells at pH 4.0. The pHs that
maximized loading capacities and binding-site affinities were generally between 4.0 and
5.5, where the sum of free proton and complexed metal concentrations was near a
minimum. Of additional importance, lead, zinc, and copper sorbed to viable cells at pH
values as low as 1.5. Previous studies with other acidithiobacilli did not measure viable-
cell sorption below pH 4.0. In separate experiments, desorption studies showed that far
less copper was recovered from viable cells than any other metal or cell condition,
suggesting that uptake may play an important role in copper sorption by BC13. To
reflect an applied system, the sorption of metal mixtures was also studied. In these
experiments, lead, zinc, and copper sorption from a tertiary mixture were 40.2 ± 4.3, 28.7
± 3.8, and 91.3 ± 3.0%, respectively, of that sorbed in single metal systems.

85
Introduction
At. caldus is a thermophilic acidophile that oxidizes reduced sulfur compounds,
fixes carbon dioxide [1], has been isolated from several acidic environments [2-4], and is
believed to be important for leaching metals from mineral sulfides in acid-mine
environments [5-9]. Despite its important interactions with metals in such systems there
have been no metal sorption studies published to date with this organism.
Microbial sorption has been used as a relatively inexpensive tool for the
immobilization of heavy metals from many types of contaminated systems [10].
Relevant to the work presented here, studies have shown that At. thiooxidans and At.
ferrooxidans can remove heavy metals from contaminated soil and sewage systems [11-
13]. In addition, zinc and copper sorption to At. thiooxidans and At. ferrooxidans has
been studied by several researchers [14-17], and are important in metal mobilization and
transport [18]. However, these organisms are typically found at temperatures below
35°C, whereas At. caldus grows optimally at 45° [1]. This suggests that a metal sorption
study using At. caldus is very relevant to warmer systems.
Here, the sorption of lead, zinc, and copper to BC13 is described with a Langmuir
model. In contrast to most prior research, experiments were carried out using viable
cells, between pH 1.5 and 7.0, and from 25 to 45C°. Tests were also carried out with
dehydrated cells for comparison to previous work [14-17]. The effects of proton
competition and metal speciation were investigated with changing pH. In addition,
temperature effects were used to calculate the heat of sorption for lead, zinc, and copper
to BC13 . Finally, the sorption of metal mixtures to BC13 was measured to determine

86
how the presence of competing metals affected the sorption capacity of lead, zinc, and
copper. The use of viable cells and mixed metal systems provides an important
fundamental link between past results and the mixed metal systems found in acid-mine
drainage and many remediation applications. This study increases the understanding of
At. caldus‟ role in the fate and mobilization of metals and may lead the way for more
applied studies with this organism.
Materials and Methods
Culture and Cell Preparation
A basal salts medium [1] was prepared and autoclaved for 15 minutes at 121°C
and 22 psig, and allowed to cool to room temperature. A trace element solution [1] was
then added to a concentration of 1 mL L-1
, and a filter sterilized (0.2 m) potassium
tetrathionate was added to a concentration of 5 mM to provide an electron donor. The
medium pH was adjusted to 2.5 using 6N sulfuric acid, aliquoted into 500-mL serum
bottles (350 mL medium volume), and capped with butyl-rubber stoppers. A 20:80
mixture of carbon dioxide:nitrogen gas was sparged into the medium to a headspace
pressure of 5 psig to provide a carbon source. BC13 (ATCC 51757) cells preserved at
4°C in nanopure water (17.4 M with the pH adjusted to 3.0 using 6N sulfuric acid),
provided the initial inoculum). Cultures were grown aerobically at 45°C and shaken at
150 rotations per minute (rpm). Cells were harvested via centrifugation during the mid-
exponential growth phase and washed using the pH 3.0 nanopure water. This wash was
repeated three times to remove residual potassium tetrathionate.

87
Cell pellets for use in viable-cell sorption studies were re-suspended in a small
aliquot of the basal salts medium at a concentration of 1 g dry-cell weight L-1
. Cell
pellets for use in dehydrated-cell sorption studies were dried in a Samdri-795 critical
point dryer (Tousimis, Rockville, MD). Sorption experiments were done immediately to
avoid potential effects of cell storage.
The sorption experiments were carried out in the same basal salts medium, but
without potassium tetrathionate. A filter sterilized (0.2 m) metal solution (lead, zinc, or
copper sulfates) was added from a stock solution prepared in the medium. The pH was
adjusted to 1.5, 2.5, 4.0, 5.5, or 7.0, using either 6N sulfuric acid or 10N sodium
hydroxide. Following cell preparation, aliquots that provided an initial cell density of
100 mg dry-cell weight L-1
were added to 125-mL Erlenmeyer flasks (75 mL medium
volume) fitted with foam stoppers. Samples were shaken at 150 rpm at 25, 35, or 45°C in
a temperature controlled incubator.
Measurement of Aqueous Metal Concentrations
Filter sterilized (0.2 m) samples were taken and preserved at 4°C for analysis.
Inductively coupled plasma mass spectrometry (ICP-MS) (Agilent 7500ce ORS, Foster
City, CA, U.S.A.) using an Octopole Reaction System and a MicroMist glass concentric
nebulizer was used to measure metal concentrations. The sample temperature was set at
2°C and the radio frequency power was set to 1500 W. Argon was used as the carrier
gas, at a flow rate of 0.64 L min-1
. The nebulizer pump was operated at 0.15 rotations per
second (rps) and the sample pump was set to 0.1 rps. Measurements were compared with

88
standards to calculate metal concentrations. Germanium and indium were used as
internal standards to correct for drift over a series of runs.
Calculation of Sorption Parameters
The Langmuir Equation (Equation 5.1) is derived for monolayer sorption onto a
surface with a finite number of homogenous binding sites, where the occupation of one
site does not affect the binding affinity of adjacent sites.
eL
eLo
eCk
CkQQ
1 (5.1)
Where eQ is the concentration of sorbed metal at equilibrium, oQ is the maximum
amount of metal per unit sorbent required for a complete monolayer (loading capacity),
eC is the equilibrium metal concentration in solution, and Lk describes binding-site
affinity by Equation 5.2:
e
LC
k)1(
(5.2)
where is defined as the percent coverage of binding-sites.
Equation 5.1 may be re-written in the linear form:
oeLoe QCkQQ
111 (5.3)
Lineweaver-Burk plots of eQ
1 versus
eC
1 were used to calculate values for oQ and Lk .

89
Calculation of the Heat of Sorption
The Arrhenius Equation (Equation 5.4) was used to calculate the heat of lead,
zinc, and copper sorption to BC13.
])([ 1RTE
LaAek (5.4)
where A is the Arrhenius pre-exponential factor, aE is the activation energy, R is the
universal gas constant, and T is the absolute temperature. Because this is an equilibrium
calculation, aE represents the difference between the activation energy required for
sorption to occur, and the activation energy required for desorption to occur. This
difference is equal to the enthalpy of sorption )( sorptionH , assuming the thermal
expansivity of the solution is negligible. Therefore:
sorptiona HE (5.5)
Because Equation 5.4 may be re-written in the linear form:
RT
HAk
sorption
L )ln()ln( (5.6)
A plot of )ln( Lk versus RT
1has a slope equal to the negative heat of sorption, and a y-
intercept equal to the natural logarithm of the Arrhenius pre-exponential factor.
Desorption Experiments
Separate sorption experiments were done at 45ºC and either pH 1.5, 4.0, or 7.0.
At equilibrium, cells were collected via centrifugation, and re-suspended in fresh basal
salts medium containing 5 mM nitrilotriacetic acid (NTA). This solution was placed in a

90
temperature controlled incubator at 45ºC and shaken at 150 rpm until the system
equilibrated. Filter sterilized (0.2 m) samples were taken and preserved at 4°C for
analysis using ICP-MS. In these experiments, results were compared between whole and
lysed cells. To lyse cells, cultures were autoclaved for 15 minutes at 121°C and 22 psig,
then sonicated for one minute with a Bronson 1020 sonicator (Danbury, CT, U.S.A.).
Cell lysis was confirmed visually using a transmitted-light microscopy (Zeiss,
Thornwood, NY, U.S.A.).
Mixed Metal Sorption
Mixed metal sorption was studied with viable cells at physiologically relevant
conditions (pH 2.5 and 45°C) using the same techniques for cell preparation,
experimental design, and measurement of aqueous metal concentrations described earlier.
The initial concentrations of lead, zinc, and copper were 0.24, 0.92, and 1.57 mM. For
direct comparison with single metal systems, these concentrations were equal to the
highest initial metal concentrations used in the individual sorption studies.
Modeling Metal Speciation
Visual MINTEQ (version 2.53) was used to predict the speciation of metal using
activities from the Debye-Huckel Equation, and the default MINTEQA2 thermodynamic
database. The temperature was set to 45°C and the free-proton concentration was
calculated from the pH, which was fixed at 1.5, 2.5, 4.0, 5.5, or 7.0. The lead, zinc, and
copper concentrations used were 0.24, 0.92, and 1.57 mM, respectively, to match the
highest metal concentrations used in the sorption experiments.

91
Statistical Analysis and Controls
In separate experiments, cells were cultured in the basal salts growth medium
described earlier, with the pH adjusted to 1.5, 2.5, or 4.0 at 45°C, covering the pH range
over which At. caldus grows well [1]. These cells were then prepared for sorption
experiments at the same pH they were grown at. The results were not statistically
different from those observed when the growth medium pH differed from the sorption
medium pH (Appendix H).
All experiments were performed in triplicate, and average values and 95%
confidence intervals were calculated. Langmuir and Arrhenius parameters, and
corresponding 95% confidence intervals, were calculated with multiple linear regressions
using the LINEST function in Microsoft Excel.
Results
Effect of pH on Lead, Zinc, and Copper Sorption
Figure 18 shows the sorption of lead, zinc, and copper to viable and dehydrated
cells over time, at pH 2.5 and 45°C. It can be seen that viable-cell systems equilibrated
more slowly than dehydrated-cell systems. Using equilibrium concentrations,
Lineweaver-Burk plots were used to calculate loading capacities and binding-site
affinities. Figure 19 shows the Lineweaver-Burk plot for the sorption of zinc to viable
BC13 cells, at pH 2.5 and 45°C. Results for all conditions tested for lead, zinc, and
copper sorption are not shown, but showed similar trends and variances. R2 values for
these plots varied between 0.88 and 0.98 (Appendix H).
92
Elapsed time (min)
0 10 20 30 40 50 60 70
Sorb
ed m
eta
l con
cen
tratio
n (
mm
ol g
-1)
0
1
2
3
4
Lead (viable)
Zinc (viable)
Copper (viable)
Lead (dehydrated)
Zinc (dehydrated)
Copper (dehydrated)
Figure 18. Change in sorbed lead, zinc, and copper concentrations to viable and
dehydrated Acidithiobacillus caldus strain BC13 cells with time at pH 2.5 and 45°C.
Error bars represent 95% confidence intervals.
Ce
-1 (L mmol
-1)
0 2 4 6 8 10 12 14 16 18 20 22
Qe
-1 (
g m
mo
l-1)
0.6
0.8
1.0
1.2
1.4
1.6
Figure 19. A Lineweaver-Burk plot of the linearized Langmuir Equation. Here, the
sorption of zinc to viable Acidithiobacillus caldus strain BC13 cells, at pH 2.5 and 45°C,
is represented. The plotted values are the inverse of metal sorbed, Qe-1
, and metal in
solution, Ce-1
, at equilibrium.

93
Figure 20 shows the effect of pH on the loading capacities and binding-site
affinities for lead, zinc, and copper to viable and dehydrated cells at 45°C. Viable cells
were observed to
pH
1 2 3 4 5 6 7 8
Qo
(mm
ol g
-1)
0
1
2
3
4
5
6Lead (viable)
Zinc (viable)
Copper (viable)
Lead (dehydrated)
Zinc (dehydrated)
Copper (dehydrated)
pH
1 2 3 4 5 6 7 8
k L (L
mm
ol-1
)
0
20
40
60
80
Lead (viable)
Zinc (viable)
Copper (viable)
Lead (dehydrated)
Zinc (dehydrated)
Copper (dehydrated)
a
b
Figure 20. The effect of pH on the (a) loading capacity ( oQ ), and (b) binding-site affinity
( Lk ) for the sorption of lead, zinc, and copper to viable and dehydrated Acidithiobacillus
caldus strain BC13 cells. Error bars represent 95% confidence intervals.

94
ln{[H+][complexed ion]
-1}
-10 -8 -6 -4 -2 0 2 4 6 8 10
Qo
(mm
ol g
-1)
0
1
2
3
4
5
6
Lead (viable)
Zinc (viable)
Copper (viable)
Lead (dehydrated)
Zinc (dehydrated)
Copper (dehydrated)
ln{[H+][complexed ion]
-1}
-10 -8 -6 -4 -2 0 2 4 6 8 10
k L (L
mm
ol-1
)
0
20
40
60
Lead (viable)
Zinc (viable)
Copper (viable)
Lead (dehydrated)
Zinc (dehydrated)
Copper (dehydrated)
a
b
Figure 21. The relationship between the free-proton and complexed lead, zinc, or copper
concentrations on the (a) loading capacity ( oQ ), and (b) binding-site affinity ( Lk ) for the
sorption of lead, zinc, and copper to viable and dehydrated Acidithiobacillus caldus strain
BC13 cells. Complexed ions are any ions other than monoatomic divalent lead, zinc, and
copper. Concentrations of 0.24, 0.92, and 1.57 mM for lead, zinc, and copper,
respectively, were used to model speciation. These were the highest aqueous
concentrations used in this study, and represent conditions where each binding site could
theoretically interact with a metal molecule. Error bars represent 95% confidence
intervals.

95
have higher loading capacities, for zinc and copper, than dehydrated cells. However, in
the case of lead, the loading capacities for viable and dehydrated cells were very close.
Copper exhibited the highest loading capacity, 4.76 ± 0.28 and 3.09 ± 0.11 mmol g-1
to
viable and dehydrated cells, respectively, at pH 5.5 (Figure 20a). The highest binding-
site affinities observed were for lead, 60.1 ± 2.5 L mmol-1
at pH 5.5, and 61.2 ± 3.0 L
mmol-1
at pH 4.0, for viable and dehydrated cells, respectively (Figure 20b).
The ratios of free-proton to complexed metal concentrations are plotted on a
natural logarithm scale against loading capacity (Figure 21a) and binding-site affinity
(Figure 21b). A vertical line at y = 0 represents the pH where the free-proton
pH
1 2 3 4 5 6 7 8
Su
m o
f fr
ee
-pro
ton
an
d c
om
ple
xed
m
eta
l co
nce
ntr
atio
ns
(M)
0.00
0.01
0.02
0.03
0.04
0.05
Lead
Zinc
Copper
Figure 22. Sum of the free-proton and complexed-metal concentrations, representing two
sources of competition for metal sorption onto a cellular binding-site. Concentrations of
0.24, 0.92, and 1.57 mM for lead, zinc, and copper, respectively, were used to model
speciation. These were the highest aqueous concentrations used in this study, and
represent conditions where each binding site could theoretically interact with a metal
molecule.

96
concentration is equal to the complexed-metal concentration. The ratio at which the
loading capacity is maximized varied among lead, zinc, and copper, and between viable
and dehydrated cells. However, Figure 21b shows that, for each metal and cell condition,
the binding-site affinity was maximized when the free proton concentration is higher than
the complexed metal concentration. The sum of the free proton and complexed metal
concentrations is shown with pH in Figure 22.
Temperature Effects
At pH 2.5, the loading capacities of lead and zinc onto viable and dehydrated cells
were not significantly dependent on temperature, neither was the loading capacity of
copper onto dehydrated cells. However, the loading capacity of copper onto viable cells
decreased from 3.2 ± 0.1 mmol g-1
, at 35ºC, to 2.7 ± 0.06 mmol g-1
at 45ºC (Figure 23a).
Conversely, binding-site affinities for lead, zinc, and copper sorption to viable and
dehydrated cells consistently decreased with increasing temperature. The largest
decrease was observed for the sorption of lead to dehydrated cells, where the binding-site
affinities were 104.9 ± 6.5, 74.5 ± 5.6, and 54.2 ± 3.2 L mmol-1
at 25, 35, and 45ºC,
respectively (Figure 23b). From Equation 5.6, heats of sorption were calculated and are
shown in Table 5.
Desorption Experiments
For each cell condition tested, at pH 2.5, 4.0, and 7.0, between 94.6 and 99.5% of
lead and zinc desorbed from cellular surfaces in an NTA wash. However, at each pH,
much less copper desorbed from viable cells than any of the other cell conditions tested.
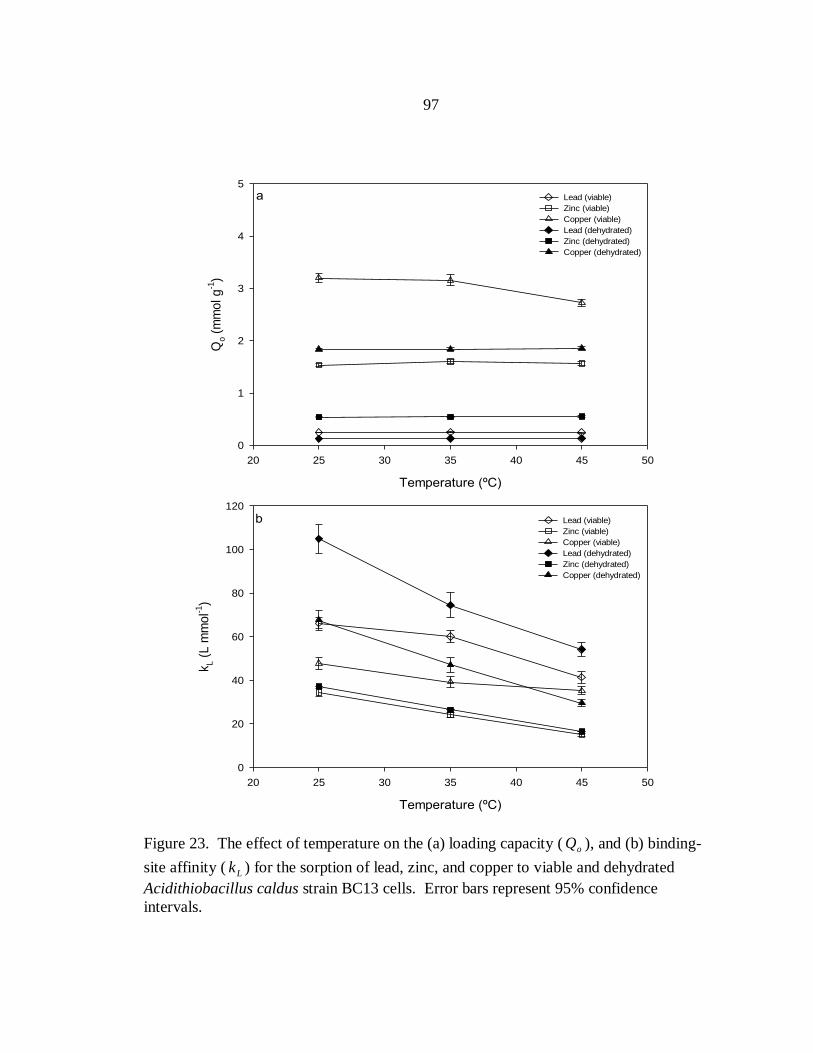
97
Temperature (ºC)
20 25 30 35 40 45 50
Qo (
mm
ol g
-1)
0
1
2
3
4
5
Lead (viable)
Zinc (viable)
Copper (viable)
Lead (dehydrated)
Zinc (dehydrated)
Copper (dehydrated)
Temperature (ºC)
20 25 30 35 40 45 50
kL (
L m
mo
l-1)
0
20
40
60
80
100
120
Lead (viable)
Zinc (viable)
Copper (viable)
Lead (dehydrated)
Zinc (dehydrated)
Copper (dehydrated)
a
b
Figure 23. The effect of temperature on the (a) loading capacity ( oQ ), and (b) binding-
site affinity ( Lk ) for the sorption of lead, zinc, and copper to viable and dehydrated
Acidithiobacillus caldus strain BC13 cells. Error bars represent 95% confidence
intervals.
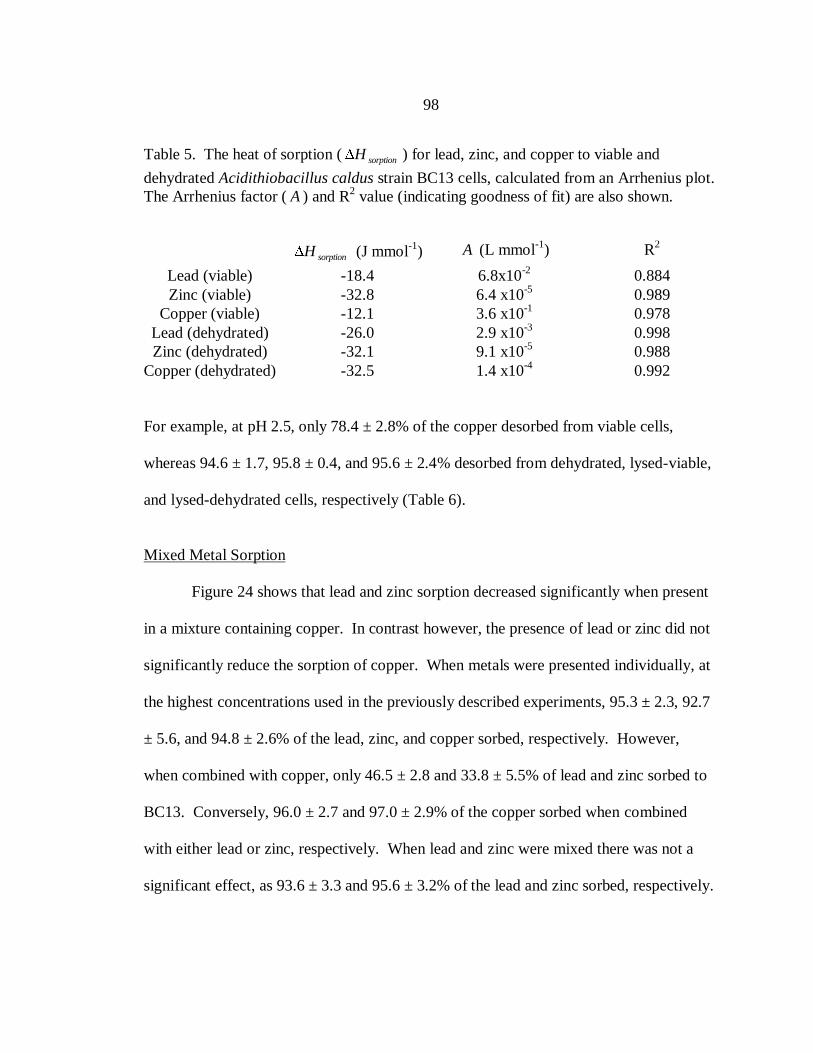
98
Table 5. The heat of sorption ( sorptionH ) for lead, zinc, and copper to viable and
dehydrated Acidithiobacillus caldus strain BC13 cells, calculated from an Arrhenius plot.
The Arrhenius factor ( A ) and R2 value (indicating goodness of fit) are also shown.
sorptionH (J mmol
-1) A (L mmol
-1) R
2
Lead (viable) -18.4 6.8x10⁻²
0.884
Zinc (viable) -32.8 6.4 x10⁻⁵
0.989
Copper (viable) -12.1 3.6 x10⁻¹
0.978
Lead (dehydrated) -26.0 2.9 x10⁻³
0.998
Zinc (dehydrated) -32.1 9.1 x10⁻⁵
0.988
Copper (dehydrated) -32.5 1.4 x10⁻⁴
0.992
For example, at pH 2.5, only 78.4 ± 2.8% of the copper desorbed from viable cells,
whereas 94.6 ± 1.7, 95.8 ± 0.4, and 95.6 ± 2.4% desorbed from dehydrated, lysed-viable,
and lysed-dehydrated cells, respectively (Table 6).
Mixed Metal Sorption
Figure 24 shows that lead and zinc sorption decreased significantly when present
in a mixture containing copper. In contrast however, the presence of lead or zinc did not
significantly reduce the sorption of copper. When metals were presented individually, at
the highest concentrations used in the previously described experiments, 95.3 ± 2.3, 92.7
± 5.6, and 94.8 ± 2.6% of the lead, zinc, and copper sorbed, respectively. However,
when combined with copper, only 46.5 ± 2.8 and 33.8 ± 5.5% of lead and zinc sorbed to
BC13. Conversely, 96.0 ± 2.7 and 97.0 ± 2.9% of the copper sorbed when combined
with either lead or zinc, respectively. When lead and zinc were mixed there was not a
significant effect, as 93.6 ± 3.3 and 95.6 ± 3.2% of the lead and zinc sorbed, respectively.

99
When all three metals were mixed, 40.2 ± 4.3, 28.7 ± 3.8, and 91.3 ± 3.0% of the lead,
zinc, and copper sorbed, respectively.
Table 6. Percent of lead, zinc, or copper that desorbed from Acidithiobacillus caldus
strain BC13 cells in a 5 mM nitriloacetic acid (NTA) wash at equilibrium. ± values
represent 95% confidence intervals.
Percent of sorbed metal removed in NTA wash
Lead Zinc Copper
pH 1.5
Viable cells 96.4 ± 3.1 94.2 ± 1.3 78.4 ± 2.8
Dehydrated cells 98.1 ± 1.7 98.1 ± 1.0 94.6 ± 1.7
Lysed-viable cells 96.3 ± 0.8 96.5 ± 0.9 95.8 ± 0.4
Lysed-dehydrated cells 96.8 ± 0.6 97.5 ± 1.2 95.6 ± 2.4
pH 4.0
Viable cells 95.4 ± 0.6 94.6 ± 1.5 83.1 ± 3.3
Dehydrated cells 97.6 ± 0.6 96.0 ± 2.8 97.4 ± 1.3
Lysed-viable cells 98.2 ± 2.0 97.5 ± 1.3 94.5 ± 2.4
Lysed-dehydrated cells 99.0 ± 1.2 97.4 ± 1.6 95.3 ± 1.3
pH 7.0
Viable cells 98.3 ± 1.0 98.0 ± 0.4 90.5 ± 0.8
Dehydrated cells 99.5 ± 0.5 98.4 ± 1.1 96.9 ± 0.4
Lysed-viable cells 97.0 ± 0.5 97.7 ± 2.2 94.4 ± 3.1
Lysed-dehydrated cells 97.4 ± 1.0 97.4 ± 1.2 96.2 ± 1.0
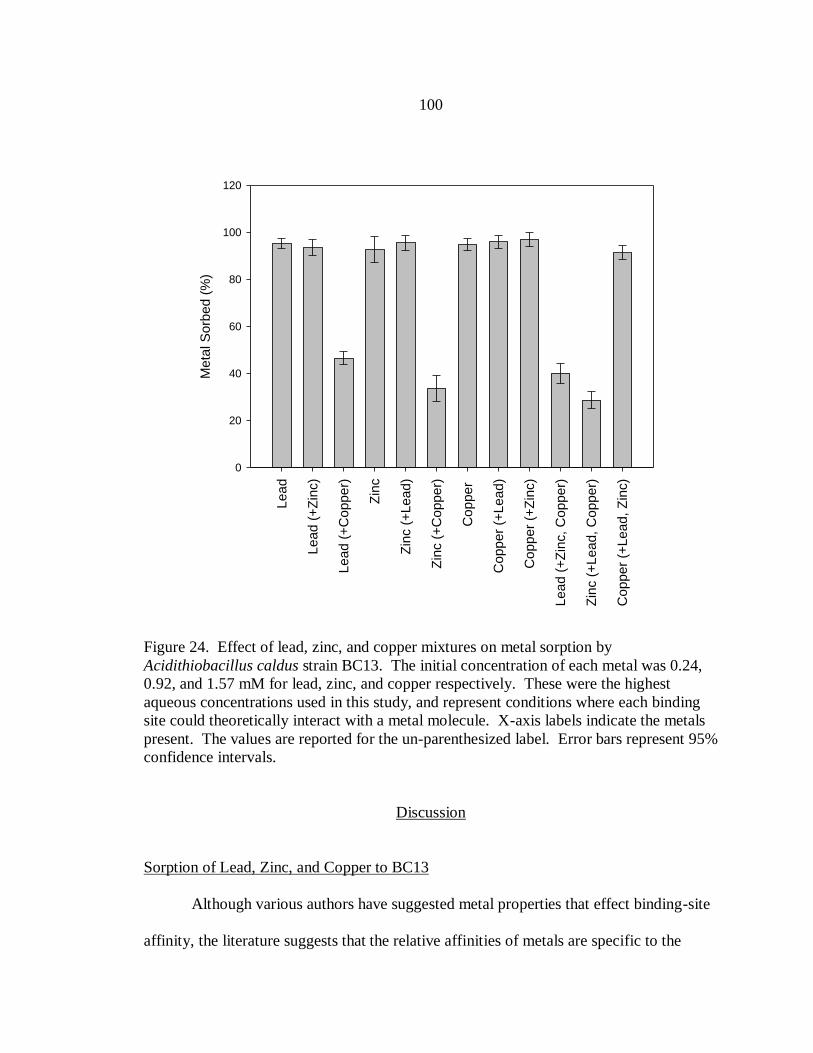
100
Le
ad
Le
ad
(+
Zin
c)
Le
ad
(+
Co
pp
er)
Zin
c
Zin
c (
+L
ea
d)
Zin
c (
+C
op
pe
r)
Co
pp
er
Co
pp
er
(+L
ea
d)
Co
pp
er
(+Z
inc)
Le
ad
(+
Zin
c,
Co
pp
er)
Zin
c (
+L
ea
d,
Co
pp
er)
Co
pp
er
(+L
ea
d,
Zin
c)
Me
tal S
orb
ed
(%
)
0
20
40
60
80
100
120
Figure 24. Effect of lead, zinc, and copper mixtures on metal sorption by
Acidithiobacillus caldus strain BC13. The initial concentration of each metal was 0.24,
0.92, and 1.57 mM for lead, zinc, and copper respectively. These were the highest
aqueous concentrations used in this study, and represent conditions where each binding
site could theoretically interact with a metal molecule. X-axis labels indicate the metals
present. The values are reported for the un-parenthesized label. Error bars represent 95%
confidence intervals.
Discussion
Sorption of Lead, Zinc, and Copper to BC13
Although various authors have suggested metal properties that effect binding-site
affinity, the literature suggests that the relative affinities of metals are specific to the
101
organism used. In the present study, the order of binding-site affinity was lead > copper
> zinc. This matches the order of binding-site affinity for these metals to Pseudomonas
putida as observed by Pardo et al. [19].
Ferris and Beveridge [20] suggested that a higher metal charge density contributes
to greater affinity. However, the ionic radii of lead, copper and zinc are 133 pm, 87 pm,
and 74 pm, respectively, so in the present case, it appears that other factors are greater
contributors to sorption affinity than charge density. It has also been suggested that
metal acidity is an important factor [21]. In the present study, the metal acidities of lead,
zinc, and copper, as represented by the stability constant of the first hydroxyl-metal
complex, were calculated to be 6.2, 6.0, and 4.4 at pH 4.0, respectively. This corresponds
with the order of binding-site affinities observed here, suggesting that metal acidity may
be important in the affinity for metal sorption to BC13.
Several studies have reported significant differences in metal sorption to viable
versus non-viable biota [i.e. 22-24]. In the present study, copper exhibited the highest
loading capacity to both viable and dehydrated cells, while lead had the lowest. In the
case of zinc and copper, a significantly higher loading capacity was observed for viable
cells as compared to dehydrated cells. This suggests that changes to zinc and copper
binding sites during the dehydrating process significantly affected zinc and copper
sorption.
Figure 18 suggests that the sorption kinetics also differ between viable and
dehydrated cells. Only 48% of the copper sorption to viable cells occurred before the
first time point, compared to 93% of the sorption to dehydrated cells. These calculations
102
were made for lead (61 versus 86%) and zinc (59 versus 80%). Interestingly, the data in
Table 6 shows that far less copper is recovered in an NTA wash of viable cells than lead
and zinc. However, recoveries of copper from dehydrated, lysed-viable, and lysed-
dehydrated cells were all similar. This may indicate that more copper had absorbed into
the viable cells, rather than adsorbing to the surface. Alvarez and Jerez [25] suggested
that At. ferrooxidans possesses a copper efflux system that requires polyphosphate kinase
activity. If BC13 possesses a similar mechanism, electron-donor starved cells would
likely lack the energy to pump phosphate-metal complexes out of the cell. Although,
there is no evidence in this report, this may explain the difference between copper
sorption kinetics to viable versus dehydrated cells, and the lower amount of copper that
desorbed from viable cells in the NTA wash.
For viable and dehydrated cells, the loading capacities and binding-site affinities
were also dependent on pH (Figure 20). In general, both increased to a plateau with
increasing pH, and then decreased slightly. A review by Febrianto et al. [26] reported
many studies that observed significant increases in the loading capacity with increasing
pH, and in many cases, a subsequent decrease in the loading capacity with further
increases in pH. Specific to bacteria, this observation has been reported by several
researchers [21,27-29].
In many systems, there are two competing factors that affect metal sorption. First,
the metal must compete with proton sorption at the binding site [30], especially at low
pH. Secondly, metal speciation increases with pH, possibly reducing the biological
availability of the metal [31]. Figure 21 shows how these factors affect the loading

103
capacity and binding-site affinity. The binding-site affinities were maximized between
pH 4.0 and 5.5, where, interestingly, the sum of the free protons and complexed ions was
near a minimum for solutions containing lead, zinc, and copper, respectively (Figure 22).
Temperature Effects
Many published studies have reported an increase in loading capacities of metals
with increasing temperature [16,17,32,33]. However, in the present report, temperature
did not significantly affect the loading capacity of lead, zinc, or copper to viable or
dehydrated cells. Conversely, the loading capacity of copper on viable cells did decrease
slightly between 35 and 45ºC (Figure 23). Similar observations were made of zinc
sorption to several species of Pseudomonas [34].
Binding-site affinities decreased with increasing temperature suggesting, by
LeChatelier‟s principle, that the sorption of these metals is an exothermic reaction and is
dominated by reversible (physical) mechanisms [23]. Copper sorption was the less
exothermic than lead or zinc sorption (Table 5), indicating a more irreversible aspect to
its binding mechanism, such as absorption. This may also support observations from the
desorption experiments.
Mixed Metal Sorption
Because of its higher calculated specific loading capacity, copper appeared to out-
compete lead and zinc for cellular binding sites in mixed-metal environments containing
high concentrations of copper. This is strongly supported by the results shown in Figure
24. These results are especially significant in the context of an applied system, where
104
mixtures of metals are likely to be present. The ability of BC13 to sorb relatively high
amounts of copper, even in the presence of other metals, suggests an especially important
role in copper transport in acidic environments. Conversely, the sharp decrease in lead
and zinc sorption in the presence of copper suggests that BC13 may play a more limited
role in lead and zinc transport in systems containing high concentrations of copper.
Interestingly, even a relatively high concentration of zinc did not significantly affect the
sorption of either lead or copper. This is important as many acid-mine drainages and
metal contaminated sites contain very high zinc concentrations [3,35,36].
Comparisons to Previous Work with Acidithiobacilli
Previous metal sorption studies using At. thiooxidans and At. ferrooxidans have
reported loading capacities for zinc and copper. To facilitate a comparison with the
results presented here, the units for loading capacity in previous reports were converted
from mg L-1
to mmol g-1
.
Liu et al. [16] used a Langmuir model to describe the sorption of zinc (at pH 2.0,
4.0, and 6.0) and copper (at pH 4.0 and 5.0) to viable At. thiooxidans cells at 25ºC. In
contrast to the sorption of zinc to BC13 observed here, Liu et al. did not observe any
sorption of zinc to viable cells below pH 6.0. At pH 6.0 a loading capacity of 0.661 ±
0.014 mmol g-1
was reported, compared to 1.67 ± 0.065 mmol g-1
, in the present study at
pH 5.5 at 45ºC. However, when Liu et al. pre-treated the cells with sodium hydroxide,
rendering them non-viable, sorption occurred at pH 2.0 (0.577 ± 0.019 mmol g-1
), pH 4.0
(0.832 ± 0.034 mmol g-1
), and pH 6.0 (1.46 ± 0.055 mmol g-1
). These values are over
three-fold higher than those reported here for dehydrated BC13 cells at similar pH. The
105
same study reported loading capacities for copper for both viable and non-viable cells
that are significantly lower than those reported here, for BC13. This comparison suggests
that viable BC13 cells may be capable of sorbing greater amounts of zinc and copper than
At. thiooxidans, especially below pH 4.0.
In another study, Ruiz-Manriquez et al. [17] reported a loading capacity of 3.14
mmol g-1
for copper sorption to At. ferrooxidans cells treated with sodium hydroxide at
pH 6.0 and 37°C, this is very close to the 3.09 mmol g-1
reported for dehydrated BC13
cells, at pH 5.5 and 45°C, in the present study. However, when viable cells were used,
Ruiz-Manriquez et al. observed loading capacities of copper lower than those observed
for viable BC13 cells in the present study. The ability of viable BC13 to sorb relatively
high amounts of lead, zinc, and copper below pH 4.0 may suggest that it could play a
significant role in the fate and mobility of these metals, especially in low pH
environments such as acid-mine drainages. In addition, At. caldus may play an especially
important role in the immobilization of copper at low pH as copper sorption did not
decrease significantly when present in a mixture containing lead and zinc.
Conclusions
This is the first report on the effects of cell condition, pH, or temperature on lead,
zinc, or copper sorption to At. caldus. This is also the first study of these effects on the
sorption of lead to any organism of the acidithiobacilli genus. Lead, zinc, and copper
sorption was observed to be highly dependent on pH, with the greatest sorption occurring
between pH 4.0 and 5.5. Temperature did not affect the loading capacities of lead, zinc,
and copper significantly; however, the binding-site affinities decreased significantly with
106
increasing temperature, suggesting that lead, zinc, and copper sorption to BC13 is an
exothermic reaction.
Because experiments were not carried out identically, it is difficult to make an
exact comparison with previous work by [16,17]; however it appears that viable BC13
cells are excellent sorbents of zinc and copper at low pH compared to viable At.
thiooxidans and At. ferrooxidans cells. In addition, mixed sorption studies showed the
presence of lead and zinc did not significantly decrease copper sorption from metal
mixtures. This suggests that At. caldus may be especially important to the fate and
transport of copper in acid-mine drainages, and may suggest a role in copper remediation.
This comprehensive study of sorption of mixtures of lead, zinc, and copper to viable
BC13 cultures contributes to understanding the role, and possible applications, of this
microorganism in the fate and transport of heavy metals in acid-mine environments. In
addition, its relatively high accumulation of zinc and copper identify At. caldus as a
potential sorbent for these metals in other acidic systems.

107
References
1. Hallberg KB, Lindstrom EB (1994) Characterization of Thiobacillus caldus sp.
Nov., a moderately thermophilic acidophile. Microbiology 140:3451-3456.
2. Burton NP, Norris PR (2000) Microbiology of acidic, geothermal springs of
Montserrat: environmental rDNA analysis. Extremophiles 4:315-320.
3. Druschel GK, Baker BJ, Gihiring TM, Banfield JF (2004) Acid mine drainage
biogeochemistry at Iron Mountain, California. Geochem Trans 5:12-32.
4. Okibe N, Gericke M, Hallberg KB, Johnson DB (2003) Enumeration and
characterization of acidophilic microorganisms isolated for a pilot plant stirred-
tank bioleaching operation. Appl Environ Microbiol 69:1936-1943.
5. Dopson M, Lindstrom EB (1999) Potential role of Thiobacillus caldus in
arsenopyrite bioleaching. Appl Environ Microbiol 65:36-40.
6. Edwards KJ, Bond PL, Banfield JF (2000) Characteristics of attachment and
growth of Thiobacillus caldus on sulphide minerals: a chemotactic response to
sulphur minerals?. Environ Microbiol 2:324-332.
7. Fu B, Zhou H, Zhang R, Qiu G (2008) Bioleaching of chalcopyrite by pure and
mixed cultures of Acidithiobacillus spp. and Leptospirillum ferriphilum. Int J
Biodeterior and Biodegrad 62:109-115.
8. McGuire MM, Edwards KJ, Banfield JF, Hamers RJ (2001) Kinetics, surface
chemistry, and structural evolution of microbially mediated sulfide mineral
dissolution. Geochem Geophys Geosyst 65:1243-1258.
9. Zhou QG, Bo F, Bo ZH, Xi L, Jian G, Fei LF, Hau CH (2007) Isolation of a strain
of Acidithiobacillus caldus and its role in bioleaching of chalcopyrite. World J
Microbiol Biotechnol 23:1217-1225.
10. Vijayaraghavan K, Yun YS (2008) Bacterial biosorbents and biosorption.
Biotechnol Adv 26:266-291.
11. Gomez C, Bosecker K (1999) Leaching heavy metals from contaminated soil
using Thiobacillus ferrooxidans or Thiobacillus thiooxidans. J Geomicrobiol
16:233-244.
108
12. Nareshkumar R, Nagendran R, Parvathi K (2008) Bioleaching of heavy metals
from contaminated soil using Acidithiobacillus ferrooxidans: effect of sulfur/soil
ratio. World J Microbiol Biotechnol 24:1539-1546.
13. Ryu HW, Moon HS, Lee EY, Cho KS, Choi H (2003) Leaching characteristics of
heavy metals from sewage sludge by Acidithiobacillus thiooxidans. Met J
Environ Qual 32:751-759.
14. Celeya RJ, Noriega JA, Yeomans JH, Ortega LJ, Ruiz-Manriquez A (2000)
Biosorption of Zinc(II) by Thiobacillus ferrooxidans. Bioprocess Eng 22:539-
542.
15. Hossain SM, Anantharaman N (2005) Studies on copper(II) biosorption using
Thiobacillus ferrooxidans. J Univ Chem Technol Metall 40:227-234.
16. Liu HL, Chen BY, Lan YW, Cheng YC (2004) Biosorption of Zn(II) and Cu(II)
by the indigenous Thiobacillus thiooxidans. Chem Eng J 97:195-201.
17. Ruiz-Manriquez A, Magana PI, Lopez V, Guzman R (1997) Biosorption of Cu by
Thiobacillus ferrooxidans. Bioprocess Eng 18:113-118.
18. Rawlings DE (2002) Heavy metal mining using microbes. Annu Rev Microbiol
56:65-91.
19. Pardo R, Herguedas M, Barrado E, Vega M (2003) Biosorption of cadmium,
copper, lead and zinc by inactive biomass of Pseudomonas putida. Anal Bioanal
Chem 376:26-32.
20. Ferris FG, Beveridge TJ (1986) Site specificity of metallic ion binding in
Escherichia coli K-12 lipopolysaccharide. Can J Microbiol 32:52-55.
21. Pagnanelli F, Esposito A, Toro L, Veglio F (2003) Metal speciation and pH effect
on Pb, Cu, Zn and Cd biosorption onto Sphaerotilus natans: Langmuir-type
empirical model. Water Res 37:627-633.
22. Sandau E, Sandau P, Pulz O (1996) Heavy metal sorption by microalgae. Acta
Biotechnol 16:227-235.
23. Hawari AH, Mulligan CN (2006) Biosorption of lead(II), cadmium(II), copper(II)
and nickel(II) by anaerobic granular biomass. Bioresource Technol 97:692-700.
24. San, Tuzen M (2007) Biosorption of Pb(II) and Cd(II) from aqueous solution
using green alga (Ulva lactuca) biomass. J Haz Mat 152:302-308.
109
25. Alvarez S, Jerez C (2004) Copper ions stimulate polyphosphate degradation and
phosphate efflux in Acidithiobacillus ferrooxidans. Appl Environ Microbiol
70:5177-5182.
26. Febrianto J, Kosasih AN, Sunarso J, Ju YH, Indraswati N, Ismadji S (2009)
Equilibrium and kinetic studies in adsorption of heavy metals using biosorbent: a
summary of recent studies. J Haz Mat 162:616-645.
27. Akzu Z (2001) Equilibrium and kinetic modeling of cadmium(II) biosorption by
C. vulgaris in a batch system: effect of temperature. Sep Purif Technol 21:285-
294.
28. Ledin M, Pedersen K, Allard B (1997) Effects of pH and ionic strength on the
adsorption of Cs, Sr, Eu, Zn, Cd and Hg by Pseudomonas putida. Water Air Soil
Poll 93:367-381.
29. Ozdemir G, Ceyhan N, Ozturk T, Akirmak F, Cosar T (2004) Biosorption of
chromium(VI), cadmium(II) and copper(II) by Pantoea sp. TEM18. Chem Eng J
102:249-253.
30. Crist RH, Oberholser K, Shenk N, Nguyen M (1981) Nature of bonding between
metallic ions and algal cell walls. Environ Sci Technol 15:1212-1217.
31. Tubbing DMJ, Amdiraal W, Cleven RFMJ, Iqbal M, Van De Ment D, Verweij W
(1994) The contribution of complexed copper to the metabolic inhibition of algae
and bacteria in synthetic media and river water. Water Res 28:37-44.
32. Deng L, Zhu X, Wang X, Su Y, Su H (2007) Biosorption of copper(II) from
aqueous solutions by green alga Cladophora fascicularis. Biodegradation
18:393-402.
33. Green-Ruiz C, Rodriguez-Tirado V, Gomez-Gil B (2008) Cadmium and zinc
removal from aqueous solutions by Bacillus jeotgali: pH, salinity and temperature
effects. Bioresource Technol 99:750-762.
34. Shaker MA (2007) Thermodynamic profile of some heavy metal ions adsorption
onto biomaterial surfaces. Am J Appl Sci 4:605-612.
35. Banks D, Younger PL, Arnesen RT, Banks SB (1997) Mine-water chemistry: the
good, the bad and the ugly. Environ Geol 32:157-174.
36. Benner SG, Blowes DW, Gould WD, Herbert RB, Ptacek CJ (1999)
Geochemistry of a permeable reactive barrier for metals and acid mine drainage.
Environ Sci Technol 33:2793-2799.

110
CHAPTER SIX
EFFECTS OF ORGANIC ACIDS AND METALS ON PROTEIN EXPRESSION BY
ACIDITHIOBACILLUS CALDUS STRAIN BC13
Abstract
Matrix assisted laser desorption ionization mass spectrometry (MALDI-MS) was
used to identify changes in expression of surface and secreted proteins when BC13 was
exposed to the organic acids; pyruvate, acetate, 2-ketoglutarate, succinate, fumarate,
malate, oxaloacetate, and the metals; lead, zinc, and copper. A membrane protein of
approximately 25.9 kDa was up-expressed in the presence of 0.25 x IC50 concentration of
organic acids, and of at least 1.0 x IC50 of heavy metals. In addition, two secreted
proteins of approximately 7.8 and 11.5 kDa were observed only when copper was
present.
One-dimensional gels were used to separate proteins (by molecular weight)
collected from fractions containing either soluble cytoplasmic proteins, peripheral-
membrane proteins, or integral-membrane proteins. No up-regulation was observed in
proteins in the soluble fraction. Protein bands at 45, 60, 80, and 100 kDa consistently up-
regulated in the peripheral fraction from cells that were allowed to adapt to pyruvate
through subsequent culturing. In addition, protein bands at approximately 10 and 25 kDa
consistently up-regulated in the presence of organic acids and heavy metals. It is possible
that these proteins are the same as those observed using MALDI-MS. Finally, two-
dimensional gels were used to separate proteins, by pI and molecular weight, however a
method was not developed that allowed for a full representation of the BC13 proteome.
111
These preliminary results suggest that BC13 can regulate protein expression in response
to the organic acids and metals tested here. Proteins that are up-regulated may play a role
in resistance mechanisms of this microorganism, and would be of commercial interest in
biomining and acid-mine remediation applications.
Introduction
At. caldus is considered an important biomining microorganism [1], especially in
warmer environments (32-50°C) [2], where its thermophilic properties make it an
important member of the autotrophic sulfur oxidizing guild [2]. The studies presented in
chapters two and three are the first reporting the toxicity and assimilation of organic acids
with At. caldus, despite previous reports indicating the important roles of organic acid
toxicity and mixotrophic and/or heterotrophic activity in many biomining environments,
especially acid-mine drainages, metal-leaching bioreactors, and acidic industrial waste
streams [3-5]. Similarly, prior to the work presented in chapter 4 of this dissertation,
metal toxicity studies with At. caldus were largely limited to the metalloid arsenic [6-9],
and the sorption studies reported in chapter five are the first using this microorganism.
Also, there have been no studies on the effects of organic acids on protein regulation in
At. caldus, and metal-induced protein regulation studies have been limited to the
metalloid arsenic, which induces the expression of TetB and several Ars family proteins,
which appear to infer arsenic and antimony resistance [3,5].
This chapter is a preliminary report on the effects of organic acids and metals on
protein expression by BC13. MALDI-MS was used to identify surface and secreted
112
proteins in the presence of varying concentrations of organic acids (pyruvate, acetate, 2-
ketoglutarate, succinate, fumarate, malate, and oxaloacetate) and metals (lead, zinc, and
copper). In addition, cells cultured in the presence of pyruvate, lead, zinc, or copper were
fractionated and the proteins were separated using one- and two-dimensional gels, and
then identified using Liquid chromatography – mass spectrometry (LC-MS). Protein
expression was compared between cells exposed to pyruvate, lead, zinc, or copper for the
first time, and those adapted to these compounds through subsequent culturing.
Materials and Methods
Microorganism, Media, and Growth Conditions
BC13 (ATCC 51757) was grown in a basal salts medium [1]. The medium was
autoclaved for 15 minutes at 121°C and 22 psig and allowed to cool to room temperature.
A trace metal solution [1] was then added to a concentration of 1 mL L-1
and the pH was
adjusted to 2.5 using 6N sulfuric acid. A filter sterilized (0.2 m) solution of potassium
tetrathionate was then added to a concentration of 5 mM, as an electron donor, and
ambient carbon dioxide provided a carbon source. A filter sterilized (0.2 m) solution
containing either metal sulfates (lead, zinc, or copper), or a sodium organic acid salt
(pyruvate, acetate, 2-ketoglutarate, succinate, fumarate, malate, or oxaloacetate) was
added from a stock solution to a concentration equal to the previously calculated IC50s.
The concentrations of organic acids and metals in the stock solutions, and salts in the
medium were adjusted to ensure that the final medium salt compositions were equal.
Cells preserved at 4°C in nanopure water (17.4 M with the pH adjusted to 3.0 using

113
6N sulfuric acid, provided the initial inoculum. Aliquots that provided initial cell
densities of approximately 5 x 10⁷ cells mL
-1 were used. Cells were cultured in 500-mL
Erlenmeyer flasks (350 mL medium volume), fitted with foam stoppers, and shaken at
150 rpm in a temperature controlled incubator at 45°C.
Cell concentrations were measured using direct cell counts with a Petroff-
counting chamber (Hausser Scientific, Horsham, PA, U.S.A.) and a phase-contrast
microscope (Zeiss, Thornwood, N.Y., U.S.A.). For each proteomic analysis, cells were
harvested during the late-exponential growth phase. To adapt cultures to pyruvate, lead,
zinc, or copper, cells were transferred to into identical, fresh, medium during the late-
exponential growth phase. Cells were washed via centrifugation and nanopure water
(17.4 M ), with the pH adjusted to 3.0 using 6N sulfuric acid, between each transfer.
This was repeated three times.
MALDI Analysis
During late-exponential growth an aliquot of each sample was mixed with an -
cyano-4-hydroxycinnamic acid matrix and spotted onto MALDI plates. The remaining
medium was centrifuged to separate the cells. Any secreted proteins present in the
supernatant were concentrated with ultra-filtration through 1 kDa filters using nitrogen
gas at 40 psig. The filter paper was washed with 1 x TAE Buffer. The buffer solution
was then mixed with a sinapinic acid matrix and spotted onto MALDI plates. An Agilent
MALDI-MS (Foster City, CA, U.S.A.) was used to analyze spots. Laser power and
frequency were optimized for maximum detection.
114
Determining the Toxicity of Metals in Spent Medium
In separate experiments, all cells were removed from cultures during the late-
exponential growth phase via filtration (0.2 m) during the late-exponential growth
phase. The medium filtrate was then re-inoculated with fresh BC13 cells. Prior to re-
inoculation, using methods previously described in chapter 4, ICP-MS was used to
measure metal concentrations in the medium filtrate. The specific growth rate of the
fresh culture was then determined using direct cell counts. For comparison, a separate
culture was grown with lead, zinc, or copper added to a concentration equal to that
measured in the spent medium filtrate.
One-Dimensional Gel Analysis
Because BC13 grew mixotrophically using potassium tetrathionate and pyruvate
(chapter 3, Figures 7-9), one-and two-dimensional gel analyses focused on cells exposed
to pyruvate, as well as those exposed to lead, zinc, and copper. Cells were harvested
during late-exponential growth via centrifugation and washed three times using a
phosphate buffer (Appendix J). Proteins were collected from different cell fractions
using the protocol described in Appendix J. The protein concentrations in the resultant
solution were measured using a Bradford assay kit (Bio-Rad, Hercules, CA, U.S.A.), and
were then diluted to approximately 10 g L-1
in a denaturing buffer (Appendix J). A 5
L aliquot of the final solution was run on a precast 4-20% gradient acrylamide gel (Bio-
Rad) that was placed into a Bio-Rad MiniFormat gel box at 80 volts for 2 hours and 15

115
minutes. The gels were then dyed using coomasie blue (Appendix J) overnight, and de-
stained with nanopure water (17.4 M ).
Protein Identification
JQuant software was used to measure band intensities to determine protein bands
that were up-regulated in the presence of pyruvate, lead, zinc, or copper. These bands
were cut from the gel and subjected to the trypsin digest described in Appendix J.
Samples were then centrifuged for 10 minutes at 10,000 rpm. A 10 L aliquot of
supernatant was placed into a sample vial. An Agilent 6340 ion trap LC-MS (Foster
City, CA, U.S.A.) was used to separate and identify peptide products of the trypsin
digest. A gradient of two solvents containing (A) 95% HPLC grade water, 5% HPLC
acetonitrile, and 0.1% formic acid; and (B) 95% HPLC grade acetonitrile, 5% HPLC
grade water, and 0.1% formic acid was used. A sample injection of 3 L was used. A
capillary flow rate of 4 uL min-1
and a column flow rate of 0.6 uL min-1
were used. The
capillary and column pumps were run following the gradients described in Appendix J.
A drying temperature of 325°C was used during electron transfer dissociation. MASCOT
software was used to compare the identified peptides against a library of known proteins.
Two-Dimensional Gel Analysis
Cells were collected via centrifugation and washed three times using a phosphate
buffer (Appendix J). Soluble proteins were then extracted, and re-suspended in a
rehydration buffer (Appendix J). Protein concentrations were measured using a Bradford

116
assay kit (Bio-Rad). Several method variations were tested in an attempt to obtain a more
complete representation of the soluble proteome. These are described briefly below.
Proteins were loaded onto either 18 or 24 cm iso-electric focusing strips (Bio-
Rad), and focused onto a Bio-Rad protein IEF cell. Strips with pH 3 11 gradients, and
a combination of pH 3 7 and pH 7 11 gel strips were also tested. The amount of
protein loaded onto each strip was varied between 50 and 600 g. In addition, proteins
were subjected to ultra-filtration (50 kDa, 40 psig nitrogen gas) in an attempt to separate
proteins that appeared to dominate the proteome. Finally, different dyes with various
levels of sensitivity were used, including coomasie (Appendix J), Sypro (Bio-Rad), CY-
dyes (Amersham, Louisville, CO, U.S.A.), and Z-dyes (Zdye, Bozeman, MT, U.S.A.).
Following isolectric focusing, gel strips were placed in an equilibration solution
(Appendix J). The gel strips were then placed into an acylamide gel prepared following
the directions given in Appendix J. A recA molecular weight marker (Bio-rad) was
placed into the acrylamide gel, and the gel was placed into an Ettan Dalttwelve System
gel electrophoresis box (General Electric, Fairfield, CT, U.S.A.). The voltage was set to
4 volts per gel, and the current was applied until the bromophenol blue migrated the
length of the gel. This typically required between 16 and 28 hours, with variances
possibly due to inconsistent cooling of the gel box.

117
Results
MALDI Analysis
Table 7 shows that pyruvate, acetate, 2-ketoglutarate, succinate, fumarate, malate,
and oxaloacetate increased expression of a membrane protein with a molecular weight of
approximately 25.9 kDa. This was observed when BC13 was cultured in the presence of
0.25 x, 0.5 x, and 1.0 x IC50 of each organic acid tested. In addition, this
Table 7. Specific intensity (counts per second per cell) of proteins from Acidithiobacillus
caldus strain BC13 grown in varying concentrations of pyruvate, lead, zinc, or copper
proportional to the respective half-maximal inhibitory concentrations (IC50s). Proteins
are denoted by their molecular weight within quotation marks. Results from pyruvate
exposure are shown here; other organic acids were tested (acetate, 2-ketoglutarate,
succinate, fumarate, malate, and oxaloacetate), however they did not produce results
significantly different than pyruvate.
Secreted proteins
(counts s-1
cell-1
)
Membrane protein „25,961‟
(counts s-1
cell-1
)
„7,820‟ „11,501‟ 0.25 x IC50 0.50 x IC50 1.0 x IC50
Lead - - Lead - - 48
Zinc - - Zinc - - 96
Copper 10.16 6.17 Copper - - 105
Pyruvate - - Pyruvate 54 58 66
Control - - Control Protein not identified
protein was identified when BC13 was cultured in the presence of 1.0 x IC50 of lead, zinc,
or copper; however it was not observed when concentrations of 0.25 x and 0.50 x IC50 of
these heavy metals were added (Table 7). Also, this protein was not observed when
BC13 was cultured in the absence of organic acids or heavy metals. Using MALDI
analysis, no other membrane proteins were observed to up-regulate in the presence of
organic acids or metals. Two secreted proteins were identified with molecular weights of

118
approximately 7.8 and 11.5 kDa, respectively, when BC13 was exposed to copper (Table
7). No secreted proteins were observed in the presence of organic acids, lead, zinc, or
organic acid and heavy metal free controls.
To determine whether the proteins „7,820‟ and „11,501‟ may serve to detoxify
copper in the growth medium, spent medium from previous BC13 cultures containing the
copper IC50 was inoculated with fresh cells. These cultures exhibited higher specific
growth rates (0.022 ± 0.001 h-1
) than those inoculated into medium with the same copper
concentration, but without previous exposure to BC13 cells (0.016 ± 0.002 h-1
, Figure
25).
0.000
0.005
0.010
0.015
0.020
0.025
0.030
0.035
Metal-free Lead Zinc Copper
Sp
ecif
ic g
row
th r
ate
(h-1
)
Predicted u
Observed u
Figure 25. Specific growth rates of cells inoculated in medium filtrate previously
exposed to Acidithiobacillus caldus strain BC13 compared to cells inoculated into spent
medium with no previous exposure to At. caldus strain BC13. The spent medium
contained lead, zinc, copper, or a heavy metal free control.
119
Gel Analysis
No significant, repeatable, up-regulation in protein bands from the soluble
fraction was observed when BC13 was exposed to pyruvate, lead, zinc, or copper,
compared to an organic acid and heavy metal free control. In addition, no changes in
protein band expression were observed between soluble fractions collected from cultures
exposed to pyruvate, lead, zinc, or copper for the first time, and those that were
subsequently adapted to these compounds.
Similarly, no differences were observed in proteins peripheral to the cell
membrane when exposed to pyruvate for the first time, or after subsequent culturing.
However, Figure 26 shows that protein bands from the peripheral-membrane fraction
with molecular weights of 45, 60, 80, and 120 kDa were up-regulated after BC13 was
adapted to pyruvate.
Ladder C P P+
250
150
100
75
50
37
25
20
15
10
Figure 26. One-dimensional, coomassie stained, gel showing peripheral protein bands
from Acidithiobacillus caldus strain BC13 in the absence of pyruvate (C), when exposed
to pyruvate for the first time (P), and when adapted to pyruvate through subsequent
culturing (P+).
kDa

120
Conversely, no up-regulation of peripheral-membrane proteins was observed when cells
were exposed to lead, zinc, or copper.
Figure 27 shows that integral-membrane proteins with molecular weights of 10 and
25 kDa were up-regulated when exposed to pyruvate, lead, zinc, or copper for the first
time. No additional changes were observed in the integral-membrane proteins when the
cultures were allowed to adapt to these compounds through subsequent culturing.
Cu Zn Pb P+ C
250
150
100
75
50
37
25
20
15
10
Figure 27. Effect of copper (Cu), zinc (Zn), lead (Pb), and pyruvate (P+) on the up- and
down- regulation of Acidithiobacillus caldus strain BC13 proteins integral to the cellular
membranes and separated on a one-dimensional, coomassie stained, gel. An organic acid
and heavy metal free control (C) is shown for comparison.
kDa

121
Figure 28 shows a two-dimensional gel of the soluble protein fraction of BC13
that was not exposed to organic acids or metals. The gel shown in Figure 28 is
representative of several replicates, and the lack of spots may suggest that the proteome is
not entirely represented using the methods tested, as previous work has predicted that At.
caldus strain KU possesses 2,821 protein coding genes [10]. It may indicate that
relatively few individual proteins are expressed to a great degree, or that the majority of
the proteome could not be visualized using a two-dimensional gel without overloading
the isoelectric focusing gels used in the first dimension of separation. More sensitive
fluorescent dyes were tested without success.
Figure 28. Two-dimensional, coomassie stained, gel of soluble proteins from
Acidithiobacillus caldus strain BC13.
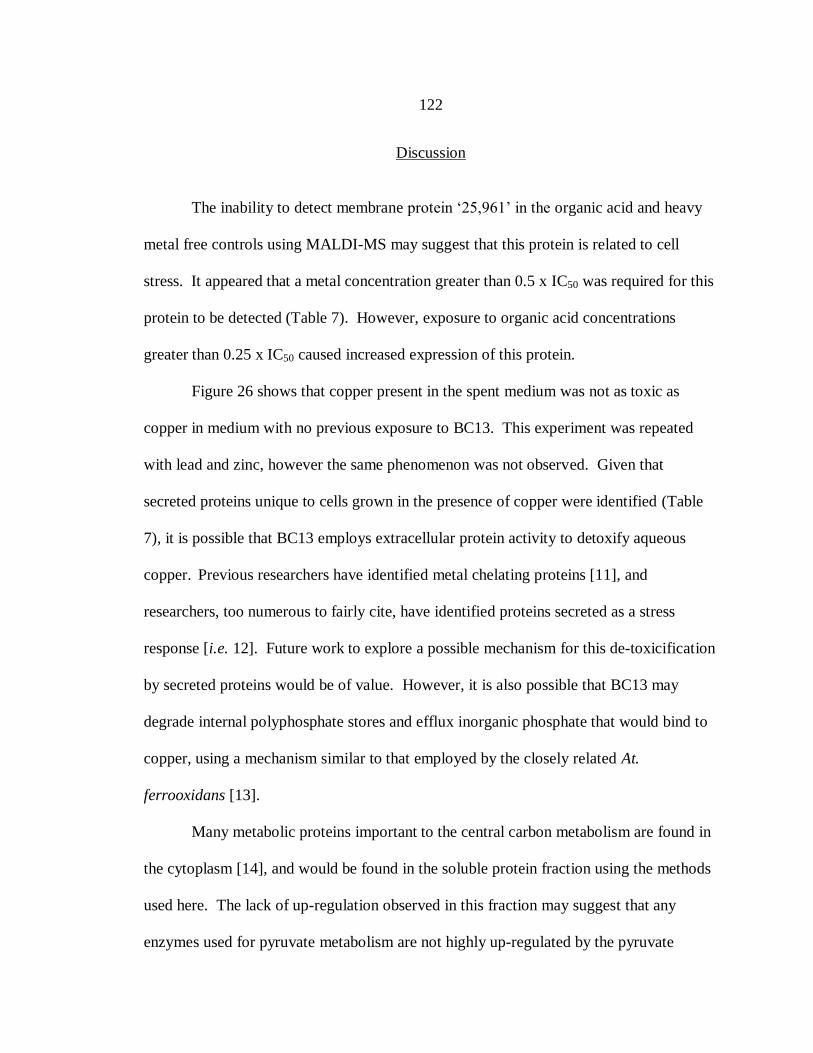
122
Discussion
The inability to detect membrane protein „25,961‟ in the organic acid and heavy
metal free controls using MALDI-MS may suggest that this protein is related to cell
stress. It appeared that a metal concentration greater than 0.5 x IC50 was required for this
protein to be detected (Table 7). However, exposure to organic acid concentrations
greater than 0.25 x IC50 caused increased expression of this protein.
Figure 26 shows that copper present in the spent medium was not as toxic as
copper in medium with no previous exposure to BC13. This experiment was repeated
with lead and zinc, however the same phenomenon was not observed. Given that
secreted proteins unique to cells grown in the presence of copper were identified (Table
7), it is possible that BC13 employs extracellular protein activity to detoxify aqueous
copper. Previous researchers have identified metal chelating proteins [11], and
researchers, too numerous to fairly cite, have identified proteins secreted as a stress
response [i.e. 12]. Future work to explore a possible mechanism for this de-toxicification
by secreted proteins would be of value. However, it is also possible that BC13 may
degrade internal polyphosphate stores and efflux inorganic phosphate that would bind to
copper, using a mechanism similar to that employed by the closely related At.
ferrooxidans [13].
Many metabolic proteins important to the central carbon metabolism are found in
the cytoplasm [14], and would be found in the soluble protein fraction using the methods
used here. The lack of up-regulation observed in this fraction may suggest that any
enzymes used for pyruvate metabolism are not highly up-regulated by the pyruvate

123
concentration, and did not increase through subsequent adaptations in the presence of
pyruvate. This may also suggest that increases in the specific growth rate observed after
subsequent adaptations to pyruvate, lead, zinc, and copper (chapters 3 and 4; Figures 10,
14, and 15) may be due to the regulation of proteins peripheral or integral to the
membrane. However, it is important to note that a single discernable band may constitute
several proteins, since only one dimension of separation was used. Because of this,
changes in protein expression can occur without being detected by changes in the band
intensity. For this reason, no firm conclusions can be drawn regarding a lack of protein
up-regulation. Figures 26 and 27 suggest that pyruvate, lead, zinc, and copper affect the
expression of peripheral- and integral-membrane proteins. Interestingly, Figure 27
indicates the up-regulation of a protein band from the integral-membrane fraction at
about 25 kDa, this supports results from the MALDI-MS analysis. The secreted proteins
identified in the presence of copper using MALDI-MS may have originated as proteins
peripheral to the membrane [14], or in the soluble fraction of the cytoplasm or periplasm
[14]. However, no proteins of this size were observed to be up-regulated from these
fractions on one-dimensional gels. Conversely, there was an up-regulated protein of
approximately 10 kDa in the integral-membrane fraction (Figure 27). Typically, integral
proteins are not secreted [14], however it is conceivable that some peripheral proteins
may not elute in the salt wash used to extract these proteins from the membrane
(Appendix J), instead remaining in the integral fraction.
124
Conclusions
The results presented here strongly suggest that BC13 can modify the expression
of proteins to adapt to stresses of organic acids and heavy metals. These changes in
protein expression may be related to the increased specific growth rates described in
chapters 3 and 4 when BC13 was pre-adapted to organic acids and heavy metals,
respectively (Figures 10 and 14). If this is the case, these proteins, and the regulatory
systems that govern their expression would have significant importance in microbial
activity in biomining environments.
Although the results presented here do not completely elucidate the effects of
organic acids and heavy metals on the proteome of BC13, they indicate that proteins up-
regulated in response to organic acids and heavy metals. Given the importance of this
microorganism in biomining and remediation, any proteins that are up-regulated in
response to organic acid or metal stress may be of commercial interest. These results lay
the foundation for future work, including the identification of up-regulated proteins, and
determination of organic acid and heavy metal tolerance mechanisms employed by At.
caldus.

125
References
1. Hallberg KB, Lindstrom EB (1994) Characterization of Thiobacillus caldus sp.
Nov., a moderately thermophilic acidophile. Microbiology 140:3451-3456.
2. Rawlings DE (2002) Heavy metal mining using microbes. Annu Rev Microbiol
56:65-91.
3. Gu XY, Wong JWC (2007) Degradation of inhibitory substances by heterotrophic
microorganisms during bioleaching of heavy metals from anaerobically digested
sewage sludge. Chemosphere 69:311–318.
4. Marchland EA, Silverstein J (2003) The role of enhanced heterotrophic bacterial
growth on iron oxidation by Acidithiobacillus ferrooxidans. Geomicrobiol J
20:231–244.
5. Olson GJ, Brierley JA, Brierley CL (2003) Bioleaching review. Part B: Progress
in bioleaching: Applications of microbial processes by the mineral industries.
Appl Microbiol Biotechnol 63:249–257.
6. Dopson M, Lindstrom EB, Hallberg KB (2001) Chromosomally encoded
arsenical resistance of the moderately thermophilic acidophile Acidithiobacillus
caldus. Extremophiles 5:247-255.
7. Kotze AA, Tuffin IM, Deane SM, Rawlings DE (2006) Cloning and
characterization of the chromosomal arsenic resistance genes from
Acidithiobacillus caldus and enhanced arsenic resistance on conjugal transfer of
ars genes located on transposon TnAtsArs. Microbiology 152:3551-3560.
8. Tuffin M, Hector SB, Deane SM, Rawlings DE (2006) Resistance determinants of
a highly arsenic-resistant strain of Leptospirillum feriphilum isolated from a
commercial biooxidation tank. Appl Environ Microbiol 72:2247-2253.
9. Van Zyl LJ, van Munster JM, Rawlings DE (2008) Construction of ArsH and
TetH mutants of the sulfur-oxidizing bacterium Acidithiobacillus caldus by
marker exchange. App Environ Microbiol 74:5686-5694.
10. Valdes J, Quatrini R, Hallberg K, Dopson M, Valenzuela PDT, Holmes DS
(2009) Draft genome sequence of the extremely acidophilic bacterium
Acidithiobacillus caldus ATCC 51756 reveals metabolic versatility in the genus
Acidithiobacillus. J Bact 191:5877-5878.

126
11. Goldenberg DM, Griffiths GL, Hansen HJ (1998) Detection and therapy of
lesions with biotin/advetin-metal chelating protein. U.S. patent application #
5,736,119.
12. Martin CA, Kurkowski DL, Valentino AM, Santiago-Schwarz F (2009) Increased
intracellular, cell surface, and secreted inducible heat shock protein 70 responses
are triggered during the monocyte to dendritic cell (DC) transition by cytokines
independently of heat stress and infection and may positively regulate DC growth.
J Immunol 183:388-399.
13. Alvarez S, Jerez C (2004) Copper ions stimulate polyphosphate degradation and
phosphate efflux in Acidithiobacillus ferrooxidans, Appl Enviro. Microbiol
70:5177-5182.
14. White D (2007) The Physiology and Biochemistry of Prokaryotes, 3rd
Edition.
Oxford University Press, Indiana University 1-45.
127
CHAPTER SEVEN
SUMMARY
Conclusions
At. caldus is an important, yet relatively uncharacterized bacterium in acid-mine
environments. Several papers have suggested that At. caldus plays an important role in
metal solubilization and acid-mine formation [1-5], however studies of intrinsic
interactions with compounds relevant to acid-mine environments, organic acids and
heavy metals, have been limited.
For the first time, the effects of organic acids on At. caldus were studied in detail.
Pyruvate, acetate, 2-ketoglutarate, succinate, fumarate, malate, and oxaloacetate have all
been identified in the spent medium of chemolithoautotrophic acidophiles [6], and each
exhibited toxic effects towards BC13. Oxaloacetate was observed to inhibit growth
completely at a concentration of 250 M, whereas other organic acids were completely
inhibitory at concentrations between 1,000 and 5,000 M. In these experiments, the
measured concentrations of organic acids decreased with time, indicating uptake,
transformation, or assimilation by the cells. PLFA analysis indicated an effect of organic
acids on the cellular envelope. Notable differences included an increase in cyclic fatty
acids, indicating possible instability of the cellular envelope. This was supported by
FESEM images showing sloughing in cells grown in the presence of organic acids.
To determine whether the decrease in organic acid concentrations in batch
cultures was due to catabolic oxidation or anabolic assimilation, the ability of BC13 to
128
grow using several different organic acids was tested under heterotrophic and
mixotrophic conditions. No cell growth was observed under heterotrophic conditions;
however, effluent cell concentrations increased over three-fold when pyruvate was
presented with potassium tetrathionate compared to cultures containing only potassium
tetrathionate or potassium tetrathionate and any of the other organic acids tested. In
addition, the pyruvate concentration of the effluent decreased to below the detection limit
and oxygen consumption increased by approximately 100%, compared to chemostat
cultures supplied with other organic acids and potassium tetrathionate or only potassium
tetrathionate. Batch experiments confirmed that BC13 grew using pyruvate as a sole
carbon source. This is significant, as the presence of mixotrophic activity can
significantly increase leaching kinetics in acid-mine environments [7-10].
The single and combined toxicities of lead, zinc, and copper under batch
conditions suggest that BC13 is at least as tolerant of metals as other acidithiobacilli.
Direct comparisons are difficult as previous studies with At. ferrooxidans and At.
thiooxidans did not use direct cell quantification or a soluble substrate [i.e., 11,12]. In
addition, the importance of inoculum history was tested by pre-adapting cultures to lead,
zinc, and copper via subsequent transfers. These cultures had specific growth rates that
were 39 ± 11, 32 ± 7, and 28 ± 12% higher in the presence of lead, zinc, or copper IC50s,
respectively, compared to cultures that had not been pre-adapted. Similar results were
observed using organic acids.
To further investigate the role of At. caldus in metal transport, and to evaluate it
as a candidate for metal remediation in acidic waste streams, the effects of pH and

129
temperature on lead, zinc, and copper sorption to viable and dehydrated BC13 cells were
studied using a Langmuir model. Copper exhibited the highest loading capacity, 4.76 ±
0.28 mmol g-1
, to viable cells at pH 5.5. The pHs that maximized loading capacities and
affinities were generally between 4.0 and 5.5, where the sum of the free proton and
complexed metal concentrations was near a minimum. Of additional importance, lead,
zinc, and copper sorbed to viable cells at pH values as low as 1.5. Previous studies with
other acidithiobacilli did not measure viable-cell sorption below pH 3.0, indicating that
At. caldus may be important in metal fate and transport in acidic environments.
Finally, results suggest that BC13 modifies the expression of proteins to adapt to
the stresses of the organic acids; pyruvate, acetate, 2-ketoglutarate, succinate, fumarate,
malate, and oxaloacetate, and the metals; lead, zinc, and copper. These changes in
protein expression may be related to the increased specific growth rates observed when
BC13 was pre-adapted to organic acids or metals through subsequent culturing, compared
to un-adapted cultures. If this is the case, these proteins, and the regulatory systems that
control their expression are important to microbial activity in acid-mine environments.
This dissertation improves the characterization of At. caldus, and has laid the
foundation for future work with this important biomining microorganism.
Future Work
Results in chapter two show that oxaloacetate was the most toxic organic acid
tested. Oxaloacetate was also the only organic acid with a pKa below the medium pH
(2.15 compared to 2.5). This would suggest that oxaloacetate protonates to a lesser
degree than the other organic acids, and would therefore diffuse into the cell less readily.

130
Within the near pH-neutral cytoplasm, the organic acids tested would de-protonate to
virtually identical extents, as all have a pKa below 5.5. This would suggest that the
weaker acids should be more toxic, as they may more readily diffuse into the cell.
However, if the toxic effects are not manifested until intracellular pH decreases to below
6.0, oxaloacetate may then de-protonate to a more significant extent, explaining its higher
toxicity. Another plausible explanation is that the toxic effects of organic acids are
manifested in the periplasmic space, disrupting the pH gradient, and subsequently the
proton motive force, that exists between the cellular surface and the cytoplasm. To this
end, pH homeostasis studies would be useful to correlate intracellular pH changes with
organic acid uptake. In addition, tests with other organic acids with low pKa values
would help support or contradict this hypothesis.
Chapter three presented strong empirical evidence that BC13 assimilated pyruvate
under mixotrophic conditions. This work would be further supported by experiments
using C14
-labeled pyruvate. The use of a scintillation counter to close the C14
mass
balance across culture fractions could confirm the assimilation of pyruvate into cellular
material. This approach could also suggest a mechanism for pyruvate assimilation. For
example, C14
detected in the headspace would indicate that the pyruvate is oxidized to
carbon dioxide, and then fixed via autotrophic pathways, such as the Calvin cycle. In
addition, enzyme assays, coupled with quantitative-PCR analysis could help to identify
an exact mechanism by which BC13 uses pyruvate.
BC13 was not observed to use acetate, 2-ketoglutarate, succinate, fumarate,
malate, or oxaloacetate, even though some of the proteins necessary for their metabolism

131
were predicted from the partial genome of At. caldus strain KU [13]. Additional
chemostat experiments using various influent concentrations and dilution rates would be
useful to determine if measurable assimilation may be observed at different
concentrations and growth rates.
The results presented in chapter six are preliminary, although they strongly
suggest that BC13 regulated protein expression to adapt to organic acid and metal
exposure. Proteins that affect the activity of this important biomining bacterium in the
presence of relevant compounds may be of commercial interest. Identifying proteins
from one-dimensional gels carries the difficulty of several proteins possibly having
similar molecular weights. Ideally, proteins could be separated on a two-dimensional gel;
however BC13 appears to express a select few proteins to a relatively high degree,
making it difficult to fully represent the proteome without saturating the isoelectric
focusing gel. Further efforts should be made to separate the proteome into sub fractions
prior to two-dimensional gel separation. For example, one possible solution is to use
ultra-centrifugation to separate fractions by molecular weight. In addition, varying the
ampholyte concentration during iso-electric focusing may facilitate focusing of heavier
protein loads, and allow for the enumeration of more dilute proteins during two-
dimensional gel electrophoresis. Finally, given the recently annotated genome of At.
caldus strain KU [13], a genome-wide protein array may be useful for initially qualifying
up and down-regulation of protein translation in the presence of heavy metals and organic
acids [14].
132
The completion of these suggested tasks would compliment the results presented
here, and contribute further to not only the understanding of At. caldus, but the
acidithiobacilli genus, and microbial activity in acid-mine environments in general.

133
References
1. Goebel BM, Stackebrandt E (1994) Cultural and phylogenetic analysis of mixed
microbial populations found in natural and commercial bioleaching environments.
Appl Environ Microbiol 60:1614-1621.
2. Okibe N, Gericke M, Hallberg KB, Johnson DB (2003) Enumeration and
characterization of acidophilic microorganisms isolated for a pilot plant stirred-
tank bioleaching operation. Appl Environ Microbiol 69:1936-1943.
3. McGuire MM, Edwards KJ, Banfield JF, Hamers RJ (2001) Kinetics, surface
chemistry, and structural evolution of microbially mediated sulfide mineral
dissolution. Geochem Geophys Geosyst 65:1243-1258.
4. Dopson M, Lindstrom EB (1999) Potential role of Thiobacillus caldus in
arsenopyrite bioleaching. Appl Environ Microbiol 65:36-40.
5. Zhou QG, Bo F, Bo ZH, Xi L, Jian G, Fei LF, Hau CH (2007) Isolation of a strain
of Acidithiobacillus caldus and its role in bioleaching of chalcopyrite. World J
Microbiol Biotechnol 23:1217-1225.
6. Schnaitman C, Lundgren D (1965) Organic compounds in the spent medium of
Ferrobacillus ferrooxidans. Can J Microbiol 1:23-27.
7. Dopson M, Lindstrom EB (1999) Potential role of Thiobacillus caldus in
arsenopyrite bioleaching. Appl Environ Microbiol 65:36-40.
8. Edwards KJ, Bond PL, Banfield JF (2000) Characteristics of attachment and
growth of Thiobacillus caldus on sulphide minerals: a chemotactic response to
sulphur minerals? Environ Microbiol 2:324-332.
9. Fu B, Zhou H, Zhang R, Qiu G (2008) Bioleaching of chalcopyrite by pure and
mixed cultures of Acidithiobacillus spp. and Leptospirillum ferriphilum. Int J
Biodeteriat and Biodegrad 62:109-115.
10. McGuire MM, Edwards KJ, Banfield JF, Hamers RJ (2001) Kinetics, surface
chemistry, and structural evolution of microbially mediated sulfide mineral
dissolution. Geochem Cosmochim Acta 65:1243-1258.
11. Barreira RPR, Villar LD, Garcia O (2005) Tolerance to copper and zinc of
Acidithiobacillus thiooxidans isolated from sewage sludge. World J Microbiol
Biotechnol 21:89-91.

134
12. Chen BY, Chen YW, Wu DJ, Cheng YC (2003) Metal toxicity assessment upon
indigenous Thiobacillus thiooxidans BC1. Environ Eng Sci 20:375-385.
13. Valdes J, Quatrini R, Hallberg K, Dopson M, Valenzuela PDT, Holmes DS
(2009) Draft genome sequence of the extremely acidophilic bacterium
Acidithiobacillus caldus ATCC 51756 reveals metabolic versatility in the genus
Acidithiobacillus. J Bact 191:5877-5878.
14. MacBeath G (2002) Protein microarrays and proteomics. Nature 32:526-532.

135
APPENDICES

136
APPENDIX A
ABILITY OF ACIDITHIOBACILLUS CALDUS STRAIN BC13 TO GROW USING
VARIOUS ELECTRON DONOR/ACCEPTOR PAIRS
137
Abstract
The results reported in this Appendix suggest that BC13 is not able to grow
anaerobically when ferric iron was available as the electron acceptor coupled to the
oxidation of either molecular hydrogen or reduced sulfur compounds, as cell
concentrations did not increase significantly, and the concentration of ferric iron in the
growth medium did not decrease. In addition, BC13 was not able to grow when
molecular hydrogen was available as an electron donor and tetrathionate or elemental
sulfur were available as electron accepters, as cell concentrations were not observed to
increase. Also, when ferrous iron was supplied as an electron donor under aerobic
conditions, no cell growth was observed, and ferrous iron concentrations did not
decrease. However, cells concentrations did increase when molecular hydrogen was
supplied as an electron donor under aerobic conditions, suggesting that BC13 is capable
of oxidizing molecular hydrogen. These results suggest that the activity of BC13 may be
limited in anoxic regions, such as subsurface and deep-ore environments.
Introduction
At. caldus is a chemolithotrophic autotroph that is capable of oxidizing reduced
sulfur compounds, including elemental sulfur, sulfide, tetrathionate, and thiosulfate as
energy sources under aerobic conditions. In addition, At. caldus strain KU can oxidize
molecular hydrogen aerobically [1]. At. caldus has not been observed to grow using
organic compounds as sole electron donors, however it has been observed to use glucose
and yeast extract [1], and as reported in chapter 3, pyruvate as carbon sources under

138
mixotrophic growth conditions. To date, At. caldus has not been observed to grow in
anaerobic environments, however, the closely related At. ferrooxidans can oxidize sulfur
anaerobically, using ferric iron as an electron acceptor [2].
The metabolic traits described above, coupled to the ability of At. caldus to thrive
at low pH (optimal growth between pH 2.0 and 3.0) and warm temperatures (optimal
growth at 45°C) [1] contribute to its prevalence in biomining environments [3-6], where
it is believed to play an important role in mineral leaching [7-9]. The results presented in
the body of this dissertation have significantly improved the characterization of this
important microorganism, however the lack of studies with At. caldus in anaerobic
environments has lead to an incomplete understanding of this microorganism‟s potential,
specifically in subsurface and deep-ore environments, where anoxic conditions may exist
[10].
The work presented in this Appendix summarizes experiments that further
characterize the metabolic flexibility of At. caldus, specifically its ability to reduce ferric
iron under anaerobic conditions, and oxidize ferrous iron and molecular hydrogen was
tested. Although, the following report does not represent a comprehensive study of
possible catabolic activity, it does improve the general understanding of this
microorganism‟s metabolic capabilities, and provides important information for future
researchers who may expand on this work.

139
Materials and Methods
Microorganism, Media, and Growth Conditions
BC13 (ATCC 51757) was grown in a basal salts medium [1]. The medium was
autoclaved for 15 minutes at 121°C and 22 psig and allowed to cool to room temperature.
A trace element solution [1] was then added to a concentration of 1 mL L-1
, and the pH
was then adjusted to 2.5 using 6N sulfuric acid. Solid electron donors and acceptors were
added via a filter sterilized (0.2 m) solution to a concentration of 5 mM. Table 8 lists
electron donor/acceptor pairs tested. The media were aliquoted into 125-mL serum
bottles (50 mL medium volume), and capped with butyl-rubber stoppers. Anaerobic
samples were purged with filter sterilized (0.2 m) nitrogen gas for 30 minutes. Each
sample was then pressurized to 5 atm using a filter sterilized (0.2 m), 80:20 mixture of
nitrogen and carbon dioxide gas. The carbon dioxide provided the sole carbon source. If
molecular hydrogen was used as the electron donor, the serum bottles were pressurized
an additional 5 atm using a filter sterilized (0.2 m) 95:5 mixture of nitrogen and
hydrogen gas. Cells preserved at 4°C in nanopure water (17.4 M with the pH adjusted
to 3.0 using 6N sulfuric acid, provided the initial inoculum. Aliquots that provided initial
cell densities of approximately 2.5 x 10⁶ cells mL
-1 were used. The serum bottles were
shaken at 150 rpm in a temperature controlled incubator at 45°C. Cell concentrations
were measured at regular time intervals using direct cell counts with a Petroff-counting
chamber (Hausser Scientific, Horsham, PA, U.S.A.) and a transmitted-light microscope
(Zeiss, Thornwood, N.Y., U.S.A.). In experiments where ferrous or ferric iron were used

140
as an electron donor or acceptor, FerroZine® kits (Hach Company, Loveland, CO,
U.S.A.) were used to measure changes in their respective concentrations. Each
experiment was repeated in triplicate so that average values and 95% confidence intervals
could be calculated.
Table 8. Pairs of electron donor/acceptors tested for growth.
Electron donor Electron acceptor
Tetrathionate Ferric iron
Sulfur Ferric iron
Ferrous iron Oxygen
Hydrogen Tetrathionate
Hydrogen Sulfur
Hydrogen Ferric iron
Hydrogen Oxygen
Results
Figure 29 shows that BC13 did not grow over a period of 350 hours when any of
the electron donor/acceptor pairs were used with the exception of hydrogen/oxygen.
When hydrogen was supplied as an electron donor under aerobic conditions cell
concentrations increased from 2.83 ± 0.29 x 10⁶ cells mL
-1, at time 0, to 6.58 ± 0.65 x 10
6
cells mL-1
, after 169 hours. The cell concentration then remained relatively steady
between 169 and 350 hours. A lag time of between 96 and 138 hours was observed prior
to growth (Figure 29). No significant changes in the ferrous or ferric iron concentrations
were observed in any of the experiments (see raw data, following text).

141
0.0E+00
1.0E+06
2.0E+06
3.0E+06
4.0E+06
5.0E+06
6.0E+06
7.0E+06
8.0E+06
0 100 200 300 400
Elapsed Time (h)
Cel
l co
nce
ntr
atio
n (
cell
s m
L-1
)
Potassium Tetrathionate Only
Sulfur/Ferric Iron
Hydrogen/Ferric Iron
Potassium Tetrathionate/Ferric Iron
Hydrogen/Oxygen
Hydrogen/Sulfur
Hydrogen/Potassium Tetrathionate
Ferrous Iron/Oxygen
Figure 29. Changes in Acidithiobacillus caldus strain BC13 cell concentrations when
grown using various electron donor/acceptor pairs. Error bars represent 95% confidence
intervals.
Discussion
The results presented in this Appendix suggest that BC13 is not able to use
ferric iron as a terminal electron acceptor, as no growth was observed on this substrate
when several different reduced sulfur compounds and molecular hydrogen were tested as
corresponding electron donors. This indicates that BC13 is unlikely to grow using any
electron donor coupled to ferric iron, as past reports have reported growth of At. caldus
when reduced sulfur compounds or molecular hydrogen were coupled with oxygen [1].
For similar reasons, it is unlikely that BC13 can oxidize ferrous iron, as it was not
observed to in these experiments when coupled with oxygen. However, Figure 29 shows
that BC13 can grow when molecular hydrogen was supplied as the sole electron donor
under aerobic conditions. This was also observed by Hallberg and Lindstrom using strain

142
KU [1]. The experimental observations reported in this Appendix have been supported
by the subsequent publication of the genome for At. caldus strain KU by Valdez et al.,
where the genes necessary for hydrogen oxidation were predicted, however those
necessary for iron oxidation and reduction were not [11,12].
143
References
1. Hallberg KB, Lindstrom EB (1994) Characterization of Thiobacillus caldus sp.
Nov., a moderately thermophilic acidophile. Microbiology 140:3451-3456.
2. Pronk JT, Bos BP, Kuenen JG (1992) Anaerobic growth of Thiobacillus
ferrooxidans. App Environ Microbiol 58:2227-2230.
3. Burton NP, Norris PR (2000) Microbiology of acidic, geothermal springs of
Montserrat: environmental rDNA analysis. Extremophiles 4:315-320.
4. Druschel GK, Baker BJ, Gihiring TM, Banfield JF (2004) Acid mine drainage
biogeochemistry at Iron Mountain, California. Geochem Trans 5:12-32.
5. Goebel BM, Stackebrandt E (1994) Cultural and phylogenetic analysis of mixed
microbial populations found in natural and commercial bioleaching environments.
Appl Environ Microbiol 60:1614-1621.
6. Okibe N, Gericke M, Hallberg KB, Johnson DB (2003) Enumeration and
characterization of acidophilic microorganisms isolated for a pilot plant stirred-
tank bioleaching operation. Appl Environ Microbiol 69:1936-1943.
7. McGuire MM, Edwards KJ, Banfield JF, Hamers RJ (2001) Kinetics, surface
chemistry, and structural evolution of microbially mediated sulfide mineral
dissolution. Geochem Geophys Geosyst 65:1243-1258.
8. Dopson M, Lindstrom EB (1999) Potential role of Thiobacillus caldus in
arsenopyrite bioleaching. Appl Environ Microbiol 65:36-40.
9. Zhou QG, Bo F, Bo ZH, Xi L, Jian G, Fei LF, Hau CH (2007) Isolation of a strain
of Acidithiobacillus caldus and its role in bioleaching of chalcopyrite. World J
Microbiol Biotechnol 23:1217-1225.
10. Stromberg B, Banwart S (1994) Kinetic modeling of geochemical processes at the
Aitik mining waste rock site in Northern Sweden. App Geochem 9:583-595.
11. Valdes J, Pedroso I, Quatrini R, Holmes DS (2008) Comparative genome analysis
of Acidithiobacillus ferrooxidans, A. thiooxidans and A. caldus: insights into their
metabolism and ecophysiology. Hydrometallurgy 94:180-184.
144
12. Valdes J, Quatrini R, Hallberg K, Dopson M, Valenzuela PDT, Holmes DS
(2009) Draft genome sequence of the extremely acidophilic bacterium
Acidithiobacillus caldus ATCC 51756 reveals metabolic versatility in the genus
Acidithiobacillus. J Bact 191:5877-5878.

145
Raw Data
Table A.1. BC13 cell concentrations when various electron donor/acceptor pairs were
provided. Experiments were repeated in triplicate and average values, standard
deviations (STDEV), and 95% confidence intervals (95% CI) are shown. Concentrations
are given in cells mL-1
.
Potassium Tetrathionate Only
Elapsed Time (h) Trial 1
0 2.44E+06
48 2.19E+06
96 2.31E+06
138 2.13E+06
169 2.19E+06
192 2.25E+06
305 1.75E+06
326 1.88E+06
350 1.88E+06
Sulfur/Ferric Iron
Elapsed Time (h) Trial 1 Trial 2 Trial 3 Average STDEV 95% CI
0 2.00E+06 2.38E+06 2.25E+06 2.21E+06 1.91E+05 2.16E+05
48 1.88E+06 2.13E+06 2.25E+06 2.08E+06 1.91E+05 2.16E+05
96 2.13E+06 2.13E+06 2.25E+06 2.17E+06 7.22E+04 8.17E+04
138 2.38E+06 2.88E+06 3.00E+06 2.75E+06 3.31E+05 3.74E+05
169 2.13E+06 2.38E+06 2.63E+06 2.38E+06 2.50E+05 2.83E+05
192 1.88E+06 2.13E+06 2.35E+06 2.12E+06 2.38E+05 2.69E+05
305 1.63E+06 1.88E+06 2.19E+06 1.90E+06 2.82E+05 3.19E+05
326 1.50E+06 1.66E+06 1.88E+06 1.68E+06 1.88E+05 2.13E+05
350 1.25E+06 1.56E+06 1.66E+06 1.49E+06 2.15E+05 2.43E+05
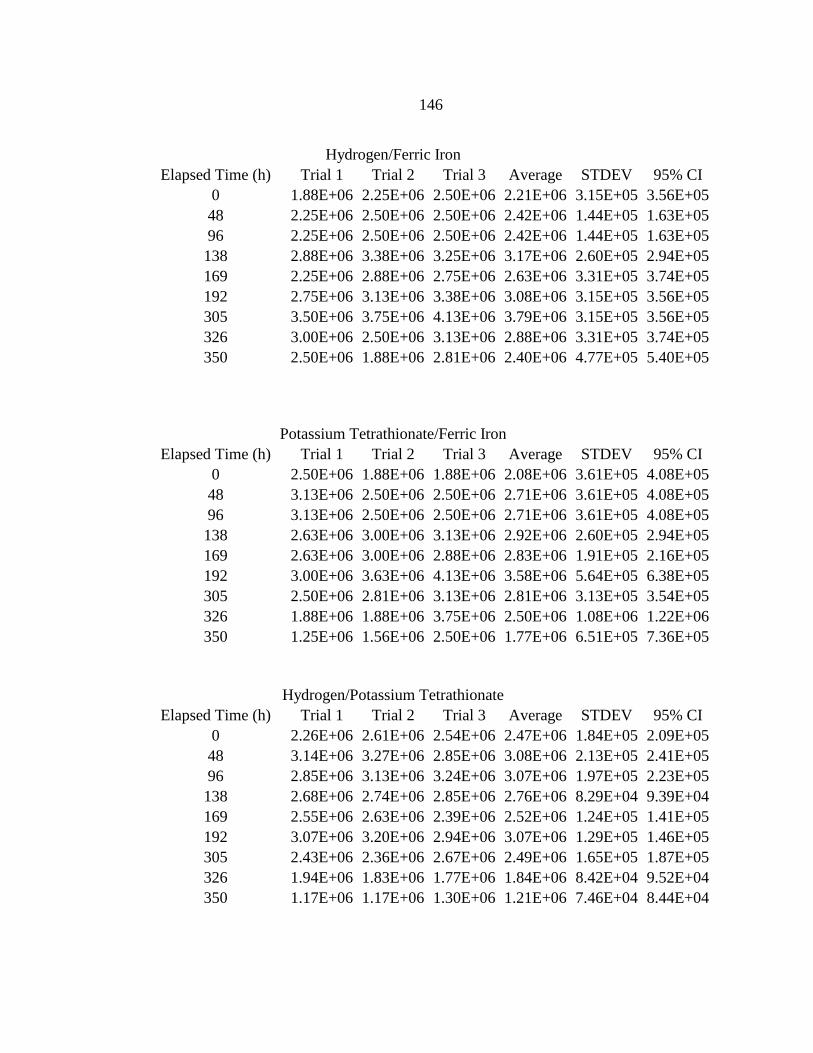
146
Hydrogen/Ferric Iron
Elapsed Time (h) Trial 1 Trial 2 Trial 3 Average STDEV 95% CI
0 1.88E+06 2.25E+06 2.50E+06 2.21E+06 3.15E+05 3.56E+05
48 2.25E+06 2.50E+06 2.50E+06 2.42E+06 1.44E+05 1.63E+05
96 2.25E+06 2.50E+06 2.50E+06 2.42E+06 1.44E+05 1.63E+05
138 2.88E+06 3.38E+06 3.25E+06 3.17E+06 2.60E+05 2.94E+05
169 2.25E+06 2.88E+06 2.75E+06 2.63E+06 3.31E+05 3.74E+05
192 2.75E+06 3.13E+06 3.38E+06 3.08E+06 3.15E+05 3.56E+05
305 3.50E+06 3.75E+06 4.13E+06 3.79E+06 3.15E+05 3.56E+05
326 3.00E+06 2.50E+06 3.13E+06 2.88E+06 3.31E+05 3.74E+05
350 2.50E+06 1.88E+06 2.81E+06 2.40E+06 4.77E+05 5.40E+05
Potassium Tetrathionate/Ferric Iron
Elapsed Time (h) Trial 1 Trial 2 Trial 3 Average STDEV 95% CI
0 2.50E+06 1.88E+06 1.88E+06 2.08E+06 3.61E+05 4.08E+05
48 3.13E+06 2.50E+06 2.50E+06 2.71E+06 3.61E+05 4.08E+05
96 3.13E+06 2.50E+06 2.50E+06 2.71E+06 3.61E+05 4.08E+05
138 2.63E+06 3.00E+06 3.13E+06 2.92E+06 2.60E+05 2.94E+05
169 2.63E+06 3.00E+06 2.88E+06 2.83E+06 1.91E+05 2.16E+05
192 3.00E+06 3.63E+06 4.13E+06 3.58E+06 5.64E+05 6.38E+05
305 2.50E+06 2.81E+06 3.13E+06 2.81E+06 3.13E+05 3.54E+05
326 1.88E+06 1.88E+06 3.75E+06 2.50E+06 1.08E+06 1.22E+06
350 1.25E+06 1.56E+06 2.50E+06 1.77E+06 6.51E+05 7.36E+05
Hydrogen/Potassium Tetrathionate
Elapsed Time (h) Trial 1 Trial 2 Trial 3 Average STDEV 95% CI
0 2.26E+06 2.61E+06 2.54E+06 2.47E+06 1.84E+05 2.09E+05
48 3.14E+06 3.27E+06 2.85E+06 3.08E+06 2.13E+05 2.41E+05
96 2.85E+06 3.13E+06 3.24E+06 3.07E+06 1.97E+05 2.23E+05
138 2.68E+06 2.74E+06 2.85E+06 2.76E+06 8.29E+04 9.39E+04
169 2.55E+06 2.63E+06 2.39E+06 2.52E+06 1.24E+05 1.41E+05
192 3.07E+06 3.20E+06 2.94E+06 3.07E+06 1.29E+05 1.46E+05
305 2.43E+06 2.36E+06 2.67E+06 2.49E+06 1.65E+05 1.87E+05
326 1.94E+06 1.83E+06 1.77E+06 1.84E+06 8.42E+04 9.52E+04
350 1.17E+06 1.17E+06 1.30E+06 1.21E+06 7.46E+04 8.44E+04

147
Hydrogen/Sulfur
Elapsed Time (h) Trial 1 Trial 2 Trial 3 Average STDEV 95% CI
0 2.58E+06 2.57E+06 2.30E+06 2.49E+06 1.60E+05 1.81E+05
48 3.41E+06 3.42E+06 3.19E+06 3.34E+06 1.31E+05 1.49E+05
96 2.93E+06 3.29E+06 3.37E+06 3.20E+06 2.38E+05 2.69E+05
138 2.56E+06 2.56E+06 2.55E+06 2.56E+06 5.87E+03 6.65E+03
169 2.56E+06 2.85E+06 2.69E+06 2.70E+06 1.44E+05 1.63E+05
192 2.78E+06 2.92E+06 3.06E+06 2.92E+06 1.37E+05 1.55E+05
305 2.68E+06 2.26E+06 2.31E+06 2.42E+06 2.31E+05 2.61E+05
326 1.74E+06 1.75E+06 1.91E+06 1.80E+06 9.64E+04 1.09E+05
350 1.25E+06 1.35E+06 1.31E+06 1.30E+06 5.44E+04 6.16E+04
Hydrogen/Oxygen
Elapsed Time (h) Trial 1 Trial 2 Trial 3 Average STDEV 95% CI
0 2.63E+06 3.13E+06 2.75E+06 2.83E+06 2.60E+05 2.94E+05
48 3.13E+06 2.50E+06 2.50E+06 2.71E+06 3.61E+05 4.08E+05
96 3.13E+06 2.50E+06 2.50E+06 2.71E+06 3.61E+05 4.08E+05
138 4.25E+06 4.75E+06 3.63E+06 4.21E+06 5.64E+05 6.38E+05
169 6.25E+06 7.25E+06 6.25E+06 6.58E+06 5.77E+05 6.53E+05
192 5.00E+06 6.00E+06 6.13E+06 5.71E+06 6.17E+05 6.98E+05
305 6.88E+06 6.50E+06 5.63E+06 6.33E+06 6.41E+05 7.26E+05
326 6.88E+06 5.41E+06 5.63E+06 5.97E+06 7.90E+05 8.94E+05
350 6.25E+06 6.25E+06 5.63E+06 6.04E+06 3.61E+05 4.08E+05
Ferrous Iron/Oxygen
Elapsed Time (h) Trial 1 Trial 2 Trial 3 Average STDEV 95% CI
0 2.28E+06 2.67E+06 2.53E+06 2.49E+06 1.93E+05 2.18E+05
48 3.28E+06 2.86E+06 3.18E+06 3.11E+06 2.19E+05 2.48E+05
96 3.17E+06 2.97E+06 3.17E+06 3.10E+06 1.19E+05 1.34E+05
138 2.46E+06 2.62E+06 2.65E+06 2.58E+06 1.01E+05 1.14E+05
169 2.43E+06 2.53E+06 2.38E+06 2.45E+06 7.79E+04 8.82E+04
192 2.86E+06 3.18E+06 3.15E+06 3.06E+06 1.80E+05 2.03E+05
305 2.71E+06 2.74E+06 2.61E+06 2.69E+06 6.85E+04 7.75E+04
326 1.93E+06 1.78E+06 1.75E+06 1.82E+06 9.81E+04 1.11E+05
350 1.30E+06 1.32E+06 1.36E+06 1.33E+06 2.86E+04 3.23E+04
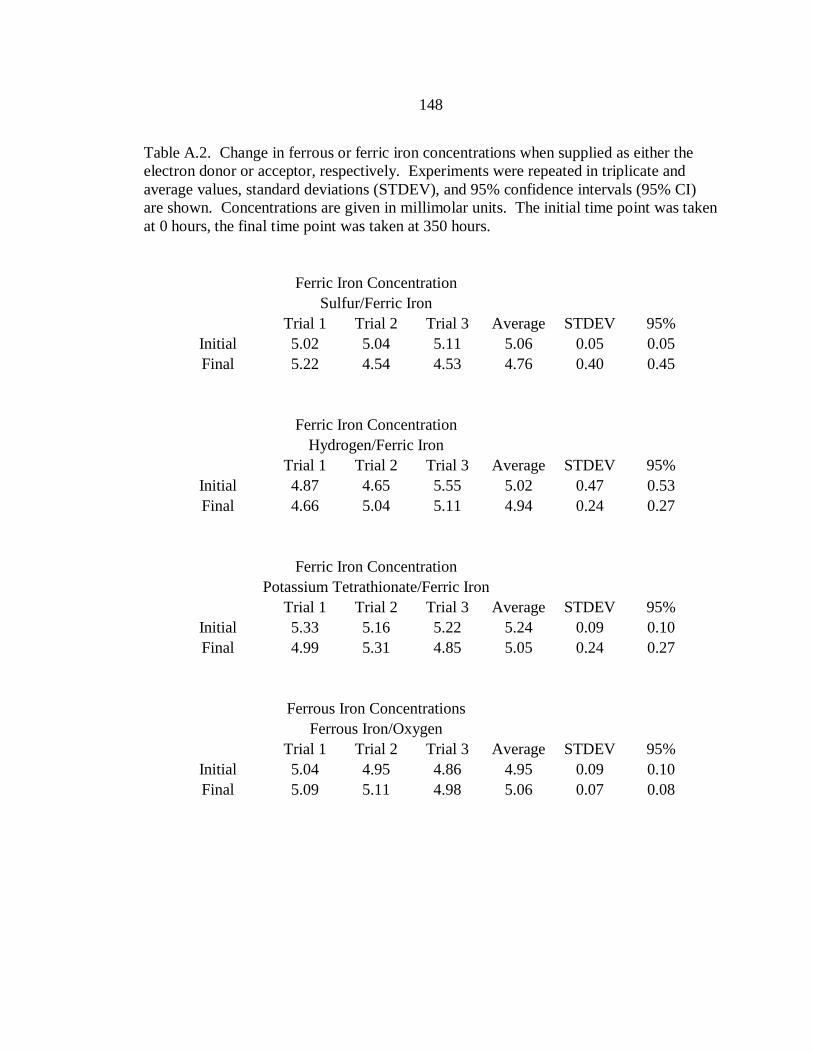
148
Table A.2. Change in ferrous or ferric iron concentrations when supplied as either the
electron donor or acceptor, respectively. Experiments were repeated in triplicate and
average values, standard deviations (STDEV), and 95% confidence intervals (95% CI)
are shown. Concentrations are given in millimolar units. The initial time point was taken
at 0 hours, the final time point was taken at 350 hours.
Ferric Iron Concentration
Sulfur/Ferric Iron
Trial 1 Trial 2 Trial 3 Average STDEV 95%
Initial 5.02 5.04 5.11 5.06 0.05 0.05
Final 5.22 4.54 4.53 4.76 0.40 0.45
Ferric Iron Concentration
Hydrogen/Ferric Iron
Trial 1 Trial 2 Trial 3 Average STDEV 95%
Initial 4.87 4.65 5.55 5.02 0.47 0.53
Final 4.66 5.04 5.11 4.94 0.24 0.27
Ferric Iron Concentration
Potassium Tetrathionate/Ferric Iron
Trial 1 Trial 2 Trial 3 Average STDEV 95%
Initial 5.33 5.16 5.22 5.24 0.09 0.10
Final 4.99 5.31 4.85 5.05 0.24 0.27
Ferrous Iron Concentrations
Ferrous Iron/Oxygen
Trial 1 Trial 2 Trial 3 Average STDEV 95%
Initial 5.04 4.95 4.86 4.95 0.09 0.10
Final 5.09 5.11 4.98 5.06 0.07 0.08
149
APPENDIX B
PRECIPITATION OF COVELLITE IN THE GROWTH MEDIUM OF
ACIDITHIOBACILLUS CALDUS STRAIN BC13
150
Abstract
This Appendix describes the precipitation of covellite during in vitro culturing of
BC13. Covellite was observed to precipitate during the late-exponential growth phase
when copper sulfate was added to concentrations of at least 20 mM. This precipitate
was not observed in abiotic controls, and MINTEQ thermodynamic modeling did not
predict the formation of covellite, and predicted that total precipitation would be ≤ 1.0 mg
L-1
. However, (± 95% confidence intervals) 56 ± 17 mg L-1
of precipitate was measured.
A spot scan of the precipitate using energy-dispersive x-ray spectroscopy (EDX) detected
only copper and sulfur, with a copper to sulfur ratio of 0.83. Powder X-ray diffraction
(p-XRD) analysis suggested that the precipitate was comprised of elemental sulfur and
covellite. At. caldus is believed to increase metal solubilization, contributing towards
acid-mine drainage formation, making these observations particularly interesting, as they
suggest that under the experimental conditions used here, this microorganism may also
facilitate the mineralization of copper.
Introduction
At. caldus is a gram negative bacterium that oxidizes sulfur and reduced sulfur
compounds for energy, and can fix carbon dioxide as a sole carbon source [1-2]. At.
caldus grows from pH 1-4, with optimal growth between pH 2 and 3, and from 32-50°C,
with optimal growth at 45°C [1]. These traits make At. caldus well suited for growth in
many biomining systems [3-6], where recent studies suggest that it may play a significant
role in metal mobilization [7-9].

151
The purpose of this study was to identify a precipitate that formed in the growth
medium of BC13 when copper sulfate was added to concentrations of at least 20 mM.
This precipitate was not predicted by the thermodynamic modeling software, MINTEQ.
Any biogenic mineralization involving At. caldus is interesting as it is an important
microorganism in acid-mine environments, where mineralization and solubilization of
metals are important to biomining and bioremediation.
Methods and Approach
Microorganism, Media, and Growth Conditions
BC13 (ATCC 51757) was grown in a basal salts medium [1]. The medium was
autoclaved for 15 minutes at 121°C and 22 psig and allowed to cool to room temperature.
A trace element solution [1] was then added to a concentration of 1 mL L-1
, and the pH
was adjusted to 2.5 using 6N sulfuric acid. A filter sterilized (0.2 m) solution of
potassium tetrathionate was then added to a concentration of 5 mM, as an electron donor,
and ambient carbon dioxide provided the sole carbon source. A filter sterilized (0.2 m)
copper sulfate solution was added to a concentration of 20 mM. Cells preserved at 4°C in
nanopure water (17.4 M with the pH adjusted to 3.0 using 6N sulfuric acid, provided
the initial inoculum. Aliquots that provided initial cell densities of approximately 5 x 10⁷
cells mL-1
were used. Cells were cultured in 500-mL Erlenmeyer flasks (350 mL medium
volume), fitted with foam stoppers, and shaken at 150 rpm in a temperature controlled
incubator at 45°C (Barnstead 4000Q, Dubuque, IA, U.S.A.). To determine the
coincidence of precipitation with a specific part of the growth cycle, cell concentrations
152
were measured using direct cell counts with a Petroff-counting chamber (Hausser
Scientific, Horsham, PA, U.S.A.) and a phase-contrast microscope (Zeiss, Thornwood,
N.Y., U.S.A.). Sacrificial sampling was used to quantify precipitation with time.
Precipitate samples were collected via centrifugation and dried in a model 40 GC lab
oven (Quincy Lab, Chicago, Il, U.S.A.) at 80°C for 12 hours. Dry weight measurements
were then recorded. Experiments were repeated in triplicate, and average values and
95% confidence intervals were calculated.
Sample Preparation and Analysis
After 144 hours, the precipitate was collected via centrifugation, and washed
using nanopure water (17.4 M This process was repeated three times to remove
medium salts. The sample was re-suspended to a concentration of approximately 50 g L-1
in nanopure water (17.4 M ). An aliquot of 10 L was pipetted onto a silica chip and
allowed to dry for 1 hour at 45°C in a temperature controlled incubator. The silica chips
were fixed onto a carousal stub using carbon tape, and imaged using FESEM (Supra
55VP, Zeiss, Peabody, MA, USA). An accelerating voltage of 1 keV, and aperture
diameter of 30 m were used. A secondary electron detector was used to image the
precipitate. To quantify the elemental composition, the accelerating voltage was
increased to 20 keV, and an EDX detector was used to measure x-ray emission.
For p-XRD analysis, a sample was collected and dried as described above. All of
the powder collected (approximately 100 mg) was poured into a p-XRD sample holder to
facilitate a random orientation of crystal structures. The sample was then analyzed using
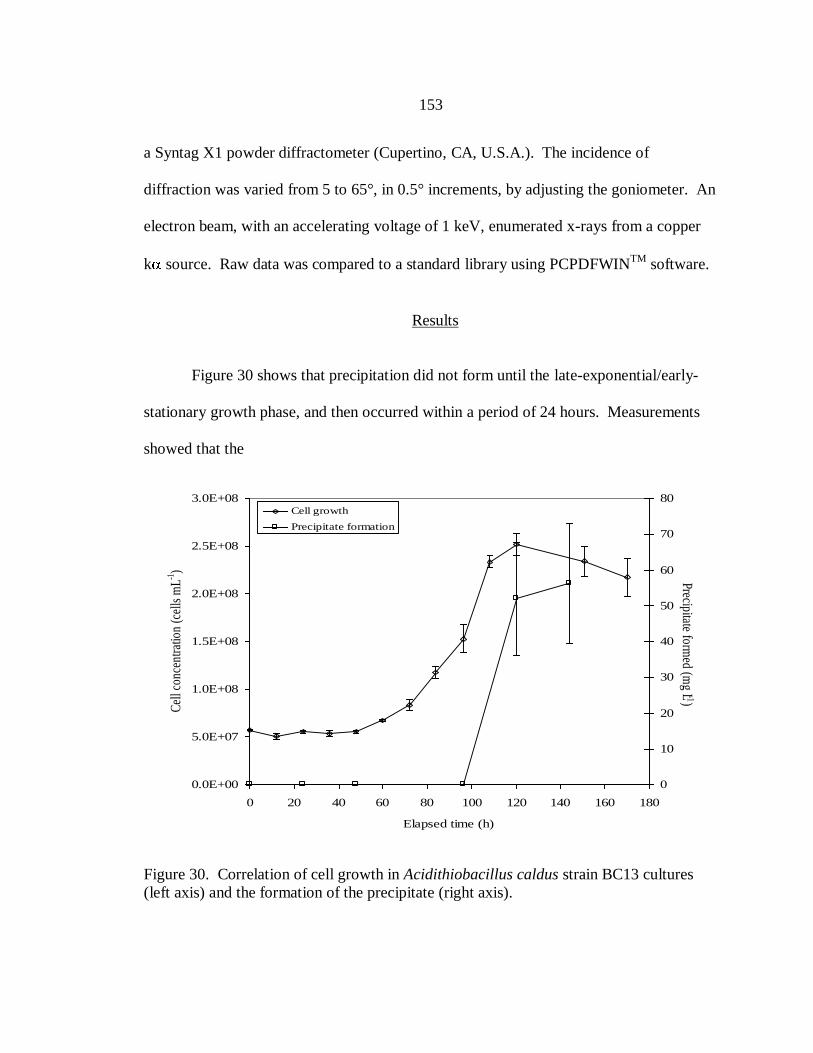
153
a Syntag X1 powder diffractometer (Cupertino, CA, U.S.A.). The incidence of
diffraction was varied from 5 to 65°, in 0.5° increments, by adjusting the goniometer. An
electron beam, with an accelerating voltage of 1 keV, enumerated x-rays from a copper
k source. Raw data was compared to a standard library using PCPDFWINTM
software.
Results
Figure 30 shows that precipitation did not form until the late-exponential/early-
stationary growth phase, and then occurred within a period of 24 hours. Measurements
showed that the
0.0E+00
5.0E+07
1.0E+08
1.5E+08
2.0E+08
2.5E+08
3.0E+08
0 20 40 60 80 100 120 140 160 180
Elapsed time (h)
Cel
l con
cent
ratio
n (c
ells
mL
-1)
0
10
20
30
40
50
60
70
80
Precipitate formed (m
g L -1)
Cell growth
Precipitate formation
Figure 30. Correlation of cell growth in Acidithiobacillus caldus strain BC13 cultures
(left axis) and the formation of the precipitate (right axis).

154
culture pH decreased from 2.5 to 1.9 ± 0.2 (see raw data, following text). Because of
this, MINTEQ was used to model experimental conditions from pH 1.5 to 7.0, since
previous reports suggest that environments local to acidithiobacilli surfaces may be pH
4.0-5.5, and intracellular pH is approximately 6.7 [10].
Table 9. Predicted precipitation using MINTEQ thermodynamic modeling of the
experimental conditions with the pH varied from 1.5 to 7.0. These pH values encompass
a range from the final growth medium pH (1.85 ± 0.17) to the maximum pH measured
within the cytoplasm of acidithiobacilli (6.7).
The results from this modeling are shown in Table 9, and indicate that no
significant precipitation was predicted, further suggesting that the precipitation was
catalyzed via biogenic mechanisms. Figure 31 shows EDX elemental analysis that
corresponds to the accompanying image. The detection of silicon is likely due to the
silica chip that the sample was placed on. The copper to sulfur ratio of the spot scan
shown in Figure 32 is 0.83. These data may suggest the presence of a copper sulfide,
although the relative amount of sulfur is higher than that observed in most copper sulfides
(Table 10). The ratio observed using EDX is closest to that of covellite, however it
pH Copper molybdenate
(CuMoO4)
Brochantite
(Cu4SO4)
Cupric Ferrite
(CuFe2)
Tenorite
(Cu)
1.5 0.43 mg L-1
- -
2.5 0.43 mg L-1
- -
3.5 0.43 mg L-1
- 3.06 mg L-1
-
5.0 0.43 mg L-1
5.43 mg L-1
2.82 mg L-1
-
7.0 0.43 mg L-1
6.1 mg L-1
3.54 mg L-1
0.11 mg L-1

155
should be noted that covellite is often copper rich due to the presence of oxidized copper,
which increases the copper to sulfur ratio.
Element Atomic %
Silicon 21.9
Sulfur 42.6
Copper 35.5
Figure 31. Elemental analysis from an energy dispersive x-ray spectroscopy spot scan.
The red circle approximates the area over which the spot-scan sampled, given an
accelerating voltage of 20 keV.
Table 10. Approximate
copper to sulfur ratios of
several copper sulfide
minerals.
Mineral Cu:S
Anilite 1.75
Covellite 1.0
Chalcocite 2
Digenite 1.8
Djurleite 1.96
Geerite 1.6
Spionkopite 1.39
Figure 32 shows that scattered x-rays from p-XRD
analysis suggest the precipitate contains sulfur and
covellite. The presence of elemental sulfur in the
precipitate may explain the relatively low ratio of
copper to sulfur measured using EDX. A slight
offset in the standard peaks from the raw data can be
seen in Figure 32, for both the covellite standard
(red)

156
and sulfur standard (green). This may be due to instrument to instrument variation in the
angle settings of the goniometer, or errors in calibrating the angle of the goniometer.
Figure 32. Raw data from powder x-ray diffraction analysis with overlays from an
elemental sulfur standard (green) and a covellite standard (red). The reference card
numbers are given in the upper right corner.
In summary, the EDX analysis suggests that the precipitate is comprised of
copper and sulfur, and the p-XRD analysis supports this, as the crystalline structures for
elemental sulfur and covellite were detected. These results are further supported by
visual observations, as covellite has a dark grey to black, sooty appearance when moist
[11], similar to the precipitate visually observed in the growth medium.
Conclusions and Future Directions
The precipitate formed during the exponential growth phase of BC13 cultures is
likely composed of covellite and elemental sulfur. These are interesting results with

157
implications in biomining and the remediation of acid-mine environments. Many
previous researchers have described the ability of At. caldus and similar microorganisms
to facilitate the dissolution of metals from minerals, especially mineral sulfides [i.e. 7-9].
The observations reported here suggest that, under the experimental conditions described,
an opposite effect is also possible. These results warrant further study to determine the
source of the sulfide required for this mineral formation, and to elucidate a specific
mechanism for this formation.
Both elemental sulfur and sulfide may be formed in the periplasm of At. caldus
during the oxidation of tetrathionate via the SOX pathway, and possibly extracellularly
during the oxidation of sulfur via sulfur dehydrogenase [12]. It may be useful to measure
sulfide concentrations at various stages throughout batch growth, and possibly in various
cell fractions. Past work has shown that BC13 can oxidize molecular hydrogen [1].
Therefore, experiments using it as an electron donor, in place of a reduced sulfur
compound, could determine whether the sulfate salts present in the medium may be a
primary source for the sulfide generation. However, no acidithiobacilli have been
observed to use sulfate as an electron acceptor, and it is unlikely that assimilatory sulfate
reduction would result in the amount of sulfide necessary for the precipitation measured
here. Finally, as the precipitation was only observed during the late-exponential/early-
stationary phase of batch growth, chemostat experiments with varying dilution rates
would be interesting to determine if steady state covellite precipitation could be
elucidated at various growth rates.
158
References
1. Hallberg KB, Lindstrom EB (1994) Characterization of Thiobacillus caldus sp.
Nov., a moderately thermophilic acidophile. Microbiology 140:3451-3456.
2. Dopson M, Lindstrom EB, Hallberg KB (2002) ATP generation during reduced
inorganic sulfur compound oxidation by Acidithiobacillus caldus is exclusively
due to electron transport phosphorylation. Extremophiles 6:123-129.
3. Burton NP, Norris PR (2000) Microbiology of acidic, geothermal springs of
Montserrat: environmental rDNA analysis. Extremophiles 4:315-320.
4. Druschel GK, Baker BJ, Gihiring TM, Banfield JF (2004) Acid mine drainage
biogeochemistry at Iron Mountain, California. Geochem Trans 5:12-32.
5. Goebel BM, Stackebrandt E (1994) Cultural and phylogenetic analysis of mixed
microbial populations found in natural and commercial bioleaching environments.
Appl Environ Microbiol 60:1614-1621.
6. Okibe N, Gericke M, Hallberg KB, Johnson DB (2003) Enumeration and
characterization of acidophilic microorganisms isolated for a pilot plant stirred-
tank bioleaching operation. Appl Environ Microbiol 69:1936-1943.
7. McGuire MM, Edwards KJ, Banfield JF, Hamers RJ (2001) Kinetics, surface
chemistry, and structural evolution of microbially mediated sulfide mineral
dissolution. Geochem Geophys Geosyst 65:1243-1258.
8. Dopson M, Lindstrom EB. 1999. Potential role of Thiobacillus caldus in
arsenopyrite bioleaching. Appl Environ Microbiol 65:36-40.
9. Zhou QG, Bo F, Bo ZH, Xi L, Jian G, Fei LF, Hau CH (2007) Isolation of a strain
of Acidithiobacillus caldus and its role in bioleaching of chalcopyrite. World J
Microbiol Biotechnol 23:1217-1225.
10. Matin A, Wilson B, Zynchlinski E, Matin M (1982) Proton motive force and
physiological basis of delta pH maintenance in Thiobacillus acidophilus. J Bact
150:582-591.
11. Klein C, Hurlbut CS (1977) Manual of Mineralogy. John Wiley & Sons. 361.

159
12. Valdes J, Quatrini R, Hallberg K, Dopson M, Valenzuela PDT, Holmes DS
(2009) Draft genome sequence of the extremely acidophilic bacterium
Acidithiobacillus caldus ATCC 51756 reveals metabolic versatility in the genus
Acidithiobacillus. J Bact 191:5877-5878.
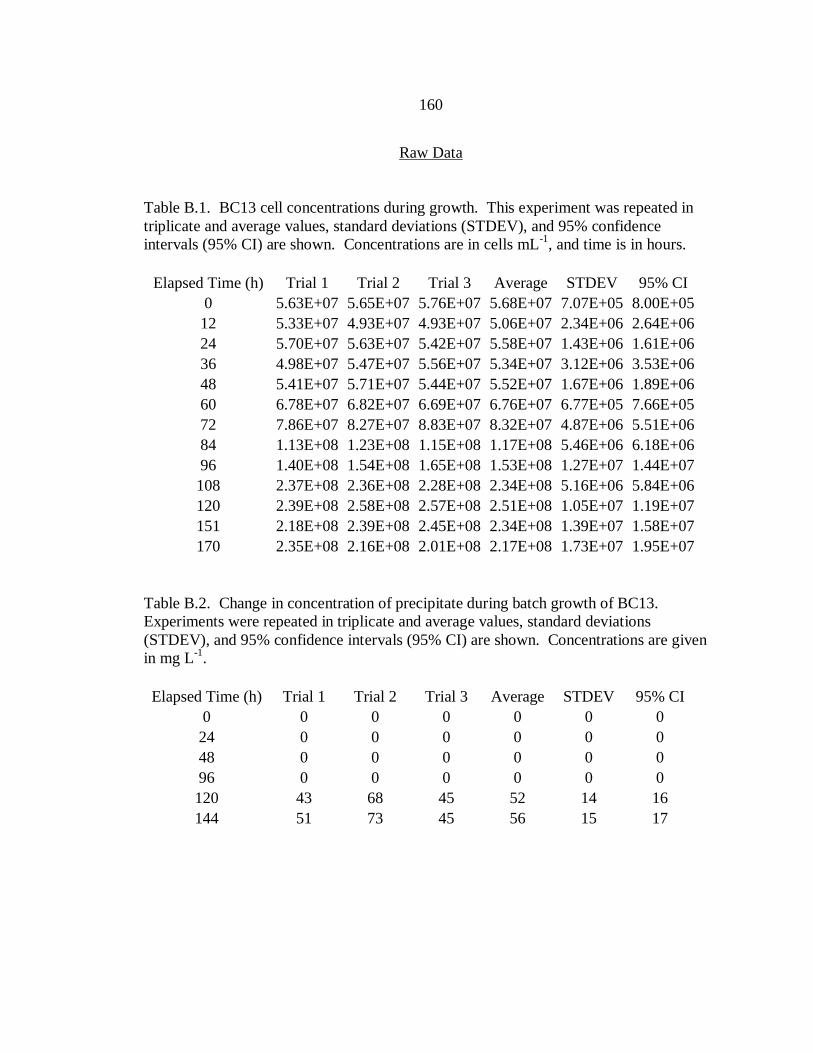
160
Raw Data
Table B.1. BC13 cell concentrations during growth. This experiment was repeated in
triplicate and average values, standard deviations (STDEV), and 95% confidence
intervals (95% CI) are shown. Concentrations are in cells mL-1
, and time is in hours.
Elapsed Time (h) Trial 1 Trial 2 Trial 3 Average STDEV 95% CI
0 5.63E+07 5.65E+07 5.76E+07 5.68E+07 7.07E+05 8.00E+05
12 5.33E+07 4.93E+07 4.93E+07 5.06E+07 2.34E+06 2.64E+06
24 5.70E+07 5.63E+07 5.42E+07 5.58E+07 1.43E+06 1.61E+06
36 4.98E+07 5.47E+07 5.56E+07 5.34E+07 3.12E+06 3.53E+06
48 5.41E+07 5.71E+07 5.44E+07 5.52E+07 1.67E+06 1.89E+06
60 6.78E+07 6.82E+07 6.69E+07 6.76E+07 6.77E+05 7.66E+05
72 7.86E+07 8.27E+07 8.83E+07 8.32E+07 4.87E+06 5.51E+06
84 1.13E+08 1.23E+08 1.15E+08 1.17E+08 5.46E+06 6.18E+06
96 1.40E+08 1.54E+08 1.65E+08 1.53E+08 1.27E+07 1.44E+07
108 2.37E+08 2.36E+08 2.28E+08 2.34E+08 5.16E+06 5.84E+06
120 2.39E+08 2.58E+08 2.57E+08 2.51E+08 1.05E+07 1.19E+07
151 2.18E+08 2.39E+08 2.45E+08 2.34E+08 1.39E+07 1.58E+07
170 2.35E+08 2.16E+08 2.01E+08 2.17E+08 1.73E+07 1.95E+07
Table B.2. Change in concentration of precipitate during batch growth of BC13.
Experiments were repeated in triplicate and average values, standard deviations
(STDEV), and 95% confidence intervals (95% CI) are shown. Concentrations are given
in mg L-1
.
Elapsed Time (h) Trial 1 Trial 2 Trial 3 Average STDEV 95% CI
0 0 0 0 0 0 0
24 0 0 0 0 0 0
48 0 0 0 0 0 0
96 0 0 0 0 0 0
120 43 68 45 52 14 16
144 51 73 45 56 15 17
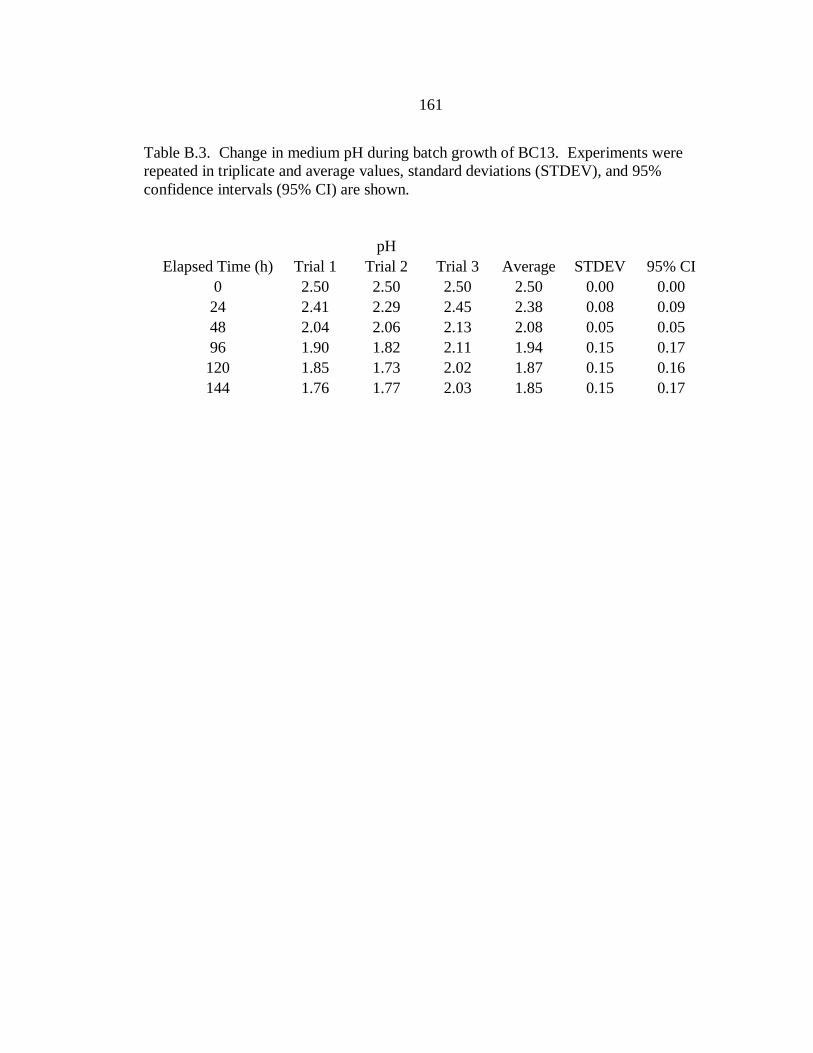
161
Table B.3. Change in medium pH during batch growth of BC13. Experiments were
repeated in triplicate and average values, standard deviations (STDEV), and 95%
confidence intervals (95% CI) are shown.
pH
Elapsed Time (h) Trial 1 Trial 2 Trial 3 Average STDEV 95% CI
0 2.50 2.50 2.50 2.50 0.00 0.00
24 2.41 2.29 2.45 2.38 0.08 0.09
48 2.04 2.06 2.13 2.08 0.05 0.05
96 1.90 1.82 2.11 1.94 0.15 0.17
120 1.85 1.73 2.02 1.87 0.15 0.16
144 1.76 1.77 2.03 1.85 0.15 0.17

162
APPENDIX C
COMPONENTS OF GROWTH MEDIUM
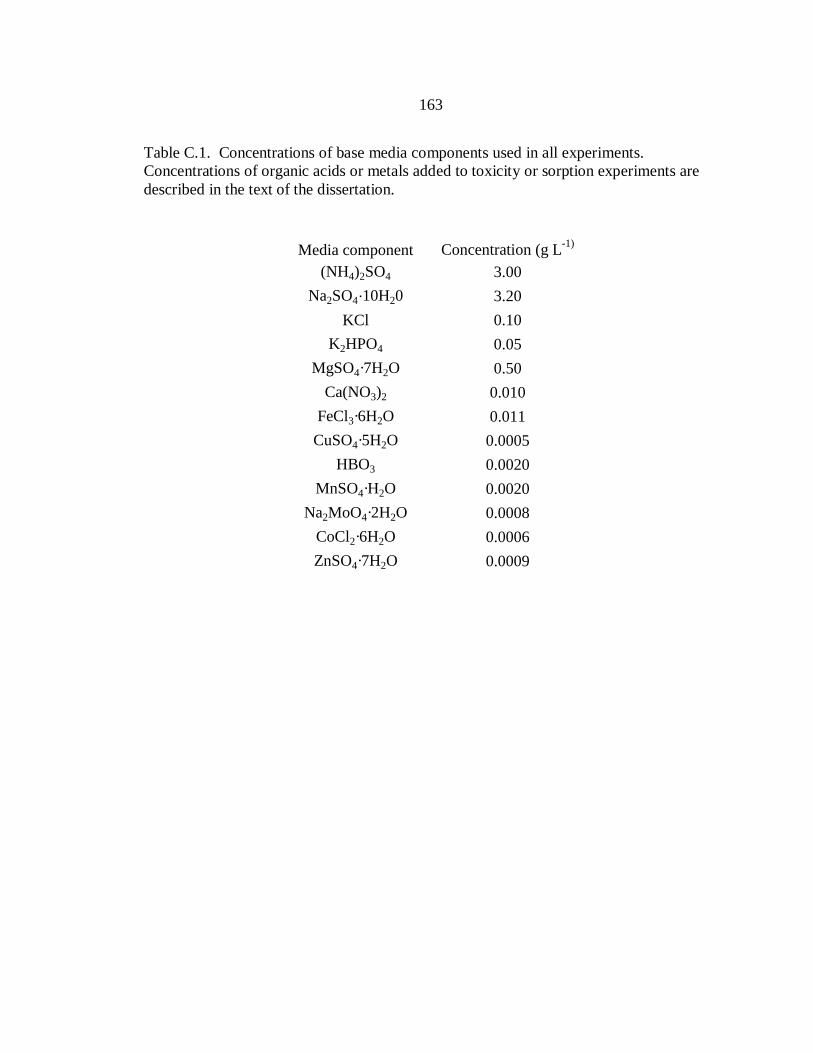
163
Table C.1. Concentrations of base media components used in all experiments.
Concentrations of organic acids or metals added to toxicity or sorption experiments are
described in the text of the dissertation.
Media component Concentration (g L-1)
(NH4)2SO4 3.00
Na2SO4·10H20 3.20
KCl 0.10
K2HPO4 0.05
MgSO4·7H2O 0.50
Ca(NO3)2 0.010
FeCl3·6H2O 0.011
CuSO4·5H2O 0.0005
HBO3 0.0020
MnSO4·H2O 0.0020
Na2MoO4·2H2O 0.0008
CoCl2·6H2O 0.0006
ZnSO4·7H2O 0.0009
164
APPENDIX D
CALCULATION OF SPECIFIC GROWTH RATES

165
Specific growth rates were calculated for two systems in the experiments
discussed in this dissertation 1) batch systems and 2) chemostat systems. In each case the
specific growth rates were determined from a cell-mass balance calculation.
Calculation of Specific Growth Rates in Batch Cultures
With respect to cells:
GenerationFlowFlowonAccumulati outin Equation D.1
May be represented as:
V
XXoX dVrFFdt
dX Equation D.2
Where X represents the number of cells in a control volume, V , t represents time,
oXF represents the flow of cells intoV , XF represents the flow out of V , and
Xr represents the reaction rate of cells.
During batch culturing there is no flow in or out of the system, and the system is assumed
to be well mixed, so Equation D.2 may be re-written as:
Vrdt
dXX Equation D.3
Also:
VCX X Equation D.4

166
XX Cr Equation D.5
where XC is the cell concentration and is the specific growth rate. Therefore, for a
constant volume system, Equation D.4 may be re-written as:
XX C
dt
dC Equation D.6
Separation and integration gives the following solution:
)ln()ln(OXX CtC Equation D.7
where OXC is the initial cell concentration. It can be seen that a plot of the natural
logarithm of the cell concentration against elapsed time will have a slope equal to the
specific growth rate.
Calculation of Specific Growth Rates in Chemostat Cultures
With respect to cells:
GenerationFlowFlowonAccumulati outin Equation D.1
May be represented as:
V
XXoX dVrFFdt
dX Equation D.2
167
The chemostat cultures described in this dissertation were well mixed, so the reaction rate
can be assumed to be independent of location within the chemostat. Also, there were no
cells present in the influent. Substituting in Equations D.4 and D.5, Equation D.2 can be
re-written as:
XXX C
V
F
dt
dC Equation D.8
for a chemostat reactor. At steady state, this Equation D.8 can be simplified to:
XX C
V
F Equation D.9
because,
XX CF Equation D.10
where is the volumetric flow rate, Equation D.11 may be re-written as:
V Equation D.11
Or by definition:
D Equation D.12
where D is the dilution rate.
168
APPENDIX E
CHAPTER TWO RAW DATA

169
Organic Acid Free Control
BC13 cell concentrations with time when grown in the absence of organic acids.
Experiments were repeated in triplicate and average values, standard deviations
(STDEV), and 95% confidence intervals (95% CI) are shown. Specific growth rates are
calculated using linear regressions and are shown along with the corresponding STDEV
and 95% CI to the right of the plots.
Table E.1. BC13 growth in the absence of organic acids.
Cells mL
-1ln (Cells mL
-1)
Elapsed Time (h) Trial 1 Trial 2 Trial 3 Average STDEV 95% CI Trial 1 Trial 2 Trial 3
0 5.00E+07 5.25E+07 5.10E+07 5.12E+07 1.25E+06 1.42E+06 17.73 17.78 17.75
12 6.17E+07 5.96E+07 6.30E+07 6.15E+07 1.70E+06 1.93E+06 17.94 17.90 17.96
24 6.93E+07 7.00E+07 8.20E+07 7.38E+07 7.12E+06 8.06E+06 18.05 18.06 18.22
36 9.71E+07 9.81E+07 9.44E+07 9.65E+07 1.93E+06 2.18E+06 18.39 18.40 18.36
48 1.57E+08 1.54E+08 1.48E+08 1.53E+08 4.55E+06 5.15E+06 18.87 18.85 18.81
60 2.16E+08 2.26E+08 2.35E+08 2.26E+08 9.76E+06 1.10E+07 19.19 19.24 19.28
72 2.56E+08 2.68E+08 2.58E+08 2.61E+08 6.50E+06 7.35E+06 19.36 19.41 19.37
84 2.86E+08 2.93E+08 2.81E+08 2.87E+08 5.71E+06 6.46E+06 19.47 19.49 19.45
96 3.26E+08 3.59E+08 3.01E+08 3.29E+08 2.93E+07 3.31E+07 19.60 19.70 19.52
108 3.54E+08 3.89E+08 3.23E+08 3.56E+08 3.31E+07 3.75E+07 19.68 19.78 19.59
120 3.62E+08 3.06E+08 3.34E+08 3.34E+08 2.78E+07 3.15E+07 19.71 19.54 19.63
17.5
18.0
18.5
19.0
19.5
20.0
0 20 40 60 80
ln [
cell
s m
L-1
]
Specific growth rate (h-1
)
Trial 1 0.026
Trial 2 0.027
Trial 3 0.025
Average 0.026
STDEV 0.001
95% CI 0.001
y = 0.0262x + 17.534
y = 0.0273x + 17.496
y = 0.0254x + 17.601
17.5
18.0
18.5
19.0
19.5
20.0
0 20 40 60 80
Elapsed time (h)
ln [
cell
s m
L-1
]
Figure E.1. Specific growth rate calculations for Trial 1 (open circles), Trial 2 (open
squares), and Trial 3 (open triangles).

170
Toxicity of Organic Acids When Presented Singly
BC13 cell concentrations with time when grown in the presence of varying
concentrations of different organic acids. Experiments were repeated in triplicate and
average values, standard deviations (STDEV), and 95% confidence intervals (95% CI)
are shown. Specific growth rates were calculated using linear regressions and are shown
along with the corresponding STDEV and 95% CI to the right of the plots. Elapsed time
is given in hours
Table E.2. BC13 growth in the presence of 50 M pyruvate.
Cells mL
-1ln (Cells mL
-1)
Elapsed Time (h) Trial 1 Trial 2 Trial 3 Average STDEV 95% CI Trial 1 Trial 2 Trial 3
0 5.18E+07 5.58E+07 5.10E+07 5.28E+07 2.57E+06 2.91E+06 17.76 17.84 17.75
12 6.03E+07 6.13E+07 5.85E+07 6.00E+07 1.42E+06 1.60E+06 17.91 17.93 17.88
24 6.67E+07 6.52E+07 6.77E+07 6.65E+07 1.24E+06 1.40E+06 18.02 17.99 18.03
36 8.14E+07 8.27E+07 8.25E+07 8.22E+07 6.81E+05 7.71E+05 18.22 18.23 18.23
48 1.00E+08 1.01E+08 9.64E+07 9.92E+07 2.42E+06 2.73E+06 18.43 18.43 18.38
60 1.18E+08 1.20E+08 1.22E+08 1.20E+08 1.72E+06 1.94E+06 18.59 18.61 18.62
72 1.43E+08 1.49E+08 1.55E+08 1.49E+08 5.93E+06 6.71E+06 18.78 18.82 18.86
84 1.62E+08 1.54E+08 1.55E+08 1.57E+08 4.31E+06 4.88E+06 18.90 18.85 18.86
96 1.71E+08 1.76E+08 1.71E+08 1.73E+08 3.06E+06 3.47E+06 18.96 18.99 18.95
108 1.56E+08 1.44E+08 1.48E+08 1.49E+08 5.73E+06 6.49E+06 18.86 18.79 18.82
120 1.62E+08 1.59E+08 1.69E+08 1.63E+08 5.35E+06 6.05E+06 18.90 18.88 18.9517.5
18.0
18.5
19.0
0 20 40 60 80
Specific growth rate (h-1
)
Trial 1 0.015
Trial 2 0.015
Trial 3 0.016
Average 0.016
STDEV 0.001
95% CI 0.001
y = 0.0149x + 17.698
y = 0.0154x + 17.686
y = 0.0162x + 17.655
17.5
18.0
18.5
19.0
0 20 40 60 80
Elapsed time (h)
ln [
cell
s m
L-1
]
.Figure E.2. Specific growth rate calculations for Trial 1 (open circles), Trial 2 (open
squares), and Trial 3 (open triangles).

171
Table E.3. BC13 growth in the presence of 100 M pyruvate.
Cells mL
-1ln (Cells mL
-1)
Elapsed Time (h) Trial 1 Trial 2 Trial 3 Average STDEV 95% CI Trial 1 Trial 2 Trial 3
0 5.15E+07 5.35E+07 5.36E+07 5.29E+07 1.17E+06 1.32E+06 17.76 17.80 17.80
12 4.92E+07 4.92E+07 5.04E+07 4.96E+07 6.78E+05 7.67E+05 17.71 17.71 17.74
24 5.23E+07 5.31E+07 5.47E+07 5.34E+07 1.24E+06 1.41E+06 17.77 17.79 17.82
36 5.98E+07 5.91E+07 5.81E+07 5.90E+07 8.36E+05 9.46E+05 17.91 17.90 17.88
48 6.78E+07 6.90E+07 7.08E+07 6.92E+07 1.52E+06 1.72E+06 18.03 18.05 18.08
60 7.65E+07 7.86E+07 7.90E+07 7.80E+07 1.33E+06 1.50E+06 18.15 18.18 18.18
72 7.72E+07 7.93E+07 7.63E+07 7.76E+07 1.54E+06 1.74E+06 18.16 18.19 18.15
84 7.95E+07 7.70E+07 7.41E+07 7.68E+07 2.70E+06 3.06E+06 18.19 18.16 18.12
96 8.80E+07 9.02E+07 9.12E+07 8.98E+07 1.61E+06 1.82E+06 18.29 18.32 18.33
108 9.60E+07 9.58E+07 1.01E+08 9.76E+07 2.92E+06 3.31E+06 18.38 18.38 18.43
120 8.44E+07 8.27E+07 8.29E+07 8.33E+07 9.11E+05 1.03E+06 18.25 18.23 18.2317.6
17.8
18.0
18.2
18.4
0 20 40 60 80
ln [
cell
s m
L-1
]
Specific growth rate (h-1
)
Trial 1 0.008
Trial 2 0.009
Trial 3 0.008
Average 0.008
STDEV 0.000
95% CI 0.001
y = 0.0084x + 17.604
y = 0.0089x + 17.597
y = 0.008x + 17.636
17.6
17.8
18.0
18.2
18.4
0 20 40 60 80
Elapsed time (h)
ln [
cell
s m
L-1
]
Figure E.3. Specific growth rate calculations for Trial 1 (open circles), Trial 2 (open
squares), and Trial 3 (open triangles).
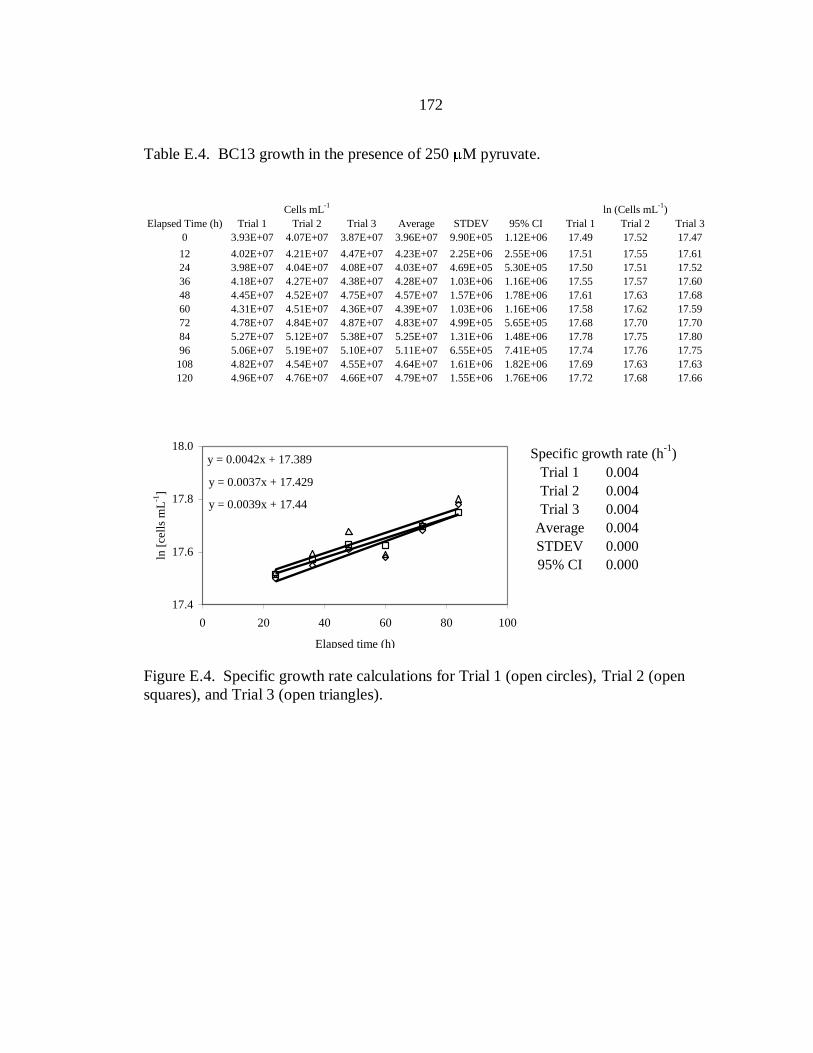
172
Table E.4. BC13 growth in the presence of 250 M pyruvate.
Cells mL
-1ln (Cells mL
-1)
Elapsed Time (h) Trial 1 Trial 2 Trial 3 Average STDEV 95% CI Trial 1 Trial 2 Trial 3
0 3.93E+07 4.07E+07 3.87E+07 3.96E+07 9.90E+05 1.12E+06 17.49 17.52 17.47
12 4.02E+07 4.21E+07 4.47E+07 4.23E+07 2.25E+06 2.55E+06 17.51 17.55 17.61
24 3.98E+07 4.04E+07 4.08E+07 4.03E+07 4.69E+05 5.30E+05 17.50 17.51 17.52
36 4.18E+07 4.27E+07 4.38E+07 4.28E+07 1.03E+06 1.16E+06 17.55 17.57 17.60
48 4.45E+07 4.52E+07 4.75E+07 4.57E+07 1.57E+06 1.78E+06 17.61 17.63 17.68
60 4.31E+07 4.51E+07 4.36E+07 4.39E+07 1.03E+06 1.16E+06 17.58 17.62 17.59
72 4.78E+07 4.84E+07 4.87E+07 4.83E+07 4.99E+05 5.65E+05 17.68 17.70 17.70
84 5.27E+07 5.12E+07 5.38E+07 5.25E+07 1.31E+06 1.48E+06 17.78 17.75 17.80
96 5.06E+07 5.19E+07 5.10E+07 5.11E+07 6.55E+05 7.41E+05 17.74 17.76 17.75
108 4.82E+07 4.54E+07 4.55E+07 4.64E+07 1.61E+06 1.82E+06 17.69 17.63 17.63
120 4.96E+07 4.76E+07 4.66E+07 4.79E+07 1.55E+06 1.76E+06 17.72 17.68 17.6617.4
17.6
17.8
18.0
0 20 40 60 80 100
ln [
cell
s m
L-1
]
Specific growth rate (h-1
)
Trial 1 0.004
Trial 2 0.004
Trial 3 0.004
Average 0.004
STDEV 0.000
95% CI 0.000
y = 0.0042x + 17.389
y = 0.0037x + 17.429
y = 0.0039x + 17.44
17.4
17.6
17.8
18.0
0 20 40 60 80 100
Elapsed time (h)
ln [
cell
s m
L-1
]
Figure E.4. Specific growth rate calculations for Trial 1 (open circles), Trial 2 (open
squares), and Trial 3 (open triangles).
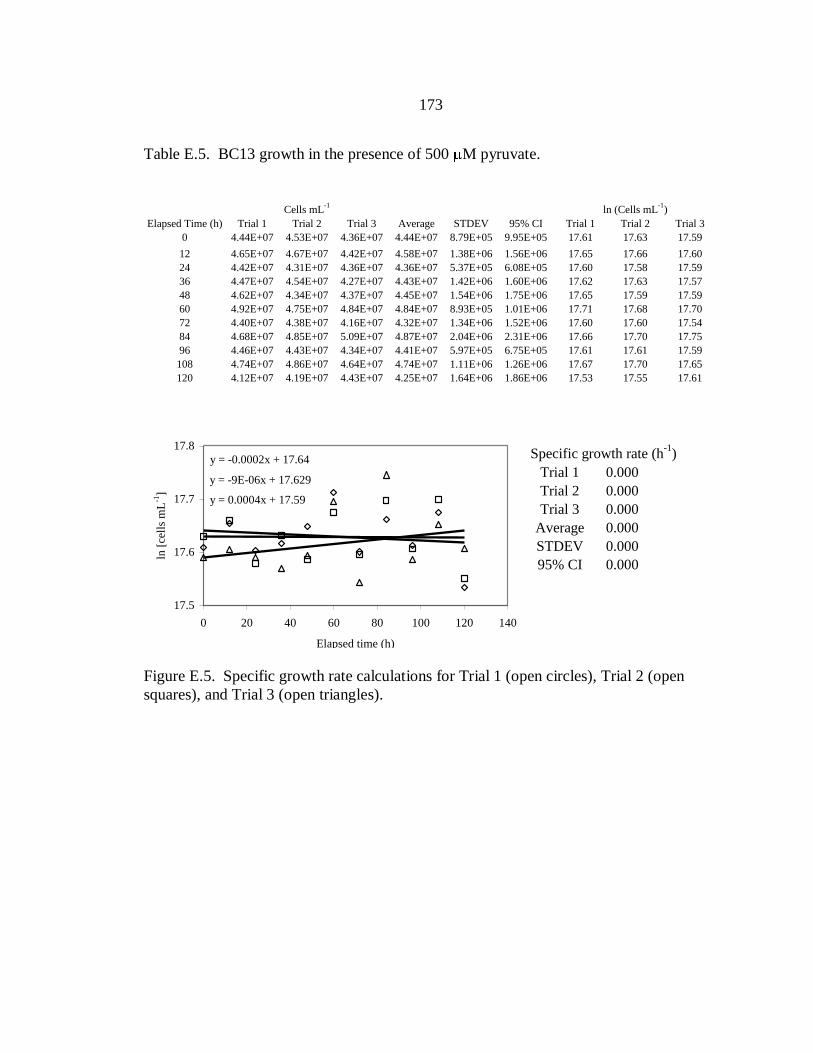
173
Table E.5. BC13 growth in the presence of 500 M pyruvate.
Cells mL
-1ln (Cells mL
-1)
Elapsed Time (h) Trial 1 Trial 2 Trial 3 Average STDEV 95% CI Trial 1 Trial 2 Trial 3
0 4.44E+07 4.53E+07 4.36E+07 4.44E+07 8.79E+05 9.95E+05 17.61 17.63 17.59
12 4.65E+07 4.67E+07 4.42E+07 4.58E+07 1.38E+06 1.56E+06 17.65 17.66 17.60
24 4.42E+07 4.31E+07 4.36E+07 4.36E+07 5.37E+05 6.08E+05 17.60 17.58 17.59
36 4.47E+07 4.54E+07 4.27E+07 4.43E+07 1.42E+06 1.60E+06 17.62 17.63 17.57
48 4.62E+07 4.34E+07 4.37E+07 4.45E+07 1.54E+06 1.75E+06 17.65 17.59 17.59
60 4.92E+07 4.75E+07 4.84E+07 4.84E+07 8.93E+05 1.01E+06 17.71 17.68 17.70
72 4.40E+07 4.38E+07 4.16E+07 4.32E+07 1.34E+06 1.52E+06 17.60 17.60 17.54
84 4.68E+07 4.85E+07 5.09E+07 4.87E+07 2.04E+06 2.31E+06 17.66 17.70 17.75
96 4.46E+07 4.43E+07 4.34E+07 4.41E+07 5.97E+05 6.75E+05 17.61 17.61 17.59
108 4.74E+07 4.86E+07 4.64E+07 4.74E+07 1.11E+06 1.26E+06 17.67 17.70 17.65
120 4.12E+07 4.19E+07 4.43E+07 4.25E+07 1.64E+06 1.86E+06 17.53 17.55 17.6117.5
17.6
17.7
17.8
0 20 40 60 80 100 120 140
ln [
cell
s m
L-1
]
Specific growth rate (h-1
)
Trial 1 0.000
Trial 2 0.000
Trial 3 0.000
Average 0.000
STDEV 0.000
95% CI 0.000
y = -0.0002x + 17.64
y = -9E-06x + 17.629
y = 0.0004x + 17.59
17.5
17.6
17.7
17.8
0 20 40 60 80 100 120 140
Elapsed time (h)
ln [
cell
s m
L-1
]
Figure E.5. Specific growth rate calculations for Trial 1 (open circles), Trial 2 (open
squares), and Trial 3 (open triangles).

174
Acetate
Table E.6. BC13 growth in the presence of 50 M acetate.
Cells mL
-1ln (Cells mL
-1)
Elapsed Time (h) Trial 1 Trial 2 Trial 3 Average STDEV 95% CI Trial 1 Trial 2 Trial 3
0 6.11E+07 5.98E+07 6.12E+07 6.07E+07 8.06E+05 9.12E+05 17.93 17.91 17.93
12 6.40E+07 6.34E+07 6.50E+07 6.41E+07 8.23E+05 9.32E+05 17.97 17.97 17.99
24 7.58E+07 7.18E+07 7.37E+07 7.38E+07 1.98E+06 2.24E+06 18.14 18.09 18.12
36 1.00E+08 9.84E+07 1.04E+08 1.01E+08 2.93E+06 3.31E+06 18.42 18.40 18.46
48 1.15E+08 1.12E+08 1.08E+08 1.12E+08 3.21E+06 3.63E+06 18.56 18.54 18.50
60 1.26E+08 1.31E+08 1.38E+08 1.32E+08 5.96E+06 6.74E+06 18.65 18.69 18.74
72 1.49E+08 1.43E+08 1.38E+08 1.43E+08 5.61E+06 6.35E+06 18.82 18.78 18.74
84 1.96E+08 1.89E+08 1.95E+08 1.93E+08 3.75E+06 4.24E+06 19.09 19.06 19.09
96 2.33E+08 2.43E+08 2.33E+08 2.36E+08 6.15E+06 6.96E+06 19.27 19.31 19.27
108 2.24E+08 2.33E+08 2.30E+08 2.29E+08 4.54E+06 5.14E+06 19.23 19.27 19.25
120 2.50E+08 2.62E+08 2.56E+08 2.56E+08 5.71E+06 6.47E+06 19.34 19.38 19.3617.5
18.0
18.5
19.0
19.5
0 20 40 60 80 100 120
ln [
cell
s m
L-1
]
Specific growth rate (h-1
)
Trial 1 0.015
Trial 2 0.015
Trial 3 0.015
Average 0.015
STDEV 0.000
95% CI 0.000
y = 0.015x + 17.808
y = 0.0154x + 17.772
y = 0.0147x + 17.816
17.5
18.0
18.5
19.0
19.5
0 20 40 60 80 100 120
Elapsed time (h)
ln [
cell
s m
L-1
]
Figure E.6. Specific growth rate calculations for Trial 1 (open circles), Trial 2 (open
squares), and Trial 3 (open triangles).

175
Table E.7. BC13 growth in the presence of 100 M acetate.
Cells mL
-1ln (Cells mL
-1)
Elapsed Time (h) Trial 1 Trial 2 Trial 3 Average STDEV 95% CI Trial 1 Trial 2 Trial 3
0 4.59E+07 4.59E+07 4.87E+07 4.69E+07 1.61E+06 1.82E+06 17.64 17.64 17.70
12 4.56E+07 4.39E+07 4.68E+07 4.54E+07 1.44E+06 1.63E+06 17.63 17.60 17.66
24 4.98E+07 5.06E+07 4.87E+07 4.97E+07 9.74E+05 1.10E+06 17.72 17.74 17.70
36 5.53E+07 5.55E+07 5.37E+07 5.48E+07 9.80E+05 1.11E+06 17.83 17.83 17.80
48 5.62E+07 5.61E+07 5.36E+07 5.53E+07 1.48E+06 1.68E+06 17.84 17.84 17.80
60 6.48E+07 6.17E+07 6.40E+07 6.35E+07 1.60E+06 1.81E+06 17.99 17.94 17.97
72 6.23E+07 5.93E+07 6.00E+07 6.05E+07 1.54E+06 1.75E+06 17.95 17.90 17.91
84 7.14E+07 7.05E+07 6.68E+07 6.96E+07 2.43E+06 2.75E+06 18.08 18.07 18.02
96 7.04E+07 6.99E+07 6.61E+07 6.88E+07 2.33E+06 2.63E+06 18.07 18.06 18.01
108 7.59E+07 8.06E+07 7.84E+07 7.83E+07 2.34E+06 2.65E+06 18.15 18.21 18.18
120 7.87E+07 7.91E+07 8.38E+07 8.05E+07 2.82E+06 3.19E+06 18.18 18.19 18.24
17.4
17.6
17.8
18.0
18.2
0 10 20 30 40 50 60 70
ln [
cell
s m
L-1
]
Specific growth rate (h-1
)
Trial 1 0.007
Trial 2 0.007
Trial 3 0.006
Average 0.006
STDEV 0.000
95% CI 0.001
y = 0.0069x + 17.556
y = 0.0065x + 17.555
y = 0.006x + 17.57
17.4
17.6
17.8
18.0
18.2
0 10 20 30 40 50 60 70
Elapsed time (h)
ln [
cell
s m
L-1
]
Figure E.7. Specific growth rate calculations for Trial 1 (open circles), Trial 2 (open
squares), and Trial 3 (open triangles).
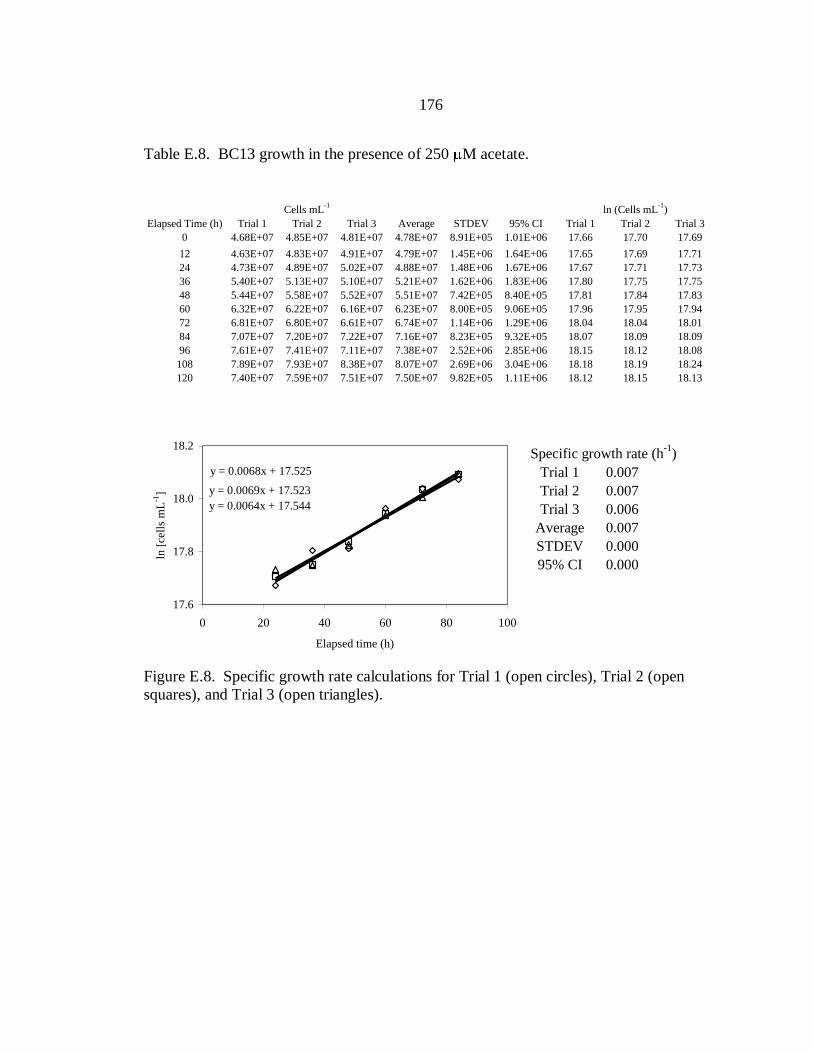
176
Table E.8. BC13 growth in the presence of 250 M acetate.
Cells mL
-1ln (Cells mL
-1)
Elapsed Time (h) Trial 1 Trial 2 Trial 3 Average STDEV 95% CI Trial 1 Trial 2 Trial 3
0 4.68E+07 4.85E+07 4.81E+07 4.78E+07 8.91E+05 1.01E+06 17.66 17.70 17.69
12 4.63E+07 4.83E+07 4.91E+07 4.79E+07 1.45E+06 1.64E+06 17.65 17.69 17.71
24 4.73E+07 4.89E+07 5.02E+07 4.88E+07 1.48E+06 1.67E+06 17.67 17.71 17.73
36 5.40E+07 5.13E+07 5.10E+07 5.21E+07 1.62E+06 1.83E+06 17.80 17.75 17.75
48 5.44E+07 5.58E+07 5.52E+07 5.51E+07 7.42E+05 8.40E+05 17.81 17.84 17.83
60 6.32E+07 6.22E+07 6.16E+07 6.23E+07 8.00E+05 9.06E+05 17.96 17.95 17.94
72 6.81E+07 6.80E+07 6.61E+07 6.74E+07 1.14E+06 1.29E+06 18.04 18.04 18.01
84 7.07E+07 7.20E+07 7.22E+07 7.16E+07 8.23E+05 9.32E+05 18.07 18.09 18.09
96 7.61E+07 7.41E+07 7.11E+07 7.38E+07 2.52E+06 2.85E+06 18.15 18.12 18.08
108 7.89E+07 7.93E+07 8.38E+07 8.07E+07 2.69E+06 3.04E+06 18.18 18.19 18.24
120 7.40E+07 7.59E+07 7.51E+07 7.50E+07 9.82E+05 1.11E+06 18.12 18.15 18.1317.6
17.8
18.0
18.2
0 20 40 60 80 100
ln [
cell
s m
L-1
]
Specific growth rate (h-1
)
Trial 1 0.007
Trial 2 0.007
Trial 3 0.006
Average 0.007
STDEV 0.000
95% CI 0.000
y = 0.0068x + 17.525
y = 0.0069x + 17.523
y = 0.0064x + 17.544
17.6
17.8
18.0
18.2
0 20 40 60 80 100
Elapsed time (h)
ln [
cell
s m
L-1
]
Figure E.8. Specific growth rate calculations for Trial 1 (open circles), Trial 2 (open
squares), and Trial 3 (open triangles).

177
Table E.9. BC13 growth in the presence of 500 M acetate.
Cells mL
-1ln (Cells mL
-1)
Elapsed Time (h) Trial 1 Trial 2 Trial 3 Average STDEV 95% CI Trial 1 Trial 2 Trial 3
0 4.82E+07 4.59E+07 4.52E+07 4.64E+07 1.53E+06 1.73E+06 17.69 17.64 17.63
12 4.70E+07 4.42E+07 4.42E+07 4.51E+07 1.58E+06 1.79E+06 17.66 17.60 17.60
24 5.13E+07 4.84E+07 4.55E+07 4.84E+07 2.88E+06 3.26E+06 17.75 17.70 17.63
36 5.20E+07 5.25E+07 4.95E+07 5.13E+07 1.63E+06 1.84E+06 17.77 17.78 17.72
48 5.57E+07 5.51E+07 5.85E+07 5.65E+07 1.83E+06 2.07E+06 17.84 17.83 17.89
60 6.29E+07 5.98E+07 5.92E+07 6.06E+07 2.02E+06 2.28E+06 17.96 17.91 17.90
72 6.84E+07 6.43E+07 6.08E+07 6.45E+07 3.80E+06 4.30E+06 18.04 17.98 17.92
84 7.11E+07 7.38E+07 6.94E+07 7.14E+07 2.21E+06 2.50E+06 18.08 18.12 18.06
96 7.54E+07 7.40E+07 7.72E+07 7.55E+07 1.61E+06 1.83E+06 18.14 18.12 18.16
108 7.41E+07 7.15E+07 7.59E+07 7.38E+07 2.22E+06 2.51E+06 18.12 18.08 18.14
120 7.53E+07 8.01E+07 7.49E+07 7.68E+07 2.88E+06 3.26E+06 18.14 18.20 18.1317.4
17.6
17.8
18.0
18.2
0 20 40 60 80 100 120
ln [
cell
s m
L-1
]
Specific growth rate (h-1
)
Trial 1 0.006
Trial 2 0.006
Trial 3 0.007
Average 0.006
STDEV 0.000
95% CI 0.000
y = 0.0058x + 17.589
y = 0.0063x + 17.535
y = 0.0066x + 17.503
17.4
17.6
17.8
18.0
18.2
0 20 40 60 80 100 120
Elapsed time (h)
ln [
cell
s m
L-1
]
Figure E.9. Specific growth rate calculations for Trial 1 (open circles), Trial 2 (open
squares), and Trial 3 (open triangles).
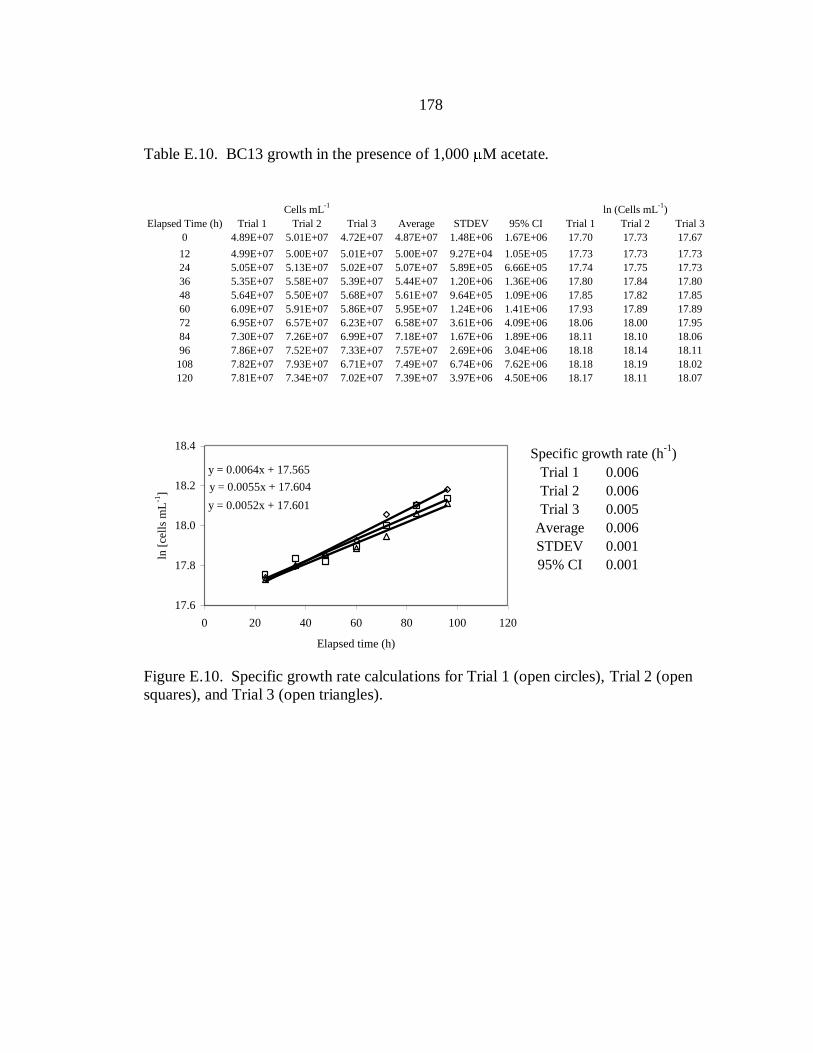
178
Table E.10. BC13 growth in the presence of 1,000 M acetate.
Cells mL
-1ln (Cells mL
-1)
Elapsed Time (h) Trial 1 Trial 2 Trial 3 Average STDEV 95% CI Trial 1 Trial 2 Trial 3
0 4.89E+07 5.01E+07 4.72E+07 4.87E+07 1.48E+06 1.67E+06 17.70 17.73 17.67
12 4.99E+07 5.00E+07 5.01E+07 5.00E+07 9.27E+04 1.05E+05 17.73 17.73 17.73
24 5.05E+07 5.13E+07 5.02E+07 5.07E+07 5.89E+05 6.66E+05 17.74 17.75 17.73
36 5.35E+07 5.58E+07 5.39E+07 5.44E+07 1.20E+06 1.36E+06 17.80 17.84 17.80
48 5.64E+07 5.50E+07 5.68E+07 5.61E+07 9.64E+05 1.09E+06 17.85 17.82 17.85
60 6.09E+07 5.91E+07 5.86E+07 5.95E+07 1.24E+06 1.41E+06 17.93 17.89 17.89
72 6.95E+07 6.57E+07 6.23E+07 6.58E+07 3.61E+06 4.09E+06 18.06 18.00 17.95
84 7.30E+07 7.26E+07 6.99E+07 7.18E+07 1.67E+06 1.89E+06 18.11 18.10 18.06
96 7.86E+07 7.52E+07 7.33E+07 7.57E+07 2.69E+06 3.04E+06 18.18 18.14 18.11
108 7.82E+07 7.93E+07 6.71E+07 7.49E+07 6.74E+06 7.62E+06 18.18 18.19 18.02
120 7.81E+07 7.34E+07 7.02E+07 7.39E+07 3.97E+06 4.50E+06 18.17 18.11 18.0717.6
17.8
18.0
18.2
18.4
0 20 40 60 80 100 120
ln [
cell
s m
L-1
]
Specific growth rate (h-1
)
Trial 1 0.006
Trial 2 0.006
Trial 3 0.005
Average 0.006
STDEV 0.001
95% CI 0.001
y = 0.0064x + 17.565
y = 0.0055x + 17.604
y = 0.0052x + 17.601
17.6
17.8
18.0
18.2
18.4
0 20 40 60 80 100 120
Elapsed time (h)
ln [
cell
s m
L-1
]
Figure E.10. Specific growth rate calculations for Trial 1 (open circles), Trial 2 (open
squares), and Trial 3 (open triangles).
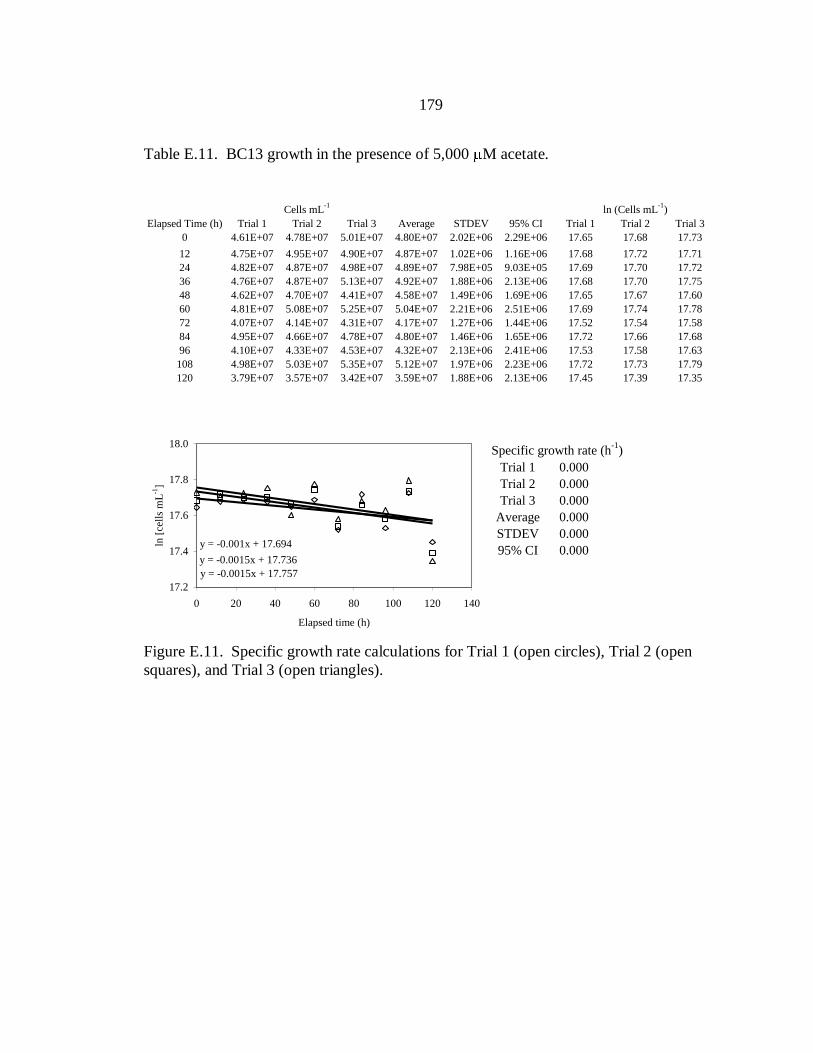
179
Table E.11. BC13 growth in the presence of 5,000 M acetate.
Cells mL
-1ln (Cells mL
-1)
Elapsed Time (h) Trial 1 Trial 2 Trial 3 Average STDEV 95% CI Trial 1 Trial 2 Trial 3
0 4.61E+07 4.78E+07 5.01E+07 4.80E+07 2.02E+06 2.29E+06 17.65 17.68 17.73
12 4.75E+07 4.95E+07 4.90E+07 4.87E+07 1.02E+06 1.16E+06 17.68 17.72 17.71
24 4.82E+07 4.87E+07 4.98E+07 4.89E+07 7.98E+05 9.03E+05 17.69 17.70 17.72
36 4.76E+07 4.87E+07 5.13E+07 4.92E+07 1.88E+06 2.13E+06 17.68 17.70 17.75
48 4.62E+07 4.70E+07 4.41E+07 4.58E+07 1.49E+06 1.69E+06 17.65 17.67 17.60
60 4.81E+07 5.08E+07 5.25E+07 5.04E+07 2.21E+06 2.51E+06 17.69 17.74 17.78
72 4.07E+07 4.14E+07 4.31E+07 4.17E+07 1.27E+06 1.44E+06 17.52 17.54 17.58
84 4.95E+07 4.66E+07 4.78E+07 4.80E+07 1.46E+06 1.65E+06 17.72 17.66 17.68
96 4.10E+07 4.33E+07 4.53E+07 4.32E+07 2.13E+06 2.41E+06 17.53 17.58 17.63
108 4.98E+07 5.03E+07 5.35E+07 5.12E+07 1.97E+06 2.23E+06 17.72 17.73 17.79
120 3.79E+07 3.57E+07 3.42E+07 3.59E+07 1.88E+06 2.13E+06 17.45 17.39 17.3517.2
17.4
17.6
17.8
18.0
0 20 40 60 80 100 120 140
ln [
cell
s m
L-1
]
Specific growth rate (h-1
)
Trial 1 0.000
Trial 2 0.000
Trial 3 0.000
Average 0.000
STDEV 0.000
95% CI 0.000y = -0.001x + 17.694
y = -0.0015x + 17.736
y = -0.0015x + 17.757
17.2
17.4
17.6
17.8
18.0
0 20 40 60 80 100 120 140
Elapsed time (h)
ln [
cell
s m
L-1
]
Figure E.11. Specific growth rate calculations for Trial 1 (open circles), Trial 2 (open
squares), and Trial 3 (open triangles).
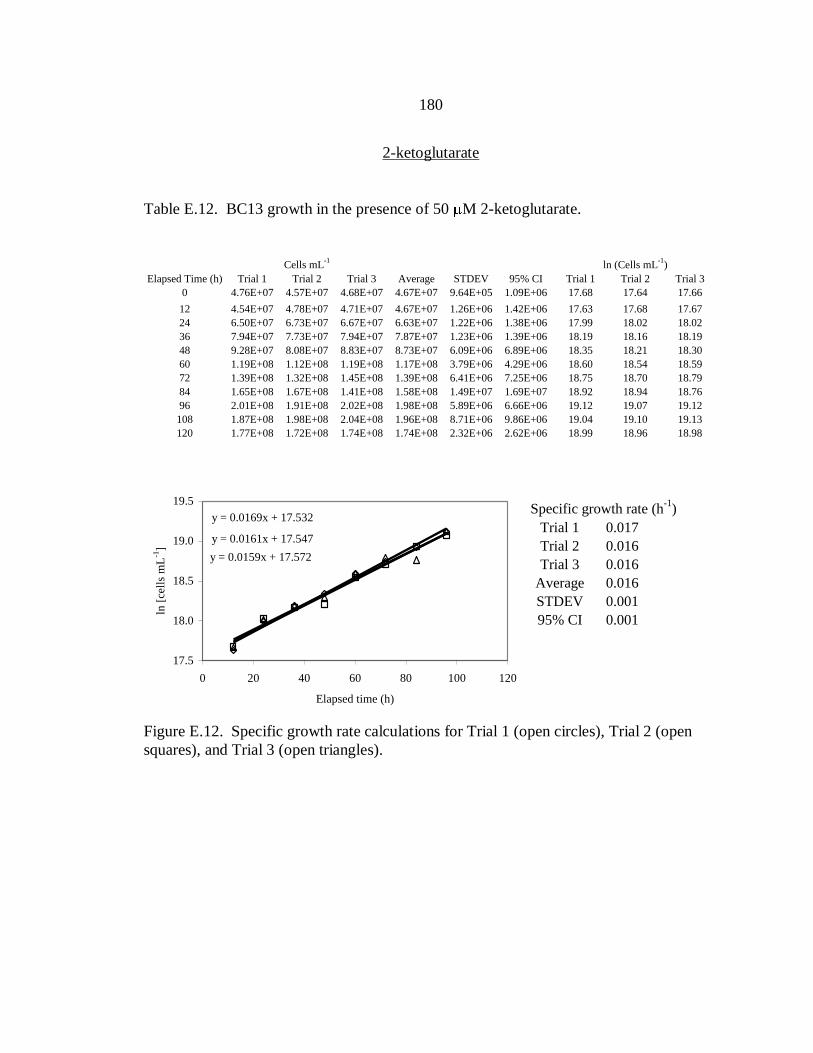
180
2-ketoglutarate
Table E.12. BC13 growth in the presence of 50 M 2-ketoglutarate.
Cells mL
-1ln (Cells mL
-1)
Elapsed Time (h) Trial 1 Trial 2 Trial 3 Average STDEV 95% CI Trial 1 Trial 2 Trial 3
0 4.76E+07 4.57E+07 4.68E+07 4.67E+07 9.64E+05 1.09E+06 17.68 17.64 17.66
12 4.54E+07 4.78E+07 4.71E+07 4.67E+07 1.26E+06 1.42E+06 17.63 17.68 17.67
24 6.50E+07 6.73E+07 6.67E+07 6.63E+07 1.22E+06 1.38E+06 17.99 18.02 18.02
36 7.94E+07 7.73E+07 7.94E+07 7.87E+07 1.23E+06 1.39E+06 18.19 18.16 18.19
48 9.28E+07 8.08E+07 8.83E+07 8.73E+07 6.09E+06 6.89E+06 18.35 18.21 18.30
60 1.19E+08 1.12E+08 1.19E+08 1.17E+08 3.79E+06 4.29E+06 18.60 18.54 18.59
72 1.39E+08 1.32E+08 1.45E+08 1.39E+08 6.41E+06 7.25E+06 18.75 18.70 18.79
84 1.65E+08 1.67E+08 1.41E+08 1.58E+08 1.49E+07 1.69E+07 18.92 18.94 18.76
96 2.01E+08 1.91E+08 2.02E+08 1.98E+08 5.89E+06 6.66E+06 19.12 19.07 19.12
108 1.87E+08 1.98E+08 2.04E+08 1.96E+08 8.71E+06 9.86E+06 19.04 19.10 19.13
120 1.77E+08 1.72E+08 1.74E+08 1.74E+08 2.32E+06 2.62E+06 18.99 18.96 18.9817.5
18.0
18.5
19.0
19.5
0 20 40 60 80 100 120
ln [
cell
s m
L-1
]
Specific growth rate (h-1
)
Trial 1 0.017
Trial 2 0.016
Trial 3 0.016
Average 0.016
STDEV 0.001
95% CI 0.001
y = 0.0169x + 17.532
y = 0.0161x + 17.547
y = 0.0159x + 17.572
17.5
18.0
18.5
19.0
19.5
0 20 40 60 80 100 120
Elapsed time (h)
ln [
cell
s m
L-1
]
Figure E.12. Specific growth rate calculations for Trial 1 (open circles), Trial 2 (open
squares), and Trial 3 (open triangles).
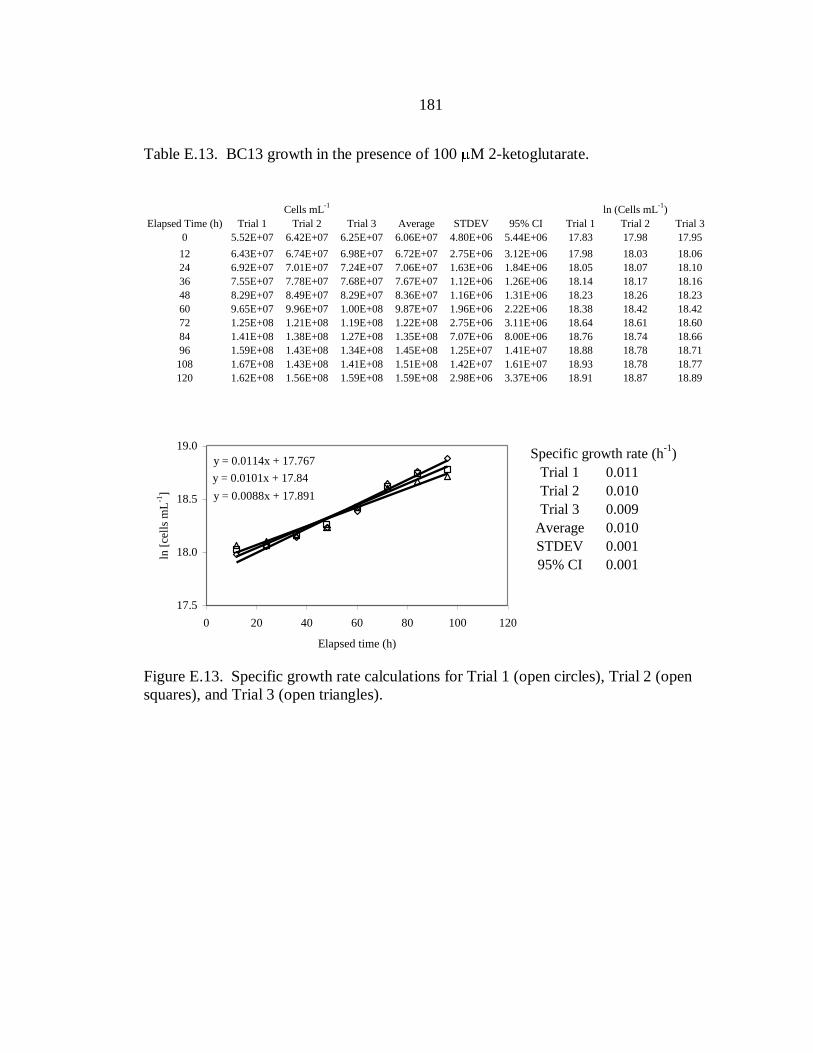
181
Table E.13. BC13 growth in the presence of 100 M 2-ketoglutarate.
Cells mL
-1ln (Cells mL
-1)
Elapsed Time (h) Trial 1 Trial 2 Trial 3 Average STDEV 95% CI Trial 1 Trial 2 Trial 3
0 5.52E+07 6.42E+07 6.25E+07 6.06E+07 4.80E+06 5.44E+06 17.83 17.98 17.95
12 6.43E+07 6.74E+07 6.98E+07 6.72E+07 2.75E+06 3.12E+06 17.98 18.03 18.06
24 6.92E+07 7.01E+07 7.24E+07 7.06E+07 1.63E+06 1.84E+06 18.05 18.07 18.10
36 7.55E+07 7.78E+07 7.68E+07 7.67E+07 1.12E+06 1.26E+06 18.14 18.17 18.16
48 8.29E+07 8.49E+07 8.29E+07 8.36E+07 1.16E+06 1.31E+06 18.23 18.26 18.23
60 9.65E+07 9.96E+07 1.00E+08 9.87E+07 1.96E+06 2.22E+06 18.38 18.42 18.42
72 1.25E+08 1.21E+08 1.19E+08 1.22E+08 2.75E+06 3.11E+06 18.64 18.61 18.60
84 1.41E+08 1.38E+08 1.27E+08 1.35E+08 7.07E+06 8.00E+06 18.76 18.74 18.66
96 1.59E+08 1.43E+08 1.34E+08 1.45E+08 1.25E+07 1.41E+07 18.88 18.78 18.71
108 1.67E+08 1.43E+08 1.41E+08 1.51E+08 1.42E+07 1.61E+07 18.93 18.78 18.77
120 1.62E+08 1.56E+08 1.59E+08 1.59E+08 2.98E+06 3.37E+06 18.91 18.87 18.8917.5
18.0
18.5
19.0
0 20 40 60 80 100 120
Specific growth rate (h-1
)
Trial 1 0.011
Trial 2 0.010
Trial 3 0.009
Average 0.010
STDEV 0.001
95% CI 0.001
y = 0.0114x + 17.767
y = 0.0101x + 17.84
y = 0.0088x + 17.891
17.5
18.0
18.5
19.0
0 20 40 60 80 100 120
Elapsed time (h)
ln [
cell
s m
L-1
]
Figure E.13. Specific growth rate calculations for Trial 1 (open circles), Trial 2 (open
squares), and Trial 3 (open triangles).

182
Table E.14. BC13 growth in the presence of 250 M 2-ketoglutarate.
Cells mL
-1ln (Cells mL
-1)
Elapsed Time (h) Trial 1 Trial 2 Trial 3 Average STDEV 95% CI Trial 1 Trial 2 Trial 3
0 5.51E+07 5.35E+07 5.37E+07 5.41E+07 8.60E+05 9.73E+05 17.82 17.80 17.80
12 5.84E+07 5.89E+07 6.22E+07 5.98E+07 2.06E+06 2.34E+06 17.88 17.89 17.95
24 6.26E+07 6.49E+07 6.58E+07 6.45E+07 1.66E+06 1.88E+06 17.95 17.99 18.00
36 7.49E+07 7.47E+07 7.80E+07 7.59E+07 1.84E+06 2.08E+06 18.13 18.13 18.17
48 8.42E+07 7.94E+07 7.57E+07 7.98E+07 4.27E+06 4.83E+06 18.25 18.19 18.14
60 9.54E+07 9.13E+07 8.64E+07 9.10E+07 4.48E+06 5.06E+06 18.37 18.33 18.27
72 1.06E+08 1.03E+08 1.08E+08 1.05E+08 2.43E+06 2.75E+06 18.48 18.45 18.49
84 1.15E+08 1.15E+08 1.13E+08 1.14E+08 1.27E+06 1.43E+06 18.56 18.56 18.54
96 1.28E+08 1.27E+08 1.30E+08 1.28E+08 1.56E+06 1.77E+06 18.67 18.66 18.68
108 1.36E+08 1.31E+08 1.25E+08 1.31E+08 5.20E+06 5.88E+06 18.73 18.69 18.65
120 1.38E+08 1.45E+08 1.37E+08 1.40E+08 4.23E+06 4.79E+06 18.74 18.79 18.7417.5
18.0
18.5
19.0
0 20 40 60 80 100 120
ln [
cell
s m
L-1
]
Specific growth rate (h-1
)
Trial 1 0.010
Trial 2 0.009
Trial 3 0.009
Average 0.009
STDEV 0.000
95% CI 0.000
y = 0.0096x + 17.767
y = 0.0092x + 17.775
y = 0.0089x + 17.802
17.5
18.0
18.5
19.0
0 20 40 60 80 100 120
Elapsed time (h)
ln [
cell
s m
L-1
]
Figure E.14. Specific growth rate calculations for Trial 1 (open circles), Trial 2 (open
squares), and Trial 3 (open triangles).

183
Table E.15. BC13 growth in the presence of 500 M 2-ketoglutarate.
Cells mL
-1ln (Cells mL
-1)
Elapsed Time (h) Trial 1 Trial 2 Trial 3 Average STDEV 95% CI Trial 1 Trial 2 Trial 3
0 5.67E+07 5.38E+07 5.34E+07 5.46E+07 1.83E+06 2.07E+06 17.85 17.80 17.79
12 5.78E+07 6.10E+07 6.47E+07 6.12E+07 3.43E+06 3.89E+06 17.87 17.93 17.98
24 6.41E+07 6.18E+07 6.51E+07 6.37E+07 1.71E+06 1.94E+06 17.98 17.94 17.99
36 7.03E+07 7.18E+07 6.80E+07 7.00E+07 1.91E+06 2.16E+06 18.07 18.09 18.03
48 7.69E+07 7.54E+07 7.19E+07 7.47E+07 2.54E+06 2.88E+06 18.16 18.14 18.09
60 8.71E+07 9.16E+07 8.75E+07 8.87E+07 2.52E+06 2.85E+06 18.28 18.33 18.29
72 9.44E+07 9.68E+07 9.11E+07 9.41E+07 2.84E+06 3.22E+06 18.36 18.39 18.33
84 9.85E+07 9.34E+07 9.40E+07 9.53E+07 2.81E+06 3.18E+06 18.41 18.35 18.36
96 1.10E+08 1.15E+08 1.09E+08 1.11E+08 3.08E+06 3.48E+06 18.52 18.56 18.51
108 1.19E+08 1.25E+08 1.20E+08 1.22E+08 2.99E+06 3.38E+06 18.60 18.64 18.61
120 1.21E+08 1.22E+08 1.27E+08 1.23E+08 3.00E+06 3.39E+06 18.61 18.62 18.6617.8
18.0
18.2
18.4
18.6
0 20 40 60 80 100
ln [
cell
s m
L-1
]
Specific growth rate (h-1
)
Trial 1 0.008
Trial 2 0.007
Trial 3 0.006
Average 0.007
STDEV 0.001
95% CI 0.001
y = 0.0077x + 17.791
y = 0.0072x + 17.821
y = 0.0061x + 17.861
17.8
18.0
18.2
18.4
18.6
0 20 40 60 80 100
Elapsed time (h)
ln [
cell
s m
L-1
]
Figure E.15. Specific growth rate calculations for Trial 1 (open circles), Trial 2 (open
squares), and Trial 3 (open triangles).
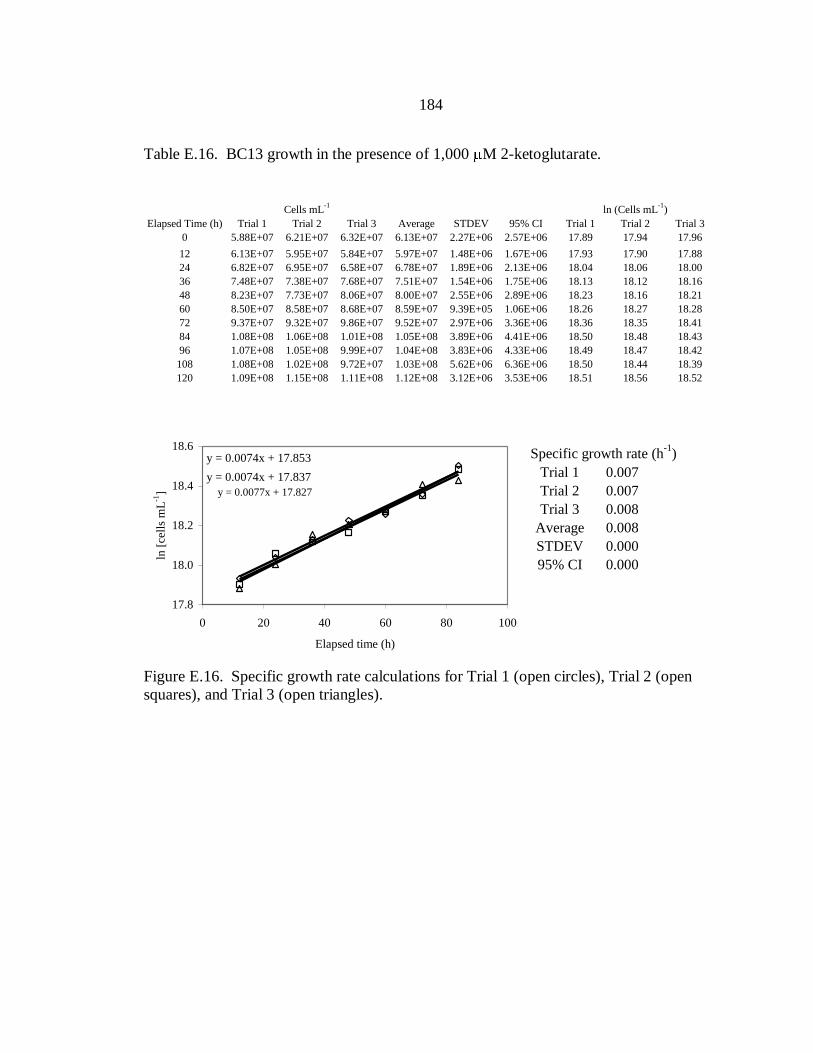
184
Table E.16. BC13 growth in the presence of 1,000 M 2-ketoglutarate.
Cells mL
-1ln (Cells mL
-1)
Elapsed Time (h) Trial 1 Trial 2 Trial 3 Average STDEV 95% CI Trial 1 Trial 2 Trial 3
0 5.88E+07 6.21E+07 6.32E+07 6.13E+07 2.27E+06 2.57E+06 17.89 17.94 17.96
12 6.13E+07 5.95E+07 5.84E+07 5.97E+07 1.48E+06 1.67E+06 17.93 17.90 17.88
24 6.82E+07 6.95E+07 6.58E+07 6.78E+07 1.89E+06 2.13E+06 18.04 18.06 18.00
36 7.48E+07 7.38E+07 7.68E+07 7.51E+07 1.54E+06 1.75E+06 18.13 18.12 18.16
48 8.23E+07 7.73E+07 8.06E+07 8.00E+07 2.55E+06 2.89E+06 18.23 18.16 18.21
60 8.50E+07 8.58E+07 8.68E+07 8.59E+07 9.39E+05 1.06E+06 18.26 18.27 18.28
72 9.37E+07 9.32E+07 9.86E+07 9.52E+07 2.97E+06 3.36E+06 18.36 18.35 18.41
84 1.08E+08 1.06E+08 1.01E+08 1.05E+08 3.89E+06 4.41E+06 18.50 18.48 18.43
96 1.07E+08 1.05E+08 9.99E+07 1.04E+08 3.83E+06 4.33E+06 18.49 18.47 18.42
108 1.08E+08 1.02E+08 9.72E+07 1.03E+08 5.62E+06 6.36E+06 18.50 18.44 18.39
120 1.09E+08 1.15E+08 1.11E+08 1.12E+08 3.12E+06 3.53E+06 18.51 18.56 18.5217.8
18.0
18.2
18.4
18.6
0 20 40 60 80 100
ln [
cell
s m
L-1
]
Specific growth rate (h-1
)
Trial 1 0.007
Trial 2 0.007
Trial 3 0.008
Average 0.008
STDEV 0.000
95% CI 0.000
y = 0.0074x + 17.853
y = 0.0074x + 17.837
y = 0.0077x + 17.827
17.8
18.0
18.2
18.4
18.6
0 20 40 60 80 100
Elapsed time (h)
ln [
cell
s m
L-1
]
Figure E.16. Specific growth rate calculations for Trial 1 (open circles), Trial 2 (open
squares), and Trial 3 (open triangles).

185
Table E.17. BC13 growth in the presence of 5,000 M 2-ketoglutarate.
Cells mL
-1ln (Cells mL
-1)
Elapsed Time (h) Trial 1 Trial 2 Trial 3 Average STDEV 95% CI Trial 1 Trial 2 Trial 3
0 4.75E+07 4.46E+07 4.34E+07 4.52E+07 2.14E+06 2.42E+06 17.68 17.61 17.59
12 4.67E+07 4.80E+07 4.63E+07 4.70E+07 8.93E+05 1.01E+06 17.66 17.69 17.65
24 4.50E+07 4.55E+07 4.49E+07 4.52E+07 3.52E+05 3.98E+05 17.62 17.63 17.62
36 4.97E+07 5.10E+07 5.21E+07 5.09E+07 1.21E+06 1.37E+06 17.72 17.75 17.77
48 4.18E+07 4.31E+07 4.07E+07 4.19E+07 1.22E+06 1.38E+06 17.55 17.58 17.52
60 4.86E+07 4.66E+07 4.73E+07 4.75E+07 9.89E+05 1.12E+06 17.70 17.66 17.67
72 4.46E+07 4.39E+07 4.13E+07 4.33E+07 1.75E+06 1.99E+06 17.61 17.60 17.54
84 4.66E+07 4.51E+07 4.48E+07 4.55E+07 9.39E+05 1.06E+06 17.66 17.62 17.62
96 4.38E+07 4.20E+07 4.08E+07 4.22E+07 1.52E+06 1.72E+06 17.60 17.55 17.52
108 4.87E+07 4.75E+07 5.00E+07 4.88E+07 1.22E+06 1.38E+06 17.70 17.68 17.73
120 3.71E+07 3.88E+07 4.10E+07 3.89E+07 1.94E+06 2.20E+06 17.43 17.47 17.5317.4
17.5
17.6
17.7
17.8
0 20 40 60 80 100 120 140
ln [
cell
s m
L-1
]
Specific growth rate (h-1
)
Trial 1 0.000
Trial 2 0.000
Trial 3 0.000
Average 0.000
STDEV 0.000
95% CI 0.000y = -0.0009x + 17.685
y = -0.0009x + 17.677
y = -0.0004x + 17.63917.4
17.5
17.6
17.7
17.8
0 20 40 60 80 100 120 140
Elapsed time (h)
ln [
cell
s m
L-1
]
Figure E.17. Specific growth rate calculations for Trial 1 (open circles), Trial 2 (open
squares), and Trial 3 (open triangles).
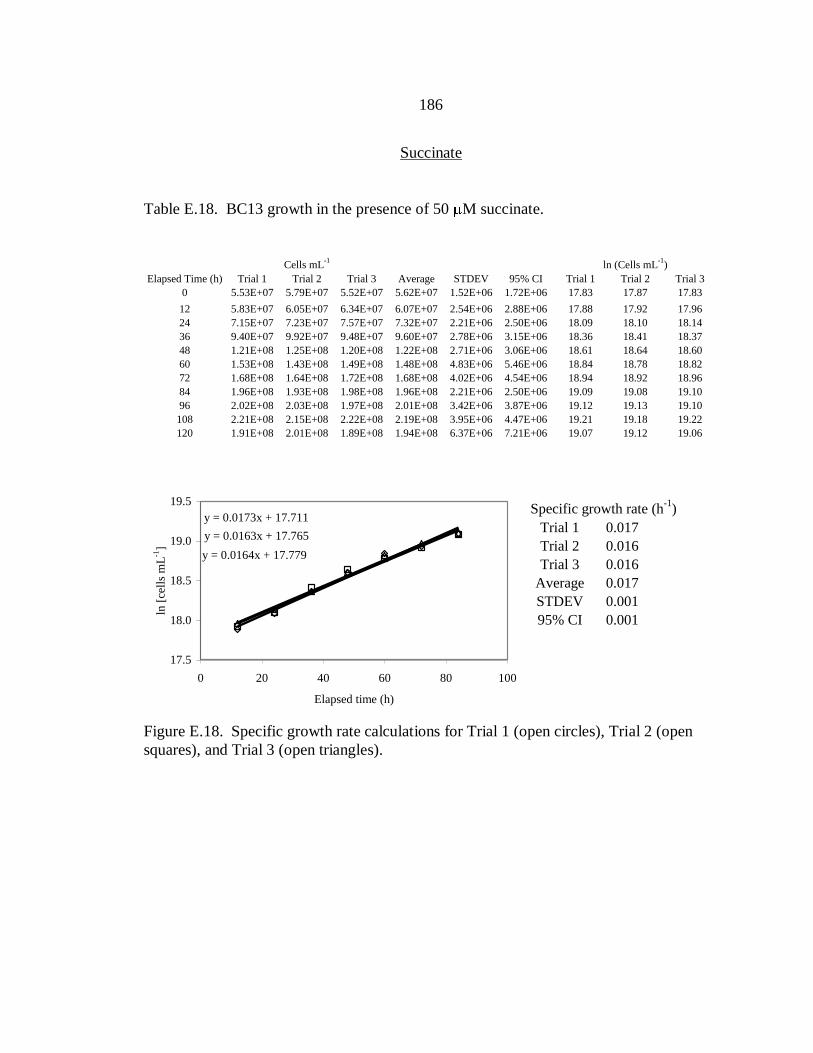
186
Succinate
Table E.18. BC13 growth in the presence of 50 M succinate.
Cells mL
-1ln (Cells mL
-1)
Elapsed Time (h) Trial 1 Trial 2 Trial 3 Average STDEV 95% CI Trial 1 Trial 2 Trial 3
0 5.53E+07 5.79E+07 5.52E+07 5.62E+07 1.52E+06 1.72E+06 17.83 17.87 17.83
12 5.83E+07 6.05E+07 6.34E+07 6.07E+07 2.54E+06 2.88E+06 17.88 17.92 17.96
24 7.15E+07 7.23E+07 7.57E+07 7.32E+07 2.21E+06 2.50E+06 18.09 18.10 18.14
36 9.40E+07 9.92E+07 9.48E+07 9.60E+07 2.78E+06 3.15E+06 18.36 18.41 18.37
48 1.21E+08 1.25E+08 1.20E+08 1.22E+08 2.71E+06 3.06E+06 18.61 18.64 18.60
60 1.53E+08 1.43E+08 1.49E+08 1.48E+08 4.83E+06 5.46E+06 18.84 18.78 18.82
72 1.68E+08 1.64E+08 1.72E+08 1.68E+08 4.02E+06 4.54E+06 18.94 18.92 18.96
84 1.96E+08 1.93E+08 1.98E+08 1.96E+08 2.21E+06 2.50E+06 19.09 19.08 19.10
96 2.02E+08 2.03E+08 1.97E+08 2.01E+08 3.42E+06 3.87E+06 19.12 19.13 19.10
108 2.21E+08 2.15E+08 2.22E+08 2.19E+08 3.95E+06 4.47E+06 19.21 19.18 19.22
120 1.91E+08 2.01E+08 1.89E+08 1.94E+08 6.37E+06 7.21E+06 19.07 19.12 19.0617.5
18.0
18.5
19.0
19.5
0 20 40 60 80 100
ln [
cell
s m
L-1
]
Specific growth rate (h-1
)
Trial 1 0.017
Trial 2 0.016
Trial 3 0.016
Average 0.017
STDEV 0.001
95% CI 0.001
y = 0.0173x + 17.711
y = 0.0163x + 17.765
y = 0.0164x + 17.779
17.5
18.0
18.5
19.0
19.5
0 20 40 60 80 100
Elapsed time (h)
ln [
cell
s m
L-1
]
Figure E.18. Specific growth rate calculations for Trial 1 (open circles), Trial 2 (open
squares), and Trial 3 (open triangles).

187
Table E.19. BC13 growth in the presence of 100 M succinate.
Cells mL
-1ln (Cells mL
-1)
Elapsed Time (h) Trial 1 Trial 2 Trial 3 Average STDEV 95% CI Trial 1 Trial 2 Trial 3
0 5.30E+07 5.58E+07 5.32E+07 5.40E+07 1.52E+06 1.72E+06 17.79 17.84 17.79
12 5.59E+07 5.86E+07 5.73E+07 5.73E+07 1.33E+06 1.50E+06 17.84 17.89 17.86
24 6.60E+07 6.68E+07 7.00E+07 6.76E+07 2.09E+06 2.37E+06 18.01 18.02 18.06
36 6.36E+07 7.00E+07 8.15E+07 7.17E+07 9.10E+06 1.03E+07 17.97 18.06 18.22
48 8.00E+07 8.19E+07 8.46E+07 8.22E+07 2.31E+06 2.61E+06 18.20 18.22 18.25
60 8.52E+07 8.91E+07 8.53E+07 8.65E+07 2.23E+06 2.53E+06 18.26 18.31 18.26
72 9.33E+07 8.89E+07 9.09E+07 9.11E+07 2.21E+06 2.50E+06 18.35 18.30 18.33
84 9.37E+07 9.78E+07 9.89E+07 9.68E+07 2.73E+06 3.09E+06 18.36 18.40 18.41
96 1.11E+08 1.13E+08 1.11E+08 1.12E+08 1.15E+06 1.30E+06 18.52 18.54 18.52
108 1.17E+08 1.16E+08 1.11E+08 1.15E+08 3.56E+06 4.03E+06 18.58 18.57 18.52
120 1.16E+08 1.18E+08 1.17E+08 1.17E+08 1.01E+06 1.14E+06 18.57 18.58 18.5817.8
18.0
18.2
18.4
18.6
0 20 40 60 80 100 120
ln [
cell
s m
L-1
]
Specific growth rate (h-1
)
Trial 1 0.008
Trial 2 0.007
Trial 3 0.007
Average 0.007
STDEV 0.001
95% CI 0.001
y = 0.0077x + 17.772
y = 0.0072x + 17.826
y = 0.0066x + 17.882
17.8
18.0
18.2
18.4
18.6
0 20 40 60 80 100 120
Elapsed time (h)
ln [
cell
s m
L-1
]
Figure E.19. Specific growth rate calculations for Trial 1 (open circles), Trial 2 (open
squares), and Trial 3 (open triangles).

188
Table E.20. BC13 growth in the presence of 250 M succinate.
Cells mL
-1ln (Cells mL
-1)
Elapsed Time (h) Trial 1 Trial 2 Trial 3 Average STDEV 95% CI Trial 1 Trial 2 Trial 3
0 5.45E+07 5.28E+07 4.97E+07 5.23E+07 2.45E+06 2.77E+06 17.81 17.78 17.72
12 5.55E+07 5.88E+07 5.89E+07 5.77E+07 1.93E+06 2.18E+06 17.83 17.89 17.89
24 6.17E+07 6.15E+07 5.80E+07 6.04E+07 2.06E+06 2.33E+06 17.94 17.94 17.88
36 6.66E+07 6.80E+07 6.84E+07 6.76E+07 9.48E+05 1.07E+06 18.01 18.03 18.04
48 7.55E+07 7.18E+07 7.82E+07 7.52E+07 3.26E+06 3.69E+06 18.14 18.09 18.18
60 7.98E+07 7.73E+07 8.62E+07 8.11E+07 4.60E+06 5.20E+06 18.19 18.16 18.27
72 8.79E+07 8.24E+07 8.10E+07 8.38E+07 3.63E+06 4.11E+06 18.29 18.23 18.21
84 9.30E+07 9.68E+07 9.75E+07 9.58E+07 2.42E+06 2.74E+06 18.35 18.39 18.39
96 9.54E+07 9.76E+07 9.43E+07 9.58E+07 1.66E+06 1.88E+06 18.37 18.40 18.36
108 1.24E+08 1.26E+08 1.22E+08 1.24E+08 1.66E+06 1.88E+06 18.63 18.65 18.62
120 1.12E+08 1.13E+08 1.16E+08 1.13E+08 1.97E+06 2.23E+06 18.53 18.54 18.5717.8
18.0
18.2
18.4
18.6
0 20 40 60 80 100 120
ln [
cell
s m
L-1
]
Specific growth rate (h-1
)
Trial 1 0.007
Trial 2 0.006
Trial 3 0.006
Average 0.007
STDEV 0.000
95% CI 0.000
y = 0.0067x + 17.78
y = 0.0064x + 17.794
y = 0.0064x + 17.805
17.8
18.0
18.2
18.4
18.6
0 20 40 60 80 100 120
Elapsed time (h)
ln [
cell
s m
L-1
]
Figure E.20. Specific growth rate calculations for Trial 1 (open circles), Trial 2 (open
squares), and Trial 3 (open triangles).
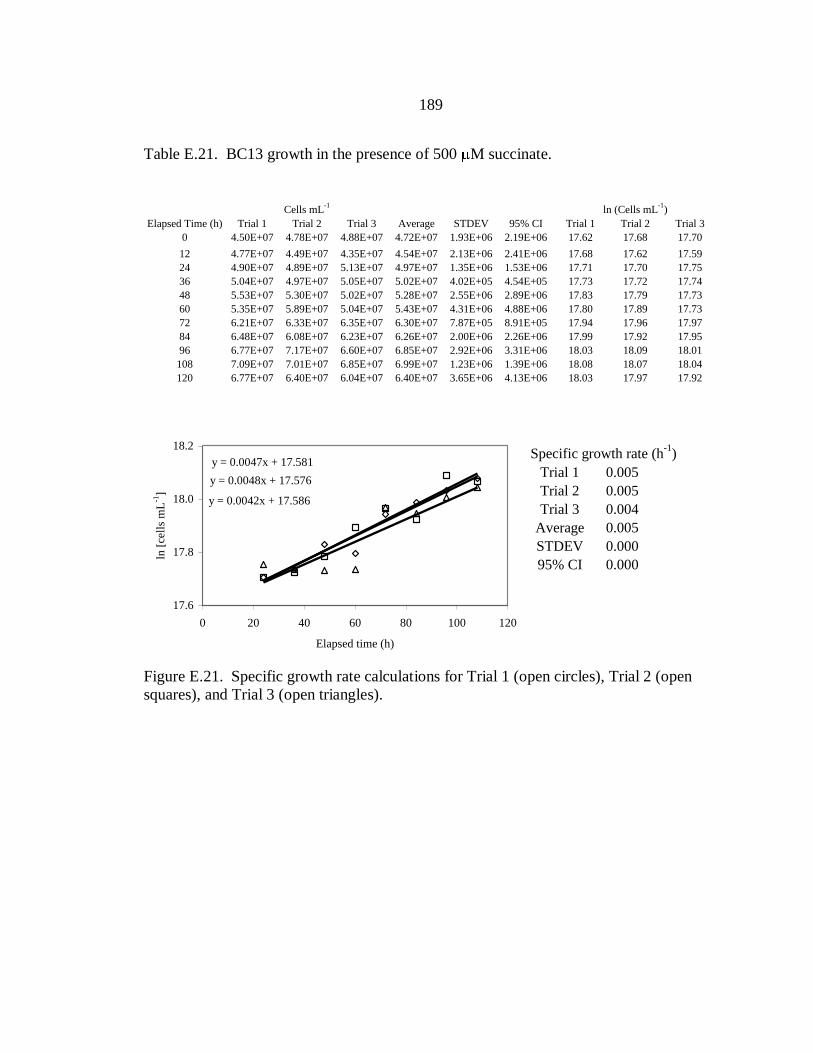
189
Table E.21. BC13 growth in the presence of 500 M succinate.
Cells mL
-1ln (Cells mL
-1)
Elapsed Time (h) Trial 1 Trial 2 Trial 3 Average STDEV 95% CI Trial 1 Trial 2 Trial 3
0 4.50E+07 4.78E+07 4.88E+07 4.72E+07 1.93E+06 2.19E+06 17.62 17.68 17.70
12 4.77E+07 4.49E+07 4.35E+07 4.54E+07 2.13E+06 2.41E+06 17.68 17.62 17.59
24 4.90E+07 4.89E+07 5.13E+07 4.97E+07 1.35E+06 1.53E+06 17.71 17.70 17.75
36 5.04E+07 4.97E+07 5.05E+07 5.02E+07 4.02E+05 4.54E+05 17.73 17.72 17.74
48 5.53E+07 5.30E+07 5.02E+07 5.28E+07 2.55E+06 2.89E+06 17.83 17.79 17.73
60 5.35E+07 5.89E+07 5.04E+07 5.43E+07 4.31E+06 4.88E+06 17.80 17.89 17.73
72 6.21E+07 6.33E+07 6.35E+07 6.30E+07 7.87E+05 8.91E+05 17.94 17.96 17.97
84 6.48E+07 6.08E+07 6.23E+07 6.26E+07 2.00E+06 2.26E+06 17.99 17.92 17.95
96 6.77E+07 7.17E+07 6.60E+07 6.85E+07 2.92E+06 3.31E+06 18.03 18.09 18.01
108 7.09E+07 7.01E+07 6.85E+07 6.99E+07 1.23E+06 1.39E+06 18.08 18.07 18.04
120 6.77E+07 6.40E+07 6.04E+07 6.40E+07 3.65E+06 4.13E+06 18.03 17.97 17.9217.6
17.8
18.0
18.2
0 20 40 60 80 100 120
ln [
cell
s m
L-1
]
Specific growth rate (h-1
)
Trial 1 0.005
Trial 2 0.005
Trial 3 0.004
Average 0.005
STDEV 0.000
95% CI 0.000
y = 0.0047x + 17.581
y = 0.0048x + 17.576
y = 0.0042x + 17.586
17.6
17.8
18.0
18.2
0 20 40 60 80 100 120
Elapsed time (h)
ln [
cell
s m
L-1
]
Figure E.21. Specific growth rate calculations for Trial 1 (open circles), Trial 2 (open
squares), and Trial 3 (open triangles).
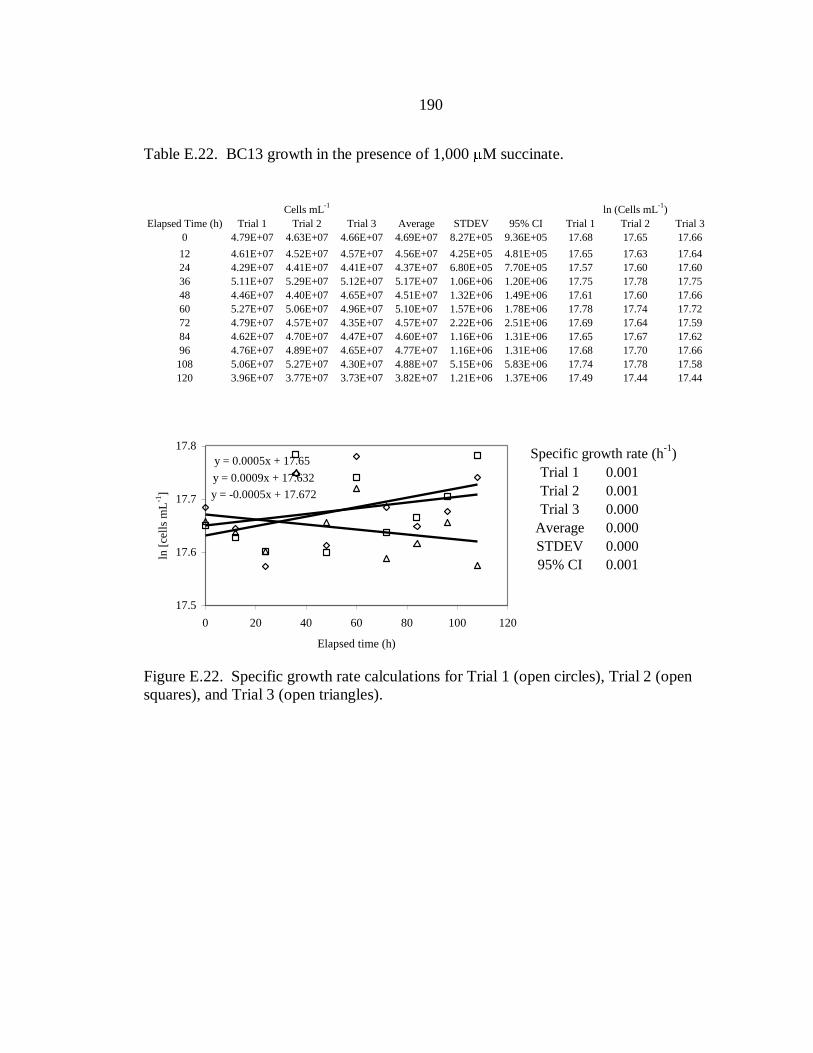
190
Table E.22. BC13 growth in the presence of 1,000 M succinate.
Cells mL
-1ln (Cells mL
-1)
Elapsed Time (h) Trial 1 Trial 2 Trial 3 Average STDEV 95% CI Trial 1 Trial 2 Trial 3
0 4.79E+07 4.63E+07 4.66E+07 4.69E+07 8.27E+05 9.36E+05 17.68 17.65 17.66
12 4.61E+07 4.52E+07 4.57E+07 4.56E+07 4.25E+05 4.81E+05 17.65 17.63 17.64
24 4.29E+07 4.41E+07 4.41E+07 4.37E+07 6.80E+05 7.70E+05 17.57 17.60 17.60
36 5.11E+07 5.29E+07 5.12E+07 5.17E+07 1.06E+06 1.20E+06 17.75 17.78 17.75
48 4.46E+07 4.40E+07 4.65E+07 4.51E+07 1.32E+06 1.49E+06 17.61 17.60 17.66
60 5.27E+07 5.06E+07 4.96E+07 5.10E+07 1.57E+06 1.78E+06 17.78 17.74 17.72
72 4.79E+07 4.57E+07 4.35E+07 4.57E+07 2.22E+06 2.51E+06 17.69 17.64 17.59
84 4.62E+07 4.70E+07 4.47E+07 4.60E+07 1.16E+06 1.31E+06 17.65 17.67 17.62
96 4.76E+07 4.89E+07 4.65E+07 4.77E+07 1.16E+06 1.31E+06 17.68 17.70 17.66
108 5.06E+07 5.27E+07 4.30E+07 4.88E+07 5.15E+06 5.83E+06 17.74 17.78 17.58
120 3.96E+07 3.77E+07 3.73E+07 3.82E+07 1.21E+06 1.37E+06 17.49 17.44 17.4417.5
17.6
17.7
17.8
0 20 40 60 80 100 120
Specific growth rate (h-1
)
Trial 1 0.001
Trial 2 0.001
Trial 3 0.000
Average 0.000
STDEV 0.000
95% CI 0.001
y = 0.0005x + 17.65
y = 0.0009x + 17.632
y = -0.0005x + 17.672
17.5
17.6
17.7
17.8
0 20 40 60 80 100 120
Elapsed time (h)
ln [
cell
s m
L-1
]
Figure E.22. Specific growth rate calculations for Trial 1 (open circles), Trial 2 (open
squares), and Trial 3 (open triangles).

191
Fumarate
Table E.23. BC13 growth in the presence of 50 M fumarate.
Cells mL
-1ln (Cells mL
-1)
Elapsed Time (h) Trial 1 Trial 2 Trial 3 Average STDEV 95% CI Trial 1 Trial 2 Trial 3
0 4.59E+07 4.60E+07 4.55E+07 4.58E+07 2.99E+05 3.39E+05 17.64 17.65 17.63
12 4.69E+07 4.91E+07 4.63E+07 4.74E+07 1.47E+06 1.66E+06 17.66 17.71 17.65
24 6.05E+07 6.20E+07 6.10E+07 6.11E+07 7.31E+05 8.27E+05 17.92 17.94 17.93
36 6.81E+07 6.61E+07 6.79E+07 6.74E+07 1.08E+06 1.23E+06 18.04 18.01 18.03
48 9.36E+07 9.01E+07 8.83E+07 9.07E+07 2.70E+06 3.06E+06 18.35 18.32 18.30
60 1.11E+08 1.11E+08 1.12E+08 1.11E+08 8.39E+05 9.49E+05 18.53 18.52 18.54
72 1.46E+08 1.41E+08 1.34E+08 1.40E+08 6.11E+06 6.91E+06 18.80 18.77 18.71
84 1.50E+08 1.45E+08 1.44E+08 1.46E+08 3.24E+06 3.67E+06 18.83 18.79 18.78
96 1.62E+08 1.58E+08 1.58E+08 1.59E+08 2.58E+06 2.92E+06 18.90 18.88 18.87
108 1.69E+08 1.66E+08 1.56E+08 1.64E+08 7.07E+06 8.00E+06 18.95 18.93 18.86
120 1.82E+08 1.79E+08 1.70E+08 1.77E+08 6.06E+06 6.86E+06 19.02 19.00 18.9517.5
18.0
18.5
19.0
0 20 40 60 80
ln [
cell
s m
L-1
]
Specific growth rate (h-1
)
Trial 1 0.019
Trial 2 0.017
Trial 3 0.018
Average 0.018
STDEV 0.001
95% CI 0.001
y = 0.0186x + 17.435
y = 0.0174x + 17.478
y = 0.0176x + 17.453
17.5
18.0
18.5
19.0
0 20 40 60 80
Elapsed time (h)
ln [
cell
s m
L-1
]
Figure E.23. Specific growth rate calculations for Trial 1 (open circles), Trial 2 (open
squares), and Trial 3 (open triangles).

192
Table E.24. BC13 growth in the presence of 100 M fumarate.
Cells mL
-1ln (Cells mL
-1)
Elapsed Time (h) Trial 1 Trial 2 Trial 3 Average STDEV 95% CI Trial 1 Trial 2 Trial 3
0 5.66E+07 5.83E+07 5.98E+07 5.82E+07 1.57E+06 1.77E+06 17.85 17.88 17.91
12 5.77E+07 5.92E+07 6.03E+07 5.91E+07 1.30E+06 1.47E+06 17.87 17.90 17.92
24 6.54E+07 6.60E+07 6.42E+07 6.52E+07 9.15E+05 1.03E+06 18.00 18.00 17.98
36 7.44E+07 7.28E+07 6.99E+07 7.24E+07 2.26E+06 2.56E+06 18.12 18.10 18.06
48 8.21E+07 8.24E+07 8.55E+07 8.33E+07 1.91E+06 2.16E+06 18.22 18.23 18.26
60 9.24E+07 8.71E+07 8.52E+07 8.82E+07 3.75E+06 4.25E+06 18.34 18.28 18.26
72 9.61E+07 9.52E+07 9.87E+07 9.67E+07 1.82E+06 2.06E+06 18.38 18.37 18.41
84 1.21E+08 1.15E+08 1.22E+08 1.19E+08 3.71E+06 4.20E+06 18.61 18.56 18.62
96 1.35E+08 1.36E+08 1.31E+08 1.34E+08 2.19E+06 2.48E+06 18.72 18.73 18.69
108 1.41E+08 1.34E+08 1.38E+08 1.37E+08 3.26E+06 3.69E+06 18.76 18.71 18.74
120 1.46E+08 1.44E+08 1.44E+08 1.45E+08 1.32E+06 1.49E+06 18.80 18.79 18.7817.5
18.0
18.5
19.0
0 20 40 60 80 100 120
ln [
cell
s m
L-1
]
Specific growth rate (h-1
)
Trial 1 0.010
Trial 2 0.009
Trial 3 0.009
Average 0.009
STDEV 0.000
95% CI 0.000
y = 0.0095x + 17.765
y = 0.009x + 17.78
y = 0.0093x + 17.768
17.5
18.0
18.5
19.0
0 20 40 60 80 100 120
Elapsed time (h)
ln [
cell
s m
L-1
]
Figure E.24. Specific growth rate calculations for Trial 1 (open circles), Trial 2 (open
squares), and Trial 3 (open triangles).
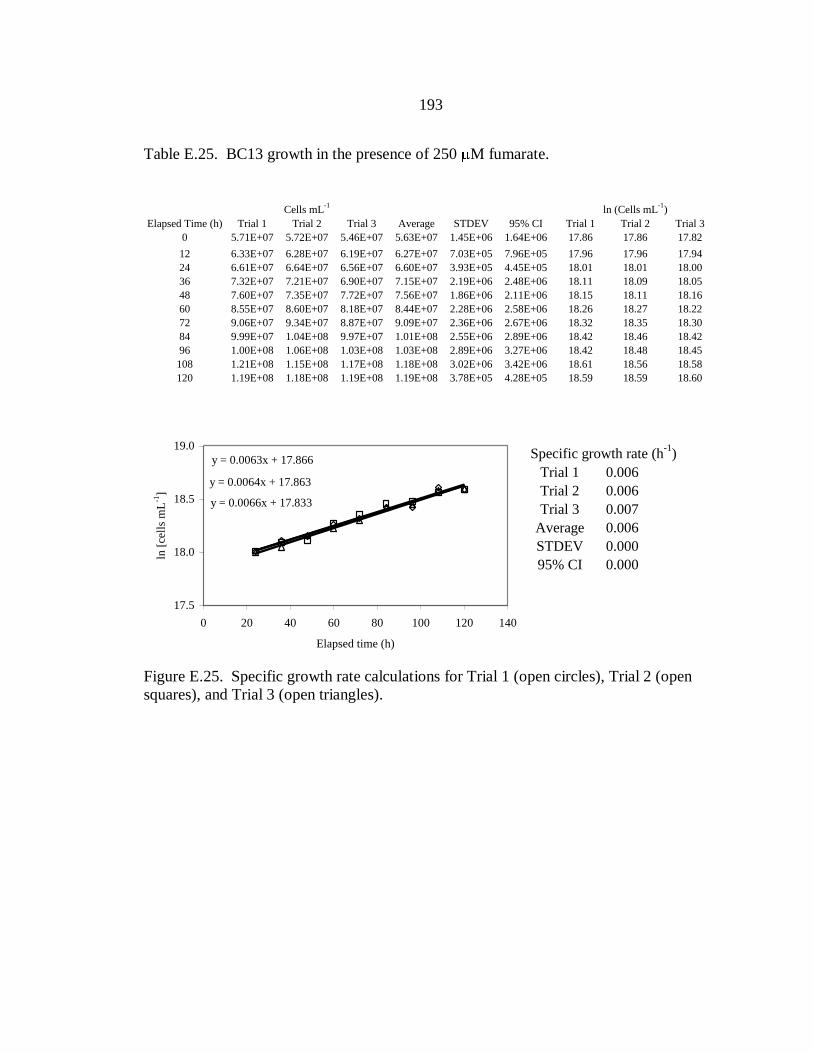
193
Table E.25. BC13 growth in the presence of 250 M fumarate.
Cells mL
-1ln (Cells mL
-1)
Elapsed Time (h) Trial 1 Trial 2 Trial 3 Average STDEV 95% CI Trial 1 Trial 2 Trial 3
0 5.71E+07 5.72E+07 5.46E+07 5.63E+07 1.45E+06 1.64E+06 17.86 17.86 17.82
12 6.33E+07 6.28E+07 6.19E+07 6.27E+07 7.03E+05 7.96E+05 17.96 17.96 17.94
24 6.61E+07 6.64E+07 6.56E+07 6.60E+07 3.93E+05 4.45E+05 18.01 18.01 18.00
36 7.32E+07 7.21E+07 6.90E+07 7.15E+07 2.19E+06 2.48E+06 18.11 18.09 18.05
48 7.60E+07 7.35E+07 7.72E+07 7.56E+07 1.86E+06 2.11E+06 18.15 18.11 18.16
60 8.55E+07 8.60E+07 8.18E+07 8.44E+07 2.28E+06 2.58E+06 18.26 18.27 18.22
72 9.06E+07 9.34E+07 8.87E+07 9.09E+07 2.36E+06 2.67E+06 18.32 18.35 18.30
84 9.99E+07 1.04E+08 9.97E+07 1.01E+08 2.55E+06 2.89E+06 18.42 18.46 18.42
96 1.00E+08 1.06E+08 1.03E+08 1.03E+08 2.89E+06 3.27E+06 18.42 18.48 18.45
108 1.21E+08 1.15E+08 1.17E+08 1.18E+08 3.02E+06 3.42E+06 18.61 18.56 18.58
120 1.19E+08 1.18E+08 1.19E+08 1.19E+08 3.78E+05 4.28E+05 18.59 18.59 18.6017.5
18.0
18.5
19.0
0 20 40 60 80 100 120 140
ln [
cell
s m
L-1
]
Specific growth rate (h-1
)
Trial 1 0.006
Trial 2 0.006
Trial 3 0.007
Average 0.006
STDEV 0.000
95% CI 0.000
y = 0.0063x + 17.866
y = 0.0064x + 17.863
y = 0.0066x + 17.833
17.5
18.0
18.5
19.0
0 20 40 60 80 100 120 140
Elapsed time (h)
ln [
cell
s m
L-1
]
Figure E.25. Specific growth rate calculations for Trial 1 (open circles), Trial 2 (open
squares), and Trial 3 (open triangles).
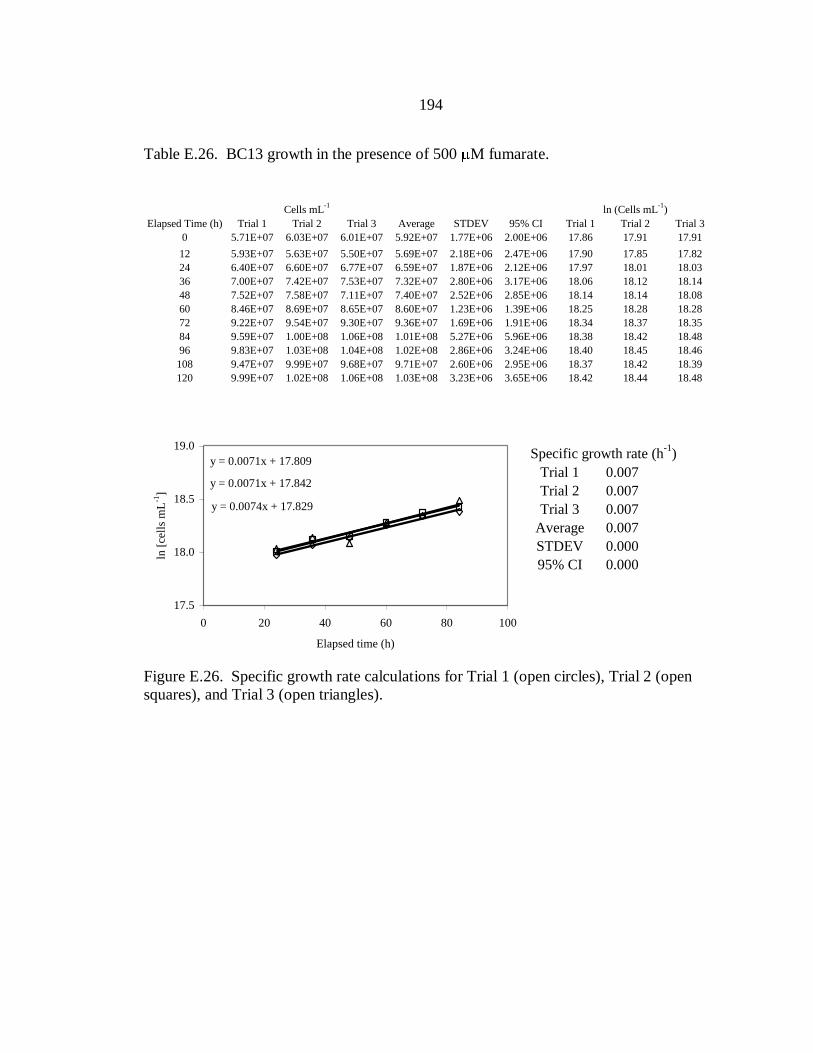
194
Table E.26. BC13 growth in the presence of 500 M fumarate.
Cells mL
-1ln (Cells mL
-1)
Elapsed Time (h) Trial 1 Trial 2 Trial 3 Average STDEV 95% CI Trial 1 Trial 2 Trial 3
0 5.71E+07 6.03E+07 6.01E+07 5.92E+07 1.77E+06 2.00E+06 17.86 17.91 17.91
12 5.93E+07 5.63E+07 5.50E+07 5.69E+07 2.18E+06 2.47E+06 17.90 17.85 17.82
24 6.40E+07 6.60E+07 6.77E+07 6.59E+07 1.87E+06 2.12E+06 17.97 18.01 18.03
36 7.00E+07 7.42E+07 7.53E+07 7.32E+07 2.80E+06 3.17E+06 18.06 18.12 18.14
48 7.52E+07 7.58E+07 7.11E+07 7.40E+07 2.52E+06 2.85E+06 18.14 18.14 18.08
60 8.46E+07 8.69E+07 8.65E+07 8.60E+07 1.23E+06 1.39E+06 18.25 18.28 18.28
72 9.22E+07 9.54E+07 9.30E+07 9.36E+07 1.69E+06 1.91E+06 18.34 18.37 18.35
84 9.59E+07 1.00E+08 1.06E+08 1.01E+08 5.27E+06 5.96E+06 18.38 18.42 18.48
96 9.83E+07 1.03E+08 1.04E+08 1.02E+08 2.86E+06 3.24E+06 18.40 18.45 18.46
108 9.47E+07 9.99E+07 9.68E+07 9.71E+07 2.60E+06 2.95E+06 18.37 18.42 18.39
120 9.99E+07 1.02E+08 1.06E+08 1.03E+08 3.23E+06 3.65E+06 18.42 18.44 18.4817.5
18.0
18.5
19.0
0 20 40 60 80 100
ln [
cell
s m
L-1
]
Specific growth rate (h-1
)
Trial 1 0.007
Trial 2 0.007
Trial 3 0.007
Average 0.007
STDEV 0.000
95% CI 0.000
y = 0.0071x + 17.809
y = 0.0071x + 17.842
y = 0.0074x + 17.829
17.5
18.0
18.5
19.0
0 20 40 60 80 100
Elapsed time (h)
ln [
cell
s m
L-1
]
Figure E.26. Specific growth rate calculations for Trial 1 (open circles), Trial 2 (open
squares), and Trial 3 (open triangles).

195
Table E.27. BC13 growth in the presence of 1,000 M fumarate.
Cells mL
-1ln (Cells mL
-1)
Elapsed Time (h) Trial 1 Trial 2 Trial 3 Average STDEV 95% CI Trial 1 Trial 2 Trial 3
0 5.67E+07 5.53E+07 5.68E+07 5.63E+07 8.58E+05 9.71E+05 17.85 17.83 17.86
12 5.73E+07 5.48E+07 5.58E+07 5.60E+07 1.28E+06 1.45E+06 17.86 17.82 17.84
24 5.95E+07 5.84E+07 5.88E+07 5.89E+07 5.45E+05 6.16E+05 17.90 17.88 17.89
36 6.64E+07 6.35E+07 5.99E+07 6.33E+07 3.29E+06 3.72E+06 18.01 17.97 17.91
48 7.22E+07 7.08E+07 6.65E+07 6.98E+07 3.00E+06 3.40E+06 18.10 18.08 18.01
60 7.92E+07 7.58E+07 7.79E+07 7.77E+07 1.73E+06 1.96E+06 18.19 18.14 18.17
72 8.30E+07 7.96E+07 7.99E+07 8.08E+07 1.90E+06 2.15E+06 18.23 18.19 18.20
84 8.83E+07 9.33E+07 9.31E+07 9.16E+07 2.83E+06 3.20E+06 18.30 18.35 18.35
96 8.58E+07 8.78E+07 9.30E+07 8.89E+07 3.72E+06 4.21E+06 18.27 18.29 18.35
108 9.06E+07 9.43E+07 9.49E+07 9.33E+07 2.35E+06 2.65E+06 18.32 18.36 18.37
120 8.69E+07 8.29E+07 7.82E+07 8.27E+07 4.37E+06 4.94E+06 18.28 18.23 18.1717.8
18.0
18.2
18.4
18.6
0 20 40 60 80 100 120
Specific growth rate (h-1
)
Trial 1 0.005
Trial 2 0.006
Trial 3 0.007
Average 0.006
STDEV 0.001
95% CI 0.001
y = 0.0054x + 17.819
y = 0.0063x + 17.752
y = 0.0073x + 17.689
17.8
18.0
18.2
18.4
18.6
0 20 40 60 80 100 120
Elapsed time (h)
ln [
cell
s m
L-1
]
Figure E.27. Specific growth rate calculations for Trial 1 (open circles), Trial 2 (open
squares), and Trial 3 (open triangles).

196
Table E.28. BC13 growth in the presence of 5,000 M fumarate.
Cells mL
-1ln (Cells mL
-1)
Elapsed Time (h) Trial 1 Trial 2 Trial 3 Average STDEV 95% CI Trial 1 Trial 2 Trial 3
0 4.34E+07 4.52E+07 4.46E+07 4.44E+07 9.06E+05 1.03E+06 17.59 17.63 17.61
12 4.44E+07 4.56E+07 4.60E+07 4.53E+07 8.16E+05 9.24E+05 17.61 17.64 17.64
24 4.51E+07 4.40E+07 4.14E+07 4.35E+07 1.86E+06 2.11E+06 17.62 17.60 17.54
36 5.08E+07 5.46E+07 5.66E+07 5.40E+07 2.93E+06 3.32E+06 17.74 17.82 17.85
48 4.67E+07 4.38E+07 4.29E+07 4.45E+07 1.98E+06 2.24E+06 17.66 17.60 17.58
60 5.06E+07 4.92E+07 4.73E+07 4.91E+07 1.67E+06 1.89E+06 17.74 17.71 17.67
72 4.92E+07 5.13E+07 4.89E+07 4.98E+07 1.36E+06 1.53E+06 17.71 17.75 17.70
84 4.39E+07 4.50E+07 4.39E+07 4.43E+07 6.28E+05 7.11E+05 17.60 17.62 17.60
96 4.50E+07 4.67E+07 4.65E+07 4.61E+07 8.85E+05 1.00E+06 17.62 17.66 17.65
108 4.81E+07 4.92E+07 4.70E+07 4.81E+07 1.11E+06 1.26E+06 17.69 17.71 17.67
120 3.75E+07 3.92E+07 3.70E+07 3.79E+07 1.17E+06 1.32E+06 17.44 17.49 17.4317.4
17.6
17.8
18.0
0 20 40 60 80 100 120
Specific growth rate (h-1
)
Trial 1 0.000
Trial 2 0.001
Trial 3 0.000
Average 0.000
STDEV 0.000
95% CI 0.000
y = 0.0004x + 17.634
y = 0.0005x + 17.647
y = 0.0002x + 17.639
17.4
17.6
17.8
18.0
0 20 40 60 80 100 120
Elapsed time (h)
ln [
cell
s m
L-1
]
Figure E.28. Specific growth rate calculations for Trial 1 (open circles), Trial 2 (open
squares), and Trial 3 (open triangles).
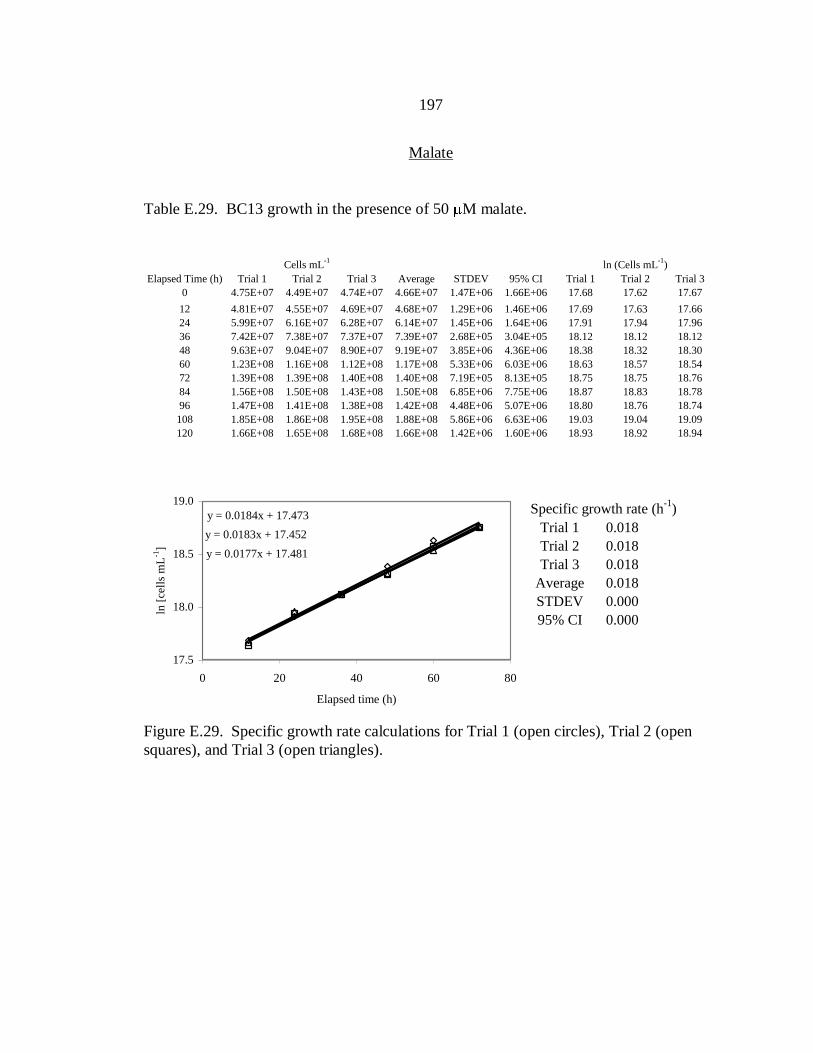
197
Malate
Table E.29. BC13 growth in the presence of 50 M malate.
Cells mL
-1ln (Cells mL
-1)
Elapsed Time (h) Trial 1 Trial 2 Trial 3 Average STDEV 95% CI Trial 1 Trial 2 Trial 3
0 4.75E+07 4.49E+07 4.74E+07 4.66E+07 1.47E+06 1.66E+06 17.68 17.62 17.67
12 4.81E+07 4.55E+07 4.69E+07 4.68E+07 1.29E+06 1.46E+06 17.69 17.63 17.66
24 5.99E+07 6.16E+07 6.28E+07 6.14E+07 1.45E+06 1.64E+06 17.91 17.94 17.96
36 7.42E+07 7.38E+07 7.37E+07 7.39E+07 2.68E+05 3.04E+05 18.12 18.12 18.12
48 9.63E+07 9.04E+07 8.90E+07 9.19E+07 3.85E+06 4.36E+06 18.38 18.32 18.30
60 1.23E+08 1.16E+08 1.12E+08 1.17E+08 5.33E+06 6.03E+06 18.63 18.57 18.54
72 1.39E+08 1.39E+08 1.40E+08 1.40E+08 7.19E+05 8.13E+05 18.75 18.75 18.76
84 1.56E+08 1.50E+08 1.43E+08 1.50E+08 6.85E+06 7.75E+06 18.87 18.83 18.78
96 1.47E+08 1.41E+08 1.38E+08 1.42E+08 4.48E+06 5.07E+06 18.80 18.76 18.74
108 1.85E+08 1.86E+08 1.95E+08 1.88E+08 5.86E+06 6.63E+06 19.03 19.04 19.09
120 1.66E+08 1.65E+08 1.68E+08 1.66E+08 1.42E+06 1.60E+06 18.93 18.92 18.9417.5
18.0
18.5
19.0
0 20 40 60 80
ln [
cell
s m
L-1
]
Specific growth rate (h-1
)
Trial 1 0.018
Trial 2 0.018
Trial 3 0.018
Average 0.018
STDEV 0.000
95% CI 0.000
y = 0.0184x + 17.473
y = 0.0183x + 17.452
y = 0.0177x + 17.481
17.5
18.0
18.5
19.0
0 20 40 60 80
Elapsed time (h)
ln [
cell
s m
L-1
]
Figure E.29. Specific growth rate calculations for Trial 1 (open circles), Trial 2 (open
squares), and Trial 3 (open triangles).

198
Table E.30. BC13 growth in the presence of 100 M malate.
Cells mL
-1ln (Cells mL
-1)
Elapsed Time (h) Trial 1 Trial 2 Trial 3 Average STDEV 95% CI Trial 1 Trial 2 Trial 3
0 5.00E+07 5.03E+07 5.91E+07 5.31E+07 5.16E+06 5.84E+06 17.73 17.73 17.89
12 6.86E+07 6.48E+07 6.60E+07 6.65E+07 1.93E+06 2.19E+06 18.04 17.99 18.01
24 6.69E+07 7.07E+07 6.98E+07 6.92E+07 2.01E+06 2.27E+06 18.02 18.07 18.06
36 7.74E+07 7.57E+07 7.36E+07 7.56E+07 1.88E+06 2.12E+06 18.16 18.14 18.11
48 9.10E+07 9.57E+07 9.61E+07 9.42E+07 2.85E+06 3.23E+06 18.33 18.38 18.38
60 9.48E+07 9.75E+07 9.31E+07 9.52E+07 2.19E+06 2.48E+06 18.37 18.40 18.35
72 1.15E+08 1.17E+08 1.14E+08 1.15E+08 1.34E+06 1.52E+06 18.56 18.58 18.55
84 1.39E+08 1.35E+08 1.36E+08 1.37E+08 2.42E+06 2.74E+06 18.75 18.72 18.73
96 1.73E+08 1.53E+08 1.65E+08 1.64E+08 1.01E+07 1.14E+07 18.97 18.85 18.92
108 1.81E+08 1.72E+08 1.80E+08 1.78E+08 4.61E+06 5.22E+06 19.01 18.97 19.01
120 1.59E+08 1.68E+08 1.60E+08 1.62E+08 5.12E+06 5.79E+06 18.88 18.94 18.8917.5
18.0
18.5
19.0
19.5
0 20 40 60 80 100 120
ln [
cell
s m
L-1
]
Specific growth rate (h-1
)
Trial 1 0.012
Trial 2 0.011
Trial 3 0.012
Average 0.012
STDEV 0.001
95% CI 0.001
y = 0.0124x + 17.706
y = 0.0109x + 17.794
y = 0.0118x + 17.735
17.5
18.0
18.5
19.0
19.5
0 20 40 60 80 100 120
Elapsed time (h)
ln [
cell
s m
L-1
]
Figure E.30. Specific growth rate calculations for Trial 1 (open circles), Trial 2 (open
squares), and Trial 3 (open triangles).
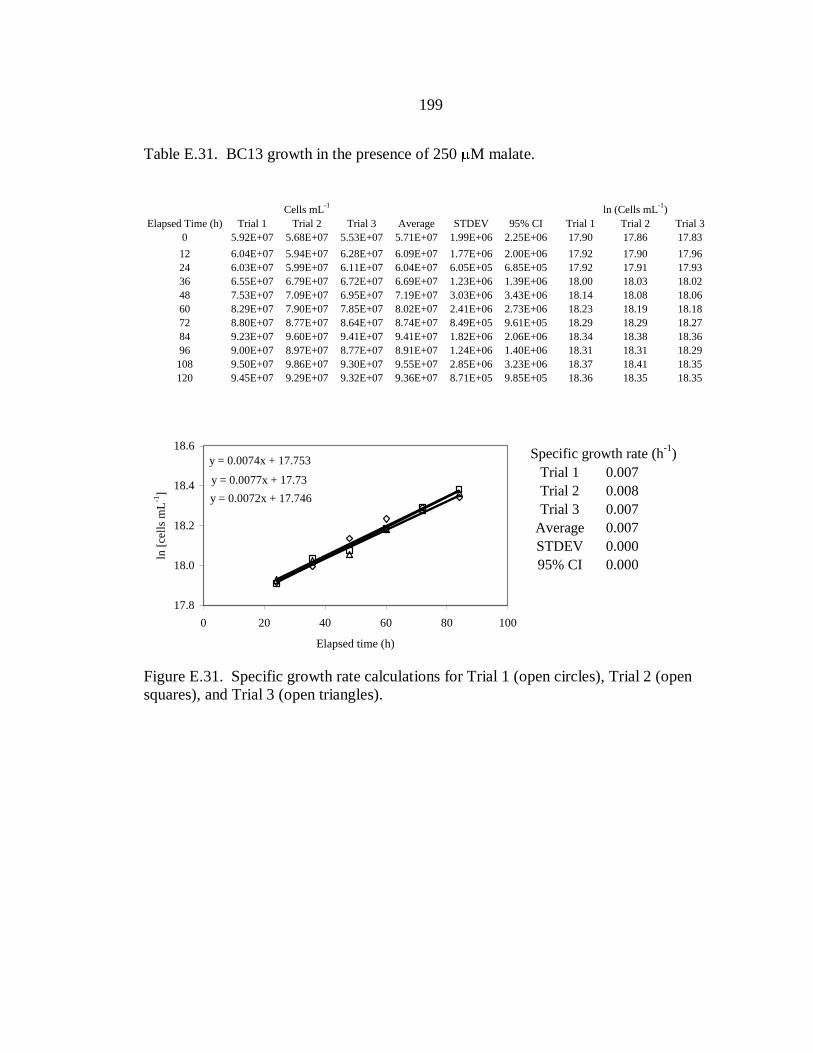
199
Table E.31. BC13 growth in the presence of 250 M malate.
Cells mL
-1ln (Cells mL
-1)
Elapsed Time (h) Trial 1 Trial 2 Trial 3 Average STDEV 95% CI Trial 1 Trial 2 Trial 3
0 5.92E+07 5.68E+07 5.53E+07 5.71E+07 1.99E+06 2.25E+06 17.90 17.86 17.83
12 6.04E+07 5.94E+07 6.28E+07 6.09E+07 1.77E+06 2.00E+06 17.92 17.90 17.96
24 6.03E+07 5.99E+07 6.11E+07 6.04E+07 6.05E+05 6.85E+05 17.92 17.91 17.93
36 6.55E+07 6.79E+07 6.72E+07 6.69E+07 1.23E+06 1.39E+06 18.00 18.03 18.02
48 7.53E+07 7.09E+07 6.95E+07 7.19E+07 3.03E+06 3.43E+06 18.14 18.08 18.06
60 8.29E+07 7.90E+07 7.85E+07 8.02E+07 2.41E+06 2.73E+06 18.23 18.19 18.18
72 8.80E+07 8.77E+07 8.64E+07 8.74E+07 8.49E+05 9.61E+05 18.29 18.29 18.27
84 9.23E+07 9.60E+07 9.41E+07 9.41E+07 1.82E+06 2.06E+06 18.34 18.38 18.36
96 9.00E+07 8.97E+07 8.77E+07 8.91E+07 1.24E+06 1.40E+06 18.31 18.31 18.29
108 9.50E+07 9.86E+07 9.30E+07 9.55E+07 2.85E+06 3.23E+06 18.37 18.41 18.35
120 9.45E+07 9.29E+07 9.32E+07 9.36E+07 8.71E+05 9.85E+05 18.36 18.35 18.3517.8
18.0
18.2
18.4
18.6
0 20 40 60 80 100
ln [
cell
s m
L-1
]
Specific growth rate (h-1
)
Trial 1 0.007
Trial 2 0.008
Trial 3 0.007
Average 0.007
STDEV 0.000
95% CI 0.000
y = 0.0074x + 17.753
y = 0.0077x + 17.73
y = 0.0072x + 17.746
17.8
18.0
18.2
18.4
18.6
0 20 40 60 80 100
Elapsed time (h)
ln [
cell
s m
L-1
]
Figure E.31. Specific growth rate calculations for Trial 1 (open circles), Trial 2 (open
squares), and Trial 3 (open triangles).
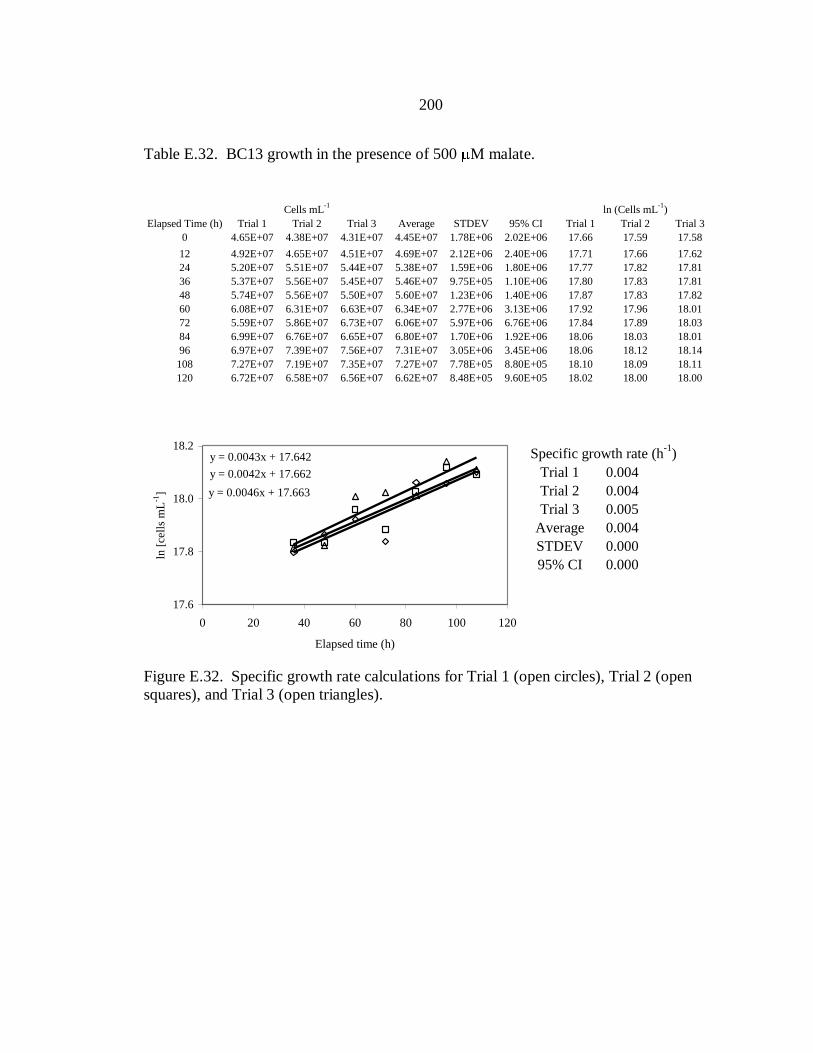
200
Table E.32. BC13 growth in the presence of 500 M malate.
Cells mL
-1ln (Cells mL
-1)
Elapsed Time (h) Trial 1 Trial 2 Trial 3 Average STDEV 95% CI Trial 1 Trial 2 Trial 3
0 4.65E+07 4.38E+07 4.31E+07 4.45E+07 1.78E+06 2.02E+06 17.66 17.59 17.58
12 4.92E+07 4.65E+07 4.51E+07 4.69E+07 2.12E+06 2.40E+06 17.71 17.66 17.62
24 5.20E+07 5.51E+07 5.44E+07 5.38E+07 1.59E+06 1.80E+06 17.77 17.82 17.81
36 5.37E+07 5.56E+07 5.45E+07 5.46E+07 9.75E+05 1.10E+06 17.80 17.83 17.81
48 5.74E+07 5.56E+07 5.50E+07 5.60E+07 1.23E+06 1.40E+06 17.87 17.83 17.82
60 6.08E+07 6.31E+07 6.63E+07 6.34E+07 2.77E+06 3.13E+06 17.92 17.96 18.01
72 5.59E+07 5.86E+07 6.73E+07 6.06E+07 5.97E+06 6.76E+06 17.84 17.89 18.03
84 6.99E+07 6.76E+07 6.65E+07 6.80E+07 1.70E+06 1.92E+06 18.06 18.03 18.01
96 6.97E+07 7.39E+07 7.56E+07 7.31E+07 3.05E+06 3.45E+06 18.06 18.12 18.14
108 7.27E+07 7.19E+07 7.35E+07 7.27E+07 7.78E+05 8.80E+05 18.10 18.09 18.11
120 6.72E+07 6.58E+07 6.56E+07 6.62E+07 8.48E+05 9.60E+05 18.02 18.00 18.0017.6
17.8
18.0
18.2
0 20 40 60 80 100 120
ln [
cell
s m
L-1
]
Specific growth rate (h-1
)
Trial 1 0.004
Trial 2 0.004
Trial 3 0.005
Average 0.004
STDEV 0.000
95% CI 0.000
y = 0.0043x + 17.642
y = 0.0042x + 17.662
y = 0.0046x + 17.663
17.6
17.8
18.0
18.2
0 20 40 60 80 100 120
Elapsed time (h)
ln [
cell
s m
L-1
]
Figure E.32. Specific growth rate calculations for Trial 1 (open circles), Trial 2 (open
squares), and Trial 3 (open triangles).
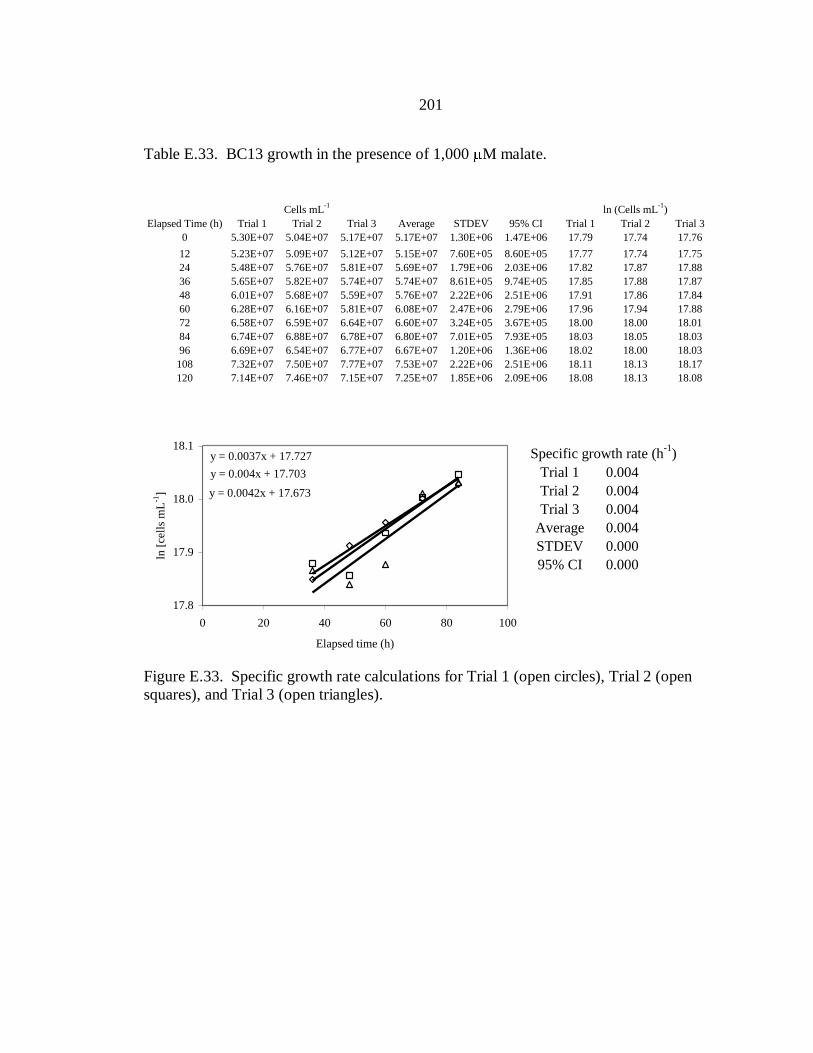
201
Table E.33. BC13 growth in the presence of 1,000 M malate.
Cells mL
-1ln (Cells mL
-1)
Elapsed Time (h) Trial 1 Trial 2 Trial 3 Average STDEV 95% CI Trial 1 Trial 2 Trial 3
0 5.30E+07 5.04E+07 5.17E+07 5.17E+07 1.30E+06 1.47E+06 17.79 17.74 17.76
12 5.23E+07 5.09E+07 5.12E+07 5.15E+07 7.60E+05 8.60E+05 17.77 17.74 17.75
24 5.48E+07 5.76E+07 5.81E+07 5.69E+07 1.79E+06 2.03E+06 17.82 17.87 17.88
36 5.65E+07 5.82E+07 5.74E+07 5.74E+07 8.61E+05 9.74E+05 17.85 17.88 17.87
48 6.01E+07 5.68E+07 5.59E+07 5.76E+07 2.22E+06 2.51E+06 17.91 17.86 17.84
60 6.28E+07 6.16E+07 5.81E+07 6.08E+07 2.47E+06 2.79E+06 17.96 17.94 17.88
72 6.58E+07 6.59E+07 6.64E+07 6.60E+07 3.24E+05 3.67E+05 18.00 18.00 18.01
84 6.74E+07 6.88E+07 6.78E+07 6.80E+07 7.01E+05 7.93E+05 18.03 18.05 18.03
96 6.69E+07 6.54E+07 6.77E+07 6.67E+07 1.20E+06 1.36E+06 18.02 18.00 18.03
108 7.32E+07 7.50E+07 7.77E+07 7.53E+07 2.22E+06 2.51E+06 18.11 18.13 18.17
120 7.14E+07 7.46E+07 7.15E+07 7.25E+07 1.85E+06 2.09E+06 18.08 18.13 18.0817.8
17.9
18.0
18.1
0 20 40 60 80 100
ln [
cell
s m
L-1
]
Specific growth rate (h-1
)
Trial 1 0.004
Trial 2 0.004
Trial 3 0.004
Average 0.004
STDEV 0.000
95% CI 0.000
y = 0.0037x + 17.727
y = 0.004x + 17.703
y = 0.0042x + 17.673
17.8
17.9
18.0
18.1
0 20 40 60 80 100
Elapsed time (h)
ln [
cell
s m
L-1
]
Figure E.33. Specific growth rate calculations for Trial 1 (open circles), Trial 2 (open
squares), and Trial 3 (open triangles).

202
Table E.34. BC13 growth in the presence of 5,000 M malate.
Cells mL
-1ln (Cells mL
-1)
Elapsed Time (h) Trial 1 Trial 2 Trial 3 Average STDEV 95% CI Trial 1 Trial 2 Trial 3
0 4.58E+07 4.50E+07 4.32E+07 4.47E+07 1.37E+06 1.55E+06 17.64 17.62 17.58
12 4.47E+07 4.26E+07 4.13E+07 4.29E+07 1.71E+06 1.93E+06 17.62 17.57 17.54
24 4.22E+07 4.17E+07 3.97E+07 4.12E+07 1.33E+06 1.50E+06 17.56 17.55 17.50
36 4.38E+07 4.51E+07 4.44E+07 4.44E+07 6.62E+05 7.49E+05 17.60 17.63 17.61
48 4.50E+07 4.60E+07 4.76E+07 4.62E+07 1.28E+06 1.45E+06 17.62 17.64 17.68
60 4.78E+07 4.78E+07 4.53E+07 4.70E+07 1.43E+06 1.62E+06 17.68 17.68 17.63
72 4.72E+07 4.64E+07 4.62E+07 4.66E+07 5.64E+05 6.39E+05 17.67 17.65 17.65
84 4.73E+07 4.75E+07 4.69E+07 4.72E+07 2.76E+05 3.13E+05 17.67 17.68 17.66
96 4.77E+07 4.56E+07 4.31E+07 4.55E+07 2.32E+06 2.63E+06 17.68 17.64 17.58
108 4.60E+07 4.81E+07 4.51E+07 4.64E+07 1.53E+06 1.73E+06 17.64 17.69 17.62
120 4.54E+07 4.76E+07 4.71E+07 4.67E+07 1.16E+06 1.31E+06 17.63 17.68 17.6717.4
17.5
17.6
17.7
0 20 40 60 80 100 120 140
ln [
cell
s m
L-1
]
Specific growth rate (h-1
)
Trial 1 0.001
Trial 2 0.001
Trial 3 0.001
Average 0.001
STDEV 0.000
95% CI 0.000
y = 0.0005x + 17.609
y = 0.0009x + 17.586
y = 0.0008x + 17.56
17.4
17.5
17.6
17.7
0 20 40 60 80 100 120 140
Elapsed time (h)
ln [
cell
s m
L-1
]
Figure E.34. Specific growth rate calculations for Trial 1 (open circles), Trial 2 (open
squares), and Trial 3 (open triangles).
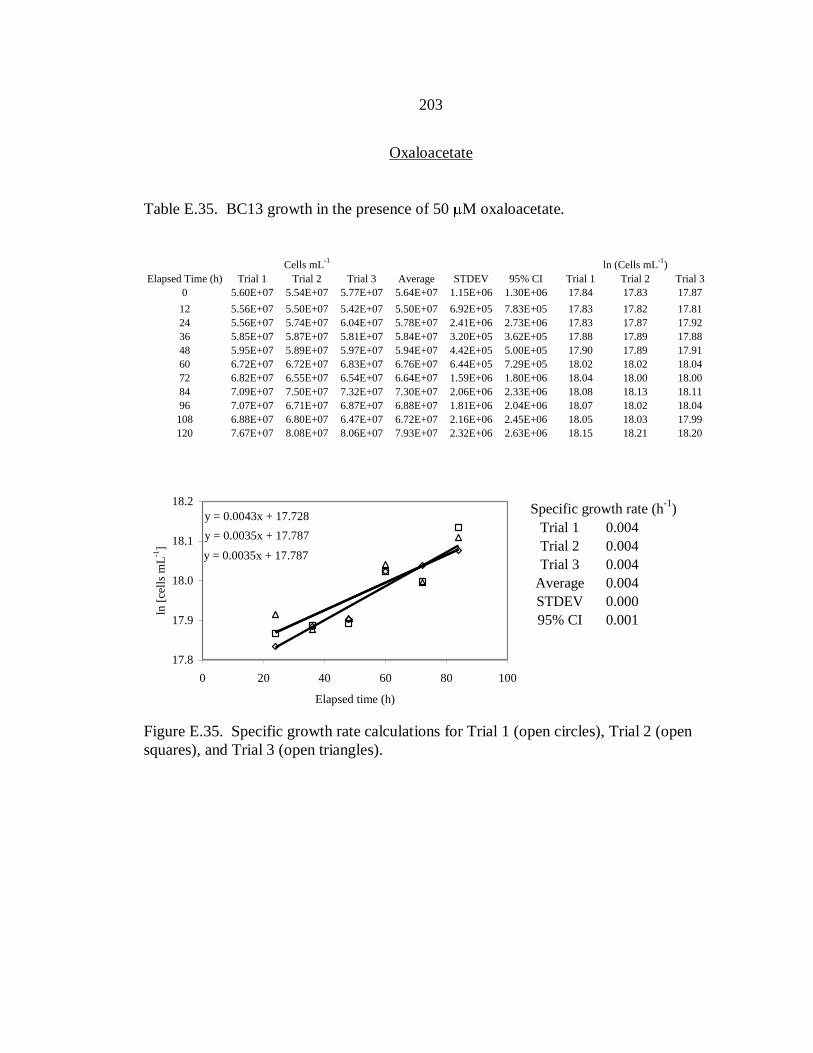
203
Oxaloacetate
Table E.35. BC13 growth in the presence of 50 M oxaloacetate.
Cells mL
-1ln (Cells mL
-1)
Elapsed Time (h) Trial 1 Trial 2 Trial 3 Average STDEV 95% CI Trial 1 Trial 2 Trial 3
0 5.60E+07 5.54E+07 5.77E+07 5.64E+07 1.15E+06 1.30E+06 17.84 17.83 17.87
12 5.56E+07 5.50E+07 5.42E+07 5.50E+07 6.92E+05 7.83E+05 17.83 17.82 17.81
24 5.56E+07 5.74E+07 6.04E+07 5.78E+07 2.41E+06 2.73E+06 17.83 17.87 17.92
36 5.85E+07 5.87E+07 5.81E+07 5.84E+07 3.20E+05 3.62E+05 17.88 17.89 17.88
48 5.95E+07 5.89E+07 5.97E+07 5.94E+07 4.42E+05 5.00E+05 17.90 17.89 17.91
60 6.72E+07 6.72E+07 6.83E+07 6.76E+07 6.44E+05 7.29E+05 18.02 18.02 18.04
72 6.82E+07 6.55E+07 6.54E+07 6.64E+07 1.59E+06 1.80E+06 18.04 18.00 18.00
84 7.09E+07 7.50E+07 7.32E+07 7.30E+07 2.06E+06 2.33E+06 18.08 18.13 18.11
96 7.07E+07 6.71E+07 6.87E+07 6.88E+07 1.81E+06 2.04E+06 18.07 18.02 18.04
108 6.88E+07 6.80E+07 6.47E+07 6.72E+07 2.16E+06 2.45E+06 18.05 18.03 17.99
120 7.67E+07 8.08E+07 8.06E+07 7.93E+07 2.32E+06 2.63E+06 18.15 18.21 18.2017.8
17.9
18.0
18.1
18.2
0 20 40 60 80 100
ln [
cell
s m
L-1
]
Specific growth rate (h-1
)
Trial 1 0.004
Trial 2 0.004
Trial 3 0.004
Average 0.004
STDEV 0.000
95% CI 0.001
y = 0.0043x + 17.728
y = 0.0035x + 17.787
y = 0.0035x + 17.787
17.8
17.9
18.0
18.1
18.2
0 20 40 60 80 100
Elapsed time (h)
ln [
cell
s m
L-1
]
Figure E.35. Specific growth rate calculations for Trial 1 (open circles), Trial 2 (open
squares), and Trial 3 (open triangles).
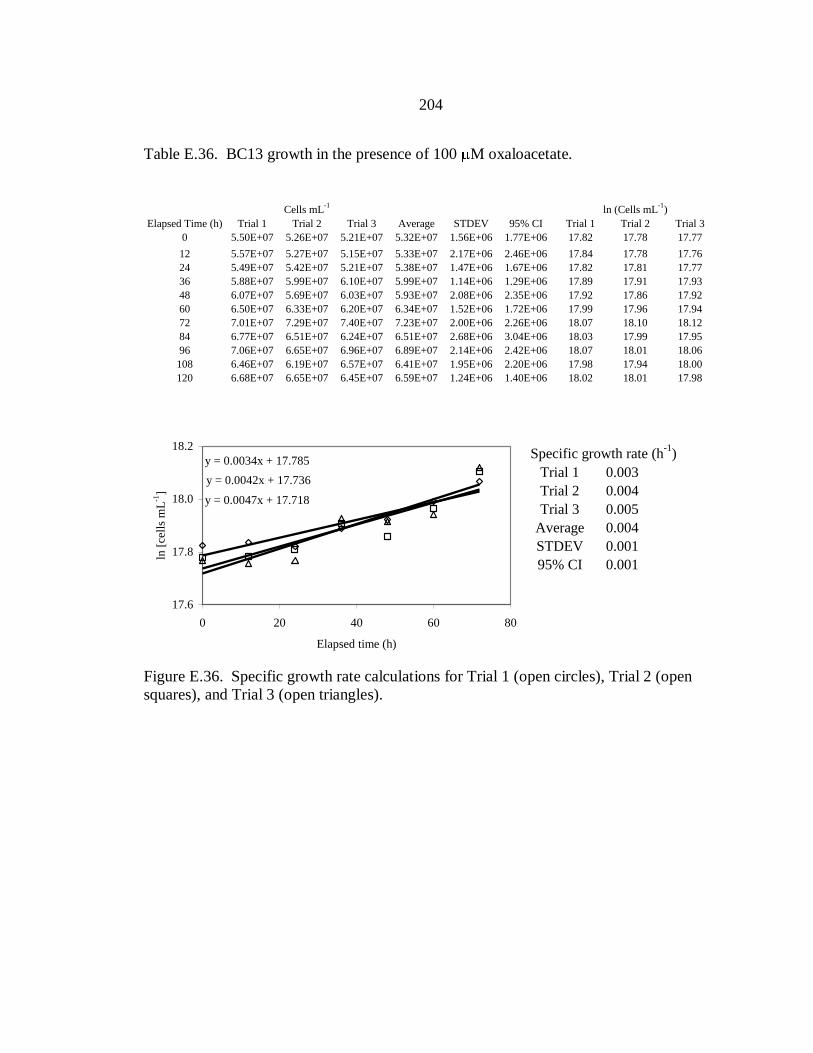
204
Table E.36. BC13 growth in the presence of 100 M oxaloacetate.
Cells mL
-1ln (Cells mL
-1)
Elapsed Time (h) Trial 1 Trial 2 Trial 3 Average STDEV 95% CI Trial 1 Trial 2 Trial 3
0 5.50E+07 5.26E+07 5.21E+07 5.32E+07 1.56E+06 1.77E+06 17.82 17.78 17.77
12 5.57E+07 5.27E+07 5.15E+07 5.33E+07 2.17E+06 2.46E+06 17.84 17.78 17.76
24 5.49E+07 5.42E+07 5.21E+07 5.38E+07 1.47E+06 1.67E+06 17.82 17.81 17.77
36 5.88E+07 5.99E+07 6.10E+07 5.99E+07 1.14E+06 1.29E+06 17.89 17.91 17.93
48 6.07E+07 5.69E+07 6.03E+07 5.93E+07 2.08E+06 2.35E+06 17.92 17.86 17.92
60 6.50E+07 6.33E+07 6.20E+07 6.34E+07 1.52E+06 1.72E+06 17.99 17.96 17.94
72 7.01E+07 7.29E+07 7.40E+07 7.23E+07 2.00E+06 2.26E+06 18.07 18.10 18.12
84 6.77E+07 6.51E+07 6.24E+07 6.51E+07 2.68E+06 3.04E+06 18.03 17.99 17.95
96 7.06E+07 6.65E+07 6.96E+07 6.89E+07 2.14E+06 2.42E+06 18.07 18.01 18.06
108 6.46E+07 6.19E+07 6.57E+07 6.41E+07 1.95E+06 2.20E+06 17.98 17.94 18.00
120 6.68E+07 6.65E+07 6.45E+07 6.59E+07 1.24E+06 1.40E+06 18.02 18.01 17.9817.6
17.8
18.0
18.2
0 20 40 60 80
ln [
cell
s m
L-1
]
Specific growth rate (h-1
)
Trial 1 0.003
Trial 2 0.004
Trial 3 0.005
Average 0.004
STDEV 0.001
95% CI 0.001
y = 0.0034x + 17.785
y = 0.0042x + 17.736
y = 0.0047x + 17.718
17.6
17.8
18.0
18.2
0 20 40 60 80
Elapsed time (h)
ln [
cell
s m
L-1
]
Figure E.36. Specific growth rate calculations for Trial 1 (open circles), Trial 2 (open
squares), and Trial 3 (open triangles).
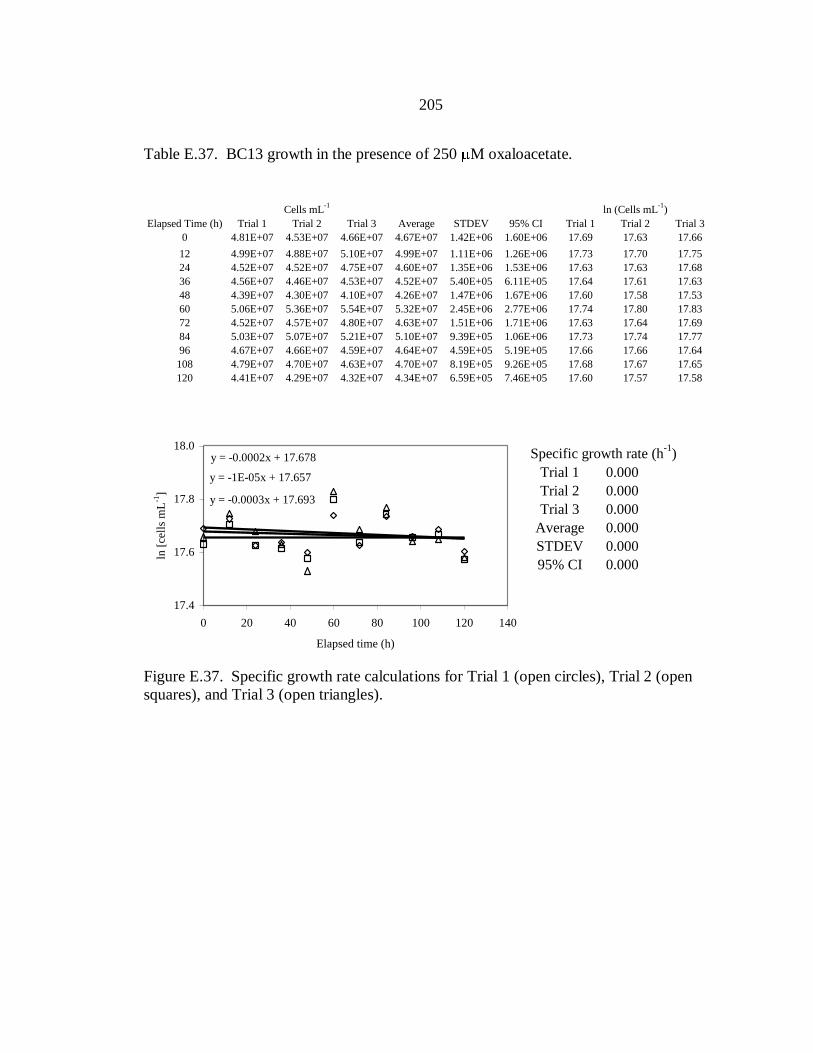
205
Table E.37. BC13 growth in the presence of 250 M oxaloacetate.
Cells mL
-1ln (Cells mL
-1)
Elapsed Time (h) Trial 1 Trial 2 Trial 3 Average STDEV 95% CI Trial 1 Trial 2 Trial 3
0 4.81E+07 4.53E+07 4.66E+07 4.67E+07 1.42E+06 1.60E+06 17.69 17.63 17.66
12 4.99E+07 4.88E+07 5.10E+07 4.99E+07 1.11E+06 1.26E+06 17.73 17.70 17.75
24 4.52E+07 4.52E+07 4.75E+07 4.60E+07 1.35E+06 1.53E+06 17.63 17.63 17.68
36 4.56E+07 4.46E+07 4.53E+07 4.52E+07 5.40E+05 6.11E+05 17.64 17.61 17.63
48 4.39E+07 4.30E+07 4.10E+07 4.26E+07 1.47E+06 1.67E+06 17.60 17.58 17.53
60 5.06E+07 5.36E+07 5.54E+07 5.32E+07 2.45E+06 2.77E+06 17.74 17.80 17.83
72 4.52E+07 4.57E+07 4.80E+07 4.63E+07 1.51E+06 1.71E+06 17.63 17.64 17.69
84 5.03E+07 5.07E+07 5.21E+07 5.10E+07 9.39E+05 1.06E+06 17.73 17.74 17.77
96 4.67E+07 4.66E+07 4.59E+07 4.64E+07 4.59E+05 5.19E+05 17.66 17.66 17.64
108 4.79E+07 4.70E+07 4.63E+07 4.70E+07 8.19E+05 9.26E+05 17.68 17.67 17.65
120 4.41E+07 4.29E+07 4.32E+07 4.34E+07 6.59E+05 7.46E+05 17.60 17.57 17.5817.4
17.6
17.8
18.0
0 20 40 60 80 100 120 140
ln [
cell
s m
L-1
]
Specific growth rate (h-1
)
Trial 1 0.000
Trial 2 0.000
Trial 3 0.000
Average 0.000
STDEV 0.000
95% CI 0.000
y = -0.0002x + 17.678
y = -1E-05x + 17.657
y = -0.0003x + 17.693
17.4
17.6
17.8
18.0
0 20 40 60 80 100 120 140
Elapsed time (h)
ln [
cell
s m
L-1
]
Figure E.37. Specific growth rate calculations for Trial 1 (open circles), Trial 2 (open
squares), and Trial 3 (open triangles).
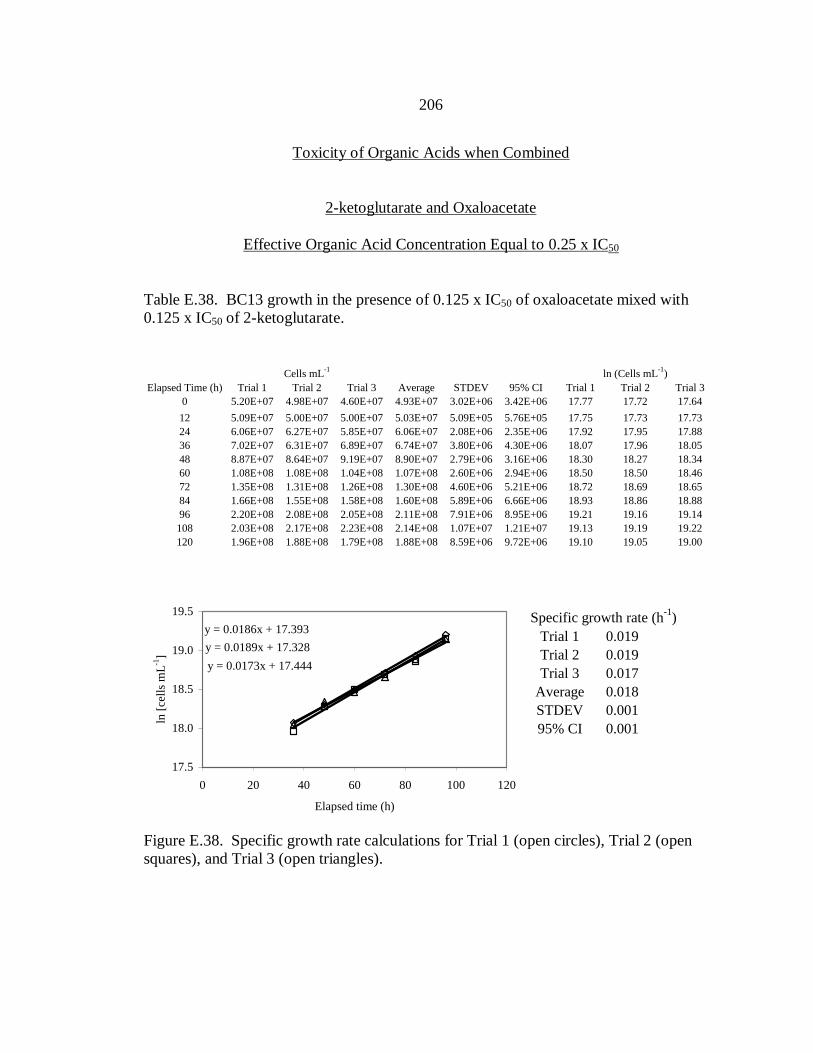
206
Toxicity of Organic Acids when Combined
2-ketoglutarate and Oxaloacetate
Effective Organic Acid Concentration Equal to 0.25 x IC50
Table E.38. BC13 growth in the presence of 0.125 x IC50 of oxaloacetate mixed with
0.125 x IC50 of 2-ketoglutarate.
Cells mL
-1ln (Cells mL
-1)
Elapsed Time (h) Trial 1 Trial 2 Trial 3 Average STDEV 95% CI Trial 1 Trial 2 Trial 3
0 5.20E+07 4.98E+07 4.60E+07 4.93E+07 3.02E+06 3.42E+06 17.77 17.72 17.64
12 5.09E+07 5.00E+07 5.00E+07 5.03E+07 5.09E+05 5.76E+05 17.75 17.73 17.73
24 6.06E+07 6.27E+07 5.85E+07 6.06E+07 2.08E+06 2.35E+06 17.92 17.95 17.88
36 7.02E+07 6.31E+07 6.89E+07 6.74E+07 3.80E+06 4.30E+06 18.07 17.96 18.05
48 8.87E+07 8.64E+07 9.19E+07 8.90E+07 2.79E+06 3.16E+06 18.30 18.27 18.34
60 1.08E+08 1.08E+08 1.04E+08 1.07E+08 2.60E+06 2.94E+06 18.50 18.50 18.46
72 1.35E+08 1.31E+08 1.26E+08 1.30E+08 4.60E+06 5.21E+06 18.72 18.69 18.65
84 1.66E+08 1.55E+08 1.58E+08 1.60E+08 5.89E+06 6.66E+06 18.93 18.86 18.88
96 2.20E+08 2.08E+08 2.05E+08 2.11E+08 7.91E+06 8.95E+06 19.21 19.16 19.14
108 2.03E+08 2.17E+08 2.23E+08 2.14E+08 1.07E+07 1.21E+07 19.13 19.19 19.22
120 1.96E+08 1.88E+08 1.79E+08 1.88E+08 8.59E+06 9.72E+06 19.10 19.05 19.00
17.5
18.0
18.5
19.0
19.5
0 20 40 60 80 100 120
ln [
cell
s m
L-1
]
Specific growth rate (h-1
)
Trial 1 0.019
Trial 2 0.019
Trial 3 0.017
Average 0.018
STDEV 0.001
95% CI 0.001
y = 0.0186x + 17.393
y = 0.0189x + 17.328
y = 0.0173x + 17.444
17.5
18.0
18.5
19.0
19.5
0 20 40 60 80 100 120
Elapsed time (h)
ln [
cell
s m
L-1
]
Figure E.38. Specific growth rate calculations for Trial 1 (open circles), Trial 2 (open
squares), and Trial 3 (open triangles).
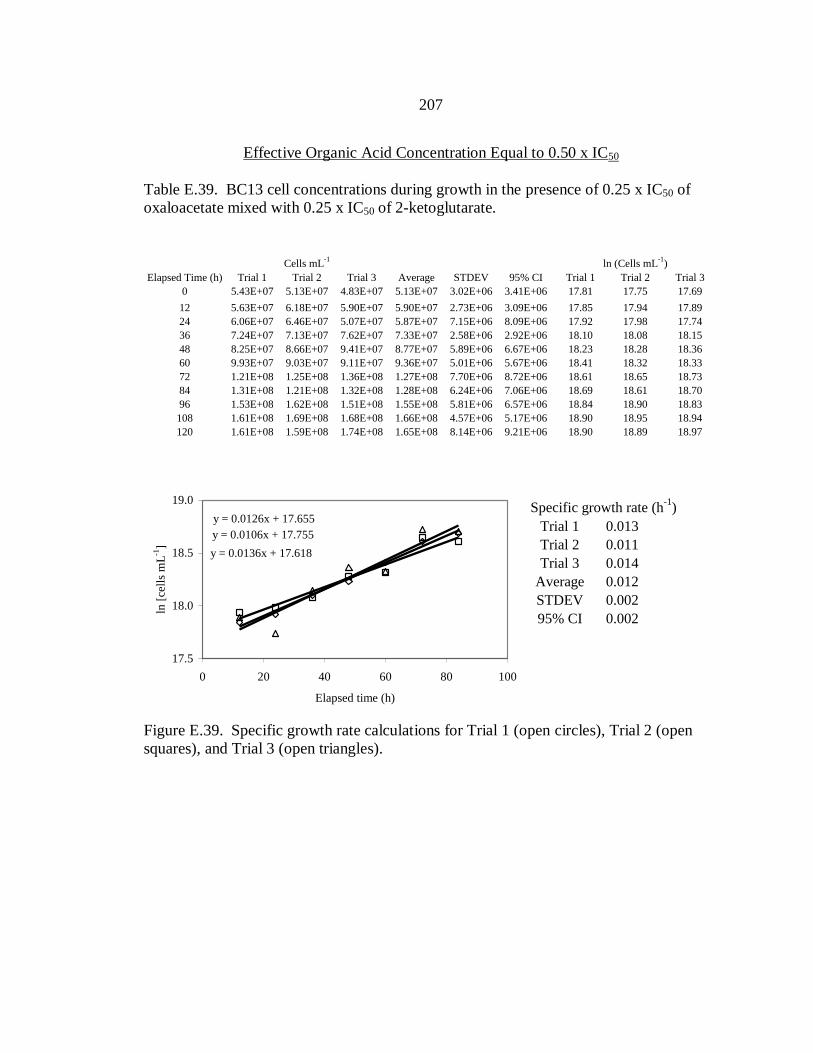
207
Effective Organic Acid Concentration Equal to 0.50 x IC50
Table E.39. BC13 cell concentrations during growth in the presence of 0.25 x IC50 of
oxaloacetate mixed with 0.25 x IC50 of 2-ketoglutarate.
Cells mL
-1ln (Cells mL
-1)
Elapsed Time (h) Trial 1 Trial 2 Trial 3 Average STDEV 95% CI Trial 1 Trial 2 Trial 3
0 5.43E+07 5.13E+07 4.83E+07 5.13E+07 3.02E+06 3.41E+06 17.81 17.75 17.69
12 5.63E+07 6.18E+07 5.90E+07 5.90E+07 2.73E+06 3.09E+06 17.85 17.94 17.89
24 6.06E+07 6.46E+07 5.07E+07 5.87E+07 7.15E+06 8.09E+06 17.92 17.98 17.74
36 7.24E+07 7.13E+07 7.62E+07 7.33E+07 2.58E+06 2.92E+06 18.10 18.08 18.15
48 8.25E+07 8.66E+07 9.41E+07 8.77E+07 5.89E+06 6.67E+06 18.23 18.28 18.36
60 9.93E+07 9.03E+07 9.11E+07 9.36E+07 5.01E+06 5.67E+06 18.41 18.32 18.33
72 1.21E+08 1.25E+08 1.36E+08 1.27E+08 7.70E+06 8.72E+06 18.61 18.65 18.73
84 1.31E+08 1.21E+08 1.32E+08 1.28E+08 6.24E+06 7.06E+06 18.69 18.61 18.70
96 1.53E+08 1.62E+08 1.51E+08 1.55E+08 5.81E+06 6.57E+06 18.84 18.90 18.83
108 1.61E+08 1.69E+08 1.68E+08 1.66E+08 4.57E+06 5.17E+06 18.90 18.95 18.94
120 1.61E+08 1.59E+08 1.74E+08 1.65E+08 8.14E+06 9.21E+06 18.90 18.89 18.9717.5
18.0
18.5
19.0
0 20 40 60 80 100
ln [
cell
s m
L-1
]
Specific growth rate (h-1
)
Trial 1 0.013
Trial 2 0.011
Trial 3 0.014
Average 0.012
STDEV 0.002
95% CI 0.002
y = 0.0126x + 17.655
y = 0.0106x + 17.755
y = 0.0136x + 17.618
17.5
18.0
18.5
19.0
0 20 40 60 80 100
Elapsed time (h)
ln [
cell
s m
L-1
]
Figure E.39. Specific growth rate calculations for Trial 1 (open circles), Trial 2 (open
squares), and Trial 3 (open triangles).
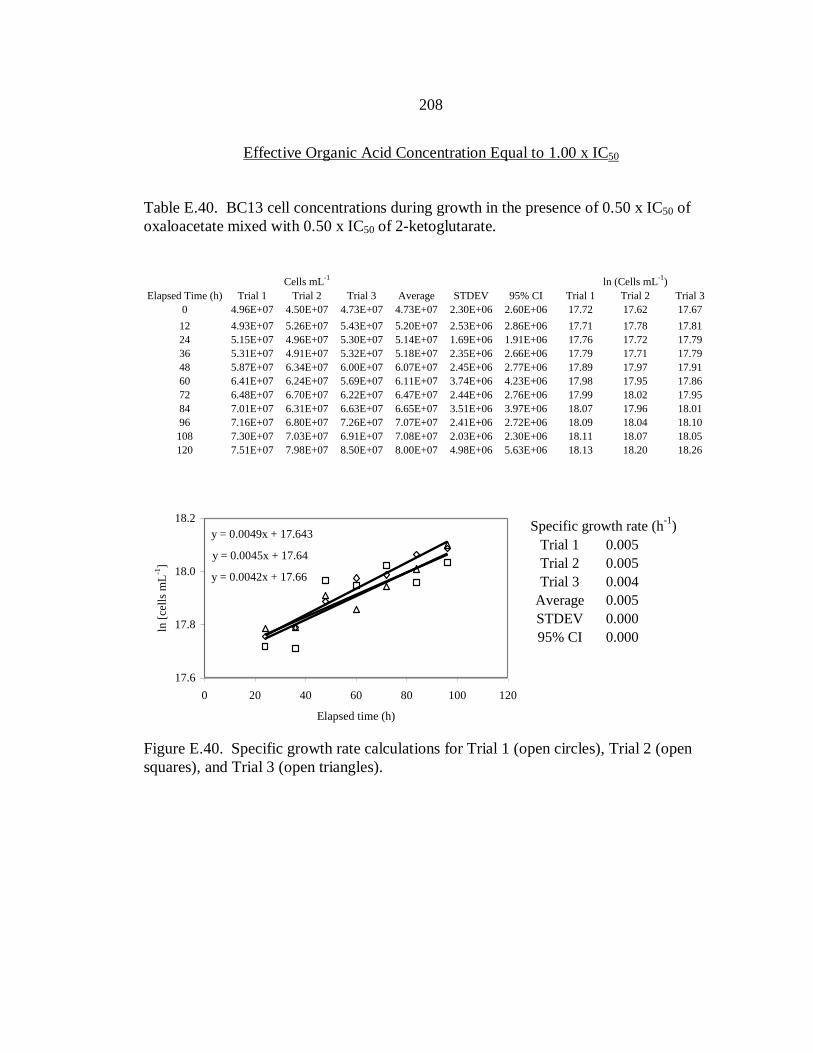
208
Effective Organic Acid Concentration Equal to 1.00 x IC50
Table E.40. BC13 cell concentrations during growth in the presence of 0.50 x IC50 of
oxaloacetate mixed with 0.50 x IC50 of 2-ketoglutarate.
Cells mL
-1ln (Cells mL
-1)
Elapsed Time (h) Trial 1 Trial 2 Trial 3 Average STDEV 95% CI Trial 1 Trial 2 Trial 3
0 4.96E+07 4.50E+07 4.73E+07 4.73E+07 2.30E+06 2.60E+06 17.72 17.62 17.67
12 4.93E+07 5.26E+07 5.43E+07 5.20E+07 2.53E+06 2.86E+06 17.71 17.78 17.81
24 5.15E+07 4.96E+07 5.30E+07 5.14E+07 1.69E+06 1.91E+06 17.76 17.72 17.79
36 5.31E+07 4.91E+07 5.32E+07 5.18E+07 2.35E+06 2.66E+06 17.79 17.71 17.79
48 5.87E+07 6.34E+07 6.00E+07 6.07E+07 2.45E+06 2.77E+06 17.89 17.97 17.91
60 6.41E+07 6.24E+07 5.69E+07 6.11E+07 3.74E+06 4.23E+06 17.98 17.95 17.86
72 6.48E+07 6.70E+07 6.22E+07 6.47E+07 2.44E+06 2.76E+06 17.99 18.02 17.95
84 7.01E+07 6.31E+07 6.63E+07 6.65E+07 3.51E+06 3.97E+06 18.07 17.96 18.01
96 7.16E+07 6.80E+07 7.26E+07 7.07E+07 2.41E+06 2.72E+06 18.09 18.04 18.10
108 7.30E+07 7.03E+07 6.91E+07 7.08E+07 2.03E+06 2.30E+06 18.11 18.07 18.05
120 7.51E+07 7.98E+07 8.50E+07 8.00E+07 4.98E+06 5.63E+06 18.13 18.20 18.2617.6
17.8
18.0
18.2
0 20 40 60 80 100 120
ln [
cell
s m
L-1
]
Specific growth rate (h-1
)
Trial 1 0.005
Trial 2 0.005
Trial 3 0.004
Average 0.005
STDEV 0.000
95% CI 0.000
y = 0.0049x + 17.643
y = 0.0045x + 17.64
y = 0.0042x + 17.66
17.6
17.8
18.0
18.2
0 20 40 60 80 100 120
Elapsed time (h)
ln [
cell
s m
L-1
]
Figure E.40. Specific growth rate calculations for Trial 1 (open circles), Trial 2 (open
squares), and Trial 3 (open triangles).

209
Effective Organic Acid Concentration Equal to 1.50 x IC50
Table E.41. BC13 cell concentrations during growth in the presence of 0.75 x IC50 of
oxaloacetate mixed with 0.75 x IC50 of 2-ketoglutarate.
Cells mL
-1ln (Cells mL
-1)
Elapsed Time (h) Trial 1 Trial 2 Trial 3 Average STDEV 95% CI Trial 1 Trial 2 Trial 3
0 4.91E+07 5.27E+07 5.09E+07 5.09E+07 1.82E+06 2.06E+06 17.71 17.78 17.75
12 4.96E+07 5.11E+07 5.20E+07 5.09E+07 1.23E+06 1.39E+06 17.72 17.75 17.77
24 5.10E+07 5.58E+07 5.75E+07 5.48E+07 3.40E+06 3.84E+06 17.75 17.84 17.87
36 5.07E+07 4.70E+07 5.04E+07 4.93E+07 2.04E+06 2.31E+06 17.74 17.67 17.73
48 4.85E+07 4.78E+07 4.64E+07 4.76E+07 1.04E+06 1.18E+06 17.70 17.68 17.65
60 4.68E+07 5.09E+07 4.99E+07 4.92E+07 2.12E+06 2.40E+06 17.66 17.74 17.72
72 4.91E+07 4.84E+07 4.38E+07 4.71E+07 2.86E+06 3.24E+06 17.71 17.69 17.60
84 5.12E+07 5.39E+07 5.65E+07 5.38E+07 2.65E+06 3.00E+06 17.75 17.80 17.85
96 4.96E+07 5.22E+07 5.50E+07 5.22E+07 2.70E+06 3.05E+06 17.72 17.77 17.82
108 5.25E+07 5.06E+07 5.17E+07 5.16E+07 9.54E+05 1.08E+06 17.78 17.74 17.76
120 5.17E+07 5.23E+07 5.25E+07 5.21E+07 4.33E+05 4.90E+05 17.76 17.77 17.7817.5
17.6
17.7
17.8
17.9
0 20 40 60 80 100 120 140
ln [
cell
s m
L-1
]
Specific growth rate (h-1
)
Trial 1 0.000
Trial 2 0.000
Trial 3 0.000
Average 0.000
STDEV 0.000
95% CI 0.000
y = 0.0003x + 17.707
y = -5E-06x + 17.749
y = 0.0001x + 17.747
17.5
17.6
17.7
17.8
17.9
0 20 40 60 80 100 120 140
Elapsed time (h)
ln [
cell
s m
L-1
]
Figure E.41. Specific growth rate calculations for Trial 1 (open circles), Trial 2 (open
squares), and Trial 3 (open triangles).

210
Effective Organic Acid Concentration Equal to 2.00 x IC50
Table E.42. BC13 cell concentrations during growth in the presence of 1.00 x IC50 of
oxaloacetate mixed with 1.00 x IC50 of 2-ketoglutarate.
Cells mL
-1ln (Cells mL
-1)
Elapsed Time (h) Trial 1 Trial 2 Trial 3 Average STDEV 95% CI Trial 1 Trial 2 Trial 3
0 4.81E+07 5.03E+07 5.23E+07 5.02E+07 2.10E+06 2.38E+06 17.69 17.73 17.77
12 4.73E+07 4.27E+07 4.62E+07 4.54E+07 2.39E+06 2.71E+06 17.67 17.57 17.65
24 4.50E+07 4.58E+07 4.18E+07 4.42E+07 2.10E+06 2.37E+06 17.62 17.64 17.55
36 4.41E+07 4.53E+07 4.75E+07 4.56E+07 1.70E+06 1.92E+06 17.60 17.63 17.68
48 4.47E+07 4.19E+07 4.16E+07 4.27E+07 1.73E+06 1.95E+06 17.62 17.55 17.54
60 4.88E+07 4.69E+07 4.70E+07 4.75E+07 1.07E+06 1.21E+06 17.70 17.66 17.67
72 4.59E+07 4.69E+07 5.03E+07 4.77E+07 2.28E+06 2.58E+06 17.64 17.66 17.73
84 5.25E+07 5.63E+07 6.14E+07 5.67E+07 4.45E+06 5.04E+06 17.78 17.85 17.93
96 5.23E+07 5.36E+07 5.16E+07 5.25E+07 1.01E+06 1.14E+06 17.77 17.80 17.76
108 5.28E+07 5.07E+07 5.29E+07 5.21E+07 1.27E+06 1.44E+06 17.78 17.74 17.78
120 5.05E+07 5.03E+07 4.85E+07 4.98E+07 1.12E+06 1.27E+06 17.74 17.73 17.7017.4
17.6
17.8
18.0
0 20 40 60 80 100 120 140
ln [
cell
s m
L-1
]
Specific growth rate (h-1
)
Trial 1 0.001
Trial 2 0.001
Trial 3 0.001
Average 0.001
STDEV 0.000
95% CI 0.000
y = 0.0011x + 17.624
y = 0.0013x + 17.61
y = 0.0011x + 17.638
17.4
17.6
17.8
18.0
0 20 40 60 80 100 120 140
Elapsed time (h)
ln [
cell
s m
L-1
]
Figure E.42. Specific growth rate calculations for Trial 1 (open circles), Trial 2 (open
squares), and Trial 3 (open triangles).
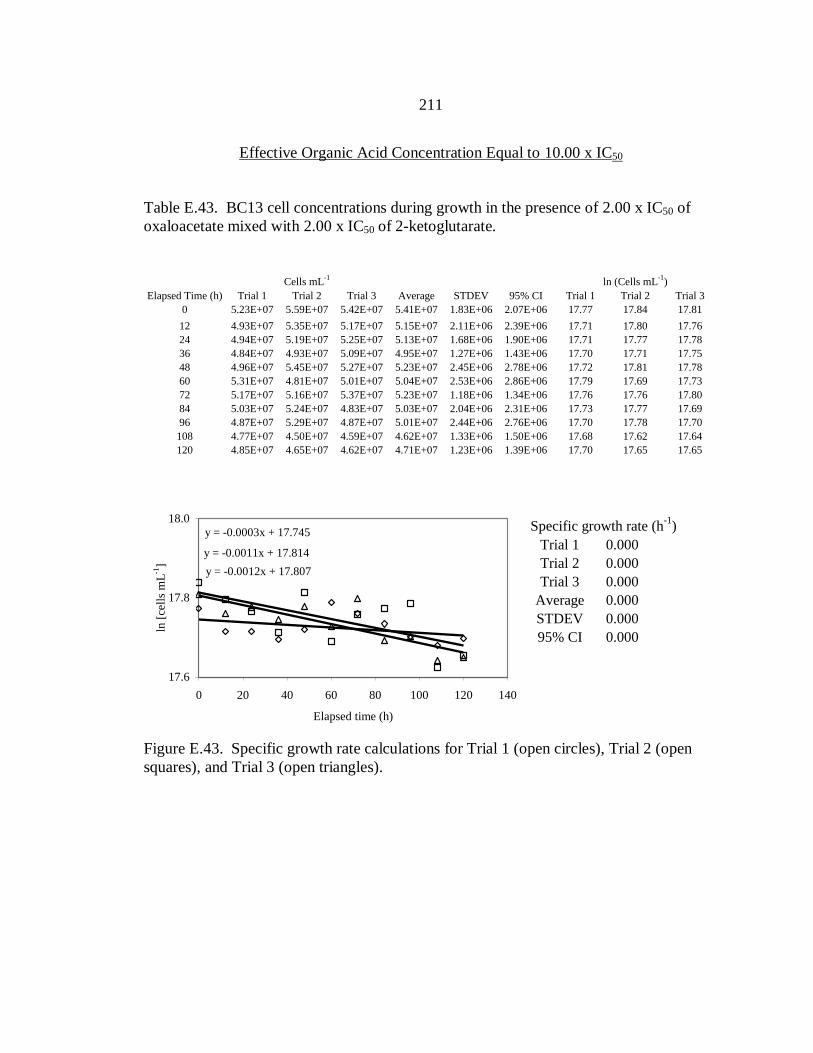
211
Effective Organic Acid Concentration Equal to 10.00 x IC50
Table E.43. BC13 cell concentrations during growth in the presence of 2.00 x IC50 of
oxaloacetate mixed with 2.00 x IC50 of 2-ketoglutarate.
Cells mL
-1ln (Cells mL
-1)
Elapsed Time (h) Trial 1 Trial 2 Trial 3 Average STDEV 95% CI Trial 1 Trial 2 Trial 3
0 5.23E+07 5.59E+07 5.42E+07 5.41E+07 1.83E+06 2.07E+06 17.77 17.84 17.81
12 4.93E+07 5.35E+07 5.17E+07 5.15E+07 2.11E+06 2.39E+06 17.71 17.80 17.76
24 4.94E+07 5.19E+07 5.25E+07 5.13E+07 1.68E+06 1.90E+06 17.71 17.77 17.78
36 4.84E+07 4.93E+07 5.09E+07 4.95E+07 1.27E+06 1.43E+06 17.70 17.71 17.75
48 4.96E+07 5.45E+07 5.27E+07 5.23E+07 2.45E+06 2.78E+06 17.72 17.81 17.78
60 5.31E+07 4.81E+07 5.01E+07 5.04E+07 2.53E+06 2.86E+06 17.79 17.69 17.73
72 5.17E+07 5.16E+07 5.37E+07 5.23E+07 1.18E+06 1.34E+06 17.76 17.76 17.80
84 5.03E+07 5.24E+07 4.83E+07 5.03E+07 2.04E+06 2.31E+06 17.73 17.77 17.69
96 4.87E+07 5.29E+07 4.87E+07 5.01E+07 2.44E+06 2.76E+06 17.70 17.78 17.70
108 4.77E+07 4.50E+07 4.59E+07 4.62E+07 1.33E+06 1.50E+06 17.68 17.62 17.64
120 4.85E+07 4.65E+07 4.62E+07 4.71E+07 1.23E+06 1.39E+06 17.70 17.65 17.6517.6
17.8
18.0
0 20 40 60 80 100 120 140
ln [
cell
s m
L-1
]
Specific growth rate (h-1
)
Trial 1 0.000
Trial 2 0.000
Trial 3 0.000
Average 0.000
STDEV 0.000
95% CI 0.000
y = -0.0003x + 17.745
y = -0.0011x + 17.814
y = -0.0012x + 17.807
17.6
17.8
18.0
0 20 40 60 80 100 120 140
Elapsed time (h)
ln [
cell
s m
L-1
]
Figure E.43. Specific growth rate calculations for Trial 1 (open circles), Trial 2 (open
squares), and Trial 3 (open triangles).

212
Succinate and Malate
Effective Organic Acid Concentration Equal to 0.25 x IC50
Table E.44. BC13 cell concentrations during growth in the presence of 0.125 x IC50 of
succinate mixed with 0.125 x IC50 of malate.
Cells mL
-1ln (Cells mL
-1)
Elapsed Time (h) Trial 1 Trial 2 Trial 3 Average STDEV 95% CI Trial 1 Trial 2 Trial 3
0 4.53E+07 4.87E+07 4.51E+07 4.64E+07 2.02E+06 2.28E+06 17.63 17.70 17.62
12 4.43E+07 4.52E+07 4.76E+07 4.57E+07 1.69E+06 1.91E+06 17.61 17.63 17.68
24 5.12E+07 4.80E+07 4.73E+07 4.89E+07 2.10E+06 2.37E+06 17.75 17.69 17.67
36 6.98E+07 6.78E+07 6.64E+07 6.80E+07 1.72E+06 1.94E+06 18.06 18.03 18.01
48 8.79E+07 7.99E+07 8.37E+07 8.38E+07 4.03E+06 4.56E+06 18.29 18.20 18.24
60 1.16E+08 1.25E+08 1.18E+08 1.20E+08 4.67E+06 5.28E+06 18.57 18.65 18.59
72 1.48E+08 1.40E+08 1.33E+08 1.40E+08 7.51E+06 8.50E+06 18.81 18.76 18.70
84 1.88E+08 1.74E+08 1.60E+08 1.74E+08 1.39E+07 1.58E+07 19.05 18.97 18.89
96 2.17E+08 2.27E+08 2.23E+08 2.22E+08 4.93E+06 5.57E+06 19.20 19.24 19.22
108 2.01E+08 1.93E+08 1.89E+08 1.94E+08 6.13E+06 6.94E+06 19.12 19.08 19.06
120 1.91E+08 1.90E+08 2.07E+08 1.96E+08 9.74E+06 1.10E+07 19.07 19.06 19.15
17.0
17.5
18.0
18.5
19.0
19.5
0 20 40 60 80 100 120
ln [
cell
s m
L-1
]
Specific growth rate (h-1
)
Trial 1 0.020
Trial 2 0.020
Trial 3 0.019
Average 0.020
STDEV 0.001
95% CI 0.001
y = 0.02x + 17.339
y = 0.0202x + 17.303
y = 0.0192x + 17.341
17.0
17.5
18.0
18.5
19.0
19.5
0 20 40 60 80 100 120
Elapsed time (h)
ln [
cell
s m
L-1
]
Figure E.44. Specific growth rate calculations for Trial 1 (open circles), Trial 2 (open
squares), and Trial 3 (open triangles).

213
Effective Organic Acid Concentration Equal to 0.50 x IC50
Table E.45. BC13 cell concentrations during growth in the presence of 0.25 x IC50 of
succinate mixed with 0.25 x IC50 of malate.
Cells mL
-1ln (Cells mL
-1)
Elapsed Time (h) Trial 1 Trial 2 Trial 3 Average STDEV 95% CI Trial 1 Trial 2 Trial 3
0 5.11E+07 5.08E+07 5.27E+07 5.15E+07 1.01E+06 1.14E+06 17.75 17.74 17.78
12 5.23E+07 5.41E+07 5.95E+07 5.53E+07 3.74E+06 4.23E+06 17.77 17.81 17.90
24 5.53E+07 5.81E+07 5.52E+07 5.62E+07 1.62E+06 1.84E+06 17.83 17.88 17.83
36 7.18E+07 7.03E+07 7.71E+07 7.31E+07 3.55E+06 4.02E+06 18.09 18.07 18.16
48 9.28E+07 8.40E+07 7.73E+07 8.47E+07 7.76E+06 8.78E+06 18.35 18.25 18.16
60 1.04E+08 1.04E+08 9.92E+07 1.02E+08 2.88E+06 3.26E+06 18.46 18.46 18.41
72 1.35E+08 1.44E+08 1.49E+08 1.43E+08 6.90E+06 7.81E+06 18.72 18.79 18.82
84 1.50E+08 1.40E+08 1.44E+08 1.45E+08 4.86E+06 5.50E+06 18.83 18.76 18.79
96 1.86E+08 1.81E+08 1.69E+08 1.79E+08 8.75E+06 9.90E+06 19.04 19.02 18.95
108 2.01E+08 2.12E+08 2.24E+08 2.13E+08 1.18E+07 1.34E+07 19.12 19.17 19.23
120 1.78E+08 1.66E+08 1.71E+08 1.71E+08 5.85E+06 6.62E+06 18.99 18.93 18.9517.5
18.0
18.5
19.0
19.5
0 20 40 60 80 100 120
ln [
cell
s m
L-1
]
Specific growth rate (h-1
)
Trial 1 0.016
Trial 2 0.015
Trial 3 0.014
Average 0.015
STDEV 0.001
95% CI 0.001
y = 0.0158x + 17.535
y = 0.0151x + 17.561
y = 0.0142x + 17.608
17.5
18.0
18.5
19.0
19.5
0 20 40 60 80 100 120
Elapsed time (h)
ln [
cell
s m
L-1
]
Figure E.45. Specific growth rate calculations for Trial 1 (open circles), Trial 2 (open
squares), and Trial 3 (open triangles).
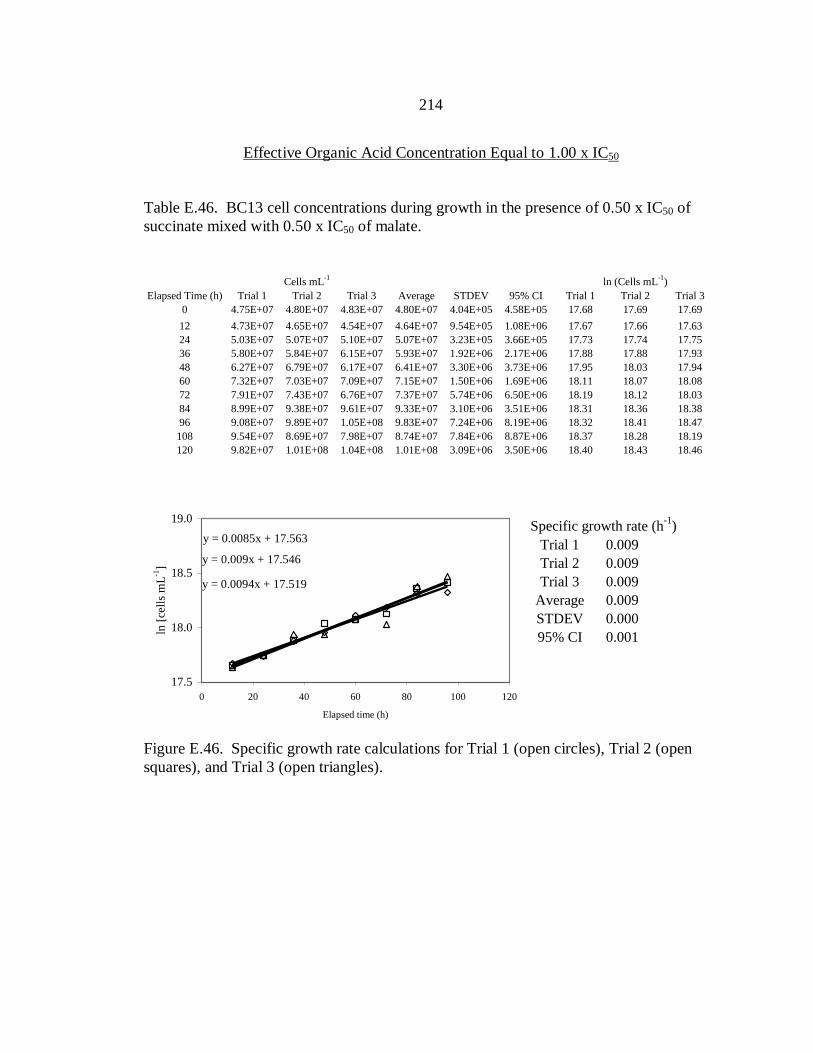
214
Effective Organic Acid Concentration Equal to 1.00 x IC50
Table E.46. BC13 cell concentrations during growth in the presence of 0.50 x IC50 of
succinate mixed with 0.50 x IC50 of malate.
Cells mL
-1ln (Cells mL
-1)
Elapsed Time (h) Trial 1 Trial 2 Trial 3 Average STDEV 95% CI Trial 1 Trial 2 Trial 3
0 4.75E+07 4.80E+07 4.83E+07 4.80E+07 4.04E+05 4.58E+05 17.68 17.69 17.69
12 4.73E+07 4.65E+07 4.54E+07 4.64E+07 9.54E+05 1.08E+06 17.67 17.66 17.63
24 5.03E+07 5.07E+07 5.10E+07 5.07E+07 3.23E+05 3.66E+05 17.73 17.74 17.75
36 5.80E+07 5.84E+07 6.15E+07 5.93E+07 1.92E+06 2.17E+06 17.88 17.88 17.93
48 6.27E+07 6.79E+07 6.17E+07 6.41E+07 3.30E+06 3.73E+06 17.95 18.03 17.94
60 7.32E+07 7.03E+07 7.09E+07 7.15E+07 1.50E+06 1.69E+06 18.11 18.07 18.08
72 7.91E+07 7.43E+07 6.76E+07 7.37E+07 5.74E+06 6.50E+06 18.19 18.12 18.03
84 8.99E+07 9.38E+07 9.61E+07 9.33E+07 3.10E+06 3.51E+06 18.31 18.36 18.38
96 9.08E+07 9.89E+07 1.05E+08 9.83E+07 7.24E+06 8.19E+06 18.32 18.41 18.47
108 9.54E+07 8.69E+07 7.98E+07 8.74E+07 7.84E+06 8.87E+06 18.37 18.28 18.19
120 9.82E+07 1.01E+08 1.04E+08 1.01E+08 3.09E+06 3.50E+06 18.40 18.43 18.4617.5
18.0
18.5
19.0
0 20 40 60 80 100 120
ln [
cell
s m
L-1
]
Specific growth rate (h-1
)
Trial 1 0.009
Trial 2 0.009
Trial 3 0.009
Average 0.009
STDEV 0.000
95% CI 0.001
y = 0.0085x + 17.563
y = 0.009x + 17.546
y = 0.0094x + 17.519
17.5
18.0
18.5
19.0
0 20 40 60 80 100 120
Elapsed time (h)
ln [
cell
s m
L-1
]
Figure E.46. Specific growth rate calculations for Trial 1 (open circles), Trial 2 (open
squares), and Trial 3 (open triangles).

215
Effective Organic Acid Concentration Equal to 1.50 x IC50
Table E.47. BC13 cell concentrations during growth in the presence of 0.75 x IC50 of
succinate mixed with 0.75 x IC50 of malate.
Cells mL
-1ln (Cells mL
-1)
Elapsed Time (h) Trial 1 Trial 2 Trial 3 Average STDEV 95% CI Trial 1 Trial 2 Trial 3
0 4.50E+07 4.55E+07 4.65E+07 4.57E+07 7.69E+05 8.70E+05 17.62 17.63 17.66
12 4.35E+07 4.40E+07 4.65E+07 4.47E+07 1.61E+06 1.82E+06 17.59 17.60 17.66
24 5.52E+07 5.66E+07 5.12E+07 5.43E+07 2.81E+06 3.18E+06 17.83 17.85 17.75
36 5.23E+07 5.43E+07 5.30E+07 5.32E+07 9.91E+05 1.12E+06 17.77 17.81 17.79
48 6.62E+07 6.20E+07 5.80E+07 6.21E+07 4.07E+06 4.60E+06 18.01 17.94 17.88
60 7.35E+07 6.77E+07 6.62E+07 6.91E+07 3.84E+06 4.34E+06 18.11 18.03 18.01
72 7.14E+07 6.64E+07 6.58E+07 6.79E+07 3.09E+06 3.50E+06 18.08 18.01 18.00
84 8.44E+07 7.67E+07 7.59E+07 7.90E+07 4.66E+06 5.28E+06 18.25 18.16 18.15
96 9.75E+07 9.31E+07 9.01E+07 9.36E+07 3.72E+06 4.21E+06 18.40 18.35 18.32
108 9.89E+07 1.07E+08 9.77E+07 1.01E+08 5.15E+06 5.83E+06 18.41 18.49 18.40
120 9.70E+07 9.39E+07 9.13E+07 9.41E+07 2.87E+06 3.25E+06 18.39 18.36 18.3317.5
18.0
18.5
19.0
0 20 40 60 80 100 120
ln [
cell
s m
L-1
]
Specific growth rate (h-1
)
Trial 1 0.008
Trial 2 0.008
Trial 3 0.008
Average 0.008
STDEV 0.000
95% CI 0.000
y = 0.0084x + 17.548
y = 0.0081x + 17.542
y = 0.0077x + 17.534
17.5
18.0
18.5
19.0
0 20 40 60 80 100 120
Elapsed time (h)
ln [
cell
s m
L-1
]
Figure E.47. Specific growth rate calculations for Trial 1 (open circles), Trial 2 (open
squares), and Trial 3 (open triangles).
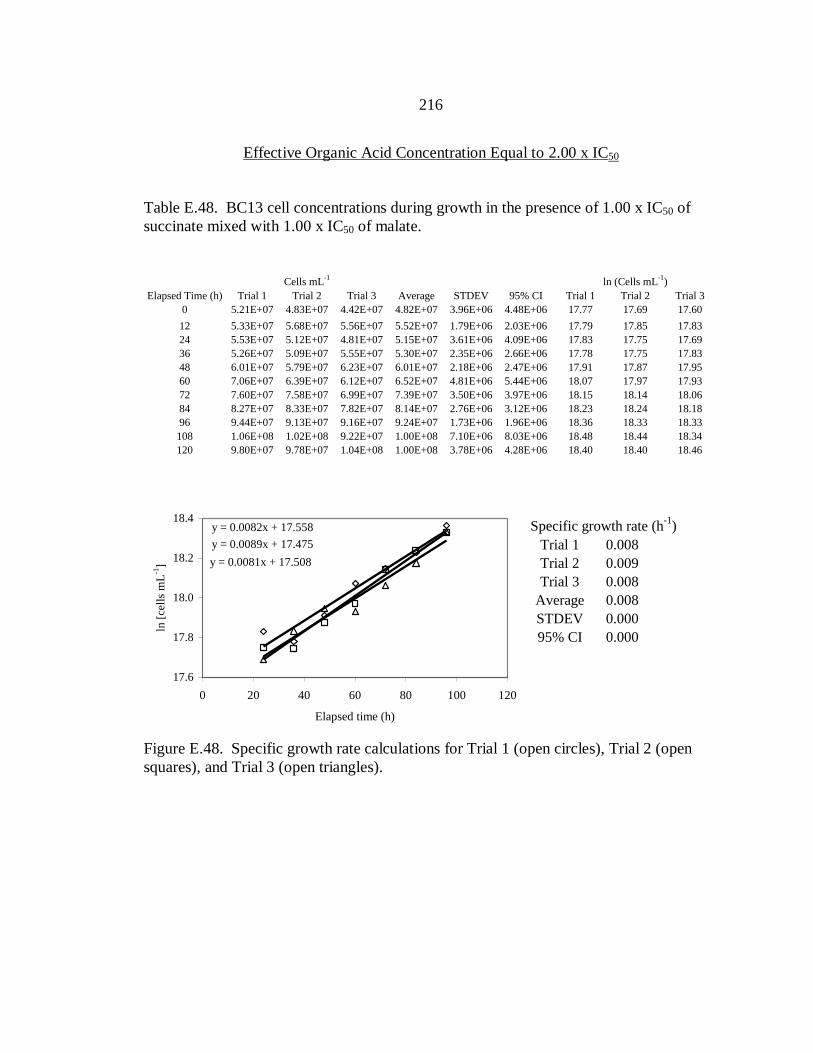
216
Effective Organic Acid Concentration Equal to 2.00 x IC50
Table E.48. BC13 cell concentrations during growth in the presence of 1.00 x IC50 of
succinate mixed with 1.00 x IC50 of malate.
Cells mL
-1ln (Cells mL
-1)
Elapsed Time (h) Trial 1 Trial 2 Trial 3 Average STDEV 95% CI Trial 1 Trial 2 Trial 3
0 5.21E+07 4.83E+07 4.42E+07 4.82E+07 3.96E+06 4.48E+06 17.77 17.69 17.60
12 5.33E+07 5.68E+07 5.56E+07 5.52E+07 1.79E+06 2.03E+06 17.79 17.85 17.83
24 5.53E+07 5.12E+07 4.81E+07 5.15E+07 3.61E+06 4.09E+06 17.83 17.75 17.69
36 5.26E+07 5.09E+07 5.55E+07 5.30E+07 2.35E+06 2.66E+06 17.78 17.75 17.83
48 6.01E+07 5.79E+07 6.23E+07 6.01E+07 2.18E+06 2.47E+06 17.91 17.87 17.95
60 7.06E+07 6.39E+07 6.12E+07 6.52E+07 4.81E+06 5.44E+06 18.07 17.97 17.93
72 7.60E+07 7.58E+07 6.99E+07 7.39E+07 3.50E+06 3.97E+06 18.15 18.14 18.06
84 8.27E+07 8.33E+07 7.82E+07 8.14E+07 2.76E+06 3.12E+06 18.23 18.24 18.18
96 9.44E+07 9.13E+07 9.16E+07 9.24E+07 1.73E+06 1.96E+06 18.36 18.33 18.33
108 1.06E+08 1.02E+08 9.22E+07 1.00E+08 7.10E+06 8.03E+06 18.48 18.44 18.34
120 9.80E+07 9.78E+07 1.04E+08 1.00E+08 3.78E+06 4.28E+06 18.40 18.40 18.4617.6
17.8
18.0
18.2
18.4
0 20 40 60 80 100 120
ln [
cell
s m
L-1
]
Specific growth rate (h-1
)
Trial 1 0.008
Trial 2 0.009
Trial 3 0.008
Average 0.008
STDEV 0.000
95% CI 0.000
y = 0.0082x + 17.558
y = 0.0089x + 17.475
y = 0.0081x + 17.508
17.6
17.8
18.0
18.2
18.4
0 20 40 60 80 100 120
Elapsed time (h)
ln [
cell
s m
L-1
]
Figure E.48. Specific growth rate calculations for Trial 1 (open circles), Trial 2 (open
squares), and Trial 3 (open triangles).

217
Effective Organic Acid Concentration Equal to 10.00 x IC50
Table E.49. BC13 cell concentrations during growth in the presence of 5.00 x IC50 of
succinate mixed with 5.00 x IC50 of malate.
Cells mL
-1ln (Cells mL
-1)
Elapsed Time (h) Trial 1 Trial 2 Trial 3 Average STDEV 95% CI Trial 1 Trial 2 Trial 3
0 5.51E+07 5.84E+07 5.56E+07 5.64E+07 1.80E+06 2.04E+06 17.82 17.88 17.83
12 5.74E+07 5.55E+07 5.31E+07 5.53E+07 2.18E+06 2.47E+06 17.87 17.83 17.79
24 5.93E+07 5.57E+07 6.02E+07 5.84E+07 2.41E+06 2.72E+06 17.90 17.83 17.91
36 5.90E+07 5.45E+07 5.98E+07 5.78E+07 2.83E+06 3.21E+06 17.89 17.81 17.91
48 6.23E+07 6.16E+07 5.95E+07 6.11E+07 1.46E+06 1.66E+06 17.95 17.94 17.90
60 6.84E+07 6.39E+07 5.85E+07 6.36E+07 4.99E+06 5.65E+06 18.04 17.97 17.88
72 7.53E+07 8.15E+07 7.49E+07 7.72E+07 3.71E+06 4.20E+06 18.14 18.22 18.13
84 8.07E+07 7.48E+07 7.47E+07 7.67E+07 3.40E+06 3.85E+06 18.21 18.13 18.13
96 8.39E+07 8.60E+07 8.10E+07 8.37E+07 2.51E+06 2.84E+06 18.25 18.27 18.21
108 8.46E+07 9.04E+07 8.37E+07 8.63E+07 3.65E+06 4.13E+06 18.25 18.32 18.24
120 8.49E+07 8.16E+07 8.45E+07 8.37E+07 1.81E+06 2.05E+06 18.26 18.22 18.2517.6
17.8
18.0
18.2
18.4
0 20 40 60 80 100 120
ln [
cell
s m
L-1
]
Specific growth rate (h-1
)
Trial 1 0.006
Trial 2 0.007
Trial 3 0.005
Average 0.006
STDEV 0.001
95% CI 0.001
y = 0.0055x + 17.721
y = 0.0066x + 17.629
y = 0.0047x + 17.731
17.6
17.8
18.0
18.2
18.4
0 20 40 60 80 100 120
Elapsed time (h)
ln [
cell
s m
L-1
]
Figure E.49. Specific growth rate calculations for Trial 1 (open circles), Trial 2 (open
squares), and Trial 3 (open triangles).

218
Mixture of all organic acids tested
Effective Organic Acid Concentration Equal to 0.25 x IC50
Table E.50. BC13 cell concentrations during growth in the presence of 0.036 x IC50 of
pyruvate, acetate, 2-ketoglutarate, succinate, fumarate, malate, and oxaloacetate.
Cells mL
-1ln (Cells mL
-1)
Elapsed Time (h) Trial 1 Trial 2 Trial 3 Average STDEV 95% CI Trial 1 Trial 2 Trial 3
0 4.46E+07 4.65E+07 4.56E+07 4.56E+07 9.47E+05 1.07E+06 17.61 17.66 17.64
12 4.57E+07 4.47E+07 4.44E+07 4.49E+07 6.76E+05 7.65E+05 17.64 17.62 17.61
24 5.62E+07 5.44E+07 5.41E+07 5.49E+07 1.17E+06 1.32E+06 17.85 17.81 17.81
36 7.48E+07 7.51E+07 7.89E+07 7.63E+07 2.30E+06 2.60E+06 18.13 18.13 18.18
48 8.38E+07 7.81E+07 8.24E+07 8.14E+07 2.97E+06 3.36E+06 18.24 18.17 18.23
60 1.25E+08 1.34E+08 1.25E+08 1.28E+08 5.20E+06 5.89E+06 18.64 18.72 18.65
72 1.54E+08 1.56E+08 1.41E+08 1.50E+08 8.35E+06 9.45E+06 18.86 18.86 18.76
84 1.92E+08 1.87E+08 2.05E+08 1.95E+08 9.40E+06 1.06E+07 19.07 19.04 19.14
96 2.09E+08 2.17E+08 2.29E+08 2.18E+08 1.00E+07 1.14E+07 19.16 19.19 19.25
108 2.01E+08 2.07E+08 2.07E+08 2.05E+08 3.35E+06 3.79E+06 19.12 19.15 19.15
120 2.02E+08 1.95E+08 1.84E+08 1.94E+08 8.77E+06 9.93E+06 19.12 19.09 19.03
17.5
18.0
18.5
19.0
19.5
0 20 40 60 80 100
ln [
cell
s m
L-1
]
Specific growth rate (h-1
)
Trial 1 0.020
Trial 2 0.021
Trial 3 0.021
Average 0.021
STDEV 0.000
95% CI 0.000
y = 0.0204x + 17.369
y = 0.0207x + 17.341
y = 0.0207x + 17.344
17.5
18.0
18.5
19.0
19.5
0 20 40 60 80 100
Elapsed time (h)
ln [
cell
s m
L-1
]
Figure E.50. Specific growth rate calculations for Trial 1 (open circles), Trial 2 (open
squares), and Trial 3 (open triangles).
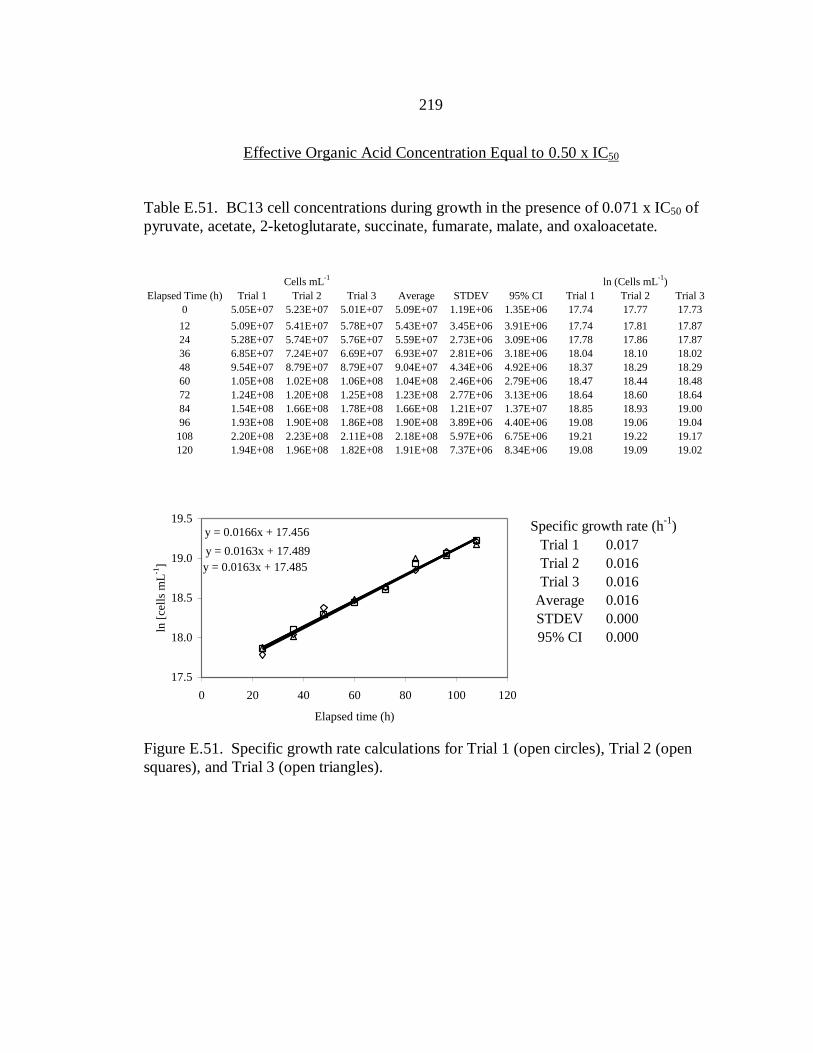
219
Effective Organic Acid Concentration Equal to 0.50 x IC50
Table E.51. BC13 cell concentrations during growth in the presence of 0.071 x IC50 of
pyruvate, acetate, 2-ketoglutarate, succinate, fumarate, malate, and oxaloacetate.
Cells mL
-1ln (Cells mL
-1)
Elapsed Time (h) Trial 1 Trial 2 Trial 3 Average STDEV 95% CI Trial 1 Trial 2 Trial 3
0 5.05E+07 5.23E+07 5.01E+07 5.09E+07 1.19E+06 1.35E+06 17.74 17.77 17.73
12 5.09E+07 5.41E+07 5.78E+07 5.43E+07 3.45E+06 3.91E+06 17.74 17.81 17.87
24 5.28E+07 5.74E+07 5.76E+07 5.59E+07 2.73E+06 3.09E+06 17.78 17.86 17.87
36 6.85E+07 7.24E+07 6.69E+07 6.93E+07 2.81E+06 3.18E+06 18.04 18.10 18.02
48 9.54E+07 8.79E+07 8.79E+07 9.04E+07 4.34E+06 4.92E+06 18.37 18.29 18.29
60 1.05E+08 1.02E+08 1.06E+08 1.04E+08 2.46E+06 2.79E+06 18.47 18.44 18.48
72 1.24E+08 1.20E+08 1.25E+08 1.23E+08 2.77E+06 3.13E+06 18.64 18.60 18.64
84 1.54E+08 1.66E+08 1.78E+08 1.66E+08 1.21E+07 1.37E+07 18.85 18.93 19.00
96 1.93E+08 1.90E+08 1.86E+08 1.90E+08 3.89E+06 4.40E+06 19.08 19.06 19.04
108 2.20E+08 2.23E+08 2.11E+08 2.18E+08 5.97E+06 6.75E+06 19.21 19.22 19.17
120 1.94E+08 1.96E+08 1.82E+08 1.91E+08 7.37E+06 8.34E+06 19.08 19.09 19.0217.5
18.0
18.5
19.0
19.5
0 20 40 60 80 100 120
ln [
cell
s m
L-1
]
Specific growth rate (h-1
)
Trial 1 0.017
Trial 2 0.016
Trial 3 0.016
Average 0.016
STDEV 0.000
95% CI 0.000
y = 0.0166x + 17.456
y = 0.0163x + 17.489
y = 0.0163x + 17.485
17.5
18.0
18.5
19.0
19.5
0 20 40 60 80 100 120
Elapsed time (h)
ln [
cell
s m
L-1
]
Figure E.51. Specific growth rate calculations for Trial 1 (open circles), Trial 2 (open
squares), and Trial 3 (open triangles).

220
Effective Organic Acid Concentration Equal to 1.00 x IC50
Table E.52. BC13 cell concentrations during growth in the presence of 0.143 x IC50 of
pyruvate, acetate, 2-ketoglutarate, succinate, fumarate, malate, and oxaloacetate.
Cells mL
-1ln (Cells mL
-1)
Elapsed Time (h) Trial 1 Trial 2 Trial 3 Average STDEV 95% CI Trial 1 Trial 2 Trial 3
0 4.91E+07 5.21E+07 4.88E+07 5.00E+07 1.82E+06 2.06E+06 17.71 17.77 17.70
12 4.98E+07 5.02E+07 5.52E+07 5.17E+07 2.98E+06 3.37E+06 17.72 17.73 17.83
24 5.04E+07 4.61E+07 4.38E+07 4.68E+07 3.32E+06 3.76E+06 17.73 17.65 17.60
36 4.79E+07 4.55E+07 4.81E+07 4.72E+07 1.47E+06 1.66E+06 17.69 17.63 17.69
48 5.46E+07 5.36E+07 4.95E+07 5.26E+07 2.72E+06 3.07E+06 17.82 17.80 17.72
60 6.09E+07 6.04E+07 5.91E+07 6.01E+07 9.51E+05 1.08E+06 17.93 17.92 17.89
72 7.32E+07 7.61E+07 6.96E+07 7.30E+07 3.26E+06 3.69E+06 18.11 18.15 18.06
84 7.45E+07 7.04E+07 7.36E+07 7.28E+07 2.15E+06 2.44E+06 18.13 18.07 18.11
96 8.35E+07 9.02E+07 9.88E+07 9.08E+07 7.69E+06 8.71E+06 18.24 18.32 18.41
108 8.62E+07 9.10E+07 9.47E+07 9.06E+07 4.23E+06 4.79E+06 18.27 18.33 18.37
120 8.71E+07 9.00E+07 8.93E+07 8.88E+07 1.49E+06 1.69E+06 18.28 18.32 18.3117.4
17.6
17.8
18.0
18.2
18.4
18.6
0 20 40 60 80 100 120
Specific growth rate (h-1
)
Trial 1 0.009
Trial 2 0.011
Trial 3 0.012
Average 0.011
STDEV 0.001
95% CI 0.001
y = 0.0093x + 17.373
y = 0.0106x + 17.278
y = 0.0118x + 17.201
17.4
17.6
17.8
18.0
18.2
18.4
18.6
0 20 40 60 80 100 120
Elapsed time (h)
ln [
cell
s m
L-1
]
Figure E.52. Specific growth rate calculations for Trial 1 (open circles), Trial 2 (open
squares), and Trial 3 (open triangles).

221
Effective Organic Acid Concentration Equal to 1.50 x IC50
Table E.53. BC13 cell concentrations during growth in the presence of 0.214 x IC50 of
pyruvate, acetate, 2-ketoglutarate, succinate, fumarate, malate, and oxaloacetate.
Cells mL
-1ln (Cells mL
-1)
Elapsed Time (h) Trial 1 Trial 2 Trial 3 Average STDEV 95% CI Trial 1 Trial 2 Trial 3
0 4.14E+07 4.83E+07 4.03E+07 4.33E+07 4.35E+06 4.93E+06 17.54 17.69 17.51
12 4.57E+07 4.44E+07 4.60E+07 4.54E+07 8.60E+05 9.73E+05 17.64 17.61 17.64
24 5.03E+07 4.45E+07 4.61E+07 4.70E+07 2.99E+06 3.39E+06 17.73 17.61 17.65
36 5.31E+07 4.88E+07 4.73E+07 4.97E+07 3.05E+06 3.45E+06 17.79 17.70 17.67
48 6.15E+07 5.64E+07 6.06E+07 5.95E+07 2.73E+06 3.09E+06 17.93 17.85 17.92
60 6.99E+07 7.05E+07 6.74E+07 6.93E+07 1.63E+06 1.84E+06 18.06 18.07 18.03
72 7.04E+07 7.02E+07 6.51E+07 6.86E+07 2.99E+06 3.38E+06 18.07 18.07 17.99
84 7.88E+07 8.29E+07 7.61E+07 7.93E+07 3.40E+06 3.85E+06 18.18 18.23 18.15
96 1.03E+08 9.44E+07 1.06E+08 1.01E+08 6.12E+06 6.92E+06 18.45 18.36 18.48
108 1.04E+08 9.75E+07 9.41E+07 9.86E+07 5.15E+06 5.82E+06 18.46 18.40 18.36
120 1.07E+08 1.11E+08 1.13E+08 1.10E+08 3.39E+06 3.84E+06 18.48 18.53 18.5417.0
17.5
18.0
18.5
19.0
0 20 40 60 80 100 120
Specific growth rate (h-1
)
Trial 1 0.009
Trial 2 0.010
Trial 3 0.009
Average 0.009
STDEV 0.000
95% CI 0.000
y = 0.0089x + 17.505
y = 0.0096x + 17.418
y = 0.0094x + 17.436
17.0
17.5
18.0
18.5
19.0
0 20 40 60 80 100 120
Elapsed time (h)
ln [
cell
s m
L-1
]
Figure E.53. Specific growth rate calculations for Trial 1 (open circles), Trial 2 (open
squares), and Trial 3 (open triangles).

222
Effective Organic Acid Concentration Equal to 2.00 x IC50
Table E.54. BC13 cell concentrations during growth in the presence of 0.286 x IC50 of
pyruvate, acetate, 2-ketoglutarate, succinate, fumarate, malate, and oxaloacetate.
Cells mL
-1ln (Cells mL
-1)
Elapsed Time (h) Trial 1 Trial 2 Trial 3 Average STDEV 95% CI Trial 1 Trial 2 Trial 3
0 5.05E+07 5.52E+07 5.23E+07 5.27E+07 2.39E+06 2.70E+06 17.74 17.83 17.77
12 5.49E+07 5.32E+07 5.12E+07 5.31E+07 1.86E+06 2.10E+06 17.82 17.79 17.75
24 5.47E+07 5.87E+07 6.24E+07 5.86E+07 3.88E+06 4.39E+06 17.82 17.89 17.95
36 5.44E+07 5.47E+07 5.91E+07 5.61E+07 2.59E+06 2.94E+06 17.81 17.82 17.89
48 6.15E+07 5.62E+07 5.29E+07 5.69E+07 4.34E+06 4.92E+06 17.93 17.84 17.78
60 6.69E+07 6.67E+07 6.04E+07 6.47E+07 3.70E+06 4.19E+06 18.02 18.02 17.92
72 7.36E+07 7.30E+07 6.91E+07 7.19E+07 2.46E+06 2.78E+06 18.11 18.11 18.05
84 8.03E+07 7.68E+07 7.20E+07 7.64E+07 4.18E+06 4.73E+06 18.20 18.16 18.09
96 8.89E+07 8.63E+07 8.21E+07 8.58E+07 3.46E+06 3.92E+06 18.30 18.27 18.22
108 9.15E+07 9.33E+07 8.56E+07 9.01E+07 3.99E+06 4.51E+06 18.33 18.35 18.27
120 9.72E+07 9.29E+07 8.93E+07 9.31E+07 3.94E+06 4.46E+06 18.39 18.35 18.3117.6
17.8
18.0
18.2
18.4
0 20 40 60 80 100 120
ln [
cell
s m
L-1
]
Specific growth rate (h-1
)
Trial 1 0.007
Trial 2 0.008
Trial 3 0.007
Average 0.007
STDEV 0.001
95% CI 0.001
y = 0.0074x + 17.571
y = 0.0077x + 17.524
y = 0.0065x + 17.568
17.6
17.8
18.0
18.2
18.4
0 20 40 60 80 100 120
Elapsed time (h)
ln [
cell
s m
L-1
]
Figure E.54. Specific growth rate calculations for Trial 1 (open circles), Trial 2 (open
squares), and Trial 3 (open triangles).

223
Effective Organic Acid Concentration Equal to 10.00 x IC50
Table E.55. BC13 cell concentrations during growth in the presence of 1.429 x IC50 of
pyruvate, acetate, 2-ketoglutarate, succinate, fumarate, malate, and oxaloacetate.
Cells mL
-1ln (Cells mL
-1)
Elapsed Time (h) Trial 1 Trial 2 Trial 3 Average STDEV 95% CI Trial 1 Trial 2 Trial 3
0 5.10E+07 5.53E+07 5.51E+07 5.38E+07 2.44E+06 2.76E+06 17.75 17.83 17.83
12 5.13E+07 5.64E+07 5.23E+07 5.33E+07 2.71E+06 3.06E+06 17.75 17.85 17.77
24 5.32E+07 5.52E+07 5.35E+07 5.40E+07 1.08E+06 1.23E+06 17.79 17.83 17.79
36 5.90E+07 5.71E+07 5.51E+07 5.71E+07 1.99E+06 2.25E+06 17.89 17.86 17.82
48 6.30E+07 6.46E+07 6.25E+07 6.34E+07 1.07E+06 1.21E+06 17.96 17.98 17.95
60 6.70E+07 6.20E+07 6.56E+07 6.48E+07 2.54E+06 2.87E+06 18.02 17.94 18.00
72 6.39E+07 7.02E+07 6.81E+07 6.74E+07 3.21E+06 3.64E+06 17.97 18.07 18.04
84 7.23E+07 7.25E+07 7.19E+07 7.22E+07 3.05E+05 3.46E+05 18.10 18.10 18.09
96 7.10E+07 7.32E+07 6.91E+07 7.11E+07 2.08E+06 2.35E+06 18.08 18.11 18.05
108 7.08E+07 7.14E+07 7.24E+07 7.15E+07 8.03E+05 9.08E+05 18.08 18.08 18.10
120 7.25E+07 7.73E+07 7.79E+07 7.59E+07 2.94E+06 3.33E+06 18.10 18.16 18.1717.6
17.8
18.0
18.2
0 20 40 60 80 100
ln [
cell
s m
L-1
]
Specific growth rate (h-1
)
Trial 1 0.004
Trial 2 0.005
Trial 3 0.005
Average 0.005
STDEV 0.000
95% CI 0.000
y = 0.0044x + 17.72
y = 0.0046x + 17.714
y = 0.0052x + 17.67
17.6
17.8
18.0
18.2
0 20 40 60 80 100
Elapsed time (h)
ln [
cell
s m
L-1
]
Figure E.55. Specific growth rate calculations for Trial 1 (open circles), Trial 2 (open
squares), and Trial 3 (open triangles).

224
Changes in Organic Acid Concentrations during Batch Growth of BC13
Table E.56. Organic acid concentrations ( M) with time during batch culturing of BC13.
Initial concentrations equal to the previously calculated IC50 values.
Pyruvate
Elapsed Time (h) Trial 1 Trial 2 Trial 3 Average STDEV 95% CI
0 66.54 66.54 66.54 66.54 0.00 0.00
40 61.42 56.23 58.62 58.76 2.60 2.94
80 39.19 34.07 33.74 35.67 3.06 3.46
120 35.67 36.67 43.52 38.62 4.27 4.84
Acetate
Elapsed Time (h) Trial 1 Trial 2 Trial 3 Average STDEV 95% CI
0 62.70 62.70 62.70 62.70 0.00 0.00
40 46.78 32.79 52.99 44.19 10.34 11.70
80 23.51 17.12 22.51 21.05 3.44 3.89
120 7.27 17.12 18.69 14.36 6.19 7.00
2-ketoglutarate
Elapsed Time (h) Trial 1 Trial 2 Trial 3 Average STDEV 95% CI
0 73.27 73.27 73.27 73.27 0.00 0.00
40 60.23 54.96 52.98 56.05 3.75 4.24
80 25.35 24.11 24.40 24.62 0.65 0.74
120 24.77 22.79 28.43 25.33 2.86 3.24
Succinate
Elapsed Time (h) Trial 1 Trial 2 Trial 3 Average STDEV 95% CI
0 62.78 62.78 62.78 62.78 0.00 0.00
40 56.63 48.90 56.88 54.14 4.53 5.13
80 27.94 24.99 25.74 26.22 1.53 1.73
120 23.54 20.34 22.10 21.99 1.60 1.81
Fumarate
Elapsed Time (h) Trial 1 Trial 2 Trial 3 Average STDEV 95% CI
0 73.76 73.76 73.76 73.76 0.00 0.00
40 61.59 51.48 57.38 56.82 5.08 5.74
80 25.52 23.23 23.60 24.12 1.23 1.39
120 22.28 19.69 21.98 21.32 1.41 1.60
Malate
Elapsed Time (h) Trial 1 Trial 2 Trial 3 Average STDEV 95% CI
0 84.33 84.33 84.33 84.33 0.00 0.00
40 65.61 67.64 65.02 66.09 1.37 1.55
80 25.72 28.50 33.90 29.38 4.16 4.71
120 21.25 28.17 31.71 27.04 5.32 6.02
Oxaloacetate
Elapsed Time (h) Trial 1 Trial 2 Trial 3 Average STDEV 95% CI
0 28.24 28.24 28.24 28.24 0.00 0.00
40 26.91 27.87 27.16 27.31 0.50 0.56
80 17.28 19.14 20.41 18.95 1.58 1.78
120 16.43 14.77 14.43 15.21 1.07 1.21

225
Summary of Phospholipid Fatty Acid Analysis
Table E.57. Percent composition of BC13 PLFA in an organic acid free control, when
exposed to all organic acids other than oxaloacetate, and when exposed to oxaloacetate.
BC13 was exposed to organic acids concentrations equal to the previously calculated
IC50 values.
Control Organic Acids W/out Oxaloacetate 95% CI Oxaloacetate
Terminally Branched Saturates
i14:0 0.00 0.04 0.02 0.00
i15:0 0.24 0.13 0.03 0.00
a15:0 0.28 0.15 0.10 0.00
i16:0 1.52 1.18 0.23 0.88
i17:0 0.05 0.06 0.02 0.00
a17:0 1.97 3.01 1.16 3.51
Total 4.06 4.55 1.33 4.39
Monoenoic
15:1w6c 0.05 0.03 0.02 0.00
16:1w9c 0.05 0.11 0.05 0.00
16:1w7c 0.44 0.58 0.13 0.48
16:1w7t 0.19 0.16 0.06 0.00
16:1w5c 0.07 0.17 0.04 0.00
cy17:0 0.61 0.78 0.13 0.69
18:1w9c 0.84 0.91 0.54 2.49
18:1w7c 51.39 43.83 13.37 43.37
18:1w5c 0.39 0.38 0.12 0.40
cy19:0 12.92 21.36 7.99 21.79
Total 66.95 68.32 24.89 69.22
Branched Monoenoic
i17:1w7c 0.02 0.01 0.01 0.00
br19:1a 0.80 1.60 0.36 1.34
Total 0.82 1.61 0.36 1.34
Mid-Chain Branched Saturate
10me16:0 0.22 0.18 0.05 0.00
12me16:0 0.00 0.01 0.00 0.00
10me18:0 0.04 0.01 0.00 0.00
Total 0.26 0.19 0.05 0.00
Normal Saturates
14:0 0.33 0.29 0.07 0.00
15:0 0.57 0.39 0.10 0.51
16:0 14.99 11.57 3.72 15.22
17:0 1.86 1.54 0.32 1.39
18:0 2.53 1.92 0.69 1.90
20:0 5.52 7.24 2.34 0.96
Total 25.80 22.96 7.84 19.98
18:2w6 1.66 2.03 1.15 5.07
20:4w6 0.46 0.34 0.12 0.00
2.12 2.37 1.18 5.07
Metabolic Status: (Ratio)
(cy17:0/16:1w7c) 1.39 1.14 0.30 1.44
(cy19:0/18:1w7c) 0.25 0.53 0.22 0.50
Total 1.64 1.67 0.53 1.94
(16:1w7t/16:1w7c) 0.43 0.32 0.14 0.00
(18:1w7t/18:1w7c) 0.00 0.00 0.00 0.00
Total 0.43 0.32 0.14 0.00

226
APPENDIX F
CHAPTER THREE RAW DATA
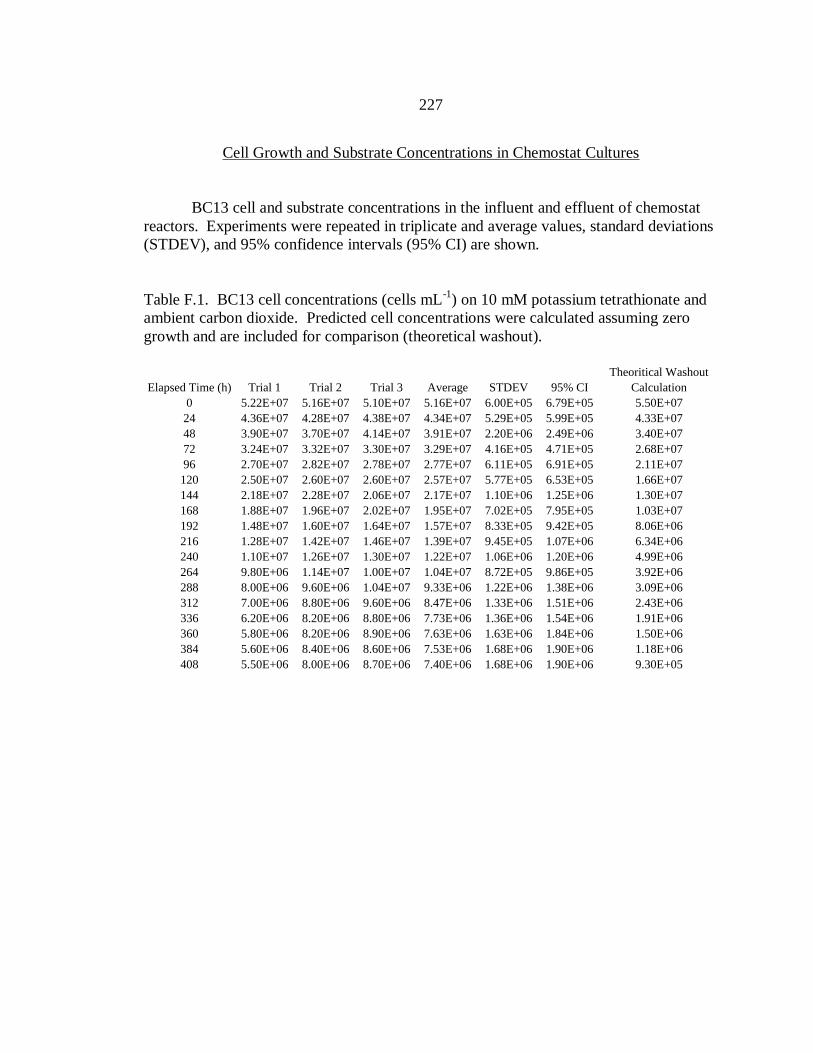
227
Cell Growth and Substrate Concentrations in Chemostat Cultures
BC13 cell and substrate concentrations in the influent and effluent of chemostat
reactors. Experiments were repeated in triplicate and average values, standard deviations
(STDEV), and 95% confidence intervals (95% CI) are shown.
Table F.1. BC13 cell concentrations (cells mL-1
) on 10 mM potassium tetrathionate and
ambient carbon dioxide. Predicted cell concentrations were calculated assuming zero
growth and are included for comparison (theoretical washout).
Theoritical Washout
Elapsed Time (h) Trial 1 Trial 2 Trial 3 Average STDEV 95% CI Calculation
0 5.22E+07 5.16E+07 5.10E+07 5.16E+07 6.00E+05 6.79E+05 5.50E+07
24 4.36E+07 4.28E+07 4.38E+07 4.34E+07 5.29E+05 5.99E+05 4.33E+07
48 3.90E+07 3.70E+07 4.14E+07 3.91E+07 2.20E+06 2.49E+06 3.40E+07
72 3.24E+07 3.32E+07 3.30E+07 3.29E+07 4.16E+05 4.71E+05 2.68E+07
96 2.70E+07 2.82E+07 2.78E+07 2.77E+07 6.11E+05 6.91E+05 2.11E+07
120 2.50E+07 2.60E+07 2.60E+07 2.57E+07 5.77E+05 6.53E+05 1.66E+07
144 2.18E+07 2.28E+07 2.06E+07 2.17E+07 1.10E+06 1.25E+06 1.30E+07
168 1.88E+07 1.96E+07 2.02E+07 1.95E+07 7.02E+05 7.95E+05 1.03E+07
192 1.48E+07 1.60E+07 1.64E+07 1.57E+07 8.33E+05 9.42E+05 8.06E+06
216 1.28E+07 1.42E+07 1.46E+07 1.39E+07 9.45E+05 1.07E+06 6.34E+06
240 1.10E+07 1.26E+07 1.30E+07 1.22E+07 1.06E+06 1.20E+06 4.99E+06
264 9.80E+06 1.14E+07 1.00E+07 1.04E+07 8.72E+05 9.86E+05 3.92E+06
288 8.00E+06 9.60E+06 1.04E+07 9.33E+06 1.22E+06 1.38E+06 3.09E+06
312 7.00E+06 8.80E+06 9.60E+06 8.47E+06 1.33E+06 1.51E+06 2.43E+06
336 6.20E+06 8.20E+06 8.80E+06 7.73E+06 1.36E+06 1.54E+06 1.91E+06
360 5.80E+06 8.20E+06 8.90E+06 7.63E+06 1.63E+06 1.84E+06 1.50E+06
384 5.60E+06 8.40E+06 8.60E+06 7.53E+06 1.68E+06 1.90E+06 1.18E+06
408 5.50E+06 8.00E+06 8.70E+06 7.40E+06 1.68E+06 1.90E+06 9.30E+05

228
Table F.2. BC13 cell concentrations (cells mL-1
) during heterotrophic growth on 50 M
pyruvate and ambient carbon dioxide.
Elapsed Time (h) Trial 1 Trial 2 Trial 3 Average STDEV 95% CI
0 5.26E+07 5.10E+07 5.00E+07 5.12E+07 1.31E+06 1.48E+06
24 4.04E+07 4.34E+07 4.00E+07 4.13E+07 1.86E+06 2.10E+06
48 3.46E+07 3.30E+07 3.40E+07 3.39E+07 8.08E+05 9.15E+05
72 2.64E+07 2.40E+07 2.66E+07 2.57E+07 1.45E+06 1.64E+06
96 2.20E+07 2.38E+07 2.50E+07 2.36E+07 1.51E+06 1.71E+06
120 1.74E+07 1.90E+07 1.50E+07 1.71E+07 2.01E+06 2.28E+06
144 1.26E+07 1.36E+07 1.40E+07 1.34E+07 7.21E+05 8.16E+05
168 9.80E+06 1.10E+07 1.00E+07 1.03E+07 6.43E+05 7.28E+05
192 7.40E+06 6.60E+06 7.00E+06 7.00E+06 4.00E+05 4.53E+05
216 6.40E+06 5.60E+06 6.00E+06 6.00E+06 4.00E+05 4.53E+05
240 4.60E+06 5.00E+06 5.00E+06 4.87E+06 2.31E+05 2.61E+05
264 3.60E+06 4.00E+06 4.00E+06 3.87E+06 2.31E+05 2.61E+05
288 3.20E+06 3.20E+06 3.70E+06 3.37E+06 2.89E+05 3.27E+05
312 2.50E+06 2.00E+06 3.00E+06 2.50E+06 5.00E+05 5.66E+05
336 1.90E+06 2.00E+06 2.20E+06 2.03E+06 1.53E+05 1.73E+05
360 1.60E+06 1.50E+06 1.90E+06 1.67E+06 2.08E+05 2.36E+05
384 1.10E+06 1.00E+06 1.20E+06 1.10E+06 1.00E+05 1.13E+05
408 1.00E+06 6.60E+05 1.34E+06 1.00E+06 3.40E+05 3.85E+05
0.0E+00
1.0E+07
2.0E+07
3.0E+07
4.0E+07
5.0E+07
6.0E+07
7.0E+07
0 50 100 150 200 250 300 350 400 450
Elapsed time (h)
Cel
l co
nce
ntr
atio
n (
cell
s m
L-1
)
Pyruvate
Acetate
Citrate
2-ketoglutarate
Succinate
Malate
Theoritical
Washout

229
Table F.3. BC13 cell concentrations (cells mL-1
) during heterotrophic growth on 50 M
acetate and ambient carbon dioxide.
Elapsed Time (h) Trial 1 Trial 2 Trial 3 Average STDEV 95% CI
0 5.10E+07 4.90E+07 5.06E+07 5.02E+07 1.06E+06 1.20E+06
24 4.00E+07 4.44E+07 4.30E+07 4.25E+07 2.25E+06 2.54E+06
48 3.80E+07 3.64E+07 3.30E+07 3.58E+07 2.55E+06 2.89E+06
72 2.80E+07 2.66E+07 2.66E+07 2.71E+07 8.08E+05 9.15E+05
96 2.10E+07 2.30E+07 2.24E+07 2.21E+07 1.03E+06 1.16E+06
120 1.80E+07 1.88E+07 1.86E+07 1.85E+07 4.16E+05 4.71E+05
144 1.34E+07 1.20E+07 1.30E+07 1.28E+07 7.21E+05 8.16E+05
168 1.00E+07 9.00E+06 8.00E+06 9.00E+06 1.00E+06 1.13E+06
192 6.60E+06 7.00E+06 8.00E+06 7.20E+06 7.21E+05 8.16E+05
216 6.00E+06 5.60E+06 6.20E+06 5.93E+06 3.06E+05 3.46E+05
240 5.00E+06 4.40E+06 5.00E+06 4.80E+06 3.46E+05 3.92E+05
264 3.00E+06 3.40E+06 2.80E+06 3.07E+06 3.06E+05 3.46E+05
288 2.60E+06 2.80E+06 3.00E+06 2.80E+06 2.00E+05 2.26E+05
312 2.00E+06 2.40E+06 2.20E+06 2.20E+06 2.00E+05 2.26E+05
336 1.60E+06 1.50E+06 1.30E+06 1.47E+06 1.53E+05 1.73E+05
360 1.10E+06 1.24E+06 1.18E+06 1.17E+06 7.02E+04 7.95E+04
384 1.00E+06 9.00E+05 1.00E+06 9.67E+05 5.77E+04 6.53E+04
408 8.00E+05 7.60E+05 8.20E+05 7.93E+05 3.06E+04 3.46E+04
0.0E+00
1.0E+07
2.0E+07
3.0E+07
4.0E+07
5.0E+07
6.0E+07
7.0E+07
0 50 100 150 200 250 300 350 400 450
Pyruvate
Acetate
Citrate
2-ketoglutarate
Succinate
Malate
Theoritical
Washout

230
Table F.4. BC13 cell concentrations (cells mL-1
) during heterotrophic growth on 50 M
citrate and ambient carbon dioxide.
Elapsed Time (h) Trial 1 Trial 2 Trial 3 Average STDEV 95% CI
0 5.00E+07 5.16E+07 5.04E+07 5.07E+07 8.33E+05 9.42E+05
24 4.16E+07 4.10E+07 4.20E+07 4.15E+07 5.03E+05 5.70E+05
48 3.12E+07 3.34E+07 2.96E+07 3.14E+07 1.91E+06 2.16E+06
72 2.70E+07 2.78E+07 2.56E+07 2.68E+07 1.11E+06 1.26E+06
96 2.30E+07 2.00E+07 2.10E+07 2.13E+07 1.53E+06 1.73E+06
120 1.54E+07 1.66E+07 1.34E+07 1.51E+07 1.62E+06 1.83E+06
144 1.30E+07 1.14E+07 1.08E+07 1.17E+07 1.14E+06 1.29E+06
168 1.04E+07 1.08E+07 9.60E+06 1.03E+07 6.11E+05 6.91E+05
192 7.00E+06 6.80E+06 7.00E+06 6.93E+06 1.15E+05 1.31E+05
216 7.00E+06 6.80E+06 6.00E+06 6.60E+06 5.29E+05 5.99E+05
240 4.20E+06 3.80E+06 3.40E+06 3.80E+06 4.00E+05 4.53E+05
264 3.20E+06 3.00E+06 2.88E+06 3.03E+06 1.62E+05 1.83E+05
288 2.60E+06 2.80E+06 3.00E+06 2.80E+06 2.00E+05 2.26E+05
312 2.40E+06 2.20E+06 2.30E+06 2.30E+06 1.00E+05 1.13E+05
336 1.80E+06 1.76E+06 1.72E+06 1.76E+06 4.00E+04 4.53E+04
360 1.48E+06 1.40E+06 1.36E+06 1.41E+06 6.11E+04 6.91E+04
384 1.04E+06 9.00E+05 8.40E+05 9.27E+05 1.03E+05 1.16E+05
408 7.60E+05 6.40E+05 7.60E+05 7.20E+05 6.93E+04 7.84E+04
.
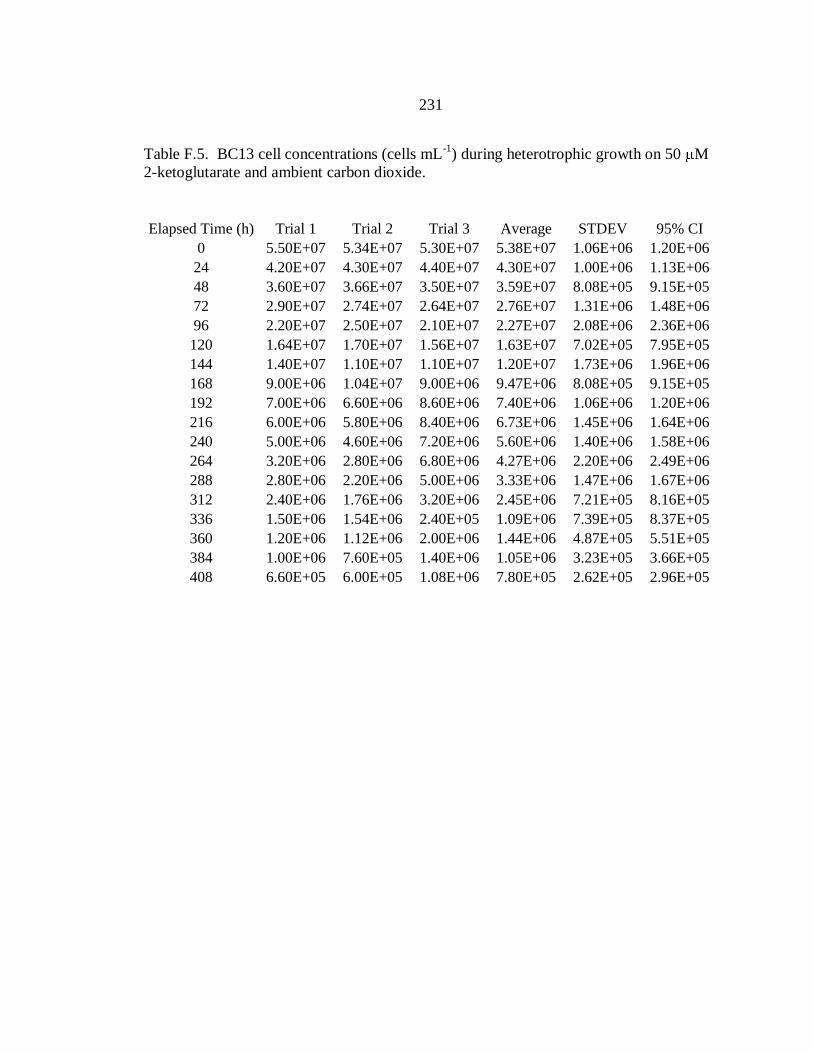
231
Table F.5. BC13 cell concentrations (cells mL-1
) during heterotrophic growth on 50 M
2-ketoglutarate and ambient carbon dioxide.
Elapsed Time (h) Trial 1 Trial 2 Trial 3 Average STDEV 95% CI
0 5.50E+07 5.34E+07 5.30E+07 5.38E+07 1.06E+06 1.20E+06
24 4.20E+07 4.30E+07 4.40E+07 4.30E+07 1.00E+06 1.13E+06
48 3.60E+07 3.66E+07 3.50E+07 3.59E+07 8.08E+05 9.15E+05
72 2.90E+07 2.74E+07 2.64E+07 2.76E+07 1.31E+06 1.48E+06
96 2.20E+07 2.50E+07 2.10E+07 2.27E+07 2.08E+06 2.36E+06
120 1.64E+07 1.70E+07 1.56E+07 1.63E+07 7.02E+05 7.95E+05
144 1.40E+07 1.10E+07 1.10E+07 1.20E+07 1.73E+06 1.96E+06
168 9.00E+06 1.04E+07 9.00E+06 9.47E+06 8.08E+05 9.15E+05
192 7.00E+06 6.60E+06 8.60E+06 7.40E+06 1.06E+06 1.20E+06
216 6.00E+06 5.80E+06 8.40E+06 6.73E+06 1.45E+06 1.64E+06
240 5.00E+06 4.60E+06 7.20E+06 5.60E+06 1.40E+06 1.58E+06
264 3.20E+06 2.80E+06 6.80E+06 4.27E+06 2.20E+06 2.49E+06
288 2.80E+06 2.20E+06 5.00E+06 3.33E+06 1.47E+06 1.67E+06
312 2.40E+06 1.76E+06 3.20E+06 2.45E+06 7.21E+05 8.16E+05
336 1.50E+06 1.54E+06 2.40E+05 1.09E+06 7.39E+05 8.37E+05
360 1.20E+06 1.12E+06 2.00E+06 1.44E+06 4.87E+05 5.51E+05
384 1.00E+06 7.60E+05 1.40E+06 1.05E+06 3.23E+05 3.66E+05
408 6.60E+05 6.00E+05 1.08E+06 7.80E+05 2.62E+05 2.96E+05
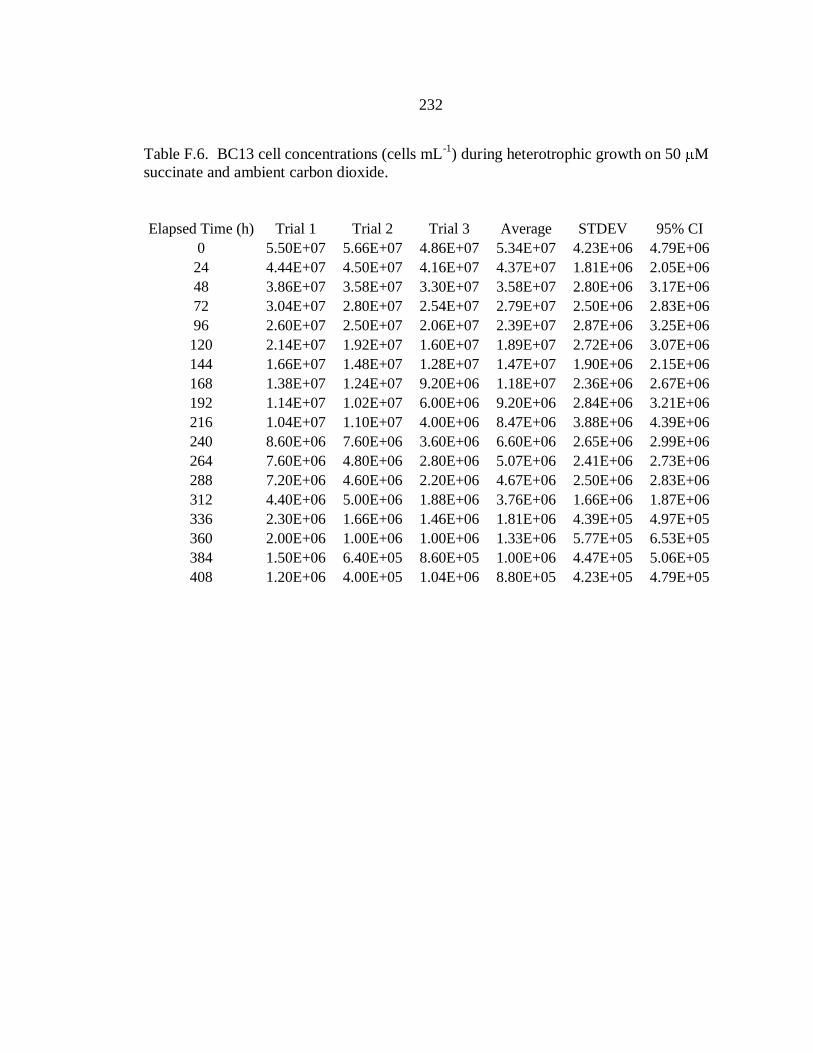
232
Table F.6. BC13 cell concentrations (cells mL-1
) during heterotrophic growth on 50 M
succinate and ambient carbon dioxide.
Elapsed Time (h) Trial 1 Trial 2 Trial 3 Average STDEV 95% CI
0 5.50E+07 5.66E+07 4.86E+07 5.34E+07 4.23E+06 4.79E+06
24 4.44E+07 4.50E+07 4.16E+07 4.37E+07 1.81E+06 2.05E+06
48 3.86E+07 3.58E+07 3.30E+07 3.58E+07 2.80E+06 3.17E+06
72 3.04E+07 2.80E+07 2.54E+07 2.79E+07 2.50E+06 2.83E+06
96 2.60E+07 2.50E+07 2.06E+07 2.39E+07 2.87E+06 3.25E+06
120 2.14E+07 1.92E+07 1.60E+07 1.89E+07 2.72E+06 3.07E+06
144 1.66E+07 1.48E+07 1.28E+07 1.47E+07 1.90E+06 2.15E+06
168 1.38E+07 1.24E+07 9.20E+06 1.18E+07 2.36E+06 2.67E+06
192 1.14E+07 1.02E+07 6.00E+06 9.20E+06 2.84E+06 3.21E+06
216 1.04E+07 1.10E+07 4.00E+06 8.47E+06 3.88E+06 4.39E+06
240 8.60E+06 7.60E+06 3.60E+06 6.60E+06 2.65E+06 2.99E+06
264 7.60E+06 4.80E+06 2.80E+06 5.07E+06 2.41E+06 2.73E+06
288 7.20E+06 4.60E+06 2.20E+06 4.67E+06 2.50E+06 2.83E+06
312 4.40E+06 5.00E+06 1.88E+06 3.76E+06 1.66E+06 1.87E+06
336 2.30E+06 1.66E+06 1.46E+06 1.81E+06 4.39E+05 4.97E+05
360 2.00E+06 1.00E+06 1.00E+06 1.33E+06 5.77E+05 6.53E+05
384 1.50E+06 6.40E+05 8.60E+05 1.00E+06 4.47E+05 5.06E+05
408 1.20E+06 4.00E+05 1.04E+06 8.80E+05 4.23E+05 4.79E+05

233
Table F.7. BC13 cell concentrations (cells mL-1
) during heterotrophic growth on 50 M
malate and ambient carbon dioxide.
Elapsed Time (h) Trial 1 Trial 2 Trial 3 Average STDEV 95% CI
0 4.90E+07 4.66E+07 5.10E+07 4.89E+07 2.20E+06 2.49E+06
24 3.96E+07 4.10E+07 4.24E+07 4.10E+07 1.40E+06 1.58E+06
48 3.70E+07 3.50E+07 3.30E+07 3.50E+07 2.00E+06 2.26E+06
72 2.42E+07 2.70E+07 2.68E+07 2.60E+07 1.56E+06 1.77E+06
96 1.84E+07 1.98E+07 2.24E+07 2.02E+07 2.03E+06 2.30E+06
120 1.28E+07 1.54E+07 1.78E+07 1.53E+07 2.50E+06 2.83E+06
144 1.02E+07 1.08E+07 1.30E+07 1.13E+07 1.47E+06 1.67E+06
168 8.60E+06 8.00E+06 1.02E+07 8.93E+06 1.14E+06 1.29E+06
192 6.40E+06 7.60E+06 9.80E+06 7.93E+06 1.72E+06 1.95E+06
216 5.60E+06 4.60E+06 6.80E+06 5.67E+06 1.10E+06 1.25E+06
240 3.40E+06 2.80E+06 4.20E+06 3.47E+06 7.02E+05 7.95E+05
264 2.60E+06 1.80E+06 3.00E+06 2.47E+06 6.11E+05 6.91E+05
288 2.20E+06 1.48E+06 2.20E+06 1.96E+06 4.16E+05 4.70E+05
312 2.04E+06 9.20E+05 1.60E+06 1.52E+06 5.64E+05 6.39E+05
336 1.30E+06 6.20E+05 1.08E+06 1.00E+06 3.47E+05 3.93E+05
360 1.00E+06 4.40E+05 6.00E+05 6.80E+05 2.88E+05 3.26E+05
384 8.20E+05 4.20E+05 3.40E+05 5.27E+05 2.57E+05 2.91E+05
408 6.60E+05 4.00E+05 2.66E+05 4.42E+05 2.00E+05 2.27E+05
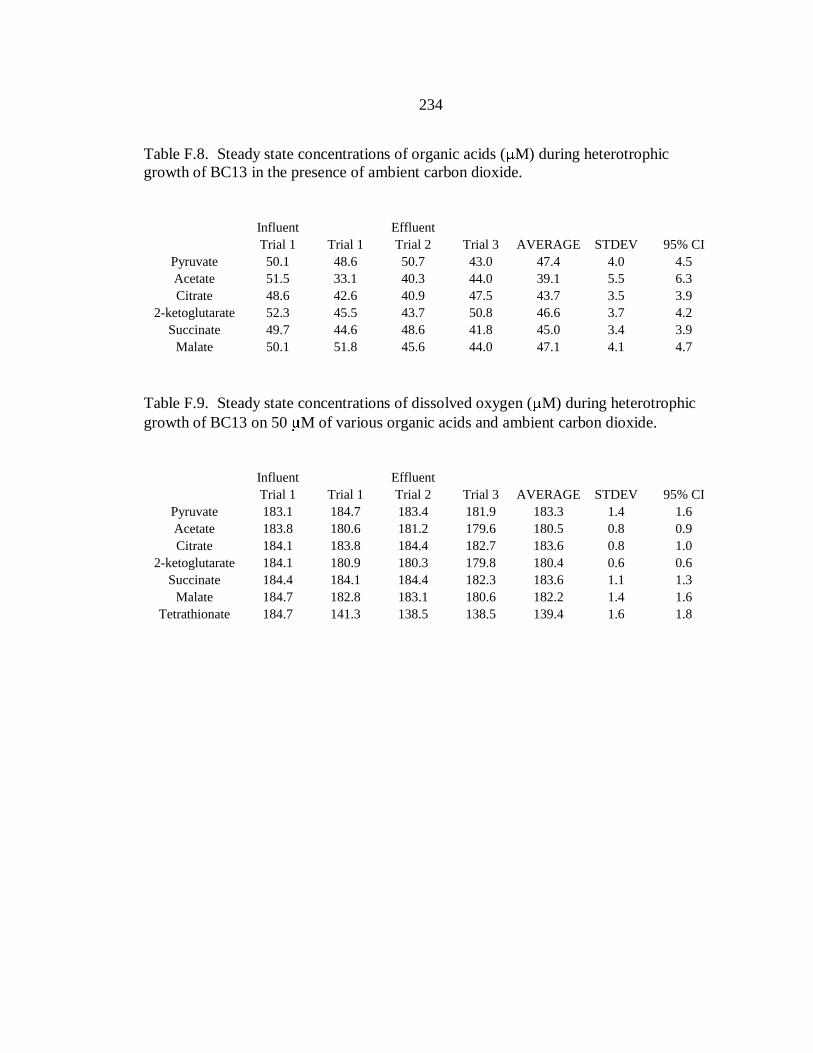
234
Table F.8. Steady state concentrations of organic acids ( M) during heterotrophic
growth of BC13 in the presence of ambient carbon dioxide.
Influent Effluent
Trial 1 Trial 1 Trial 2 Trial 3 AVERAGE STDEV 95% CI
Pyruvate 50.1 48.6 50.7 43.0 47.4 4.0 4.5
Acetate 51.5 33.1 40.3 44.0 39.1 5.5 6.3
Citrate 48.6 42.6 40.9 47.5 43.7 3.5 3.9
2-ketoglutarate 52.3 45.5 43.7 50.8 46.6 3.7 4.2
Succinate 49.7 44.6 48.6 41.8 45.0 3.4 3.9
Malate 50.1 51.8 45.6 44.0 47.1 4.1 4.7
Table F.9. Steady state concentrations of dissolved oxygen ( M) during heterotrophic
growth of BC13 on 50 M of various organic acids and ambient carbon dioxide.
Influent Effluent
Trial 1 Trial 1 Trial 2 Trial 3 AVERAGE STDEV 95% CI
Pyruvate 183.1 184.7 183.4 181.9 183.3 1.4 1.6
Acetate 183.8 180.6 181.2 179.6 180.5 0.8 0.9
Citrate 184.1 183.8 184.4 182.7 183.6 0.8 1.0
2-ketoglutarate 184.1 180.9 180.3 179.8 180.4 0.6 0.6
Succinate 184.4 184.1 184.4 182.3 183.6 1.1 1.3
Malate 184.7 182.8 183.1 180.6 182.2 1.4 1.6
Tetrathionate 184.7 141.3 138.5 138.5 139.4 1.6 1.8
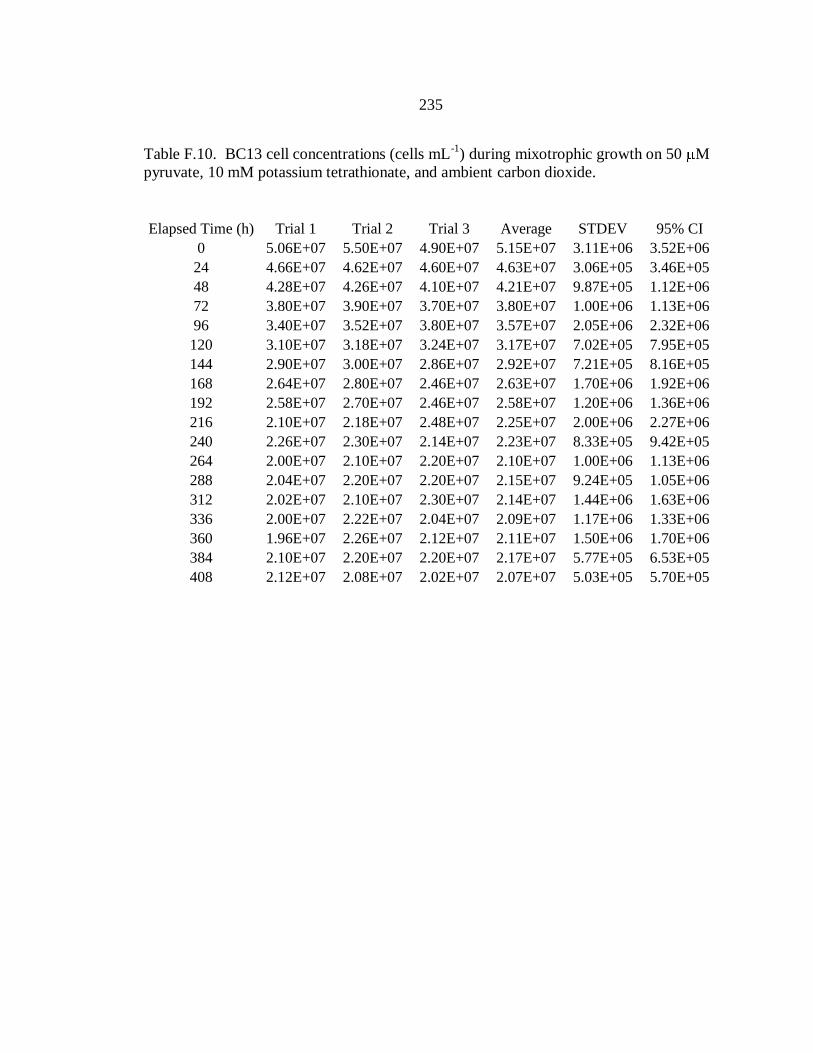
235
Table F.10. BC13 cell concentrations (cells mL-1
) during mixotrophic growth on 50 M
pyruvate, 10 mM potassium tetrathionate, and ambient carbon dioxide.
Elapsed Time (h) Trial 1 Trial 2 Trial 3 Average STDEV 95% CI
0 5.06E+07 5.50E+07 4.90E+07 5.15E+07 3.11E+06 3.52E+06
24 4.66E+07 4.62E+07 4.60E+07 4.63E+07 3.06E+05 3.46E+05
48 4.28E+07 4.26E+07 4.10E+07 4.21E+07 9.87E+05 1.12E+06
72 3.80E+07 3.90E+07 3.70E+07 3.80E+07 1.00E+06 1.13E+06
96 3.40E+07 3.52E+07 3.80E+07 3.57E+07 2.05E+06 2.32E+06
120 3.10E+07 3.18E+07 3.24E+07 3.17E+07 7.02E+05 7.95E+05
144 2.90E+07 3.00E+07 2.86E+07 2.92E+07 7.21E+05 8.16E+05
168 2.64E+07 2.80E+07 2.46E+07 2.63E+07 1.70E+06 1.92E+06
192 2.58E+07 2.70E+07 2.46E+07 2.58E+07 1.20E+06 1.36E+06
216 2.10E+07 2.18E+07 2.48E+07 2.25E+07 2.00E+06 2.27E+06
240 2.26E+07 2.30E+07 2.14E+07 2.23E+07 8.33E+05 9.42E+05
264 2.00E+07 2.10E+07 2.20E+07 2.10E+07 1.00E+06 1.13E+06
288 2.04E+07 2.20E+07 2.20E+07 2.15E+07 9.24E+05 1.05E+06
312 2.02E+07 2.10E+07 2.30E+07 2.14E+07 1.44E+06 1.63E+06
336 2.00E+07 2.22E+07 2.04E+07 2.09E+07 1.17E+06 1.33E+06
360 1.96E+07 2.26E+07 2.12E+07 2.11E+07 1.50E+06 1.70E+06
384 2.10E+07 2.20E+07 2.20E+07 2.17E+07 5.77E+05 6.53E+05
408 2.12E+07 2.08E+07 2.02E+07 2.07E+07 5.03E+05 5.70E+05
0.0E+00
1.0E+07
2.0E+07
3.0E+07
4.0E+07
5.0E+07
6.0E+07
0 50 100 150 200 250 300 350 400 450
Elapsed time (h)
Cel
l co
nce
ntr
atio
n (
cell
s m
L-1
)
Pyruvate
Acetate
Citrate
2-ketoglutarate
Succinate
Malate
Tetrathionate
Theoritical
Washout
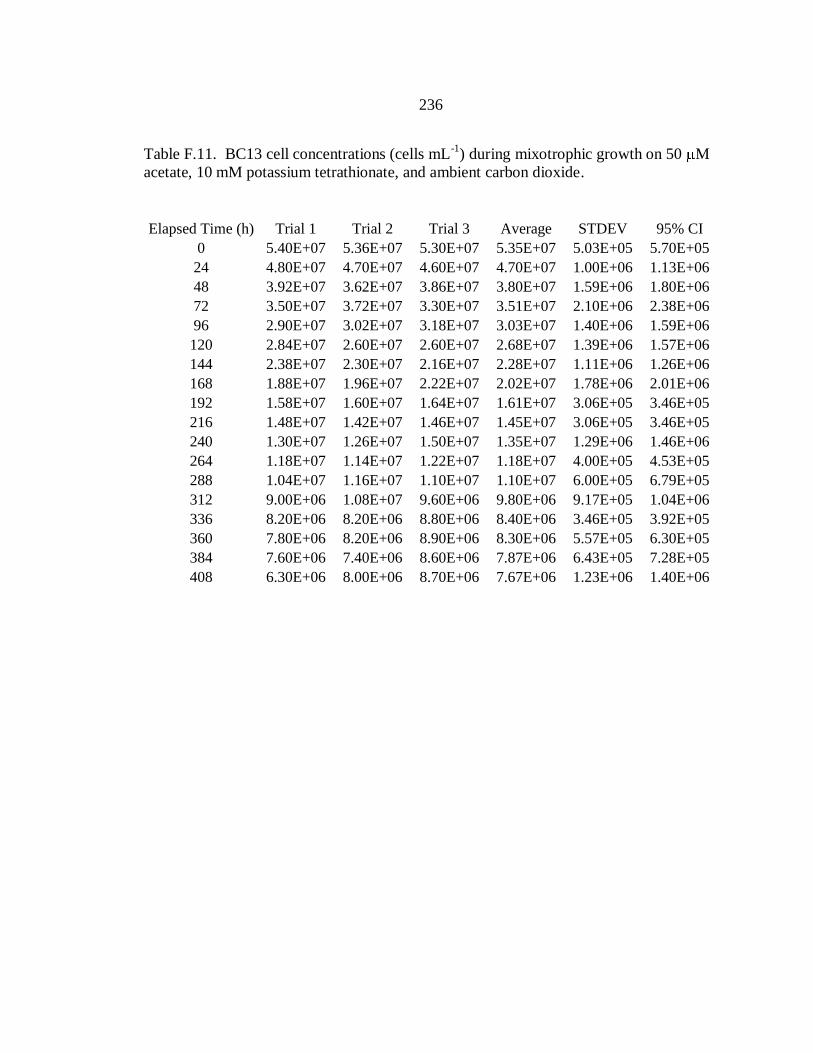
236
Table F.11. BC13 cell concentrations (cells mL-1
) during mixotrophic growth on 50 M
acetate, 10 mM potassium tetrathionate, and ambient carbon dioxide.
Elapsed Time (h) Trial 1 Trial 2 Trial 3 Average STDEV 95% CI
0 5.40E+07 5.36E+07 5.30E+07 5.35E+07 5.03E+05 5.70E+05
24 4.80E+07 4.70E+07 4.60E+07 4.70E+07 1.00E+06 1.13E+06
48 3.92E+07 3.62E+07 3.86E+07 3.80E+07 1.59E+06 1.80E+06
72 3.50E+07 3.72E+07 3.30E+07 3.51E+07 2.10E+06 2.38E+06
96 2.90E+07 3.02E+07 3.18E+07 3.03E+07 1.40E+06 1.59E+06
120 2.84E+07 2.60E+07 2.60E+07 2.68E+07 1.39E+06 1.57E+06
144 2.38E+07 2.30E+07 2.16E+07 2.28E+07 1.11E+06 1.26E+06
168 1.88E+07 1.96E+07 2.22E+07 2.02E+07 1.78E+06 2.01E+06
192 1.58E+07 1.60E+07 1.64E+07 1.61E+07 3.06E+05 3.46E+05
216 1.48E+07 1.42E+07 1.46E+07 1.45E+07 3.06E+05 3.46E+05
240 1.30E+07 1.26E+07 1.50E+07 1.35E+07 1.29E+06 1.46E+06
264 1.18E+07 1.14E+07 1.22E+07 1.18E+07 4.00E+05 4.53E+05
288 1.04E+07 1.16E+07 1.10E+07 1.10E+07 6.00E+05 6.79E+05
312 9.00E+06 1.08E+07 9.60E+06 9.80E+06 9.17E+05 1.04E+06
336 8.20E+06 8.20E+06 8.80E+06 8.40E+06 3.46E+05 3.92E+05
360 7.80E+06 8.20E+06 8.90E+06 8.30E+06 5.57E+05 6.30E+05
384 7.60E+06 7.40E+06 8.60E+06 7.87E+06 6.43E+05 7.28E+05
408 6.30E+06 8.00E+06 8.70E+06 7.67E+06 1.23E+06 1.40E+06
0.0E+00
1.0E+07
2.0E+07
3.0E+07
4.0E+07
5.0E+07
6.0E+07
0 50 100 150 200 250 300 350 400 450
Pyruvate
Acetate
Citrate
2-ketoglutarate
Succinate
Malate
Tetrathionate
Theoritical
Washout

237
Table F.12. BC13 cell concentrations (cells mL-1
) during mixotrophic growth on 50 M
citrate, 10 mM potassium tetrathionate, and ambient carbon dioxide.
Elapsed Time (h) Trial 1 Trial 2 Trial 3 Average STDEV 95% CI
0 5.62E+07 5.56E+07 5.50E+07 5.56E+07 6.00E+05 6.79E+05
24 4.76E+07 4.88E+07 4.78E+07 4.81E+07 6.43E+05 7.28E+05
48 3.70E+07 3.80E+07 3.90E+07 3.80E+07 1.00E+06 1.13E+06
72 3.24E+07 2.92E+07 3.30E+07 3.15E+07 2.04E+06 2.31E+06
96 2.70E+07 2.82E+07 2.98E+07 2.83E+07 1.40E+06 1.59E+06
120 2.10E+07 2.60E+07 2.00E+07 2.23E+07 3.21E+06 3.64E+06
144 1.88E+07 1.80E+07 2.06E+07 1.91E+07 1.33E+06 1.51E+06
168 1.88E+07 1.66E+07 1.60E+07 1.71E+07 1.47E+06 1.67E+06
192 1.28E+07 1.10E+07 1.64E+07 1.34E+07 2.75E+06 3.11E+06
216 1.28E+07 1.32E+07 1.20E+07 1.27E+07 6.11E+05 6.91E+05
240 1.08E+07 1.22E+07 1.20E+07 1.17E+07 7.57E+05 8.57E+05
264 9.00E+06 1.04E+07 9.40E+06 9.60E+06 7.21E+05 8.16E+05
288 7.20E+06 8.20E+06 1.00E+07 8.47E+06 1.42E+06 1.61E+06
312 5.60E+06 6.80E+06 7.60E+06 6.67E+06 1.01E+06 1.14E+06
336 4.20E+06 6.20E+06 6.80E+06 5.73E+06 1.36E+06 1.54E+06
360 5.00E+06 6.60E+06 5.20E+06 5.60E+06 8.72E+05 9.86E+05
384 5.40E+06 6.00E+06 5.00E+06 5.47E+06 5.03E+05 5.70E+05
408 5.60E+06 5.80E+06 5.80E+06 5.73E+06 1.15E+05 1.31E+05
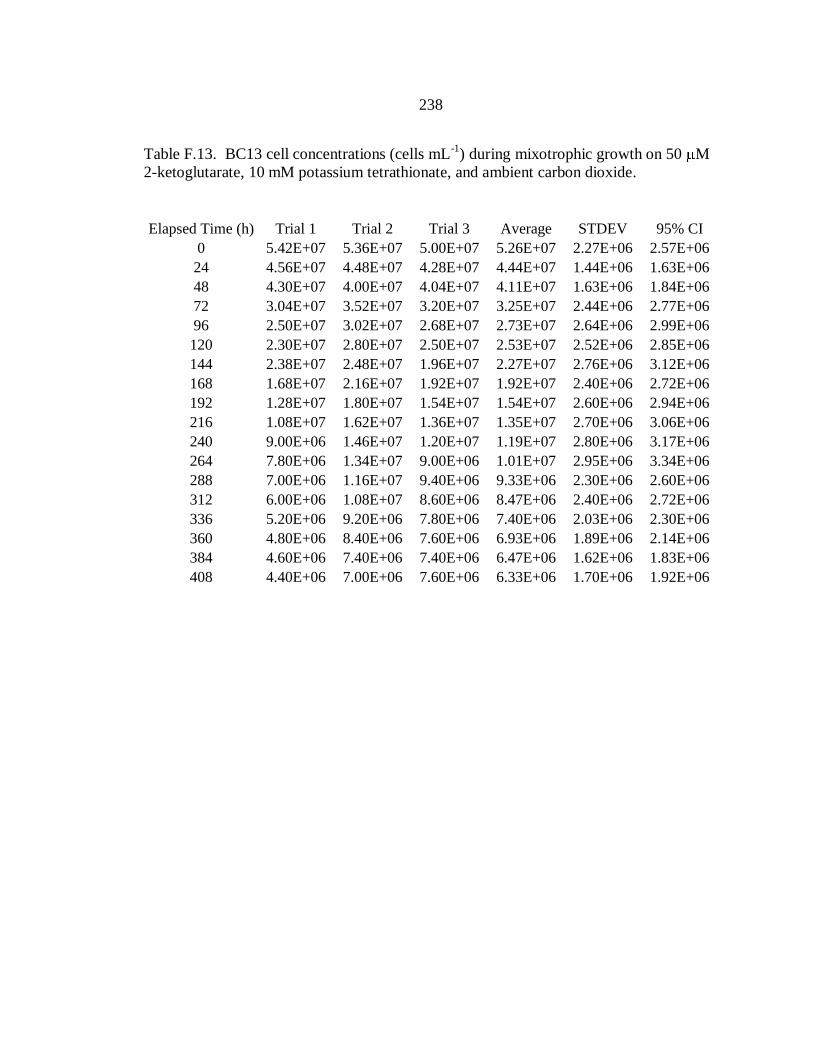
238
Table F.13. BC13 cell concentrations (cells mL-1
) during mixotrophic growth on 50 M
2-ketoglutarate, 10 mM potassium tetrathionate, and ambient carbon dioxide.
Elapsed Time (h) Trial 1 Trial 2 Trial 3 Average STDEV 95% CI
0 5.42E+07 5.36E+07 5.00E+07 5.26E+07 2.27E+06 2.57E+06
24 4.56E+07 4.48E+07 4.28E+07 4.44E+07 1.44E+06 1.63E+06
48 4.30E+07 4.00E+07 4.04E+07 4.11E+07 1.63E+06 1.84E+06
72 3.04E+07 3.52E+07 3.20E+07 3.25E+07 2.44E+06 2.77E+06
96 2.50E+07 3.02E+07 2.68E+07 2.73E+07 2.64E+06 2.99E+06
120 2.30E+07 2.80E+07 2.50E+07 2.53E+07 2.52E+06 2.85E+06
144 2.38E+07 2.48E+07 1.96E+07 2.27E+07 2.76E+06 3.12E+06
168 1.68E+07 2.16E+07 1.92E+07 1.92E+07 2.40E+06 2.72E+06
192 1.28E+07 1.80E+07 1.54E+07 1.54E+07 2.60E+06 2.94E+06
216 1.08E+07 1.62E+07 1.36E+07 1.35E+07 2.70E+06 3.06E+06
240 9.00E+06 1.46E+07 1.20E+07 1.19E+07 2.80E+06 3.17E+06
264 7.80E+06 1.34E+07 9.00E+06 1.01E+07 2.95E+06 3.34E+06
288 7.00E+06 1.16E+07 9.40E+06 9.33E+06 2.30E+06 2.60E+06
312 6.00E+06 1.08E+07 8.60E+06 8.47E+06 2.40E+06 2.72E+06
336 5.20E+06 9.20E+06 7.80E+06 7.40E+06 2.03E+06 2.30E+06
360 4.80E+06 8.40E+06 7.60E+06 6.93E+06 1.89E+06 2.14E+06
384 4.60E+06 7.40E+06 7.40E+06 6.47E+06 1.62E+06 1.83E+06
408 4.40E+06 7.00E+06 7.60E+06 6.33E+06 1.70E+06 1.92E+06

239
Table F.14. BC13 cell concentrations (cells mL-1
) during mixotrophic growth on 50 M
succinate, 10 mM potassium tetrathionate, and ambient carbon dioxide.
Elapsed Time (h) Trial 1 Trial 2 Trial 3 Average STDEV 95% CI
0 5.32E+07 5.36E+07 5.34E+07 5.34E+07 2.00E+05 2.26E+05
24 4.56E+07 4.48E+07 4.58E+07 4.54E+07 5.29E+05 5.99E+05
48 4.24E+07 4.32E+07 4.28E+07 4.28E+07 4.00E+05 4.53E+05
72 3.10E+07 3.18E+07 3.16E+07 3.15E+07 4.16E+05 4.71E+05
96 3.00E+07 3.12E+07 3.08E+07 3.07E+07 6.11E+05 6.91E+05
120 2.20E+07 2.30E+07 2.24E+07 2.25E+07 5.03E+05 5.70E+05
144 1.98E+07 2.10E+07 1.90E+07 1.99E+07 1.01E+06 1.14E+06
168 1.68E+07 1.80E+07 1.80E+07 1.76E+07 6.93E+05 7.84E+05
192 1.42E+07 1.54E+07 1.52E+07 1.49E+07 6.43E+05 7.28E+05
216 1.06E+07 1.16E+07 1.22E+07 1.15E+07 8.08E+05 9.15E+05
240 1.00E+07 1.14E+07 1.20E+07 1.11E+07 1.03E+06 1.16E+06
264 9.60E+06 1.10E+07 9.60E+06 1.01E+07 8.08E+05 9.15E+05
288 7.00E+06 8.60E+06 9.40E+06 8.33E+06 1.22E+06 1.38E+06
312 6.40E+06 8.20E+06 9.00E+06 7.87E+06 1.33E+06 1.51E+06
336 5.80E+06 7.80E+06 8.40E+06 7.33E+06 1.36E+06 1.54E+06
360 5.60E+06 8.00E+06 8.60E+06 7.40E+06 1.59E+06 1.80E+06
384 5.20E+06 8.00E+06 8.40E+06 7.20E+06 1.74E+06 1.97E+06
408 4.80E+06 7.80E+06 8.20E+06 6.93E+06 1.86E+06 2.10E+06
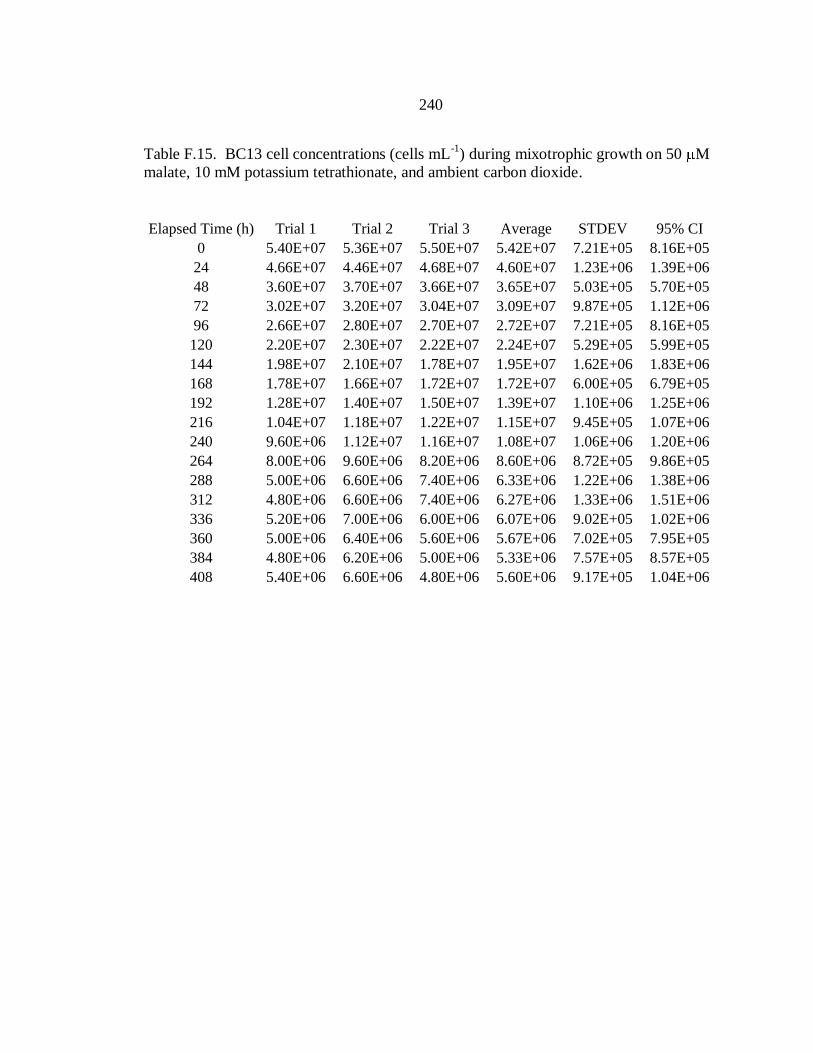
240
Table F.15. BC13 cell concentrations (cells mL-1
) during mixotrophic growth on 50 M
malate, 10 mM potassium tetrathionate, and ambient carbon dioxide.
Elapsed Time (h) Trial 1 Trial 2 Trial 3 Average STDEV 95% CI
0 5.40E+07 5.36E+07 5.50E+07 5.42E+07 7.21E+05 8.16E+05
24 4.66E+07 4.46E+07 4.68E+07 4.60E+07 1.23E+06 1.39E+06
48 3.60E+07 3.70E+07 3.66E+07 3.65E+07 5.03E+05 5.70E+05
72 3.02E+07 3.20E+07 3.04E+07 3.09E+07 9.87E+05 1.12E+06
96 2.66E+07 2.80E+07 2.70E+07 2.72E+07 7.21E+05 8.16E+05
120 2.20E+07 2.30E+07 2.22E+07 2.24E+07 5.29E+05 5.99E+05
144 1.98E+07 2.10E+07 1.78E+07 1.95E+07 1.62E+06 1.83E+06
168 1.78E+07 1.66E+07 1.72E+07 1.72E+07 6.00E+05 6.79E+05
192 1.28E+07 1.40E+07 1.50E+07 1.39E+07 1.10E+06 1.25E+06
216 1.04E+07 1.18E+07 1.22E+07 1.15E+07 9.45E+05 1.07E+06
240 9.60E+06 1.12E+07 1.16E+07 1.08E+07 1.06E+06 1.20E+06
264 8.00E+06 9.60E+06 8.20E+06 8.60E+06 8.72E+05 9.86E+05
288 5.00E+06 6.60E+06 7.40E+06 6.33E+06 1.22E+06 1.38E+06
312 4.80E+06 6.60E+06 7.40E+06 6.27E+06 1.33E+06 1.51E+06
336 5.20E+06 7.00E+06 6.00E+06 6.07E+06 9.02E+05 1.02E+06
360 5.00E+06 6.40E+06 5.60E+06 5.67E+06 7.02E+05 7.95E+05
384 4.80E+06 6.20E+06 5.00E+06 5.33E+06 7.57E+05 8.57E+05
408 5.40E+06 6.60E+06 4.80E+06 5.60E+06 9.17E+05 1.04E+06

241
Table F.16. Steady state concentrations of organic acids ( M) during mixotrophic
growth of BC13 in the presence of ambient carbon dioxide.
Influent Effluent
Trial 1 Trial 1 Trial 2 Trial 3 AVERAGE STDEV 95% CI
Pyruvate 48.3 0.0 0.0 0.0 0.0 0.0 0.0
Acetate 48.7 40.7 38.8 46.8 42.1 4.2 4.7
Citrate 49.8 40.1 40.9 47.5 42.8 4.1 4.6
2-ketoglutarate 50.7 41.7 43.7 50.8 45.4 4.7 5.4
Succinate 51.4 40.6 48.6 41.8 43.7 4.3 4.9
Malate 50.4 45.6 45.6 44.0 45.1 0.9 1.0
Table F.17. Steady state concentrations of dissolved oxygen ( M) during mixotrophic
growth of BC13 on 50 M of various organic acids and ambient carbon dioxide.
Influent Effluent
Trial 1 Trial 1 Trial 2 Trial 3 AVERAGE STDEV 95% CI
Pyruvate 194.4 98.4 95.1 92.8 95.4 2.8 3.2
Acetate 193.8 154.4 140.7 141.0 145.4 7.8 8.9
Citrate 194.7 145.9 142.3 142.6 143.6 2.0 2.3
2-ketoglutarate 194.4 139.1 133.5 136.9 136.5 2.8 3.2
Succinate 194.4 150.6 147.3 144.8 147.6 2.9 3.3
Malate 194.7 149.4 136.8 147.3 144.5 6.8 7.6
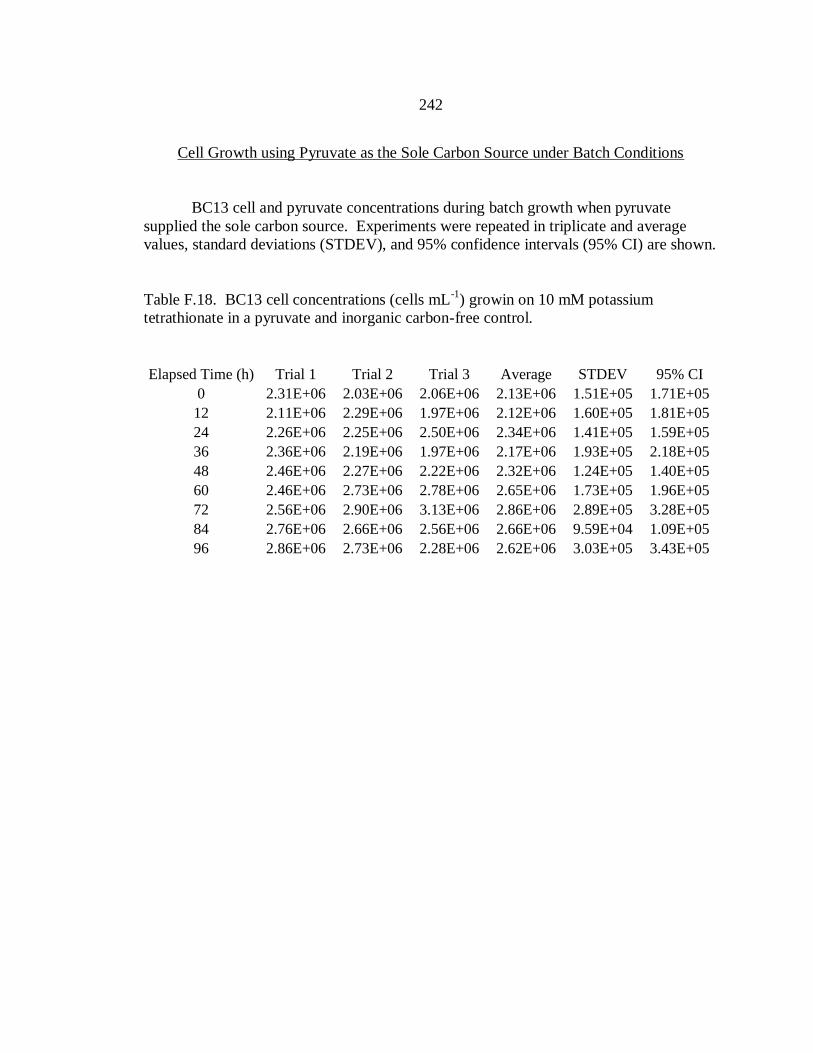
242
Cell Growth using Pyruvate as the Sole Carbon Source under Batch Conditions
BC13 cell and pyruvate concentrations during batch growth when pyruvate
supplied the sole carbon source. Experiments were repeated in triplicate and average
values, standard deviations (STDEV), and 95% confidence intervals (95% CI) are shown.
Table F.18. BC13 cell concentrations (cells mL-1
) growin on 10 mM potassium
tetrathionate in a pyruvate and inorganic carbon-free control.
Elapsed Time (h) Trial 1 Trial 2 Trial 3 Average STDEV 95% CI
0 2.31E+06 2.03E+06 2.06E+06 2.13E+06 1.51E+05 1.71E+05
12 2.11E+06 2.29E+06 1.97E+06 2.12E+06 1.60E+05 1.81E+05
24 2.26E+06 2.25E+06 2.50E+06 2.34E+06 1.41E+05 1.59E+05
36 2.36E+06 2.19E+06 1.97E+06 2.17E+06 1.93E+05 2.18E+05
48 2.46E+06 2.27E+06 2.22E+06 2.32E+06 1.24E+05 1.40E+05
60 2.46E+06 2.73E+06 2.78E+06 2.65E+06 1.73E+05 1.96E+05
72 2.56E+06 2.90E+06 3.13E+06 2.86E+06 2.89E+05 3.28E+05
84 2.76E+06 2.66E+06 2.56E+06 2.66E+06 9.59E+04 1.09E+05
96 2.86E+06 2.73E+06 2.28E+06 2.62E+06 3.03E+05 3.43E+05
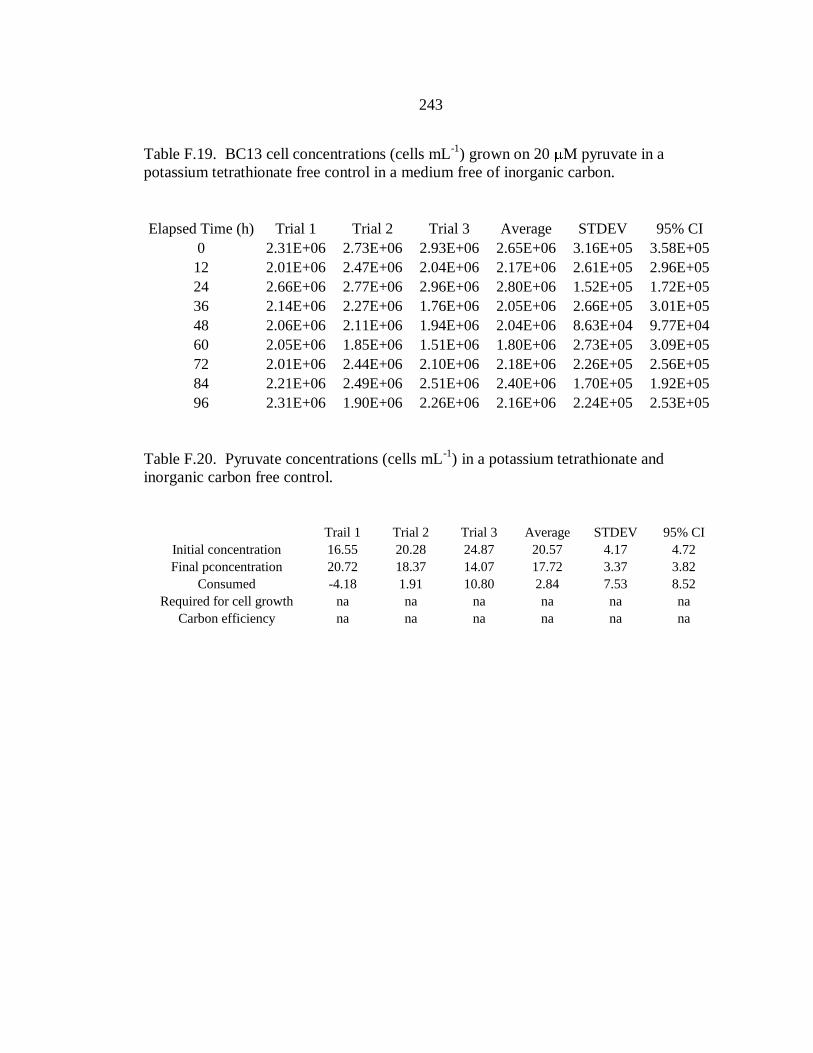
243
Table F.19. BC13 cell concentrations (cells mL-1
) grown on 20 M pyruvate in a
potassium tetrathionate free control in a medium free of inorganic carbon.
Elapsed Time (h) Trial 1 Trial 2 Trial 3 Average STDEV 95% CI
0 2.31E+06 2.73E+06 2.93E+06 2.65E+06 3.16E+05 3.58E+05
12 2.01E+06 2.47E+06 2.04E+06 2.17E+06 2.61E+05 2.96E+05
24 2.66E+06 2.77E+06 2.96E+06 2.80E+06 1.52E+05 1.72E+05
36 2.14E+06 2.27E+06 1.76E+06 2.05E+06 2.66E+05 3.01E+05
48 2.06E+06 2.11E+06 1.94E+06 2.04E+06 8.63E+04 9.77E+04
60 2.05E+06 1.85E+06 1.51E+06 1.80E+06 2.73E+05 3.09E+05
72 2.01E+06 2.44E+06 2.10E+06 2.18E+06 2.26E+05 2.56E+05
84 2.21E+06 2.49E+06 2.51E+06 2.40E+06 1.70E+05 1.92E+05
96 2.31E+06 1.90E+06 2.26E+06 2.16E+06 2.24E+05 2.53E+05
Table F.20. Pyruvate concentrations (cells mL-1
) in a potassium tetrathionate and
inorganic carbon free control.
Trail 1 Trial 2 Trial 3 Average STDEV 95% CI
Initial concentration 16.55 20.28 24.87 20.57 4.17 4.72
Final pconcentration 20.72 18.37 14.07 17.72 3.37 3.82
Consumed -4.18 1.91 10.80 2.84 7.53 8.52
Required for cell growth na na na na na na
Carbon efficiency na na na na na na
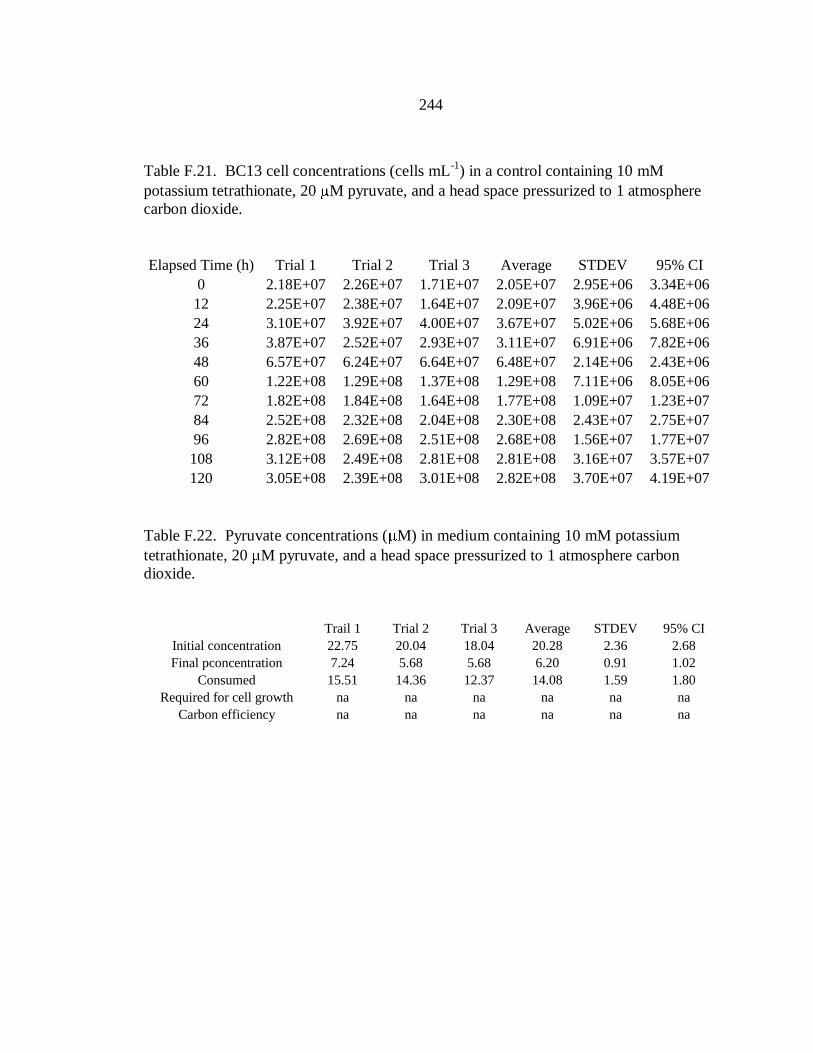
244
Table F.21. BC13 cell concentrations (cells mL-1
) in a control containing 10 mM
potassium tetrathionate, 20 M pyruvate, and a head space pressurized to 1 atmosphere
carbon dioxide.
Elapsed Time (h) Trial 1 Trial 2 Trial 3 Average STDEV 95% CI
0 2.18E+07 2.26E+07 1.71E+07 2.05E+07 2.95E+06 3.34E+06
12 2.25E+07 2.38E+07 1.64E+07 2.09E+07 3.96E+06 4.48E+06
24 3.10E+07 3.92E+07 4.00E+07 3.67E+07 5.02E+06 5.68E+06
36 3.87E+07 2.52E+07 2.93E+07 3.11E+07 6.91E+06 7.82E+06
48 6.57E+07 6.24E+07 6.64E+07 6.48E+07 2.14E+06 2.43E+06
60 1.22E+08 1.29E+08 1.37E+08 1.29E+08 7.11E+06 8.05E+06
72 1.82E+08 1.84E+08 1.64E+08 1.77E+08 1.09E+07 1.23E+07
84 2.52E+08 2.32E+08 2.04E+08 2.30E+08 2.43E+07 2.75E+07
96 2.82E+08 2.69E+08 2.51E+08 2.68E+08 1.56E+07 1.77E+07
108 3.12E+08 2.49E+08 2.81E+08 2.81E+08 3.16E+07 3.57E+07
120 3.05E+08 2.39E+08 3.01E+08 2.82E+08 3.70E+07 4.19E+07
Table F.22. Pyruvate concentrations ( M) in medium containing 10 mM potassium
tetrathionate, 20 M pyruvate, and a head space pressurized to 1 atmosphere carbon
dioxide.
Trail 1 Trial 2 Trial 3 Average STDEV 95% CI
Initial concentration 22.75 20.04 18.04 20.28 2.36 2.68
Final pconcentration 7.24 5.68 5.68 6.20 0.91 1.02
Consumed 15.51 14.36 12.37 14.08 1.59 1.80
Required for cell growth na na na na na na
Carbon efficiency na na na na na na
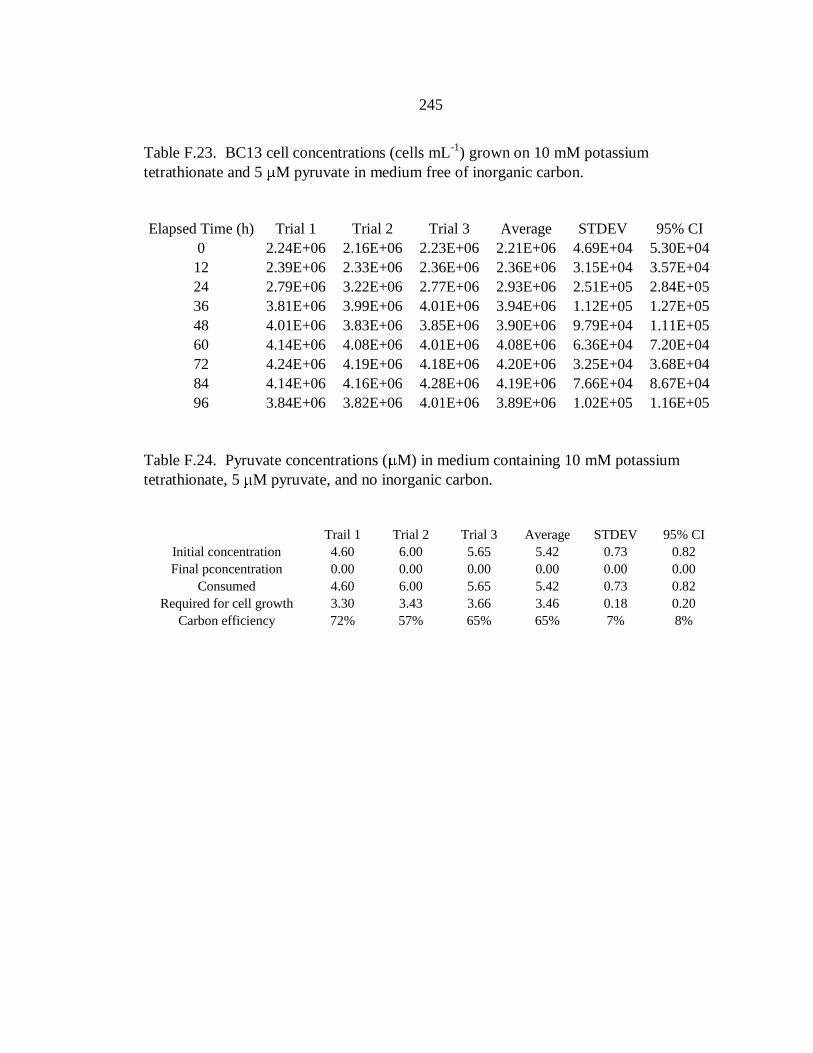
245
Table F.23. BC13 cell concentrations (cells mL-1
) grown on 10 mM potassium
tetrathionate and 5 M pyruvate in medium free of inorganic carbon.
Elapsed Time (h) Trial 1 Trial 2 Trial 3 Average STDEV 95% CI
0 2.24E+06 2.16E+06 2.23E+06 2.21E+06 4.69E+04 5.30E+04
12 2.39E+06 2.33E+06 2.36E+06 2.36E+06 3.15E+04 3.57E+04
24 2.79E+06 3.22E+06 2.77E+06 2.93E+06 2.51E+05 2.84E+05
36 3.81E+06 3.99E+06 4.01E+06 3.94E+06 1.12E+05 1.27E+05
48 4.01E+06 3.83E+06 3.85E+06 3.90E+06 9.79E+04 1.11E+05
60 4.14E+06 4.08E+06 4.01E+06 4.08E+06 6.36E+04 7.20E+04
72 4.24E+06 4.19E+06 4.18E+06 4.20E+06 3.25E+04 3.68E+04
84 4.14E+06 4.16E+06 4.28E+06 4.19E+06 7.66E+04 8.67E+04
96 3.84E+06 3.82E+06 4.01E+06 3.89E+06 1.02E+05 1.16E+05
Table F.24. Pyruvate concentrations ( M) in medium containing 10 mM potassium
tetrathionate, 5 M pyruvate, and no inorganic carbon.
Trail 1 Trial 2 Trial 3 Average STDEV 95% CI
Initial concentration 4.60 6.00 5.65 5.42 0.73 0.82
Final pconcentration 0.00 0.00 0.00 0.00 0.00 0.00
Consumed 4.60 6.00 5.65 5.42 0.73 0.82
Required for cell growth 3.30 3.43 3.66 3.46 0.18 0.20
Carbon efficiency 72% 57% 65% 65% 7% 8%
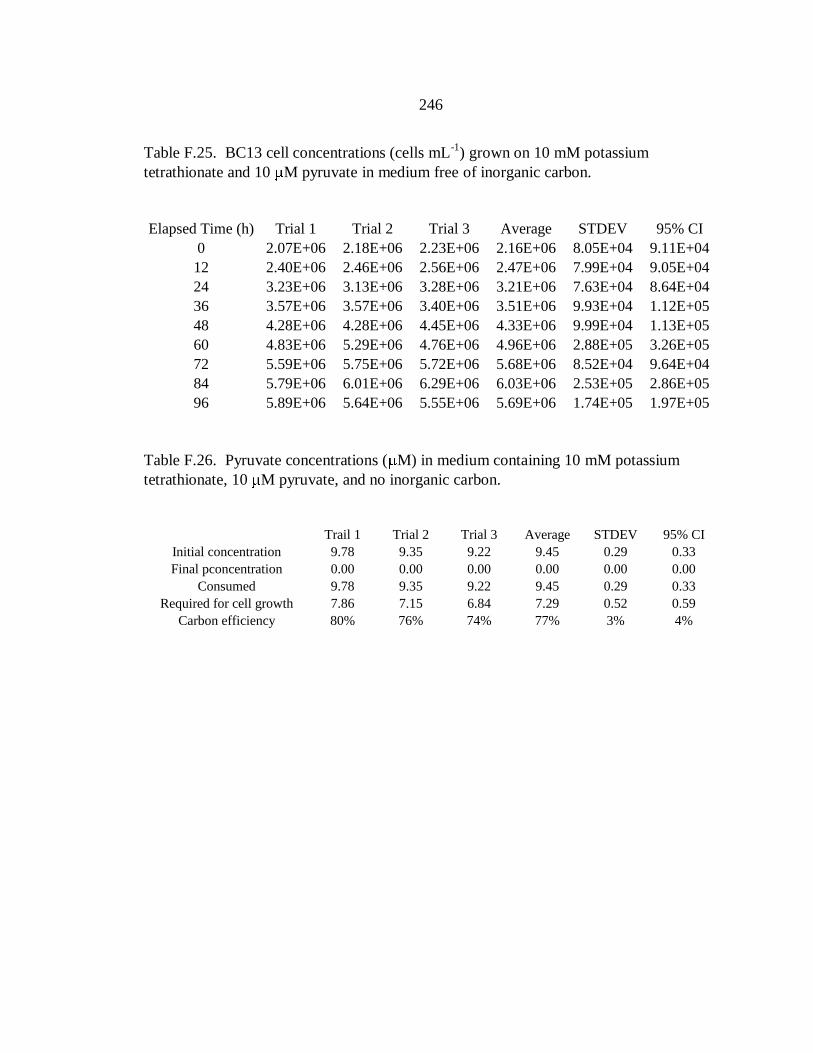
246
Table F.25. BC13 cell concentrations (cells mL-1
) grown on 10 mM potassium
tetrathionate and 10 M pyruvate in medium free of inorganic carbon.
Elapsed Time (h) Trial 1 Trial 2 Trial 3 Average STDEV 95% CI
0 2.07E+06 2.18E+06 2.23E+06 2.16E+06 8.05E+04 9.11E+04
12 2.40E+06 2.46E+06 2.56E+06 2.47E+06 7.99E+04 9.05E+04
24 3.23E+06 3.13E+06 3.28E+06 3.21E+06 7.63E+04 8.64E+04
36 3.57E+06 3.57E+06 3.40E+06 3.51E+06 9.93E+04 1.12E+05
48 4.28E+06 4.28E+06 4.45E+06 4.33E+06 9.99E+04 1.13E+05
60 4.83E+06 5.29E+06 4.76E+06 4.96E+06 2.88E+05 3.26E+05
72 5.59E+06 5.75E+06 5.72E+06 5.68E+06 8.52E+04 9.64E+04
84 5.79E+06 6.01E+06 6.29E+06 6.03E+06 2.53E+05 2.86E+05
96 5.89E+06 5.64E+06 5.55E+06 5.69E+06 1.74E+05 1.97E+05
Table F.26. Pyruvate concentrations ( M) in medium containing 10 mM potassium
tetrathionate, 10 M pyruvate, and no inorganic carbon.
Trail 1 Trial 2 Trial 3 Average STDEV 95% CI
Initial concentration 9.78 9.35 9.22 9.45 0.29 0.33
Final pconcentration 0.00 0.00 0.00 0.00 0.00 0.00
Consumed 9.78 9.35 9.22 9.45 0.29 0.33
Required for cell growth 7.86 7.15 6.84 7.29 0.52 0.59
Carbon efficiency 80% 76% 74% 77% 3% 4%

247
Table F.27. BC13 cell concentrations (cells mL-1
) grown on 10 mM potassium
tetrathionate and 15 M pyruvate in medium free of inorganic carbon.
Elapsed Time (h) Trial 1 Trial 2 Trial 3 Average STDEV 95% CI
0 2.25E+06 2.28E+06 2.28E+06 2.27E+06 1.74E+04 1.97E+04
12 2.51E+06 2.60E+06 3.07E+06 2.73E+06 2.98E+05 3.37E+05
24 2.65E+06 3.68E+06 3.30E+06 3.21E+06 5.22E+05 5.90E+05
36 3.73E+06 4.58E+06 4.11E+06 4.14E+06 4.25E+05 4.81E+05
48 5.15E+06 5.78E+06 6.10E+06 5.68E+06 4.86E+05 5.50E+05
60 6.35E+06 6.60E+06 6.99E+06 6.65E+06 3.26E+05 3.69E+05
72 6.81E+06 6.41E+06 6.02E+06 6.41E+06 3.92E+05 4.43E+05
84 6.71E+06 7.27E+06 7.27E+06 7.08E+06 3.25E+05 3.68E+05
96 6.31E+06 7.07E+06 6.87E+06 6.75E+06 3.96E+05 4.48E+05
Table F.28. Pyruvate concentrations ( M) in medium containing 10 mM potassium
tetrathionate, 15 M pyruvate, and no inorganic carbon.
Trail 1 Trial 2 Trial 3 Average STDEV 95% CI
Initial concentration 15.61 16.41 15.86 15.96 0.41 0.46
Final pconcentration 4.03 5.38 3.18 4.20 1.11 1.26
Consumed 11.58 11.03 12.68 11.77 0.84 0.95
Required for cell growth 8.37 9.89 9.46 9.24 0.78 0.89
Carbon efficiency 72% 90% 75% 79% 9% 11%
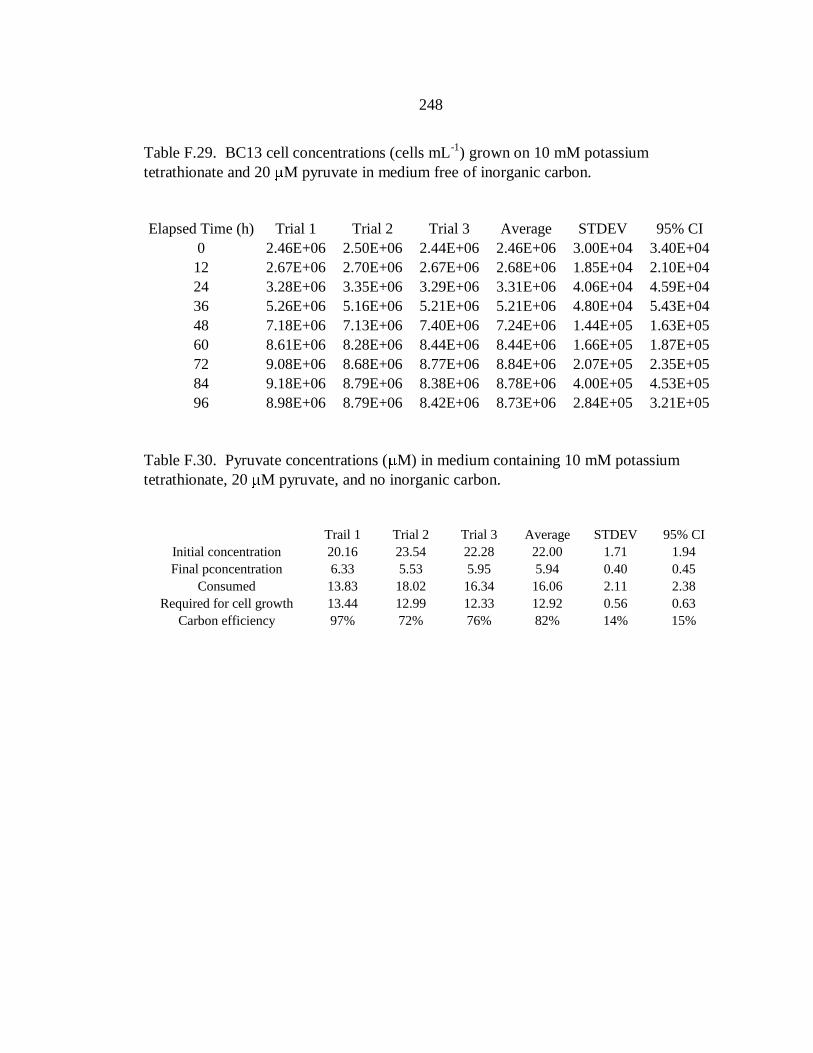
248
Table F.29. BC13 cell concentrations (cells mL-1
) grown on 10 mM potassium
tetrathionate and 20 M pyruvate in medium free of inorganic carbon.
Elapsed Time (h) Trial 1 Trial 2 Trial 3 Average STDEV 95% CI
0 2.46E+06 2.50E+06 2.44E+06 2.46E+06 3.00E+04 3.40E+04
12 2.67E+06 2.70E+06 2.67E+06 2.68E+06 1.85E+04 2.10E+04
24 3.28E+06 3.35E+06 3.29E+06 3.31E+06 4.06E+04 4.59E+04
36 5.26E+06 5.16E+06 5.21E+06 5.21E+06 4.80E+04 5.43E+04
48 7.18E+06 7.13E+06 7.40E+06 7.24E+06 1.44E+05 1.63E+05
60 8.61E+06 8.28E+06 8.44E+06 8.44E+06 1.66E+05 1.87E+05
72 9.08E+06 8.68E+06 8.77E+06 8.84E+06 2.07E+05 2.35E+05
84 9.18E+06 8.79E+06 8.38E+06 8.78E+06 4.00E+05 4.53E+05
96 8.98E+06 8.79E+06 8.42E+06 8.73E+06 2.84E+05 3.21E+05
Table F.30. Pyruvate concentrations ( M) in medium containing 10 mM potassium
tetrathionate, 20 M pyruvate, and no inorganic carbon.
Trail 1 Trial 2 Trial 3 Average STDEV 95% CI
Initial concentration 20.16 23.54 22.28 22.00 1.71 1.94
Final pconcentration 6.33 5.53 5.95 5.94 0.40 0.45
Consumed 13.83 18.02 16.34 16.06 2.11 2.38
Required for cell growth 13.44 12.99 12.33 12.92 0.56 0.63
Carbon efficiency 97% 72% 76% 82% 14% 15%

249
Toxicity of Organic Acids at Lower Concentrations (≤50 M)
BC13 cell concentrations with time when grown in the presence of varying
concentrations of different organic acids. Experiments were repeated in triplicate and
average values, standard deviations (STDEV), and 95% confidence intervals (95% CI)
are shown. Specific growth rates were calculated using linear regressions and are shown
along with the corresponding STDEV and 95% CI to the right of the plots.
Pyruvate
Table F.31. BC13 growth in the presence of 5 M pyruvate.
Cells mL
-1ln (Cells mL
-1)
Elapsed Time (h) Trial 1 Trial 2 Trial 3 Average STDEV 95% CI Trial 1 Trial 2 Trial 3
0 5.00E+07 5.13E+07 4.98E+07 5.04E+07 8.03E+05 9.09E+05 17.73 17.75 17.72
12 5.21E+07 4.96E+07 5.03E+07 5.07E+07 1.30E+06 1.47E+06 17.77 17.72 17.73
24 7.06E+07 6.82E+07 6.67E+07 6.85E+07 1.97E+06 2.23E+06 18.07 18.04 18.02
36 9.52E+07 9.96E+07 1.01E+08 9.87E+07 3.20E+06 3.63E+06 18.37 18.42 18.43
48 1.15E+08 1.20E+08 1.21E+08 1.19E+08 2.94E+06 3.32E+06 18.56 18.60 18.61
60 2.28E+08 2.34E+08 2.16E+08 2.26E+08 9.04E+06 1.02E+07 19.24 19.27 19.19
72 2.74E+08 2.83E+08 2.54E+08 2.70E+08 1.48E+07 1.67E+07 19.43 19.46 19.35
84 3.04E+08 2.95E+08 2.98E+08 2.99E+08 4.70E+06 5.32E+06 19.53 19.50 19.51
96 3.31E+08 2.85E+08 3.14E+08 3.10E+08 2.30E+07 2.60E+07 19.62 19.47 19.57
108 3.02E+08 2.65E+08 3.24E+08 2.97E+08 2.98E+07 3.37E+07 19.52 19.40 19.60
120 3.00E+08 2.90E+08 3.18E+08 3.03E+08 1.41E+07 1.59E+07 19.52 19.49 19.58
Specific growth rate (h-1
)
Trial 1 0.029
Trial 2 0.030
Trial 3 0.028
Average 0.029
STDEV 0.001
95% CI 0.001
y = 0.0286x + 17.374
y = 0.03x + 17.326
y = 0.0281x + 17.376
17.5
18.0
18.5
19.0
19.5
20.0
0 20 40 60 80
Elapsed time (h)
ln [
Cel
ls m
L-1
]
Figure F.1. Specific growth rate calculations for Trial 1 (open circles), Trial 2 (open
squares), and Trial 3 (open triangles).

250
Table F.32. BC13 growth in the presence of 10 M pyruvate.
Cells mL
-1ln (Cells mL
-1)
Elapsed Time (h) Trial 1 Trial 2 Trial 3 Average STDEV 95% CI Trial 1 Trial 2 Trial 3
0 5.13E+07 5.42E+07 5.42E+07 5.32E+07 1.64E+06 1.86E+06 17.75 17.81 17.81
12 5.10E+07 5.74E+07 5.73E+07 5.52E+07 3.66E+06 4.14E+06 17.75 17.87 17.86
24 6.92E+07 6.92E+07 7.57E+07 7.14E+07 3.73E+06 4.22E+06 18.05 18.05 18.14
36 1.21E+08 7.83E+07 7.69E+07 9.21E+07 2.51E+07 2.84E+07 18.61 18.18 18.16
48 1.55E+08 1.63E+08 1.10E+08 1.42E+08 2.88E+07 3.25E+07 18.86 18.91 18.51
60 2.18E+08 2.23E+08 2.15E+08 2.19E+08 4.17E+06 4.72E+06 19.20 19.22 19.19
72 2.67E+08 2.83E+08 2.55E+08 2.68E+08 1.40E+07 1.58E+07 19.40 19.46 19.36
84 2.93E+08 2.96E+08 3.02E+08 2.97E+08 4.79E+06 5.42E+06 19.50 19.51 19.53
96 3.20E+08 3.23E+08 3.59E+08 3.34E+08 2.15E+07 2.43E+07 19.58 19.59 19.70
108 3.27E+08 3.31E+08 3.58E+08 3.39E+08 1.71E+07 1.93E+07 19.61 19.62 19.70
120 3.11E+08 3.03E+08 3.21E+08 3.11E+08 9.08E+06 1.03E+07 19.55 19.53 19.59
17.5
18.0
18.5
19.0
19.5
20.0
0 20 40 60 80
ln [
Cel
ls m
L-1
]
Specific growth rate (h-1
)
Trial 1 0.029
Trial 2 0.029
Trial 3 0.026
Average 0.028
STDEV 0.002
95% CI 0.002
y = 0.0285x + 17.449
y = 0.0291x + 17.392
y = 0.0261x + 17.441
17.5
18.0
18.5
19.0
19.5
20.0
0 20 40 60 80
Elapsed time (h)
ln [
Cel
ls m
L-1
]
Figure F.2. Specific growth rate calculations for Trial 1 (open circles), Trial 2 (open
squares), and Trial 3 (open triangles).

251
Table F.33. BC13 growth in the presence of 20 M pyruvate.
Cells mL
-1ln (Cells mL
-1)
Elapsed Time (h) Trial 1 Trial 2 Trial 3 Average STDEV 95% CI Trial 1 Trial 2 Trial 3
0 5.00E+07 5.82E+07 5.73E+07 5.52E+07 4.48E+06 5.06E+06 17.73 17.88 17.86
12 4.85E+07 4.92E+07 4.46E+07 4.75E+07 2.48E+06 2.81E+06 17.70 17.71 17.61
24 7.01E+07 6.00E+07 6.55E+07 6.52E+07 5.07E+06 5.74E+06 18.07 17.91 18.00
36 1.26E+08 1.04E+08 9.69E+07 1.09E+08 1.52E+07 1.72E+07 18.65 18.46 18.39
48 1.61E+08 1.49E+08 1.47E+08 1.52E+08 7.38E+06 8.35E+06 18.90 18.82 18.81
60 2.08E+08 1.83E+08 1.73E+08 1.88E+08 1.81E+07 2.04E+07 19.15 19.03 18.97
72 2.70E+08 2.52E+08 2.45E+08 2.56E+08 1.30E+07 1.47E+07 19.41 19.34 19.32
84 2.89E+08 2.51E+08 2.77E+08 2.72E+08 1.93E+07 2.19E+07 19.48 19.34 19.44
96 3.34E+08 3.67E+08 3.08E+08 3.36E+08 2.94E+07 3.33E+07 19.63 19.72 19.55
108 3.30E+08 3.17E+08 3.16E+08 3.21E+08 7.50E+06 8.49E+06 19.61 19.57 19.57
120 3.12E+08 3.22E+08 3.21E+08 3.19E+08 5.29E+06 5.99E+06 19.56 19.59 19.59
17.5
18.0
18.5
19.0
19.5
20.0
0 20 40 60 80 100 120
ln [
Cel
ls m
L-1
]
Specific growth rate (h-1
)
Trial 1 0.023
Trial 2 0.024
Trial 3 0.025
Average 0.024
STDEV 0.001
95% CI 0.001
y = 0.0229x + 17.635
y = 0.0239x + 17.501
y = 0.0235x + 17.491
17.5
18.0
18.5
19.0
19.5
20.0
0 20 40 60 80 100 120
Elapsed time (h)
ln [
Cel
ls m
L-1
]
Figure F.3. Specific growth rate calculations for Trial 1 (open circles), Trial 2 (open
squares), and Trial 3 (open triangles).
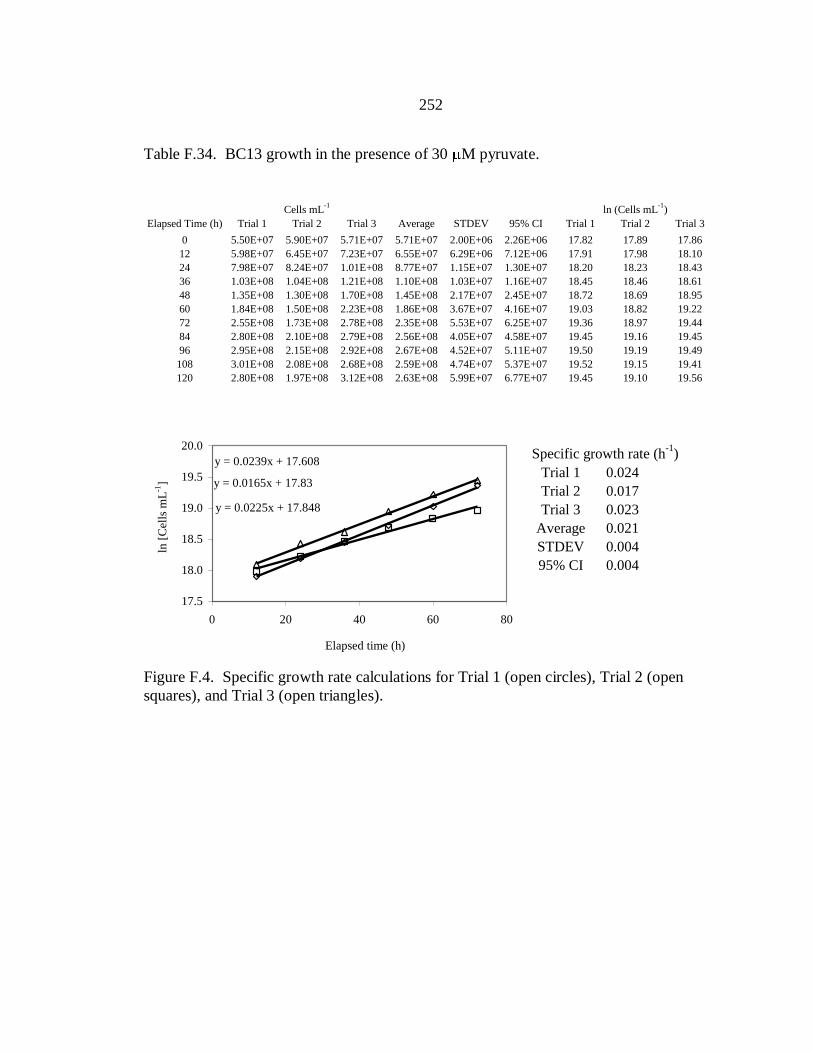
252
Table F.34. BC13 growth in the presence of 30 M pyruvate.
Cells mL
-1ln (Cells mL
-1)
Elapsed Time (h) Trial 1 Trial 2 Trial 3 Average STDEV 95% CI Trial 1 Trial 2 Trial 3
0 5.50E+07 5.90E+07 5.71E+07 5.71E+07 2.00E+06 2.26E+06 17.82 17.89 17.86
12 5.98E+07 6.45E+07 7.23E+07 6.55E+07 6.29E+06 7.12E+06 17.91 17.98 18.10
24 7.98E+07 8.24E+07 1.01E+08 8.77E+07 1.15E+07 1.30E+07 18.20 18.23 18.43
36 1.03E+08 1.04E+08 1.21E+08 1.10E+08 1.03E+07 1.16E+07 18.45 18.46 18.61
48 1.35E+08 1.30E+08 1.70E+08 1.45E+08 2.17E+07 2.45E+07 18.72 18.69 18.95
60 1.84E+08 1.50E+08 2.23E+08 1.86E+08 3.67E+07 4.16E+07 19.03 18.82 19.22
72 2.55E+08 1.73E+08 2.78E+08 2.35E+08 5.53E+07 6.25E+07 19.36 18.97 19.44
84 2.80E+08 2.10E+08 2.79E+08 2.56E+08 4.05E+07 4.58E+07 19.45 19.16 19.45
96 2.95E+08 2.15E+08 2.92E+08 2.67E+08 4.52E+07 5.11E+07 19.50 19.19 19.49
108 3.01E+08 2.08E+08 2.68E+08 2.59E+08 4.74E+07 5.37E+07 19.52 19.15 19.41
120 2.80E+08 1.97E+08 3.12E+08 2.63E+08 5.99E+07 6.77E+07 19.45 19.10 19.56
Specific growth rate (h-1
)
Trial 1 0.024
Trial 2 0.017
Trial 3 0.023
Average 0.021
STDEV 0.004
95% CI 0.004
y = 0.0239x + 17.608
y = 0.0165x + 17.83
y = 0.0225x + 17.848
17.5
18.0
18.5
19.0
19.5
20.0
0 20 40 60 80
Elapsed time (h)
ln [
Cel
ls m
L-1
]
Figure F.4. Specific growth rate calculations for Trial 1 (open circles), Trial 2 (open
squares), and Trial 3 (open triangles).
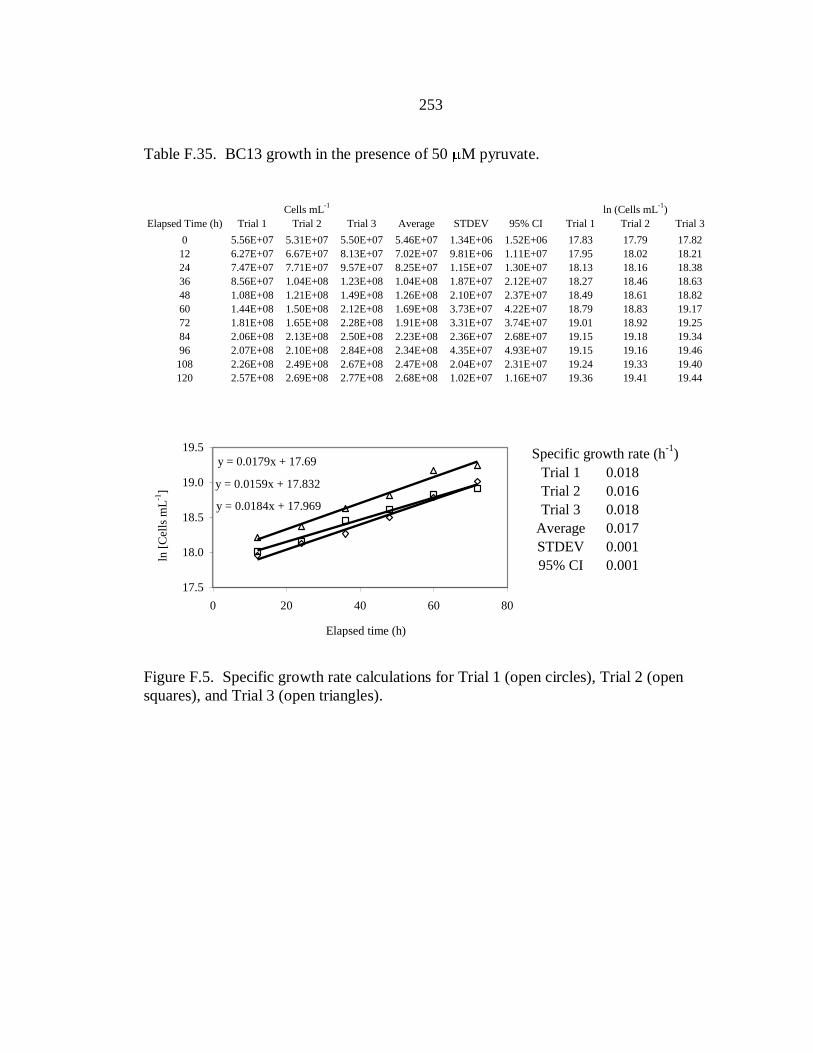
253
Table F.35. BC13 growth in the presence of 50 M pyruvate.
Cells mL
-1ln (Cells mL
-1)
Elapsed Time (h) Trial 1 Trial 2 Trial 3 Average STDEV 95% CI Trial 1 Trial 2 Trial 3
0 5.56E+07 5.31E+07 5.50E+07 5.46E+07 1.34E+06 1.52E+06 17.83 17.79 17.82
12 6.27E+07 6.67E+07 8.13E+07 7.02E+07 9.81E+06 1.11E+07 17.95 18.02 18.21
24 7.47E+07 7.71E+07 9.57E+07 8.25E+07 1.15E+07 1.30E+07 18.13 18.16 18.38
36 8.56E+07 1.04E+08 1.23E+08 1.04E+08 1.87E+07 2.12E+07 18.27 18.46 18.63
48 1.08E+08 1.21E+08 1.49E+08 1.26E+08 2.10E+07 2.37E+07 18.49 18.61 18.82
60 1.44E+08 1.50E+08 2.12E+08 1.69E+08 3.73E+07 4.22E+07 18.79 18.83 19.17
72 1.81E+08 1.65E+08 2.28E+08 1.91E+08 3.31E+07 3.74E+07 19.01 18.92 19.25
84 2.06E+08 2.13E+08 2.50E+08 2.23E+08 2.36E+07 2.68E+07 19.15 19.18 19.34
96 2.07E+08 2.10E+08 2.84E+08 2.34E+08 4.35E+07 4.93E+07 19.15 19.16 19.46
108 2.26E+08 2.49E+08 2.67E+08 2.47E+08 2.04E+07 2.31E+07 19.24 19.33 19.40
120 2.57E+08 2.69E+08 2.77E+08 2.68E+08 1.02E+07 1.16E+07 19.36 19.41 19.44
Specific growth rate (h-1
)
Trial 1 0.018
Trial 2 0.016
Trial 3 0.018
Average 0.017
STDEV 0.001
95% CI 0.001
y = 0.0179x + 17.69
y = 0.0159x + 17.832
y = 0.0184x + 17.969
17.5
18.0
18.5
19.0
19.5
0 20 40 60 80
Elapsed time (h)
ln [
Cel
ls m
L-1
]
Figure F.5. Specific growth rate calculations for Trial 1 (open circles), Trial 2 (open
squares), and Trial 3 (open triangles).
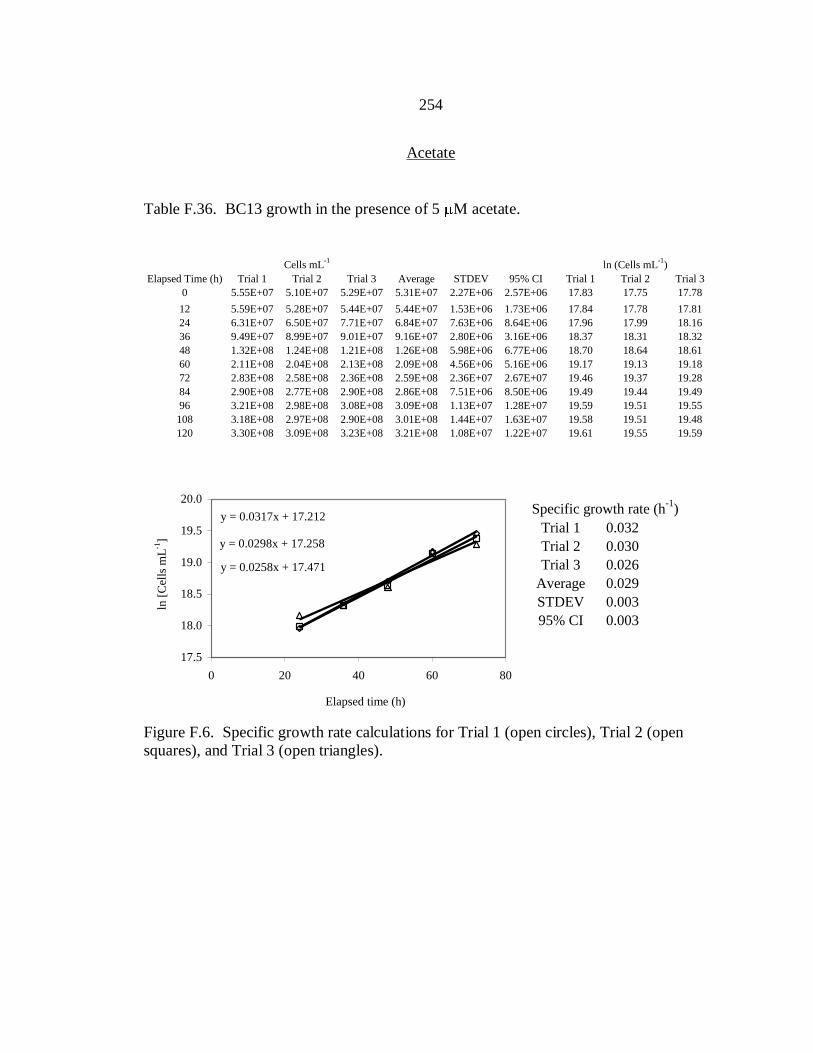
254
Acetate
Table F.36. BC13 growth in the presence of 5 M acetate.
Cells mL
-1ln (Cells mL
-1)
Elapsed Time (h) Trial 1 Trial 2 Trial 3 Average STDEV 95% CI Trial 1 Trial 2 Trial 3
0 5.55E+07 5.10E+07 5.29E+07 5.31E+07 2.27E+06 2.57E+06 17.83 17.75 17.78
12 5.59E+07 5.28E+07 5.44E+07 5.44E+07 1.53E+06 1.73E+06 17.84 17.78 17.81
24 6.31E+07 6.50E+07 7.71E+07 6.84E+07 7.63E+06 8.64E+06 17.96 17.99 18.16
36 9.49E+07 8.99E+07 9.01E+07 9.16E+07 2.80E+06 3.16E+06 18.37 18.31 18.32
48 1.32E+08 1.24E+08 1.21E+08 1.26E+08 5.98E+06 6.77E+06 18.70 18.64 18.61
60 2.11E+08 2.04E+08 2.13E+08 2.09E+08 4.56E+06 5.16E+06 19.17 19.13 19.18
72 2.83E+08 2.58E+08 2.36E+08 2.59E+08 2.36E+07 2.67E+07 19.46 19.37 19.28
84 2.90E+08 2.77E+08 2.90E+08 2.86E+08 7.51E+06 8.50E+06 19.49 19.44 19.49
96 3.21E+08 2.98E+08 3.08E+08 3.09E+08 1.13E+07 1.28E+07 19.59 19.51 19.55
108 3.18E+08 2.97E+08 2.90E+08 3.01E+08 1.44E+07 1.63E+07 19.58 19.51 19.48
120 3.30E+08 3.09E+08 3.23E+08 3.21E+08 1.08E+07 1.22E+07 19.61 19.55 19.59
Specific growth rate (h-1
)
Trial 1 0.032
Trial 2 0.030
Trial 3 0.026
Average 0.029
STDEV 0.003
95% CI 0.003
y = 0.0317x + 17.212
y = 0.0298x + 17.258
y = 0.0258x + 17.471
17.5
18.0
18.5
19.0
19.5
20.0
0 20 40 60 80
Elapsed time (h)
ln [
Cel
ls m
L-1
]
Figure F.6. Specific growth rate calculations for Trial 1 (open circles), Trial 2 (open
squares), and Trial 3 (open triangles).
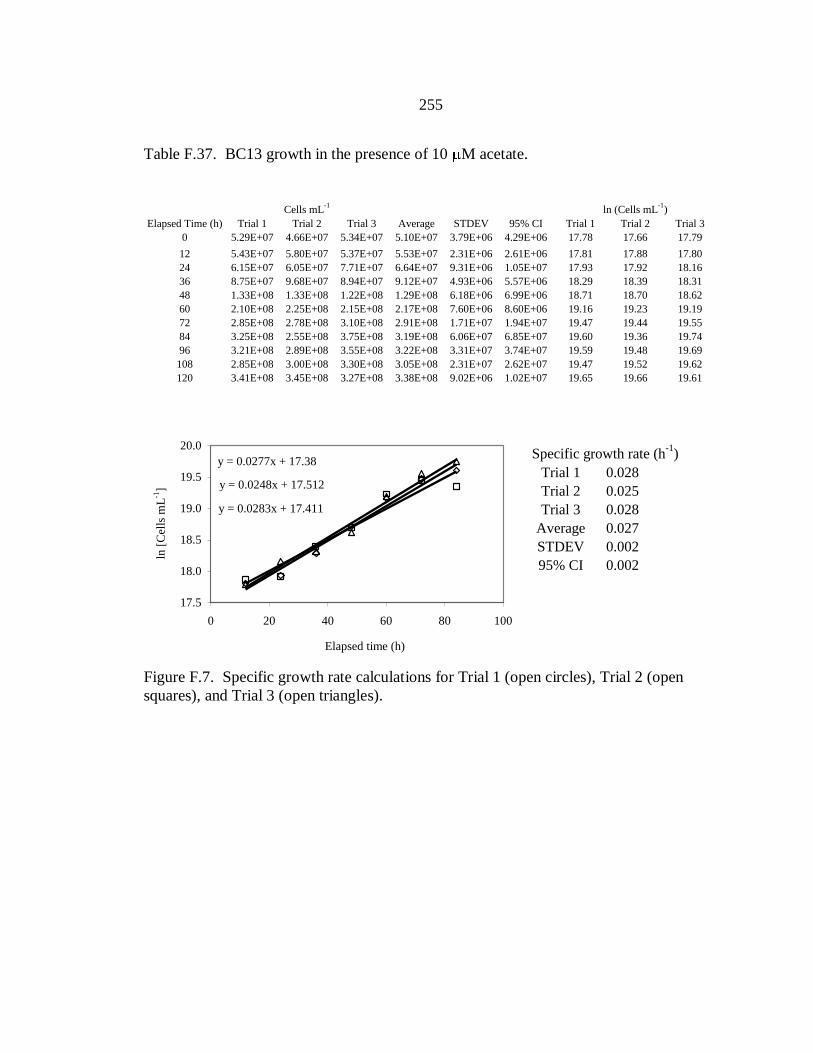
255
Table F.37. BC13 growth in the presence of 10 M acetate.
Cells mL
-1ln (Cells mL
-1)
Elapsed Time (h) Trial 1 Trial 2 Trial 3 Average STDEV 95% CI Trial 1 Trial 2 Trial 3
0 5.29E+07 4.66E+07 5.34E+07 5.10E+07 3.79E+06 4.29E+06 17.78 17.66 17.79
12 5.43E+07 5.80E+07 5.37E+07 5.53E+07 2.31E+06 2.61E+06 17.81 17.88 17.80
24 6.15E+07 6.05E+07 7.71E+07 6.64E+07 9.31E+06 1.05E+07 17.93 17.92 18.16
36 8.75E+07 9.68E+07 8.94E+07 9.12E+07 4.93E+06 5.57E+06 18.29 18.39 18.31
48 1.33E+08 1.33E+08 1.22E+08 1.29E+08 6.18E+06 6.99E+06 18.71 18.70 18.62
60 2.10E+08 2.25E+08 2.15E+08 2.17E+08 7.60E+06 8.60E+06 19.16 19.23 19.19
72 2.85E+08 2.78E+08 3.10E+08 2.91E+08 1.71E+07 1.94E+07 19.47 19.44 19.55
84 3.25E+08 2.55E+08 3.75E+08 3.19E+08 6.06E+07 6.85E+07 19.60 19.36 19.74
96 3.21E+08 2.89E+08 3.55E+08 3.22E+08 3.31E+07 3.74E+07 19.59 19.48 19.69
108 2.85E+08 3.00E+08 3.30E+08 3.05E+08 2.31E+07 2.62E+07 19.47 19.52 19.62
120 3.41E+08 3.45E+08 3.27E+08 3.38E+08 9.02E+06 1.02E+07 19.65 19.66 19.61
17.5
18.0
18.5
19.0
19.5
20.0
0 20 40 60 80 100
ln [
Cel
ls m
L-1
]
Specific growth rate (h-1
)
Trial 1 0.028
Trial 2 0.025
Trial 3 0.028
Average 0.027
STDEV 0.002
95% CI 0.002
y = 0.0277x + 17.38
y = 0.0248x + 17.512
y = 0.0283x + 17.411
17.5
18.0
18.5
19.0
19.5
20.0
0 20 40 60 80 100
Elapsed time (h)
ln [
Cel
ls m
L-1
]
Figure F.7. Specific growth rate calculations for Trial 1 (open circles), Trial 2 (open
squares), and Trial 3 (open triangles).
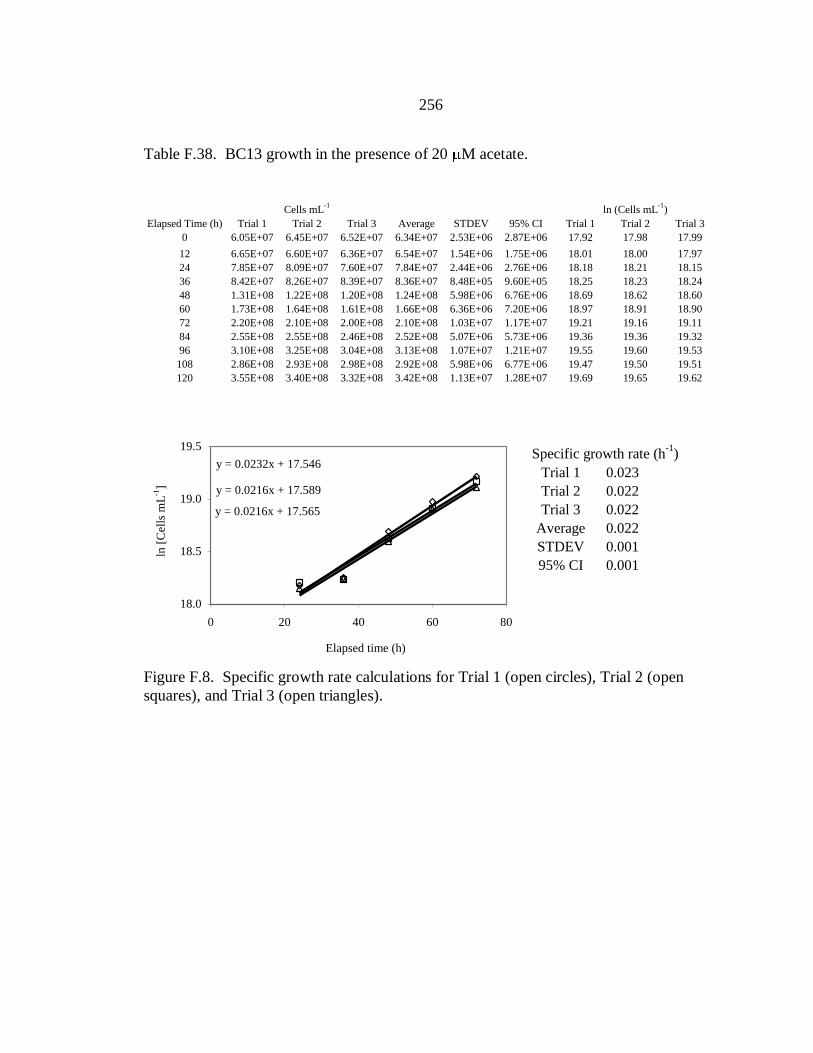
256
Table F.38. BC13 growth in the presence of 20 M acetate.
Cells mL
-1ln (Cells mL
-1)
Elapsed Time (h) Trial 1 Trial 2 Trial 3 Average STDEV 95% CI Trial 1 Trial 2 Trial 3
0 6.05E+07 6.45E+07 6.52E+07 6.34E+07 2.53E+06 2.87E+06 17.92 17.98 17.99
12 6.65E+07 6.60E+07 6.36E+07 6.54E+07 1.54E+06 1.75E+06 18.01 18.00 17.97
24 7.85E+07 8.09E+07 7.60E+07 7.84E+07 2.44E+06 2.76E+06 18.18 18.21 18.15
36 8.42E+07 8.26E+07 8.39E+07 8.36E+07 8.48E+05 9.60E+05 18.25 18.23 18.24
48 1.31E+08 1.22E+08 1.20E+08 1.24E+08 5.98E+06 6.76E+06 18.69 18.62 18.60
60 1.73E+08 1.64E+08 1.61E+08 1.66E+08 6.36E+06 7.20E+06 18.97 18.91 18.90
72 2.20E+08 2.10E+08 2.00E+08 2.10E+08 1.03E+07 1.17E+07 19.21 19.16 19.11
84 2.55E+08 2.55E+08 2.46E+08 2.52E+08 5.07E+06 5.73E+06 19.36 19.36 19.32
96 3.10E+08 3.25E+08 3.04E+08 3.13E+08 1.07E+07 1.21E+07 19.55 19.60 19.53
108 2.86E+08 2.93E+08 2.98E+08 2.92E+08 5.98E+06 6.77E+06 19.47 19.50 19.51
120 3.55E+08 3.40E+08 3.32E+08 3.42E+08 1.13E+07 1.28E+07 19.69 19.65 19.62
18.0
18.5
19.0
19.5
0 20 40 60 80
ln [
Cel
ls m
L-1
]
Specific growth rate (h-1
)
Trial 1 0.023
Trial 2 0.022
Trial 3 0.022
Average 0.022
STDEV 0.001
95% CI 0.001
y = 0.0232x + 17.546
y = 0.0216x + 17.589
y = 0.0216x + 17.565
18.0
18.5
19.0
19.5
0 20 40 60 80
Elapsed time (h)
ln [
Cel
ls m
L-1
]
Figure F.8. Specific growth rate calculations for Trial 1 (open circles), Trial 2 (open
squares), and Trial 3 (open triangles).
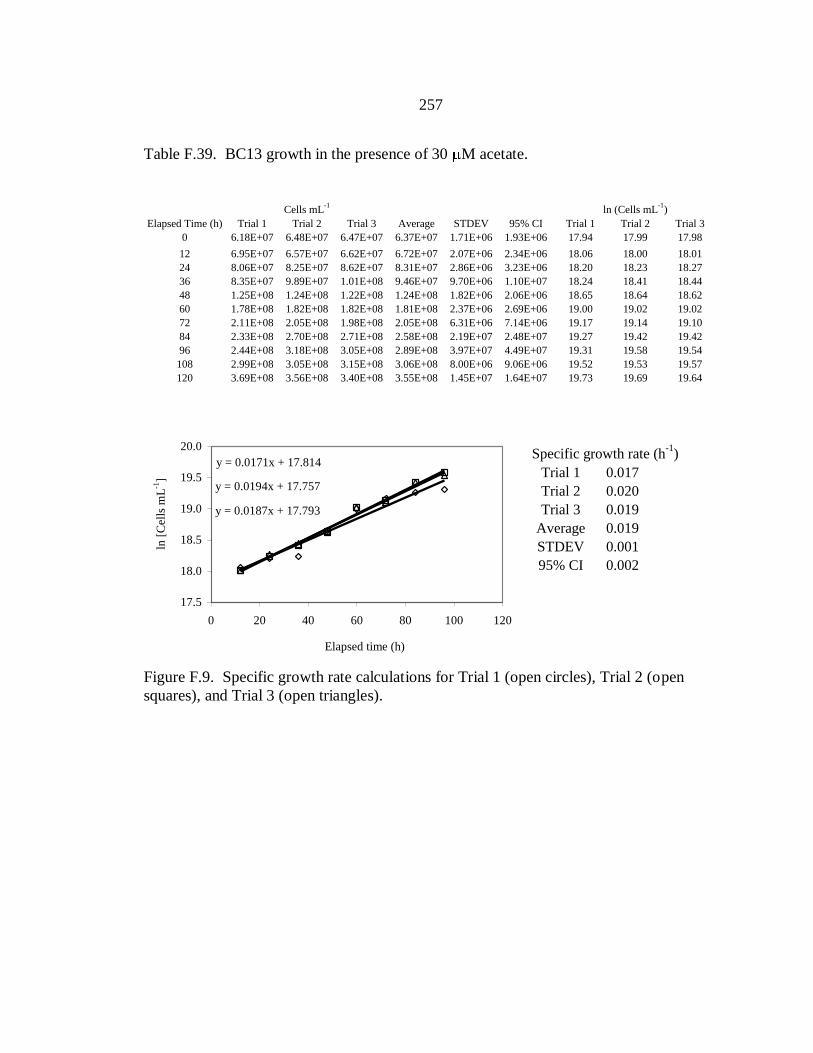
257
Table F.39. BC13 growth in the presence of 30 M acetate.
Cells mL
-1ln (Cells mL
-1)
Elapsed Time (h) Trial 1 Trial 2 Trial 3 Average STDEV 95% CI Trial 1 Trial 2 Trial 3
0 6.18E+07 6.48E+07 6.47E+07 6.37E+07 1.71E+06 1.93E+06 17.94 17.99 17.98
12 6.95E+07 6.57E+07 6.62E+07 6.72E+07 2.07E+06 2.34E+06 18.06 18.00 18.01
24 8.06E+07 8.25E+07 8.62E+07 8.31E+07 2.86E+06 3.23E+06 18.20 18.23 18.27
36 8.35E+07 9.89E+07 1.01E+08 9.46E+07 9.70E+06 1.10E+07 18.24 18.41 18.44
48 1.25E+08 1.24E+08 1.22E+08 1.24E+08 1.82E+06 2.06E+06 18.65 18.64 18.62
60 1.78E+08 1.82E+08 1.82E+08 1.81E+08 2.37E+06 2.69E+06 19.00 19.02 19.02
72 2.11E+08 2.05E+08 1.98E+08 2.05E+08 6.31E+06 7.14E+06 19.17 19.14 19.10
84 2.33E+08 2.70E+08 2.71E+08 2.58E+08 2.19E+07 2.48E+07 19.27 19.42 19.42
96 2.44E+08 3.18E+08 3.05E+08 2.89E+08 3.97E+07 4.49E+07 19.31 19.58 19.54
108 2.99E+08 3.05E+08 3.15E+08 3.06E+08 8.00E+06 9.06E+06 19.52 19.53 19.57
120 3.69E+08 3.56E+08 3.40E+08 3.55E+08 1.45E+07 1.64E+07 19.73 19.69 19.64
17.5
18.0
18.5
19.0
19.5
20.0
0 20 40 60 80 100 120
ln [
Cel
ls m
L-1
]
Specific growth rate (h-1
)
Trial 1 0.017
Trial 2 0.020
Trial 3 0.019
Average 0.019
STDEV 0.001
95% CI 0.002
y = 0.0171x + 17.814
y = 0.0194x + 17.757
y = 0.0187x + 17.793
17.5
18.0
18.5
19.0
19.5
20.0
0 20 40 60 80 100 120
Elapsed time (h)
ln [
Cel
ls m
L-1
]
Figure F.9. Specific growth rate calculations for Trial 1 (open circles), Trial 2 (open
squares), and Trial 3 (open triangles).
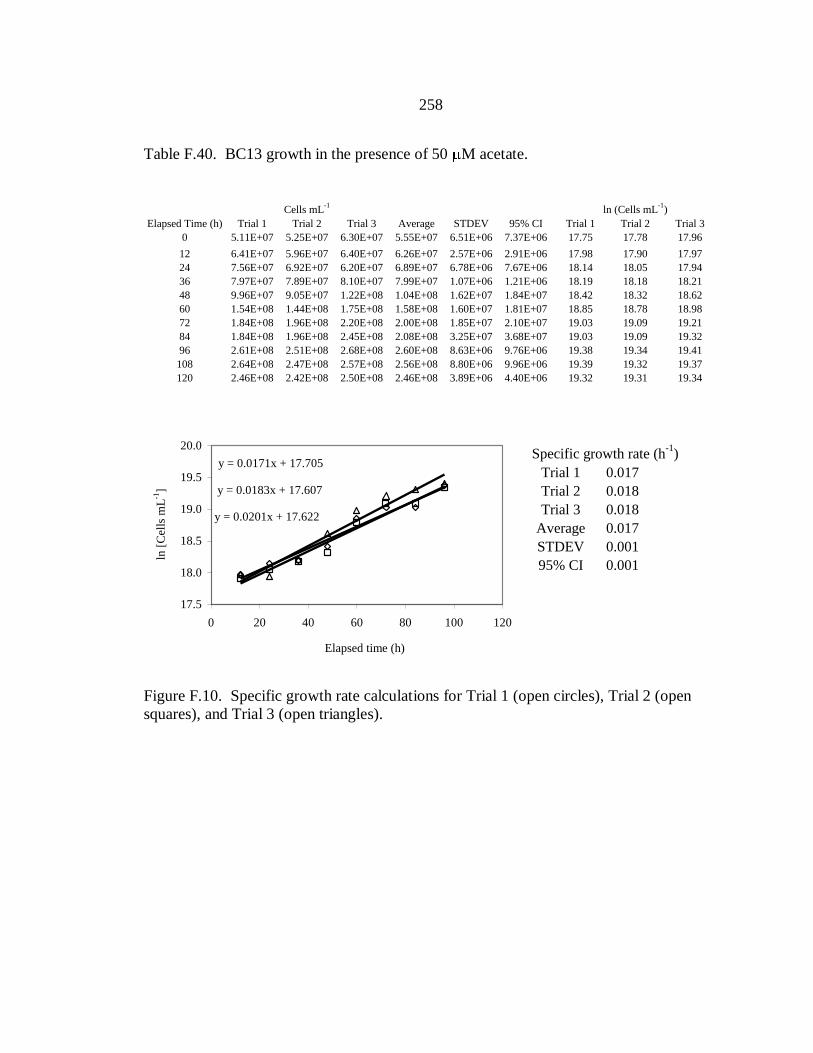
258
Table F.40. BC13 growth in the presence of 50 M acetate.
Cells mL
-1ln (Cells mL
-1)
Elapsed Time (h) Trial 1 Trial 2 Trial 3 Average STDEV 95% CI Trial 1 Trial 2 Trial 3
0 5.11E+07 5.25E+07 6.30E+07 5.55E+07 6.51E+06 7.37E+06 17.75 17.78 17.96
12 6.41E+07 5.96E+07 6.40E+07 6.26E+07 2.57E+06 2.91E+06 17.98 17.90 17.97
24 7.56E+07 6.92E+07 6.20E+07 6.89E+07 6.78E+06 7.67E+06 18.14 18.05 17.94
36 7.97E+07 7.89E+07 8.10E+07 7.99E+07 1.07E+06 1.21E+06 18.19 18.18 18.21
48 9.96E+07 9.05E+07 1.22E+08 1.04E+08 1.62E+07 1.84E+07 18.42 18.32 18.62
60 1.54E+08 1.44E+08 1.75E+08 1.58E+08 1.60E+07 1.81E+07 18.85 18.78 18.98
72 1.84E+08 1.96E+08 2.20E+08 2.00E+08 1.85E+07 2.10E+07 19.03 19.09 19.21
84 1.84E+08 1.96E+08 2.45E+08 2.08E+08 3.25E+07 3.68E+07 19.03 19.09 19.32
96 2.61E+08 2.51E+08 2.68E+08 2.60E+08 8.63E+06 9.76E+06 19.38 19.34 19.41
108 2.64E+08 2.47E+08 2.57E+08 2.56E+08 8.80E+06 9.96E+06 19.39 19.32 19.37
120 2.46E+08 2.42E+08 2.50E+08 2.46E+08 3.89E+06 4.40E+06 19.32 19.31 19.34
17.5
18.0
18.5
19.0
19.5
20.0
0 20 40 60 80 100 120
ln [
Cel
ls m
L-1
]
Specific growth rate (h-1
)
Trial 1 0.017
Trial 2 0.018
Trial 3 0.018
Average 0.017
STDEV 0.001
95% CI 0.001
y = 0.0171x + 17.705
y = 0.0183x + 17.607
y = 0.0201x + 17.622
17.5
18.0
18.5
19.0
19.5
20.0
0 20 40 60 80 100 120
Elapsed time (h)
ln [
Cel
ls m
L-1
]
Figure F.10. Specific growth rate calculations for Trial 1 (open circles), Trial 2 (open
squares), and Trial 3 (open triangles).

259
Citrate
Table F.41. BC13 growth in the presence of 5 M citrate.
Cells mL
-1ln (Cells mL
-1)
Elapsed Time (h) Trial 1 Trial 2 Trial 3 Average STDEV 95% CI Trial 1 Trial 2 Trial 3
0 5.36E+07 5.34E+07 5.51E+07 5.40E+07 9.60E+05 1.09E+06 17.80 17.79 17.83
12 5.48E+07 5.73E+07 5.71E+07 5.64E+07 1.40E+06 1.58E+06 17.82 17.86 17.86
24 6.51E+07 6.46E+07 6.62E+07 6.53E+07 8.11E+05 9.18E+05 17.99 17.98 18.01
36 9.01E+07 9.25E+07 9.70E+07 9.32E+07 3.51E+06 3.97E+06 18.32 18.34 18.39
48 1.35E+08 1.41E+08 1.44E+08 1.40E+08 4.61E+06 5.22E+06 18.72 18.76 18.78
60 2.13E+08 2.21E+08 2.16E+08 2.17E+08 4.46E+06 5.05E+06 19.17 19.22 19.19
72 2.55E+08 2.58E+08 2.37E+08 2.50E+08 1.13E+07 1.28E+07 19.36 19.37 19.29
84 2.97E+08 3.06E+08 3.11E+08 3.05E+08 6.91E+06 7.82E+06 19.51 19.54 19.56
96 3.23E+08 3.24E+08 3.18E+08 3.22E+08 3.57E+06 4.03E+06 19.59 19.60 19.58
108 3.25E+08 3.18E+08 3.16E+08 3.20E+08 4.93E+06 5.58E+06 19.60 19.58 19.57
120 3.17E+08 3.04E+08 3.00E+08 3.07E+08 8.68E+06 9.82E+06 19.57 19.53 19.52
Specific growth rate (h-1
)
Trial 1 0.030
Trial 2 0.030
Trial 3 0.028
Average 0.029
STDEV 0.001
95% CI 0.001
y = 0.0299x + 17.276
y = 0.0304x + 17.278
y = 0.0279x + 17.39
17.5
18.0
18.5
19.0
19.5
20.0
0 20 40 60 80
Elapsed time (h)
ln [
Cel
ls m
L-1
]
Figure F.11. Specific growth rate calculations for Trial 1 (open circles), Trial 2 (open
squares), and Trial 3 (open triangles).

260
Table F.42. BC13 growth in the presence of 10 M citrate.
Cells mL
-1ln (Cells mL
-1)
Elapsed Time (h) Trial 1 Trial 2 Trial 3 Average STDEV 95% CI Trial 1 Trial 2 Trial 3
0 5.60E+07 5.70E+07 5.66E+07 5.65E+07 5.17E+05 5.85E+05 17.84 17.86 17.85
12 5.36E+07 5.49E+07 5.64E+07 5.50E+07 1.39E+06 1.58E+06 17.80 17.82 17.85
24 6.30E+07 6.60E+07 6.49E+07 6.46E+07 1.49E+06 1.69E+06 17.96 18.00 17.99
36 8.96E+07 9.32E+07 9.08E+07 9.12E+07 1.83E+06 2.07E+06 18.31 18.35 18.32
48 1.40E+08 1.36E+08 1.34E+08 1.37E+08 3.22E+06 3.64E+06 18.76 18.73 18.71
60 2.12E+08 2.11E+08 2.08E+08 2.11E+08 2.40E+06 2.71E+06 19.17 19.17 19.15
72 2.56E+08 2.44E+08 2.41E+08 2.47E+08 8.16E+06 9.23E+06 19.36 19.31 19.30
84 2.94E+08 2.85E+08 2.97E+08 2.92E+08 6.08E+06 6.88E+06 19.50 19.47 19.51
96 3.38E+08 3.32E+08 3.15E+08 3.29E+08 1.18E+07 1.34E+07 19.64 19.62 19.57
108 3.25E+08 3.30E+08 3.35E+08 3.30E+08 4.90E+06 5.54E+06 19.60 19.61 19.63
120 3.20E+08 3.12E+08 3.26E+08 3.19E+08 6.80E+06 7.70E+06 19.58 19.56 19.6017.5
18.0
18.5
19.0
19.5
20.0
0 20 40 60 80 100
ln [
Cel
ls m
L-1
]
Specific growth rate (h-1
)
Trial 1 0.026
Trial 2 0.025
Trial 3 0.025
Average 0.025
STDEV 0.001
95% CI 0.001
y = 0.0261x + 17.442
y = 0.0249x + 17.496
y = 0.0251x + 17.486
17.5
18.0
18.5
19.0
19.5
20.0
0 20 40 60 80 100
Elapsed time (h)
ln [
Cel
ls m
L-1
]
Figure F.12. Specific growth rate calculations for Trial 1 (open circles), Trial 2 (open
squares), and Trial 3 (open triangles).
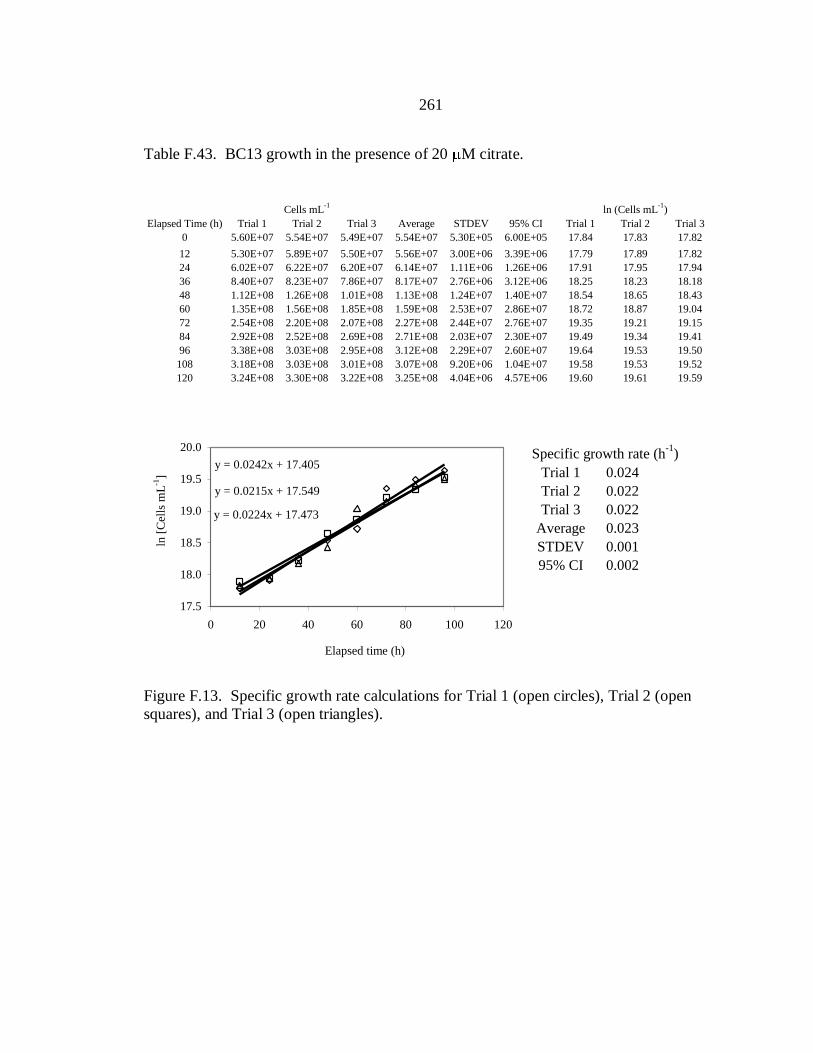
261
Table F.43. BC13 growth in the presence of 20 M citrate.
Cells mL
-1ln (Cells mL
-1)
Elapsed Time (h) Trial 1 Trial 2 Trial 3 Average STDEV 95% CI Trial 1 Trial 2 Trial 3
0 5.60E+07 5.54E+07 5.49E+07 5.54E+07 5.30E+05 6.00E+05 17.84 17.83 17.82
12 5.30E+07 5.89E+07 5.50E+07 5.56E+07 3.00E+06 3.39E+06 17.79 17.89 17.82
24 6.02E+07 6.22E+07 6.20E+07 6.14E+07 1.11E+06 1.26E+06 17.91 17.95 17.94
36 8.40E+07 8.23E+07 7.86E+07 8.17E+07 2.76E+06 3.12E+06 18.25 18.23 18.18
48 1.12E+08 1.26E+08 1.01E+08 1.13E+08 1.24E+07 1.40E+07 18.54 18.65 18.43
60 1.35E+08 1.56E+08 1.85E+08 1.59E+08 2.53E+07 2.86E+07 18.72 18.87 19.04
72 2.54E+08 2.20E+08 2.07E+08 2.27E+08 2.44E+07 2.76E+07 19.35 19.21 19.15
84 2.92E+08 2.52E+08 2.69E+08 2.71E+08 2.03E+07 2.30E+07 19.49 19.34 19.41
96 3.38E+08 3.03E+08 2.95E+08 3.12E+08 2.29E+07 2.60E+07 19.64 19.53 19.50
108 3.18E+08 3.03E+08 3.01E+08 3.07E+08 9.20E+06 1.04E+07 19.58 19.53 19.52
120 3.24E+08 3.30E+08 3.22E+08 3.25E+08 4.04E+06 4.57E+06 19.60 19.61 19.5917.5
18.0
18.5
19.0
19.5
20.0
0 20 40 60 80 100 120
ln [
Cel
ls m
L-1
]
Specific growth rate (h-1
)
Trial 1 0.024
Trial 2 0.022
Trial 3 0.022
Average 0.023
STDEV 0.001
95% CI 0.002
y = 0.0242x + 17.405
y = 0.0215x + 17.549
y = 0.0224x + 17.473
17.5
18.0
18.5
19.0
19.5
20.0
0 20 40 60 80 100 120
Elapsed time (h)
ln [
Cel
ls m
L-1
]
Figure F.13. Specific growth rate calculations for Trial 1 (open circles), Trial 2 (open
squares), and Trial 3 (open triangles).

262
Table F.44. BC13 growth in the presence of 30 M citrate.
Cells mL
-1ln (Cells mL
-1)
Elapsed Time (h) Trial 1 Trial 2 Trial 3 Average STDEV 95% CI Trial 1 Trial 2 Trial 3
0 5.16E+07 4.96E+07 4.90E+07 5.00E+07 1.36E+06 1.54E+06 17.76 17.72 17.71
12 5.10E+07 5.25E+07 5.11E+07 5.15E+07 8.23E+05 9.31E+05 17.75 17.78 17.75
24 6.15E+07 6.16E+07 6.46E+07 6.26E+07 1.75E+06 1.99E+06 17.93 17.94 17.98
36 8.23E+07 7.87E+07 7.69E+07 7.93E+07 2.77E+06 3.13E+06 18.23 18.18 18.16
48 1.13E+08 1.16E+08 1.11E+08 1.13E+08 2.27E+06 2.56E+06 18.54 18.57 18.53
60 1.33E+08 1.27E+08 1.32E+08 1.30E+08 3.21E+06 3.63E+06 18.70 18.66 18.70
72 1.75E+08 1.62E+08 2.24E+08 1.87E+08 3.27E+07 3.70E+07 18.98 18.90 19.23
84 2.05E+08 2.51E+08 2.45E+08 2.34E+08 2.50E+07 2.83E+07 19.14 19.34 19.32
96 3.36E+08 3.30E+08 3.56E+08 3.41E+08 1.37E+07 1.56E+07 19.63 19.61 19.69
108 3.17E+08 3.09E+08 3.40E+08 3.22E+08 1.64E+07 1.86E+07 19.58 19.55 19.65
120 3.32E+08 3.40E+08 3.39E+08 3.37E+08 4.47E+06 5.06E+06 19.62 19.64 19.64
17.5
18.0
18.5
19.0
19.5
20.0
0 20 40 60 80 100 120
ln [
Cel
ls m
L-1
]
Specific growth rate (h-1
)
Trial 1 0.022
Trial 2 0.022
Trial 3 0.024
Average 0.022
STDEV 0.001
95% CI 0.001
y = 0.0215x + 17.453
y = 0.022x + 17.436
y = 0.0235x + 17.403
17.5
18.0
18.5
19.0
19.5
20.0
0 20 40 60 80 100 120
Elapsed time (h)
ln [
Cel
ls m
L-1
]
Figure F.14. Specific growth rate calculations for Trial 1 (open circles), Trial 2 (open
squares), and Trial 3 (open triangles).

263
Table F.45. BC13 growth in the presence of 50 M citrate.
Cells mL
-1ln (Cells mL
-1)
Elapsed Time (h) Trial 1 Trial 2 Trial 3 Average STDEV 95% CI Trial 1 Trial 2 Trial 3
0 5.27E+07 5.35E+07 5.42E+07 5.35E+07 7.40E+05 8.37E+05 17.78 17.79 17.81
12 5.94E+07 5.73E+07 6.06E+07 5.91E+07 1.69E+06 1.92E+06 17.90 17.86 17.92
24 6.10E+07 6.15E+07 6.69E+07 6.31E+07 3.25E+06 3.67E+06 17.93 17.93 18.02
36 8.31E+07 8.05E+07 7.66E+07 8.01E+07 3.30E+06 3.74E+06 18.24 18.20 18.15
48 1.15E+08 1.17E+08 9.12E+07 1.08E+08 1.43E+07 1.61E+07 18.56 18.57 18.33
60 1.28E+08 1.26E+08 1.21E+08 1.25E+08 3.23E+06 3.65E+06 18.67 18.65 18.61
72 1.80E+08 1.64E+08 1.59E+08 1.68E+08 1.09E+07 1.24E+07 19.01 18.92 18.88
84 2.10E+08 2.03E+08 2.07E+08 2.06E+08 3.50E+06 3.96E+06 19.16 19.13 19.15
96 2.54E+08 2.59E+08 2.44E+08 2.52E+08 7.58E+06 8.58E+06 19.35 19.37 19.31
108 2.46E+08 2.37E+08 2.58E+08 2.47E+08 1.07E+07 1.21E+07 19.32 19.28 19.37
120 2.36E+08 2.59E+08 2.45E+08 2.47E+08 1.14E+07 1.29E+07 19.28 19.37 19.32
17.5
18.0
18.5
19.0
19.5
0 20 40 60 80 100 120
ln [
Cel
ls m
L-1
]
Specific growth rate (h-1
)
Trial 1 0.019
Trial 2 0.019
Trial 3 0.018
Average 0.018
STDEV 0.001
95% CI 0.001
y = 0.0186x + 17.597
y = 0.0186x + 17.576
y = 0.0177x + 17.59
17.5
18.0
18.5
19.0
19.5
0 20 40 60 80 100 120
Elapsed time (h)
ln [
Cel
ls m
L-1
]
Figure F.15. Specific growth rate calculations for Trial 1 (open circles), Trial 2 (open
squares), and Trial 3 (open triangles).
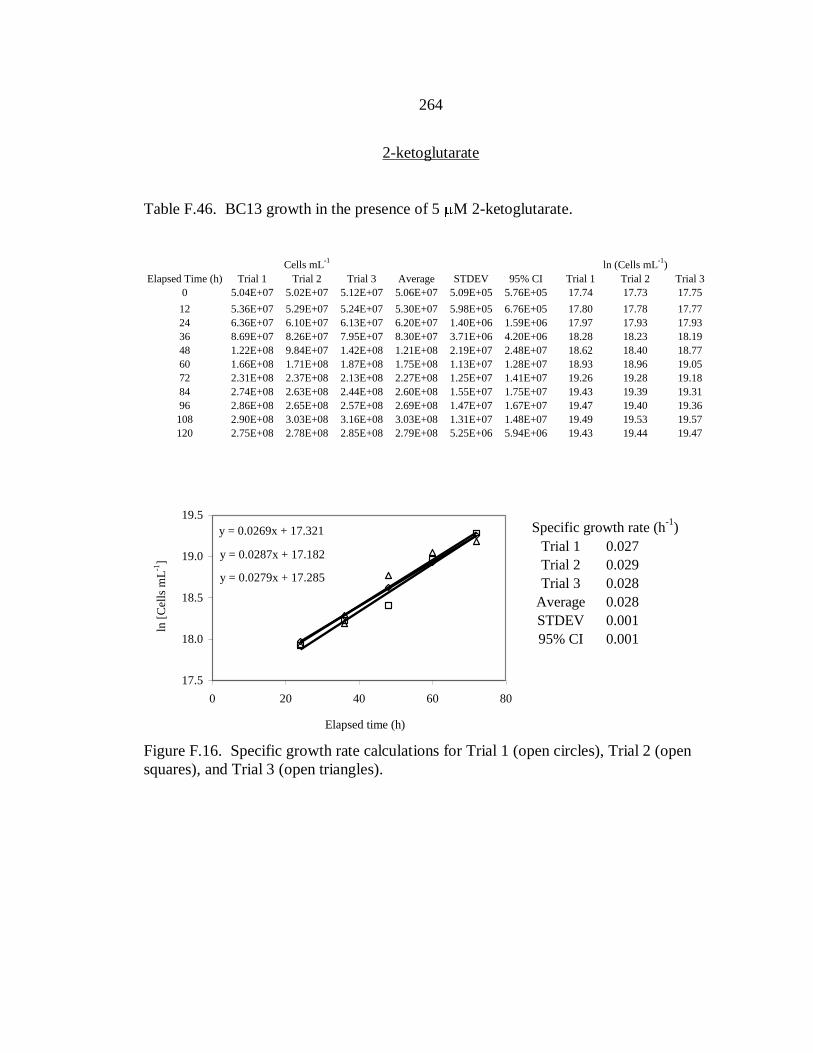
264
2-ketoglutarate
Table F.46. BC13 growth in the presence of 5 M 2-ketoglutarate.
Cells mL
-1ln (Cells mL
-1)
Elapsed Time (h) Trial 1 Trial 2 Trial 3 Average STDEV 95% CI Trial 1 Trial 2 Trial 3
0 5.04E+07 5.02E+07 5.12E+07 5.06E+07 5.09E+05 5.76E+05 17.74 17.73 17.75
12 5.36E+07 5.29E+07 5.24E+07 5.30E+07 5.98E+05 6.76E+05 17.80 17.78 17.77
24 6.36E+07 6.10E+07 6.13E+07 6.20E+07 1.40E+06 1.59E+06 17.97 17.93 17.93
36 8.69E+07 8.26E+07 7.95E+07 8.30E+07 3.71E+06 4.20E+06 18.28 18.23 18.19
48 1.22E+08 9.84E+07 1.42E+08 1.21E+08 2.19E+07 2.48E+07 18.62 18.40 18.77
60 1.66E+08 1.71E+08 1.87E+08 1.75E+08 1.13E+07 1.28E+07 18.93 18.96 19.05
72 2.31E+08 2.37E+08 2.13E+08 2.27E+08 1.25E+07 1.41E+07 19.26 19.28 19.18
84 2.74E+08 2.63E+08 2.44E+08 2.60E+08 1.55E+07 1.75E+07 19.43 19.39 19.31
96 2.86E+08 2.65E+08 2.57E+08 2.69E+08 1.47E+07 1.67E+07 19.47 19.40 19.36
108 2.90E+08 3.03E+08 3.16E+08 3.03E+08 1.31E+07 1.48E+07 19.49 19.53 19.57
120 2.75E+08 2.78E+08 2.85E+08 2.79E+08 5.25E+06 5.94E+06 19.43 19.44 19.4717.5
18.0
18.5
19.0
19.5
0 20 40 60 80
ln [
Cel
ls m
L-1
]
Specific growth rate (h-1
)
Trial 1 0.027
Trial 2 0.029
Trial 3 0.028
Average 0.028
STDEV 0.001
95% CI 0.001
y = 0.0269x + 17.321
y = 0.0287x + 17.182
y = 0.0279x + 17.285
17.5
18.0
18.5
19.0
19.5
0 20 40 60 80
Elapsed time (h)
ln [
Cel
ls m
L-1
]
Figure F.16. Specific growth rate calculations for Trial 1 (open circles), Trial 2 (open
squares), and Trial 3 (open triangles).

265
Table F.47. BC13 growth in the presence of 10 M 2-ketoglutarate.
Cells mL
-1ln (Cells mL
-1)
Elapsed Time (h) Trial 1 Trial 2 Trial 3 Average STDEV 95% CI Trial 1 Trial 2 Trial 3
0 5.16E+07 5.39E+07 5.48E+07 5.34E+07 1.66E+06 1.88E+06 17.76 17.80 17.82
12 5.17E+07 5.16E+07 5.10E+07 5.15E+07 4.09E+05 4.63E+05 17.76 17.76 17.75
24 6.14E+07 5.86E+07 5.93E+07 5.98E+07 1.48E+06 1.67E+06 17.93 17.89 17.90
36 8.36E+07 8.41E+07 8.72E+07 8.49E+07 1.93E+06 2.19E+06 18.24 18.25 18.28
48 1.18E+08 1.18E+08 1.22E+08 1.19E+08 2.69E+06 3.05E+06 18.58 18.59 18.62
60 1.65E+08 1.61E+08 1.55E+08 1.60E+08 5.04E+06 5.70E+06 18.92 18.90 18.86
72 2.00E+08 1.97E+08 2.37E+08 2.11E+08 2.22E+07 2.51E+07 19.12 19.10 19.28
84 2.42E+08 2.48E+08 2.39E+08 2.43E+08 4.83E+06 5.47E+06 19.31 19.33 19.29
96 2.72E+08 2.64E+08 2.66E+08 2.67E+08 4.24E+06 4.79E+06 19.42 19.39 19.40
108 3.03E+08 3.10E+08 2.99E+08 3.04E+08 5.33E+06 6.03E+06 19.53 19.55 19.52
120 2.72E+08 2.69E+08 2.70E+08 2.70E+08 1.22E+06 1.38E+06 19.42 19.41 19.41
Specific growth rate (h-1
)
Trial 1 0.023
Trial 2 0.023
Trial 3 0.024
Average 0.023
STDEV 0.000
95% CI 0.001
y = 0.0228x + 17.455
y = 0.0232x + 17.431
y = 0.0237x + 17.43
17.5
18.0
18.5
19.0
19.5
20.0
0 20 40 60 80 100
Elapsed time (h)
ln [
Cel
ls m
L-1
]
Figure F.17. Specific growth rate calculations for Trial 1 (open circles), Trial 2 (open
squares), and Trial 3 (open triangles).

266
Table F.48. BC13 growth in the presence of 20 M 2-ketoglutarate.
Cells mL
-1ln (Cells mL
-1)
Elapsed Time (h) Trial 1 Trial 2 Trial 3 Average STDEV 95% CI Trial 1 Trial 2 Trial 3
0 5.41E+07 5.24E+07 5.50E+07 5.38E+07 1.30E+06 1.47E+06 17.81 17.78 17.82
12 5.12E+07 5.27E+07 5.33E+07 5.24E+07 1.12E+06 1.26E+06 17.75 17.78 17.79
24 5.84E+07 5.93E+07 5.84E+07 5.87E+07 4.80E+05 5.43E+05 17.88 17.90 17.88
36 8.70E+07 8.46E+07 8.54E+07 8.57E+07 1.20E+06 1.36E+06 18.28 18.25 18.26
48 1.18E+08 1.23E+08 1.19E+08 1.20E+08 2.46E+06 2.78E+06 18.59 18.63 18.59
60 1.59E+08 1.54E+08 1.60E+08 1.58E+08 2.96E+06 3.35E+06 18.89 18.85 18.89
72 2.04E+08 1.98E+08 1.96E+08 1.99E+08 4.08E+06 4.62E+06 19.13 19.11 19.09
84 2.37E+08 2.48E+08 2.58E+08 2.48E+08 1.06E+07 1.20E+07 19.28 19.33 19.37
96 2.43E+08 2.30E+08 2.52E+08 2.42E+08 1.09E+07 1.23E+07 19.31 19.25 19.34
108 2.59E+08 2.26E+08 2.43E+08 2.43E+08 1.66E+07 1.87E+07 19.37 19.24 19.31
120 2.34E+08 2.58E+08 2.49E+08 2.47E+08 1.25E+07 1.42E+07 19.27 19.37 19.33
Specific growth rate (h-1
)
Trial 1 0.023
Trial 2 0.023
Trial 3 0.023
Average 0.023
STDEV 0.000
95% CI 0.000
y = 0.0229x + 17.444
y = 0.0228x + 17.455
y = 0.0231x + 17.444
17.5
18.0
18.5
19.0
19.5
0 20 40 60 80 100
Elapsed time (h)
ln [
Cel
ls m
L-1
]
Figure F.18. Specific growth rate calculations for Trial 1 (open circles), Trial 2 (open
squares), and Trial 3 (open triangles).
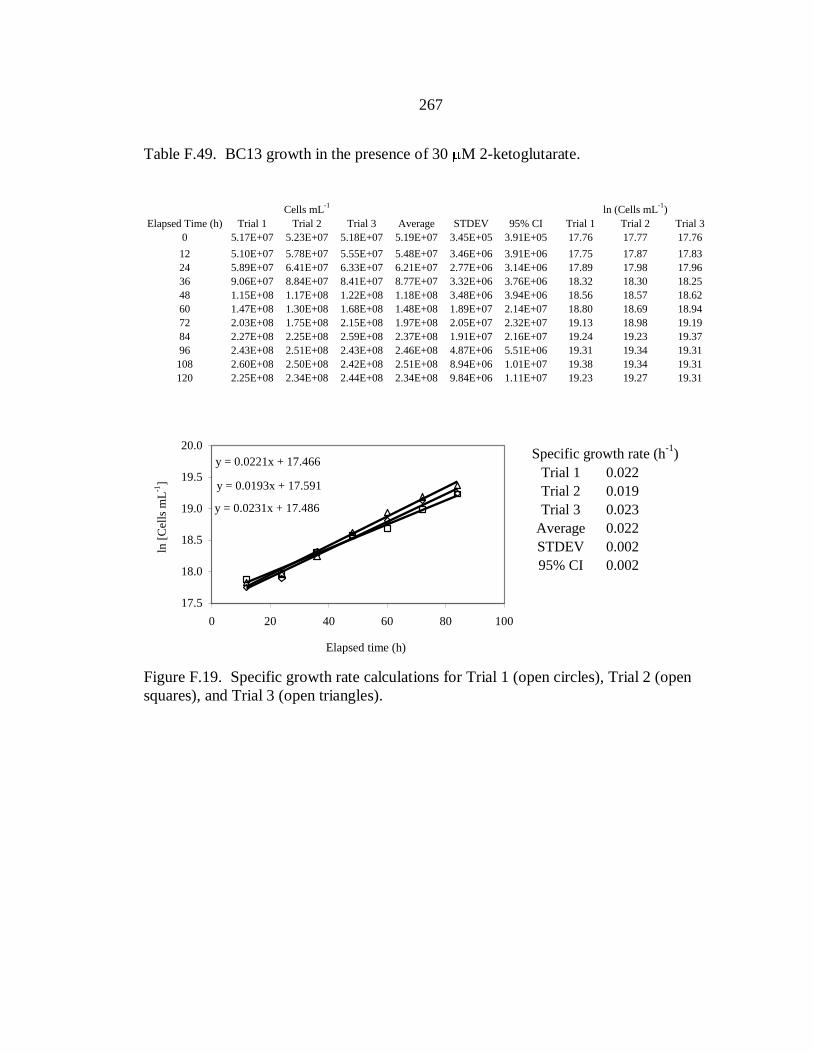
267
Table F.49. BC13 growth in the presence of 30 M 2-ketoglutarate.
Cells mL
-1ln (Cells mL
-1)
Elapsed Time (h) Trial 1 Trial 2 Trial 3 Average STDEV 95% CI Trial 1 Trial 2 Trial 3
0 5.17E+07 5.23E+07 5.18E+07 5.19E+07 3.45E+05 3.91E+05 17.76 17.77 17.76
12 5.10E+07 5.78E+07 5.55E+07 5.48E+07 3.46E+06 3.91E+06 17.75 17.87 17.83
24 5.89E+07 6.41E+07 6.33E+07 6.21E+07 2.77E+06 3.14E+06 17.89 17.98 17.96
36 9.06E+07 8.84E+07 8.41E+07 8.77E+07 3.32E+06 3.76E+06 18.32 18.30 18.25
48 1.15E+08 1.17E+08 1.22E+08 1.18E+08 3.48E+06 3.94E+06 18.56 18.57 18.62
60 1.47E+08 1.30E+08 1.68E+08 1.48E+08 1.89E+07 2.14E+07 18.80 18.69 18.94
72 2.03E+08 1.75E+08 2.15E+08 1.97E+08 2.05E+07 2.32E+07 19.13 18.98 19.19
84 2.27E+08 2.25E+08 2.59E+08 2.37E+08 1.91E+07 2.16E+07 19.24 19.23 19.37
96 2.43E+08 2.51E+08 2.43E+08 2.46E+08 4.87E+06 5.51E+06 19.31 19.34 19.31
108 2.60E+08 2.50E+08 2.42E+08 2.51E+08 8.94E+06 1.01E+07 19.38 19.34 19.31
120 2.25E+08 2.34E+08 2.44E+08 2.34E+08 9.84E+06 1.11E+07 19.23 19.27 19.31
Specific growth rate (h-1
)
Trial 1 0.022
Trial 2 0.019
Trial 3 0.023
Average 0.022
STDEV 0.002
95% CI 0.002
y = 0.0221x + 17.466
y = 0.0193x + 17.591
y = 0.0231x + 17.486
17.5
18.0
18.5
19.0
19.5
20.0
0 20 40 60 80 100
Elapsed time (h)
ln [
Cel
ls m
L-1
]
Figure F.19. Specific growth rate calculations for Trial 1 (open circles), Trial 2 (open
squares), and Trial 3 (open triangles).
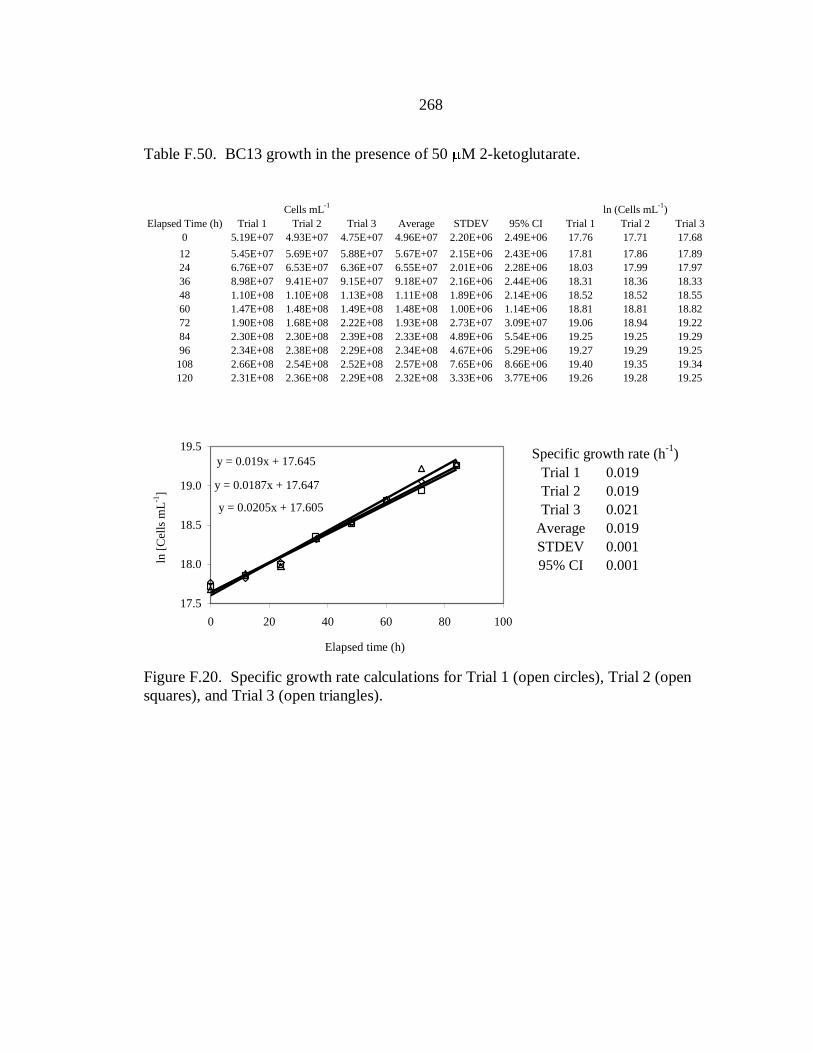
268
Table F.50. BC13 growth in the presence of 50 M 2-ketoglutarate.
Cells mL
-1ln (Cells mL
-1)
Elapsed Time (h) Trial 1 Trial 2 Trial 3 Average STDEV 95% CI Trial 1 Trial 2 Trial 3
0 5.19E+07 4.93E+07 4.75E+07 4.96E+07 2.20E+06 2.49E+06 17.76 17.71 17.68
12 5.45E+07 5.69E+07 5.88E+07 5.67E+07 2.15E+06 2.43E+06 17.81 17.86 17.89
24 6.76E+07 6.53E+07 6.36E+07 6.55E+07 2.01E+06 2.28E+06 18.03 17.99 17.97
36 8.98E+07 9.41E+07 9.15E+07 9.18E+07 2.16E+06 2.44E+06 18.31 18.36 18.33
48 1.10E+08 1.10E+08 1.13E+08 1.11E+08 1.89E+06 2.14E+06 18.52 18.52 18.55
60 1.47E+08 1.48E+08 1.49E+08 1.48E+08 1.00E+06 1.14E+06 18.81 18.81 18.82
72 1.90E+08 1.68E+08 2.22E+08 1.93E+08 2.73E+07 3.09E+07 19.06 18.94 19.22
84 2.30E+08 2.30E+08 2.39E+08 2.33E+08 4.89E+06 5.54E+06 19.25 19.25 19.29
96 2.34E+08 2.38E+08 2.29E+08 2.34E+08 4.67E+06 5.29E+06 19.27 19.29 19.25
108 2.66E+08 2.54E+08 2.52E+08 2.57E+08 7.65E+06 8.66E+06 19.40 19.35 19.34
120 2.31E+08 2.36E+08 2.29E+08 2.32E+08 3.33E+06 3.77E+06 19.26 19.28 19.25
17.5
18.0
18.5
19.0
19.5
0 20 40 60 80 100
ln [
Cel
ls m
L-1
]
Specific growth rate (h-1
)
Trial 1 0.019
Trial 2 0.019
Trial 3 0.021
Average 0.019
STDEV 0.001
95% CI 0.001
y = 0.019x + 17.645
y = 0.0187x + 17.647
y = 0.0205x + 17.605
17.5
18.0
18.5
19.0
19.5
0 20 40 60 80 100
Elapsed time (h)
ln [
Cel
ls m
L-1
]
Figure F.20. Specific growth rate calculations for Trial 1 (open circles), Trial 2 (open
squares), and Trial 3 (open triangles).

269
Succinate
Table F.51. BC13 growth in the presence of 5 M succinate.
Cells mL
-1ln (Cells mL
-1)
Elapsed Time (h) Trial 1 Trial 2 Trial 3 Average STDEV 95% CI Trial 1 Trial 2 Trial 3
0 5.62E+07 5.41E+07 5.43E+07 5.49E+07 1.15E+06 1.31E+06 17.84 17.81 17.81
12 5.85E+07 5.68E+07 5.79E+07 5.77E+07 8.38E+05 9.49E+05 17.88 17.86 17.87
24 6.91E+07 6.93E+07 7.03E+07 6.95E+07 6.52E+05 7.38E+05 18.05 18.05 18.07
36 9.01E+07 9.04E+07 8.82E+07 8.96E+07 1.20E+06 1.36E+06 18.32 18.32 18.29
48 1.25E+08 1.28E+08 1.29E+08 1.27E+08 1.70E+06 1.93E+06 18.65 18.66 18.67
60 2.26E+08 2.29E+08 2.26E+08 2.27E+08 1.82E+06 2.05E+06 19.23 19.25 19.24
72 2.87E+08 2.70E+08 2.53E+08 2.70E+08 1.71E+07 1.93E+07 19.47 19.42 19.35
84 2.95E+08 3.10E+08 2.89E+08 2.98E+08 1.09E+07 1.24E+07 19.50 19.55 19.48
96 3.31E+08 3.34E+08 3.19E+08 3.28E+08 7.67E+06 8.68E+06 19.62 19.63 19.58
108 3.36E+08 3.52E+08 3.47E+08 3.45E+08 8.21E+06 9.29E+06 19.63 19.68 19.66
120 3.27E+08 3.40E+08 3.39E+08 3.35E+08 7.30E+06 8.26E+06 19.61 19.65 19.64
Specific growth rate (h-1
)
Trial 1 0.031
Trial 2 0.030
Trial 3 0.029
Average 0.030
STDEV 0.001
95% CI 0.001
y = 0.0314x + 17.238
y = 0.0304x + 17.279
y = 0.0292x + 17.324
17.5
18.0
18.5
19.0
19.5
20.0
0 20 40 60 80
Elapsed time (h)
ln [
Cel
ls m
L-1
]
Figure F.21. Specific growth rate calculations for Trial 1 (open circles), Trial 2 (open
squares), and Trial 3 (open triangles).

270
Table F.52. BC13 growth in the presence of 10 M succinate.
Cells mL
-1ln (Cells mL
-1)
Elapsed Time (h) Trial 1 Trial 2 Trial 3 Average STDEV 95% CI Trial 1 Trial 2 Trial 3
0 5.48E+07 5.48E+07 5.67E+07 5.54E+07 1.11E+06 1.25E+06 17.82 17.82 17.85
12 6.10E+07 5.54E+07 5.77E+07 5.80E+07 2.82E+06 3.19E+06 17.93 17.83 17.87
24 7.08E+07 7.34E+07 7.25E+07 7.22E+07 1.33E+06 1.51E+06 18.07 18.11 18.10
36 1.19E+08 9.42E+07 9.27E+07 1.02E+08 1.47E+07 1.67E+07 18.59 18.36 18.35
48 1.31E+08 1.38E+08 1.37E+08 1.35E+08 3.68E+06 4.16E+06 18.69 18.74 18.74
60 2.35E+08 2.27E+08 2.26E+08 2.30E+08 4.64E+06 5.25E+06 19.27 19.24 19.24
72 2.88E+08 2.87E+08 2.96E+08 2.90E+08 4.50E+06 5.09E+06 19.48 19.48 19.50
84 3.01E+08 2.87E+08 2.83E+08 2.90E+08 9.17E+06 1.04E+07 19.52 19.47 19.46
96 3.34E+08 3.27E+08 3.14E+08 3.25E+08 1.02E+07 1.15E+07 19.63 19.60 19.56
108 3.21E+08 3.10E+08 3.23E+08 3.18E+08 6.77E+06 7.66E+06 19.59 19.55 19.59
120 3.17E+08 3.17E+08 3.07E+08 3.14E+08 6.15E+06 6.96E+06 19.58 19.57 19.54
17.5
18.0
18.5
19.0
19.5
20.0
0 20 40 60 80
ln [
Cel
ls m
L-1
]
Specific growth rate (h-1
)
Trial 1 0.027
Trial 2 0.029
Trial 3 0.029
Average 0.028
STDEV 0.001
95% CI 0.001
y = 0.0273x + 17.528
y = 0.0286x + 17.427
y = 0.0285x + 17.435
17.5
18.0
18.5
19.0
19.5
20.0
0 20 40 60 80
Elapsed time (h)
ln [
Cel
ls m
L-1
]
Figure F.22. Specific growth rate calculations for Trial 1 (open circles), Trial 2 (open
squares), and Trial 3 (open triangles).

271
Table F.53. BC13 growth in the presence of 20 M succinate.
Cells mL
-1ln (Cells mL
-1)
Elapsed Time (h) Trial 1 Trial 2 Trial 3 Average STDEV 95% CI Trial 1 Trial 2 Trial 3
0 5.64E+07 5.66E+07 5.74E+07 5.68E+07 5.38E+05 6.08E+05 17.85 17.85 17.87
12 6.19E+07 6.16E+07 6.13E+07 6.16E+07 3.29E+05 3.72E+05 17.94 17.94 17.93
24 7.34E+07 7.02E+07 6.88E+07 7.08E+07 2.34E+06 2.65E+06 18.11 18.07 18.05
36 8.90E+07 9.19E+07 9.32E+07 9.14E+07 2.18E+06 2.46E+06 18.30 18.34 18.35
48 1.35E+08 1.31E+08 1.25E+08 1.30E+08 5.11E+06 5.78E+06 18.72 18.69 18.64
60 1.89E+08 1.96E+08 1.97E+08 1.94E+08 4.33E+06 4.89E+06 19.06 19.10 19.10
72 3.00E+08 2.91E+08 2.95E+08 2.96E+08 4.48E+06 5.07E+06 19.52 19.49 19.50
84 3.37E+08 2.91E+08 3.43E+08 3.23E+08 2.84E+07 3.22E+07 19.63 19.49 19.65
96 3.37E+08 3.34E+08 3.39E+08 3.37E+08 2.89E+06 3.27E+06 19.64 19.63 19.64
108 3.33E+08 3.27E+08 3.28E+08 3.29E+08 2.98E+06 3.37E+06 19.62 19.61 19.61
120 3.09E+08 2.98E+08 3.04E+08 3.04E+08 5.45E+06 6.17E+06 19.55 19.51 19.53
17.5
18.0
18.5
19.0
19.5
20.0
0 20 40 60 80 100
ln [
Cel
ls m
L-1
]
Specific growth rate (h-1
)
Trial 1 0.028
Trial 2 0.026
Trial 3 0.028
Average 0.027
STDEV 0.001
95% CI 0.001
y = 0.0276x + 17.4
y = 0.0261x + 17.451
y = 0.0284x + 17.347
17.5
18.0
18.5
19.0
19.5
20.0
0 20 40 60 80 100
Elapsed time (h)
ln [
Cel
ls m
L-1
]
Figure F.23. Specific growth rate calculations for Trial 1 (open circles), Trial 2 (open
squares), and Trial 3 (open triangles).
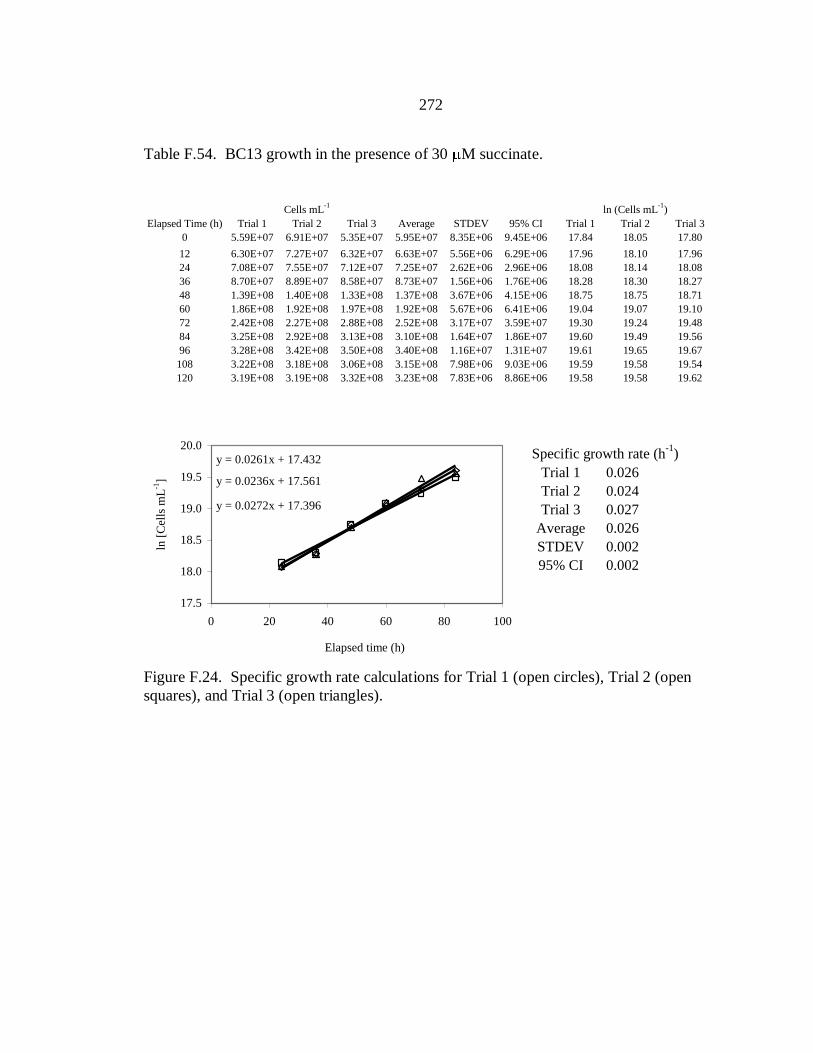
272
Table F.54. BC13 growth in the presence of 30 M succinate.
Cells mL
-1ln (Cells mL
-1)
Elapsed Time (h) Trial 1 Trial 2 Trial 3 Average STDEV 95% CI Trial 1 Trial 2 Trial 3
0 5.59E+07 6.91E+07 5.35E+07 5.95E+07 8.35E+06 9.45E+06 17.84 18.05 17.80
12 6.30E+07 7.27E+07 6.32E+07 6.63E+07 5.56E+06 6.29E+06 17.96 18.10 17.96
24 7.08E+07 7.55E+07 7.12E+07 7.25E+07 2.62E+06 2.96E+06 18.08 18.14 18.08
36 8.70E+07 8.89E+07 8.58E+07 8.73E+07 1.56E+06 1.76E+06 18.28 18.30 18.27
48 1.39E+08 1.40E+08 1.33E+08 1.37E+08 3.67E+06 4.15E+06 18.75 18.75 18.71
60 1.86E+08 1.92E+08 1.97E+08 1.92E+08 5.67E+06 6.41E+06 19.04 19.07 19.10
72 2.42E+08 2.27E+08 2.88E+08 2.52E+08 3.17E+07 3.59E+07 19.30 19.24 19.48
84 3.25E+08 2.92E+08 3.13E+08 3.10E+08 1.64E+07 1.86E+07 19.60 19.49 19.56
96 3.28E+08 3.42E+08 3.50E+08 3.40E+08 1.16E+07 1.31E+07 19.61 19.65 19.67
108 3.22E+08 3.18E+08 3.06E+08 3.15E+08 7.98E+06 9.03E+06 19.59 19.58 19.54
120 3.19E+08 3.19E+08 3.32E+08 3.23E+08 7.83E+06 8.86E+06 19.58 19.58 19.62
17.5
18.0
18.5
19.0
19.5
20.0
0 20 40 60 80 100
ln [
Cel
ls m
L-1
]
Specific growth rate (h-1
)
Trial 1 0.026
Trial 2 0.024
Trial 3 0.027
Average 0.026
STDEV 0.002
95% CI 0.002
y = 0.0261x + 17.432
y = 0.0236x + 17.561
y = 0.0272x + 17.396
17.5
18.0
18.5
19.0
19.5
20.0
0 20 40 60 80 100
Elapsed time (h)
ln [
Cel
ls m
L-1
]
Figure F.24. Specific growth rate calculations for Trial 1 (open circles), Trial 2 (open
squares), and Trial 3 (open triangles).

273
Table F.55. BC13 growth in the presence of 50 M succinate.
Cells mL
-1ln (Cells mL
-1)
Elapsed Time (h) Trial 1 Trial 2 Trial 3 Average STDEV 95% CI Trial 1 Trial 2 Trial 3
0 5.63E+07 5.51E+07 5.60E+07 5.58E+07 6.07E+05 6.87E+05 17.85 17.83 17.84
12 6.35E+07 6.33E+07 6.02E+07 6.23E+07 1.83E+06 2.07E+06 17.97 17.96 17.91
24 7.35E+07 7.47E+07 7.26E+07 7.36E+07 1.06E+06 1.20E+06 18.11 18.13 18.10
36 8.39E+07 1.12E+08 8.38E+07 9.32E+07 1.62E+07 1.84E+07 18.25 18.53 18.24
48 1.38E+08 1.31E+08 1.32E+08 1.34E+08 3.66E+06 4.15E+06 18.74 18.69 18.70
60 1.82E+08 1.85E+08 1.78E+08 1.82E+08 3.36E+06 3.80E+06 19.02 19.04 19.00
72 2.24E+08 2.02E+08 2.44E+08 2.23E+08 2.10E+07 2.37E+07 19.23 19.12 19.31
84 2.79E+08 2.41E+08 2.87E+08 2.69E+08 2.43E+07 2.75E+07 19.45 19.30 19.48
96 2.64E+08 2.79E+08 2.62E+08 2.68E+08 9.03E+06 1.02E+07 19.39 19.45 19.39
108 2.34E+08 2.56E+08 2.59E+08 2.50E+08 1.37E+07 1.55E+07 19.27 19.36 19.37
120 2.45E+08 2.68E+08 2.78E+08 2.64E+08 1.67E+07 1.90E+07 19.32 19.40 19.44
17.5
18.0
18.5
19.0
19.5
20.0
0 20 40 60 80 100
ln [
Cel
ls m
L-1
]
Specific growth rate (h-1
)
Trial 1 0.024
Trial 2 0.019
Trial 3 0.025
Average 0.022
STDEV 0.003
95% CI 0.003
y = 0.0235x + 17.528
y = 0.019x + 17.777
y = 0.0247x + 17.471
17.5
18.0
18.5
19.0
19.5
20.0
0 20 40 60 80 100
Elapsed time (h)
ln [
Cel
ls m
L-1
]
Figure F.25. Specific growth rate calculations for Trial 1 (open circles), Trial 2 (open
squares), and Trial 3 (open triangles).

274
Malate
Table F.56. BC13 growth in the presence of 5 M malate.
Cells mL
-1ln (Cells mL
-1)
Elapsed Time (h) Trial 1 Trial 2 Trial 3 Average STDEV 95% CI Trial 1 Trial 2 Trial 3
0 5.05E+07 5.23E+07 5.31E+07 5.20E+07 1.35E+06 1.53E+06 17.74 17.77 17.79
12 5.25E+07 5.14E+07 5.64E+07 5.34E+07 2.64E+06 2.99E+06 17.78 17.76 17.85
24 6.46E+07 6.30E+07 6.54E+07 6.43E+07 1.22E+06 1.38E+06 17.98 17.96 18.00
36 8.83E+07 9.75E+07 8.94E+07 9.17E+07 5.04E+06 5.71E+06 18.30 18.40 18.31
48 1.50E+08 1.36E+08 1.03E+08 1.30E+08 2.45E+07 2.77E+07 18.83 18.72 18.45
60 1.96E+08 1.95E+08 1.99E+08 1.96E+08 2.23E+06 2.52E+06 19.09 19.09 19.11
72 2.66E+08 2.56E+08 2.49E+08 2.57E+08 8.33E+06 9.43E+06 19.40 19.36 19.33
84 2.84E+08 2.84E+08 2.93E+08 2.87E+08 5.18E+06 5.86E+06 19.47 19.46 19.50
96 3.26E+08 3.20E+08 3.08E+08 3.18E+08 8.96E+06 1.01E+07 19.60 19.58 19.55
108 3.31E+08 2.93E+08 3.05E+08 3.09E+08 1.90E+07 2.16E+07 19.62 19.50 19.53
120 3.40E+08 3.27E+08 3.21E+08 3.30E+08 9.48E+06 1.07E+07 19.64 19.61 19.59
Specific growth rate (h-1
)
Trial 1 0.030
Trial 2 0.029
Trial 3 0.029
Average 0.029
STDEV 0.001
95% CI 0.001
y = 0.0302x + 17.269
y = 0.0291x + 17.307
y = 0.029x + 17.249
17.5
18.0
18.5
19.0
19.5
20.0
0 20 40 60 80
Elapsed time (h)
ln [
Cel
ls m
L-1
]
Figure F.26. Specific growth rate calculations for Trial 1 (open circles), Trial 2 (open
squares), and Trial 3 (open triangles).

275
Table F.57. BC13 growth in the presence of 10 M malate.
Cells mL
-1ln (Cells mL
-1)
Elapsed Time (h) Trial 1 Trial 2 Trial 3 Average STDEV 95% CI Trial 1 Trial 2 Trial 3
0 5.03E+07 4.79E+07 5.00E+07 4.94E+07 1.30E+06 1.47E+06 17.73 17.69 17.73
12 5.08E+07 5.15E+07 5.14E+07 5.12E+07 3.71E+05 4.20E+05 17.74 17.76 17.76
24 6.30E+07 6.05E+07 6.29E+07 6.21E+07 1.44E+06 1.63E+06 17.96 17.92 17.96
36 9.08E+07 8.82E+07 8.80E+07 8.90E+07 1.59E+06 1.80E+06 18.32 18.30 18.29
48 1.53E+08 1.48E+08 1.46E+08 1.49E+08 3.47E+06 3.93E+06 18.85 18.82 18.80
60 2.00E+08 2.06E+08 2.07E+08 2.04E+08 3.94E+06 4.46E+06 19.11 19.15 19.15
72 2.34E+08 2.50E+08 2.23E+08 2.36E+08 1.37E+07 1.55E+07 19.27 19.34 19.22
84 2.49E+08 2.68E+08 2.41E+08 2.53E+08 1.39E+07 1.57E+07 19.33 19.41 19.30
96 2.55E+08 2.70E+08 2.42E+08 2.56E+08 1.39E+07 1.57E+07 19.36 19.41 19.31
108 2.44E+08 2.64E+08 2.40E+08 2.49E+08 1.30E+07 1.47E+07 19.31 19.39 19.30
120 2.27E+08 2.31E+08 2.39E+08 2.32E+08 6.20E+06 7.01E+06 19.24 19.26 19.29
17.5
18.0
18.5
19.0
19.5
0 20 40 60 80
ln [
Cel
ls m
L-1
]
Specific growth rate (h-1
)
Trial 1 0.028
Trial 2 0.029
Trial 3 0.027
Average 0.028
STDEV 0.001
95% CI 0.001
y = 0.0277x + 17.38
y = 0.0288x + 17.334
y = 0.0272x + 17.389
17.5
18.0
18.5
19.0
19.5
0 20 40 60 80
Elapsed time (h)
ln [
Cel
ls m
L-1
]
Figure F.27. Specific growth rate calculations for Trial 1 (open circles), Trial 2 (open
squares), and Trial 3 (open triangles).
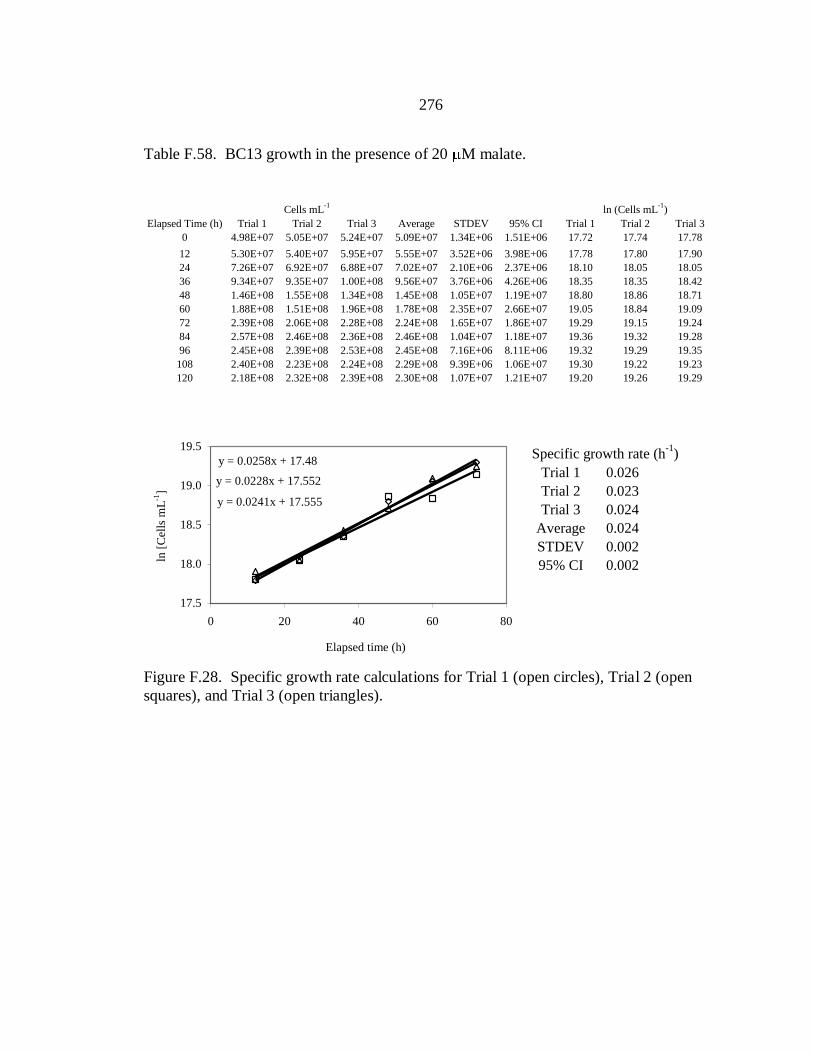
276
Table F.58. BC13 growth in the presence of 20 M malate.
Cells mL
-1ln (Cells mL
-1)
Elapsed Time (h) Trial 1 Trial 2 Trial 3 Average STDEV 95% CI Trial 1 Trial 2 Trial 3
0 4.98E+07 5.05E+07 5.24E+07 5.09E+07 1.34E+06 1.51E+06 17.72 17.74 17.78
12 5.30E+07 5.40E+07 5.95E+07 5.55E+07 3.52E+06 3.98E+06 17.78 17.80 17.90
24 7.26E+07 6.92E+07 6.88E+07 7.02E+07 2.10E+06 2.37E+06 18.10 18.05 18.05
36 9.34E+07 9.35E+07 1.00E+08 9.56E+07 3.76E+06 4.26E+06 18.35 18.35 18.42
48 1.46E+08 1.55E+08 1.34E+08 1.45E+08 1.05E+07 1.19E+07 18.80 18.86 18.71
60 1.88E+08 1.51E+08 1.96E+08 1.78E+08 2.35E+07 2.66E+07 19.05 18.84 19.09
72 2.39E+08 2.06E+08 2.28E+08 2.24E+08 1.65E+07 1.86E+07 19.29 19.15 19.24
84 2.57E+08 2.46E+08 2.36E+08 2.46E+08 1.04E+07 1.18E+07 19.36 19.32 19.28
96 2.45E+08 2.39E+08 2.53E+08 2.45E+08 7.16E+06 8.11E+06 19.32 19.29 19.35
108 2.40E+08 2.23E+08 2.24E+08 2.29E+08 9.39E+06 1.06E+07 19.30 19.22 19.23
120 2.18E+08 2.32E+08 2.39E+08 2.30E+08 1.07E+07 1.21E+07 19.20 19.26 19.29
17.5
18.0
18.5
19.0
19.5
0 20 40 60 80
ln [
Cel
ls m
L-1
]
Specific growth rate (h-1
)
Trial 1 0.026
Trial 2 0.023
Trial 3 0.024
Average 0.024
STDEV 0.002
95% CI 0.002
y = 0.0258x + 17.48
y = 0.0228x + 17.552
y = 0.0241x + 17.555
17.5
18.0
18.5
19.0
19.5
0 20 40 60 80
Elapsed time (h)
ln [
Cel
ls m
L-1
]
Figure F.28. Specific growth rate calculations for Trial 1 (open circles), Trial 2 (open
squares), and Trial 3 (open triangles).
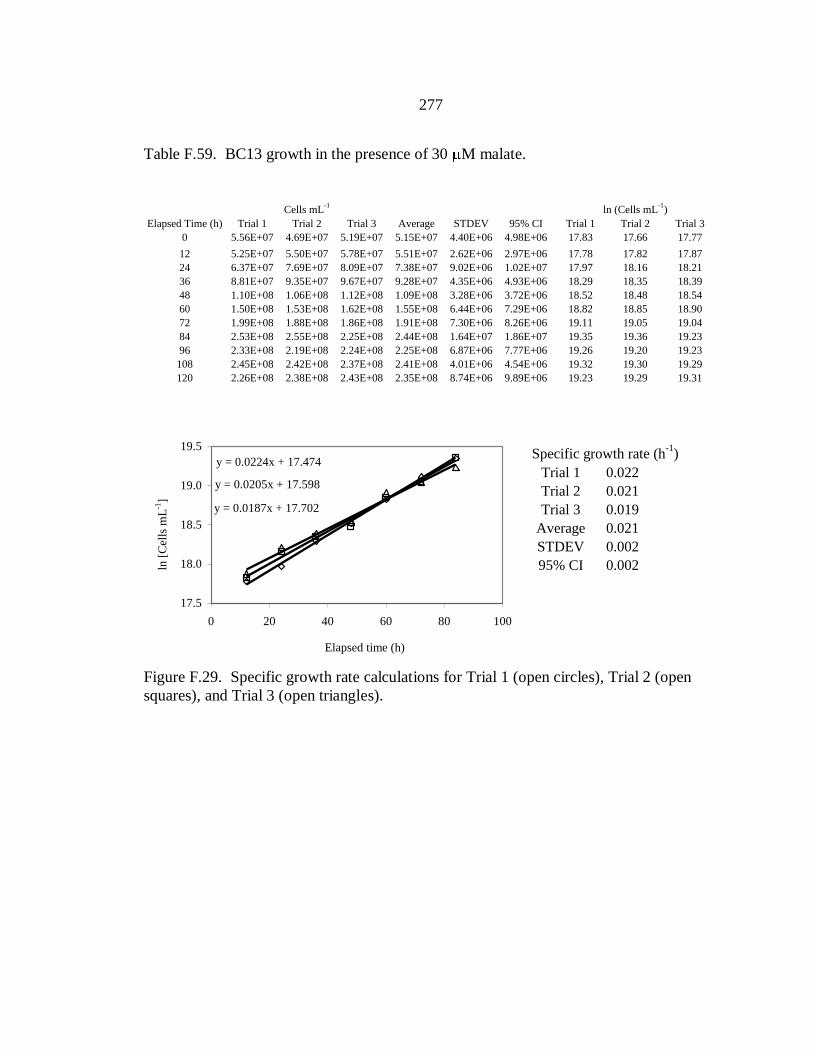
277
Table F.59. BC13 growth in the presence of 30 M malate.
Cells mL
-1ln (Cells mL
-1)
Elapsed Time (h) Trial 1 Trial 2 Trial 3 Average STDEV 95% CI Trial 1 Trial 2 Trial 3
0 5.56E+07 4.69E+07 5.19E+07 5.15E+07 4.40E+06 4.98E+06 17.83 17.66 17.77
12 5.25E+07 5.50E+07 5.78E+07 5.51E+07 2.62E+06 2.97E+06 17.78 17.82 17.87
24 6.37E+07 7.69E+07 8.09E+07 7.38E+07 9.02E+06 1.02E+07 17.97 18.16 18.21
36 8.81E+07 9.35E+07 9.67E+07 9.28E+07 4.35E+06 4.93E+06 18.29 18.35 18.39
48 1.10E+08 1.06E+08 1.12E+08 1.09E+08 3.28E+06 3.72E+06 18.52 18.48 18.54
60 1.50E+08 1.53E+08 1.62E+08 1.55E+08 6.44E+06 7.29E+06 18.82 18.85 18.90
72 1.99E+08 1.88E+08 1.86E+08 1.91E+08 7.30E+06 8.26E+06 19.11 19.05 19.04
84 2.53E+08 2.55E+08 2.25E+08 2.44E+08 1.64E+07 1.86E+07 19.35 19.36 19.23
96 2.33E+08 2.19E+08 2.24E+08 2.25E+08 6.87E+06 7.77E+06 19.26 19.20 19.23
108 2.45E+08 2.42E+08 2.37E+08 2.41E+08 4.01E+06 4.54E+06 19.32 19.30 19.29
120 2.26E+08 2.38E+08 2.43E+08 2.35E+08 8.74E+06 9.89E+06 19.23 19.29 19.31
17.5
18.0
18.5
19.0
19.5
0 20 40 60 80 100
ln [
Cel
ls m
L-1
]
Specific growth rate (h-1
)
Trial 1 0.022
Trial 2 0.021
Trial 3 0.019
Average 0.021
STDEV 0.002
95% CI 0.002
y = 0.0224x + 17.474
y = 0.0205x + 17.598
y = 0.0187x + 17.702
17.5
18.0
18.5
19.0
19.5
0 20 40 60 80 100
Elapsed time (h)
ln [
Cel
ls m
L-1
]
Figure F.29. Specific growth rate calculations for Trial 1 (open circles), Trial 2 (open
squares), and Trial 3 (open triangles).

278
Table F.60. BC13 growth in the presence of 50 M malate.
Cells mL
-1ln (Cells mL
-1)
Elapsed Time (h) Trial 1 Trial 2 Trial 3 Average STDEV 95% CI Trial 1 Trial 2 Trial 3
0 5.58E+07 5.44E+07 5.58E+07 5.53E+07 8.08E+05 9.14E+05 17.84 17.81 17.84
12 5.50E+07 5.26E+07 5.36E+07 5.37E+07 1.24E+06 1.40E+06 17.82 17.78 17.80
24 6.66E+07 6.60E+07 7.03E+07 6.76E+07 2.32E+06 2.62E+06 18.01 18.00 18.07
36 8.66E+07 8.37E+07 9.55E+07 8.86E+07 6.12E+06 6.93E+06 18.28 18.24 18.37
48 1.11E+08 1.11E+08 1.07E+08 1.09E+08 2.35E+06 2.66E+06 18.52 18.52 18.48
60 1.42E+08 1.24E+08 1.23E+08 1.30E+08 1.09E+07 1.24E+07 18.77 18.63 18.63
72 1.79E+08 1.86E+08 1.78E+08 1.81E+08 4.45E+06 5.04E+06 19.00 19.04 19.00
84 2.04E+08 2.39E+08 2.25E+08 2.23E+08 1.73E+07 1.95E+07 19.14 19.29 19.23
96 2.26E+08 2.30E+08 2.11E+08 2.23E+08 1.02E+07 1.16E+07 19.24 19.26 19.17
108 2.17E+08 2.04E+08 2.11E+08 2.11E+08 6.88E+06 7.78E+06 19.20 19.13 19.17
120 2.04E+08 1.95E+08 2.02E+08 2.00E+08 5.09E+06 5.76E+06 19.14 19.09 19.12
17.5
18.0
18.5
19.0
19.5
0 20 40 60 80 100
ln [
Cel
ls m
L-1
]
Specific growth rate (h-1
)
Trial 1 0.019
Trial 2 0.021
Trial 3 0.019
Average 0.020
STDEV 0.001
95% CI 0.001
y = 0.0191x + 17.591
y = 0.0209x + 17.501
y = 0.0191x + 17.594
17.5
18.0
18.5
19.0
19.5
0 20 40 60 80 100
Elapsed time (h)
ln [
Cel
ls m
L-1
]
Figure F.30. Specific growth rate calculations for Trial 1 (open circles), Trial 2 (open
squares), and Trial 3 (open triangles).
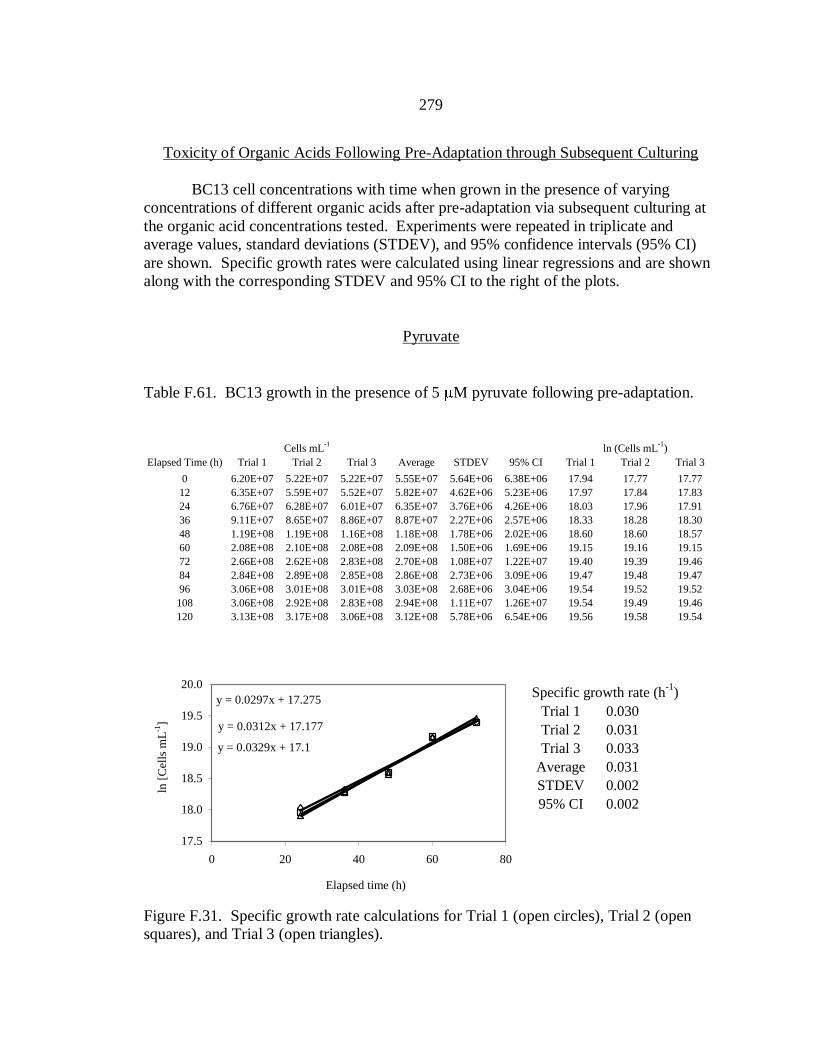
279
Toxicity of Organic Acids Following Pre-Adaptation through Subsequent Culturing
BC13 cell concentrations with time when grown in the presence of varying
concentrations of different organic acids after pre-adaptation via subsequent culturing at
the organic acid concentrations tested. Experiments were repeated in triplicate and
average values, standard deviations (STDEV), and 95% confidence intervals (95% CI)
are shown. Specific growth rates were calculated using linear regressions and are shown
along with the corresponding STDEV and 95% CI to the right of the plots.
Pyruvate
Table F.61. BC13 growth in the presence of 5 M pyruvate following pre-adaptation.
Cells mL
-1ln (Cells mL
-1)
Elapsed Time (h) Trial 1 Trial 2 Trial 3 Average STDEV 95% CI Trial 1 Trial 2 Trial 3
0 6.20E+07 5.22E+07 5.22E+07 5.55E+07 5.64E+06 6.38E+06 17.94 17.77 17.77
12 6.35E+07 5.59E+07 5.52E+07 5.82E+07 4.62E+06 5.23E+06 17.97 17.84 17.83
24 6.76E+07 6.28E+07 6.01E+07 6.35E+07 3.76E+06 4.26E+06 18.03 17.96 17.91
36 9.11E+07 8.65E+07 8.86E+07 8.87E+07 2.27E+06 2.57E+06 18.33 18.28 18.30
48 1.19E+08 1.19E+08 1.16E+08 1.18E+08 1.78E+06 2.02E+06 18.60 18.60 18.57
60 2.08E+08 2.10E+08 2.08E+08 2.09E+08 1.50E+06 1.69E+06 19.15 19.16 19.15
72 2.66E+08 2.62E+08 2.83E+08 2.70E+08 1.08E+07 1.22E+07 19.40 19.39 19.46
84 2.84E+08 2.89E+08 2.85E+08 2.86E+08 2.73E+06 3.09E+06 19.47 19.48 19.47
96 3.06E+08 3.01E+08 3.01E+08 3.03E+08 2.68E+06 3.04E+06 19.54 19.52 19.52
108 3.06E+08 2.92E+08 2.83E+08 2.94E+08 1.11E+07 1.26E+07 19.54 19.49 19.46
120 3.13E+08 3.17E+08 3.06E+08 3.12E+08 5.78E+06 6.54E+06 19.56 19.58 19.54
Specific growth rate (h-1
)
Trial 1 0.030
Trial 2 0.031
Trial 3 0.033
Average 0.031
STDEV 0.002
95% CI 0.002
y = 0.0297x + 17.275
y = 0.0312x + 17.177
y = 0.0329x + 17.1
17.5
18.0
18.5
19.0
19.5
20.0
0 20 40 60 80
Elapsed time (h)
ln [
Cel
ls m
L-1
]
Figure F.31. Specific growth rate calculations for Trial 1 (open circles), Trial 2 (open
squares), and Trial 3 (open triangles).

280
Table F.62. BC13 growth in the presence of 10 M pyruvate following pre-adaptation.
Cells mL
-1ln (Cells mL
-1)
Elapsed Time (h) Trial 1 Trial 2 Trial 3 Average STDEV 95% CI Trial 1 Trial 2 Trial 3
0 6.14E+08 5.88E+07 6.08E+07 2.45E+08 3.20E+08 3.62E+08 20.24 17.89 17.92
12 6.29E+07 6.22E+07 6.03E+07 6.18E+07 1.34E+06 1.52E+06 17.96 17.95 17.92
24 6.18E+07 6.45E+07 6.46E+07 6.36E+07 1.57E+06 1.77E+06 17.94 17.98 17.98
36 9.64E+07 9.43E+07 8.32E+07 9.13E+07 7.11E+06 8.05E+06 18.38 18.36 18.24
48 1.34E+08 1.42E+08 1.53E+08 1.43E+08 9.38E+06 1.06E+07 18.71 18.77 18.85
60 1.99E+08 1.87E+08 2.09E+08 1.98E+08 1.11E+07 1.25E+07 19.11 19.04 19.16
72 2.75E+08 2.83E+08 2.95E+08 2.84E+08 1.03E+07 1.16E+07 19.43 19.46 19.50
84 2.78E+08 2.70E+08 2.81E+08 2.76E+08 5.48E+06 6.20E+06 19.44 19.41 19.45
96 3.05E+08 3.05E+08 3.05E+08 3.05E+08 1.14E+05 1.29E+05 19.54 19.54 19.54
108 3.17E+08 3.13E+08 3.06E+08 3.12E+08 5.21E+06 5.89E+06 19.57 19.56 19.54
120 3.14E+08 3.11E+08 3.24E+08 3.16E+08 6.57E+06 7.43E+06 19.56 19.56 19.59
17.5
18.0
18.5
19.0
19.5
20.0
0 20 40 60 80
ln [
Cel
ls m
L-1
]
Specific growth rate (h-1
)
Trial 1 0.031
Trial 2 0.030
Trial 3 0.033
Average 0.031
STDEV 0.001
95% CI 0.002
y = 0.0309x + 17.233
y = 0.0303x + 17.269
y = 0.033x + 17.161
17.5
18.0
18.5
19.0
19.5
20.0
0 20 40 60 80
Elapsed time (h)
Figure F.32. Specific growth rate calculations for Trial 1 (open circles), Trial 2 (open
squares), and Trial 3 (open triangles).
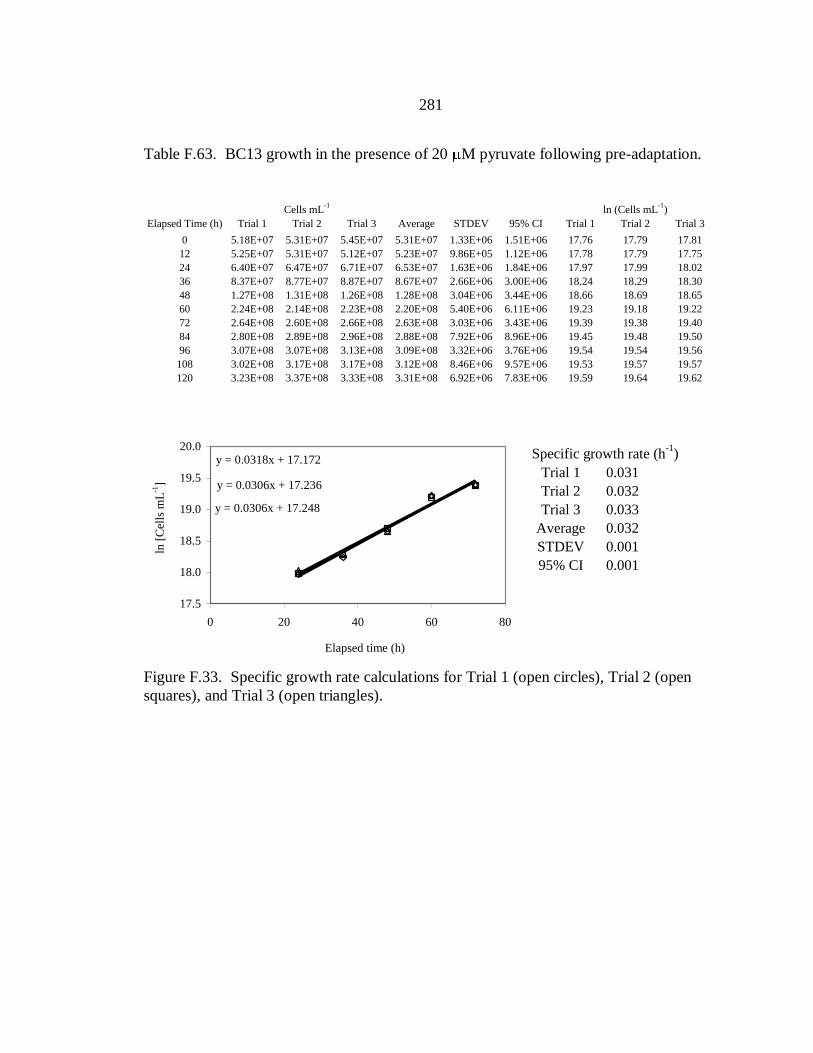
281
Table F.63. BC13 growth in the presence of 20 M pyruvate following pre-adaptation.
Cells mL
-1ln (Cells mL
-1)
Elapsed Time (h) Trial 1 Trial 2 Trial 3 Average STDEV 95% CI Trial 1 Trial 2 Trial 3
0 5.18E+07 5.31E+07 5.45E+07 5.31E+07 1.33E+06 1.51E+06 17.76 17.79 17.81
12 5.25E+07 5.31E+07 5.12E+07 5.23E+07 9.86E+05 1.12E+06 17.78 17.79 17.75
24 6.40E+07 6.47E+07 6.71E+07 6.53E+07 1.63E+06 1.84E+06 17.97 17.99 18.02
36 8.37E+07 8.77E+07 8.87E+07 8.67E+07 2.66E+06 3.00E+06 18.24 18.29 18.30
48 1.27E+08 1.31E+08 1.26E+08 1.28E+08 3.04E+06 3.44E+06 18.66 18.69 18.65
60 2.24E+08 2.14E+08 2.23E+08 2.20E+08 5.40E+06 6.11E+06 19.23 19.18 19.22
72 2.64E+08 2.60E+08 2.66E+08 2.63E+08 3.03E+06 3.43E+06 19.39 19.38 19.40
84 2.80E+08 2.89E+08 2.96E+08 2.88E+08 7.92E+06 8.96E+06 19.45 19.48 19.50
96 3.07E+08 3.07E+08 3.13E+08 3.09E+08 3.32E+06 3.76E+06 19.54 19.54 19.56
108 3.02E+08 3.17E+08 3.17E+08 3.12E+08 8.46E+06 9.57E+06 19.53 19.57 19.57
120 3.23E+08 3.37E+08 3.33E+08 3.31E+08 6.92E+06 7.83E+06 19.59 19.64 19.62
17.5
18.0
18.5
19.0
19.5
20.0
0 20 40 60 80
ln [
Cel
ls m
L-1
]
Specific growth rate (h-1
)
Trial 1 0.031
Trial 2 0.032
Trial 3 0.033
Average 0.032
STDEV 0.001
95% CI 0.001
y = 0.0318x + 17.172
y = 0.0306x + 17.236
y = 0.0306x + 17.248
17.5
18.0
18.5
19.0
19.5
20.0
0 20 40 60 80
Elapsed time (h)
ln [
Cel
ls m
L-1
]
Figure F.33. Specific growth rate calculations for Trial 1 (open circles), Trial 2 (open
squares), and Trial 3 (open triangles).

282
Table F.64. BC13 growth in the presence of 30 M pyruvate following pre-adaptation.
Cells mL
-1ln (Cells mL
-1)
Elapsed Time (h) Trial 1 Trial 2 Trial 3 Average STDEV 95% CI Trial 1 Trial 2 Trial 3
0 5.27E+07 5.32E+07 5.38E+07 5.32E+07 5.20E+05 5.89E+05 17.78 17.79 17.80
12 5.46E+07 5.72E+07 5.69E+07 5.63E+07 1.41E+06 1.59E+06 17.82 17.86 17.86
24 6.02E+07 6.07E+07 6.18E+07 6.09E+07 8.26E+05 9.35E+05 17.91 17.92 17.94
36 9.03E+07 9.19E+07 9.00E+07 9.07E+07 9.97E+05 1.13E+06 18.32 18.34 18.32
48 1.09E+08 1.13E+08 1.19E+08 1.14E+08 5.07E+06 5.74E+06 18.50 18.55 18.59
60 1.32E+08 1.62E+08 1.72E+08 1.55E+08 2.08E+07 2.36E+07 18.70 18.90 18.96
72 2.52E+08 2.32E+08 2.22E+08 2.35E+08 1.53E+07 1.73E+07 19.34 19.26 19.22
84 2.15E+08 2.12E+08 2.03E+08 2.10E+08 6.36E+06 7.19E+06 19.19 19.17 19.13
96 2.45E+08 2.39E+08 2.51E+08 2.45E+08 5.87E+06 6.65E+06 19.32 19.29 19.34
108 2.35E+08 2.44E+08 2.47E+08 2.42E+08 6.08E+06 6.89E+06 19.28 19.31 19.32
120 2.20E+08 2.15E+08 2.07E+08 2.14E+08 6.70E+06 7.58E+06 19.21 19.18 19.15
Specific growth rate (h-1
)
Trial 1 0.027
Trial 2 0.027
Trial 3 0.027
Average 0.027
STDEV 0.000
95% CI 0.000
y = 0.027x + 17.259
y = 0.0271x + 17.294
y = 0.0267x + 17.324
17.5
18.0
18.5
19.0
19.5
0 20 40 60 80
Elapsed time (h)
ln [
Cel
ls m
L-1
]
Figure F.34. Specific growth rate calculations for Trial 1 (open circles), Trial 2 (open
squares), and Trial 3 (open triangles).

283
Table F.65. BC13 growth in the presence of 50 M pyruvate following pre-adaptation.
Cells mL
-1ln (Cells mL
-1)
Elapsed Time (h) Trial 1 Trial 2 Trial 3 Average STDEV 95% CI Trial 1 Trial 2 Trial 3
0 5.38E+07 5.36E+07 5.63E+07 5.46E+07 1.49E+06 1.69E+06 17.80 17.80 17.85
12 5.51E+07 5.71E+07 5.84E+07 5.69E+07 1.71E+06 1.93E+06 17.82 17.86 17.88
24 6.79E+07 6.96E+07 6.73E+07 6.83E+07 1.17E+06 1.33E+06 18.03 18.06 18.02
36 9.20E+07 9.38E+07 9.32E+07 9.30E+07 9.32E+05 1.05E+06 18.34 18.36 18.35
48 1.04E+08 1.01E+08 1.06E+08 1.04E+08 2.34E+06 2.65E+06 18.46 18.43 18.48
60 1.26E+08 1.29E+08 1.32E+08 1.29E+08 2.78E+06 3.14E+06 18.65 18.67 18.70
72 1.79E+08 1.83E+08 1.90E+08 1.84E+08 5.69E+06 6.44E+06 19.01 19.02 19.06
84 2.17E+08 2.26E+08 2.26E+08 2.23E+08 5.42E+06 6.14E+06 19.19 19.24 19.23
96 2.74E+08 2.41E+08 2.53E+08 2.56E+08 1.67E+07 1.89E+07 19.43 19.30 19.35
108 2.40E+08 2.50E+08 2.44E+08 2.45E+08 5.32E+06 6.01E+06 19.29 19.34 19.31
120 2.28E+08 2.30E+08 2.34E+08 2.30E+08 2.92E+06 3.30E+06 19.24 19.25 19.27
17.5
18.0
18.5
19.0
19.5
20.0
0 20 40 60 80 100 120
ln [
Cel
ls m
L-1
]
Specific growth rate (h-1
)
Trial 1 0.019
Trial 2 0.018
Trial 3 0.019
Average 0.019
STDEV 0.001
95% CI 0.001
y = 0.0191x + 17.587
y = 0.0181x + 17.642
y = 0.0185x + 17.635
17.5
18.0
18.5
19.0
19.5
20.0
0 20 40 60 80 100 120
Elapsed time (h)
ln [
Cel
ls m
L-1
]
Figure F.35. Specific growth rate calculations for Trial 1 (open circles), Trial 2 (open
squares), and Trial 3 (open triangles).

284
Acetate
Table F.66. BC13 growth in the presence of 5 M acetate following pre-adaptation.
Cells mL
-1ln (Cells mL
-1)
Elapsed Time (h) Trial 1 Trial 2 Trial 3 Average STDEV 95% CI Trial 1 Trial 2 Trial 3
0 5.50E+07 5.01E+07 5.05E+07 5.19E+07 2.71E+06 3.07E+06 17.82 17.73 17.74
12 5.74E+07 5.46E+07 5.26E+07 5.49E+07 2.42E+06 2.74E+06 17.87 17.82 17.78
24 6.99E+07 6.50E+07 6.67E+07 6.72E+07 2.44E+06 2.77E+06 18.06 17.99 18.02
36 9.71E+07 8.79E+07 9.07E+07 9.19E+07 4.71E+06 5.33E+06 18.39 18.29 18.32
48 1.38E+08 1.24E+08 1.24E+08 1.29E+08 8.58E+06 9.71E+06 18.75 18.63 18.63
60 2.25E+08 1.99E+08 2.08E+08 2.11E+08 1.31E+07 1.48E+07 19.23 19.11 19.15
72 2.46E+08 2.74E+08 2.96E+08 2.72E+08 2.50E+07 2.83E+07 19.32 19.43 19.51
84 2.99E+08 2.79E+08 2.72E+08 2.83E+08 1.44E+07 1.63E+07 19.52 19.45 19.42
96 3.28E+08 2.99E+08 2.99E+08 3.08E+08 1.67E+07 1.89E+07 19.61 19.52 19.51
108 3.32E+08 3.04E+08 3.18E+08 3.18E+08 1.37E+07 1.55E+07 19.62 19.53 19.58
120 3.46E+08 3.27E+08 3.32E+08 3.35E+08 9.69E+06 1.10E+07 19.66 19.61 19.62
Specific growth rate (h-1
)
Trial 1 0.028
Trial 2 0.031
Trial 3 0.032
Average 0.030
STDEV 0.002
95% CI 0.002
y = 0.028x + 17.408
y = 0.0307x + 17.214
y = 0.0317x + 17.203
17.5
18.0
18.5
19.0
19.5
20.0
0 20 40 60 80
Elapsed time (h)
ln [
Cel
ls m
L-1
]
Figure F.36. Specific growth rate calculations for Trial 1 (open circles), Trial 2 (open
squares), and Trial 3 (open triangles).
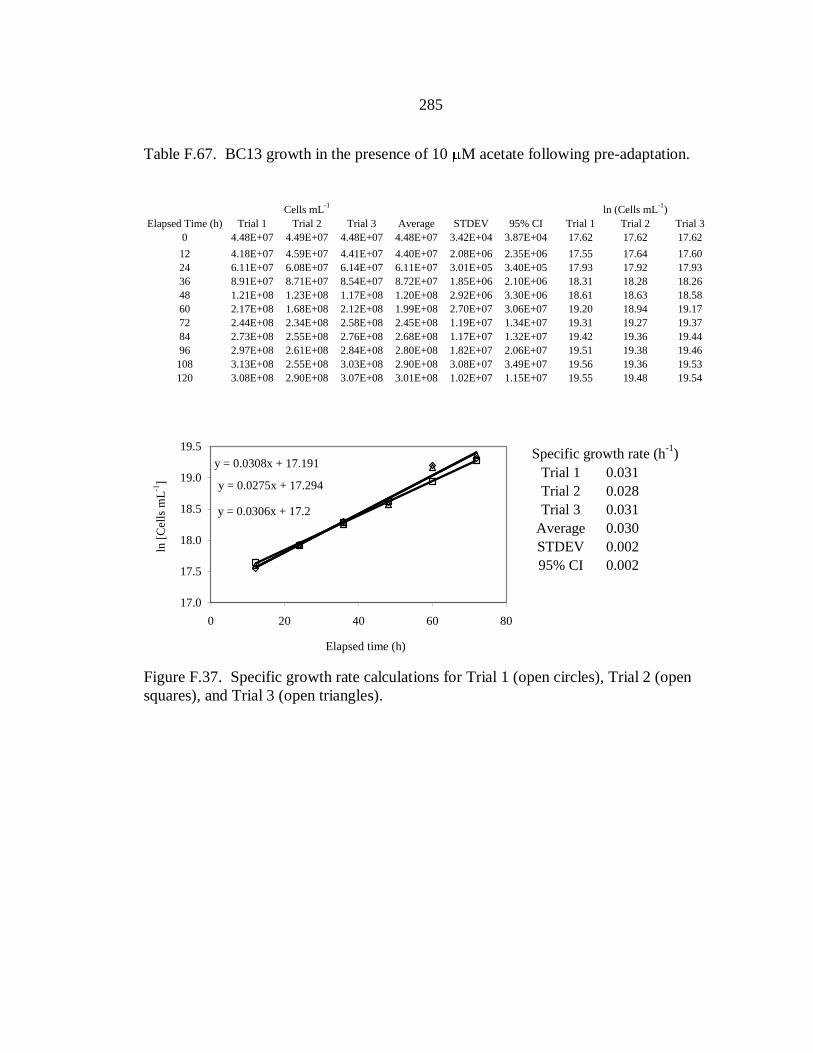
285
Table F.67. BC13 growth in the presence of 10 M acetate following pre-adaptation.
Cells mL
-1ln (Cells mL
-1)
Elapsed Time (h) Trial 1 Trial 2 Trial 3 Average STDEV 95% CI Trial 1 Trial 2 Trial 3
0 4.48E+07 4.49E+07 4.48E+07 4.48E+07 3.42E+04 3.87E+04 17.62 17.62 17.62
12 4.18E+07 4.59E+07 4.41E+07 4.40E+07 2.08E+06 2.35E+06 17.55 17.64 17.60
24 6.11E+07 6.08E+07 6.14E+07 6.11E+07 3.01E+05 3.40E+05 17.93 17.92 17.93
36 8.91E+07 8.71E+07 8.54E+07 8.72E+07 1.85E+06 2.10E+06 18.31 18.28 18.26
48 1.21E+08 1.23E+08 1.17E+08 1.20E+08 2.92E+06 3.30E+06 18.61 18.63 18.58
60 2.17E+08 1.68E+08 2.12E+08 1.99E+08 2.70E+07 3.06E+07 19.20 18.94 19.17
72 2.44E+08 2.34E+08 2.58E+08 2.45E+08 1.19E+07 1.34E+07 19.31 19.27 19.37
84 2.73E+08 2.55E+08 2.76E+08 2.68E+08 1.17E+07 1.32E+07 19.42 19.36 19.44
96 2.97E+08 2.61E+08 2.84E+08 2.80E+08 1.82E+07 2.06E+07 19.51 19.38 19.46
108 3.13E+08 2.55E+08 3.03E+08 2.90E+08 3.08E+07 3.49E+07 19.56 19.36 19.53
120 3.08E+08 2.90E+08 3.07E+08 3.01E+08 1.02E+07 1.15E+07 19.55 19.48 19.54
17.0
17.5
18.0
18.5
19.0
19.5
0 20 40 60 80
ln [
Cel
ls m
L-1
]
Specific growth rate (h-1
)
Trial 1 0.031
Trial 2 0.028
Trial 3 0.031
Average 0.030
STDEV 0.002
95% CI 0.002
y = 0.0308x + 17.191
y = 0.0275x + 17.294
y = 0.0306x + 17.2
17.0
17.5
18.0
18.5
19.0
19.5
0 20 40 60 80
Elapsed time (h)
ln [
Cel
ls m
L-1
]
Figure F.37. Specific growth rate calculations for Trial 1 (open circles), Trial 2 (open
squares), and Trial 3 (open triangles).

286
Table F.68. BC13 growth in the presence of 20 M acetate following pre-adaptation.
Cells mL
-1ln (Cells mL
-1)
Elapsed Time (h) Trial 1 Trial 2 Trial 3 Average STDEV 95% CI Trial 1 Trial 2 Trial 3
0 5.45E+07 5.51E+07 5.60E+07 5.52E+07 7.70E+05 8.71E+05 17.81 17.82 17.84
12 5.55E+07 5.86E+07 5.84E+07 5.75E+07 1.73E+06 1.96E+06 17.83 17.89 17.88
24 6.52E+07 6.95E+07 7.21E+07 6.89E+07 3.47E+06 3.93E+06 17.99 18.06 18.09
36 9.01E+07 9.09E+07 9.48E+07 9.19E+07 2.54E+06 2.88E+06 18.32 18.32 18.37
48 1.35E+08 1.34E+08 1.36E+08 1.35E+08 1.30E+06 1.47E+06 18.72 18.71 18.73
60 1.60E+08 1.55E+08 1.52E+08 1.55E+08 4.34E+06 4.91E+06 18.89 18.86 18.84
72 2.20E+08 1.97E+08 2.27E+08 2.14E+08 1.58E+07 1.79E+07 19.21 19.10 19.24
84 2.75E+08 2.79E+08 2.67E+08 2.73E+08 6.10E+06 6.91E+06 19.43 19.45 19.40
96 2.99E+08 3.03E+08 3.17E+08 3.06E+08 9.40E+06 1.06E+07 19.52 19.53 19.57
108 3.04E+08 2.92E+08 2.79E+08 2.92E+08 1.26E+07 1.42E+07 19.53 19.49 19.45
120 3.02E+08 3.04E+08 3.29E+08 3.11E+08 1.50E+07 1.69E+07 19.52 19.53 19.61
17.5
18.0
18.5
19.0
19.5
0 20 40 60 80
ln [
Cel
ls m
L-1
]
Specific growth rate (h-1
)
Trial 1 0.024
Trial 2 0.021
Trial 3 0.022
Average 0.022
STDEV 0.001
95% CI 0.002
y = 0.0238x + 17.495
y = 0.021x + 17.605
y = 0.0223x + 17.587
17.5
18.0
18.5
19.0
19.5
0 20 40 60 80
Elapsed time (h)
ln [
Cel
ls m
L-1
]
Figure F.38. Specific growth rate calculations for Trial 1 (open circles), Trial 2 (open
squares), and Trial 3 (open triangles).
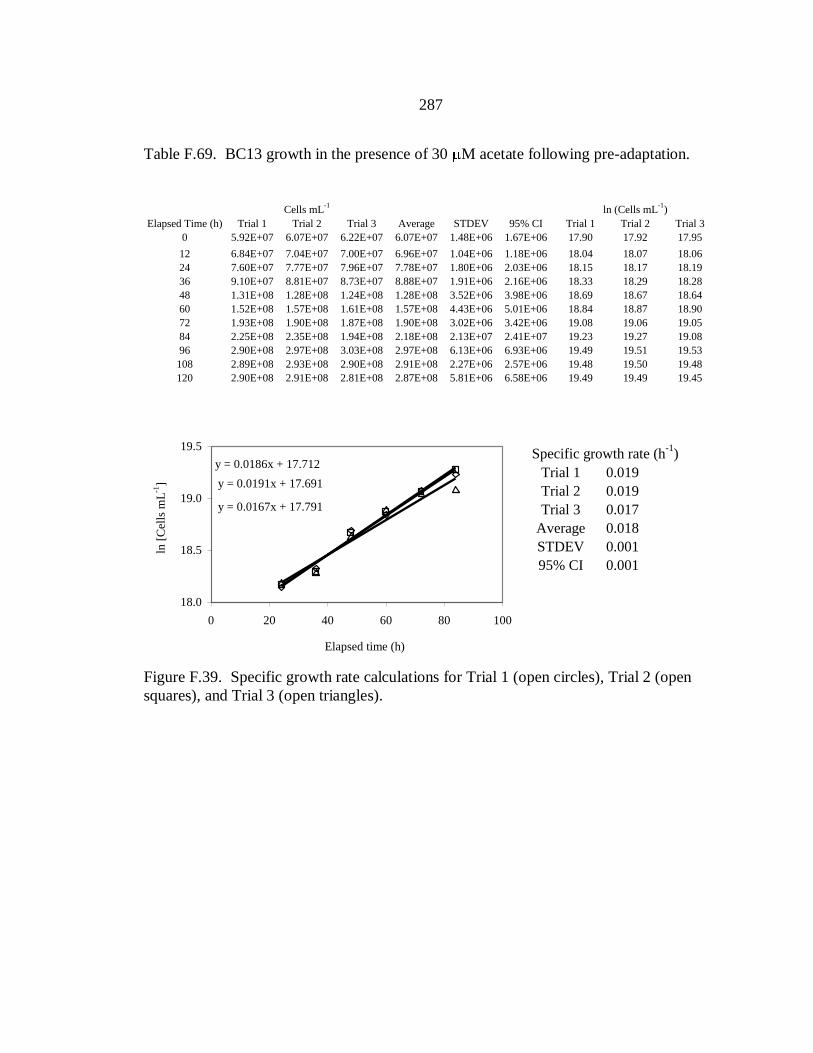
287
Table F.69. BC13 growth in the presence of 30 M acetate following pre-adaptation.
Cells mL
-1ln (Cells mL
-1)
Elapsed Time (h) Trial 1 Trial 2 Trial 3 Average STDEV 95% CI Trial 1 Trial 2 Trial 3
0 5.92E+07 6.07E+07 6.22E+07 6.07E+07 1.48E+06 1.67E+06 17.90 17.92 17.95
12 6.84E+07 7.04E+07 7.00E+07 6.96E+07 1.04E+06 1.18E+06 18.04 18.07 18.06
24 7.60E+07 7.77E+07 7.96E+07 7.78E+07 1.80E+06 2.03E+06 18.15 18.17 18.19
36 9.10E+07 8.81E+07 8.73E+07 8.88E+07 1.91E+06 2.16E+06 18.33 18.29 18.28
48 1.31E+08 1.28E+08 1.24E+08 1.28E+08 3.52E+06 3.98E+06 18.69 18.67 18.64
60 1.52E+08 1.57E+08 1.61E+08 1.57E+08 4.43E+06 5.01E+06 18.84 18.87 18.90
72 1.93E+08 1.90E+08 1.87E+08 1.90E+08 3.02E+06 3.42E+06 19.08 19.06 19.05
84 2.25E+08 2.35E+08 1.94E+08 2.18E+08 2.13E+07 2.41E+07 19.23 19.27 19.08
96 2.90E+08 2.97E+08 3.03E+08 2.97E+08 6.13E+06 6.93E+06 19.49 19.51 19.53
108 2.89E+08 2.93E+08 2.90E+08 2.91E+08 2.27E+06 2.57E+06 19.48 19.50 19.48
120 2.90E+08 2.91E+08 2.81E+08 2.87E+08 5.81E+06 6.58E+06 19.49 19.49 19.45
18.0
18.5
19.0
19.5
0 20 40 60 80 100
ln [
Cel
ls m
L-1
]
Specific growth rate (h-1
)
Trial 1 0.019
Trial 2 0.019
Trial 3 0.017
Average 0.018
STDEV 0.001
95% CI 0.001
y = 0.0186x + 17.712
y = 0.0191x + 17.691
y = 0.0167x + 17.791
18.0
18.5
19.0
19.5
0 20 40 60 80 100
Elapsed time (h)
ln [
Cel
ls m
L-1
]
Figure F.39. Specific growth rate calculations for Trial 1 (open circles), Trial 2 (open
squares), and Trial 3 (open triangles).
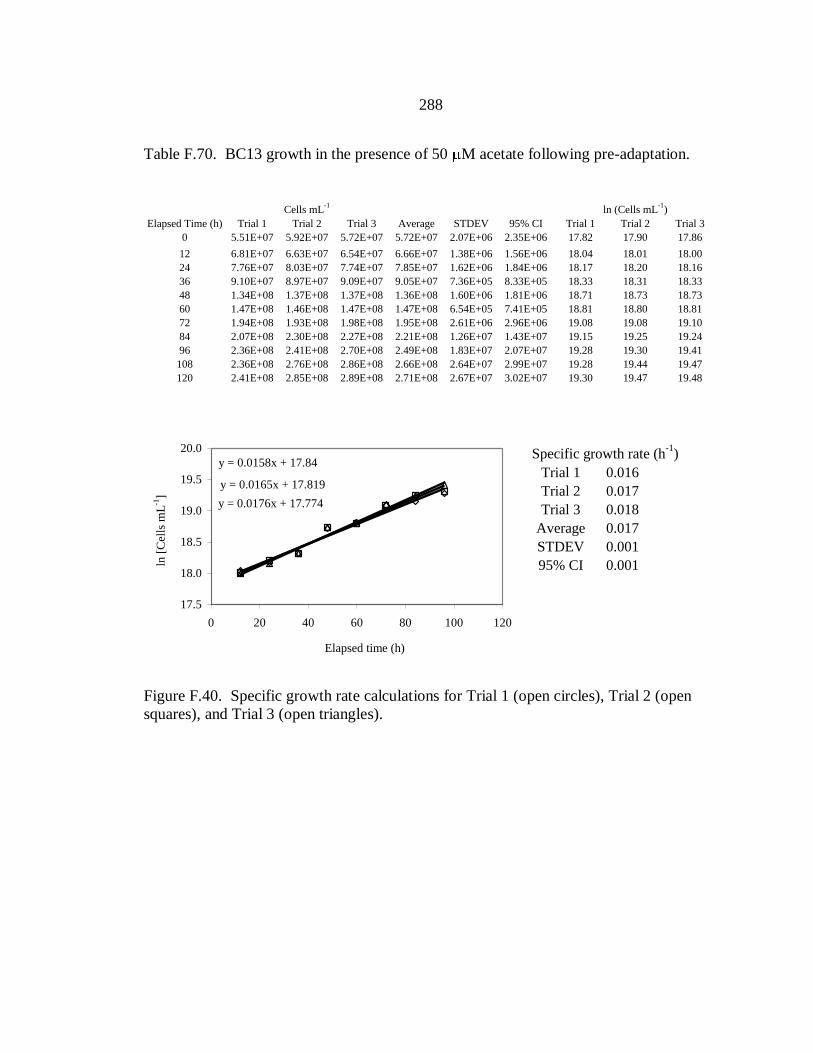
288
Table F.70. BC13 growth in the presence of 50 M acetate following pre-adaptation.
Cells mL
-1ln (Cells mL
-1)
Elapsed Time (h) Trial 1 Trial 2 Trial 3 Average STDEV 95% CI Trial 1 Trial 2 Trial 3
0 5.51E+07 5.92E+07 5.72E+07 5.72E+07 2.07E+06 2.35E+06 17.82 17.90 17.86
12 6.81E+07 6.63E+07 6.54E+07 6.66E+07 1.38E+06 1.56E+06 18.04 18.01 18.00
24 7.76E+07 8.03E+07 7.74E+07 7.85E+07 1.62E+06 1.84E+06 18.17 18.20 18.16
36 9.10E+07 8.97E+07 9.09E+07 9.05E+07 7.36E+05 8.33E+05 18.33 18.31 18.33
48 1.34E+08 1.37E+08 1.37E+08 1.36E+08 1.60E+06 1.81E+06 18.71 18.73 18.73
60 1.47E+08 1.46E+08 1.47E+08 1.47E+08 6.54E+05 7.41E+05 18.81 18.80 18.81
72 1.94E+08 1.93E+08 1.98E+08 1.95E+08 2.61E+06 2.96E+06 19.08 19.08 19.10
84 2.07E+08 2.30E+08 2.27E+08 2.21E+08 1.26E+07 1.43E+07 19.15 19.25 19.24
96 2.36E+08 2.41E+08 2.70E+08 2.49E+08 1.83E+07 2.07E+07 19.28 19.30 19.41
108 2.36E+08 2.76E+08 2.86E+08 2.66E+08 2.64E+07 2.99E+07 19.28 19.44 19.47
120 2.41E+08 2.85E+08 2.89E+08 2.71E+08 2.67E+07 3.02E+07 19.30 19.47 19.48
17.5
18.0
18.5
19.0
19.5
20.0
0 20 40 60 80 100 120
ln [
Cel
ls m
L-1
]
Specific growth rate (h-1
)
Trial 1 0.016
Trial 2 0.017
Trial 3 0.018
Average 0.017
STDEV 0.001
95% CI 0.001
y = 0.0158x + 17.84
y = 0.0165x + 17.819
y = 0.0176x + 17.774
17.5
18.0
18.5
19.0
19.5
20.0
0 20 40 60 80 100 120
Elapsed time (h)
ln [
Cel
ls m
L-1
]
Figure F.40. Specific growth rate calculations for Trial 1 (open circles), Trial 2 (open
squares), and Trial 3 (open triangles).

289
Citrate
Table F.71. BC13 growth in the presence of 5 M citrate following pre-adaptation.
Cells mL
-1ln (Cells mL
-1)
Elapsed Time (h) Trial 1 Trial 2 Trial 3 Average STDEV 95% CI Trial 1 Trial 2 Trial 3
0 6.10E+06 6.20E+06 5.80E+06 6.03E+06 2.07E+05 2.35E+05 15.62 15.64 15.57
12 5.90E+07 5.87E+07 5.96E+07 5.91E+07 4.40E+05 4.98E+05 17.89 17.89 17.90
24 6.25E+07 6.75E+07 6.90E+07 6.63E+07 3.43E+06 3.89E+06 17.95 18.03 18.05
36 9.20E+07 9.41E+07 9.04E+07 9.21E+07 1.83E+06 2.07E+06 18.34 18.36 18.32
48 1.30E+08 1.31E+08 1.33E+08 1.31E+08 1.48E+06 1.68E+06 18.69 18.69 18.71
60 2.26E+08 2.15E+08 2.26E+08 2.22E+08 6.02E+06 6.81E+06 19.23 19.19 19.23
72 2.61E+08 2.48E+08 2.85E+08 2.64E+08 1.88E+07 2.12E+07 19.38 19.33 19.47
84 2.90E+08 3.02E+08 2.95E+08 2.96E+08 5.85E+06 6.62E+06 19.49 19.53 19.50
96 3.21E+08 3.22E+08 3.09E+08 3.17E+08 6.88E+06 7.79E+06 19.59 19.59 19.55
108 3.22E+08 3.32E+08 3.30E+08 3.28E+08 5.60E+06 6.33E+06 19.59 19.62 19.61
120 3.25E+08 3.13E+08 3.04E+08 3.14E+08 1.04E+07 1.18E+07 19.60 19.56 19.53
Specific growth rate (h-1
)
Trial 1 0.031
Trial 2 0.029
Trial 3 0.031
Average 0.030
STDEV 0.002
95% CI 0.002
y = 0.0313x + 17.215
y = 0.0286x + 17.346
y = 0.0312x + 17.256
17.5
18.0
18.5
19.0
19.5
20.0
0 20 40 60 80
Elapsed time (h)
ln [
Cel
ls m
L-1
]
Figure F.41. Specific growth rate calculations for Trial 1 (open circles), Trial 2 (open
squares), and Trial 3 (open triangles).
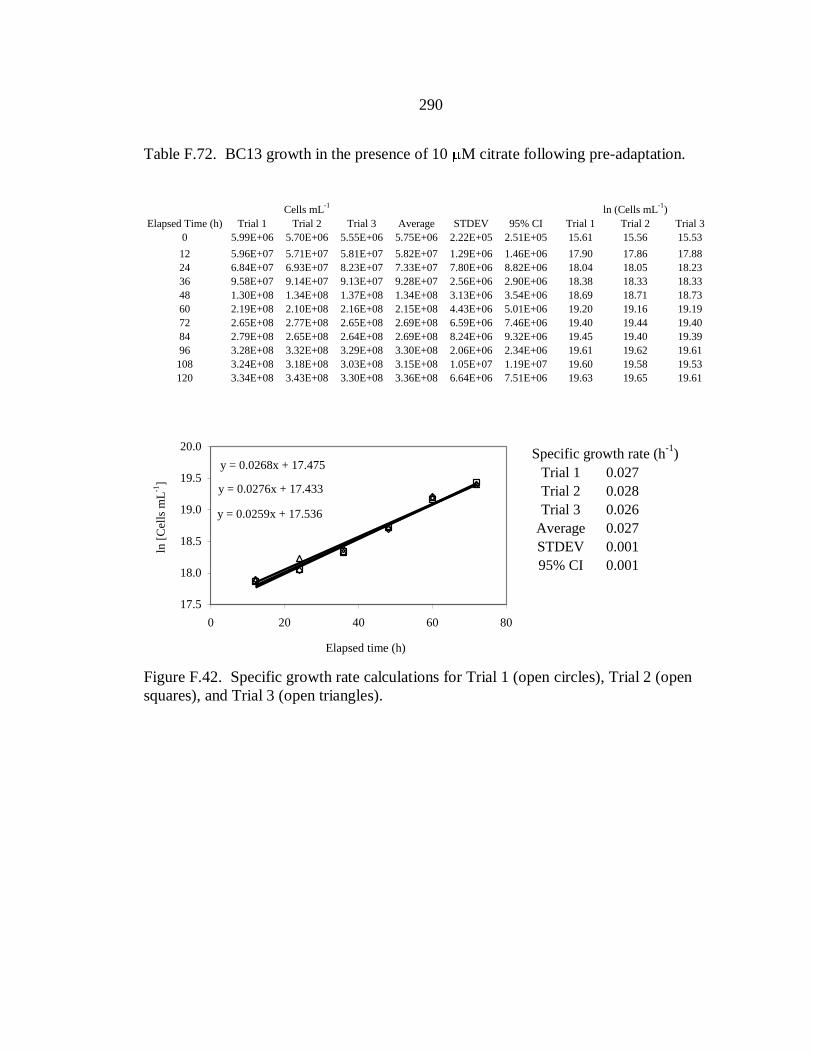
290
Table F.72. BC13 growth in the presence of 10 M citrate following pre-adaptation.
Cells mL
-1ln (Cells mL
-1)
Elapsed Time (h) Trial 1 Trial 2 Trial 3 Average STDEV 95% CI Trial 1 Trial 2 Trial 3
0 5.99E+06 5.70E+06 5.55E+06 5.75E+06 2.22E+05 2.51E+05 15.61 15.56 15.53
12 5.96E+07 5.71E+07 5.81E+07 5.82E+07 1.29E+06 1.46E+06 17.90 17.86 17.88
24 6.84E+07 6.93E+07 8.23E+07 7.33E+07 7.80E+06 8.82E+06 18.04 18.05 18.23
36 9.58E+07 9.14E+07 9.13E+07 9.28E+07 2.56E+06 2.90E+06 18.38 18.33 18.33
48 1.30E+08 1.34E+08 1.37E+08 1.34E+08 3.13E+06 3.54E+06 18.69 18.71 18.73
60 2.19E+08 2.10E+08 2.16E+08 2.15E+08 4.43E+06 5.01E+06 19.20 19.16 19.19
72 2.65E+08 2.77E+08 2.65E+08 2.69E+08 6.59E+06 7.46E+06 19.40 19.44 19.40
84 2.79E+08 2.65E+08 2.64E+08 2.69E+08 8.24E+06 9.32E+06 19.45 19.40 19.39
96 3.28E+08 3.32E+08 3.29E+08 3.30E+08 2.06E+06 2.34E+06 19.61 19.62 19.61
108 3.24E+08 3.18E+08 3.03E+08 3.15E+08 1.05E+07 1.19E+07 19.60 19.58 19.53
120 3.34E+08 3.43E+08 3.30E+08 3.36E+08 6.64E+06 7.51E+06 19.63 19.65 19.61
17.5
18.0
18.5
19.0
19.5
20.0
0 20 40 60 80
ln [
Cel
ls m
L-1
]
Specific growth rate (h-1
)
Trial 1 0.027
Trial 2 0.028
Trial 3 0.026
Average 0.027
STDEV 0.001
95% CI 0.001
y = 0.0268x + 17.475
y = 0.0276x + 17.433
y = 0.0259x + 17.536
17.5
18.0
18.5
19.0
19.5
20.0
0 20 40 60 80
Elapsed time (h)
ln [
Cel
ls m
L-1
]
Figure F.42. Specific growth rate calculations for Trial 1 (open circles), Trial 2 (open
squares), and Trial 3 (open triangles).
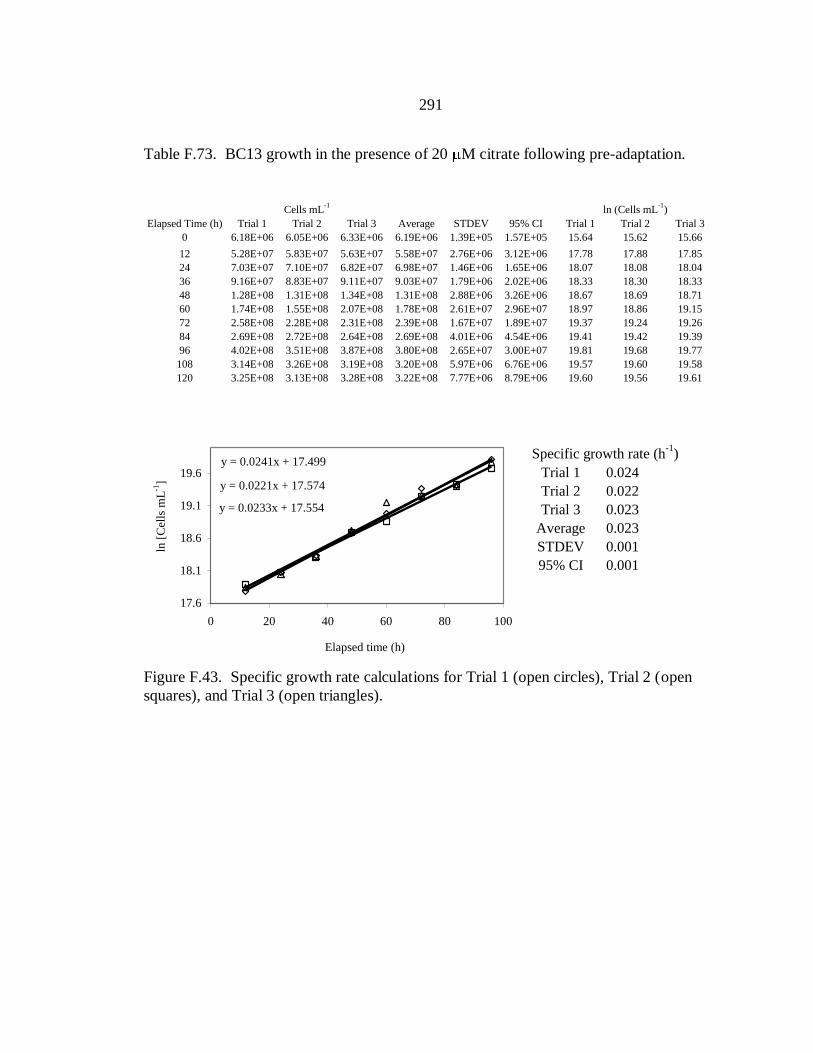
291
Table F.73. BC13 growth in the presence of 20 M citrate following pre-adaptation.
Cells mL
-1ln (Cells mL
-1)
Elapsed Time (h) Trial 1 Trial 2 Trial 3 Average STDEV 95% CI Trial 1 Trial 2 Trial 3
0 6.18E+06 6.05E+06 6.33E+06 6.19E+06 1.39E+05 1.57E+05 15.64 15.62 15.66
12 5.28E+07 5.83E+07 5.63E+07 5.58E+07 2.76E+06 3.12E+06 17.78 17.88 17.85
24 7.03E+07 7.10E+07 6.82E+07 6.98E+07 1.46E+06 1.65E+06 18.07 18.08 18.04
36 9.16E+07 8.83E+07 9.11E+07 9.03E+07 1.79E+06 2.02E+06 18.33 18.30 18.33
48 1.28E+08 1.31E+08 1.34E+08 1.31E+08 2.88E+06 3.26E+06 18.67 18.69 18.71
60 1.74E+08 1.55E+08 2.07E+08 1.78E+08 2.61E+07 2.96E+07 18.97 18.86 19.15
72 2.58E+08 2.28E+08 2.31E+08 2.39E+08 1.67E+07 1.89E+07 19.37 19.24 19.26
84 2.69E+08 2.72E+08 2.64E+08 2.69E+08 4.01E+06 4.54E+06 19.41 19.42 19.39
96 4.02E+08 3.51E+08 3.87E+08 3.80E+08 2.65E+07 3.00E+07 19.81 19.68 19.77
108 3.14E+08 3.26E+08 3.19E+08 3.20E+08 5.97E+06 6.76E+06 19.57 19.60 19.58
120 3.25E+08 3.13E+08 3.28E+08 3.22E+08 7.77E+06 8.79E+06 19.60 19.56 19.61
17.6
18.1
18.6
19.1
19.6
0 20 40 60 80 100
ln [
Cel
ls m
L-1
]
Specific growth rate (h-1
)
Trial 1 0.024
Trial 2 0.022
Trial 3 0.023
Average 0.023
STDEV 0.001
95% CI 0.001
y = 0.0241x + 17.499
y = 0.0221x + 17.574
y = 0.0233x + 17.554
17.6
18.1
18.6
19.1
19.6
0 20 40 60 80 100
Elapsed time (h)
ln [
Cel
ls m
L-1
]
Figure F.43. Specific growth rate calculations for Trial 1 (open circles), Trial 2 (open
squares), and Trial 3 (open triangles).
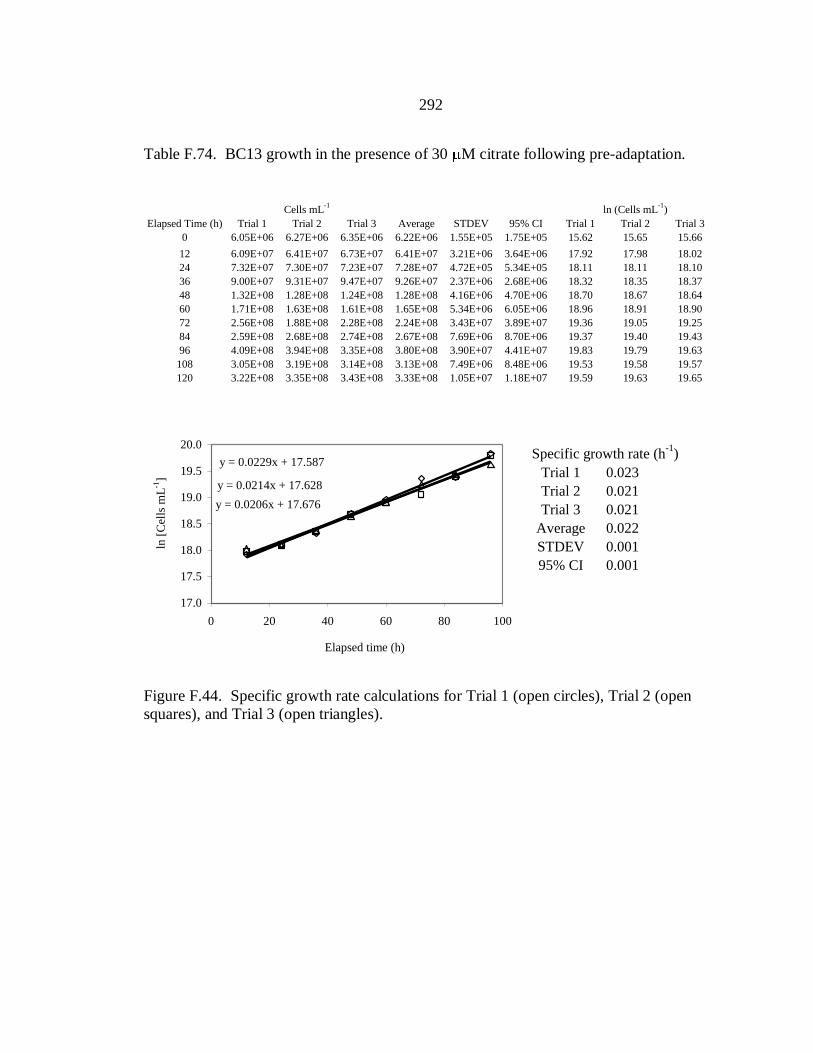
292
Table F.74. BC13 growth in the presence of 30 M citrate following pre-adaptation.
Cells mL
-1ln (Cells mL
-1)
Elapsed Time (h) Trial 1 Trial 2 Trial 3 Average STDEV 95% CI Trial 1 Trial 2 Trial 3
0 6.05E+06 6.27E+06 6.35E+06 6.22E+06 1.55E+05 1.75E+05 15.62 15.65 15.66
12 6.09E+07 6.41E+07 6.73E+07 6.41E+07 3.21E+06 3.64E+06 17.92 17.98 18.02
24 7.32E+07 7.30E+07 7.23E+07 7.28E+07 4.72E+05 5.34E+05 18.11 18.11 18.10
36 9.00E+07 9.31E+07 9.47E+07 9.26E+07 2.37E+06 2.68E+06 18.32 18.35 18.37
48 1.32E+08 1.28E+08 1.24E+08 1.28E+08 4.16E+06 4.70E+06 18.70 18.67 18.64
60 1.71E+08 1.63E+08 1.61E+08 1.65E+08 5.34E+06 6.05E+06 18.96 18.91 18.90
72 2.56E+08 1.88E+08 2.28E+08 2.24E+08 3.43E+07 3.89E+07 19.36 19.05 19.25
84 2.59E+08 2.68E+08 2.74E+08 2.67E+08 7.69E+06 8.70E+06 19.37 19.40 19.43
96 4.09E+08 3.94E+08 3.35E+08 3.80E+08 3.90E+07 4.41E+07 19.83 19.79 19.63
108 3.05E+08 3.19E+08 3.14E+08 3.13E+08 7.49E+06 8.48E+06 19.53 19.58 19.57
120 3.22E+08 3.35E+08 3.43E+08 3.33E+08 1.05E+07 1.18E+07 19.59 19.63 19.65
17.0
17.5
18.0
18.5
19.0
19.5
20.0
0 20 40 60 80 100
ln [
Cel
ls m
L-1
]
Specific growth rate (h-1
)
Trial 1 0.023
Trial 2 0.021
Trial 3 0.021
Average 0.022
STDEV 0.001
95% CI 0.001
y = 0.0229x + 17.587
y = 0.0214x + 17.628
y = 0.0206x + 17.676
17.0
17.5
18.0
18.5
19.0
19.5
20.0
0 20 40 60 80 100
Elapsed time (h)
ln [
Cel
ls m
L-1
]
Figure F.44. Specific growth rate calculations for Trial 1 (open circles), Trial 2 (open
squares), and Trial 3 (open triangles).

293
Table F.75. BC13 growth in the presence of 50 M citrate following pre-adaptation.
Cells mL
-1ln (Cells mL
-1)
Elapsed Time (h) Trial 1 Trial 2 Trial 3 Average STDEV 95% CI Trial 1 Trial 2 Trial 3
0 6.30E+06 6.15E+06 6.42E+06 6.29E+06 1.38E+05 1.56E+05 15.66 15.63 15.68
12 5.84E+07 5.70E+07 5.95E+07 5.83E+07 1.24E+06 1.40E+06 17.88 17.86 17.90
24 7.15E+07 7.06E+07 7.07E+07 7.09E+07 5.22E+05 5.91E+05 18.09 18.07 18.07
36 8.73E+07 8.40E+07 8.18E+07 8.44E+07 2.77E+06 3.14E+06 18.28 18.25 18.22
48 1.03E+08 9.52E+07 1.11E+08 1.03E+08 8.12E+06 9.19E+06 18.45 18.37 18.53
60 1.46E+08 1.24E+08 1.47E+08 1.39E+08 1.33E+07 1.50E+07 18.80 18.63 18.81
72 1.84E+08 1.99E+08 1.70E+08 1.84E+08 1.41E+07 1.59E+07 19.03 19.11 18.95
84 1.90E+08 2.04E+08 2.04E+08 1.99E+08 7.96E+06 9.01E+06 19.06 19.13 19.14
96 2.69E+08 2.54E+08 2.24E+08 2.49E+08 2.29E+07 2.59E+07 19.41 19.35 19.23
108 2.80E+08 2.61E+08 2.70E+08 2.70E+08 9.34E+06 1.06E+07 19.45 19.38 19.41
120 2.80E+08 2.51E+08 2.69E+08 2.67E+08 1.47E+07 1.66E+07 19.45 19.34 19.4117.0
17.5
18.0
18.5
19.0
19.5
20.0
0 20 40 60 80 100
ln [
Cel
ls m
L-1
]
Specific growth rate (h-1
)
Trial 1 0.018
Trial 2 0.019
Trial 3 0.017
Average 0.018
STDEV 0.001
95% CI 0.001
y = 0.018x + 17.653
y = 0.0185x + 17.6
y = 0.017x + 17.691
17.0
17.5
18.0
18.5
19.0
19.5
20.0
0 20 40 60 80 100
Elapsed time (h)
ln [
Cel
ls m
L-1
]
Figure F.45. Specific growth rate calculations for Trial 1 (open circles), Trial 2 (open
squares), and Trial 3 (open triangles).

294
2-ketoglutarate
Table F.76. BC13 growth in the presence of 5 M 2-ketoglutarate following pre-
adaptation.
Cells mL
-1ln (Cells mL
-1)
Elapsed Time (h) Trial 1 Trial 2 Trial 3 Average STDEV 95% CI Trial 1 Trial 2 Trial 3
0 5.40E+07 5.65E+07 5.42E+07 5.49E+07 1.41E+06 1.59E+06 17.80 17.85 17.81
12 5.95E+07 6.03E+07 6.00E+07 5.99E+07 3.91E+05 4.42E+05 17.90 17.91 17.91
24 6.31E+07 6.51E+07 6.68E+07 6.50E+07 1.89E+06 2.14E+06 17.96 17.99 18.02
36 9.01E+07 8.95E+07 9.59E+07 9.18E+07 3.51E+06 3.98E+06 18.32 18.31 18.38
48 1.34E+08 1.33E+08 1.30E+08 1.32E+08 2.23E+06 2.53E+06 18.72 18.70 18.68
60 2.06E+08 2.08E+08 2.04E+08 2.06E+08 1.93E+06 2.18E+06 19.14 19.15 19.13
72 2.46E+08 2.50E+08 2.42E+08 2.46E+08 4.26E+06 4.82E+06 19.32 19.34 19.30
84 2.64E+08 2.62E+08 2.49E+08 2.58E+08 8.08E+06 9.14E+06 19.39 19.38 19.33
96 2.96E+08 2.88E+08 2.85E+08 2.89E+08 5.41E+06 6.13E+06 19.50 19.48 19.47
108 3.21E+08 3.25E+08 3.29E+08 3.25E+08 4.23E+06 4.79E+06 19.59 19.60 19.61
120 3.30E+08 3.29E+08 3.24E+08 3.28E+08 3.35E+06 3.79E+06 19.61 19.61 19.60
Specific growth rate (h-1
)
Trial 1 0.030
Trial 2 0.030
Trial 3 0.028
Average 0.029
STDEV 0.001
95% CI 0.001
y = 0.0296x + 17.272
y = 0.0295x + 17.285
y = 0.0277x + 17.373
17.5
18.0
18.5
19.0
19.5
0 20 40 60 80
Elapsed time (h)
ln [
Cel
ls m
L-1
]
Figure F.46. Specific growth rate calculations for Trial 1 (open circles), Trial 2 (open
squares), and Trial 3 (open triangles).

295
Table F.77. BC13 growth in the presence of 10 M 2-ketoglutarate following pre-
adaptation.
Cells mL
-1ln (Cells mL
-1)
Elapsed Time (h) Trial 1 Trial 2 Trial 3 Average STDEV 95% CI Trial 1 Trial 2 Trial 3
0 5.63E+07 5.56E+07 5.74E+07 5.64E+07 9.11E+05 1.03E+06 17.85 17.83 17.87
12 5.81E+07 5.39E+07 5.93E+07 5.71E+07 2.85E+06 3.22E+06 17.88 17.80 17.90
24 6.77E+07 6.53E+07 6.43E+07 6.58E+07 1.79E+06 2.02E+06 18.03 18.00 17.98
36 8.57E+07 8.22E+07 8.06E+07 8.28E+07 2.58E+06 2.92E+06 18.27 18.22 18.21
48 1.30E+08 1.24E+08 1.20E+08 1.25E+08 4.76E+06 5.39E+06 18.68 18.63 18.61
60 2.09E+08 1.69E+08 1.57E+08 1.78E+08 2.71E+07 3.07E+07 19.16 18.95 18.87
72 2.40E+08 2.33E+08 2.27E+08 2.33E+08 6.12E+06 6.93E+06 19.29 19.27 19.24
84 2.64E+08 2.71E+08 2.70E+08 2.68E+08 3.85E+06 4.35E+06 19.39 19.42 19.42
96 2.91E+08 2.91E+08 2.97E+08 2.93E+08 3.34E+06 3.78E+06 19.49 19.49 19.51
108 3.00E+08 3.16E+08 3.04E+08 3.07E+08 8.20E+06 9.28E+06 19.52 19.57 19.53
120 2.89E+08 3.15E+08 3.07E+08 3.04E+08 1.32E+07 1.49E+07 19.48 19.57 19.54
Specific growth rate (h-1
)
Trial 1 0.024
Trial 2 0.024
Trial 3 0.023
Average 0.024
STDEV 0.001
95% CI 0.001
y = 0.0237x + 17.534
y = 0.0241x + 17.454
y = 0.0231x + 17.496
17.5
18.0
18.5
19.0
19.5
20.0
0 20 40 60 80 100
Elapsed time (h)
ln [
Cel
ls m
L-1
]
Figure F.47. Specific growth rate calculations for Trial 1 (open circles), Trial 2 (open
squares), and Trial 3 (open triangles).
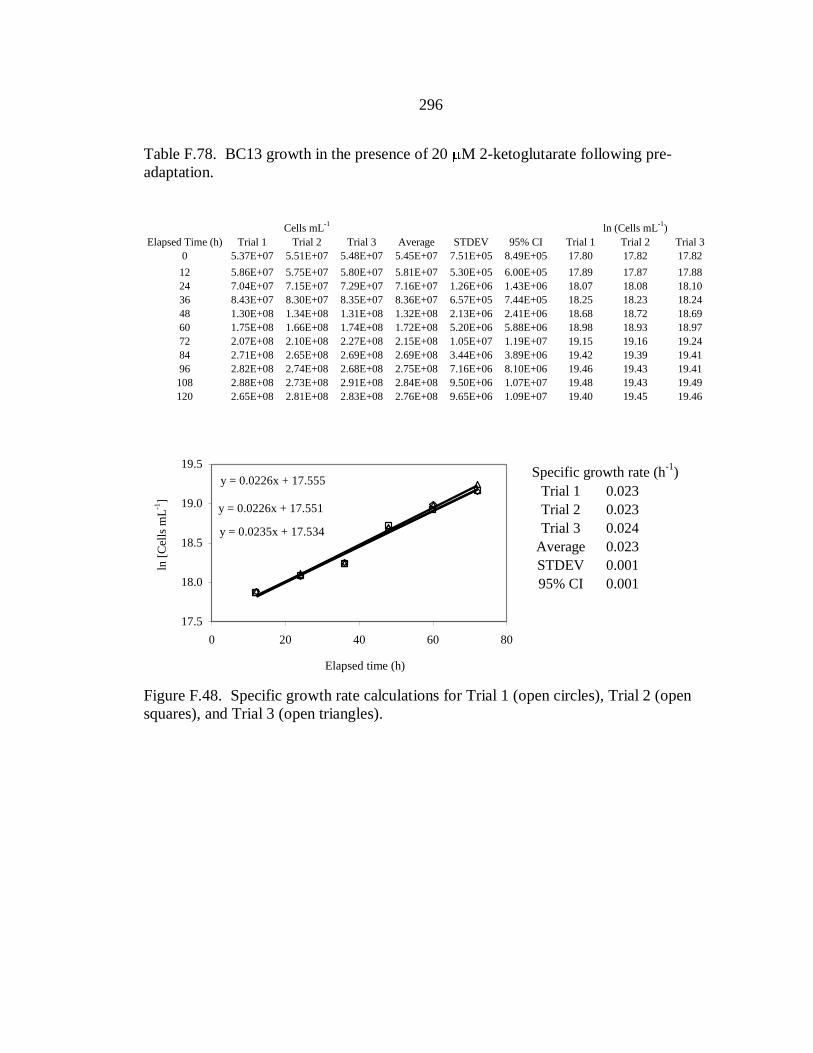
296
Table F.78. BC13 growth in the presence of 20 M 2-ketoglutarate following pre-
adaptation.
Cells mL
-1ln (Cells mL
-1)
Elapsed Time (h) Trial 1 Trial 2 Trial 3 Average STDEV 95% CI Trial 1 Trial 2 Trial 3
0 5.37E+07 5.51E+07 5.48E+07 5.45E+07 7.51E+05 8.49E+05 17.80 17.82 17.82
12 5.86E+07 5.75E+07 5.80E+07 5.81E+07 5.30E+05 6.00E+05 17.89 17.87 17.88
24 7.04E+07 7.15E+07 7.29E+07 7.16E+07 1.26E+06 1.43E+06 18.07 18.08 18.10
36 8.43E+07 8.30E+07 8.35E+07 8.36E+07 6.57E+05 7.44E+05 18.25 18.23 18.24
48 1.30E+08 1.34E+08 1.31E+08 1.32E+08 2.13E+06 2.41E+06 18.68 18.72 18.69
60 1.75E+08 1.66E+08 1.74E+08 1.72E+08 5.20E+06 5.88E+06 18.98 18.93 18.97
72 2.07E+08 2.10E+08 2.27E+08 2.15E+08 1.05E+07 1.19E+07 19.15 19.16 19.24
84 2.71E+08 2.65E+08 2.69E+08 2.69E+08 3.44E+06 3.89E+06 19.42 19.39 19.41
96 2.82E+08 2.74E+08 2.68E+08 2.75E+08 7.16E+06 8.10E+06 19.46 19.43 19.41
108 2.88E+08 2.73E+08 2.91E+08 2.84E+08 9.50E+06 1.07E+07 19.48 19.43 19.49
120 2.65E+08 2.81E+08 2.83E+08 2.76E+08 9.65E+06 1.09E+07 19.40 19.45 19.46
Specific growth rate (h-1
)
Trial 1 0.023
Trial 2 0.023
Trial 3 0.024
Average 0.023
STDEV 0.001
95% CI 0.001
y = 0.0226x + 17.555
y = 0.0226x + 17.551
y = 0.0235x + 17.534
17.5
18.0
18.5
19.0
19.5
0 20 40 60 80
Elapsed time (h)
ln [
Cel
ls m
L-1
]
Figure F.48. Specific growth rate calculations for Trial 1 (open circles), Trial 2 (open
squares), and Trial 3 (open triangles).
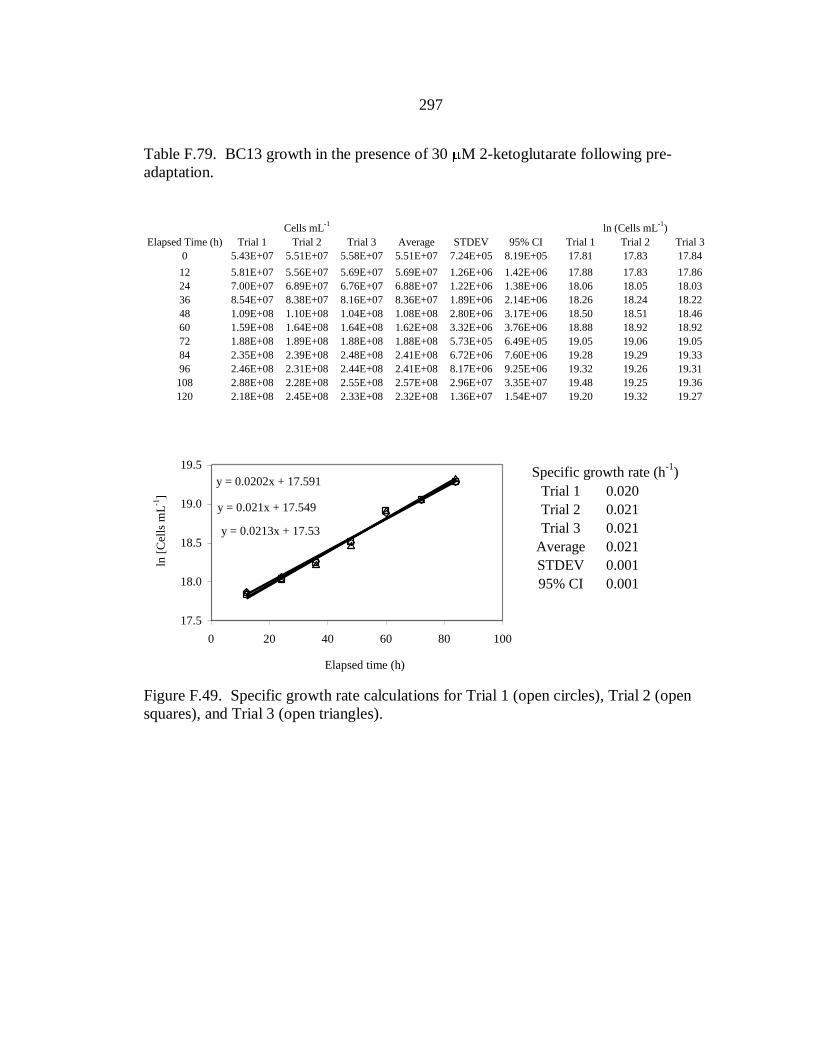
297
Table F.79. BC13 growth in the presence of 30 M 2-ketoglutarate following pre-
adaptation.
Cells mL
-1ln (Cells mL
-1)
Elapsed Time (h) Trial 1 Trial 2 Trial 3 Average STDEV 95% CI Trial 1 Trial 2 Trial 3
0 5.43E+07 5.51E+07 5.58E+07 5.51E+07 7.24E+05 8.19E+05 17.81 17.83 17.84
12 5.81E+07 5.56E+07 5.69E+07 5.69E+07 1.26E+06 1.42E+06 17.88 17.83 17.86
24 7.00E+07 6.89E+07 6.76E+07 6.88E+07 1.22E+06 1.38E+06 18.06 18.05 18.03
36 8.54E+07 8.38E+07 8.16E+07 8.36E+07 1.89E+06 2.14E+06 18.26 18.24 18.22
48 1.09E+08 1.10E+08 1.04E+08 1.08E+08 2.80E+06 3.17E+06 18.50 18.51 18.46
60 1.59E+08 1.64E+08 1.64E+08 1.62E+08 3.32E+06 3.76E+06 18.88 18.92 18.92
72 1.88E+08 1.89E+08 1.88E+08 1.88E+08 5.73E+05 6.49E+05 19.05 19.06 19.05
84 2.35E+08 2.39E+08 2.48E+08 2.41E+08 6.72E+06 7.60E+06 19.28 19.29 19.33
96 2.46E+08 2.31E+08 2.44E+08 2.41E+08 8.17E+06 9.25E+06 19.32 19.26 19.31
108 2.88E+08 2.28E+08 2.55E+08 2.57E+08 2.96E+07 3.35E+07 19.48 19.25 19.36
120 2.18E+08 2.45E+08 2.33E+08 2.32E+08 1.36E+07 1.54E+07 19.20 19.32 19.27
17.5
18.0
18.5
19.0
19.5
0 20 40 60 80 100
ln [
Cel
ls m
L-1
]
Specific growth rate (h-1
)
Trial 1 0.020
Trial 2 0.021
Trial 3 0.021
Average 0.021
STDEV 0.001
95% CI 0.001
y = 0.0202x + 17.591
y = 0.021x + 17.549
y = 0.0213x + 17.53
17.5
18.0
18.5
19.0
19.5
0 20 40 60 80 100
Elapsed time (h)
ln [
Cel
ls m
L-1
]
Figure F.49. Specific growth rate calculations for Trial 1 (open circles), Trial 2 (open
squares), and Trial 3 (open triangles).

298
Table F.80. BC13 growth in the presence of 50 M 2-ketoglutarate following pre-
adaptation.
Cells mL
-1ln (Cells mL
-1)
Elapsed Time (h) Trial 1 Trial 2 Trial 3 Average STDEV 95% CI Trial 1 Trial 2 Trial 3
0 6.02E+07 5.18E+07 5.18E+07 5.46E+07 4.86E+06 5.50E+06 17.91 17.76 17.76
12 6.12E+07 5.38E+07 5.49E+07 5.66E+07 3.98E+06 4.51E+06 17.93 17.80 17.82
24 7.25E+07 6.93E+07 6.66E+07 6.95E+07 2.96E+06 3.35E+06 18.10 18.05 18.01
36 9.12E+07 9.31E+07 9.51E+07 9.31E+07 1.96E+06 2.22E+06 18.33 18.35 18.37
48 1.09E+08 1.10E+08 1.16E+08 1.12E+08 3.77E+06 4.26E+06 18.50 18.52 18.57
60 1.33E+08 1.36E+08 1.37E+08 1.35E+08 2.03E+06 2.30E+06 18.71 18.73 18.74
72 1.81E+08 1.80E+08 1.73E+08 1.78E+08 4.43E+06 5.01E+06 19.02 19.01 18.97
84 2.16E+08 2.13E+08 2.16E+08 2.15E+08 1.54E+06 1.74E+06 19.19 19.18 19.19
96 2.75E+08 2.95E+08 2.78E+08 2.83E+08 1.07E+07 1.21E+07 19.43 19.50 19.44
108 2.70E+08 2.45E+08 2.45E+08 2.53E+08 1.41E+07 1.60E+07 19.41 19.32 19.32
120 2.24E+08 2.35E+08 2.13E+08 2.24E+08 1.07E+07 1.21E+07 19.23 19.27 19.18
Specific growth rate (h-1
)
Trial 1 0.018
Trial 2 0.020
Trial 3 0.019
Average 0.019
STDEV 0.001
95% CI 0.001
y = 0.0181x + 17.673
y = 0.0196x + 17.586
y = 0.019x + 17.61
17.5
18.0
18.5
19.0
19.5
20.0
0 20 40 60 80 100 120
Elapsed time (h)
ln [
Cel
ls m
L-1
]
Figure F.50. Specific growth rate calculations for Trial 1 (open circles), Trial 2 (open
squares), and Trial 3 (open triangles).

299
Succinate
Table F.81. BC13 growth in the presence of 5 M succinate following pre-adaptation.
Cells mL
-1ln (Cells mL
-1)
Elapsed Time (h) Trial 1 Trial 2 Trial 3 Average STDEV 95% CI Trial 1 Trial 2 Trial 3
0 5.85E+07 5.67E+07 5.76E+07 5.76E+07 9.15E+05 1.04E+06 17.88 17.85 17.87
12 6.10E+07 5.02E+07 5.85E+07 5.65E+07 5.66E+06 6.40E+06 17.93 17.73 17.88
24 6.21E+07 6.19E+07 6.59E+07 6.33E+07 2.25E+06 2.55E+06 17.94 17.94 18.00
36 9.36E+07 9.31E+07 9.51E+07 9.39E+07 1.04E+06 1.18E+06 18.35 18.35 18.37
48 1.30E+08 1.24E+08 1.30E+08 1.28E+08 3.27E+06 3.70E+06 18.69 18.64 18.68
60 1.86E+08 1.83E+08 2.32E+08 2.00E+08 2.73E+07 3.09E+07 19.04 19.03 19.26
72 2.45E+08 2.53E+08 2.91E+08 2.63E+08 2.46E+07 2.78E+07 19.32 19.35 19.49
84 2.90E+08 2.76E+08 2.79E+08 2.82E+08 7.41E+06 8.38E+06 19.49 19.44 19.45
96 3.16E+08 3.23E+08 3.19E+08 3.19E+08 3.89E+06 4.40E+06 19.57 19.59 19.58
108 3.01E+08 2.97E+08 3.02E+08 3.00E+08 2.49E+06 2.81E+06 19.52 19.51 19.53
120 3.00E+08 2.96E+08 3.08E+08 3.02E+08 5.99E+06 6.77E+06 19.52 19.51 19.55
Specific growth rate (h-1
)
Trial 1 0.029
Trial 2 0.029
Trial 3 0.032
Average 0.030
STDEV 0.002
95% CI 0.002
y = 0.0286x + 17.296
y = 0.0291x + 17.263
y = 0.0322x + 17.216
17.5
18.0
18.5
19.0
19.5
20.0
0 20 40 60 80
Elapsed time (h)
ln [
Cel
ls m
L-1
]
Figure F.51. Specific growth rate calculations for Trial 1 (open circles), Trial 2 (open
squares), and Trial 3 (open triangles).

300
Table F.82. BC13 growth in the presence of 10 M succinate following pre-adaptation.
Cells mL
-1ln (Cells mL
-1)
Elapsed Time (h) Trial 1 Trial 2 Trial 3 Average STDEV 95% CI Trial 1 Trial 2 Trial 3
0 4.76E+07 4.53E+07 4.64E+07 4.64E+07 1.15E+06 1.30E+06 17.68 17.63 17.65
12 5.10E+07 5.34E+07 5.80E+07 5.41E+07 3.58E+06 4.05E+06 17.75 17.79 17.88
24 5.25E+07 5.06E+07 4.64E+07 4.98E+07 3.09E+06 3.50E+06 17.78 17.74 17.65
36 9.42E+07 1.02E+08 8.69E+07 9.44E+07 7.59E+06 8.59E+06 18.36 18.44 18.28
48 1.35E+08 1.35E+08 1.24E+08 1.31E+08 6.15E+06 6.96E+06 18.72 18.72 18.64
60 1.95E+08 2.13E+08 1.80E+08 1.96E+08 1.65E+07 1.86E+07 19.09 19.18 19.01
72 2.39E+08 2.46E+08 2.19E+08 2.35E+08 1.39E+07 1.58E+07 19.29 19.32 19.20
84 3.36E+08 3.13E+08 3.52E+08 3.34E+08 1.98E+07 2.24E+07 19.63 19.56 19.68
96 3.09E+08 3.38E+08 2.82E+08 3.10E+08 2.79E+07 3.16E+07 19.55 19.64 19.46
108 2.88E+08 3.02E+08 2.98E+08 2.96E+08 7.23E+06 8.19E+06 19.48 19.53 19.51
120 3.10E+08 3.37E+08 3.11E+08 3.19E+08 1.55E+07 1.75E+07 19.55 19.64 19.55
17.5
18.0
18.5
19.0
19.5
20.0
0 20 40 60 80 100
ln [
Cel
ls m
L-1
]
Specific growth rate (h-1
)
Trial 1 0.030
Trial 2 0.029
Trial 3 0.032
Average 0.030
STDEV 0.001
95% CI 0.001
y = 0.0296x + 17.212
y = 0.0291x + 17.257
y = 0.0316x + 17.038
17.5
18.0
18.5
19.0
19.5
20.0
0 20 40 60 80 100
Elapsed time (h)
ln [
Cel
ls m
L-1
]
Figure F.52. Specific growth rate calculations for Trial 1 (open circles), Trial 2 (open
squares), and Trial 3 (open triangles).

301
Table F.83. BC13 growth in the presence of 20 M succinate following pre-adaptation.
Cells mL
-1ln (Cells mL
-1)
Elapsed Time (h) Trial 1 Trial 2 Trial 3 Average STDEV 95% CI Trial 1 Trial 2 Trial 3
0 5.80E+07 5.65E+07 5.77E+07 5.74E+07 7.74E+05 8.76E+05 17.88 17.85 17.87
12 5.57E+07 5.02E+07 4.78E+07 5.13E+07 4.06E+06 4.59E+06 17.84 17.73 17.68
24 5.91E+07 6.00E+07 5.85E+07 5.92E+07 7.62E+05 8.63E+05 17.90 17.91 17.88
36 7.86E+07 7.63E+07 6.66E+07 7.38E+07 6.35E+06 7.19E+06 18.18 18.15 18.01
48 1.16E+08 1.30E+08 1.35E+08 1.27E+08 9.93E+06 1.12E+07 18.56 18.68 18.72
60 1.54E+08 1.45E+08 1.60E+08 1.53E+08 7.29E+06 8.25E+06 18.85 18.79 18.89
72 2.18E+08 1.93E+08 2.25E+08 2.12E+08 1.70E+07 1.93E+07 19.20 19.08 19.23
84 2.28E+08 2.23E+08 2.63E+08 2.38E+08 2.17E+07 2.46E+07 19.25 19.22 19.39
96 2.55E+08 2.47E+08 2.31E+08 2.45E+08 1.20E+07 1.35E+07 19.36 19.33 19.26
108 2.19E+08 2.66E+08 2.46E+08 2.43E+08 2.36E+07 2.67E+07 19.20 19.40 19.32
120 2.18E+08 2.20E+08 2.60E+08 2.33E+08 2.35E+07 2.66E+07 19.20 19.21 19.37
17.5
18.0
18.5
19.0
19.5
0 20 40 60 80
ln [
Cel
ls m
L-1
]
Specific growth rate (h-1
)
Trial 1 0.027
Trial 2 0.025
Trial 3 0.030
Average 0.027
STDEV 0.003
95% CI 0.003
y = 0.0273x + 17.226
y = 0.0248x + 17.331
y = 0.0298x + 17.119
17.5
18.0
18.5
19.0
19.5
0 20 40 60 80
Elapsed time (h)
ln [
Cel
ls m
L-1
]
Figure F.53. Specific growth rate calculations for Trial 1 (open circles), Trial 2 (open
squares), and Trial 3 (open triangles).
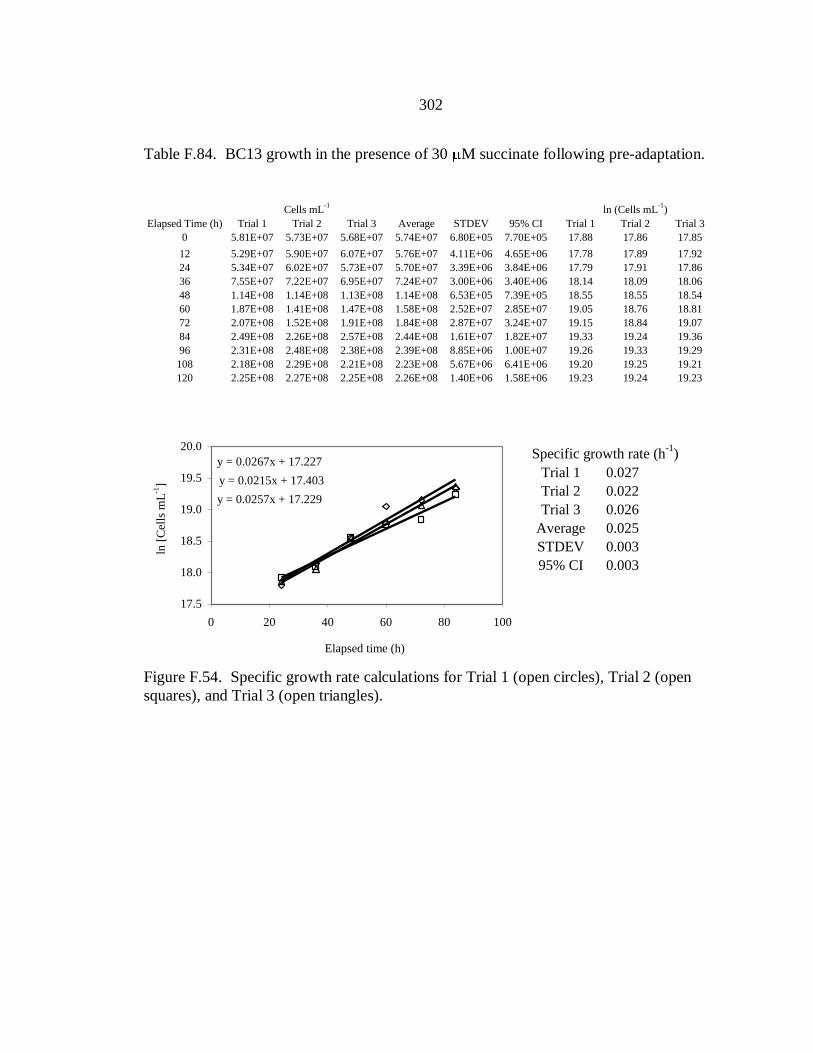
302
Table F.84. BC13 growth in the presence of 30 M succinate following pre-adaptation.
Cells mL
-1ln (Cells mL
-1)
Elapsed Time (h) Trial 1 Trial 2 Trial 3 Average STDEV 95% CI Trial 1 Trial 2 Trial 3
0 5.81E+07 5.73E+07 5.68E+07 5.74E+07 6.80E+05 7.70E+05 17.88 17.86 17.85
12 5.29E+07 5.90E+07 6.07E+07 5.76E+07 4.11E+06 4.65E+06 17.78 17.89 17.92
24 5.34E+07 6.02E+07 5.73E+07 5.70E+07 3.39E+06 3.84E+06 17.79 17.91 17.86
36 7.55E+07 7.22E+07 6.95E+07 7.24E+07 3.00E+06 3.40E+06 18.14 18.09 18.06
48 1.14E+08 1.14E+08 1.13E+08 1.14E+08 6.53E+05 7.39E+05 18.55 18.55 18.54
60 1.87E+08 1.41E+08 1.47E+08 1.58E+08 2.52E+07 2.85E+07 19.05 18.76 18.81
72 2.07E+08 1.52E+08 1.91E+08 1.84E+08 2.87E+07 3.24E+07 19.15 18.84 19.07
84 2.49E+08 2.26E+08 2.57E+08 2.44E+08 1.61E+07 1.82E+07 19.33 19.24 19.36
96 2.31E+08 2.48E+08 2.38E+08 2.39E+08 8.85E+06 1.00E+07 19.26 19.33 19.29
108 2.18E+08 2.29E+08 2.21E+08 2.23E+08 5.67E+06 6.41E+06 19.20 19.25 19.21
120 2.25E+08 2.27E+08 2.25E+08 2.26E+08 1.40E+06 1.58E+06 19.23 19.24 19.23
17.5
18.0
18.5
19.0
19.5
20.0
0 20 40 60 80 100
ln [
Cel
ls m
L-1
]
Specific growth rate (h-1
)
Trial 1 0.027
Trial 2 0.022
Trial 3 0.026
Average 0.025
STDEV 0.003
95% CI 0.003
y = 0.0267x + 17.227
y = 0.0215x + 17.403
y = 0.0257x + 17.229
17.5
18.0
18.5
19.0
19.5
20.0
0 20 40 60 80 100
Elapsed time (h)
ln [
Cel
ls m
L-1
]
Figure F.54. Specific growth rate calculations for Trial 1 (open circles), Trial 2 (open
squares), and Trial 3 (open triangles).
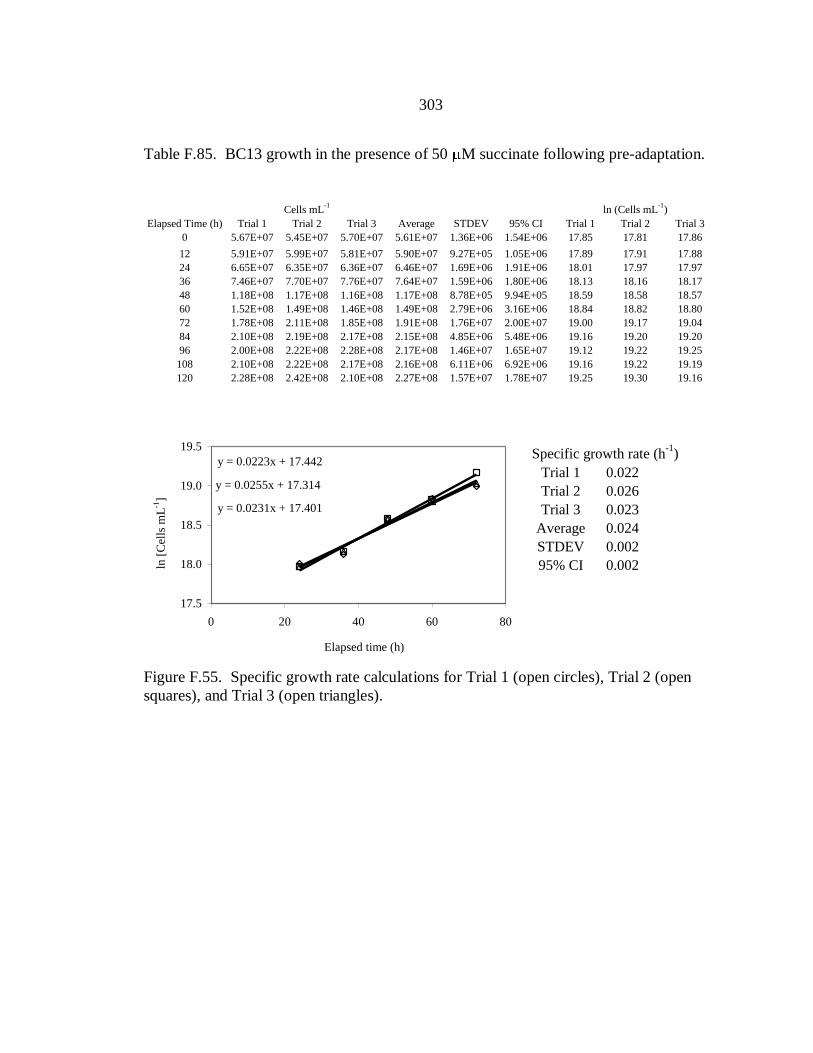
303
Table F.85. BC13 growth in the presence of 50 M succinate following pre-adaptation.
Cells mL
-1ln (Cells mL
-1)
Elapsed Time (h) Trial 1 Trial 2 Trial 3 Average STDEV 95% CI Trial 1 Trial 2 Trial 3
0 5.67E+07 5.45E+07 5.70E+07 5.61E+07 1.36E+06 1.54E+06 17.85 17.81 17.86
12 5.91E+07 5.99E+07 5.81E+07 5.90E+07 9.27E+05 1.05E+06 17.89 17.91 17.88
24 6.65E+07 6.35E+07 6.36E+07 6.46E+07 1.69E+06 1.91E+06 18.01 17.97 17.97
36 7.46E+07 7.70E+07 7.76E+07 7.64E+07 1.59E+06 1.80E+06 18.13 18.16 18.17
48 1.18E+08 1.17E+08 1.16E+08 1.17E+08 8.78E+05 9.94E+05 18.59 18.58 18.57
60 1.52E+08 1.49E+08 1.46E+08 1.49E+08 2.79E+06 3.16E+06 18.84 18.82 18.80
72 1.78E+08 2.11E+08 1.85E+08 1.91E+08 1.76E+07 2.00E+07 19.00 19.17 19.04
84 2.10E+08 2.19E+08 2.17E+08 2.15E+08 4.85E+06 5.48E+06 19.16 19.20 19.20
96 2.00E+08 2.22E+08 2.28E+08 2.17E+08 1.46E+07 1.65E+07 19.12 19.22 19.25
108 2.10E+08 2.22E+08 2.17E+08 2.16E+08 6.11E+06 6.92E+06 19.16 19.22 19.19
120 2.28E+08 2.42E+08 2.10E+08 2.27E+08 1.57E+07 1.78E+07 19.25 19.30 19.16
17.5
18.0
18.5
19.0
19.5
0 20 40 60 80
ln [
Cel
ls m
L-1
]
Specific growth rate (h-1
)
Trial 1 0.022
Trial 2 0.026
Trial 3 0.023
Average 0.024
STDEV 0.002
95% CI 0.002
y = 0.0223x + 17.442
y = 0.0255x + 17.314
y = 0.0231x + 17.401
17.5
18.0
18.5
19.0
19.5
0 20 40 60 80
Elapsed time (h)
ln [
Cel
ls m
L-1
]
Figure F.55. Specific growth rate calculations for Trial 1 (open circles), Trial 2 (open
squares), and Trial 3 (open triangles).
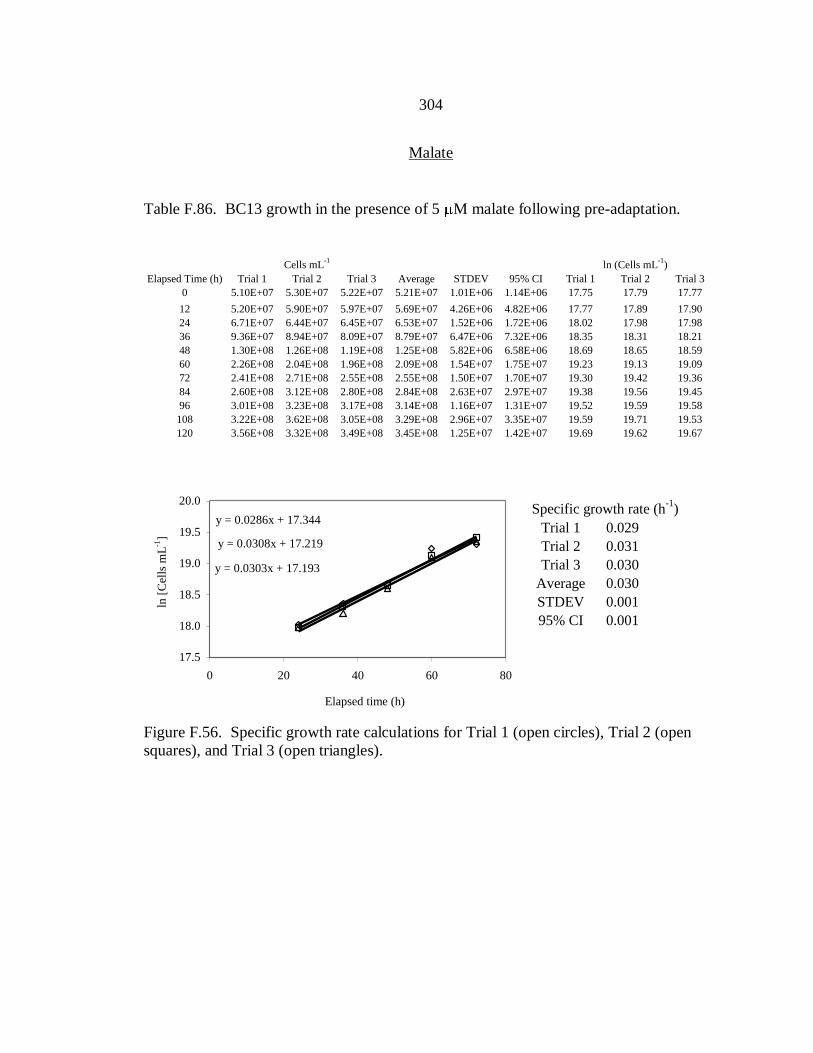
304
Malate
Table F.86. BC13 growth in the presence of 5 M malate following pre-adaptation.
Cells mL
-1ln (Cells mL
-1)
Elapsed Time (h) Trial 1 Trial 2 Trial 3 Average STDEV 95% CI Trial 1 Trial 2 Trial 3
0 5.10E+07 5.30E+07 5.22E+07 5.21E+07 1.01E+06 1.14E+06 17.75 17.79 17.77
12 5.20E+07 5.90E+07 5.97E+07 5.69E+07 4.26E+06 4.82E+06 17.77 17.89 17.90
24 6.71E+07 6.44E+07 6.45E+07 6.53E+07 1.52E+06 1.72E+06 18.02 17.98 17.98
36 9.36E+07 8.94E+07 8.09E+07 8.79E+07 6.47E+06 7.32E+06 18.35 18.31 18.21
48 1.30E+08 1.26E+08 1.19E+08 1.25E+08 5.82E+06 6.58E+06 18.69 18.65 18.59
60 2.26E+08 2.04E+08 1.96E+08 2.09E+08 1.54E+07 1.75E+07 19.23 19.13 19.09
72 2.41E+08 2.71E+08 2.55E+08 2.55E+08 1.50E+07 1.70E+07 19.30 19.42 19.36
84 2.60E+08 3.12E+08 2.80E+08 2.84E+08 2.63E+07 2.97E+07 19.38 19.56 19.45
96 3.01E+08 3.23E+08 3.17E+08 3.14E+08 1.16E+07 1.31E+07 19.52 19.59 19.58
108 3.22E+08 3.62E+08 3.05E+08 3.29E+08 2.96E+07 3.35E+07 19.59 19.71 19.53
120 3.56E+08 3.32E+08 3.49E+08 3.45E+08 1.25E+07 1.42E+07 19.69 19.62 19.67
Specific growth rate (h-1
)
Trial 1 0.029
Trial 2 0.031
Trial 3 0.030
Average 0.030
STDEV 0.001
95% CI 0.001
y = 0.0286x + 17.344
y = 0.0308x + 17.219
y = 0.0303x + 17.193
17.5
18.0
18.5
19.0
19.5
20.0
0 20 40 60 80
Elapsed time (h)
ln [
Cel
ls m
L-1
]
Figure F.56. Specific growth rate calculations for Trial 1 (open circles), Trial 2 (open
squares), and Trial 3 (open triangles).
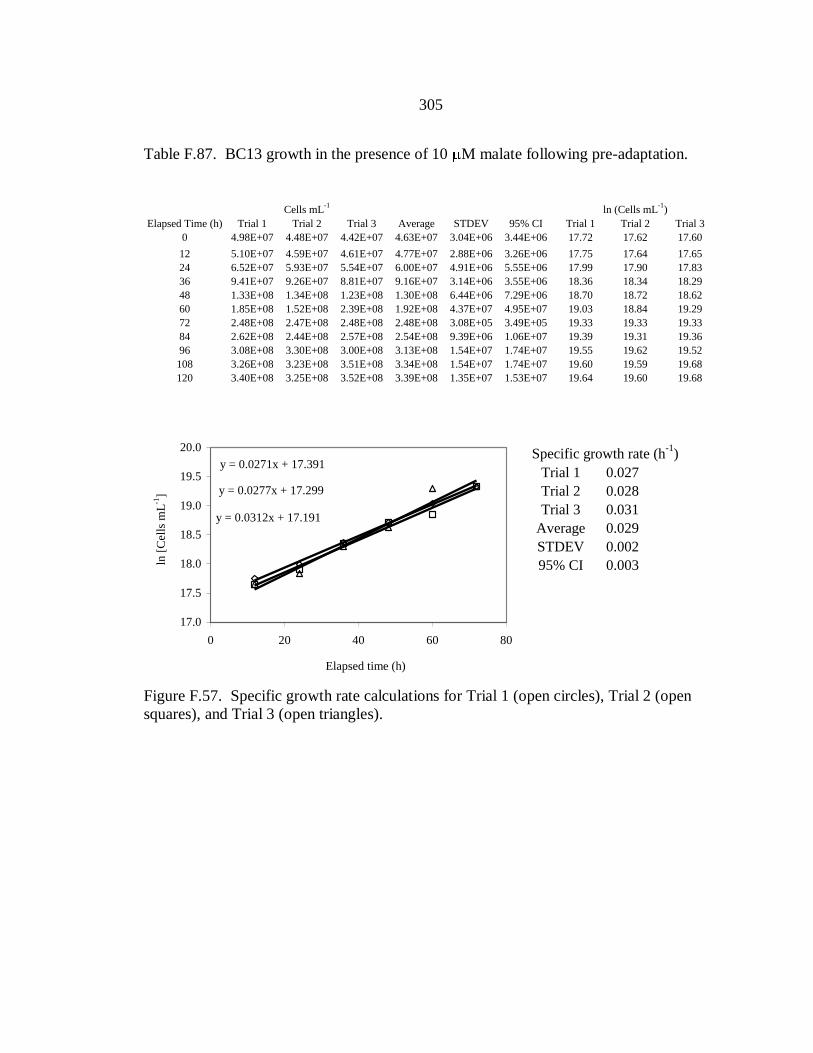
305
Table F.87. BC13 growth in the presence of 10 M malate following pre-adaptation.
Cells mL
-1ln (Cells mL
-1)
Elapsed Time (h) Trial 1 Trial 2 Trial 3 Average STDEV 95% CI Trial 1 Trial 2 Trial 3
0 4.98E+07 4.48E+07 4.42E+07 4.63E+07 3.04E+06 3.44E+06 17.72 17.62 17.60
12 5.10E+07 4.59E+07 4.61E+07 4.77E+07 2.88E+06 3.26E+06 17.75 17.64 17.65
24 6.52E+07 5.93E+07 5.54E+07 6.00E+07 4.91E+06 5.55E+06 17.99 17.90 17.83
36 9.41E+07 9.26E+07 8.81E+07 9.16E+07 3.14E+06 3.55E+06 18.36 18.34 18.29
48 1.33E+08 1.34E+08 1.23E+08 1.30E+08 6.44E+06 7.29E+06 18.70 18.72 18.62
60 1.85E+08 1.52E+08 2.39E+08 1.92E+08 4.37E+07 4.95E+07 19.03 18.84 19.29
72 2.48E+08 2.47E+08 2.48E+08 2.48E+08 3.08E+05 3.49E+05 19.33 19.33 19.33
84 2.62E+08 2.44E+08 2.57E+08 2.54E+08 9.39E+06 1.06E+07 19.39 19.31 19.36
96 3.08E+08 3.30E+08 3.00E+08 3.13E+08 1.54E+07 1.74E+07 19.55 19.62 19.52
108 3.26E+08 3.23E+08 3.51E+08 3.34E+08 1.54E+07 1.74E+07 19.60 19.59 19.68
120 3.40E+08 3.25E+08 3.52E+08 3.39E+08 1.35E+07 1.53E+07 19.64 19.60 19.68 17.0
17.5
18.0
18.5
19.0
19.5
20.0
0 20 40 60 80
ln [
Cel
ls m
L-1
]
Specific growth rate (h-1
)
Trial 1 0.027
Trial 2 0.028
Trial 3 0.031
Average 0.029
STDEV 0.002
95% CI 0.003
y = 0.0271x + 17.391
y = 0.0277x + 17.299
y = 0.0312x + 17.191
17.0
17.5
18.0
18.5
19.0
19.5
20.0
0 20 40 60 80
Elapsed time (h)
ln [
Cel
ls m
L-1
]
Figure F.57. Specific growth rate calculations for Trial 1 (open circles), Trial 2 (open
squares), and Trial 3 (open triangles).
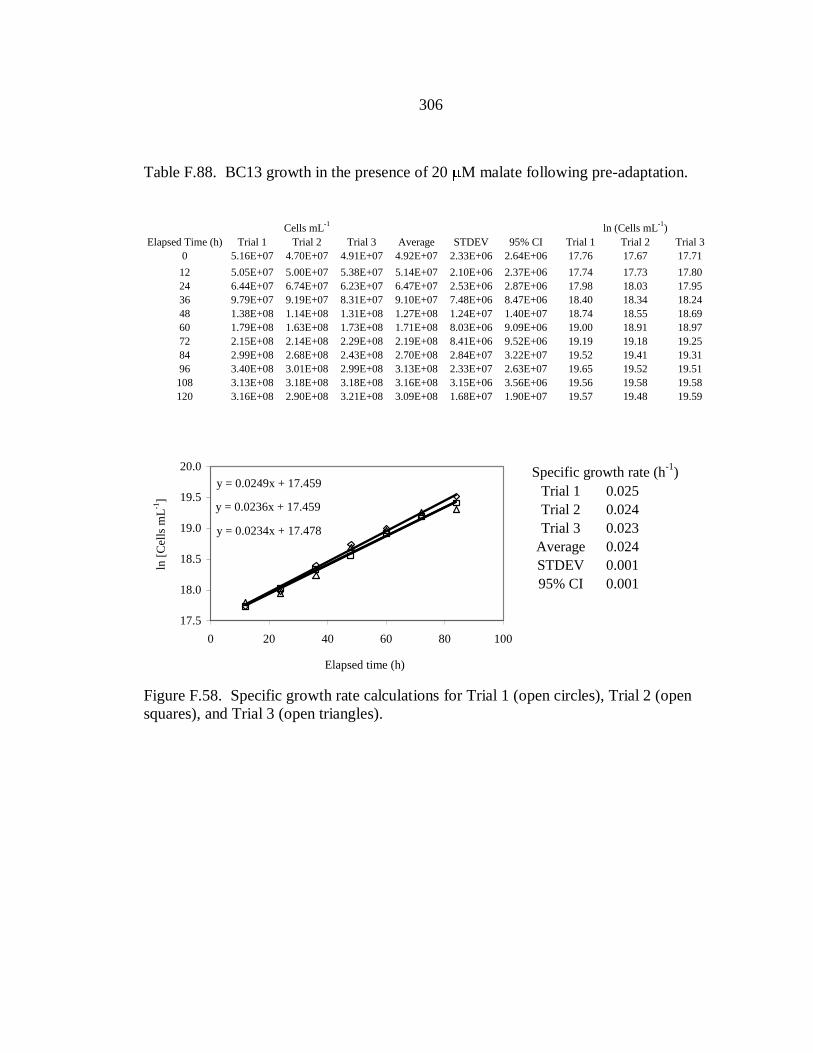
306
Table F.88. BC13 growth in the presence of 20 M malate following pre-adaptation.
Cells mL
-1ln (Cells mL
-1)
Elapsed Time (h) Trial 1 Trial 2 Trial 3 Average STDEV 95% CI Trial 1 Trial 2 Trial 3
0 5.16E+07 4.70E+07 4.91E+07 4.92E+07 2.33E+06 2.64E+06 17.76 17.67 17.71
12 5.05E+07 5.00E+07 5.38E+07 5.14E+07 2.10E+06 2.37E+06 17.74 17.73 17.80
24 6.44E+07 6.74E+07 6.23E+07 6.47E+07 2.53E+06 2.87E+06 17.98 18.03 17.95
36 9.79E+07 9.19E+07 8.31E+07 9.10E+07 7.48E+06 8.47E+06 18.40 18.34 18.24
48 1.38E+08 1.14E+08 1.31E+08 1.27E+08 1.24E+07 1.40E+07 18.74 18.55 18.69
60 1.79E+08 1.63E+08 1.73E+08 1.71E+08 8.03E+06 9.09E+06 19.00 18.91 18.97
72 2.15E+08 2.14E+08 2.29E+08 2.19E+08 8.41E+06 9.52E+06 19.19 19.18 19.25
84 2.99E+08 2.68E+08 2.43E+08 2.70E+08 2.84E+07 3.22E+07 19.52 19.41 19.31
96 3.40E+08 3.01E+08 2.99E+08 3.13E+08 2.33E+07 2.63E+07 19.65 19.52 19.51
108 3.13E+08 3.18E+08 3.18E+08 3.16E+08 3.15E+06 3.56E+06 19.56 19.58 19.58
120 3.16E+08 2.90E+08 3.21E+08 3.09E+08 1.68E+07 1.90E+07 19.57 19.48 19.59
17.5
18.0
18.5
19.0
19.5
20.0
0 20 40 60 80 100
ln [
Cel
ls m
L-1
]
Specific growth rate (h-1
)
Trial 1 0.025
Trial 2 0.024
Trial 3 0.023
Average 0.024
STDEV 0.001
95% CI 0.001
y = 0.0249x + 17.459
y = 0.0236x + 17.459
y = 0.0234x + 17.478
17.5
18.0
18.5
19.0
19.5
20.0
0 20 40 60 80 100
Elapsed time (h)
ln [
Cel
ls m
L-1
]
Figure F.58. Specific growth rate calculations for Trial 1 (open circles), Trial 2 (open
squares), and Trial 3 (open triangles).
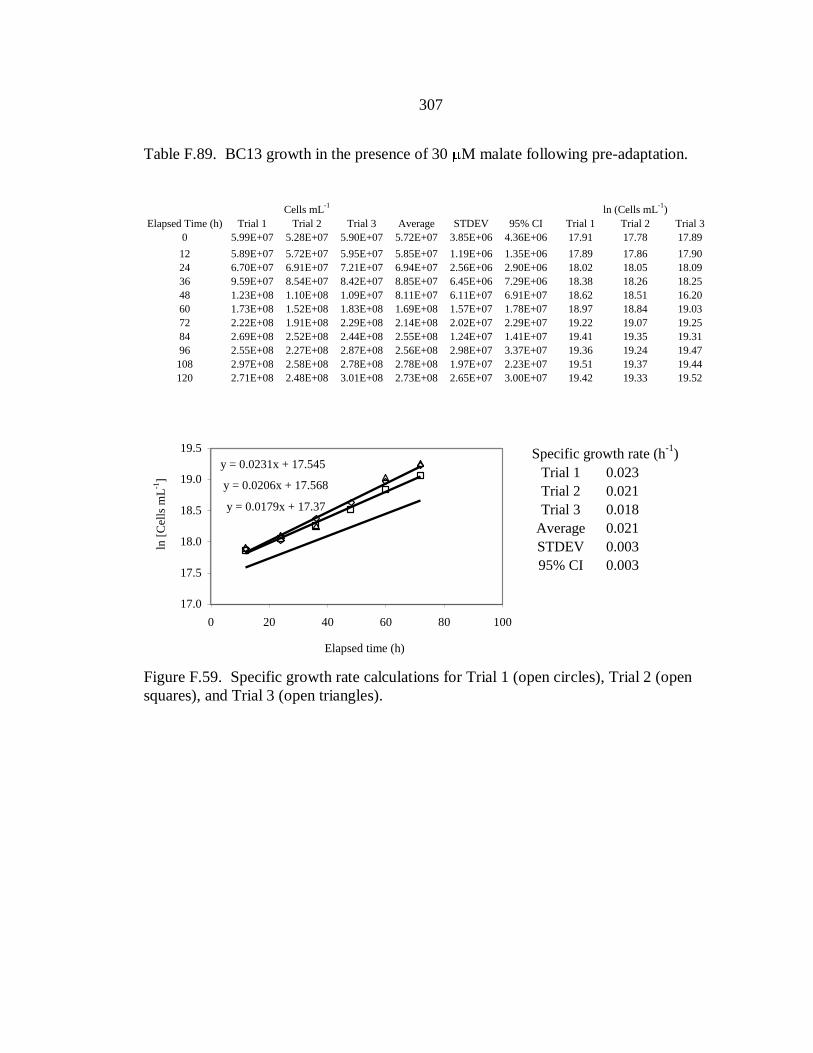
307
Table F.89. BC13 growth in the presence of 30 M malate following pre-adaptation.
Cells mL
-1ln (Cells mL
-1)
Elapsed Time (h) Trial 1 Trial 2 Trial 3 Average STDEV 95% CI Trial 1 Trial 2 Trial 3
0 5.99E+07 5.28E+07 5.90E+07 5.72E+07 3.85E+06 4.36E+06 17.91 17.78 17.89
12 5.89E+07 5.72E+07 5.95E+07 5.85E+07 1.19E+06 1.35E+06 17.89 17.86 17.90
24 6.70E+07 6.91E+07 7.21E+07 6.94E+07 2.56E+06 2.90E+06 18.02 18.05 18.09
36 9.59E+07 8.54E+07 8.42E+07 8.85E+07 6.45E+06 7.29E+06 18.38 18.26 18.25
48 1.23E+08 1.10E+08 1.09E+07 8.11E+07 6.11E+07 6.91E+07 18.62 18.51 16.20
60 1.73E+08 1.52E+08 1.83E+08 1.69E+08 1.57E+07 1.78E+07 18.97 18.84 19.03
72 2.22E+08 1.91E+08 2.29E+08 2.14E+08 2.02E+07 2.29E+07 19.22 19.07 19.25
84 2.69E+08 2.52E+08 2.44E+08 2.55E+08 1.24E+07 1.41E+07 19.41 19.35 19.31
96 2.55E+08 2.27E+08 2.87E+08 2.56E+08 2.98E+07 3.37E+07 19.36 19.24 19.47
108 2.97E+08 2.58E+08 2.78E+08 2.78E+08 1.97E+07 2.23E+07 19.51 19.37 19.44
120 2.71E+08 2.48E+08 3.01E+08 2.73E+08 2.65E+07 3.00E+07 19.42 19.33 19.52
17.0
17.5
18.0
18.5
19.0
19.5
0 20 40 60 80 100
ln [
Cel
ls m
L-1
]
Specific growth rate (h-1
)
Trial 1 0.023
Trial 2 0.021
Trial 3 0.018
Average 0.021
STDEV 0.003
95% CI 0.003
y = 0.0231x + 17.545
y = 0.0206x + 17.568
y = 0.0179x + 17.37
17.0
17.5
18.0
18.5
19.0
19.5
0 20 40 60 80 100
Elapsed time (h)
ln [
Cel
ls m
L-1
]
Figure F.59. Specific growth rate calculations for Trial 1 (open circles), Trial 2 (open
squares), and Trial 3 (open triangles).

308
Table F.90. BC13 growth in the presence of 50 M malate following pre-adaptation.
Cells mL
-1ln (Cells mL
-1)
Elapsed Time (h) Trial 1 Trial 2 Trial 3 Average STDEV 95% CI Trial 1 Trial 2 Trial 3
0 5.53E+07 5.10E+07 5.19E+07 5.27E+07 2.28E+06 2.57E+06 17.83 17.75 17.77
12 5.83E+07 6.08E+07 6.46E+07 6.12E+07 3.18E+06 3.60E+06 17.88 17.92 17.98
24 6.89E+07 7.30E+07 7.89E+07 7.36E+07 5.03E+06 5.69E+06 18.05 18.11 18.18
36 9.30E+07 9.68E+07 9.18E+07 9.39E+07 2.60E+06 2.94E+06 18.35 18.39 18.34
48 1.35E+08 1.20E+08 1.30E+08 1.28E+08 7.60E+06 8.61E+06 18.72 18.60 18.69
60 1.79E+08 1.67E+08 1.60E+08 1.69E+08 9.42E+06 1.07E+07 19.00 18.93 18.89
72 2.12E+08 2.11E+08 2.10E+08 2.11E+08 1.04E+06 1.17E+06 19.17 19.17 19.16
84 2.30E+08 2.46E+08 2.27E+08 2.35E+08 9.82E+06 1.11E+07 19.26 19.32 19.24
96 2.23E+08 2.42E+08 2.62E+08 2.43E+08 1.96E+07 2.21E+07 19.22 19.31 19.39
108 2.27E+08 2.35E+08 2.53E+08 2.39E+08 1.33E+07 1.51E+07 19.24 19.28 19.35
120 2.18E+08 2.31E+08 2.30E+08 2.26E+08 7.44E+06 8.42E+06 19.20 19.26 19.25
17.5
18.0
18.5
19.0
19.5
0 20 40 60 80 100
ln [
Cel
ls m
L-1
]
Specific growth rate (h-1
)
Trial 1 0.021
Trial 2 0.020
Trial 3 0.019
Average 0.020
STDEV 0.001
95% CI 0.001
y = 0.0209x + 17.629
y = 0.0204x + 17.654
y = 0.0187x + 17.742
17.5
18.0
18.5
19.0
19.5
0 20 40 60 80 100
Elapsed time (h)
ln [
Cel
ls m
L-1
]
Figure F.60. Specific growth rate calculations for Trial 1 (open circles), Trial 2 (open
squares), and Trial 3 (open triangles).
309
APPENDIX G
CHAPTER FOUR RAW DATA
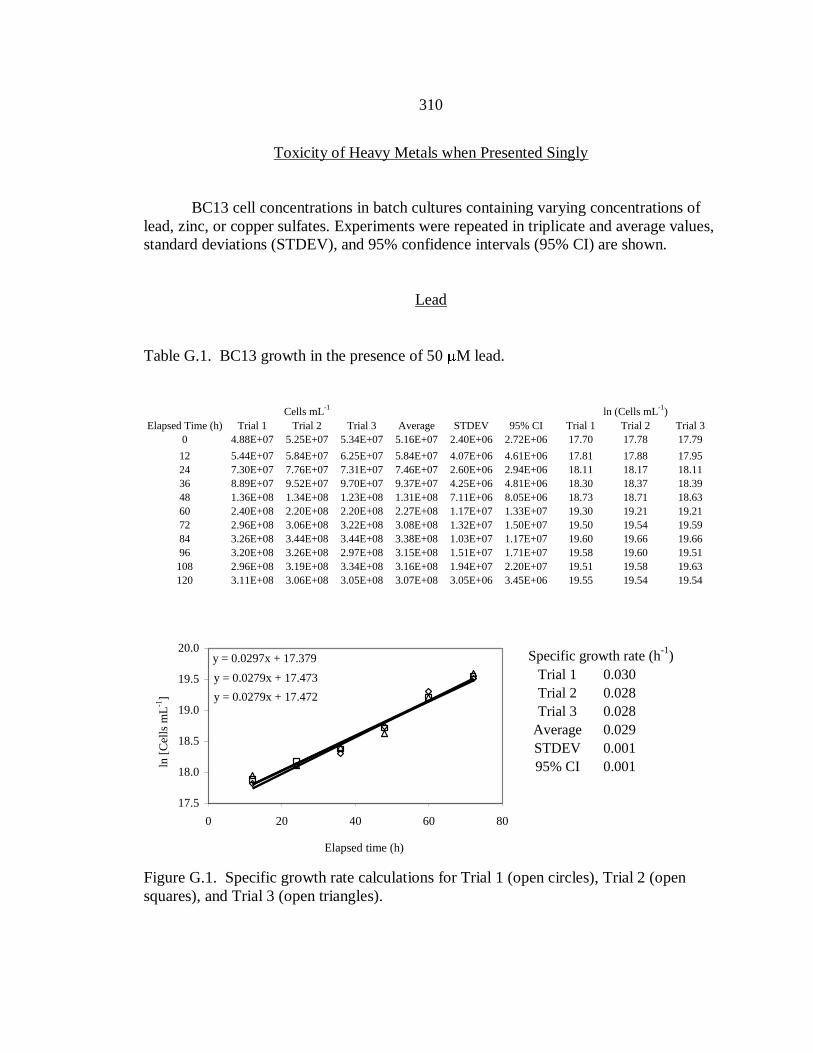
310
Toxicity of Heavy Metals when Presented Singly
BC13 cell concentrations in batch cultures containing varying concentrations of
lead, zinc, or copper sulfates. Experiments were repeated in triplicate and average values,
standard deviations (STDEV), and 95% confidence intervals (95% CI) are shown.
Lead
Table G.1. BC13 growth in the presence of 50 M lead.
Cells mL
-1ln (Cells mL
-1)
Elapsed Time (h) Trial 1 Trial 2 Trial 3 Average STDEV 95% CI Trial 1 Trial 2 Trial 3
0 4.88E+07 5.25E+07 5.34E+07 5.16E+07 2.40E+06 2.72E+06 17.70 17.78 17.79
12 5.44E+07 5.84E+07 6.25E+07 5.84E+07 4.07E+06 4.61E+06 17.81 17.88 17.95
24 7.30E+07 7.76E+07 7.31E+07 7.46E+07 2.60E+06 2.94E+06 18.11 18.17 18.11
36 8.89E+07 9.52E+07 9.70E+07 9.37E+07 4.25E+06 4.81E+06 18.30 18.37 18.39
48 1.36E+08 1.34E+08 1.23E+08 1.31E+08 7.11E+06 8.05E+06 18.73 18.71 18.63
60 2.40E+08 2.20E+08 2.20E+08 2.27E+08 1.17E+07 1.33E+07 19.30 19.21 19.21
72 2.96E+08 3.06E+08 3.22E+08 3.08E+08 1.32E+07 1.50E+07 19.50 19.54 19.59
84 3.26E+08 3.44E+08 3.44E+08 3.38E+08 1.03E+07 1.17E+07 19.60 19.66 19.66
96 3.20E+08 3.26E+08 2.97E+08 3.15E+08 1.51E+07 1.71E+07 19.58 19.60 19.51
108 2.96E+08 3.19E+08 3.34E+08 3.16E+08 1.94E+07 2.20E+07 19.51 19.58 19.63
120 3.11E+08 3.06E+08 3.05E+08 3.07E+08 3.05E+06 3.45E+06 19.55 19.54 19.54
Specific growth rate (h-1
)
Trial 1 0.030
Trial 2 0.028
Trial 3 0.028
Average 0.029
STDEV 0.001
95% CI 0.001
y = 0.0297x + 17.379
y = 0.0279x + 17.473
y = 0.0279x + 17.472
17.5
18.0
18.5
19.0
19.5
20.0
0 20 40 60 80
Elapsed time (h)
ln [
Cel
ls m
L-1
]
Figure G.1. Specific growth rate calculations for Trial 1 (open circles), Trial 2 (open
squares), and Trial 3 (open triangles).
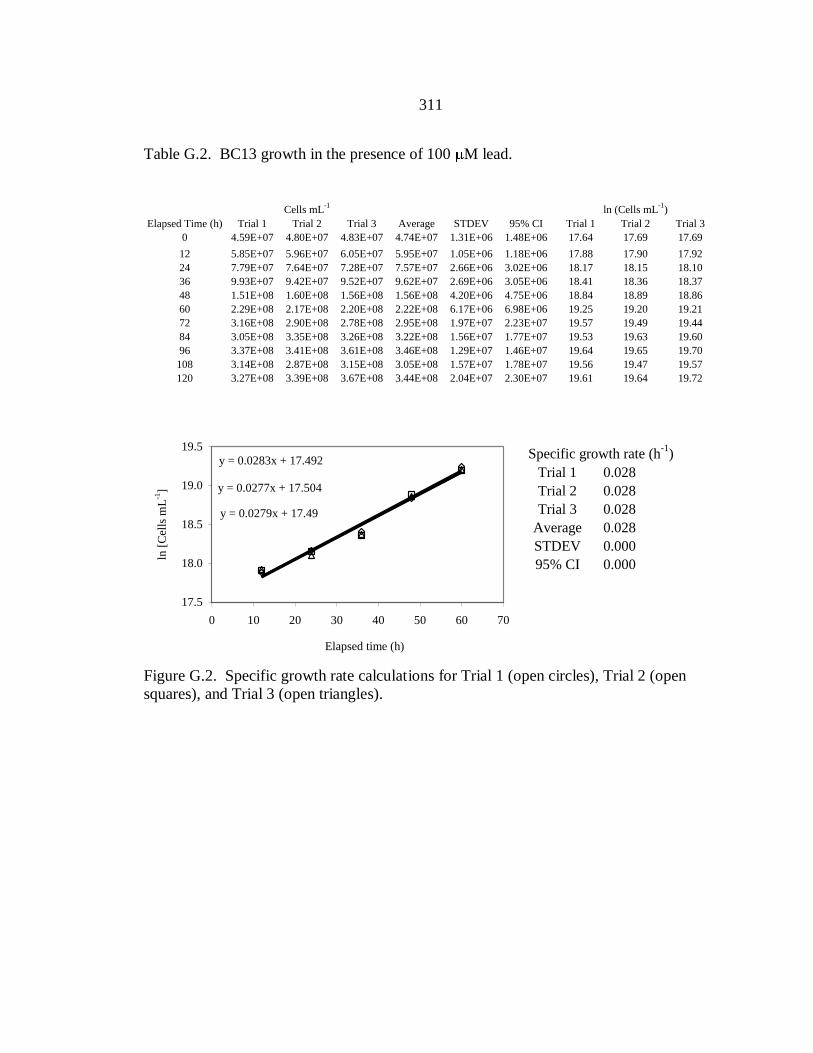
311
Table G.2. BC13 growth in the presence of 100 M lead.
Cells mL
-1ln (Cells mL
-1)
Elapsed Time (h) Trial 1 Trial 2 Trial 3 Average STDEV 95% CI Trial 1 Trial 2 Trial 3
0 4.59E+07 4.80E+07 4.83E+07 4.74E+07 1.31E+06 1.48E+06 17.64 17.69 17.69
12 5.85E+07 5.96E+07 6.05E+07 5.95E+07 1.05E+06 1.18E+06 17.88 17.90 17.92
24 7.79E+07 7.64E+07 7.28E+07 7.57E+07 2.66E+06 3.02E+06 18.17 18.15 18.10
36 9.93E+07 9.42E+07 9.52E+07 9.62E+07 2.69E+06 3.05E+06 18.41 18.36 18.37
48 1.51E+08 1.60E+08 1.56E+08 1.56E+08 4.20E+06 4.75E+06 18.84 18.89 18.86
60 2.29E+08 2.17E+08 2.20E+08 2.22E+08 6.17E+06 6.98E+06 19.25 19.20 19.21
72 3.16E+08 2.90E+08 2.78E+08 2.95E+08 1.97E+07 2.23E+07 19.57 19.49 19.44
84 3.05E+08 3.35E+08 3.26E+08 3.22E+08 1.56E+07 1.77E+07 19.53 19.63 19.60
96 3.37E+08 3.41E+08 3.61E+08 3.46E+08 1.29E+07 1.46E+07 19.64 19.65 19.70
108 3.14E+08 2.87E+08 3.15E+08 3.05E+08 1.57E+07 1.78E+07 19.56 19.47 19.57
120 3.27E+08 3.39E+08 3.67E+08 3.44E+08 2.04E+07 2.30E+07 19.61 19.64 19.72
17.5
18.0
18.5
19.0
19.5
0 10 20 30 40 50 60 70
ln [
Cel
ls m
L-1
]
Specific growth rate (h-1
)
Trial 1 0.028
Trial 2 0.028
Trial 3 0.028
Average 0.028
STDEV 0.000
95% CI 0.000
y = 0.0283x + 17.492
y = 0.0277x + 17.504
y = 0.0279x + 17.49
17.5
18.0
18.5
19.0
19.5
0 10 20 30 40 50 60 70
Elapsed time (h)
ln [
Cel
ls m
L-1
]
Figure G.2. Specific growth rate calculations for Trial 1 (open circles), Trial 2 (open
squares), and Trial 3 (open triangles).
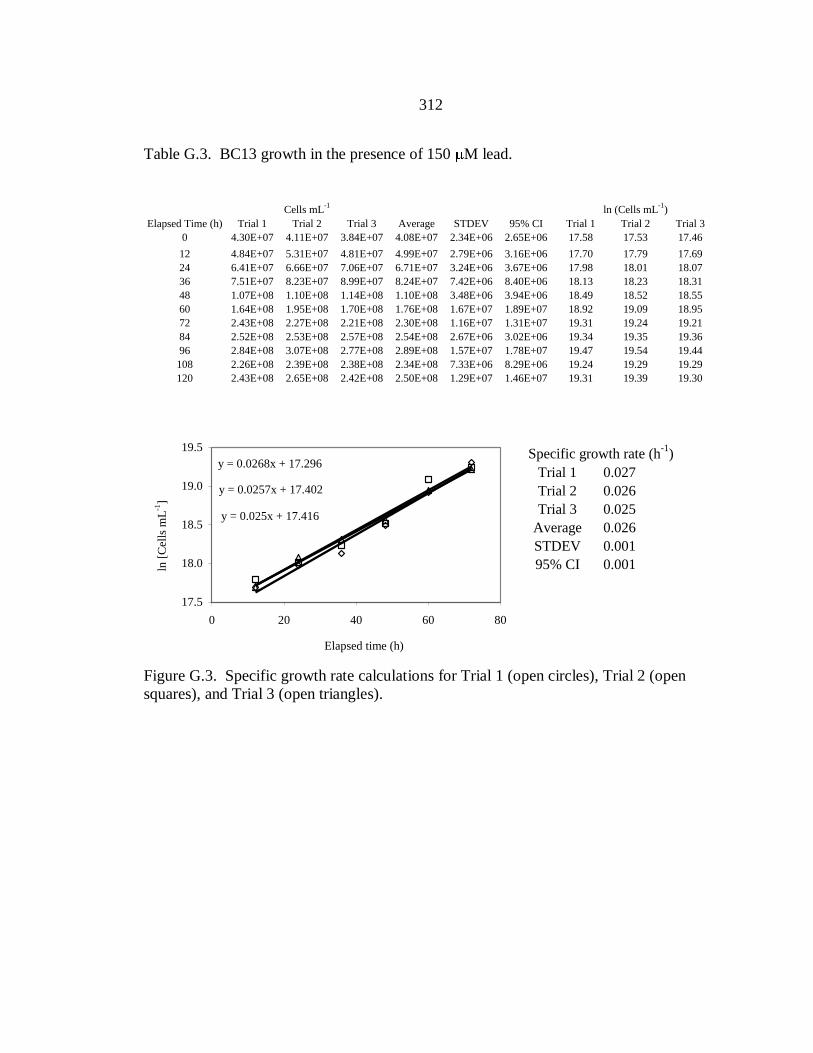
312
Table G.3. BC13 growth in the presence of 150 M lead.
Cells mL
-1ln (Cells mL
-1)
Elapsed Time (h) Trial 1 Trial 2 Trial 3 Average STDEV 95% CI Trial 1 Trial 2 Trial 3
0 4.30E+07 4.11E+07 3.84E+07 4.08E+07 2.34E+06 2.65E+06 17.58 17.53 17.46
12 4.84E+07 5.31E+07 4.81E+07 4.99E+07 2.79E+06 3.16E+06 17.70 17.79 17.69
24 6.41E+07 6.66E+07 7.06E+07 6.71E+07 3.24E+06 3.67E+06 17.98 18.01 18.07
36 7.51E+07 8.23E+07 8.99E+07 8.24E+07 7.42E+06 8.40E+06 18.13 18.23 18.31
48 1.07E+08 1.10E+08 1.14E+08 1.10E+08 3.48E+06 3.94E+06 18.49 18.52 18.55
60 1.64E+08 1.95E+08 1.70E+08 1.76E+08 1.67E+07 1.89E+07 18.92 19.09 18.95
72 2.43E+08 2.27E+08 2.21E+08 2.30E+08 1.16E+07 1.31E+07 19.31 19.24 19.21
84 2.52E+08 2.53E+08 2.57E+08 2.54E+08 2.67E+06 3.02E+06 19.34 19.35 19.36
96 2.84E+08 3.07E+08 2.77E+08 2.89E+08 1.57E+07 1.78E+07 19.47 19.54 19.44
108 2.26E+08 2.39E+08 2.38E+08 2.34E+08 7.33E+06 8.29E+06 19.24 19.29 19.29
120 2.43E+08 2.65E+08 2.42E+08 2.50E+08 1.29E+07 1.46E+07 19.31 19.39 19.30
17.5
18.0
18.5
19.0
19.5
0 20 40 60 80
ln [
Cel
ls m
L-1
]
Specific growth rate (h-1
)
Trial 1 0.027
Trial 2 0.026
Trial 3 0.025
Average 0.026
STDEV 0.001
95% CI 0.001
y = 0.0268x + 17.296
y = 0.0257x + 17.402
y = 0.025x + 17.416
17.5
18.0
18.5
19.0
19.5
0 20 40 60 80
Elapsed time (h)
ln [
Cel
ls m
L-1
]
Figure G.3. Specific growth rate calculations for Trial 1 (open circles), Trial 2 (open
squares), and Trial 3 (open triangles).

313
Table G.4. BC13 growth in the presence of 200 M lead.
Cells mL
-1ln (Cells mL
-1)
Elapsed Time (h) Trial 1 Trial 2 Trial 3 Average STDEV 95% CI Trial 1 Trial 2 Trial 3
0 4.26E+07 4.18E+07 4.18E+07 4.21E+07 5.08E+05 5.75E+05 17.57 17.55 17.55
12 4.05E+07 4.30E+07 3.92E+07 4.09E+07 1.90E+06 2.15E+06 17.52 17.58 17.48
24 5.22E+07 5.72E+07 5.75E+07 5.56E+07 2.98E+06 3.37E+06 17.77 17.86 17.87
36 6.95E+07 6.52E+07 7.15E+07 6.87E+07 3.21E+06 3.63E+06 18.06 17.99 18.08
48 8.90E+07 8.79E+07 8.47E+07 8.72E+07 2.23E+06 2.52E+06 18.30 18.29 18.25
60 1.81E+08 1.20E+08 1.26E+08 1.42E+08 3.38E+07 3.83E+07 19.01 18.60 18.65
72 2.24E+08 2.14E+08 2.17E+08 2.18E+08 5.34E+06 6.04E+06 19.23 19.18 19.20
84 2.24E+08 2.19E+08 2.26E+08 2.23E+08 3.56E+06 4.03E+06 19.23 19.21 19.24
96 2.62E+08 2.87E+08 2.62E+08 2.70E+08 1.42E+07 1.60E+07 19.39 19.47 19.38
108 2.16E+08 2.01E+08 1.84E+08 2.00E+08 1.58E+07 1.79E+07 19.19 19.12 19.03
120 2.15E+08 2.27E+08 2.22E+08 2.21E+08 6.33E+06 7.16E+06 19.19 19.24 19.22
17.0
17.5
18.0
18.5
19.0
19.5
0 10 20 30 40 50 60 70
ln [
Cel
ls m
L-1
]
Specific growth rate (h-1
)
Trial 1 0.029
Trial 2 0.021
Trial 3 0.023
Average 0.024
STDEV 0.005
95% CI 0.005
y = 0.0294x + 17.074
y = 0.0207x + 17.32
y = 0.0227x + 17.253
17.0
17.5
18.0
18.5
19.0
19.5
0 10 20 30 40 50 60 70
Elapsed time (h)
ln [
Cel
ls m
L-1
]
Figure G.4. Specific growth rate calculations for Trial 1 (open circles), Trial 2 (open
squares), and Trial 3 (open triangles).
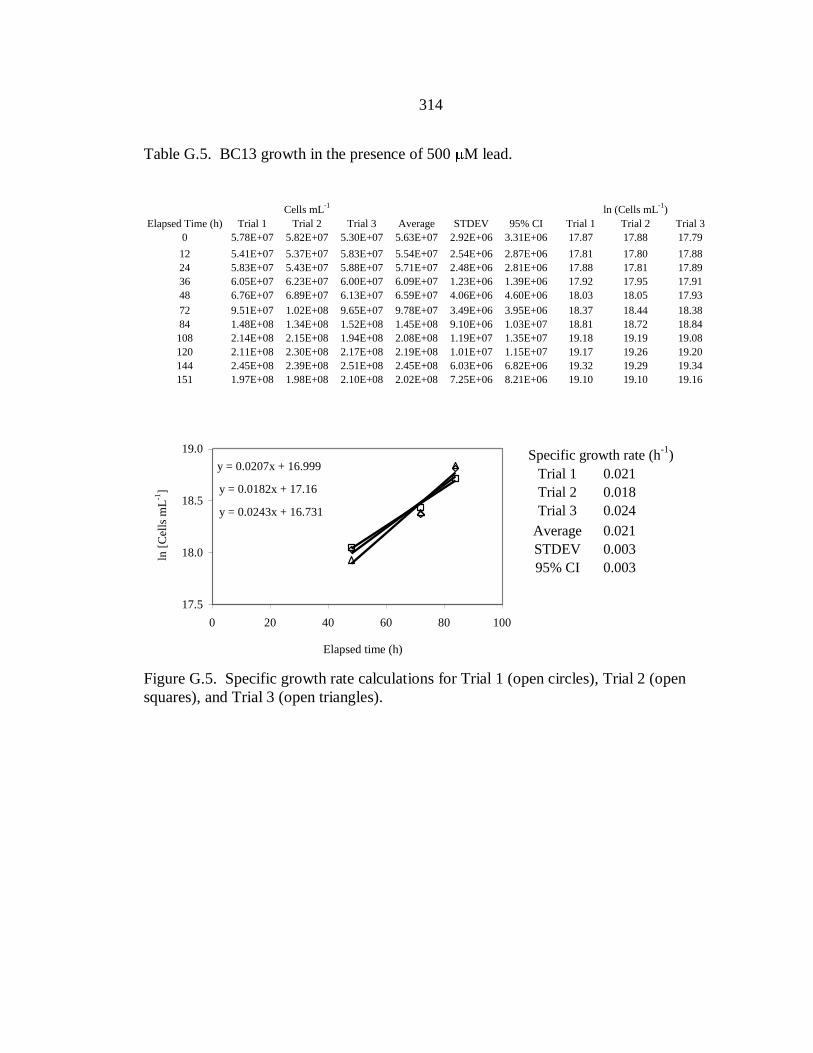
314
Table G.5. BC13 growth in the presence of 500 M lead.
Cells mL
-1ln (Cells mL
-1)
Elapsed Time (h) Trial 1 Trial 2 Trial 3 Average STDEV 95% CI Trial 1 Trial 2 Trial 3
0 5.78E+07 5.82E+07 5.30E+07 5.63E+07 2.92E+06 3.31E+06 17.87 17.88 17.79
12 5.41E+07 5.37E+07 5.83E+07 5.54E+07 2.54E+06 2.87E+06 17.81 17.80 17.88
24 5.83E+07 5.43E+07 5.88E+07 5.71E+07 2.48E+06 2.81E+06 17.88 17.81 17.89
36 6.05E+07 6.23E+07 6.00E+07 6.09E+07 1.23E+06 1.39E+06 17.92 17.95 17.91
48 6.76E+07 6.89E+07 6.13E+07 6.59E+07 4.06E+06 4.60E+06 18.03 18.05 17.93
72 9.51E+07 1.02E+08 9.65E+07 9.78E+07 3.49E+06 3.95E+06 18.37 18.44 18.38
84 1.48E+08 1.34E+08 1.52E+08 1.45E+08 9.10E+06 1.03E+07 18.81 18.72 18.84
108 2.14E+08 2.15E+08 1.94E+08 2.08E+08 1.19E+07 1.35E+07 19.18 19.19 19.08
120 2.11E+08 2.30E+08 2.17E+08 2.19E+08 1.01E+07 1.15E+07 19.17 19.26 19.20
144 2.45E+08 2.39E+08 2.51E+08 2.45E+08 6.03E+06 6.82E+06 19.32 19.29 19.34
151 1.97E+08 1.98E+08 2.10E+08 2.02E+08 7.25E+06 8.21E+06 19.10 19.10 19.16
17.5
18.0
18.5
19.0
0 20 40 60 80 100
ln [
Cel
ls m
L-1
]
Specific growth rate (h-1
)
Trial 1 0.021
Trial 2 0.018
Trial 3 0.024
Average 0.021
STDEV 0.003
95% CI 0.003
y = 0.0207x + 16.999
y = 0.0182x + 17.16
y = 0.0243x + 16.731
17.5
18.0
18.5
19.0
0 20 40 60 80 100
Elapsed time (h)
ln [
Cel
ls m
L-1
]
Figure G.5. Specific growth rate calculations for Trial 1 (open circles), Trial 2 (open
squares), and Trial 3 (open triangles).

315
Table G.6. BC13 growth in the presence of 1 mM lead.
Cells mL
-1ln (Cells mL
-1)
Elapsed Time (h) Trial 1 Trial 2 Trial 3 Average STDEV 95% CI Trial 1 Trial 2 Trial 3
0 5.52E+07 5.85E+07 5.38E+07 5.59E+07 2.40E+06 2.72E+06 17.83 17.88 17.80
12 5.79E+07 6.02E+07 6.27E+07 6.03E+07 2.37E+06 2.68E+06 17.87 17.91 17.95
24 5.31E+07 5.58E+07 5.29E+07 5.39E+07 1.61E+06 1.83E+06 17.79 17.84 17.78
36 6.38E+07 6.24E+07 5.99E+07 6.20E+07 1.96E+06 2.21E+06 17.97 17.95 17.91
48 5.95E+07 6.02E+07 5.96E+07 5.98E+07 3.77E+05 4.27E+05 17.90 17.91 17.90
72 7.77E+07 7.32E+07 7.29E+07 7.46E+07 2.72E+06 3.07E+06 18.17 18.11 18.10
84 1.18E+08 9.86E+07 8.89E+07 1.02E+08 1.46E+07 1.65E+07 18.58 18.41 18.30
108 1.35E+08 1.35E+08 1.37E+08 1.36E+08 1.41E+06 1.60E+06 18.72 18.72 18.74
120 1.52E+08 1.57E+08 1.48E+08 1.52E+08 4.76E+06 5.39E+06 18.84 18.87 18.81
144 1.57E+08 1.64E+08 1.58E+08 1.60E+08 3.71E+06 4.20E+06 18.87 18.92 18.88
151 1.38E+08 1.46E+08 1.42E+08 1.42E+08 4.03E+06 4.56E+06 18.75 18.80 18.77
17.5
18.0
18.5
19.0
0 20 40 60 80 100 120 140
ln [
Cel
ls m
L-1
]
Specific growth rate (h-1
)
Trial 1 0.013
Trial 2 0.014
Trial 3 0.014
Average 0.014
STDEV 0.000
95% CI 0.000
y = 0.0133x + 17.291
y = 0.0139x + 17.204
y = 0.0136x + 17.198
17.5
18.0
18.5
19.0
0 20 40 60 80 100 120 140
Elapsed time (h)
ln [
Cel
ls m
L-1
]
Figure G.6. Specific growth rate calculations for Trial 1 (open circles), Trial 2 (open
squares), and Trial 3 (open triangles).
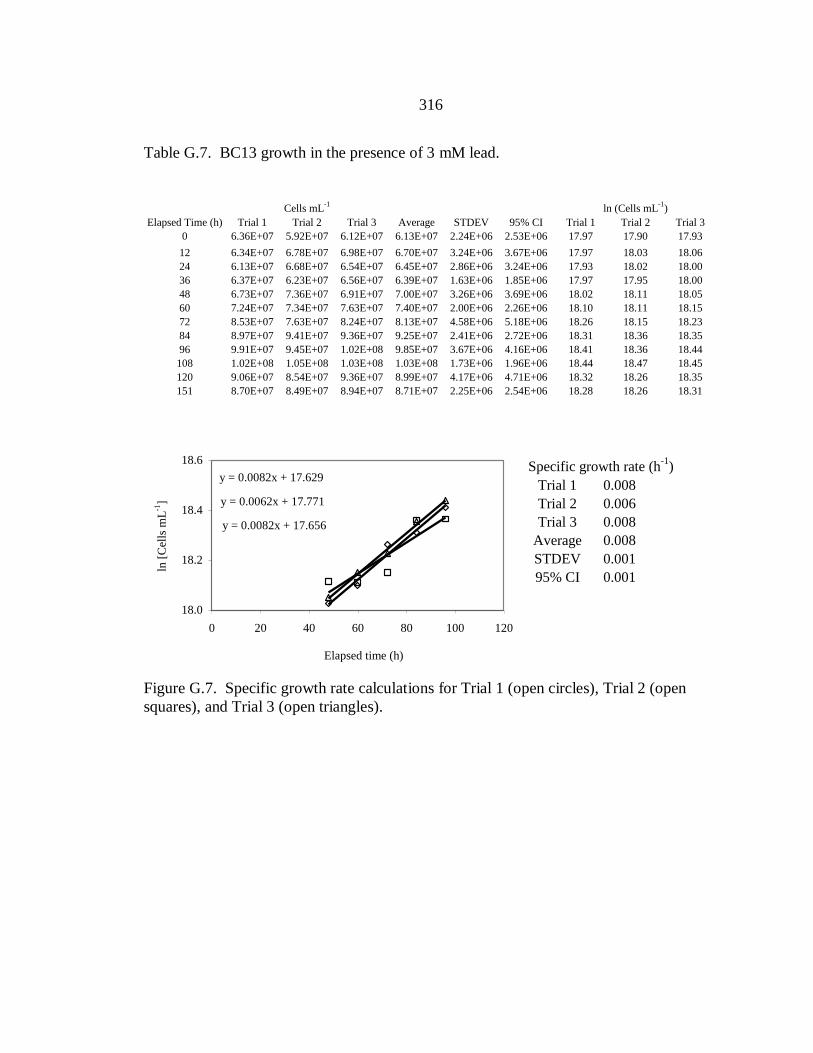
316
Table G.7. BC13 growth in the presence of 3 mM lead.
Cells mL
-1ln (Cells mL
-1)
Elapsed Time (h) Trial 1 Trial 2 Trial 3 Average STDEV 95% CI Trial 1 Trial 2 Trial 3
0 6.36E+07 5.92E+07 6.12E+07 6.13E+07 2.24E+06 2.53E+06 17.97 17.90 17.93
12 6.34E+07 6.78E+07 6.98E+07 6.70E+07 3.24E+06 3.67E+06 17.97 18.03 18.06
24 6.13E+07 6.68E+07 6.54E+07 6.45E+07 2.86E+06 3.24E+06 17.93 18.02 18.00
36 6.37E+07 6.23E+07 6.56E+07 6.39E+07 1.63E+06 1.85E+06 17.97 17.95 18.00
48 6.73E+07 7.36E+07 6.91E+07 7.00E+07 3.26E+06 3.69E+06 18.02 18.11 18.05
60 7.24E+07 7.34E+07 7.63E+07 7.40E+07 2.00E+06 2.26E+06 18.10 18.11 18.15
72 8.53E+07 7.63E+07 8.24E+07 8.13E+07 4.58E+06 5.18E+06 18.26 18.15 18.23
84 8.97E+07 9.41E+07 9.36E+07 9.25E+07 2.41E+06 2.72E+06 18.31 18.36 18.35
96 9.91E+07 9.45E+07 1.02E+08 9.85E+07 3.67E+06 4.16E+06 18.41 18.36 18.44
108 1.02E+08 1.05E+08 1.03E+08 1.03E+08 1.73E+06 1.96E+06 18.44 18.47 18.45
120 9.06E+07 8.54E+07 9.36E+07 8.99E+07 4.17E+06 4.71E+06 18.32 18.26 18.35
151 8.70E+07 8.49E+07 8.94E+07 8.71E+07 2.25E+06 2.54E+06 18.28 18.26 18.31
18.0
18.2
18.4
18.6
0 20 40 60 80 100 120
ln [
Cel
ls m
L-1
]
Specific growth rate (h-1
)
Trial 1 0.008
Trial 2 0.006
Trial 3 0.008
Average 0.008
STDEV 0.001
95% CI 0.001
y = 0.0082x + 17.629
y = 0.0062x + 17.771
y = 0.0082x + 17.656
18.0
18.2
18.4
18.6
0 20 40 60 80 100 120
Elapsed time (h)
ln [
Cel
ls m
L-1
]
Figure G.7. Specific growth rate calculations for Trial 1 (open circles), Trial 2 (open
squares), and Trial 3 (open triangles).
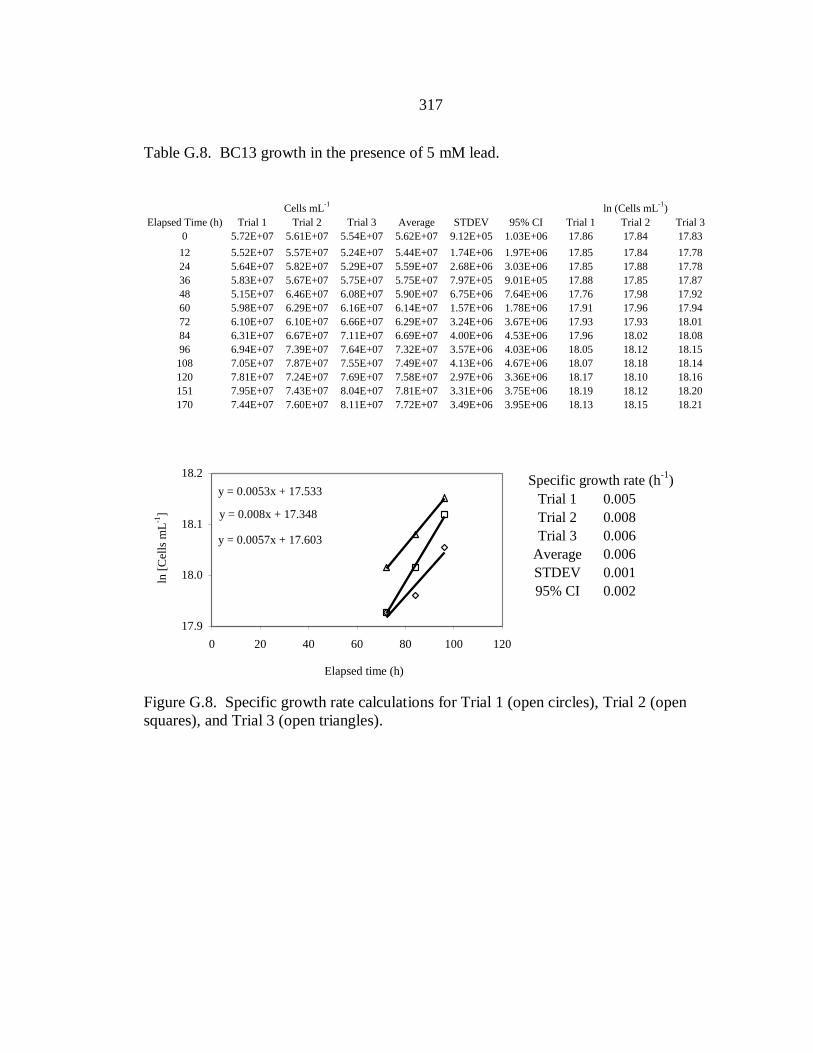
317
Table G.8. BC13 growth in the presence of 5 mM lead.
Cells mL
-1ln (Cells mL
-1)
Elapsed Time (h) Trial 1 Trial 2 Trial 3 Average STDEV 95% CI Trial 1 Trial 2 Trial 3
0 5.72E+07 5.61E+07 5.54E+07 5.62E+07 9.12E+05 1.03E+06 17.86 17.84 17.83
12 5.52E+07 5.57E+07 5.24E+07 5.44E+07 1.74E+06 1.97E+06 17.85 17.84 17.78
24 5.64E+07 5.82E+07 5.29E+07 5.59E+07 2.68E+06 3.03E+06 17.85 17.88 17.78
36 5.83E+07 5.67E+07 5.75E+07 5.75E+07 7.97E+05 9.01E+05 17.88 17.85 17.87
48 5.15E+07 6.46E+07 6.08E+07 5.90E+07 6.75E+06 7.64E+06 17.76 17.98 17.92
60 5.98E+07 6.29E+07 6.16E+07 6.14E+07 1.57E+06 1.78E+06 17.91 17.96 17.94
72 6.10E+07 6.10E+07 6.66E+07 6.29E+07 3.24E+06 3.67E+06 17.93 17.93 18.01
84 6.31E+07 6.67E+07 7.11E+07 6.69E+07 4.00E+06 4.53E+06 17.96 18.02 18.08
96 6.94E+07 7.39E+07 7.64E+07 7.32E+07 3.57E+06 4.03E+06 18.05 18.12 18.15
108 7.05E+07 7.87E+07 7.55E+07 7.49E+07 4.13E+06 4.67E+06 18.07 18.18 18.14
120 7.81E+07 7.24E+07 7.69E+07 7.58E+07 2.97E+06 3.36E+06 18.17 18.10 18.16
151 7.95E+07 7.43E+07 8.04E+07 7.81E+07 3.31E+06 3.75E+06 18.19 18.12 18.20
170 7.44E+07 7.60E+07 8.11E+07 7.72E+07 3.49E+06 3.95E+06 18.13 18.15 18.21
17.9
18.0
18.1
18.2
0 20 40 60 80 100 120
ln [
Cel
ls m
L-1
]
Specific growth rate (h-1
)
Trial 1 0.005
Trial 2 0.008
Trial 3 0.006
Average 0.006
STDEV 0.001
95% CI 0.002
y = 0.0053x + 17.533
y = 0.008x + 17.348
y = 0.0057x + 17.603
17.9
18.0
18.1
18.2
0 20 40 60 80 100 120
Elapsed time (h)
ln [
Cel
ls m
L-1
]
Figure G.8. Specific growth rate calculations for Trial 1 (open circles), Trial 2 (open
squares), and Trial 3 (open triangles).

318
Table G.9. BC13 growth in the presence of 7.5 mM lead.
Cells mL
-1ln (Cells mL
-1)
Elapsed Time (h) Trial 1 Trial 2 Trial 3 Average STDEV 95% CI Trial 1 Trial 2 Trial 3
0 5.26E+07 5.26E+07 5.26E+07 5.26E+07 1.00E+00 1.13E+00 17.78 17.78 17.78
12 5.46E+07 5.15E+07 4.76E+07 5.12E+07 3.51E+06 3.97E+06 17.82 17.76 17.68
24 5.43E+07 5.31E+07 4.95E+07 5.23E+07 2.48E+06 2.81E+06 17.81 17.79 17.72
36 5.89E+07 5.83E+07 5.29E+07 5.67E+07 3.32E+06 3.76E+06 17.89 17.88 17.78
48 5.61E+07 6.13E+07 5.10E+07 5.61E+07 5.14E+06 5.82E+06 17.84 17.93 17.75
60 5.52E+07 5.69E+07 4.81E+07 5.34E+07 4.68E+06 5.30E+06 17.83 17.86 17.69
72 5.58E+07 5.61E+07 4.58E+07 5.26E+07 5.85E+06 6.62E+06 17.84 17.84 17.64
84 5.69E+07 6.13E+07 4.58E+07 5.47E+07 7.97E+06 9.02E+06 17.86 17.93 17.64
96 5.42E+07 6.50E+07 4.99E+07 5.64E+07 7.77E+06 8.79E+06 17.81 17.99 17.73
108 5.89E+07 6.25E+07 4.70E+07 5.61E+07 8.13E+06 9.20E+06 17.89 17.95 17.67
120 6.18E+07 6.28E+07 4.83E+07 5.76E+07 8.07E+06 9.13E+06 17.94 17.96 17.69
151 5.57E+07 6.13E+07 5.07E+07 5.59E+07 5.33E+06 6.03E+06 17.83 17.93 17.74
170 5.20E+07 5.68E+07 4.67E+07 5.18E+07 5.02E+06 5.68E+06 17.77 17.85 17.66
240 5.22E+07 5.73E+07 4.72E+07 5.22E+07 5.01E+06 5.67E+06 17.77 17.86 17.67
17.6
17.7
17.8
17.9
18.0
18.1
0 50 100 150 200 250 300
ln [
Cel
ls m
L-1
]
Specific growth rate (h-1
)
Trial 1 0.000
Trial 2 0.000
Trial 3 0.000
Average 0.000
STDEV 0.000
95% CI 0.000
y = -0.0001x + 17.842
y = 0.0005x + 17.84
y = -0.0003x + 17.727
17.6
17.7
17.8
17.9
18.0
18.1
0 50 100 150 200 250 300
Elapsed time (h)
ln [
Cel
ls m
L-1
]
Figure G.9. Specific growth rate calculations for Trial 1 (open circles), Trial 2 (open
squares), and Trial 3 (open triangles).
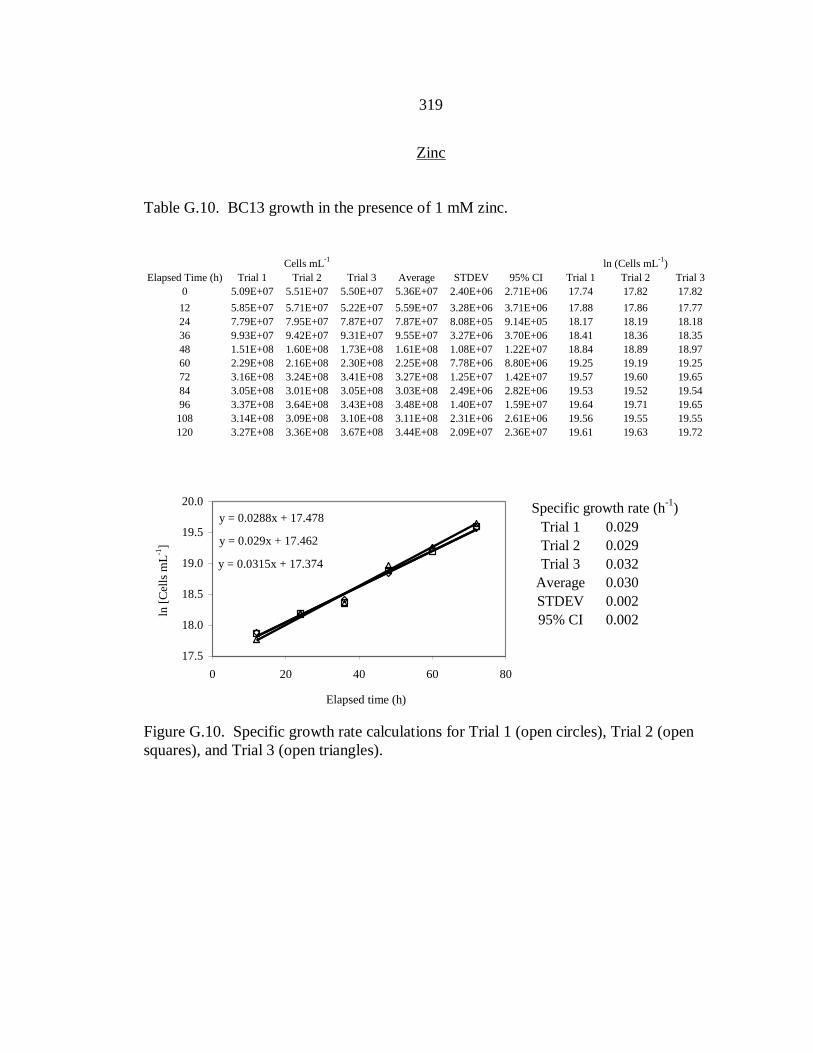
319
Zinc
Table G.10. BC13 growth in the presence of 1 mM zinc.
Cells mL
-1ln (Cells mL
-1)
Elapsed Time (h) Trial 1 Trial 2 Trial 3 Average STDEV 95% CI Trial 1 Trial 2 Trial 3
0 5.09E+07 5.51E+07 5.50E+07 5.36E+07 2.40E+06 2.71E+06 17.74 17.82 17.82
12 5.85E+07 5.71E+07 5.22E+07 5.59E+07 3.28E+06 3.71E+06 17.88 17.86 17.77
24 7.79E+07 7.95E+07 7.87E+07 7.87E+07 8.08E+05 9.14E+05 18.17 18.19 18.18
36 9.93E+07 9.42E+07 9.31E+07 9.55E+07 3.27E+06 3.70E+06 18.41 18.36 18.35
48 1.51E+08 1.60E+08 1.73E+08 1.61E+08 1.08E+07 1.22E+07 18.84 18.89 18.97
60 2.29E+08 2.16E+08 2.30E+08 2.25E+08 7.78E+06 8.80E+06 19.25 19.19 19.25
72 3.16E+08 3.24E+08 3.41E+08 3.27E+08 1.25E+07 1.42E+07 19.57 19.60 19.65
84 3.05E+08 3.01E+08 3.05E+08 3.03E+08 2.49E+06 2.82E+06 19.53 19.52 19.54
96 3.37E+08 3.64E+08 3.43E+08 3.48E+08 1.40E+07 1.59E+07 19.64 19.71 19.65
108 3.14E+08 3.09E+08 3.10E+08 3.11E+08 2.31E+06 2.61E+06 19.56 19.55 19.55
120 3.27E+08 3.36E+08 3.67E+08 3.44E+08 2.09E+07 2.36E+07 19.61 19.63 19.72
Specific growth rate (h-1
)
Trial 1 0.029
Trial 2 0.029
Trial 3 0.032
Average 0.030
STDEV 0.002
95% CI 0.002
y = 0.0288x + 17.478
y = 0.029x + 17.462
y = 0.0315x + 17.374
17.5
18.0
18.5
19.0
19.5
20.0
0 20 40 60 80
Elapsed time (h)
ln [
Cel
ls m
L-1
]
Figure G.10. Specific growth rate calculations for Trial 1 (open circles), Trial 2 (open
squares), and Trial 3 (open triangles).

320
Table G.11. BC13 growth in the presence of 3 mM zinc.
Cells mL
-1ln (Cells mL
-1)
Elapsed Time (h) Trial 1 Trial 2 Trial 3 Average STDEV 95% CI Trial 1 Trial 2 Trial 3
0 5.35E+07 5.88E+07 6.44E+07 5.89E+07 5.41E+06 6.13E+06 17.80 17.89 17.98
12 5.60E+07 5.03E+07 5.12E+07 5.25E+07 3.05E+06 3.45E+06 17.84 17.73 17.75
24 5.61E+07 6.17E+07 5.89E+07 5.89E+07 2.79E+06 3.16E+06 17.84 17.94 17.89
36 7.82E+07 8.13E+07 8.19E+07 8.05E+07 1.99E+06 2.26E+06 18.17 18.21 18.22
48 1.14E+08 1.12E+08 1.17E+08 1.14E+08 2.66E+06 3.01E+06 18.55 18.53 18.58
60 1.68E+08 1.68E+08 1.62E+08 1.66E+08 3.41E+06 3.86E+06 18.94 18.94 18.90
72 2.61E+08 2.69E+08 2.84E+08 2.71E+08 1.15E+07 1.30E+07 19.38 19.41 19.46
84 2.61E+08 2.44E+08 2.45E+08 2.50E+08 9.76E+06 1.10E+07 19.38 19.31 19.32
96 2.75E+08 2.83E+08 2.71E+08 2.76E+08 6.18E+06 6.99E+06 19.43 19.46 19.42
108 2.28E+08 2.38E+08 2.40E+08 2.35E+08 6.67E+06 7.55E+06 19.24 19.29 19.30
120 2.44E+08 2.59E+08 2.39E+08 2.47E+08 1.00E+07 1.13E+07 19.31 19.37 19.29
17.5
18.0
18.5
19.0
19.5
20.0
0 20 40 60 80
ln [
Cel
ls m
L-1
]
Specific growth rate (h-1
)
Trial 1 0.027
Trial 2 0.028
Trial 3 0.029
Average 0.028
STDEV 0.001
95% CI 0.001
y = 0.0271x + 17.318
y = 0.0279x + 17.291
y = 0.0285x + 17.272
17.5
18.0
18.5
19.0
19.5
20.0
0 20 40 60 80
Elapsed time (h)
ln [
Cel
ls m
L-1
]
Figure G.11. Specific growth rate calculations for Trial 1 (open circles), Trial 2 (open
squares), and Trial 3 (open triangles).
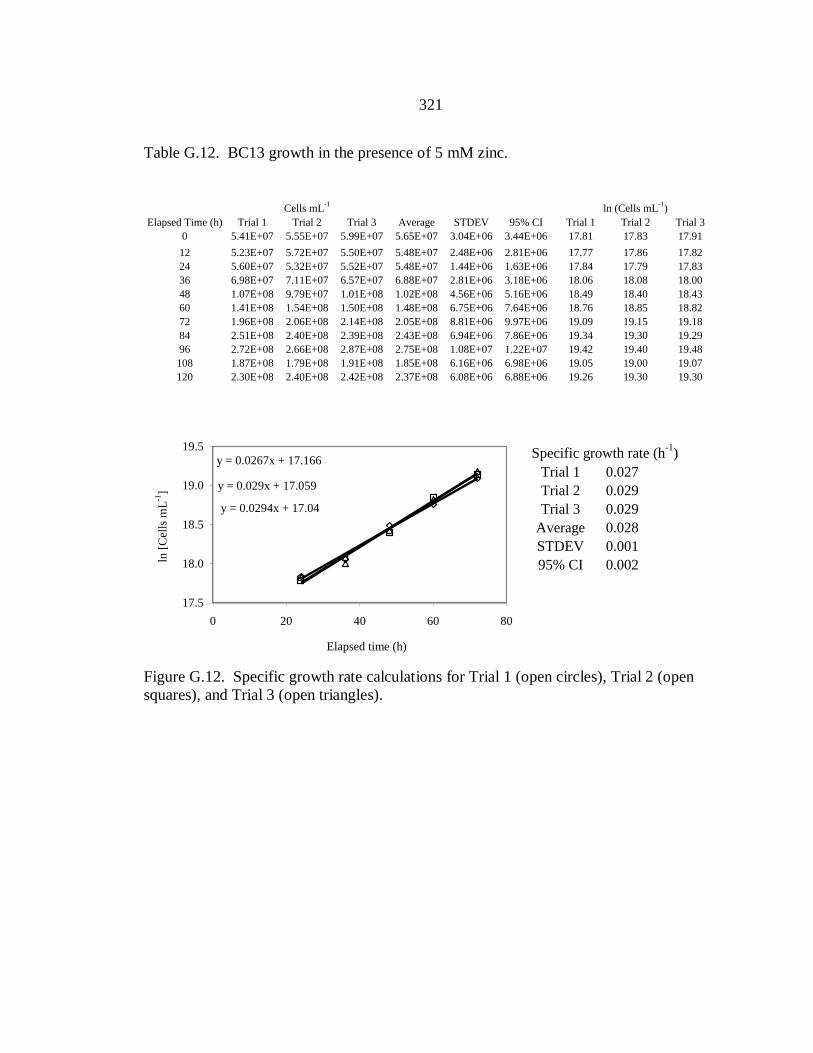
321
Table G.12. BC13 growth in the presence of 5 mM zinc.
Cells mL
-1ln (Cells mL
-1)
Elapsed Time (h) Trial 1 Trial 2 Trial 3 Average STDEV 95% CI Trial 1 Trial 2 Trial 3
0 5.41E+07 5.55E+07 5.99E+07 5.65E+07 3.04E+06 3.44E+06 17.81 17.83 17.91
12 5.23E+07 5.72E+07 5.50E+07 5.48E+07 2.48E+06 2.81E+06 17.77 17.86 17.82
24 5.60E+07 5.32E+07 5.52E+07 5.48E+07 1.44E+06 1.63E+06 17.84 17.79 17.83
36 6.98E+07 7.11E+07 6.57E+07 6.88E+07 2.81E+06 3.18E+06 18.06 18.08 18.00
48 1.07E+08 9.79E+07 1.01E+08 1.02E+08 4.56E+06 5.16E+06 18.49 18.40 18.43
60 1.41E+08 1.54E+08 1.50E+08 1.48E+08 6.75E+06 7.64E+06 18.76 18.85 18.82
72 1.96E+08 2.06E+08 2.14E+08 2.05E+08 8.81E+06 9.97E+06 19.09 19.15 19.18
84 2.51E+08 2.40E+08 2.39E+08 2.43E+08 6.94E+06 7.86E+06 19.34 19.30 19.29
96 2.72E+08 2.66E+08 2.87E+08 2.75E+08 1.08E+07 1.22E+07 19.42 19.40 19.48
108 1.87E+08 1.79E+08 1.91E+08 1.85E+08 6.16E+06 6.98E+06 19.05 19.00 19.07
120 2.30E+08 2.40E+08 2.42E+08 2.37E+08 6.08E+06 6.88E+06 19.26 19.30 19.30
17.5
18.0
18.5
19.0
19.5
0 20 40 60 80
ln [
Cel
ls m
L-1
]
Specific growth rate (h-1
)
Trial 1 0.027
Trial 2 0.029
Trial 3 0.029
Average 0.028
STDEV 0.001
95% CI 0.002
y = 0.0267x + 17.166
y = 0.029x + 17.059
y = 0.0294x + 17.04
17.5
18.0
18.5
19.0
19.5
0 20 40 60 80
Elapsed time (h)
ln [
Cel
ls m
L-1
]
Figure G.12. Specific growth rate calculations for Trial 1 (open circles), Trial 2 (open
squares), and Trial 3 (open triangles).
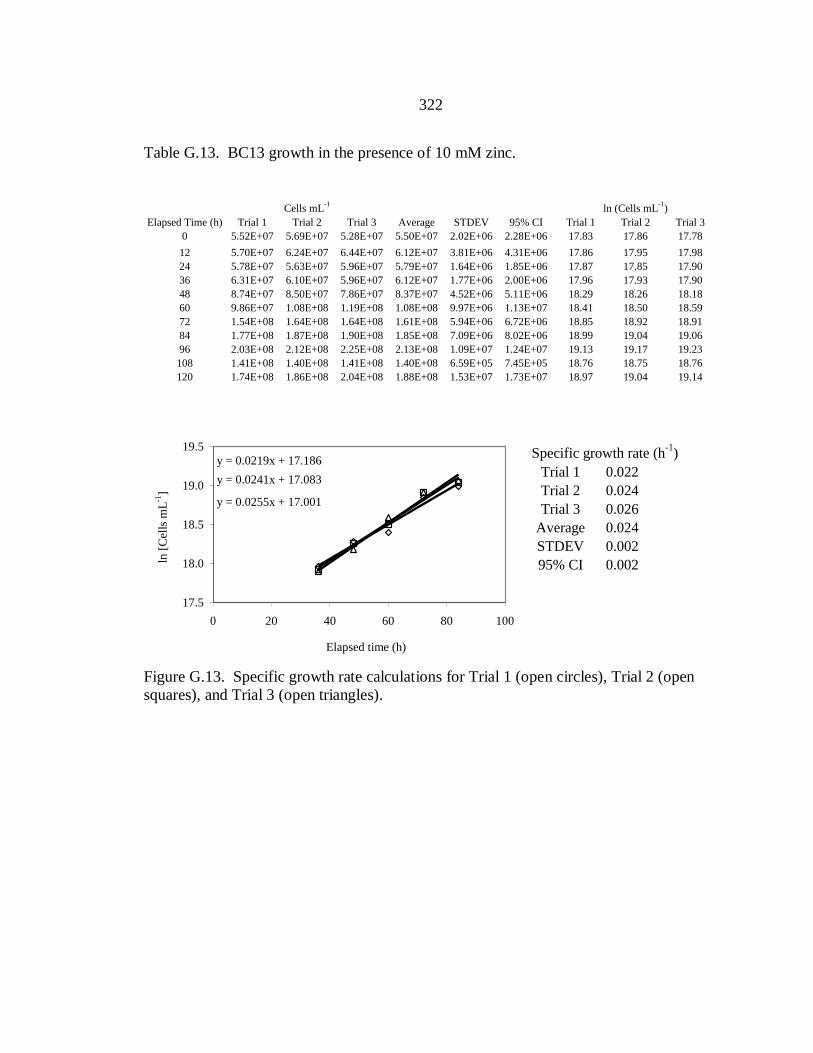
322
Table G.13. BC13 growth in the presence of 10 mM zinc.
Cells mL
-1ln (Cells mL
-1)
Elapsed Time (h) Trial 1 Trial 2 Trial 3 Average STDEV 95% CI Trial 1 Trial 2 Trial 3
0 5.52E+07 5.69E+07 5.28E+07 5.50E+07 2.02E+06 2.28E+06 17.83 17.86 17.78
12 5.70E+07 6.24E+07 6.44E+07 6.12E+07 3.81E+06 4.31E+06 17.86 17.95 17.98
24 5.78E+07 5.63E+07 5.96E+07 5.79E+07 1.64E+06 1.85E+06 17.87 17.85 17.90
36 6.31E+07 6.10E+07 5.96E+07 6.12E+07 1.77E+06 2.00E+06 17.96 17.93 17.90
48 8.74E+07 8.50E+07 7.86E+07 8.37E+07 4.52E+06 5.11E+06 18.29 18.26 18.18
60 9.86E+07 1.08E+08 1.19E+08 1.08E+08 9.97E+06 1.13E+07 18.41 18.50 18.59
72 1.54E+08 1.64E+08 1.64E+08 1.61E+08 5.94E+06 6.72E+06 18.85 18.92 18.91
84 1.77E+08 1.87E+08 1.90E+08 1.85E+08 7.09E+06 8.02E+06 18.99 19.04 19.06
96 2.03E+08 2.12E+08 2.25E+08 2.13E+08 1.09E+07 1.24E+07 19.13 19.17 19.23
108 1.41E+08 1.40E+08 1.41E+08 1.40E+08 6.59E+05 7.45E+05 18.76 18.75 18.76
120 1.74E+08 1.86E+08 2.04E+08 1.88E+08 1.53E+07 1.73E+07 18.97 19.04 19.14
17.5
18.0
18.5
19.0
19.5
0 20 40 60 80 100
ln [
Cel
ls m
L-1
]
Specific growth rate (h-1
)
Trial 1 0.022
Trial 2 0.024
Trial 3 0.026
Average 0.024
STDEV 0.002
95% CI 0.002
y = 0.0219x + 17.186
y = 0.0241x + 17.083
y = 0.0255x + 17.001
17.5
18.0
18.5
19.0
19.5
0 20 40 60 80 100
Elapsed time (h)
ln [
Cel
ls m
L-1
]
Figure G.13. Specific growth rate calculations for Trial 1 (open circles), Trial 2 (open
squares), and Trial 3 (open triangles).

323
Table G.14. BC13 growth in the presence of 20 mM zinc.
Cells mL
-1ln (Cells mL
-1)
Elapsed Time (h) Trial 1 Trial 2 Trial 3 Average STDEV 95% CI Trial 1 Trial 2 Trial 3
0 4.54E+07 5.00E+07 5.46E+07 5.00E+07 4.57E+06 5.18E+06 17.63 17.73 17.82
12 4.92E+07 4.85E+07 4.78E+07 4.85E+07 6.93E+05 7.84E+05 17.71 17.70 17.68
24 5.16E+07 4.83E+07 4.54E+07 4.84E+07 3.09E+06 3.50E+06 17.76 17.69 17.63
72 5.32E+07 5.90E+07 5.71E+07 5.64E+07 2.95E+06 3.34E+06 17.79 17.89 17.86
84 7.09E+07 6.86E+07 7.10E+07 7.02E+07 1.38E+06 1.57E+06 18.08 18.04 18.08
96 7.67E+07 8.05E+07 7.81E+07 7.84E+07 1.95E+06 2.21E+06 18.15 18.20 18.17
108 1.16E+08 1.08E+08 1.06E+08 1.10E+08 5.13E+06 5.81E+06 18.57 18.50 18.48
120 1.44E+08 1.37E+08 1.30E+08 1.37E+08 6.91E+06 7.82E+06 18.79 18.74 18.68
144 1.48E+08 1.61E+08 1.77E+08 1.62E+08 1.47E+07 1.66E+07 18.81 18.90 18.99
168 1.19E+08 1.12E+08 1.07E+08 1.13E+08 6.18E+06 6.99E+06 18.59 18.54 18.49 17.5
18.0
18.5
19.0
0 20 40 60 80 100 120 140
Specific growth rate (h-1
)
Trial 1 0.021
Trial 2 0.018
Trial 3 0.017
Average 0.019
STDEV 0.002
95% CI 0.002
y = 0.0207x + 16.29
y = 0.0179x + 16.559
y = 0.0171x + 16.617
17.5
18.0
18.5
19.0
0 20 40 60 80 100 120 140
Elapsed time (h)
ln [
Cel
ls m
L-1
]
Figure G.14. Specific growth rate calculations for Trial 1 (open circles), Trial 2 (open
squares), and Trial 3 (open triangles).
324
Table G.15. BC13 growth in the presence of 35 mM zinc.
Cells mL
-1ln (Cells mL
-1)
Elapsed Time (h) Trial 1 Trial 2 Trial 3 Average STDEV 95% CI Trial 1 Trial 2 Trial 3
0 5.68E+07 5.78E+07 5.49E+07 5.65E+07 1.44E+06 1.63E+06 17.85 17.87 17.82
12 5.68E+07 5.53E+07 5.61E+07 5.61E+07 7.64E+05 8.64E+05 17.86 17.83 17.84
24 5.40E+07 5.07E+07 4.82E+07 5.10E+07 2.90E+06 3.28E+06 17.80 17.74 17.69
72 6.42E+07 6.64E+07 6.80E+07 6.62E+07 1.92E+06 2.17E+06 17.98 18.01 18.04
84 7.06E+07 7.38E+07 7.06E+07 7.17E+07 1.85E+06 2.09E+06 18.07 18.12 18.07
96 9.04E+07 8.79E+07 8.53E+07 8.79E+07 2.53E+06 2.86E+06 18.32 18.29 18.26
108 1.14E+08 1.14E+08 1.10E+08 1.13E+08 2.64E+06 2.98E+06 18.55 18.56 18.51
120 1.32E+08 1.38E+08 1.40E+08 1.37E+08 4.19E+06 4.74E+06 18.70 18.74 18.76
144 1.51E+08 1.47E+08 1.48E+08 1.49E+08 2.02E+06 2.28E+06 18.83 18.81 18.82
168 1.57E+08 1.58E+08 1.56E+08 1.57E+08 1.22E+06 1.38E+06 18.87 18.88 18.86 17.5
18.0
18.5
19.0
0 20 40 60 80 100 120 140
ln [
Cel
ls m
L-1
]
Specific growth rate (h-1
)
Trial 1 0.016
Trial 2 0.016
Trial 3 0.016
Average 0.016
STDEV 0.000
95% CI 0.000
y = 0.016x + 16.787
y = 0.0158x + 16.825
y = 0.0157x + 16.818
17.5
18.0
18.5
19.0
0 20 40 60 80 100 120 140
Elapsed time (h)
ln [
Cel
ls m
L-1
]
Figure G.15. Specific growth rate calculations for Trial 1 (open circles), Trial 2 (open
squares), and Trial 3 (open triangles).
325
Table G.16. BC13 growth in the presence of 50 mM zinc.
Trial 1 Trial 2 Trial 3 Average STDEV 95% CI ln (Cells mL
-1)
0 5.23E+07 4.86E+07 5.00E+07 5.03E+07 1.86E+06 2.10E+06 17.77 17.70 17.73
12 5.16E+07 5.00E+07 4.84E+07 5.00E+07 1.62E+06 1.83E+06 17.76 17.73 17.69
24 4.88E+07 5.15E+07 5.26E+07 5.09E+07 1.96E+06 2.22E+06 17.70 17.76 17.78
72 4.36E+07 4.62E+07 4.64E+07 4.54E+07 1.56E+06 1.76E+06 17.59 17.65 17.65
84 5.57E+07 5.37E+07 5.01E+07 5.32E+07 2.82E+06 3.19E+06 17.84 17.80 17.73
96 6.21E+07 6.68E+07 6.82E+07 6.57E+07 3.22E+06 3.65E+06 17.94 18.02 18.04
108 8.09E+07 7.36E+07 6.72E+07 7.39E+07 6.86E+06 7.76E+06 18.21 18.11 18.02
120 8.64E+07 8.65E+07 8.39E+07 8.56E+07 1.47E+06 1.67E+06 18.27 18.28 18.25
144 9.29E+07 9.39E+07 9.78E+07 9.49E+07 2.61E+06 2.95E+06 18.35 18.36 18.40
168 9.09E+07 8.42E+07 8.86E+07 8.79E+07 3.42E+06 3.87E+06 18.33 18.25 18.30 17.5
18.0
18.5
19.0
0 50 100 150 200
ln [
Cel
ls m
L-1
]
Specific growth rate (h-1
)
Trial 2 0.011
Trial 3 0.010
Average 0.011
STDEV 0.000
95% CI 0.000
y = 0.0107x + 16.921
y = 0.0102x + 16.972
y = 0.0108x + 16.895
17.5
18.0
18.5
19.0
0 50 100 150 200
Elapsed time (h)
ln [
Cel
ls m
L-1
]
Figure G.16. Specific growth rate calculations for Trial 1 (open circles), Trial 2 (open
squares), and Trial 3 (open triangles).

326
Table G.17. BC13 growth in the presence of 75 mM zinc.
Cells mL
-1ln (Cells mL
-1)
Elapsed Time (h) Trial 1 Trial 2 Trial 3 Average STDEV 95% CI Trial 1 Trial 2 Trial 3
0 4.92E+07 4.93E+07 5.27E+07 5.04E+07 2.01E+06 2.27E+06 17.71 17.71 17.78
12 5.29E+07 5.36E+07 5.23E+07 5.29E+07 6.24E+05 7.06E+05 17.78 17.80 17.77
24 5.37E+07 5.89E+07 5.57E+07 5.61E+07 2.62E+06 2.97E+06 17.80 17.89 17.83
72 4.93E+07 6.10E+07 5.40E+07 5.48E+07 5.89E+06 6.66E+06 17.71 17.93 17.80
84 4.75E+07 5.77E+07 4.97E+07 5.16E+07 5.40E+06 6.11E+06 17.68 17.87 17.72
96 5.12E+07 5.81E+07 4.97E+07 5.30E+07 4.47E+06 5.06E+06 17.75 17.88 17.72
108 5.02E+07 6.38E+07 4.83E+07 5.41E+07 8.45E+06 9.56E+06 17.73 17.97 17.69
120 5.37E+07 5.99E+07 4.82E+07 5.39E+07 5.84E+06 6.60E+06 17.80 17.91 17.69
144 5.81E+07 6.23E+07 4.52E+07 5.52E+07 8.89E+06 1.01E+07 17.88 17.95 17.63
168 6.07E+07 6.59E+07 4.10E+07 5.59E+07 1.32E+07 1.49E+07 17.92 18.00 17.53 17.4
17.6
17.8
18.0
18.2
0 50 100 150 200
ln [
Cel
ls m
L-1
]
Specific growth rate (h-1
)
Trial 1 0.000
Trial 2 0.000
Trial 3 0.000
Average 0.000
STDEV 0.000
95% CI 0.000
y = 0.0008x + 17.712
y = 0.0013x + 17.785
y = -0.0014x + 17.834
17.4
17.6
17.8
18.0
18.2
0 50 100 150 200
Elapsed time (h)
ln [
Cel
ls m
L-1
]
Figure G.17. Specific growth rate calculations for Trial 1 (open circles), Trial 2 (open
squares), and Trial 3 (open triangles).

327
Copper
Table G.18. BC13 growth in the presence of 1 mM copper.
Cells mL
-1ln (Cells mL
-1)
Elapsed Time (h) Trial 1 Trial 2 Trial 3 Average STDEV 95% CI Trial 1 Trial 2 Trial 3
0 4.68E+07 5.04E+07 4.55E+07 4.76E+07 2.51E+06 2.84E+06 17.66 17.74 17.63
12 5.55E+07 5.31E+07 5.58E+07 5.48E+07 1.48E+06 1.67E+06 17.83 17.79 17.84
24 7.18E+07 7.85E+07 8.40E+07 7.81E+07 6.08E+06 6.88E+06 18.09 18.18 18.25
36 9.71E+07 9.51E+07 9.41E+07 9.54E+07 1.51E+06 1.70E+06 18.39 18.37 18.36
48 1.39E+08 1.32E+08 1.32E+08 1.34E+08 4.12E+06 4.66E+06 18.75 18.69 18.70
60 2.77E+08 3.02E+08 3.27E+08 3.02E+08 2.49E+07 2.82E+07 19.44 19.53 19.61
72 3.38E+08 3.07E+08 2.90E+08 3.12E+08 2.47E+07 2.79E+07 19.64 19.54 19.48
84 2.93E+08 3.22E+08 3.47E+08 3.20E+08 2.71E+07 3.07E+07 19.49 19.59 19.66
96 2.87E+08 3.14E+08 3.31E+08 3.10E+08 2.21E+07 2.50E+07 19.47 19.56 19.62
108 3.02E+08 2.85E+08 2.84E+08 2.90E+08 1.02E+07 1.15E+07 19.53 19.47 19.47
120 3.14E+08 2.90E+08 3.17E+08 3.07E+08 1.51E+07 1.71E+07 19.57 19.48 19.57
Specific growth rate (h-1
)
Trial 1 0.032
Trial 2 0.033
Trial 3 0.033
Average 0.033
STDEV 0.001
95% CI 0.001
y = 0.0323x + 17.337
y = 0.0333x + 17.314
y = 0.0332x + 17.353
17.5
18.0
18.5
19.0
19.5
20.0
0 10 20 30 40 50 60 70
Elapsed time (h)
ln [
Cel
ls m
L-1
]
Figure G.18. Specific growth rate calculations for Trial 1 (open circles), Trial 2 (open
squares), and Trial 3 (open triangles).

328
Table G.19. BC13 growth in the presence of 3 mM copper.
Cells mL
-1ln (Cells mL
-1)
Elapsed Time (h) Trial 1 Trial 2 Trial 3 Average STDEV 95% CI Trial 1 Trial 2 Trial 3
0 4.90E+07 4.88E+07 4.99E+07 4.92E+07 5.89E+05 6.67E+05 17.71 17.70 17.73
12 5.13E+07 5.06E+07 5.48E+07 5.23E+07 2.27E+06 2.57E+06 17.75 17.74 17.82
24 7.58E+07 8.24E+07 9.05E+07 8.29E+07 7.38E+06 8.36E+06 18.14 18.23 18.32
36 9.46E+07 8.76E+07 9.62E+07 9.28E+07 4.60E+06 5.20E+06 18.36 18.29 18.38
48 1.35E+08 1.43E+08 1.32E+08 1.37E+08 5.70E+06 6.45E+06 18.72 18.78 18.70
60 2.51E+08 2.35E+08 2.27E+08 2.37E+08 1.23E+07 1.39E+07 19.34 19.27 19.24
72 3.64E+08 3.41E+08 3.18E+08 3.41E+08 2.28E+07 2.58E+07 19.71 19.65 19.58
84 3.19E+08 3.47E+08 3.31E+08 3.32E+08 1.43E+07 1.62E+07 19.58 19.67 19.62
96 2.75E+08 2.82E+08 2.84E+08 2.81E+08 4.73E+06 5.35E+06 19.43 19.46 19.46
108 2.91E+08 2.95E+08 2.85E+08 2.91E+08 5.17E+06 5.85E+06 19.49 19.50 19.47
120 3.15E+08 3.11E+08 3.34E+08 3.20E+08 1.25E+07 1.42E+07 19.57 19.56 19.63
17.5
18.0
18.5
19.0
19.5
20.0
0 20 40 60 80
ln [
Cel
ls m
L-1
]
Specific growth rate (h-1
)
Trial 1 0.033
Trial 2 0.031
Trial 3 0.028
Average 0.031
STDEV 0.002
95% CI 0.003
y = 0.0327x + 17.298
y = 0.0313x + 17.342
y = 0.0282x + 17.487
17.5
18.0
18.5
19.0
19.5
20.0
0 20 40 60 80
Elapsed time (h)
ln [
Cel
ls m
L-1
]
Figure G.19. Specific growth rate calculations for Trial 1 (open circles), Trial 2 (open
squares), and Trial 3 (open triangles).

329
Table G.20. BC13 growth in the presence of 5 mM copper.
Cells mL
-1ln (Cells mL
-1)
Elapsed Time (h) Trial 1 Trial 2 Trial 3 Average STDEV 95% CI Trial 1 Trial 2 Trial 3
0 4.99E+07 4.56E+07 4.60E+07 4.72E+07 2.37E+06 2.68E+06 17.73 17.64 17.64
12 4.95E+07 5.09E+07 5.52E+07 5.19E+07 3.02E+06 3.41E+06 17.72 17.74 17.83
24 7.51E+07 7.71E+07 7.33E+07 7.52E+07 1.92E+06 2.17E+06 18.13 18.16 18.11
36 1.03E+08 1.00E+08 1.03E+08 1.02E+08 1.67E+06 1.89E+06 18.45 18.42 18.45
48 1.26E+08 1.26E+08 1.21E+08 1.24E+08 2.41E+06 2.73E+06 18.65 18.65 18.61
60 2.42E+08 2.49E+08 2.61E+08 2.51E+08 9.87E+06 1.12E+07 19.30 19.33 19.38
72 3.39E+08 3.14E+08 3.31E+08 3.28E+08 1.29E+07 1.46E+07 19.64 19.56 19.62
84 3.10E+08 3.17E+08 2.97E+08 3.08E+08 9.84E+06 1.11E+07 19.55 19.57 19.51
96 2.87E+08 3.12E+08 3.36E+08 3.12E+08 2.46E+07 2.78E+07 19.48 19.56 19.63
108 2.84E+08 2.57E+08 2.32E+08 2.58E+08 2.60E+07 2.94E+07 19.47 19.37 19.26
120 3.01E+08 3.26E+08 3.27E+08 3.18E+08 1.47E+07 1.67E+07 19.52 19.60 19.61
17.5
18.0
18.5
19.0
19.5
20.0
0 20 40 60 80
ln [
Cel
ls m
L-1
]
Specific growth rate (h-1
)
Trial 1 0.032
Trial 2 0.031
Trial 3 0.031
Average 0.031
STDEV 0.001
95% CI 0.001
y = 0.0317x + 17.315
y = 0.0306x + 17.362
y = 0.0308x + 17.374
17.5
18.0
18.5
19.0
19.5
20.0
0 20 40 60 80
Elapsed time (h)
ln [
Cel
ls m
L-1
]
Figure G.20. Specific growth rate calculations for Trial 1 (open circles), Trial 2 (open
squares), and Trial 3 (open triangles).
330
Table G.21. BC13 growth in the presence of 10 mM copper.
Cells mL
-1ln (Cells mL
-1)
Elapsed Time (h) Trial 1 Trial 2 Trial 3 Average STDEV 95% CI Trial 1 Trial 2 Trial 3
0 5.18E+07 5.16E+07 4.80E+07 5.05E+07 2.13E+06 2.41E+06 17.76 17.76 17.69
12 5.66E+07 5.48E+07 5.23E+07 5.46E+07 2.18E+06 2.46E+06 17.85 17.82 17.77
24 6.09E+07 5.98E+07 6.31E+07 6.13E+07 1.70E+06 1.93E+06 17.92 17.91 17.96
36 6.71E+07 6.41E+07 6.24E+07 6.45E+07 2.38E+06 2.70E+06 18.02 17.98 17.95
48 8.65E+07 8.67E+07 8.76E+07 8.69E+07 5.94E+05 6.72E+05 18.28 18.28 18.29
60 1.04E+08 1.11E+08 1.21E+08 1.12E+08 8.18E+06 9.25E+06 18.46 18.53 18.61
72 1.54E+08 1.45E+08 1.66E+08 1.55E+08 1.03E+07 1.17E+07 18.85 18.79 18.93
84 2.32E+08 2.16E+08 2.39E+08 2.29E+08 1.18E+07 1.34E+07 19.26 19.19 19.29
96 2.62E+08 2.84E+08 2.59E+08 2.68E+08 1.35E+07 1.52E+07 19.39 19.46 19.37
108 2.36E+08 2.29E+08 2.29E+08 2.32E+08 3.74E+06 4.24E+06 19.28 19.25 19.25
120 2.17E+08 2.28E+08 2.06E+08 2.17E+08 1.10E+07 1.24E+07 19.19 19.24 19.14
17.5
18.0
18.5
19.0
19.5
0 20 40 60 80 100
ln [
Cel
ls m
L-1
]
Specific growth rate (h-1
)
Trial 1 0.026
Trial 2 0.025
Trial 3 0.028
Average 0.026
STDEV 0.002
95% CI 0.002
y = 0.0255x + 17.046
y = 0.0246x + 17.08
y = 0.0277x + 16.949
17.5
18.0
18.5
19.0
19.5
0 20 40 60 80 100
Elapsed time (h)
ln [
Cel
ls m
L-1
]
Figure G.21. Specific growth rate calculations for Trial 1 (open circles), Trial 2 (open
squares), and Trial 3 (open triangles).
331
Table G.22. BC13 growth in the presence of 20 mM copper.
Cells mL
-1ln (Cells mL
-1)
Elapsed Time (h) Trial 1 Trial 2 Trial 3 Average STDEV 95% CI Trial 1 Trial 2 Trial 3
0 5.63E+07 5.65E+07 5.76E+07 5.68E+07 7.07E+05 8.00E+05 17.85 17.85 17.87
12 5.33E+07 4.93E+07 4.93E+07 5.06E+07 2.34E+06 2.64E+06 17.79 17.71 17.71
24 5.70E+07 5.63E+07 5.42E+07 5.58E+07 1.43E+06 1.61E+06 17.86 17.85 17.81
36 4.98E+07 5.47E+07 5.56E+07 5.34E+07 3.12E+06 3.53E+06 17.72 17.82 17.83
48 5.41E+07 5.71E+07 5.44E+07 5.52E+07 1.67E+06 1.89E+06 17.81 17.86 17.81
60 6.78E+07 6.82E+07 6.69E+07 6.76E+07 6.77E+05 7.66E+05 18.03 18.04 18.02
72 7.86E+07 8.27E+07 8.83E+07 8.32E+07 4.87E+06 5.51E+06 18.18 18.23 18.30
84 1.13E+08 1.23E+08 1.15E+08 1.17E+08 5.46E+06 6.18E+06 18.54 18.63 18.56
96 1.40E+08 1.54E+08 1.65E+08 1.53E+08 1.27E+07 1.44E+07 18.75 18.85 18.92
108 2.37E+08 2.36E+08 2.28E+08 2.34E+08 5.16E+06 5.84E+06 19.28 19.28 19.24
120 2.39E+08 2.58E+08 2.57E+08 2.51E+08 1.05E+07 1.19E+07 19.29 19.37 19.36
151 2.18E+08 2.39E+08 2.45E+08 2.34E+08 1.39E+07 1.58E+07 19.20 19.29 19.32
170 2.35E+08 2.16E+08 2.01E+08 2.17E+08 1.73E+07 1.95E+07 19.28 19.19 19.12
17.5
18.0
18.5
19.0
0 20 40 60 80 100 120
ln [
Cel
ls m
L-1
]
Specific growth rate (h-1
)
Trial 1 0.021
Trial 2 0.024
Trial 3 0.025
Average 0.023
STDEV 0.002
95% CI 0.002
y = 0.0211x + 16.733
y = 0.0237x + 16.592
y = 0.0248x + 16.518
17.5
18.0
18.5
19.0
0 20 40 60 80 100 120
Elapsed time (h)
ln [
Cel
ls m
L-1
]
Figure G.22. Specific growth rate calculations for Trial 1 (open circles), Trial 2 (open
squares), and Trial 3 (open triangles).

332
Table G.23. BC13 growth in the presence of 50 mM copper.
Cells mL
-1ln (Cells mL
-1)
Elapsed Time (h) Trial 1 Trial 2 Trial 3 Average STDEV 95% CI Trial 1 Trial 2 Trial 3
0 6.16E+07 6.63E+07 6.20E+07 6.33E+07 2.63E+06 2.98E+06 17.94 18.01 17.94
12 5.76E+07 5.19E+07 5.33E+07 5.43E+07 2.97E+06 3.36E+06 17.87 17.77 17.79
24 6.22E+07 6.49E+07 6.13E+07 6.28E+07 1.86E+06 2.11E+06 17.95 17.99 17.93
72 5.03E+07 4.98E+07 5.13E+07 5.05E+07 7.29E+05 8.25E+05 17.73 17.72 17.75
84 5.17E+07 5.21E+07 5.35E+07 5.24E+07 9.00E+05 1.02E+06 17.76 17.77 17.79
96 5.44E+07 4.99E+07 5.42E+07 5.28E+07 2.57E+06 2.90E+06 17.81 17.72 17.81
108 6.15E+07 6.50E+07 6.41E+07 6.35E+07 1.79E+06 2.02E+06 17.94 17.99 17.98
120 8.40E+07 8.26E+07 8.00E+07 8.22E+07 2.06E+06 2.33E+06 18.25 18.23 18.20
144 1.16E+08 1.26E+08 1.25E+08 1.22E+08 5.36E+06 6.06E+06 18.57 18.65 18.64
168 1.47E+08 1.36E+08 1.49E+08 1.44E+08 6.90E+06 7.81E+06 18.80 18.73 18.82 17.5
18.0
18.5
19.0
0 50 100 150 200
ln [
Cel
ls m
L-1
]
Specific growth rate (h-1
)
Trial 1 0.016
Trial 2 0.019
Trial 3 0.018
Average 0.018
STDEV 0.001
95% CI 0.002
y = 0.0164x + 16.218
y = 0.0192x + 15.904
y = 0.0176x + 16.096
17.5
18.0
18.5
19.0
0 50 100 150 200
Elapsed time (h)
ln [
Cel
ls m
L-1
]
Figure G.23. Specific growth rate calculations for Trial 1 (open circles), Trial 2 (open
squares), and Trial 3 (open triangles).

333
Table G.24. BC13 growth in the presence of 100 mM copper.
Cells mL
-1ln (Cells mL
-1)
Elapsed Time (h) Trial 1 Trial 2 Trial 3 Average STDEV 95% CI Trial 1 Trial 2 Trial 3
0 5.25E+07 5.03E+07 5.38E+07 5.22E+07 1.79E+06 2.02E+06 17.78 17.73 17.80
12 5.29E+07 5.04E+07 5.42E+07 5.25E+07 1.91E+06 2.16E+06 17.78 17.74 17.81
24 5.36E+07 5.11E+07 5.22E+07 5.23E+07 1.22E+06 1.38E+06 17.80 17.75 17.77
72 5.80E+07 5.75E+07 5.14E+07 5.56E+07 3.70E+06 4.19E+06 17.88 17.87 17.75
84 6.57E+07 6.20E+07 5.99E+07 6.25E+07 2.97E+06 3.37E+06 18.00 17.94 17.91
96 7.34E+07 7.15E+07 7.29E+07 7.26E+07 9.71E+05 1.10E+06 18.11 18.09 18.10
108 9.07E+07 9.04E+07 8.70E+07 8.93E+07 2.04E+06 2.31E+06 18.32 18.32 18.28
120 1.21E+08 1.17E+08 1.12E+08 1.17E+08 4.46E+06 5.05E+06 18.61 18.58 18.53
144 1.56E+08 1.48E+08 1.53E+08 1.52E+08 3.78E+06 4.28E+06 18.86 18.81 18.84
168 1.48E+08 1.47E+08 1.36E+08 1.44E+08 6.51E+06 7.36E+06 18.81 18.80 18.73 17.5
18.0
18.5
19.0
0 20 40 60 80 100 120 140
ln [
Cel
ls m
L-1
]
Specific growth rate (h-1
)
Trial 1 0.017
Trial 2 0.018
Trial 3 0.017
Average 0.017
STDEV 0.000
95% CI 0.001
y = 0.017x + 16.529
y = 0.0179x + 16.409
y = 0.0171x + 16.458
17.5
18.0
18.5
19.0
0 20 40 60 80 100 120 140
Elapsed time (h)
ln [
Cel
ls m
L-1
]
Figure G.24. Specific growth rate calculations for Trial 1 (open circles), Trial 2 (open
squares), and Trial 3 (open triangles).
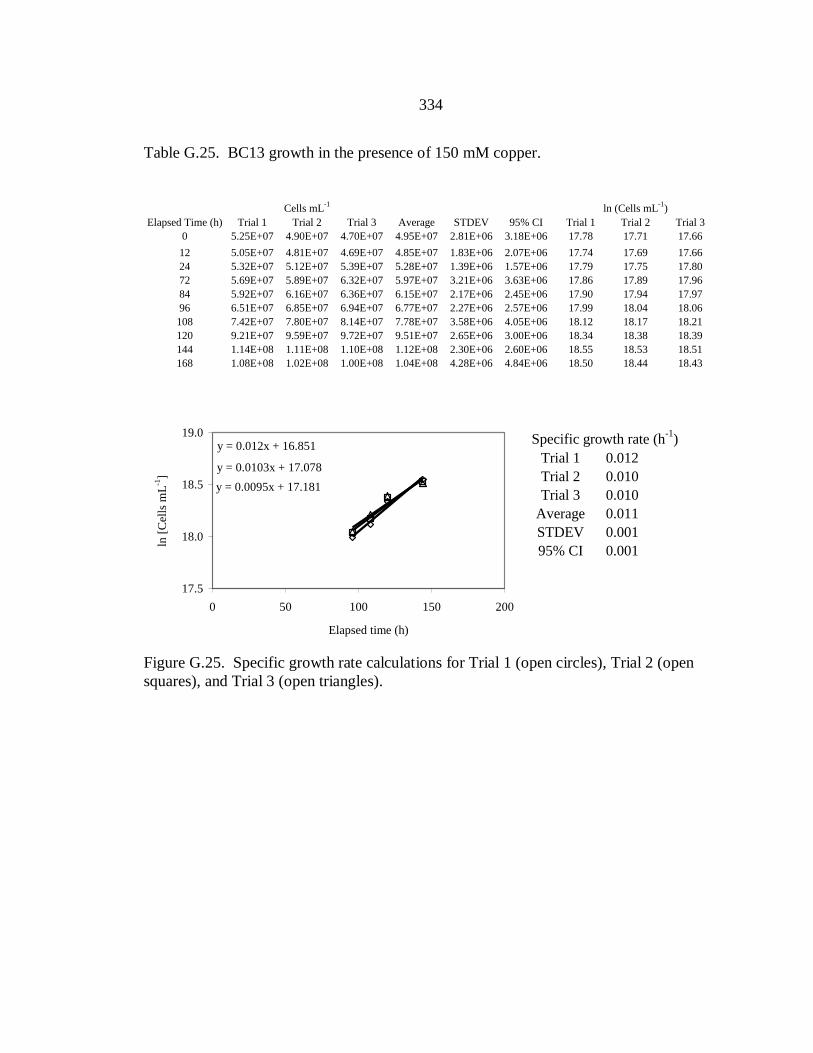
334
Table G.25. BC13 growth in the presence of 150 mM copper.
Cells mL
-1ln (Cells mL
-1)
Elapsed Time (h) Trial 1 Trial 2 Trial 3 Average STDEV 95% CI Trial 1 Trial 2 Trial 3
0 5.25E+07 4.90E+07 4.70E+07 4.95E+07 2.81E+06 3.18E+06 17.78 17.71 17.66
12 5.05E+07 4.81E+07 4.69E+07 4.85E+07 1.83E+06 2.07E+06 17.74 17.69 17.66
24 5.32E+07 5.12E+07 5.39E+07 5.28E+07 1.39E+06 1.57E+06 17.79 17.75 17.80
72 5.69E+07 5.89E+07 6.32E+07 5.97E+07 3.21E+06 3.63E+06 17.86 17.89 17.96
84 5.92E+07 6.16E+07 6.36E+07 6.15E+07 2.17E+06 2.45E+06 17.90 17.94 17.97
96 6.51E+07 6.85E+07 6.94E+07 6.77E+07 2.27E+06 2.57E+06 17.99 18.04 18.06
108 7.42E+07 7.80E+07 8.14E+07 7.78E+07 3.58E+06 4.05E+06 18.12 18.17 18.21
120 9.21E+07 9.59E+07 9.72E+07 9.51E+07 2.65E+06 3.00E+06 18.34 18.38 18.39
144 1.14E+08 1.11E+08 1.10E+08 1.12E+08 2.30E+06 2.60E+06 18.55 18.53 18.51
168 1.08E+08 1.02E+08 1.00E+08 1.04E+08 4.28E+06 4.84E+06 18.50 18.44 18.43 17.5
18.0
18.5
19.0
0 50 100 150 200
ln [
Cel
ls m
L-1
]
Specific growth rate (h-1
)
Trial 1 0.012
Trial 2 0.010
Trial 3 0.010
Average 0.011
STDEV 0.001
95% CI 0.001
y = 0.012x + 16.851
y = 0.0103x + 17.078
y = 0.0095x + 17.181
17.5
18.0
18.5
19.0
0 50 100 150 200
Elapsed time (h)
ln [
Cel
ls m
L-1
]
Figure G.25. Specific growth rate calculations for Trial 1 (open circles), Trial 2 (open
squares), and Trial 3 (open triangles).

335
Table G.26. BC13 growth in the presence of 200 mM copper.
Cells mL
-1ln (Cells mL
-1)
Elapsed Time (h) Trial 1 Trial 2 Trial 3 Average STDEV 95% CI Trial 1 Trial 2 Trial 3
0 4.75E+07 4.54E+07 4.21E+07 4.50E+07 2.72E+06 3.08E+06 17.68 17.63 17.56
12 5.06E+07 5.26E+07 5.34E+07 5.22E+07 1.44E+06 1.63E+06 17.74 17.78 17.79
24 5.19E+07 5.08E+07 5.51E+07 5.26E+07 2.20E+06 2.49E+06 17.76 17.74 17.82
72 5.66E+07 5.37E+07 5.00E+07 5.34E+07 3.28E+06 3.71E+06 17.85 17.80 17.73
84 6.18E+07 5.71E+07 5.67E+07 5.85E+07 2.85E+06 3.22E+06 17.94 17.86 17.85
96 6.52E+07 6.58E+07 6.27E+07 6.46E+07 1.64E+06 1.86E+06 17.99 18.00 17.95
108 7.72E+07 7.93E+07 6.95E+07 7.53E+07 5.15E+06 5.83E+06 18.16 18.19 18.06
120 8.30E+07 8.93E+07 8.07E+07 8.43E+07 4.46E+06 5.04E+06 18.23 18.31 18.21
144 9.08E+07 9.03E+07 8.90E+07 9.01E+07 9.12E+05 1.03E+06 18.32 18.32 18.30
168 1.07E+08 1.13E+08 1.08E+08 1.09E+08 3.42E+06 3.87E+06 18.49 18.54 18.49 17.8
18.0
18.2
18.4
0 20 40 60 80 100 120
ln [
Cel
ls m
L-1
]
Specific growth rate (h-1
)
Trial 1 0.009
Trial 2 0.014
Trial 3 0.009
Average 0.010
STDEV 0.003
95% CI 0.003
y = 0.0092x + 17.144
y = 0.0136x + 16.708
y = 0.0085x + 17.139
17.8
18.0
18.2
18.4
0 20 40 60 80 100 120
Elapsed time (h)
ln [
Cel
ls m
L-1
]
Figure G.26. Specific growth rate calculations for Trial 1 (open circles), Trial 2 (open
squares), and Trial 3 (open triangles).
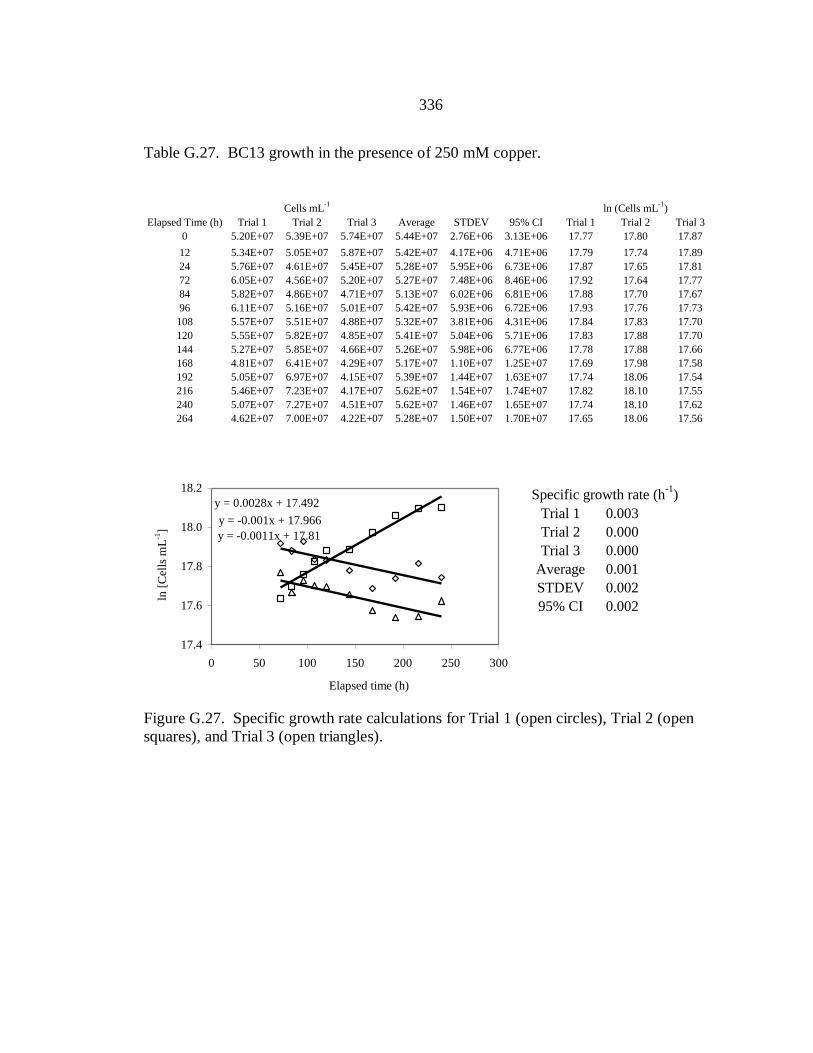
336
Table G.27. BC13 growth in the presence of 250 mM copper.
Cells mL
-1ln (Cells mL
-1)
Elapsed Time (h) Trial 1 Trial 2 Trial 3 Average STDEV 95% CI Trial 1 Trial 2 Trial 3
0 5.20E+07 5.39E+07 5.74E+07 5.44E+07 2.76E+06 3.13E+06 17.77 17.80 17.87
12 5.34E+07 5.05E+07 5.87E+07 5.42E+07 4.17E+06 4.71E+06 17.79 17.74 17.89
24 5.76E+07 4.61E+07 5.45E+07 5.28E+07 5.95E+06 6.73E+06 17.87 17.65 17.81
72 6.05E+07 4.56E+07 5.20E+07 5.27E+07 7.48E+06 8.46E+06 17.92 17.64 17.77
84 5.82E+07 4.86E+07 4.71E+07 5.13E+07 6.02E+06 6.81E+06 17.88 17.70 17.67
96 6.11E+07 5.16E+07 5.01E+07 5.42E+07 5.93E+06 6.72E+06 17.93 17.76 17.73
108 5.57E+07 5.51E+07 4.88E+07 5.32E+07 3.81E+06 4.31E+06 17.84 17.83 17.70
120 5.55E+07 5.82E+07 4.85E+07 5.41E+07 5.04E+06 5.71E+06 17.83 17.88 17.70
144 5.27E+07 5.85E+07 4.66E+07 5.26E+07 5.98E+06 6.77E+06 17.78 17.88 17.66
168 4.81E+07 6.41E+07 4.29E+07 5.17E+07 1.10E+07 1.25E+07 17.69 17.98 17.58
192 5.05E+07 6.97E+07 4.15E+07 5.39E+07 1.44E+07 1.63E+07 17.74 18.06 17.54
216 5.46E+07 7.23E+07 4.17E+07 5.62E+07 1.54E+07 1.74E+07 17.82 18.10 17.55
240 5.07E+07 7.27E+07 4.51E+07 5.62E+07 1.46E+07 1.65E+07 17.74 18.10 17.62
264 4.62E+07 7.00E+07 4.22E+07 5.28E+07 1.50E+07 1.70E+07 17.65 18.06 17.56
17.4
17.6
17.8
18.0
18.2
0 50 100 150 200 250 300
ln [
Cel
ls m
L-1
]
Specific growth rate (h-1
)
Trial 1 0.003
Trial 2 0.000
Trial 3 0.000
Average 0.001
STDEV 0.002
95% CI 0.002
y = -0.001x + 17.966
y = 0.0028x + 17.492
y = -0.0011x + 17.81
17.4
17.6
17.8
18.0
18.2
0 50 100 150 200 250 300
Elapsed time (h)
ln [
Cel
ls m
L-1
]
Figure G.27. Specific growth rate calculations for Trial 1 (open circles), Trial 2 (open
squares), and Trial 3 (open triangles).

337
Toxicity of Heavy Metals when Combined
Lead and Zinc
Table G.28. BC13 growth in the presence of 0.125 x PbMIC + 0.125 x ZnMIC.
Cells mL
-1ln (Cells mL
-1)
Elapsed Time (h) Trial 1 Trial 2 Trial 3 Average STDEV 95% CI Trial 1 Trial 2 Trial 3
0 5.77E+07 6.01E+07 5.63E+07 5.81E+07 1.93E+06 2.18E+06 17.87 17.91 17.85
12 5.65E+07 5.62E+07 5.65E+07 5.64E+07 1.58E+05 1.78E+05 17.85 17.85 17.85
24 4.93E+07 4.97E+07 5.44E+07 5.11E+07 2.85E+06 3.22E+06 17.71 17.72 17.81
36 6.10E+07 6.06E+07 6.13E+07 6.10E+07 3.48E+05 3.94E+05 17.93 17.92 17.93
48 6.50E+07 6.39E+07 6.36E+07 6.42E+07 7.74E+05 8.76E+05 17.99 17.97 17.97
60 7.67E+07 7.44E+07 7.47E+07 7.53E+07 1.26E+06 1.42E+06 18.16 18.13 18.13
72 9.39E+07 8.67E+07 9.09E+07 9.05E+07 3.64E+06 4.12E+06 18.36 18.28 18.33
84 1.47E+08 1.37E+08 1.44E+08 1.43E+08 4.95E+06 5.60E+06 18.81 18.74 18.79
96 1.66E+08 1.50E+08 1.83E+08 1.66E+08 1.63E+07 1.84E+07 18.93 18.83 19.02
108 1.93E+08 1.64E+08 1.86E+08 1.81E+08 1.51E+07 1.71E+07 19.08 18.92 19.04
120 2.18E+08 1.32E+08 1.26E+08 1.59E+08 5.13E+07 5.80E+07 19.20 18.70 18.65
144 2.28E+08 1.47E+08 1.41E+08 1.72E+08 4.88E+07 5.53E+07 19.25 18.81 18.76
Specific growth rate (h-1
)
Trial 1 0.021
Trial 2 0.019
Trial 3 0.023
Average 0.021
STDEV 0.002
95% CI 0.002
y = 0.021x + 16.933
y = 0.0194x + 16.994
y = 0.0231x + 16.784
17.5
18.0
18.5
19.0
19.5
0 20 40 60 80 100 120
Elapsed time (h)
ln [
Cel
ls m
L-1
]
.Figure G.28. Specific growth rate calculations for Trial 1 (open circles), Trial 2 (open
squares), and Trial 3 (open triangles).
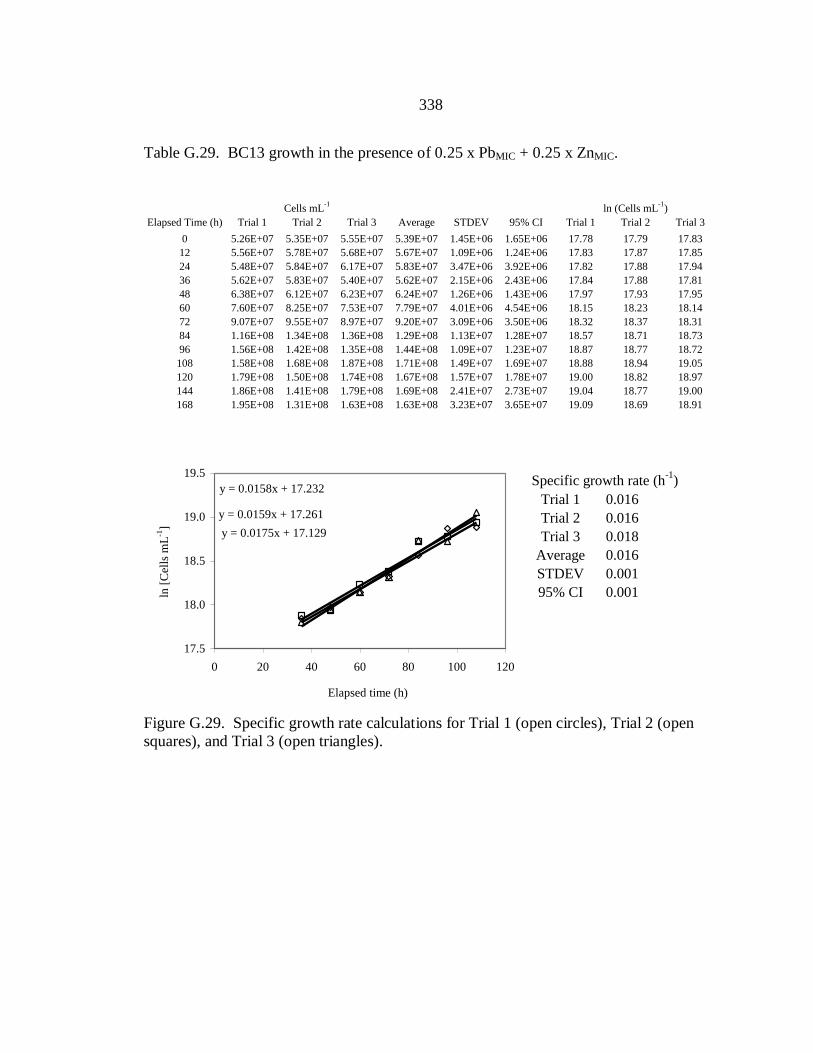
338
Table G.29. BC13 growth in the presence of 0.25 x PbMIC + 0.25 x ZnMIC.
Cells mL
-1ln (Cells mL
-1)
Elapsed Time (h) Trial 1 Trial 2 Trial 3 Average STDEV 95% CI Trial 1 Trial 2 Trial 3
0 5.26E+07 5.35E+07 5.55E+07 5.39E+07 1.45E+06 1.65E+06 17.78 17.79 17.83
12 5.56E+07 5.78E+07 5.68E+07 5.67E+07 1.09E+06 1.24E+06 17.83 17.87 17.85
24 5.48E+07 5.84E+07 6.17E+07 5.83E+07 3.47E+06 3.92E+06 17.82 17.88 17.94
36 5.62E+07 5.83E+07 5.40E+07 5.62E+07 2.15E+06 2.43E+06 17.84 17.88 17.81
48 6.38E+07 6.12E+07 6.23E+07 6.24E+07 1.26E+06 1.43E+06 17.97 17.93 17.95
60 7.60E+07 8.25E+07 7.53E+07 7.79E+07 4.01E+06 4.54E+06 18.15 18.23 18.14
72 9.07E+07 9.55E+07 8.97E+07 9.20E+07 3.09E+06 3.50E+06 18.32 18.37 18.31
84 1.16E+08 1.34E+08 1.36E+08 1.29E+08 1.13E+07 1.28E+07 18.57 18.71 18.73
96 1.56E+08 1.42E+08 1.35E+08 1.44E+08 1.09E+07 1.23E+07 18.87 18.77 18.72
108 1.58E+08 1.68E+08 1.87E+08 1.71E+08 1.49E+07 1.69E+07 18.88 18.94 19.05
120 1.79E+08 1.50E+08 1.74E+08 1.67E+08 1.57E+07 1.78E+07 19.00 18.82 18.97
144 1.86E+08 1.41E+08 1.79E+08 1.69E+08 2.41E+07 2.73E+07 19.04 18.77 19.00
168 1.95E+08 1.31E+08 1.63E+08 1.63E+08 3.23E+07 3.65E+07 19.09 18.69 18.91
Specific growth rate (h-1
)
Trial 1 0.016
Trial 2 0.016
Trial 3 0.018
Average 0.016
STDEV 0.001
95% CI 0.001
y = 0.0158x + 17.232
y = 0.0159x + 17.261
y = 0.0175x + 17.129
17.5
18.0
18.5
19.0
19.5
0 20 40 60 80 100 120
Elapsed time (h)
ln [
Cel
ls m
L-1
]
Figure G.29. Specific growth rate calculations for Trial 1 (open circles), Trial 2 (open
squares), and Trial 3 (open triangles).

339
Table G.30. BC13 growth in the presence of 0.375 x PbMIC + 0.375 x ZnMIC.
Cells mL
-1ln (Cells mL
-1)
Elapsed Time (h) Trial 1 Trial 2 Trial 3 Average STDEV 95% CI Trial 1 Trial 2 Trial 3
0 5.52E+07 5.71E+07 5.49E+07 5.57E+07 1.15E+06 1.31E+06 17.83 17.86 17.82
12 5.79E+07 5.75E+07 5.90E+07 5.81E+07 7.77E+05 8.79E+05 17.87 17.87 17.89
24 5.81E+07 5.94E+07 5.39E+07 5.71E+07 2.85E+06 3.22E+06 17.88 17.90 17.80
36 6.38E+07 6.74E+07 7.15E+07 6.76E+07 3.87E+06 4.38E+06 17.97 18.03 18.09
48 7.05E+07 7.61E+07 7.92E+07 7.53E+07 4.39E+06 4.97E+06 18.07 18.15 18.19
60 8.07E+07 8.81E+07 8.02E+07 8.30E+07 4.44E+06 5.03E+06 18.21 18.29 18.20
72 9.76E+07 1.06E+08 1.01E+08 1.02E+08 4.32E+06 4.88E+06 18.40 18.48 18.43
84 1.15E+08 1.09E+08 1.11E+08 1.12E+08 3.26E+06 3.69E+06 18.56 18.51 18.52
96 1.28E+08 1.36E+08 1.28E+08 1.31E+08 4.39E+06 4.96E+06 18.67 18.73 18.67
108 1.37E+08 1.30E+08 1.37E+08 1.35E+08 4.16E+06 4.70E+06 18.74 18.68 18.73
120 1.38E+08 1.48E+08 1.46E+08 1.44E+08 4.97E+06 5.62E+06 18.75 18.81 18.80
144 1.34E+08 1.24E+08 1.36E+08 1.31E+08 6.33E+06 7.17E+06 18.72 18.64 18.73
168 1.36E+08 1.29E+08 1.40E+08 1.35E+08 5.65E+06 6.39E+06 18.73 18.68 18.76
17.5
18.0
18.5
19.0
0 20 40 60 80 100 120
ln [
Cel
ls m
L-1
]
Specific growth rate (h-1
)
Trial 1 0.012
Trial 2 0.011
Trial 3 0.011
Average 0.011
STDEV 0.000
95% CI 0.000
y = 0.0116x + 17.557
y = 0.0113x + 17.622
y = 0.0111x + 17.607
17.5
18.0
18.5
19.0
0 20 40 60 80 100 120
Elapsed time (h)
ln [
Cel
ls m
L-1
]
Figure G.30. Specific growth rate calculations for Trial 1 (open circles), Trial 2 (open
squares), and Trial 3 (open triangles).

340
Table G.31. BC13 growth in the presence of 0.50 x PbMIC + 0.50 x ZnMIC.
Cells mL
-1ln (Cells mL
-1)
Elapsed Time (h) Trial 1 Trial 2 Trial 3 Average STDEV 95% CI Trial 1 Trial 2 Trial 3
0 4.94E+07 4.84E+07 4.77E+07 4.85E+07 8.54E+05 9.66E+05 17.72 17.69 17.68
12 5.13E+07 5.00E+07 5.12E+07 5.09E+07 7.20E+05 8.15E+05 17.75 17.73 17.75
24 5.29E+07 5.22E+07 5.37E+07 5.29E+07 7.33E+05 8.30E+05 17.78 17.77 17.80
36 5.38E+07 5.45E+07 5.27E+07 5.37E+07 8.97E+05 1.01E+06 17.80 17.81 17.78
48 5.17E+07 5.27E+07 5.26E+07 5.23E+07 5.82E+05 6.59E+05 17.76 17.78 17.78
60 5.25E+07 5.24E+07 5.19E+07 5.23E+07 3.51E+05 3.98E+05 17.78 17.77 17.76
72 5.44E+07 5.47E+07 5.32E+07 5.41E+07 7.91E+05 8.95E+05 17.81 17.82 17.79
84 5.81E+07 5.69E+07 5.78E+07 5.76E+07 5.76E+05 6.52E+05 17.88 17.86 17.87
96 5.99E+07 6.06E+07 5.91E+07 5.99E+07 7.52E+05 8.51E+05 17.91 17.92 17.90
108 6.16E+07 6.23E+07 6.22E+07 6.21E+07 3.78E+05 4.28E+05 17.94 17.95 17.95
120 6.84E+07 6.63E+07 6.80E+07 6.76E+07 1.13E+06 1.27E+06 18.04 18.01 18.04
144 6.94E+07 6.96E+07 6.86E+07 6.92E+07 5.06E+05 5.73E+05 18.06 18.06 18.04
168 7.04E+07 7.04E+07 6.84E+07 6.97E+07 1.16E+06 1.31E+06 18.07 18.07 18.04
17.7
17.8
17.9
18.0
18.1
0 20 40 60 80 100 120 140
ln [
Cel
ls m
L-1
]
Specific growth rate (h-1
)
Trial 1 0.004
Trial 2 0.004
Trial 3 0.004
Average 0.0041
STDEV 0.0003
95% CI 0.0003
y = 0.0041x + 17.522
y = 0.0039x + 17.538
y = 0.0044x + 17.488
17.7
17.8
17.9
18.0
18.1
0 20 40 60 80 100 120 140
Elapsed time (h)
ln [
Cel
ls m
L-1
]
Figure G.31. Specific growth rate calculations for Trial 1 (open circles), Trial 2 (open
squares), and Trial 3 (open triangles).
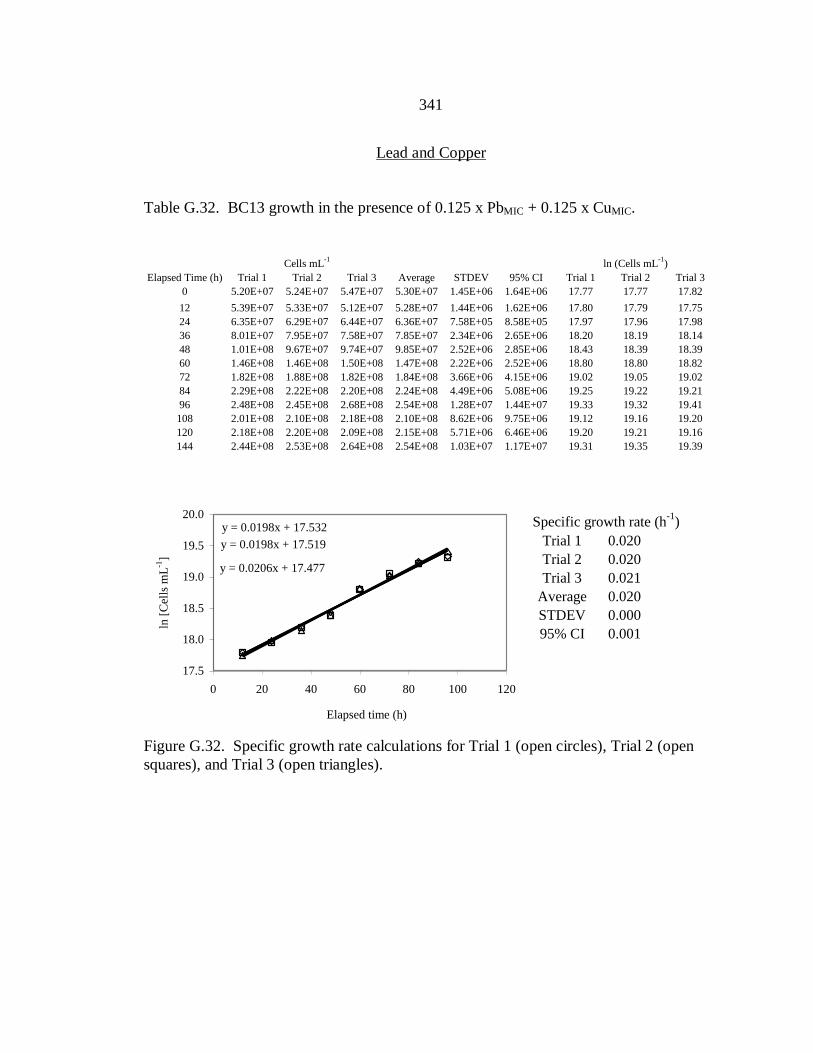
341
Lead and Copper
Table G.32. BC13 growth in the presence of 0.125 x PbMIC + 0.125 x CuMIC.
Cells mL
-1ln (Cells mL
-1)
Elapsed Time (h) Trial 1 Trial 2 Trial 3 Average STDEV 95% CI Trial 1 Trial 2 Trial 3
0 5.20E+07 5.24E+07 5.47E+07 5.30E+07 1.45E+06 1.64E+06 17.77 17.77 17.82
12 5.39E+07 5.33E+07 5.12E+07 5.28E+07 1.44E+06 1.62E+06 17.80 17.79 17.75
24 6.35E+07 6.29E+07 6.44E+07 6.36E+07 7.58E+05 8.58E+05 17.97 17.96 17.98
36 8.01E+07 7.95E+07 7.58E+07 7.85E+07 2.34E+06 2.65E+06 18.20 18.19 18.14
48 1.01E+08 9.67E+07 9.74E+07 9.85E+07 2.52E+06 2.85E+06 18.43 18.39 18.39
60 1.46E+08 1.46E+08 1.50E+08 1.47E+08 2.22E+06 2.52E+06 18.80 18.80 18.82
72 1.82E+08 1.88E+08 1.82E+08 1.84E+08 3.66E+06 4.15E+06 19.02 19.05 19.02
84 2.29E+08 2.22E+08 2.20E+08 2.24E+08 4.49E+06 5.08E+06 19.25 19.22 19.21
96 2.48E+08 2.45E+08 2.68E+08 2.54E+08 1.28E+07 1.44E+07 19.33 19.32 19.41
108 2.01E+08 2.10E+08 2.18E+08 2.10E+08 8.62E+06 9.75E+06 19.12 19.16 19.20
120 2.18E+08 2.20E+08 2.09E+08 2.15E+08 5.71E+06 6.46E+06 19.20 19.21 19.16
144 2.44E+08 2.53E+08 2.64E+08 2.54E+08 1.03E+07 1.17E+07 19.31 19.35 19.39
Specific growth rate (h-1
)
Trial 1 0.020
Trial 2 0.020
Trial 3 0.021
Average 0.020
STDEV 0.000
95% CI 0.001
y = 0.0198x + 17.532
y = 0.0198x + 17.519
y = 0.0206x + 17.477
17.5
18.0
18.5
19.0
19.5
20.0
0 20 40 60 80 100 120
Elapsed time (h)
ln [
Cel
ls m
L-1
]
Figure G.32. Specific growth rate calculations for Trial 1 (open circles), Trial 2 (open
squares), and Trial 3 (open triangles).
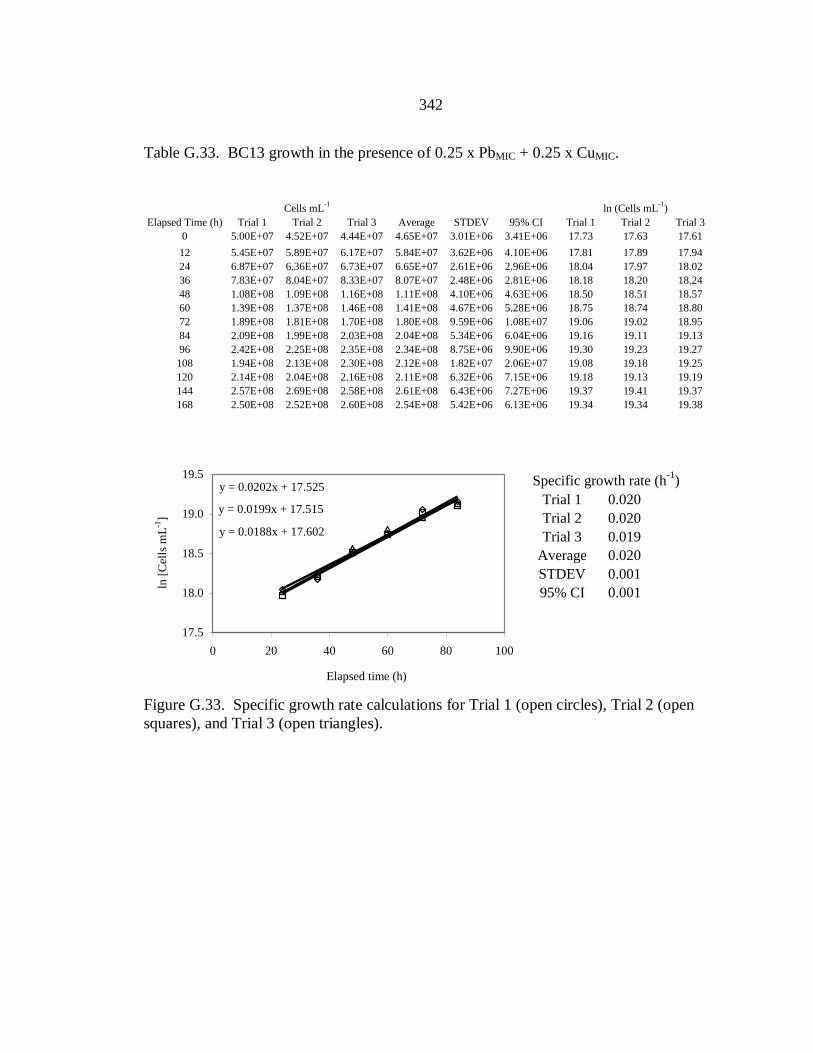
342
Table G.33. BC13 growth in the presence of 0.25 x PbMIC + 0.25 x CuMIC.
Cells mL
-1ln (Cells mL
-1)
Elapsed Time (h) Trial 1 Trial 2 Trial 3 Average STDEV 95% CI Trial 1 Trial 2 Trial 3
0 5.00E+07 4.52E+07 4.44E+07 4.65E+07 3.01E+06 3.41E+06 17.73 17.63 17.61
12 5.45E+07 5.89E+07 6.17E+07 5.84E+07 3.62E+06 4.10E+06 17.81 17.89 17.94
24 6.87E+07 6.36E+07 6.73E+07 6.65E+07 2.61E+06 2.96E+06 18.04 17.97 18.02
36 7.83E+07 8.04E+07 8.33E+07 8.07E+07 2.48E+06 2.81E+06 18.18 18.20 18.24
48 1.08E+08 1.09E+08 1.16E+08 1.11E+08 4.10E+06 4.63E+06 18.50 18.51 18.57
60 1.39E+08 1.37E+08 1.46E+08 1.41E+08 4.67E+06 5.28E+06 18.75 18.74 18.80
72 1.89E+08 1.81E+08 1.70E+08 1.80E+08 9.59E+06 1.08E+07 19.06 19.02 18.95
84 2.09E+08 1.99E+08 2.03E+08 2.04E+08 5.34E+06 6.04E+06 19.16 19.11 19.13
96 2.42E+08 2.25E+08 2.35E+08 2.34E+08 8.75E+06 9.90E+06 19.30 19.23 19.27
108 1.94E+08 2.13E+08 2.30E+08 2.12E+08 1.82E+07 2.06E+07 19.08 19.18 19.25
120 2.14E+08 2.04E+08 2.16E+08 2.11E+08 6.32E+06 7.15E+06 19.18 19.13 19.19
144 2.57E+08 2.69E+08 2.58E+08 2.61E+08 6.43E+06 7.27E+06 19.37 19.41 19.37
168 2.50E+08 2.52E+08 2.60E+08 2.54E+08 5.42E+06 6.13E+06 19.34 19.34 19.38
17.5
18.0
18.5
19.0
19.5
0 20 40 60 80 100
ln [
Cel
ls m
L-1
]
Specific growth rate (h-1
)
Trial 1 0.020
Trial 2 0.020
Trial 3 0.019
Average 0.020
STDEV 0.001
95% CI 0.001
y = 0.0202x + 17.525
y = 0.0199x + 17.515
y = 0.0188x + 17.602
17.5
18.0
18.5
19.0
19.5
0 20 40 60 80 100
Elapsed time (h)
ln [
Cel
ls m
L-1
]
Figure G.33. Specific growth rate calculations for Trial 1 (open circles), Trial 2 (open
squares), and Trial 3 (open triangles).
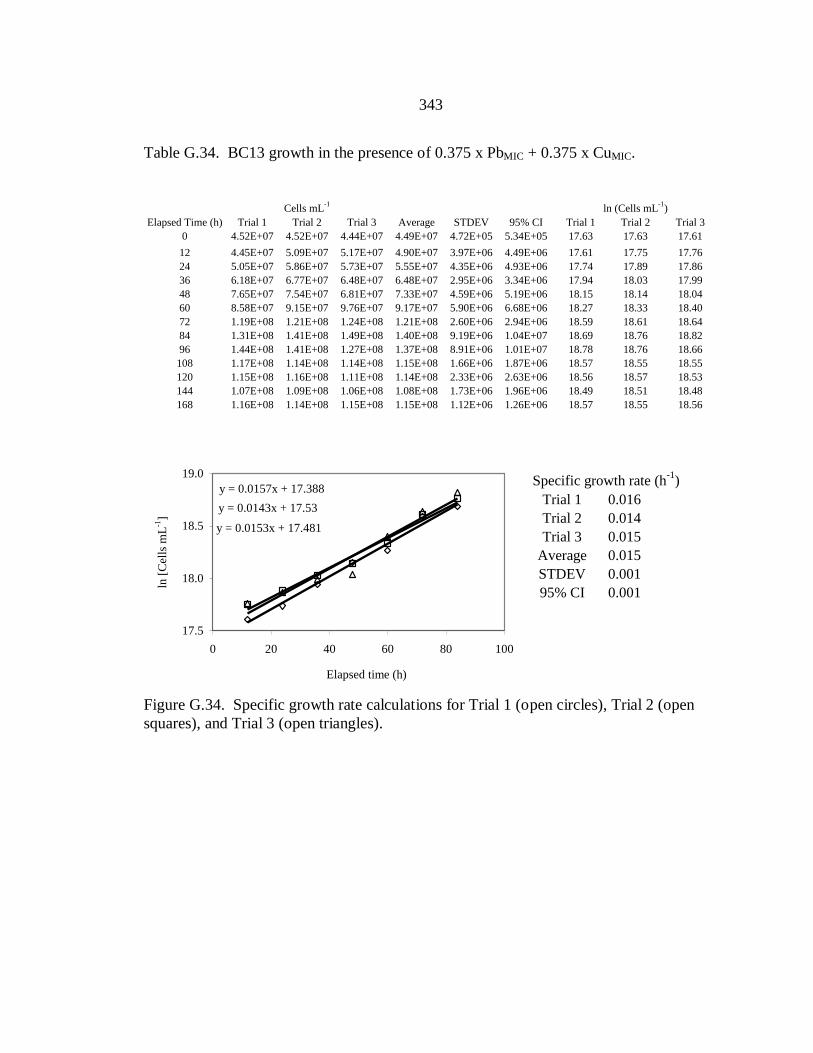
343
Table G.34. BC13 growth in the presence of 0.375 x PbMIC + 0.375 x CuMIC.
Cells mL
-1ln (Cells mL
-1)
Elapsed Time (h) Trial 1 Trial 2 Trial 3 Average STDEV 95% CI Trial 1 Trial 2 Trial 3
0 4.52E+07 4.52E+07 4.44E+07 4.49E+07 4.72E+05 5.34E+05 17.63 17.63 17.61
12 4.45E+07 5.09E+07 5.17E+07 4.90E+07 3.97E+06 4.49E+06 17.61 17.75 17.76
24 5.05E+07 5.86E+07 5.73E+07 5.55E+07 4.35E+06 4.93E+06 17.74 17.89 17.86
36 6.18E+07 6.77E+07 6.48E+07 6.48E+07 2.95E+06 3.34E+06 17.94 18.03 17.99
48 7.65E+07 7.54E+07 6.81E+07 7.33E+07 4.59E+06 5.19E+06 18.15 18.14 18.04
60 8.58E+07 9.15E+07 9.76E+07 9.17E+07 5.90E+06 6.68E+06 18.27 18.33 18.40
72 1.19E+08 1.21E+08 1.24E+08 1.21E+08 2.60E+06 2.94E+06 18.59 18.61 18.64
84 1.31E+08 1.41E+08 1.49E+08 1.40E+08 9.19E+06 1.04E+07 18.69 18.76 18.82
96 1.44E+08 1.41E+08 1.27E+08 1.37E+08 8.91E+06 1.01E+07 18.78 18.76 18.66
108 1.17E+08 1.14E+08 1.14E+08 1.15E+08 1.66E+06 1.87E+06 18.57 18.55 18.55
120 1.15E+08 1.16E+08 1.11E+08 1.14E+08 2.33E+06 2.63E+06 18.56 18.57 18.53
144 1.07E+08 1.09E+08 1.06E+08 1.08E+08 1.73E+06 1.96E+06 18.49 18.51 18.48
168 1.16E+08 1.14E+08 1.15E+08 1.15E+08 1.12E+06 1.26E+06 18.57 18.55 18.56
17.5
18.0
18.5
19.0
0 20 40 60 80 100
ln [
Cel
ls m
L-1
]
Specific growth rate (h-1
)
Trial 1 0.016
Trial 2 0.014
Trial 3 0.015
Average 0.015
STDEV 0.001
95% CI 0.001
y = 0.0157x + 17.388
y = 0.0143x + 17.53
y = 0.0153x + 17.481
17.5
18.0
18.5
19.0
0 20 40 60 80 100
Elapsed time (h)
ln [
Cel
ls m
L-1
]
Figure G.34. Specific growth rate calculations for Trial 1 (open circles), Trial 2 (open
squares), and Trial 3 (open triangles).

344
Table G.35. BC13 growth in the presence of 0.50 x PbMIC + 0.50 x CuMIC.
Cells mL
-1ln (Cells mL
-1)
Elapsed Time (h) Trial 1 Trial 2 Trial 3 Average STDEV 95% CI Trial 1 Trial 2 Trial 3
0 5.51E+07 6.01E+07 6.58E+07 6.03E+07 5.34E+06 6.05E+06 17.82 17.91 18.00
12 5.44E+07 5.16E+07 4.83E+07 5.14E+07 3.04E+06 3.44E+06 17.81 17.76 17.69
24 5.59E+07 5.18E+07 4.91E+07 5.23E+07 3.40E+06 3.85E+06 17.84 17.76 17.71
36 5.58E+07 5.13E+07 5.60E+07 5.44E+07 2.65E+06 3.00E+06 17.84 17.75 17.84
48 6.84E+07 6.81E+07 7.49E+07 7.05E+07 3.83E+06 4.34E+06 18.04 18.04 18.13
60 8.21E+07 8.06E+07 7.52E+07 7.93E+07 3.67E+06 4.15E+06 18.22 18.20 18.14
72 9.06E+07 8.63E+07 8.92E+07 8.87E+07 2.19E+06 2.48E+06 18.32 18.27 18.31
84 1.10E+08 1.03E+08 9.71E+07 1.03E+08 6.24E+06 7.06E+06 18.51 18.45 18.39
96 1.39E+08 1.29E+08 1.20E+08 1.29E+08 9.32E+06 1.05E+07 18.75 18.68 18.60
108 1.25E+08 1.15E+08 1.38E+08 1.26E+08 1.18E+07 1.33E+07 18.64 18.56 18.74
120 1.61E+08 1.49E+08 1.53E+08 1.54E+08 5.75E+06 6.51E+06 18.90 18.82 18.85
144 1.59E+08 1.60E+08 1.56E+08 1.58E+08 1.79E+06 2.02E+06 18.89 18.89 18.87
168 1.47E+08 1.45E+08 1.51E+08 1.48E+08 2.66E+06 3.01E+06 18.81 18.79 18.83
17.5
18.0
18.5
19.0
0 20 40 60 80 100 120 140
ln [
Cel
ls m
L-1
]
Specific growth rate (h-1
)
Trial 1 0.012
Trial 2 0.012
Trial 3 0.012
Average 0.012
STDEV 0.000
95% CI 0.000
y = 0.0121x + 17.461
y = 0.0116x + 17.444
y = 0.0115x + 17.479
17.5
18.0
18.5
19.0
0 20 40 60 80 100 120 140
Elapsed time (h)
ln [
Cel
ls m
L-1
]
Figure G.35. Specific growth rate calculations for Trial 1 (open circles), Trial 2 (open
squares), and Trial 3 (open triangles).

345
Zinc and Copper
Table G.36. BC13 growth in the presence of 0.125 x ZnMIC + 0.125 x CuMIC.
Cells mL
-1ln (Cells mL
-1)
Elapsed Time (h) Trial 1 Trial 2 Trial 3 Average STDEV 95% CI Trial 1 Trial 2 Trial 3
0 5.62E+07 5.10E+07 4.64E+07 5.12E+07 4.86E+06 5.50E+06 17.84 17.75 17.65
12 5.33E+07 5.65E+07 5.88E+07 5.62E+07 2.77E+06 3.13E+06 17.79 17.85 17.89
24 5.37E+07 5.60E+07 5.34E+07 5.43E+07 1.41E+06 1.59E+06 17.80 17.84 17.79
36 5.43E+07 5.21E+07 5.31E+07 5.32E+07 1.10E+06 1.24E+06 17.81 17.77 17.79
48 5.52E+07 5.78E+07 5.95E+07 5.75E+07 2.20E+06 2.49E+06 17.83 17.87 17.90
60 7.58E+07 6.93E+07 7.41E+07 7.31E+07 3.37E+06 3.81E+06 18.14 18.05 18.12
72 1.01E+08 9.94E+07 9.57E+07 9.88E+07 2.87E+06 3.25E+06 18.43 18.41 18.38
84 1.26E+08 1.23E+08 1.22E+08 1.24E+08 1.95E+06 2.21E+06 18.65 18.63 18.62
96 1.67E+08 1.59E+08 1.71E+08 1.66E+08 5.99E+06 6.78E+06 18.94 18.89 18.96
108 1.96E+08 1.81E+08 2.35E+08 2.04E+08 2.80E+07 3.17E+07 19.09 19.02 19.28
120 2.33E+08 2.31E+08 2.83E+08 2.49E+08 2.94E+07 3.33E+07 19.27 19.26 19.46
144 2.18E+08 2.39E+08 3.00E+08 2.52E+08 4.26E+07 4.82E+07 19.20 19.29 19.52
Specific growth rate (h-1
)
Trial 1 0.020
Trial 2 0.020
Trial 3 0.023
Average 0.021
STDEV 0.002
95% CI 0.002
y = 0.02x + 16.942
y = 0.0195x + 16.951
y = 0.0225x + 16.782
17.5
18.0
18.5
19.0
19.5
20.0
0 20 40 60 80 100 120 140
Elapsed time (h)
ln [
Cel
ls m
L-1
]
Figure G.36. Specific growth rate calculations for Trial 1 (open circles), Trial 2 (open
squares), and Trial 3 (open triangles).
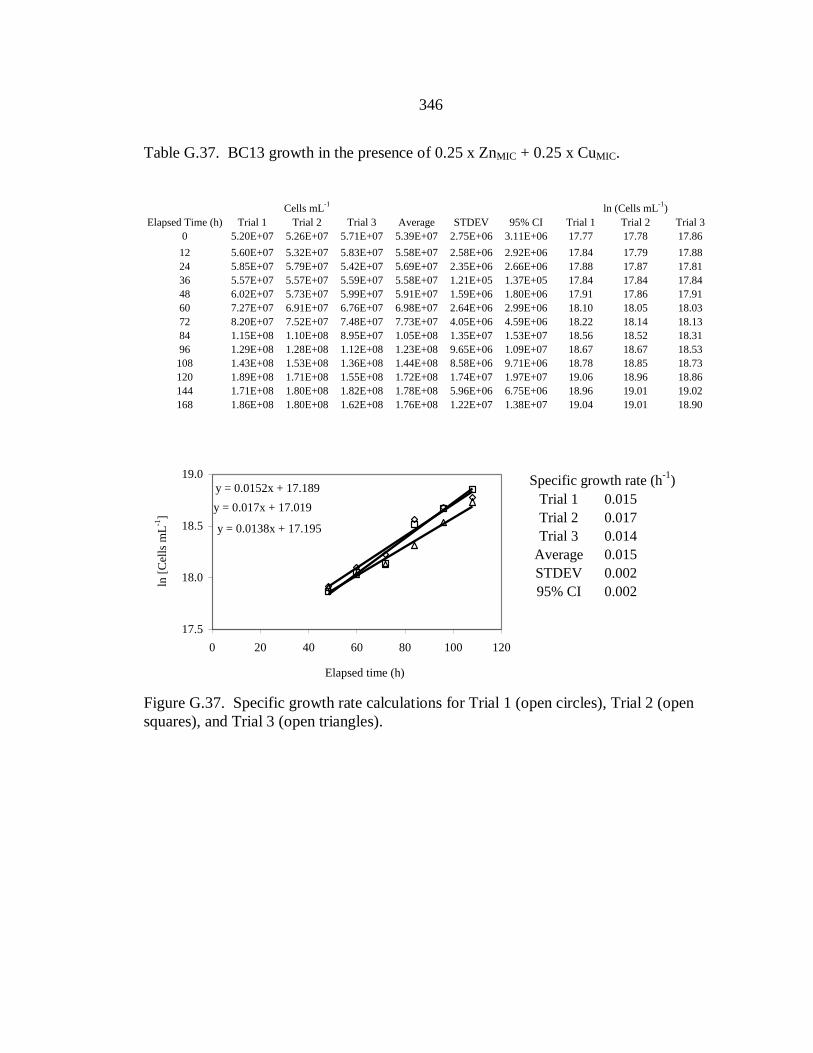
346
Table G.37. BC13 growth in the presence of 0.25 x ZnMIC + 0.25 x CuMIC.
Cells mL
-1ln (Cells mL
-1)
Elapsed Time (h) Trial 1 Trial 2 Trial 3 Average STDEV 95% CI Trial 1 Trial 2 Trial 3
0 5.20E+07 5.26E+07 5.71E+07 5.39E+07 2.75E+06 3.11E+06 17.77 17.78 17.86
12 5.60E+07 5.32E+07 5.83E+07 5.58E+07 2.58E+06 2.92E+06 17.84 17.79 17.88
24 5.85E+07 5.79E+07 5.42E+07 5.69E+07 2.35E+06 2.66E+06 17.88 17.87 17.81
36 5.57E+07 5.57E+07 5.59E+07 5.58E+07 1.21E+05 1.37E+05 17.84 17.84 17.84
48 6.02E+07 5.73E+07 5.99E+07 5.91E+07 1.59E+06 1.80E+06 17.91 17.86 17.91
60 7.27E+07 6.91E+07 6.76E+07 6.98E+07 2.64E+06 2.99E+06 18.10 18.05 18.03
72 8.20E+07 7.52E+07 7.48E+07 7.73E+07 4.05E+06 4.59E+06 18.22 18.14 18.13
84 1.15E+08 1.10E+08 8.95E+07 1.05E+08 1.35E+07 1.53E+07 18.56 18.52 18.31
96 1.29E+08 1.28E+08 1.12E+08 1.23E+08 9.65E+06 1.09E+07 18.67 18.67 18.53
108 1.43E+08 1.53E+08 1.36E+08 1.44E+08 8.58E+06 9.71E+06 18.78 18.85 18.73
120 1.89E+08 1.71E+08 1.55E+08 1.72E+08 1.74E+07 1.97E+07 19.06 18.96 18.86
144 1.71E+08 1.80E+08 1.82E+08 1.78E+08 5.96E+06 6.75E+06 18.96 19.01 19.02
168 1.86E+08 1.80E+08 1.62E+08 1.76E+08 1.22E+07 1.38E+07 19.04 19.01 18.90
17.5
18.0
18.5
19.0
0 20 40 60 80 100 120
ln [
Cel
ls m
L-1
]
Specific growth rate (h-1
)
Trial 1 0.015
Trial 2 0.017
Trial 3 0.014
Average 0.015
STDEV 0.002
95% CI 0.002
y = 0.0152x + 17.189
y = 0.017x + 17.019
y = 0.0138x + 17.195
17.5
18.0
18.5
19.0
0 20 40 60 80 100 120
Elapsed time (h)
ln [
Cel
ls m
L-1
]
Figure G.37. Specific growth rate calculations for Trial 1 (open circles), Trial 2 (open
squares), and Trial 3 (open triangles).

347
Table G.38. BC13 growth in the presence of 0.375 x ZnMIC + 0.375 x CuMIC.
Cells mL
-1ln (Cells mL
-1)
Elapsed Time (h) Trial 1 Trial 2 Trial 3 Average STDEV 95% CI Trial 1 Trial 2 Trial 3
0 4.69E+07 4.78E+07 4.44E+07 4.63E+07 1.77E+06 2.00E+06 17.66 17.68 17.61
12 4.66E+07 4.44E+07 4.16E+07 4.42E+07 2.53E+06 2.87E+06 17.66 17.61 17.54
24 5.18E+07 5.71E+07 5.58E+07 5.49E+07 2.76E+06 3.13E+06 17.76 17.86 17.84
36 6.39E+07 5.87E+07 6.39E+07 6.22E+07 3.00E+06 3.40E+06 17.97 17.89 17.97
48 7.53E+07 8.01E+07 7.83E+07 7.79E+07 2.41E+06 2.73E+06 18.14 18.20 18.18
60 8.89E+07 8.39E+07 8.20E+07 8.49E+07 3.56E+06 4.03E+06 18.30 18.25 18.22
72 9.98E+07 1.04E+08 1.11E+08 1.05E+08 5.46E+06 6.18E+06 18.42 18.46 18.52
84 1.24E+08 1.29E+08 1.25E+08 1.26E+08 2.23E+06 2.52E+06 18.64 18.67 18.65
96 1.58E+08 1.60E+08 1.60E+08 1.59E+08 1.46E+06 1.66E+06 18.88 18.89 18.89
108 1.27E+08 1.29E+08 1.32E+08 1.29E+08 2.55E+06 2.89E+06 18.66 18.68 18.70
120 1.23E+08 1.26E+08 1.14E+08 1.21E+08 6.18E+06 6.99E+06 18.63 18.66 18.56
144 1.13E+08 1.17E+08 1.24E+08 1.18E+08 5.52E+06 6.25E+06 18.54 18.58 18.63
168 1.24E+08 1.31E+08 1.19E+08 1.25E+08 5.83E+06 6.60E+06 18.63 18.69 18.59
17.0
17.5
18.0
18.5
19.0
0 20 40 60 80 100 120
ln [
Cel
ls m
L-1
]
Specific growth rate (h-1
)
Trial 1 0.014
Trial 2 0.015
Trial 3 0.015
Average 0.015
STDEV 0.000
95% CI 0.000
y = 0.0143x + 17.449
y = 0.0147x + 17.435
y = 0.015x + 17.413
17.0
17.5
18.0
18.5
19.0
0 20 40 60 80 100 120
Elapsed time (h)
ln [
Cel
ls m
L-1
]
Figure G.38. Specific growth rate calculations for Trial 1 (open circles), Trial 2 (open
squares), and Trial 3 (open triangles).

348
Table G.39. BC13 growth in the presence of 0.50 x ZnMIC + 0.50 x CuMIC.
Cells mL
-1ln (Cells mL
-1)
Elapsed Time (h) Trial 1 Trial 2 Trial 3 Average STDEV 95% CI Trial 1 Trial 2 Trial 3
0 5.42E+07 5.78E+07 5.80E+07 5.67E+07 2.11E+06 2.39E+06 17.81 17.87 17.88
12 5.34E+07 5.00E+07 4.97E+07 5.10E+07 2.08E+06 2.35E+06 17.79 17.73 17.72
24 5.89E+07 5.50E+07 5.48E+07 5.62E+07 2.32E+06 2.63E+06 17.89 17.82 17.82
36 6.08E+07 6.38E+07 6.32E+07 6.26E+07 1.58E+06 1.79E+06 17.92 17.97 17.96
48 6.61E+07 6.58E+07 6.21E+07 6.47E+07 2.22E+06 2.51E+06 18.01 18.00 17.94
60 7.50E+07 7.55E+07 6.83E+07 7.29E+07 3.99E+06 4.52E+06 18.13 18.14 18.04
72 7.95E+07 8.03E+07 7.86E+07 7.95E+07 8.09E+05 9.16E+05 18.19 18.20 18.18
84 8.52E+07 9.01E+07 8.39E+07 8.64E+07 3.25E+06 3.68E+06 18.26 18.32 18.25
96 9.31E+07 8.71E+07 8.80E+07 8.94E+07 3.26E+06 3.69E+06 18.35 18.28 18.29
108 1.06E+08 9.34E+07 9.96E+07 9.95E+07 6.09E+06 6.89E+06 18.48 18.35 18.42
120 1.45E+08 1.02E+08 9.92E+07 1.16E+08 2.58E+07 2.92E+07 18.79 18.44 18.41
144 1.51E+08 1.20E+08 1.07E+08 1.26E+08 2.26E+07 2.56E+07 18.83 18.61 18.49
168 1.55E+08 1.29E+08 1.17E+08 1.34E+08 1.92E+07 2.18E+07 18.86 18.68 18.58
17.5
18.0
18.5
19.0
0 20 40 60 80 100 120
ln [
Cel
ls m
L-1
]
Specific growth rate (h-1
)
Trial 1 0.007
Trial 2 0.007
Trial 3 0.007
Average 0.0068
STDEV 0.0002
95% CI 0.0002
y = 0.0069x + 17.7
y = 0.0066x + 17.693
y = 0.007x + 17.651
17.5
18.0
18.5
19.0
0 20 40 60 80 100 120
Elapsed time (h)
ln [
Cel
ls m
L-1
]
Figure G.39. Specific growth rate calculations for Trial 1 (open circles), Trial 2 (open
squares), and Trial 3 (open triangles).
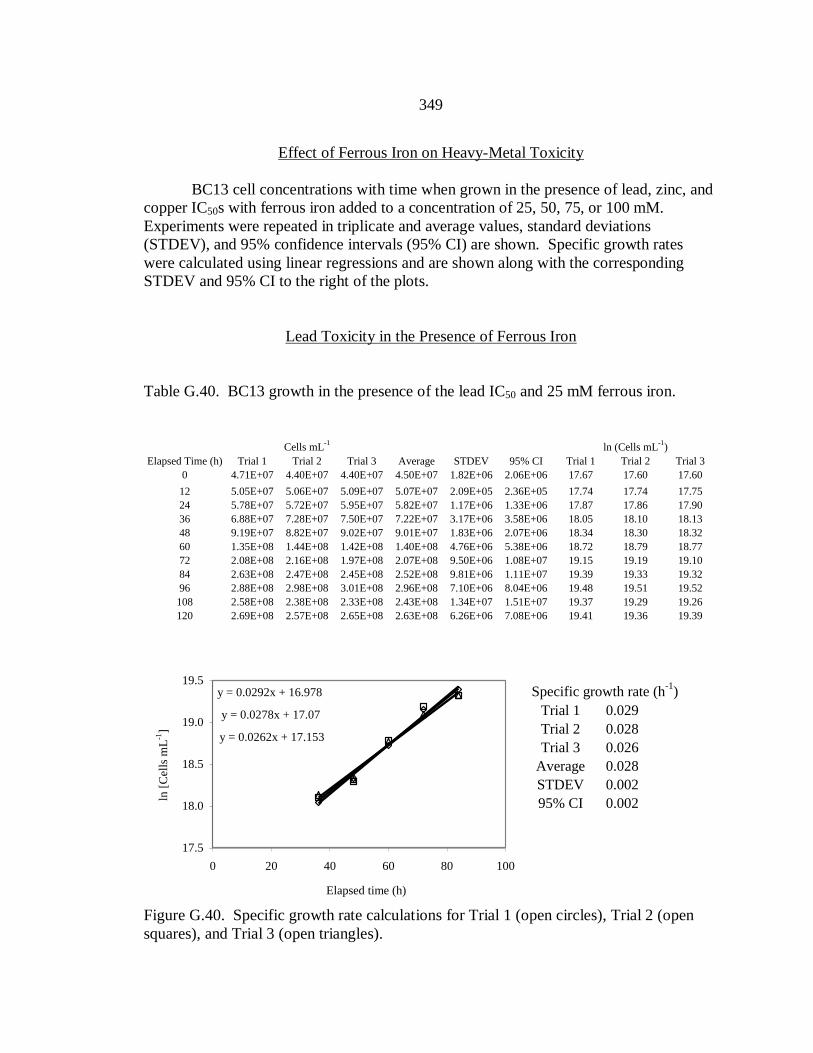
349
Effect of Ferrous Iron on Heavy-Metal Toxicity
BC13 cell concentrations with time when grown in the presence of lead, zinc, and
copper IC50s with ferrous iron added to a concentration of 25, 50, 75, or 100 mM.
Experiments were repeated in triplicate and average values, standard deviations
(STDEV), and 95% confidence intervals (95% CI) are shown. Specific growth rates
were calculated using linear regressions and are shown along with the corresponding
STDEV and 95% CI to the right of the plots.
Lead Toxicity in the Presence of Ferrous Iron
Table G.40. BC13 growth in the presence of the lead IC50 and 25 mM ferrous iron.
Cells mL
-1ln (Cells mL
-1)
Elapsed Time (h) Trial 1 Trial 2 Trial 3 Average STDEV 95% CI Trial 1 Trial 2 Trial 3
0 4.71E+07 4.40E+07 4.40E+07 4.50E+07 1.82E+06 2.06E+06 17.67 17.60 17.60
12 5.05E+07 5.06E+07 5.09E+07 5.07E+07 2.09E+05 2.36E+05 17.74 17.74 17.75
24 5.78E+07 5.72E+07 5.95E+07 5.82E+07 1.17E+06 1.33E+06 17.87 17.86 17.90
36 6.88E+07 7.28E+07 7.50E+07 7.22E+07 3.17E+06 3.58E+06 18.05 18.10 18.13
48 9.19E+07 8.82E+07 9.02E+07 9.01E+07 1.83E+06 2.07E+06 18.34 18.30 18.32
60 1.35E+08 1.44E+08 1.42E+08 1.40E+08 4.76E+06 5.38E+06 18.72 18.79 18.77
72 2.08E+08 2.16E+08 1.97E+08 2.07E+08 9.50E+06 1.08E+07 19.15 19.19 19.10
84 2.63E+08 2.47E+08 2.45E+08 2.52E+08 9.81E+06 1.11E+07 19.39 19.33 19.32
96 2.88E+08 2.98E+08 3.01E+08 2.96E+08 7.10E+06 8.04E+06 19.48 19.51 19.52
108 2.58E+08 2.38E+08 2.33E+08 2.43E+08 1.34E+07 1.51E+07 19.37 19.29 19.26
120 2.69E+08 2.57E+08 2.65E+08 2.63E+08 6.26E+06 7.08E+06 19.41 19.36 19.39
Specific growth rate (h-1
)
Trial 1 0.029
Trial 2 0.028
Trial 3 0.026
Average 0.028
STDEV 0.002
95% CI 0.002
y = 0.0292x + 16.978
y = 0.0278x + 17.07
y = 0.0262x + 17.153
17.5
18.0
18.5
19.0
19.5
0 20 40 60 80 100
Elapsed time (h)
ln [
Cel
ls m
L-1
]
Figure G.40. Specific growth rate calculations for Trial 1 (open circles), Trial 2 (open
squares), and Trial 3 (open triangles).

350
Table G.41. BC13 growth in the presence of the lead IC50 and 50 mM ferrous iron.
Cells mL
-1ln (Cells mL
-1)
Elapsed Time (h) Trial 1 Trial 2 Trial 3 Average STDEV 95% CI Trial 1 Trial 2 Trial 3
0 4.23E+07 4.34E+07 4.31E+07 4.29E+07 5.84E+05 6.60E+05 17.56 17.59 17.58
12 5.31E+07 5.03E+07 5.27E+07 5.20E+07 1.52E+06 1.72E+06 17.79 17.73 17.78
24 5.57E+07 5.70E+07 5.95E+07 5.74E+07 1.93E+06 2.19E+06 17.83 17.86 17.90
36 6.78E+07 6.38E+07 6.23E+07 6.46E+07 2.82E+06 3.19E+06 18.03 17.97 17.95
48 8.53E+07 8.02E+07 7.76E+07 8.10E+07 3.91E+06 4.42E+06 18.26 18.20 18.17
60 1.41E+08 1.34E+08 1.33E+08 1.36E+08 4.64E+06 5.25E+06 18.77 18.71 18.70
72 2.11E+08 2.14E+08 2.08E+08 2.11E+08 2.94E+06 3.33E+06 19.17 19.18 19.15
84 2.70E+08 2.79E+08 2.65E+08 2.72E+08 7.12E+06 8.06E+06 19.41 19.45 19.40
96 2.67E+08 2.61E+08 2.76E+08 2.68E+08 7.73E+06 8.74E+06 19.40 19.38 19.44
108 2.31E+08 2.21E+08 2.27E+08 2.26E+08 5.32E+06 6.01E+06 19.26 19.21 19.24
120 2.51E+08 2.35E+08 2.37E+08 2.41E+08 8.41E+06 9.51E+06 19.34 19.28 19.28
Specific growth rate (h-1
)
Trial 1 0.031
Trial 2 0.033
Trial 3 0.032
Average 0.032
STDEV 0.001
95% CI 0.001
y = 0.0306x + 16.893
y = 0.0328x + 16.736
y = 0.0324x + 16.733
17.5
18.0
18.5
19.0
19.5
20.0
0 20 40 60 80 100
Elapsed time (h)
ln [
Cel
ls m
L-1
]
Figure G.41. Specific growth rate calculations for Trial 1 (open circles), Trial 2 (open
squares), and Trial 3 (open triangles).

351
Table G.42. BC13 growth in the presence of the lead IC50 and 75 mM ferrous iron.
Cells mL
-1ln (Cells mL
-1)
Elapsed Time (h) Trial 1 Trial 2 Trial 3 Average STDEV 95% CI Trial 1 Trial 2 Trial 3
0 4.55E+07 4.77E+07 5.00E+07 4.77E+07 2.28E+06 2.58E+06 17.63 17.68 17.73
12 5.25E+07 5.38E+07 5.24E+07 5.29E+07 8.06E+05 9.12E+05 17.78 17.80 17.77
24 5.96E+07 5.94E+07 5.77E+07 5.89E+07 1.07E+06 1.21E+06 17.90 17.90 17.87
36 7.22E+07 7.55E+07 7.72E+07 7.50E+07 2.51E+06 2.85E+06 18.10 18.14 18.16
48 9.87E+07 1.01E+08 9.56E+07 9.86E+07 2.95E+06 3.34E+06 18.41 18.44 18.38
60 1.52E+08 1.55E+08 1.64E+08 1.57E+08 6.20E+06 7.02E+06 18.84 18.86 18.91
72 2.16E+08 2.09E+08 2.21E+08 2.16E+08 6.01E+06 6.80E+06 19.19 19.16 19.22
84 2.54E+08 2.41E+08 2.38E+08 2.44E+08 8.14E+06 9.21E+06 19.35 19.30 19.29
96 2.85E+08 3.02E+08 3.18E+08 3.02E+08 1.62E+07 1.83E+07 19.47 19.53 19.58
108 2.34E+08 2.40E+08 2.39E+08 2.38E+08 3.23E+06 3.65E+06 19.27 19.30 19.29
120 2.48E+08 2.48E+08 2.58E+08 2.51E+08 5.59E+06 6.33E+06 19.33 19.33 19.37
Specific growth rate (h-1
)
Trial 1 0.031
Trial 2 0.029
Trial 3 0.031
Average 0.030
STDEV 0.001
95% CI 0.001
y = 0.031x + 16.958
y = 0.029x + 17.082
y = 0.0308x + 17.002
18.0
18.5
19.0
19.5
0 20 40 60 80
Elapsed time (h)
ln [
Cel
ls m
L-1
]
Figure G.42. Specific growth rate calculations for Trial 1 (open circles), Trial 2 (open
squares), and Trial 3 (open triangles).
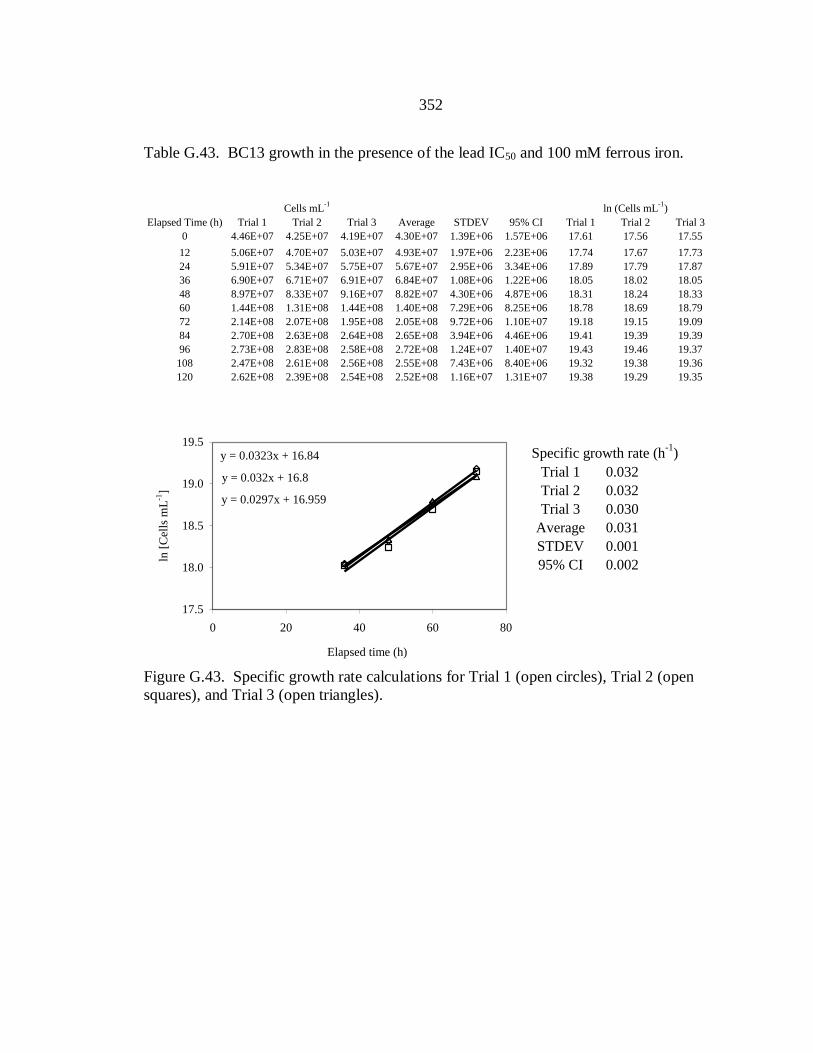
352
Table G.43. BC13 growth in the presence of the lead IC50 and 100 mM ferrous iron.
Cells mL
-1ln (Cells mL
-1)
Elapsed Time (h) Trial 1 Trial 2 Trial 3 Average STDEV 95% CI Trial 1 Trial 2 Trial 3
0 4.46E+07 4.25E+07 4.19E+07 4.30E+07 1.39E+06 1.57E+06 17.61 17.56 17.55
12 5.06E+07 4.70E+07 5.03E+07 4.93E+07 1.97E+06 2.23E+06 17.74 17.67 17.73
24 5.91E+07 5.34E+07 5.75E+07 5.67E+07 2.95E+06 3.34E+06 17.89 17.79 17.87
36 6.90E+07 6.71E+07 6.91E+07 6.84E+07 1.08E+06 1.22E+06 18.05 18.02 18.05
48 8.97E+07 8.33E+07 9.16E+07 8.82E+07 4.30E+06 4.87E+06 18.31 18.24 18.33
60 1.44E+08 1.31E+08 1.44E+08 1.40E+08 7.29E+06 8.25E+06 18.78 18.69 18.79
72 2.14E+08 2.07E+08 1.95E+08 2.05E+08 9.72E+06 1.10E+07 19.18 19.15 19.09
84 2.70E+08 2.63E+08 2.64E+08 2.65E+08 3.94E+06 4.46E+06 19.41 19.39 19.39
96 2.73E+08 2.83E+08 2.58E+08 2.72E+08 1.24E+07 1.40E+07 19.43 19.46 19.37
108 2.47E+08 2.61E+08 2.56E+08 2.55E+08 7.43E+06 8.40E+06 19.32 19.38 19.36
120 2.62E+08 2.39E+08 2.54E+08 2.52E+08 1.16E+07 1.31E+07 19.38 19.29 19.35
Specific growth rate (h-1
)
Trial 1 0.032
Trial 2 0.032
Trial 3 0.030
Average 0.031
STDEV 0.001
95% CI 0.002
y = 0.0323x + 16.84
y = 0.032x + 16.8
y = 0.0297x + 16.959
17.5
18.0
18.5
19.0
19.5
0 20 40 60 80
Elapsed time (h)
ln [
Cel
ls m
L-1
]
Figure G.43. Specific growth rate calculations for Trial 1 (open circles), Trial 2 (open
squares), and Trial 3 (open triangles).

353
Zinc Toxicity in the Presence of Ferrous Iron
Table G.44. BC13 growth in the presence of the zinc IC50 and 25 mM ferrous iron.
Cells mL
-125 mM ln (Cells mL
-1)
Elapsed Time (h) Trial 1 Trial 2 Trial 3 Average STDEV 95% CI Trial 1 Trial 2 Trial 3
0 5.14E+07 5.05E+07 4.87E+07 5.02E+07 1.38E+06 1.56E+06 17.76 17.74 17.70
12 5.59E+07 5.28E+07 4.96E+07 5.28E+07 3.13E+06 3.54E+06 17.84 17.78 17.72
24 6.08E+07 5.85E+07 5.86E+07 5.93E+07 1.31E+06 1.48E+06 17.92 17.89 17.89
72 6.87E+07 7.03E+07 7.32E+07 7.07E+07 2.30E+06 2.60E+06 18.04 18.07 18.11
84 8.78E+07 8.88E+07 8.62E+07 8.76E+07 1.29E+06 1.46E+06 18.29 18.30 18.27
96 1.07E+08 1.07E+08 1.07E+08 1.07E+08 4.35E+05 4.92E+05 18.48 18.48 18.49
108 1.37E+08 1.38E+08 1.38E+08 1.38E+08 5.90E+05 6.68E+05 18.74 18.74 18.74
120 1.77E+08 1.75E+08 1.72E+08 1.74E+08 2.32E+06 2.62E+06 18.99 18.98 18.96
144 1.86E+08 1.76E+08 1.81E+08 1.81E+08 4.82E+06 5.45E+06 19.04 18.99 19.02
168 1.54E+08 1.48E+08 1.56E+08 1.53E+08 4.07E+06 4.61E+06 18.86 18.81 18.8617.5
18.0
18.5
19.0
19.5
0 20 40 60 80 100 120 140
ln [
Cel
ls m
L-1
]
Specific growth rate (h-1
)
Trial 1 0.020
Trial 2 0.019
Trial 3 0.018
Average 0.019
STDEV 0.001
95% CI 0.001
y = 0.0195x + 16.64
y = 0.0188x + 16.706
y = 0.0182x + 16.771
17.5
18.0
18.5
19.0
19.5
0 20 40 60 80 100 120 140
Elapsed time (h)
ln [
Cel
ls m
L-1
]
Figure G.44. Specific growth rate calculations for Trial 1 (open circles), Trial 2 (open
squares), and Trial 3 (open triangles).

354
Table G.45. BC13 growth in the presence of the zinc IC50 and 50 mM ferrous iron.
Cells mL
-1ln (Cells mL
-1)
Elapsed Time (h) Trial 1 Trial 2 Trial 3 Average STDEV 95% CI Trial 1 Trial 2 Trial 3
0 4.82E+07 5.02E+07 4.73E+07 4.86E+07 1.48E+06 1.67E+06 17.69 17.73 17.67
12 5.49E+07 5.45E+07 5.12E+07 5.36E+07 2.04E+06 2.31E+06 17.82 17.81 17.75
24 6.35E+07 6.52E+07 6.31E+07 6.39E+07 1.14E+06 1.29E+06 17.97 17.99 17.96
72 6.76E+07 6.65E+07 7.01E+07 6.81E+07 1.86E+06 2.11E+06 18.03 18.01 18.07
84 9.05E+07 8.52E+07 8.01E+07 8.53E+07 5.22E+06 5.90E+06 18.32 18.26 18.20
96 1.09E+08 1.10E+08 1.09E+08 1.09E+08 9.59E+05 1.09E+06 18.51 18.52 18.50
108 1.54E+08 1.64E+08 1.56E+08 1.58E+08 5.01E+06 5.67E+06 18.85 18.91 18.87
120 1.99E+08 1.95E+08 1.86E+08 1.93E+08 6.63E+06 7.51E+06 19.11 19.09 19.04
144 1.82E+08 1.75E+08 1.72E+08 1.76E+08 5.28E+06 5.98E+06 19.02 18.98 18.96
168 1.58E+08 1.51E+08 1.53E+08 1.54E+08 3.72E+06 4.20E+06 18.88 18.83 18.8517.5
18.0
18.5
19.0
19.5
0 20 40 60 80 100 120 140
ln [
Cel
ls m
L-1
]
Specific growth rate (h-1
)
Trial 1 0.022
Trial 2 0.023
Trial 3 0.022
Average 0.023
STDEV 0.001
95% CI 0.001
y = 0.0224x + 16.412
y = 0.0234x + 16.317
y = 0.0218x + 16.442
17.5
18.0
18.5
19.0
19.5
0 20 40 60 80 100 120 140
Elapsed time (h)
ln [
Cel
ls m
L-1
]
Figure G.45. Specific growth rate calculations for Trial 1 (open circles), Trial 2 (open
squares), and Trial 3 (open triangles).

355
Table G.46. BC13 growth in the presence of the zinc IC50 and 75 mM ferrous iron.
Cells mL
-1ln (Cells mL
-1)
Elapsed Time (h) Trial 1 Trial 2 Trial 3 Average STDEV 95% CI Trial 1 Trial 2 Trial 3
0 4.81E+07 5.05E+07 4.78E+07 4.88E+07 1.47E+06 1.67E+06 17.69 17.74 17.68
12 6.11E+07 6.26E+07 6.39E+07 6.25E+07 1.41E+06 1.60E+06 17.93 17.95 17.97
24 5.90E+07 5.72E+07 5.51E+07 5.71E+07 1.92E+06 2.17E+06 17.89 17.86 17.82
72 6.16E+07 6.53E+07 6.69E+07 6.46E+07 2.74E+06 3.10E+06 17.94 17.99 18.02
84 8.44E+07 7.93E+07 8.14E+07 8.17E+07 2.56E+06 2.90E+06 18.25 18.19 18.22
96 1.03E+08 1.05E+08 1.08E+08 1.05E+08 2.22E+06 2.51E+06 18.45 18.47 18.49
108 1.57E+08 1.51E+08 1.53E+08 1.54E+08 3.32E+06 3.76E+06 18.87 18.83 18.85
120 1.95E+08 2.00E+08 2.09E+08 2.01E+08 7.52E+06 8.50E+06 19.09 19.11 19.16
144 1.93E+08 2.03E+08 1.96E+08 1.97E+08 5.09E+06 5.75E+06 19.08 19.13 19.09
168 1.51E+08 1.55E+08 1.57E+08 1.54E+08 2.88E+06 3.25E+06 18.83 18.86 18.8717.5
18.0
18.5
19.0
19.5
0 20 40 60 80 100 120 140
ln [
Cel
ls m
L-1
]
Specific growth rate (h-1
)
Trial 1 0.024
Trial 2 0.024
Trial 3 0.024
Average 0.024
STDEV 0.000
95% CI 0.000
y = 0.0244x + 16.18
y = 0.024x + 16.217
y = 0.0243x + 16.217
17.5
18.0
18.5
19.0
19.5
0 20 40 60 80 100 120 140
Elapsed time (h)
ln [
Cel
ls m
L-1
]
Figure G.46. Specific growth rate calculations for Trial 1 (open circles), Trial 2 (open
squares), and Trial 3 (open triangles).

356
Table G.47. BC13 growth in the presence of the zinc IC50 and 100 mM ferrous iron.
Cells mL
-1ln (Cells mL
-1)
Elapsed Time (h) Trial 1 Trial 2 Trial 3 Average STDEV 95% CI Trial 1 Trial 2 Trial 3
0 5.06E+07 5.52E+07 5.03E+07 5.20E+07 2.77E+06 3.14E+06 17.74 17.83 17.73
12 5.78E+07 5.40E+07 5.38E+07 5.52E+07 2.24E+06 2.53E+06 17.87 17.80 17.80
24 6.16E+07 5.86E+07 5.53E+07 5.85E+07 3.14E+06 3.55E+06 17.94 17.89 17.83
72 5.84E+07 5.29E+07 4.95E+07 5.36E+07 4.47E+06 5.05E+06 17.88 17.78 17.72
84 8.11E+07 8.15E+07 7.87E+07 8.04E+07 1.52E+06 1.72E+06 18.21 18.22 18.18
96 1.06E+08 1.07E+08 1.15E+08 1.09E+08 5.17E+06 5.85E+06 18.48 18.48 18.56
108 1.57E+08 1.70E+08 1.53E+08 1.60E+08 8.81E+06 9.97E+06 18.87 18.95 18.85
120 2.07E+08 1.91E+08 2.03E+08 2.00E+08 8.63E+06 9.77E+06 19.15 19.07 19.13
144 1.85E+08 1.95E+08 2.09E+08 1.96E+08 1.23E+07 1.39E+07 19.04 19.09 19.16
168 1.50E+08 1.35E+08 1.24E+08 1.36E+08 1.27E+07 1.44E+07 18.82 18.72 18.6417.5
18.0
18.5
19.0
19.5
0 20 40 60 80 100 120 140
ln [
Cel
ls m
L-1
]
Specific growth rate (h-1
)
Trial 1 0.027
Trial 2 0.028
Trial 3 0.029
Average 0.028
STDEV 0.001
95% CI 0.001
y = 0.0266x + 15.961
y = 0.0275x + 15.86
y = 0.0291x + 15.697
17.5
18.0
18.5
19.0
19.5
0 20 40 60 80 100 120 140
Elapsed time (h)
ln [
Cel
ls m
L-1
]
Figure G.47. Specific growth rate calculations for Trial 1 (open circles), Trial 2 (open
squares), and Trial 3 (open triangles).

357
Copper Toxicity in the Presence of Ferrous Iron
Table G.48. BC13 growth in the presence of the copper IC50 and 25 mM ferrous iron.
Cells mL
-1ln (Cells mL
-1)
Elapsed Time (h) Trial 1 Trial 2 Trial 3 Average STDEV 95% CI Trial 1 Trial 2 Trial 3
0 5.36E+07 5.10E+07 5.12E+07 5.19E+07 1.47E+06 1.66E+06 17.80 17.75 17.75
12 4.58E+07 4.45E+07 4.27E+07 4.43E+07 1.55E+06 1.75E+06 17.64 17.61 17.57
24 5.88E+07 5.92E+07 6.25E+07 6.02E+07 2.01E+06 2.28E+06 17.89 17.90 17.95
72 5.21E+07 4.95E+07 4.96E+07 5.04E+07 1.47E+06 1.66E+06 17.77 17.72 17.72
84 6.42E+07 6.74E+07 6.67E+07 6.61E+07 1.67E+06 1.89E+06 17.98 18.03 18.02
96 7.14E+07 7.54E+07 7.79E+07 7.49E+07 3.28E+06 3.71E+06 18.08 18.14 18.17
108 8.86E+07 9.10E+07 8.95E+07 8.97E+07 1.18E+06 1.33E+06 18.30 18.33 18.31
120 1.12E+08 1.07E+08 1.10E+08 1.10E+08 2.98E+06 3.37E+06 18.54 18.48 18.52
144 1.54E+08 1.49E+08 1.42E+08 1.48E+08 5.75E+06 6.51E+06 18.85 18.82 18.77
168 1.32E+08 1.34E+08 1.26E+08 1.31E+08 4.03E+06 4.56E+06 18.70 18.71 18.6517.5
18.0
18.5
19.0
0 50 100 150 200
ln [
Cel
ls m
L-1
]
Specific growth rate (h-1
)
Trial 1 0.015
Trial 2 0.015
Trial 3 0.014
Average 0.015
STDEV 0.001
95% CI 0.001
y = 0.0152x + 16.674
y = 0.0146x + 16.729
y = 0.0142x + 16.772
17.5
18.0
18.5
19.0
0 50 100 150 200
Elapsed time (h)
ln [
Cel
ls m
L-1
]
Figure G.48. Specific growth rate calculations for Trial 1 (open circles), Trial 2 (open
squares), and Trial 3 (open triangles).
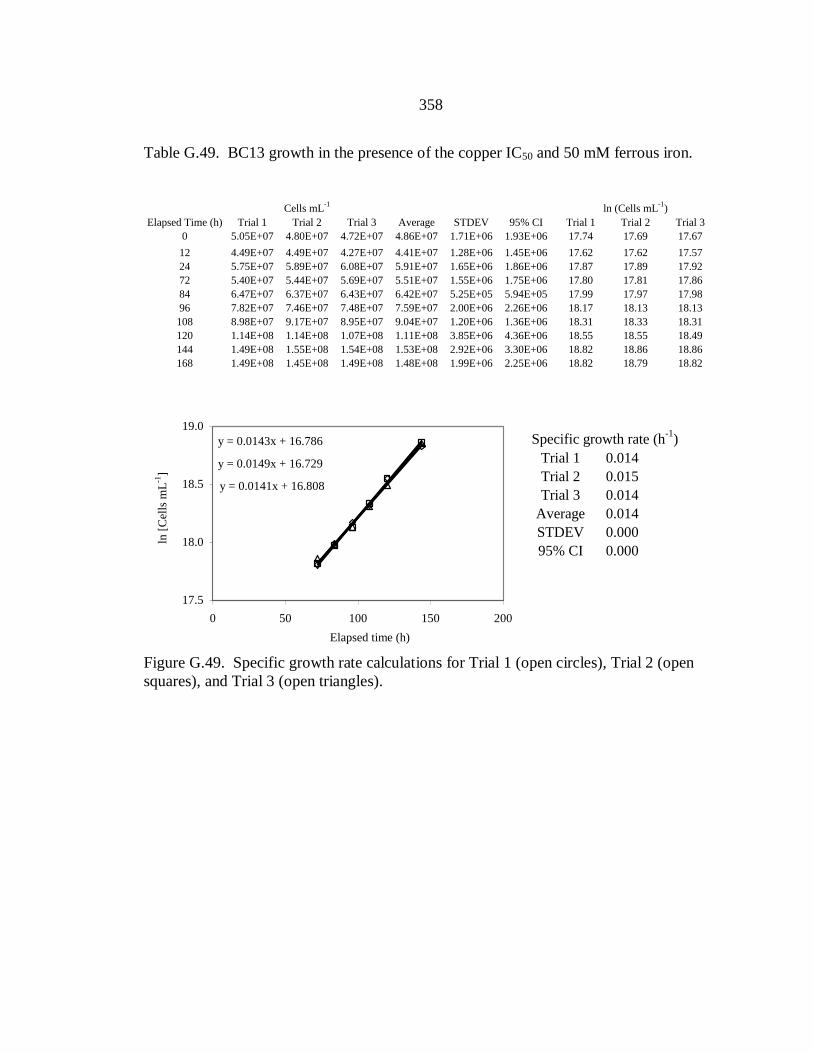
358
Table G.49. BC13 growth in the presence of the copper IC50 and 50 mM ferrous iron.
Cells mL
-1ln (Cells mL
-1)
Elapsed Time (h) Trial 1 Trial 2 Trial 3 Average STDEV 95% CI Trial 1 Trial 2 Trial 3
0 5.05E+07 4.80E+07 4.72E+07 4.86E+07 1.71E+06 1.93E+06 17.74 17.69 17.67
12 4.49E+07 4.49E+07 4.27E+07 4.41E+07 1.28E+06 1.45E+06 17.62 17.62 17.57
24 5.75E+07 5.89E+07 6.08E+07 5.91E+07 1.65E+06 1.86E+06 17.87 17.89 17.92
72 5.40E+07 5.44E+07 5.69E+07 5.51E+07 1.55E+06 1.75E+06 17.80 17.81 17.86
84 6.47E+07 6.37E+07 6.43E+07 6.42E+07 5.25E+05 5.94E+05 17.99 17.97 17.98
96 7.82E+07 7.46E+07 7.48E+07 7.59E+07 2.00E+06 2.26E+06 18.17 18.13 18.13
108 8.98E+07 9.17E+07 8.95E+07 9.04E+07 1.20E+06 1.36E+06 18.31 18.33 18.31
120 1.14E+08 1.14E+08 1.07E+08 1.11E+08 3.85E+06 4.36E+06 18.55 18.55 18.49
144 1.49E+08 1.55E+08 1.54E+08 1.53E+08 2.92E+06 3.30E+06 18.82 18.86 18.86
168 1.49E+08 1.45E+08 1.49E+08 1.48E+08 1.99E+06 2.25E+06 18.82 18.79 18.8217.5
18.0
18.5
19.0
0 50 100 150 200
ln [
Cel
ls m
L-1
]
Specific growth rate (h-1
)
Trial 1 0.014
Trial 2 0.015
Trial 3 0.014
Average 0.014
STDEV 0.000
95% CI 0.000
y = 0.0143x + 16.786
y = 0.0149x + 16.729
y = 0.0141x + 16.808
17.5
18.0
18.5
19.0
0 50 100 150 200
Elapsed time (h)
ln [
Cel
ls m
L-1
]
Figure G.49. Specific growth rate calculations for Trial 1 (open circles), Trial 2 (open
squares), and Trial 3 (open triangles).

359
Table G.50. BC13 growth in the presence of the copper IC50 and 75 mM ferrous iron.
Cells mL
-1ln (Cells mL
-1)
Elapsed Time (h) Trial 1 Trial 2 Trial 3 Average STDEV 95% CI Trial 1 Trial 2 Trial 3
0 5.51E+07 5.77E+07 5.65E+07 5.65E+07 1.30E+06 1.47E+06 17.83 17.87 17.85
12 4.81E+07 5.06E+07 5.37E+07 5.08E+07 2.78E+06 3.15E+06 17.69 17.74 17.80
24 5.67E+07 5.75E+07 6.02E+07 5.81E+07 1.85E+06 2.09E+06 17.85 17.87 17.91
72 5.75E+07 6.00E+07 6.09E+07 5.95E+07 1.77E+06 2.00E+06 17.87 17.91 17.93
84 6.96E+07 6.86E+07 6.47E+07 6.76E+07 2.59E+06 2.93E+06 18.06 18.04 17.98
96 7.87E+07 8.17E+07 7.73E+07 7.92E+07 2.25E+06 2.55E+06 18.18 18.22 18.16
108 8.96E+07 8.70E+07 9.10E+07 8.92E+07 1.99E+06 2.25E+06 18.31 18.28 18.33
120 1.15E+08 1.16E+08 1.15E+08 1.16E+08 6.02E+05 6.81E+05 18.56 18.57 18.56
144 1.57E+08 1.53E+08 1.60E+08 1.57E+08 3.67E+06 4.16E+06 18.87 18.85 18.89
168 1.34E+08 1.36E+08 1.32E+08 1.34E+08 1.79E+06 2.03E+06 18.72 18.72 18.7017.5
18.0
18.5
19.0
0 50 100 150 200
ln [
Cel
ls m
L-1
]
Specific growth rate (h-1
)
Trial 1 0.014
Trial 2 0.013
Trial 3 0.014
Average 0.014
STDEV 0.000
95% CI 0.001
y = 0.0139x + 16.864
y = 0.0132x + 16.938
y = 0.0141x + 16.841
17.5
18.0
18.5
19.0
0 50 100 150 200
Elapsed time (h)
ln [
Cel
ls m
L-1
]
Figure G.50. Specific growth rate calculations for Trial 1 (open circles), Trial 2 (open
squares), and Trial 3 (open triangles).

360
Table G.51. BC13 growth in the presence of the copper IC50 and 100 mM ferrous iron.
Cells mL
-1ln (Cells mL
-1)
Elapsed Time (h) Trial 1 Trial 2 Trial 3 Average STDEV 95% CI Trial 1 Trial 2 Trial 3
0 5.37E+07 5.62E+07 6.06E+07 5.68E+07 3.46E+06 3.91E+06 17.80 17.84 17.92
12 4.78E+07 4.71E+07 4.74E+07 4.74E+07 3.78E+05 4.28E+05 17.68 17.67 17.67
24 5.97E+07 6.02E+07 6.39E+07 6.12E+07 2.30E+06 2.60E+06 17.90 17.91 17.97
72 5.35E+07 5.25E+07 5.13E+07 5.25E+07 1.11E+06 1.25E+06 17.80 17.78 17.75
84 6.59E+07 6.61E+07 6.08E+07 6.43E+07 3.04E+06 3.44E+06 18.00 18.01 17.92
96 8.01E+07 8.00E+07 7.51E+07 7.84E+07 2.84E+06 3.21E+06 18.20 18.20 18.13
108 9.50E+07 1.00E+08 9.26E+07 9.60E+07 3.93E+06 4.44E+06 18.37 18.42 18.34
120 1.33E+08 1.33E+08 1.32E+08 1.32E+08 6.13E+05 6.94E+05 18.71 18.70 18.70
144 1.50E+08 1.51E+08 1.50E+08 1.50E+08 1.01E+06 1.15E+06 18.82 18.84 18.83
168 1.41E+08 1.48E+08 1.58E+08 1.49E+08 8.64E+06 9.78E+06 18.76 18.82 18.8817.5
18.0
18.5
19.0
0 20 40 60 80 100 120 140
ln [
Cel
ls m
L-1
]
Specific growth rate (h-1
)
Trial 1 0.018
Trial 2 0.019
Trial 3 0.019
Average 0.019
STDEV 0.001
95% CI 0.001
y = 0.0182x + 16.467
y = 0.0189x + 16.405
y = 0.0192x + 16.324
17.5
18.0
18.5
19.0
0 20 40 60 80 100 120 140
Elapsed time (h)
ln [
Cel
ls m
L-1
]
Figure G.51. Specific growth rate calculations for Trial 1 (open circles), Trial 2 (open
squares), and Trial 3 (open triangles).
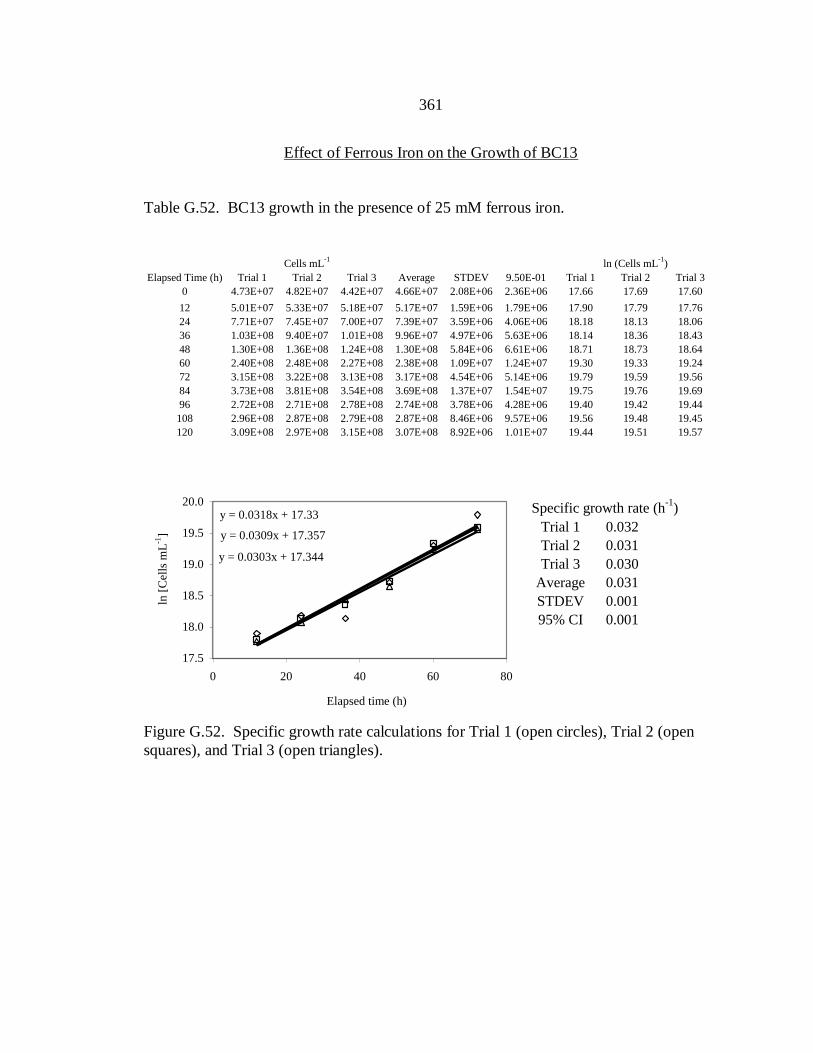
361
Effect of Ferrous Iron on the Growth of BC13
Table G.52. BC13 growth in the presence of 25 mM ferrous iron.
Cells mL
-1ln (Cells mL
-1)
Elapsed Time (h) Trial 1 Trial 2 Trial 3 Average STDEV 9.50E-01 Trial 1 Trial 2 Trial 3
0 4.73E+07 4.82E+07 4.42E+07 4.66E+07 2.08E+06 2.36E+06 17.66 17.69 17.60
12 5.01E+07 5.33E+07 5.18E+07 5.17E+07 1.59E+06 1.79E+06 17.90 17.79 17.76
24 7.71E+07 7.45E+07 7.00E+07 7.39E+07 3.59E+06 4.06E+06 18.18 18.13 18.06
36 1.03E+08 9.40E+07 1.01E+08 9.96E+07 4.97E+06 5.63E+06 18.14 18.36 18.43
48 1.30E+08 1.36E+08 1.24E+08 1.30E+08 5.84E+06 6.61E+06 18.71 18.73 18.64
60 2.40E+08 2.48E+08 2.27E+08 2.38E+08 1.09E+07 1.24E+07 19.30 19.33 19.24
72 3.15E+08 3.22E+08 3.13E+08 3.17E+08 4.54E+06 5.14E+06 19.79 19.59 19.56
84 3.73E+08 3.81E+08 3.54E+08 3.69E+08 1.37E+07 1.54E+07 19.75 19.76 19.69
96 2.72E+08 2.71E+08 2.78E+08 2.74E+08 3.78E+06 4.28E+06 19.40 19.42 19.44
108 2.96E+08 2.87E+08 2.79E+08 2.87E+08 8.46E+06 9.57E+06 19.56 19.48 19.45
120 3.09E+08 2.97E+08 3.15E+08 3.07E+08 8.92E+06 1.01E+07 19.44 19.51 19.57
17.5
18.0
18.5
19.0
19.5
20.0
0 20 40 60 80
ln [
Cel
ls m
L-1
]
Specific growth rate (h-1
)
Trial 1 0.032
Trial 2 0.031
Trial 3 0.030
Average 0.031
STDEV 0.001
95% CI 0.001
y = 0.0318x + 17.33
y = 0.0309x + 17.357
y = 0.0303x + 17.344
17.5
18.0
18.5
19.0
19.5
20.0
0 20 40 60 80
Elapsed time (h)
ln [
Cel
ls m
L-1
]
Figure G.52. Specific growth rate calculations for Trial 1 (open circles), Trial 2 (open
squares), and Trial 3 (open triangles).

362
Table G.53. BC13 growth in the presence of 50 mM ferrous iron.
Cells mL
-1ln (Cells mL
-1)
Elapsed Time (h) Trial 1 Trial 2 Trial 3 Average STDEV 9.50E-01 Trial 1 Trial 2 Trial 3
0 4.53E+07 4.41E+07 4.46E+07 4.47E+07 6.07E+05 6.87E+05 17.63 17.60 17.61
12 5.38E+07 5.42E+07 5.72E+07 5.51E+07 1.87E+06 2.12E+06 17.80 17.81 17.86
24 8.13E+07 7.45E+07 8.09E+07 7.89E+07 3.81E+06 4.32E+06 18.21 18.13 18.21
36 1.11E+08 8.66E+07 8.94E+07 9.56E+07 1.32E+07 1.50E+07 18.52 18.28 18.31
48 1.78E+08 1.92E+08 1.84E+08 1.84E+08 7.14E+06 8.08E+06 19.00 19.07 19.03
60 2.41E+08 2.51E+08 2.50E+08 2.48E+08 5.63E+06 6.37E+06 19.30 19.34 19.34
72 3.16E+08 3.66E+08 3.48E+08 3.43E+08 2.52E+07 2.85E+07 19.57 19.72 19.67
84 3.55E+08 3.74E+08 3.87E+08 3.72E+08 1.60E+07 1.81E+07 19.69 19.74 19.77
96 2.86E+08 3.11E+08 3.29E+08 3.09E+08 2.14E+07 2.42E+07 19.47 19.56 19.61
108 2.89E+08 2.83E+08 2.90E+08 2.87E+08 3.81E+06 4.31E+06 19.48 19.46 19.48
120 3.00E+08 2.82E+08 2.87E+08 2.90E+08 9.63E+06 1.09E+07 19.52 19.46 19.47
17.0
17.5
18.0
18.5
19.0
19.5
20.0
0 20 40 60 80
ln [
Cel
ls m
L-1
]
Specific growth rate (h-1
)
Trial 1 0.029
Trial 2 0.031
Trial 3 0.030
Average 0.030
STDEV 0.001
95% CI 0.001
y = 0.0286x + 17.547
y = 0.0308x + 17.453
y = 0.0296x + 17.511
17.0
17.5
18.0
18.5
19.0
19.5
20.0
0 20 40 60 80
Elapsed time (h)
ln [
Cel
ls m
L-1
]
Figure G.53. Specific growth rate calculations for Trial 1 (open circles), Trial 2 (open
squares), and Trial 3 (open triangles).

363
Table G.54. BC13 growth in the presence of 75 mM ferrous iron.
Cells mL
-1ln (Cells mL
-1)
Elapsed Time (h) Trial 1 Trial 2 Trial 3 Average STDEV 9.50E-01 Trial 1 Trial 2 Trial 3
0 4.66E+07 4.22E+07 4.57E+07 4.49E+07 2.34E+06 2.65E+06 17.66 17.56 17.64
12 5.94E+07 5.42E+07 5.68E+07 5.68E+07 2.63E+06 2.98E+06 17.90 17.81 17.86
24 7.82E+07 8.05E+07 7.06E+07 7.64E+07 5.18E+06 5.86E+06 18.18 18.20 18.07
36 7.54E+07 9.33E+07 9.40E+07 8.75E+07 1.05E+07 1.19E+07 18.14 18.35 18.36
48 1.33E+08 1.62E+08 1.80E+08 1.58E+08 2.35E+07 2.66E+07 18.71 18.90 19.01
60 2.40E+08 2.22E+08 2.32E+08 2.31E+08 9.18E+06 1.04E+07 19.30 19.22 19.26
72 3.93E+08 3.69E+08 3.70E+08 3.77E+08 1.35E+07 1.53E+07 19.79 19.73 19.73
84 3.79E+08 3.54E+08 3.48E+08 3.60E+08 1.63E+07 1.84E+07 19.75 19.68 19.67
96 2.66E+08 2.74E+08 2.96E+08 2.78E+08 1.57E+07 1.78E+07 19.40 19.43 19.51
108 3.13E+08 3.08E+08 2.93E+08 3.05E+08 1.07E+07 1.21E+07 19.56 19.55 19.50
120 2.77E+08 2.57E+08 2.48E+08 2.61E+08 1.48E+07 1.67E+07 19.44 19.37 19.33
17.0
17.5
18.0
18.5
19.0
19.5
20.0
0 20 40 60 80
ln [
Cel
ls m
L-1
]
Specific growth rate (h-1
)
Trial 1 0.029
Trial 2 0.030
Trial 3 0.030
Average 0.030
STDEV 0.001
95% CI 0.001
y = 0.0289x + 17.482
y = 0.0298x + 17.464
y = 0.0298x + 17.487
17.0
17.5
18.0
18.5
19.0
19.5
20.0
0 20 40 60 80
Elapsed time (h)
ln [
Cel
ls m
L-1
]
Figure G.54. Specific growth rate calculations for Trial 1 (open circles), Trial 2 (open
squares), and Trial 3 (open triangles).

364
Table G.55. BC13 growth in the presence of 100 mM ferrous iron.
Cells mL
-1ln (Cells mL
-1)
Elapsed Time (h) Trial 1 Trial 2 Trial 3 Average STDEV 9.50E-01 Trial 1 Trial 2 Trial 3
0 4.36E+07 4.33E+07 4.38E+07 4.36E+07 2.26E+05 2.56E+05 17.59 17.58 17.59
12 5.17E+07 5.39E+07 5.16E+07 5.24E+07 1.32E+06 1.50E+06 17.76 17.80 17.76
24 7.01E+07 7.20E+07 7.29E+07 7.17E+07 1.42E+06 1.61E+06 18.07 18.09 18.10
36 9.26E+07 8.70E+07 9.06E+07 9.01E+07 2.82E+06 3.19E+06 18.34 18.28 18.32
48 1.25E+08 1.55E+08 1.14E+08 1.31E+08 2.09E+07 2.37E+07 18.65 18.86 18.55
60 2.59E+08 2.35E+08 2.28E+08 2.40E+08 1.63E+07 1.84E+07 19.37 19.27 19.24
72 3.18E+08 3.16E+08 3.05E+08 3.13E+08 6.72E+06 7.60E+06 19.58 19.57 19.54
84 3.93E+08 4.02E+08 3.86E+08 3.94E+08 7.79E+06 8.82E+06 19.79 19.81 19.77
96 2.45E+08 2.31E+08 2.45E+08 2.40E+08 8.39E+06 9.49E+06 19.32 19.26 19.32
108 3.25E+08 3.40E+08 3.11E+08 3.25E+08 1.48E+07 1.67E+07 19.60 19.65 19.55
120 2.82E+08 2.94E+08 3.23E+08 3.00E+08 2.14E+07 2.42E+07 19.46 19.50 19.59
17.0
17.5
18.0
18.5
19.0
19.5
20.0
0 20 40 60 80
ln [
Cel
ls m
L-1
]
Specific growth rate (h-1
)
Trial 1 0.029
Trial 2 0.029
Trial 3 0.028
Average 0.028
STDEV 0.001
95% CI 0.001
y = 0.0291x + 17.433
y = 0.0288x + 17.459
y = 0.0275x + 17.454
17.0
17.5
18.0
18.5
19.0
19.5
20.0
0 20 40 60 80
Elapsed time (h)
ln [
Cel
ls m
L-1
]
Figure G.55. Specific growth rate calculations for Trial 1 (open circles), Trial 2 (open
squares), and Trial 3 (open triangles).

365
Toxicity of Heavy Metals Following Pre-Adaptation through Subsequent Culturing
BC13 cell concentrations with time when grown in the presence of varying
concentrations of lead, zinc, and copper after pre-adaptation via subsequent culturing at
the respective IC50. Experiments were repeated in triplicate and average values, standard
deviations (STDEV), and 95% confidence intervals (95% CI) are shown. Specific
growth rates were calculated using linear regressions and are shown along with the
corresponding STDEV and 95% CI to the right of the plots.
Table G.56. BC13 growth in the presence of the lead IC50 following pre-adaptation.
Cells mL
-1ln (Cells mL
-1)
Elapsed Time (h) Trial 1 Trial 2 Trial 3 Average STDEV 9.50E-01 Trial 1 Trial 2 Trial 3
0 5.17E+07 5.13E+07 5.12E+07 5.14E+07 2.62E+05 2.96E+05 17.76 17.75 17.75
12 6.22E+07 6.81E+07 7.35E+07 6.79E+07 5.61E+06 6.34E+06 17.95 18.04 18.11
24 5.23E+07 5.00E+07 5.07E+07 5.10E+07 1.14E+06 1.29E+06 17.77 17.73 17.74
36 5.85E+07 6.10E+07 6.42E+07 6.12E+07 2.87E+06 3.24E+06 17.88 17.93 17.98
48 7.25E+07 7.73E+07 8.39E+07 7.79E+07 5.74E+06 6.49E+06 18.10 18.16 18.25
60 9.38E+07 9.31E+07 1.08E+08 9.82E+07 8.26E+06 9.35E+06 18.36 18.35 18.50
72 1.18E+08 1.17E+08 1.27E+08 1.20E+08 5.87E+06 6.65E+06 18.58 18.57 18.66
84 1.38E+08 1.27E+08 1.33E+08 1.32E+08 5.51E+06 6.24E+06 18.74 18.66 18.71
96 1.59E+08 1.38E+08 1.35E+08 1.44E+08 1.27E+07 1.43E+07 18.88 18.75 18.72
108 1.49E+08 1.51E+08 1.42E+08 1.47E+08 4.77E+06 5.40E+06 18.82 18.83 18.77 17.5
18.0
18.5
19.0
0 20 40 60 80
ln [
Cel
ls m
L-1
]
Specific growth rate (h-1
)
Trial 1 0.020
Trial 2 0.018
Trial 3 0.019
Average 0.019
STDEV 0.001
95% CI 0.001
y = 0.0196x + 17.17
y = 0.0177x + 17.297
y = 0.0192x + 17.309
17.5
18.0
18.5
19.0
0 20 40 60 80
Elapsed time (h)
ln [
Cel
ls m
L-1
]
Figure G.56. Specific growth rate calculations for Trial 1 (open circles), Trial 2 (open
squares), and Trial 3 (open triangles).

366
Table G.57. BC13 growth in the presence of the zinc IC50 following pre-adaptation.
Cells mL
-1ln (Cells mL
-1)
Elapsed Time (h) Trial 1 Trial 2 Trial 3 Average STDEV 9.50E-01 Trial 1 Trial 2 Trial 3
0 5.42E+07 5.96E+07 6.09E+07 5.82E+07 3.54E+06 4.00E+06 17.81 17.90 17.92
12 5.15E+07 5.84E+07 5.94E+07 5.64E+07 4.27E+06 4.83E+06 17.76 17.88 17.90
24 5.56E+07 5.18E+07 5.02E+07 5.25E+07 2.76E+06 3.13E+06 17.83 17.76 17.73
36 6.29E+07 6.78E+07 7.05E+07 6.71E+07 3.88E+06 4.39E+06 17.96 18.03 18.07
48 6.52E+07 6.61E+07 6.99E+07 6.71E+07 2.51E+06 2.85E+06 17.99 18.01 18.06
60 8.85E+07 8.15E+07 7.99E+07 8.33E+07 4.58E+06 5.19E+06 18.30 18.22 18.20
72 1.15E+08 1.22E+08 1.23E+08 1.20E+08 4.12E+06 4.66E+06 18.56 18.62 18.62
84 1.43E+08 1.33E+08 1.35E+08 1.37E+08 5.12E+06 5.80E+06 18.78 18.71 18.72
96 1.43E+08 1.56E+08 1.58E+08 1.52E+08 8.06E+06 9.12E+06 18.78 18.87 18.88
108 1.57E+08 1.50E+08 1.60E+08 1.56E+08 4.79E+06 5.42E+06 18.87 18.83 18.89 17.5
18.0
18.5
19.0
0 20 40 60 80 100
ln [
Cel
ls m
L-1
]
Specific growth rate (h-1
)
Trial 1 0.022
Trial 2 0.021
Trial 3 0.020
Average 0.021
STDEV 0.001
95% CI 0.001
y = 0.0218x + 16.968
y = 0.0209x + 17.007
y = 0.0201x + 17.077
17.5
18.0
18.5
19.0
0 20 40 60 80 100
Elapsed time (h)
ln [
Cel
ls m
L-1
]
Figure G.57. Specific growth rate calculations for Trial 1 (open circles), Trial 2 (open
squares), and Trial 3 (open triangles).

367
Table G.58. BC13 growth in the presence of the copper IC50 following pre-adaptation.
Cells mL
-1ln (Cells mL
-1)
Elapsed Time (h) Trial 1 Trial 2 Trial 3 Average STDEV 9.50E-01 Trial 1 Trial 2 Trial 3
0 5.54E+07 5.77E+07 5.73E+07 5.68E+07 1.22E+06 1.38E+06 17.83 17.87 17.86
12 5.37E+07 5.01E+07 4.60E+07 4.99E+07 3.87E+06 4.38E+06 17.80 17.73 17.64
24 5.32E+07 5.09E+07 5.60E+07 5.33E+07 2.54E+06 2.87E+06 17.79 17.75 17.84
36 4.96E+07 4.83E+07 5.13E+07 4.97E+07 1.53E+06 1.73E+06 17.72 17.69 17.75
48 6.20E+07 6.37E+07 6.48E+07 6.35E+07 1.43E+06 1.62E+06 17.94 17.97 17.99
60 8.19E+07 7.83E+07 7.25E+07 7.76E+07 4.72E+06 5.34E+06 18.22 18.18 18.10
72 1.05E+08 9.90E+07 1.07E+08 1.04E+08 4.22E+06 4.77E+06 18.47 18.41 18.49
84 1.58E+08 1.46E+08 1.40E+08 1.48E+08 8.97E+06 1.01E+07 18.88 18.80 18.76
96 1.62E+08 1.43E+08 1.51E+08 1.52E+08 9.56E+06 1.08E+07 18.90 18.78 18.83
108 1.60E+08 1.38E+08 1.34E+08 1.44E+08 1.43E+07 1.61E+07 18.89 18.74 18.71 17.5
18.0
18.5
19.0
0 20 40 60 80 100
ln [
Cel
ls m
L-1
]
Specific growth rate (h-1
)
Trial 1 0.024
Trial 2 0.022
Trial 3 0.021
Average 0.022
STDEV 0.001
95% CI 0.002
y = 0.0236x + 16.826
y = 0.0222x + 16.881
y = 0.0209x + 16.964
17.5
18.0
18.5
19.0
0 20 40 60 80 100
Elapsed time (h)
ln [
Cel
ls m
L-1
]
Figure G.58. Specific growth rate calculations for Trial 1 (open circles), Trial 2 (open
squares), and Trial 3 (open triangles).

368
Resuscitation of BC13 Following Exposure to Heavy Metal MICs
BC13 cell concentrations with time when grown in metal free medium after being
harvested from medium containing an MIC of lead, zinc, or copper. Experiments were
repeated in triplicate and average values, standard deviations (STDEV), and 95%
confidence intervals (95% CI) are shown. Specific growth rates were calculated using
linear regressions and are shown along with the corresponding STDEV and 95% CI to the
right of the plots.
Table G.59. BC13 growth in metal free medium following exposure to the lead MIC.
Cells mL
-1ln (Cells mL
-1)
Elapsed Time (h) Trial 1 Trial 2 Trial 3 Average STDEV 95% CI Trial 1 Trial 2 Trial 3
0 4.77E+07 5.04E+07 4.78E+07 4.86E+07 1.54E+06 1.74E+06 17.68 17.74 17.68
12 5.50E+07 4.76E+07 4.76E+07 5.01E+07 4.26E+06 4.83E+06 17.82 17.68 17.68
24 8.15E+07 7.76E+07 7.43E+07 7.78E+07 3.59E+06 4.06E+06 18.22 18.17 18.12
36 8.33E+07 9.07E+07 9.71E+07 9.04E+07 6.88E+06 7.79E+06 18.24 18.32 18.39
48 1.42E+08 1.30E+08 1.42E+08 1.38E+08 6.73E+06 7.62E+06 18.77 18.68 18.77
60 2.40E+08 2.79E+08 2.64E+08 2.61E+08 1.96E+07 2.22E+07 19.30 19.45 19.39
72 3.05E+08 3.36E+08 3.63E+08 3.35E+08 2.92E+07 3.30E+07 19.53 19.63 19.71
84 3.37E+08 2.92E+08 2.99E+08 3.09E+08 2.39E+07 2.71E+07 19.63 19.49 19.51
96 3.03E+08 3.21E+08 3.18E+08 3.14E+08 9.82E+06 1.11E+07 19.53 19.59 19.58
108 3.21E+08 2.88E+08 2.68E+08 2.92E+08 2.66E+07 3.01E+07 19.59 19.48 19.41
120 3.29E+08 2.91E+08 3.14E+08 3.11E+08 1.92E+07 2.18E+07 19.61 19.49 19.56
Specific growth rate (h-1
)
Trial 1 0.029
Trial 2 0.033
Trial 3 0.034
Average 0.032
STDEV 0.003
95% CI 0.003
y = 0.0294x + 17.413
y = 0.0333x + 17.258
y = 0.0341x + 17.244
17.5
18.0
18.5
19.0
19.5
20.0
0 20 40 60 80
Elapsed time (h)
ln [
Cel
ls m
L-1
]
Figure G.59. Specific growth rate calculations for Trial 1 (open circles), Trial 2 (open
squares), and Trial 3 (open triangles).

369
Table G.60. BC13 growth in metal free medium following exposure to the zinc MIC.
Cells mL
-1ln (Cells mL
-1)
Elapsed Time (h) Trial 1 Trial 2 Trial 3 Average STDEV 95% CI Trial 1 Trial 2 Trial 3
0 5.07E+07 5.55E+07 5.99E+07 5.54E+07 4.62E+06 5.23E+06 17.74 17.83 17.91
12 5.15E+07 5.72E+07 5.50E+07 5.46E+07 2.87E+06 3.25E+06 17.76 17.86 17.82
24 5.50E+07 5.32E+07 5.52E+07 5.45E+07 1.10E+06 1.24E+06 17.82 17.79 17.83
36 7.52E+07 7.11E+07 6.57E+07 7.07E+07 4.77E+06 5.40E+06 18.14 18.08 18.00
48 1.12E+08 9.79E+07 1.01E+08 1.03E+08 7.36E+06 8.33E+06 18.53 18.40 18.43
60 1.39E+08 1.54E+08 1.50E+08 1.48E+08 7.51E+06 8.50E+06 18.75 18.85 18.82
72 1.98E+08 2.06E+08 2.14E+08 2.06E+08 7.81E+06 8.84E+06 19.10 19.15 19.18
84 2.32E+08 2.40E+08 2.39E+08 2.37E+08 3.98E+06 4.50E+06 19.26 19.30 19.29
96 2.60E+08 2.66E+08 2.87E+08 2.71E+08 1.42E+07 1.61E+07 19.38 19.40 19.48
108 2.51E+08 2.79E+08 2.51E+08 2.60E+08 1.61E+07 1.82E+07 19.34 19.45 19.34
120 2.37E+08 2.40E+08 2.42E+08 2.40E+08 2.27E+06 2.57E+06 19.28 19.30 19.30
17.5
18.0
18.5
19.0
19.5
0 20 40 60 80
ln [
Cel
ls m
L-1
]
Specific growth rate (h-1
)
Trial 1 0.027
Trial 2 0.029
Trial 3 0.029
Average 0.028
STDEV 0.002
95% CI 0.002
y = 0.0265x + 17.198
y = 0.029x + 17.059
y = 0.0294x + 17.04
17.5
18.0
18.5
19.0
19.5
0 20 40 60 80
Elapsed time (h)
ln [
Cel
ls m
L-1
]
Figure G.60. Specific growth rate calculations for Trial 1 (open circles), Trial 2 (open
squares), and Trial 3 (open triangles).
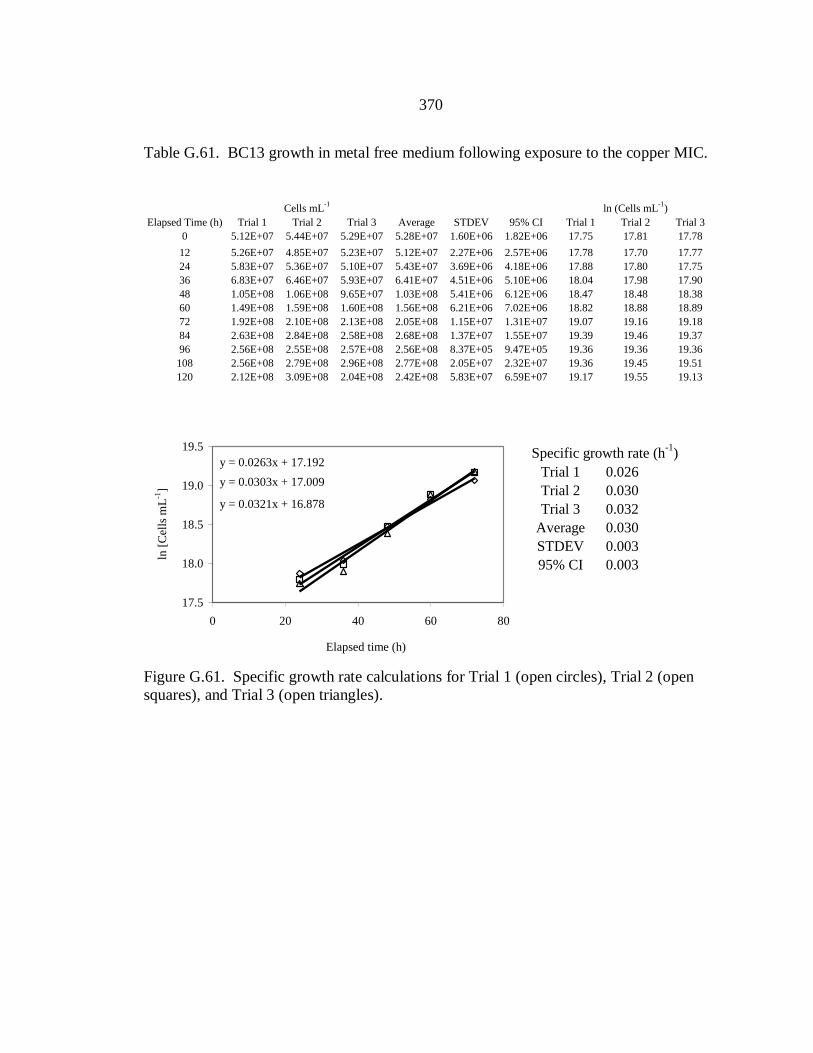
370
Table G.61. BC13 growth in metal free medium following exposure to the copper MIC.
Cells mL
-1ln (Cells mL
-1)
Elapsed Time (h) Trial 1 Trial 2 Trial 3 Average STDEV 95% CI Trial 1 Trial 2 Trial 3
0 5.12E+07 5.44E+07 5.29E+07 5.28E+07 1.60E+06 1.82E+06 17.75 17.81 17.78
12 5.26E+07 4.85E+07 5.23E+07 5.12E+07 2.27E+06 2.57E+06 17.78 17.70 17.77
24 5.83E+07 5.36E+07 5.10E+07 5.43E+07 3.69E+06 4.18E+06 17.88 17.80 17.75
36 6.83E+07 6.46E+07 5.93E+07 6.41E+07 4.51E+06 5.10E+06 18.04 17.98 17.90
48 1.05E+08 1.06E+08 9.65E+07 1.03E+08 5.41E+06 6.12E+06 18.47 18.48 18.38
60 1.49E+08 1.59E+08 1.60E+08 1.56E+08 6.21E+06 7.02E+06 18.82 18.88 18.89
72 1.92E+08 2.10E+08 2.13E+08 2.05E+08 1.15E+07 1.31E+07 19.07 19.16 19.18
84 2.63E+08 2.84E+08 2.58E+08 2.68E+08 1.37E+07 1.55E+07 19.39 19.46 19.37
96 2.56E+08 2.55E+08 2.57E+08 2.56E+08 8.37E+05 9.47E+05 19.36 19.36 19.36
108 2.56E+08 2.79E+08 2.96E+08 2.77E+08 2.05E+07 2.32E+07 19.36 19.45 19.51
120 2.12E+08 3.09E+08 2.04E+08 2.42E+08 5.83E+07 6.59E+07 19.17 19.55 19.13
17.5
18.0
18.5
19.0
19.5
0 20 40 60 80
ln [
Cel
ls m
L-1
]
Specific growth rate (h-1
)
Trial 1 0.026
Trial 2 0.030
Trial 3 0.032
Average 0.030
STDEV 0.003
95% CI 0.003
y = 0.0263x + 17.192
y = 0.0303x + 17.009
y = 0.0321x + 16.878
17.5
18.0
18.5
19.0
19.5
0 20 40 60 80
Elapsed time (h)
ln [
Cel
ls m
L-1
]
Figure G.61. Specific growth rate calculations for Trial 1 (open circles), Trial 2 (open
squares), and Trial 3 (open triangles).
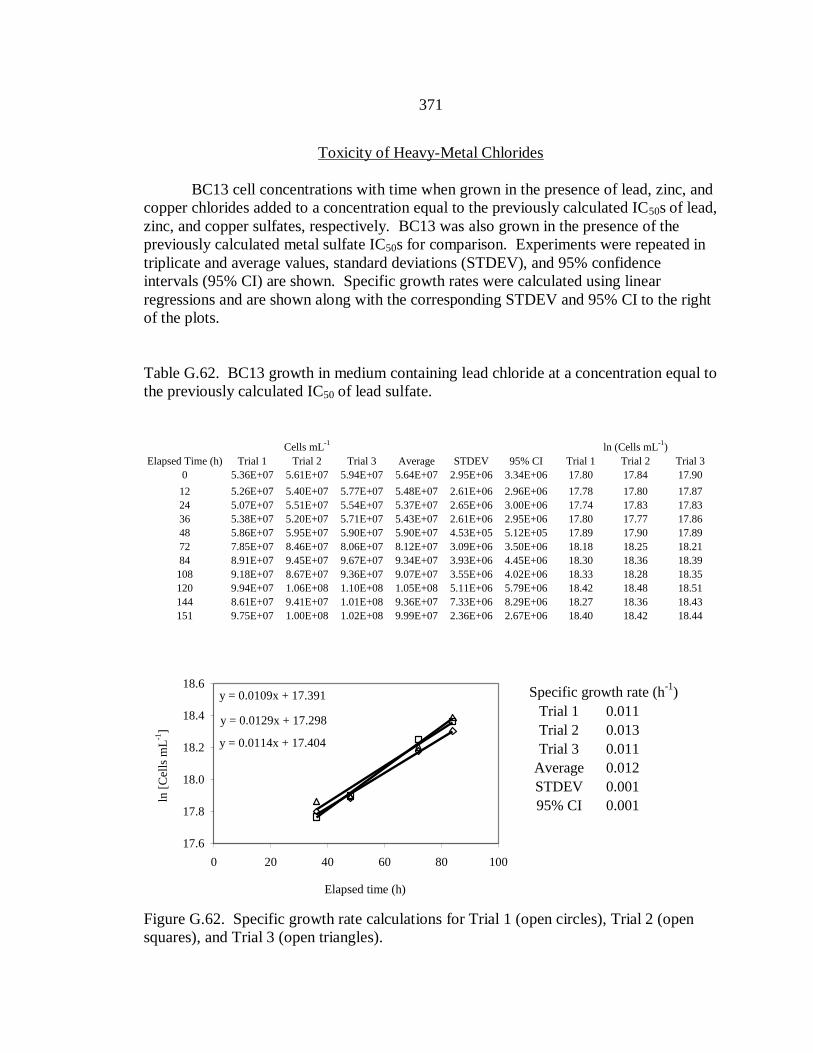
371
Toxicity of Heavy-Metal Chlorides
BC13 cell concentrations with time when grown in the presence of lead, zinc, and
copper chlorides added to a concentration equal to the previously calculated IC50s of lead,
zinc, and copper sulfates, respectively. BC13 was also grown in the presence of the
previously calculated metal sulfate IC50s for comparison. Experiments were repeated in
triplicate and average values, standard deviations (STDEV), and 95% confidence
intervals (95% CI) are shown. Specific growth rates were calculated using linear
regressions and are shown along with the corresponding STDEV and 95% CI to the right
of the plots.
Table G.62. BC13 growth in medium containing lead chloride at a concentration equal to
the previously calculated IC50 of lead sulfate.
Cells mL
-1ln (Cells mL
-1)
Elapsed Time (h) Trial 1 Trial 2 Trial 3 Average STDEV 95% CI Trial 1 Trial 2 Trial 3
0 5.36E+07 5.61E+07 5.94E+07 5.64E+07 2.95E+06 3.34E+06 17.80 17.84 17.90
12 5.26E+07 5.40E+07 5.77E+07 5.48E+07 2.61E+06 2.96E+06 17.78 17.80 17.87
24 5.07E+07 5.51E+07 5.54E+07 5.37E+07 2.65E+06 3.00E+06 17.74 17.83 17.83
36 5.38E+07 5.20E+07 5.71E+07 5.43E+07 2.61E+06 2.95E+06 17.80 17.77 17.86
48 5.86E+07 5.95E+07 5.90E+07 5.90E+07 4.53E+05 5.12E+05 17.89 17.90 17.89
72 7.85E+07 8.46E+07 8.06E+07 8.12E+07 3.09E+06 3.50E+06 18.18 18.25 18.21
84 8.91E+07 9.45E+07 9.67E+07 9.34E+07 3.93E+06 4.45E+06 18.30 18.36 18.39
108 9.18E+07 8.67E+07 9.36E+07 9.07E+07 3.55E+06 4.02E+06 18.33 18.28 18.35
120 9.94E+07 1.06E+08 1.10E+08 1.05E+08 5.11E+06 5.79E+06 18.42 18.48 18.51
144 8.61E+07 9.41E+07 1.01E+08 9.36E+07 7.33E+06 8.29E+06 18.27 18.36 18.43
151 9.75E+07 1.00E+08 1.02E+08 9.99E+07 2.36E+06 2.67E+06 18.40 18.42 18.44
Specific growth rate (h-1
)
Trial 1 0.011
Trial 2 0.013
Trial 3 0.011
Average 0.012
STDEV 0.001
95% CI 0.001
y = 0.0109x + 17.391
y = 0.0129x + 17.298
y = 0.0114x + 17.404
17.6
17.8
18.0
18.2
18.4
18.6
0 20 40 60 80 100
Elapsed time (h)
ln [
Cel
ls m
L-1
]
Figure G.62. Specific growth rate calculations for Trial 1 (open circles), Trial 2 (open
squares), and Trial 3 (open triangles).
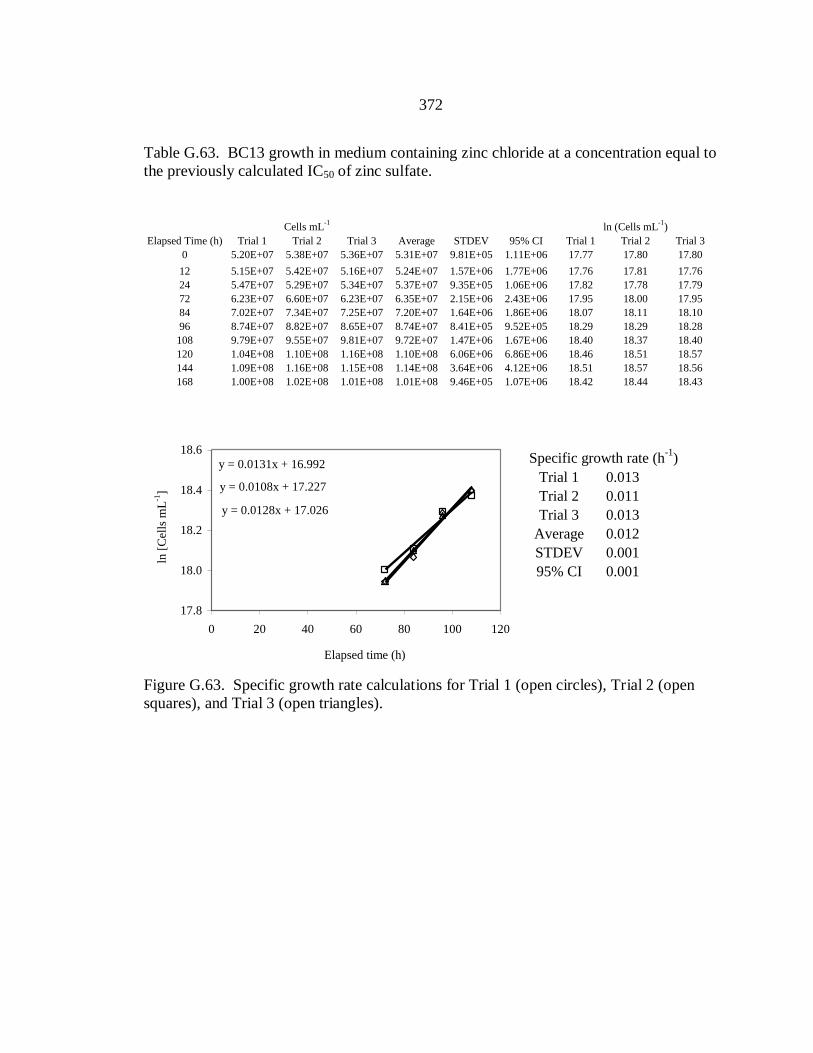
372
Table G.63. BC13 growth in medium containing zinc chloride at a concentration equal to
the previously calculated IC50 of zinc sulfate.
Cells mL
-1ln (Cells mL
-1)
Elapsed Time (h) Trial 1 Trial 2 Trial 3 Average STDEV 95% CI Trial 1 Trial 2 Trial 3
0 5.20E+07 5.38E+07 5.36E+07 5.31E+07 9.81E+05 1.11E+06 17.77 17.80 17.80
12 5.15E+07 5.42E+07 5.16E+07 5.24E+07 1.57E+06 1.77E+06 17.76 17.81 17.76
24 5.47E+07 5.29E+07 5.34E+07 5.37E+07 9.35E+05 1.06E+06 17.82 17.78 17.79
72 6.23E+07 6.60E+07 6.23E+07 6.35E+07 2.15E+06 2.43E+06 17.95 18.00 17.95
84 7.02E+07 7.34E+07 7.25E+07 7.20E+07 1.64E+06 1.86E+06 18.07 18.11 18.10
96 8.74E+07 8.82E+07 8.65E+07 8.74E+07 8.41E+05 9.52E+05 18.29 18.29 18.28
108 9.79E+07 9.55E+07 9.81E+07 9.72E+07 1.47E+06 1.67E+06 18.40 18.37 18.40
120 1.04E+08 1.10E+08 1.16E+08 1.10E+08 6.06E+06 6.86E+06 18.46 18.51 18.57
144 1.09E+08 1.16E+08 1.15E+08 1.14E+08 3.64E+06 4.12E+06 18.51 18.57 18.56
168 1.00E+08 1.02E+08 1.01E+08 1.01E+08 9.46E+05 1.07E+06 18.42 18.44 18.43 17.8
18.0
18.2
18.4
18.6
0 20 40 60 80 100 120
ln [
Cel
ls m
L-1
]
Specific growth rate (h-1
)
Trial 1 0.013
Trial 2 0.011
Trial 3 0.013
Average 0.012
STDEV 0.001
95% CI 0.001
y = 0.0131x + 16.992
y = 0.0108x + 17.227
y = 0.0128x + 17.026
17.8
18.0
18.2
18.4
18.6
0 20 40 60 80 100 120
Elapsed time (h)
ln [
Cel
ls m
L-1
]
Figure G.63. Specific growth rate calculations for Trial 1 (open circles), Trial 2 (open
squares), and Trial 3 (open triangles).
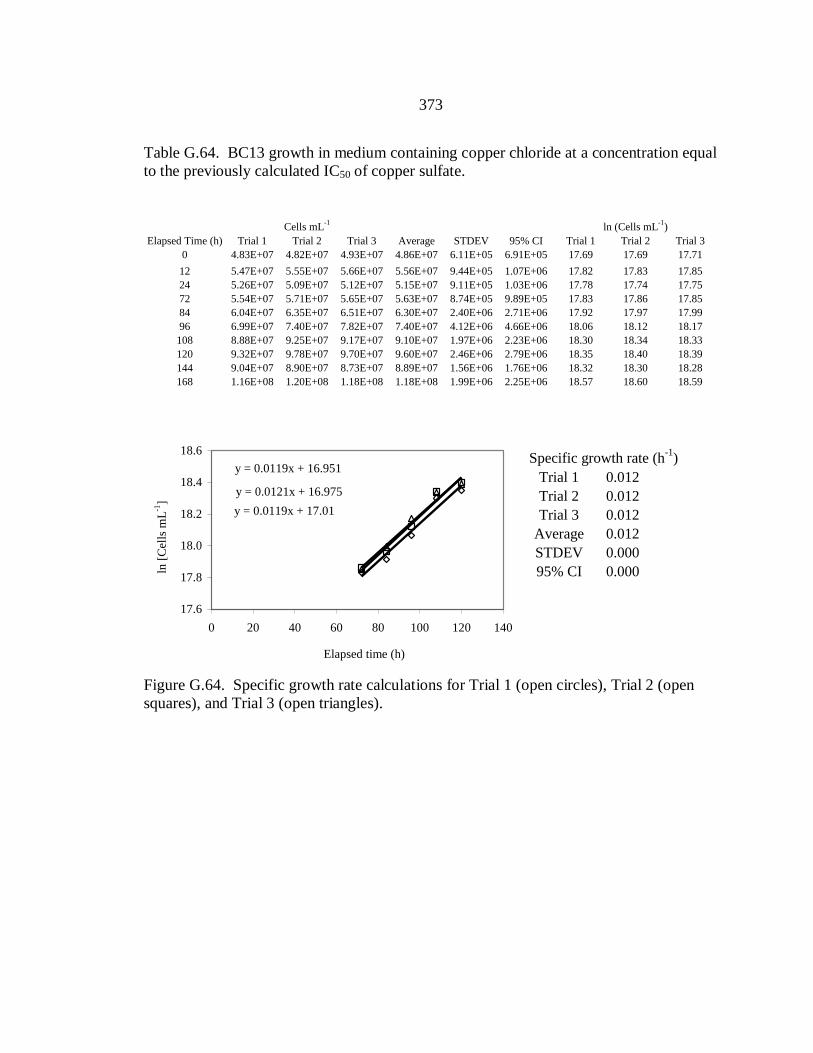
373
Table G.64. BC13 growth in medium containing copper chloride at a concentration equal
to the previously calculated IC50 of copper sulfate.
Cells mL
-1ln (Cells mL
-1)
Elapsed Time (h) Trial 1 Trial 2 Trial 3 Average STDEV 95% CI Trial 1 Trial 2 Trial 3
0 4.83E+07 4.82E+07 4.93E+07 4.86E+07 6.11E+05 6.91E+05 17.69 17.69 17.71
12 5.47E+07 5.55E+07 5.66E+07 5.56E+07 9.44E+05 1.07E+06 17.82 17.83 17.85
24 5.26E+07 5.09E+07 5.12E+07 5.15E+07 9.11E+05 1.03E+06 17.78 17.74 17.75
72 5.54E+07 5.71E+07 5.65E+07 5.63E+07 8.74E+05 9.89E+05 17.83 17.86 17.85
84 6.04E+07 6.35E+07 6.51E+07 6.30E+07 2.40E+06 2.71E+06 17.92 17.97 17.99
96 6.99E+07 7.40E+07 7.82E+07 7.40E+07 4.12E+06 4.66E+06 18.06 18.12 18.17
108 8.88E+07 9.25E+07 9.17E+07 9.10E+07 1.97E+06 2.23E+06 18.30 18.34 18.33
120 9.32E+07 9.78E+07 9.70E+07 9.60E+07 2.46E+06 2.79E+06 18.35 18.40 18.39
144 9.04E+07 8.90E+07 8.73E+07 8.89E+07 1.56E+06 1.76E+06 18.32 18.30 18.28
168 1.16E+08 1.20E+08 1.18E+08 1.18E+08 1.99E+06 2.25E+06 18.57 18.60 18.59 17.6
17.8
18.0
18.2
18.4
18.6
0 20 40 60 80 100 120 140
ln [
Cel
ls m
L-1
]
Specific growth rate (h-1
)
Trial 1 0.012
Trial 2 0.012
Trial 3 0.012
Average 0.012
STDEV 0.000
95% CI 0.000
y = 0.0119x + 16.951
y = 0.0121x + 16.975
y = 0.0119x + 17.01
17.6
17.8
18.0
18.2
18.4
18.6
0 20 40 60 80 100 120 140
Elapsed time (h)
ln [
Cel
ls m
L-1
]
Figure G.64. Specific growth rate calculations for Trial 1 (open circles), Trial 2 (open
squares), and Trial 3 (open triangles).

374
Toxicity of Heavy-Metal Sulfates at Previously Calculated IC50s
Table G.65. BC13 growth in medium containing lead sulfate at a concentration equal to
the previously calculated IC50.
Cells mL
-1ln (Cells mL
-1)
Elapsed Time (h) Trial 1 Trial 2 Trial 3 Average STDEV 95% CI Trial 1 Trial 2 Trial 3
0 5.12E+07 5.07E+07 5.26E+07 5.15E+07 9.65E+05 1.09E+06 17.75 17.74 17.78
12 5.42E+07 5.67E+07 5.99E+07 5.69E+07 2.83E+06 3.20E+06 17.81 17.85 17.91
24 7.22E+07 7.58E+07 7.13E+07 7.31E+07 2.35E+06 2.66E+06 18.10 18.14 18.08
36 9.73E+07 9.29E+07 9.50E+07 9.51E+07 2.19E+06 2.48E+06 18.39 18.35 18.37
48 1.31E+08 1.25E+08 1.18E+08 1.25E+08 6.34E+06 7.17E+06 18.69 18.65 18.59
60 2.19E+08 2.12E+08 2.01E+08 2.11E+08 9.10E+06 1.03E+07 19.20 19.17 19.12
72 3.28E+08 3.16E+08 3.00E+08 3.15E+08 1.42E+07 1.61E+07 19.61 19.57 19.52
84 3.27E+08 3.10E+08 3.07E+08 3.15E+08 1.09E+07 1.23E+07 19.61 19.55 19.54
96 3.13E+08 3.15E+08 3.35E+08 3.21E+08 1.19E+07 1.35E+07 19.56 19.57 19.63
108 3.16E+08 3.31E+08 3.49E+08 3.32E+08 1.66E+07 1.88E+07 19.57 19.62 19.67
120 3.08E+08 3.03E+08 3.03E+08 3.05E+08 2.89E+06 3.27E+06 19.55 19.53 19.53
Specific growth rate (h-1
)
Trial 1 0.030
Trial 2 0.029
Trial 3 0.027
Average 0.029
STDEV 0.002
95% CI 0.002
y = 0.0301x + 17.371
y = 0.0285x + 17.425
y = 0.0271x + 17.459
17.5
18.0
18.5
19.0
19.5
20.0
0 20 40 60 80
Elapsed time (h)
ln [
Cel
ls m
L-1
]
Figure G.65. Specific growth rate calculations for Trial 1 (open circles), Trial 2 (open
squares), and Trial 3 (open triangles).
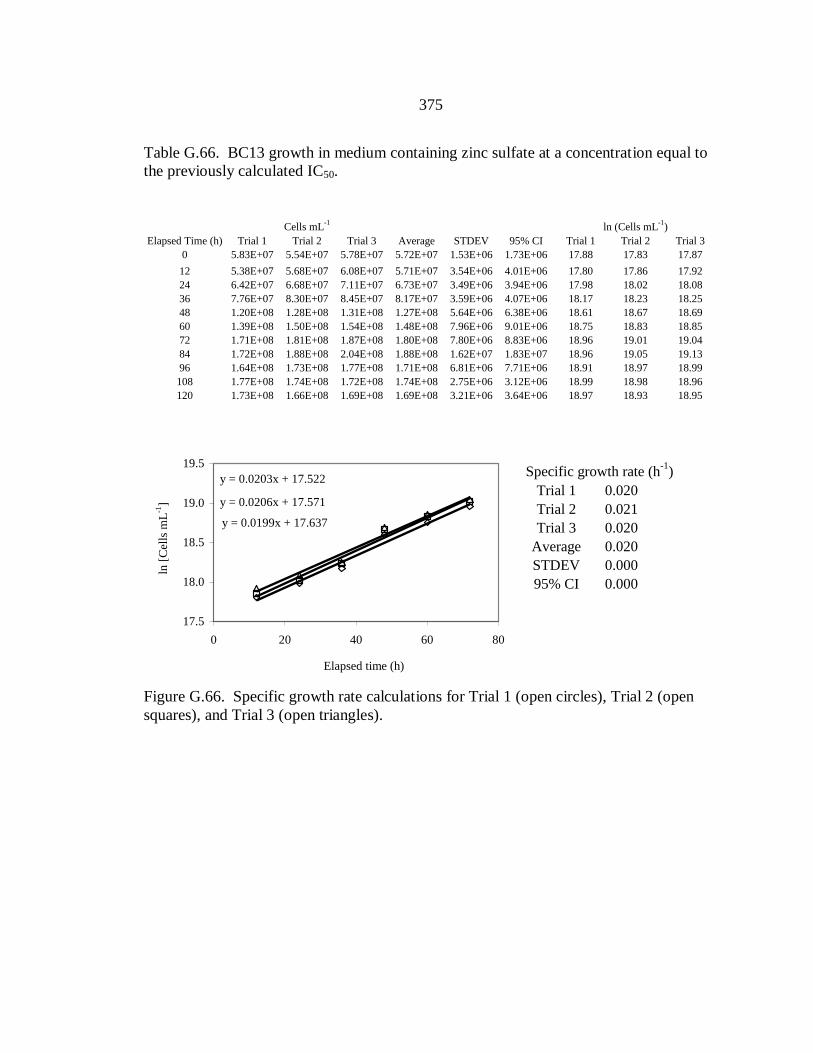
375
Table G.66. BC13 growth in medium containing zinc sulfate at a concentration equal to
the previously calculated IC50.
Cells mL
-1ln (Cells mL
-1)
Elapsed Time (h) Trial 1 Trial 2 Trial 3 Average STDEV 95% CI Trial 1 Trial 2 Trial 3
0 5.83E+07 5.54E+07 5.78E+07 5.72E+07 1.53E+06 1.73E+06 17.88 17.83 17.87
12 5.38E+07 5.68E+07 6.08E+07 5.71E+07 3.54E+06 4.01E+06 17.80 17.86 17.92
24 6.42E+07 6.68E+07 7.11E+07 6.73E+07 3.49E+06 3.94E+06 17.98 18.02 18.08
36 7.76E+07 8.30E+07 8.45E+07 8.17E+07 3.59E+06 4.07E+06 18.17 18.23 18.25
48 1.20E+08 1.28E+08 1.31E+08 1.27E+08 5.64E+06 6.38E+06 18.61 18.67 18.69
60 1.39E+08 1.50E+08 1.54E+08 1.48E+08 7.96E+06 9.01E+06 18.75 18.83 18.85
72 1.71E+08 1.81E+08 1.87E+08 1.80E+08 7.80E+06 8.83E+06 18.96 19.01 19.04
84 1.72E+08 1.88E+08 2.04E+08 1.88E+08 1.62E+07 1.83E+07 18.96 19.05 19.13
96 1.64E+08 1.73E+08 1.77E+08 1.71E+08 6.81E+06 7.71E+06 18.91 18.97 18.99
108 1.77E+08 1.74E+08 1.72E+08 1.74E+08 2.75E+06 3.12E+06 18.99 18.98 18.96
120 1.73E+08 1.66E+08 1.69E+08 1.69E+08 3.21E+06 3.64E+06 18.97 18.93 18.95
Specific growth rate (h-1
)
Trial 1 0.020
Trial 2 0.021
Trial 3 0.020
Average 0.020
STDEV 0.000
95% CI 0.000
y = 0.0203x + 17.522
y = 0.0206x + 17.571
y = 0.0199x + 17.637
17.5
18.0
18.5
19.0
19.5
0 20 40 60 80
Elapsed time (h)
ln [
Cel
ls m
L-1
]
Figure G.66. Specific growth rate calculations for Trial 1 (open circles), Trial 2 (open
squares), and Trial 3 (open triangles).
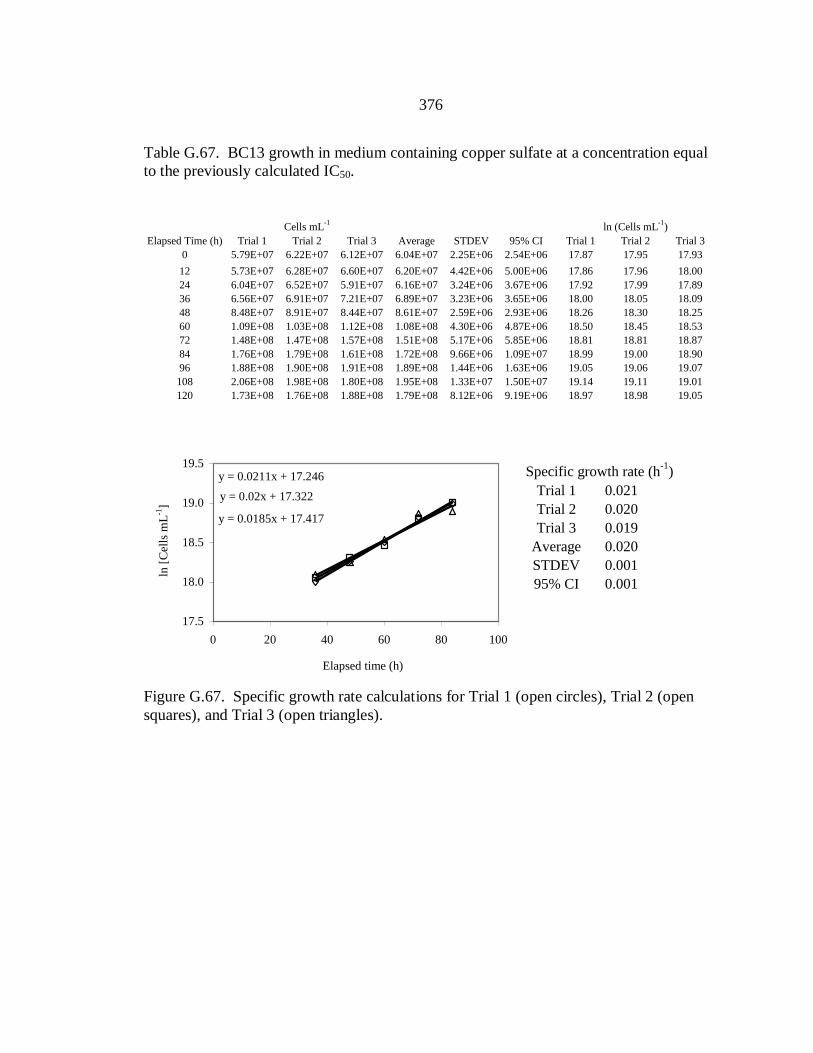
376
Table G.67. BC13 growth in medium containing copper sulfate at a concentration equal
to the previously calculated IC50.
Cells mL
-1ln (Cells mL
-1)
Elapsed Time (h) Trial 1 Trial 2 Trial 3 Average STDEV 95% CI Trial 1 Trial 2 Trial 3
0 5.79E+07 6.22E+07 6.12E+07 6.04E+07 2.25E+06 2.54E+06 17.87 17.95 17.93
12 5.73E+07 6.28E+07 6.60E+07 6.20E+07 4.42E+06 5.00E+06 17.86 17.96 18.00
24 6.04E+07 6.52E+07 5.91E+07 6.16E+07 3.24E+06 3.67E+06 17.92 17.99 17.89
36 6.56E+07 6.91E+07 7.21E+07 6.89E+07 3.23E+06 3.65E+06 18.00 18.05 18.09
48 8.48E+07 8.91E+07 8.44E+07 8.61E+07 2.59E+06 2.93E+06 18.26 18.30 18.25
60 1.09E+08 1.03E+08 1.12E+08 1.08E+08 4.30E+06 4.87E+06 18.50 18.45 18.53
72 1.48E+08 1.47E+08 1.57E+08 1.51E+08 5.17E+06 5.85E+06 18.81 18.81 18.87
84 1.76E+08 1.79E+08 1.61E+08 1.72E+08 9.66E+06 1.09E+07 18.99 19.00 18.90
96 1.88E+08 1.90E+08 1.91E+08 1.89E+08 1.44E+06 1.63E+06 19.05 19.06 19.07
108 2.06E+08 1.98E+08 1.80E+08 1.95E+08 1.33E+07 1.50E+07 19.14 19.11 19.01
120 1.73E+08 1.76E+08 1.88E+08 1.79E+08 8.12E+06 9.19E+06 18.97 18.98 19.05
Specific growth rate (h-1
)
Trial 1 0.021
Trial 2 0.020
Trial 3 0.019
Average 0.020
STDEV 0.001
95% CI 0.001
y = 0.0211x + 17.246
y = 0.02x + 17.322
y = 0.0185x + 17.417
17.5
18.0
18.5
19.0
19.5
0 20 40 60 80 100
Elapsed time (h)
ln [
Cel
ls m
L-1
]
Figure G.67. Specific growth rate calculations for Trial 1 (open circles), Trial 2 (open
squares), and Trial 3 (open triangles).

377
Toxicity of Metal Sulfates + Sodium Chloride
BC13 cell concentrations with time when grown in the presence of lead, zinc, and
copper sulfate IC50s with sodium chloride added to a concentration equivalent to that
which would be present if metal chlorides were added to the IC50s of lead, zinc, and
copper sulfates, respectively. Experiments were repeated in triplicate and average values,
standard deviations (STDEV), and 95% confidence intervals (95% CI) are shown.
Specific growth rates were calculated using linear regressions and are shown along with
the corresponding STDEV and 95% CI to the right of the plots.
Table G.68. BC13 growth in medium containing lead sulfate + sodium chloride.
Cells mL
-1ln (Cells mL
-1)
Elapsed Time (h) Trial 1 Trial 2 Trial 3 Average STDEV 95% CI Trial 1 Trial 2 Trial 3
0 5.60E+07 5.64E+07 5.32E+07 5.52E+07 1.73E+06 1.96E+06 17.84 17.85 17.79
12 5.10E+07 4.82E+07 4.55E+07 4.82E+07 2.75E+06 3.11E+06 17.75 17.69 17.63
24 5.23E+07 5.18E+07 5.31E+07 5.24E+07 6.84E+05 7.74E+05 17.77 17.76 17.79
36 5.33E+07 5.07E+07 5.30E+07 5.23E+07 1.38E+06 1.57E+06 17.79 17.74 17.79
48 6.10E+07 6.22E+07 6.03E+07 6.12E+07 9.99E+05 1.13E+06 17.93 17.95 17.91
72 8.27E+07 8.29E+07 8.07E+07 8.21E+07 1.21E+06 1.36E+06 18.23 18.23 18.21
84 9.25E+07 9.71E+07 9.62E+07 9.53E+07 2.48E+06 2.80E+06 18.34 18.39 18.38
108 8.79E+07 8.46E+07 8.44E+07 8.56E+07 1.95E+06 2.20E+06 18.29 18.25 18.25
120 1.05E+08 1.01E+08 1.05E+08 1.04E+08 2.24E+06 2.54E+06 18.47 18.43 18.47
144 8.36E+07 8.09E+07 8.23E+07 8.23E+07 1.36E+06 1.54E+06 18.24 18.21 18.23
151 9.76E+07 1.00E+08 1.02E+08 9.99E+07 2.27E+06 2.57E+06 18.40 18.42 18.44
Specific growth rate (h-1
)
Trial 1 0.012
Trial 2 0.013
Trial 3 0.012
Average 0.012
STDEV 0.001
95% CI 0.001
y = 0.0123x + 17.344
y = 0.0134x + 17.278
y = 0.0117x + 17.358
17.6
17.8
18.0
18.2
18.4
0 20 40 60 80
Elapsed time (h)
ln [
Cel
ls m
L-1
]
Figure G.68. Specific growth rate calculations for Trial 1 (open circles), Trial 2 (open
squares), and Trial 3 (open triangles).
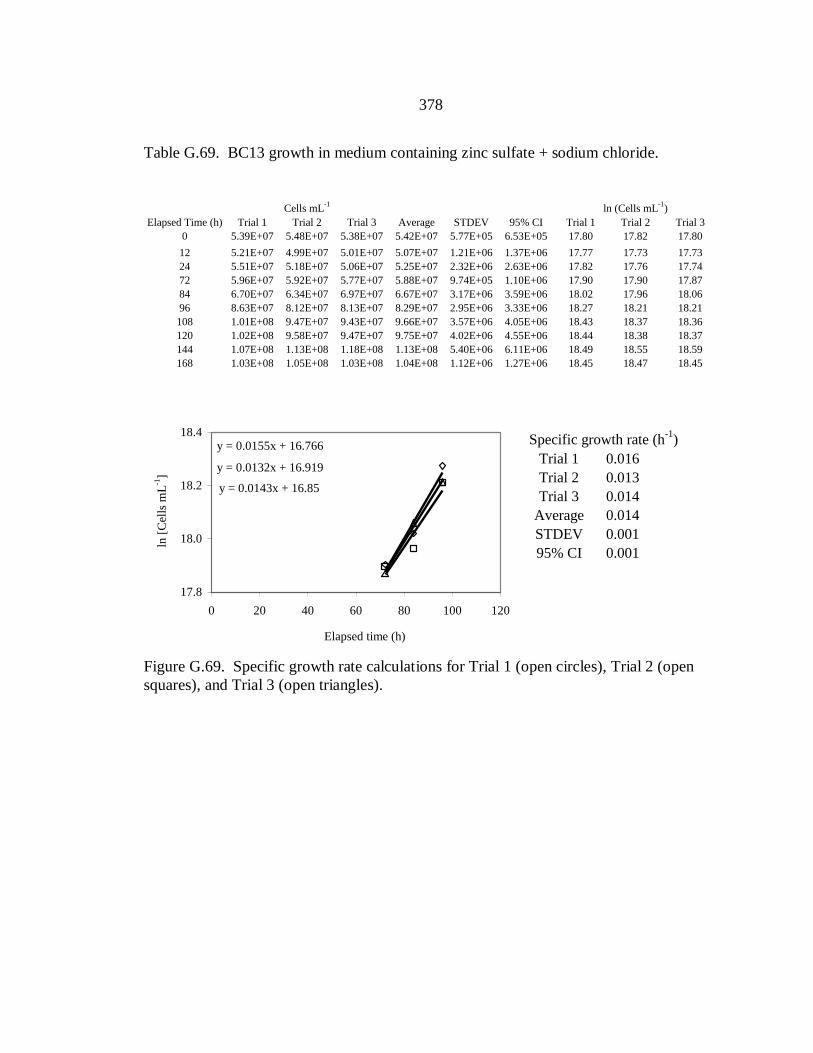
378
Table G.69. BC13 growth in medium containing zinc sulfate + sodium chloride.
Cells mL
-1ln (Cells mL
-1)
Elapsed Time (h) Trial 1 Trial 2 Trial 3 Average STDEV 95% CI Trial 1 Trial 2 Trial 3
0 5.39E+07 5.48E+07 5.38E+07 5.42E+07 5.77E+05 6.53E+05 17.80 17.82 17.80
12 5.21E+07 4.99E+07 5.01E+07 5.07E+07 1.21E+06 1.37E+06 17.77 17.73 17.73
24 5.51E+07 5.18E+07 5.06E+07 5.25E+07 2.32E+06 2.63E+06 17.82 17.76 17.74
72 5.96E+07 5.92E+07 5.77E+07 5.88E+07 9.74E+05 1.10E+06 17.90 17.90 17.87
84 6.70E+07 6.34E+07 6.97E+07 6.67E+07 3.17E+06 3.59E+06 18.02 17.96 18.06
96 8.63E+07 8.12E+07 8.13E+07 8.29E+07 2.95E+06 3.33E+06 18.27 18.21 18.21
108 1.01E+08 9.47E+07 9.43E+07 9.66E+07 3.57E+06 4.05E+06 18.43 18.37 18.36
120 1.02E+08 9.58E+07 9.47E+07 9.75E+07 4.02E+06 4.55E+06 18.44 18.38 18.37
144 1.07E+08 1.13E+08 1.18E+08 1.13E+08 5.40E+06 6.11E+06 18.49 18.55 18.59
168 1.03E+08 1.05E+08 1.03E+08 1.04E+08 1.12E+06 1.27E+06 18.45 18.47 18.45 17.8
18.0
18.2
18.4
0 20 40 60 80 100 120
ln [
Cel
ls m
L-1
]
Specific growth rate (h-1
)
Trial 1 0.016
Trial 2 0.013
Trial 3 0.014
Average 0.014
STDEV 0.001
95% CI 0.001
y = 0.0155x + 16.766
y = 0.0132x + 16.919
y = 0.0143x + 16.85
17.8
18.0
18.2
18.4
0 20 40 60 80 100 120
Elapsed time (h)
ln [
Cel
ls m
L-1
]
Figure G.69. Specific growth rate calculations for Trial 1 (open circles), Trial 2 (open
squares), and Trial 3 (open triangles).

379
Table G.70. BC13 growth in medium containing copper sulfate + sodium chloride.
Cells mL
-1ln (Cells mL
-1)
Elapsed Time (h) Trial 1 Trial 2 Trial 3 Average STDEV 95% CI Trial 1 Trial 2 Trial 3
0 4.95E+07 4.82E+07 4.93E+07 4.86E+07 6.11E+05 6.91E+05 17.69 17.69 17.71
12 5.72E+07 5.55E+07 5.66E+07 5.56E+07 9.44E+05 1.07E+06 17.82 17.83 17.85
24 5.10E+07 5.09E+07 5.12E+07 5.15E+07 9.11E+05 1.03E+06 17.78 17.74 17.75
72 5.21E+07 5.71E+07 5.65E+07 5.63E+07 8.74E+05 9.89E+05 17.83 17.86 17.85
84 5.68E+07 6.35E+07 6.51E+07 6.30E+07 2.40E+06 2.71E+06 17.92 17.97 17.99
96 7.25E+07 7.40E+07 7.82E+07 7.40E+07 4.12E+06 4.66E+06 18.06 18.12 18.17
108 8.53E+07 9.25E+07 9.17E+07 9.10E+07 1.97E+06 2.23E+06 18.30 18.34 18.33
120 9.67E+07 9.78E+07 9.70E+07 9.60E+07 2.46E+06 2.79E+06 18.35 18.40 18.39
144 9.00E+07 8.90E+07 8.73E+07 8.89E+07 1.56E+06 1.76E+06 18.32 18.30 18.28
168 1.23E+08 1.20E+08 1.18E+08 1.18E+08 1.99E+06 2.25E+06 18.57 18.60 18.59 17.6
17.8
18.0
18.2
18.4
0 20 40 60 80 100 120
ln [
Cel
ls m
L-1
]
Specific growth rate (h-1
)
Trial 1 0.013
Trial 2 0.013
Trial 3 0.014
Average 0.013
STDEV 0.000
95% CI 0.000
y = 0.013x + 16.855
y = 0.0133x + 16.871
y = 0.0136x + 16.861
17.6
17.8
18.0
18.2
18.4
0 20 40 60 80 100 120
Elapsed time (h)
ln [
Cel
ls m
L-1
]
Figure G.70. Specific growth rate calculations for Trial 1 (open circles), Trial 2 (open
squares), and Trial 3 (open triangles).
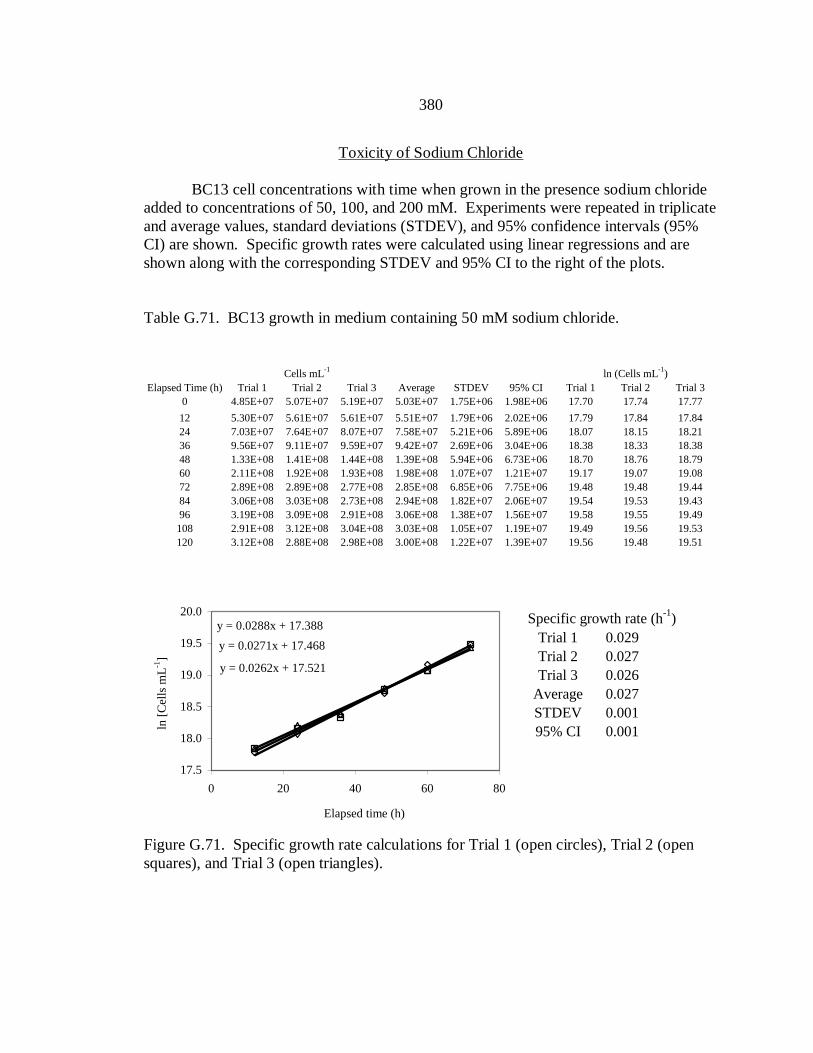
380
Toxicity of Sodium Chloride
BC13 cell concentrations with time when grown in the presence sodium chloride
added to concentrations of 50, 100, and 200 mM. Experiments were repeated in triplicate
and average values, standard deviations (STDEV), and 95% confidence intervals (95%
CI) are shown. Specific growth rates were calculated using linear regressions and are
shown along with the corresponding STDEV and 95% CI to the right of the plots.
Table G.71. BC13 growth in medium containing 50 mM sodium chloride.
Cells mL
-1ln (Cells mL
-1)
Elapsed Time (h) Trial 1 Trial 2 Trial 3 Average STDEV 95% CI Trial 1 Trial 2 Trial 3
0 4.85E+07 5.07E+07 5.19E+07 5.03E+07 1.75E+06 1.98E+06 17.70 17.74 17.77
12 5.30E+07 5.61E+07 5.61E+07 5.51E+07 1.79E+06 2.02E+06 17.79 17.84 17.84
24 7.03E+07 7.64E+07 8.07E+07 7.58E+07 5.21E+06 5.89E+06 18.07 18.15 18.21
36 9.56E+07 9.11E+07 9.59E+07 9.42E+07 2.69E+06 3.04E+06 18.38 18.33 18.38
48 1.33E+08 1.41E+08 1.44E+08 1.39E+08 5.94E+06 6.73E+06 18.70 18.76 18.79
60 2.11E+08 1.92E+08 1.93E+08 1.98E+08 1.07E+07 1.21E+07 19.17 19.07 19.08
72 2.89E+08 2.89E+08 2.77E+08 2.85E+08 6.85E+06 7.75E+06 19.48 19.48 19.44
84 3.06E+08 3.03E+08 2.73E+08 2.94E+08 1.82E+07 2.06E+07 19.54 19.53 19.43
96 3.19E+08 3.09E+08 2.91E+08 3.06E+08 1.38E+07 1.56E+07 19.58 19.55 19.49
108 2.91E+08 3.12E+08 3.04E+08 3.03E+08 1.05E+07 1.19E+07 19.49 19.56 19.53
120 3.12E+08 2.88E+08 2.98E+08 3.00E+08 1.22E+07 1.39E+07 19.56 19.48 19.51
17.5
18.0
18.5
19.0
19.5
20.0
0 20 40 60 80
ln [
Cel
ls m
L-1
]
Specific growth rate (h-1
)
Trial 1 0.029
Trial 2 0.027
Trial 3 0.026
Average 0.027
STDEV 0.001
95% CI 0.001
y = 0.0288x + 17.388
y = 0.0271x + 17.468
y = 0.0262x + 17.521
17.5
18.0
18.5
19.0
19.5
20.0
0 20 40 60 80
Elapsed time (h)
ln [
Cel
ls m
L-1
]
Figure G.71. Specific growth rate calculations for Trial 1 (open circles), Trial 2 (open
squares), and Trial 3 (open triangles).
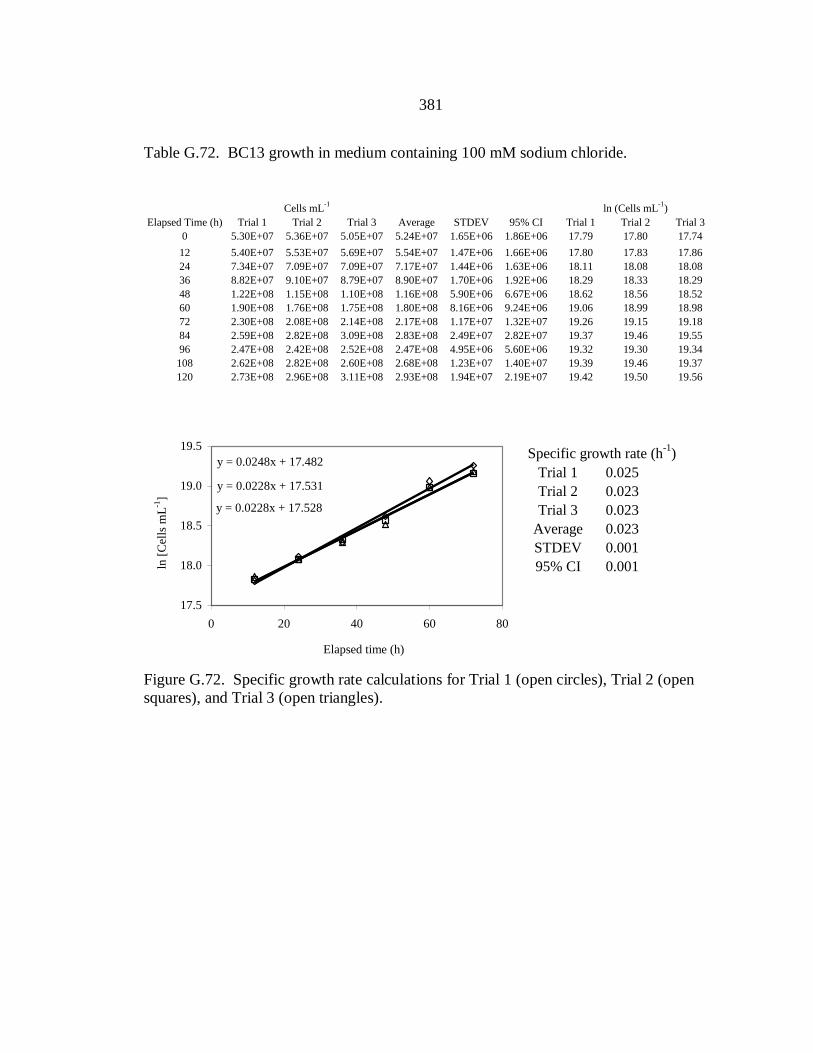
381
Table G.72. BC13 growth in medium containing 100 mM sodium chloride.
Cells mL
-1ln (Cells mL
-1)
Elapsed Time (h) Trial 1 Trial 2 Trial 3 Average STDEV 95% CI Trial 1 Trial 2 Trial 3
0 5.30E+07 5.36E+07 5.05E+07 5.24E+07 1.65E+06 1.86E+06 17.79 17.80 17.74
12 5.40E+07 5.53E+07 5.69E+07 5.54E+07 1.47E+06 1.66E+06 17.80 17.83 17.86
24 7.34E+07 7.09E+07 7.09E+07 7.17E+07 1.44E+06 1.63E+06 18.11 18.08 18.08
36 8.82E+07 9.10E+07 8.79E+07 8.90E+07 1.70E+06 1.92E+06 18.29 18.33 18.29
48 1.22E+08 1.15E+08 1.10E+08 1.16E+08 5.90E+06 6.67E+06 18.62 18.56 18.52
60 1.90E+08 1.76E+08 1.75E+08 1.80E+08 8.16E+06 9.24E+06 19.06 18.99 18.98
72 2.30E+08 2.08E+08 2.14E+08 2.17E+08 1.17E+07 1.32E+07 19.26 19.15 19.18
84 2.59E+08 2.82E+08 3.09E+08 2.83E+08 2.49E+07 2.82E+07 19.37 19.46 19.55
96 2.47E+08 2.42E+08 2.52E+08 2.47E+08 4.95E+06 5.60E+06 19.32 19.30 19.34
108 2.62E+08 2.82E+08 2.60E+08 2.68E+08 1.23E+07 1.40E+07 19.39 19.46 19.37
120 2.73E+08 2.96E+08 3.11E+08 2.93E+08 1.94E+07 2.19E+07 19.42 19.50 19.56
17.5
18.0
18.5
19.0
19.5
0 20 40 60 80
ln [
Cel
ls m
L-1
]
Specific growth rate (h-1
)
Trial 1 0.025
Trial 2 0.023
Trial 3 0.023
Average 0.023
STDEV 0.001
95% CI 0.001
y = 0.0248x + 17.482
y = 0.0228x + 17.531
y = 0.0228x + 17.528
17.5
18.0
18.5
19.0
19.5
0 20 40 60 80
Elapsed time (h)
ln [
Cel
ls m
L-1
]
Figure G.72. Specific growth rate calculations for Trial 1 (open circles), Trial 2 (open
squares), and Trial 3 (open triangles).

382
Table G.73. BC13 growth in medium containing 200 mM sodium chloride.
Cells mL
-1ln (Cells mL
-1)
Elapsed Time (h) Trial 1 Trial 2 Trial 3 Average STDEV 95% CI Trial 1 Trial 2 Trial 3
0 5.00E+07 5.48E+07 5.79E+07 5.42E+07 4.01E+06 4.54E+06 17.73 17.82 17.87
12 5.19E+07 5.07E+07 5.49E+07 5.25E+07 2.18E+06 2.46E+06 17.76 17.74 17.82
24 7.39E+07 6.67E+07 6.69E+07 6.92E+07 4.09E+06 4.63E+06 18.12 18.02 18.02
36 9.47E+07 9.80E+07 1.02E+08 9.83E+07 3.70E+06 4.19E+06 18.37 18.40 18.44
48 1.30E+08 1.31E+08 1.30E+08 1.30E+08 1.03E+06 1.16E+06 18.68 18.69 18.68
60 1.54E+08 1.43E+08 1.55E+08 1.51E+08 6.73E+06 7.62E+06 18.85 18.78 18.86
72 1.94E+08 2.13E+08 2.02E+08 2.03E+08 9.13E+06 1.03E+07 19.09 19.18 19.12
84 2.40E+08 2.52E+08 2.50E+08 2.47E+08 6.41E+06 7.25E+06 19.30 19.34 19.34
96 2.40E+08 2.29E+08 2.34E+08 2.34E+08 5.60E+06 6.33E+06 19.30 19.25 19.27
108 2.29E+08 2.38E+08 2.16E+08 2.28E+08 1.07E+07 1.22E+07 19.25 19.29 19.19
120 2.13E+08 2.05E+08 2.23E+08 2.13E+08 9.10E+06 1.03E+07 19.18 19.14 19.22
17.5
18.0
18.5
19.0
19.5
0 20 40 60 80 100
ln [
Cel
ls m
L-1
]
Specific growth rate (h-1
)
Trial 1 0.020
Trial 2 0.022
Trial 3 0.021
Average 0.021
STDEV 0.001
95% CI 0.001
y = 0.0196x + 17.677
y = 0.0215x + 17.572
y = 0.021x + 17.609
17.5
18.0
18.5
19.0
19.5
0 20 40 60 80 100
Elapsed time (h)
ln [
Cel
ls m
L-1
]
Figure G.73. Specific growth rate calculations for Trial 1 (open circles), Trial 2 (open
squares), and Trial 3 (open triangles).

383
Combined Toxicity of Heavy-Metal Sulfates and Chloride
BC13 cell concentrations with time when grown in the presence lead, zinc, and
copper sulfates (at either the 0.5 x IC50 or 1.0 x IC50) mixed with sodium chloride added
to concentrations of 50, 100, and 200 mM. Experiments were repeated in triplicate and
average values, standard deviations (STDEV), and 95% confidence intervals (95% CI)
are shown. Specific growth rates were calculated using linear regressions and are shown
along with the corresponding STDEV and 95% CI to the right of the plots.
0.5 x IC50 Lead Sulfate + Chloride
Table G.74. BC13 growth in medium containing 0.5 x IC50 lead sulfate and 50 mM
sodium chloride.
Cells mL
-1ln (Cells mL
-1)
Elapsed Time (h) Trial 1 Trial 2 Trial 3 Average STDEV 95% CI Trial 1 Trial 2 Trial 3
0 5.70E+07 5.62E+07 5.72E+07 5.68E+07 5.45E+05 6.17E+05 17.86 17.84 17.86
12 5.78E+07 5.76E+07 5.32E+07 5.62E+07 2.63E+06 2.98E+06 17.87 17.87 17.79
24 6.42E+07 6.01E+07 5.73E+07 6.05E+07 3.46E+06 3.92E+06 17.98 17.91 17.86
36 8.97E+07 9.60E+07 9.08E+07 9.22E+07 3.40E+06 3.84E+06 18.31 18.38 18.32
48 1.04E+08 9.67E+07 1.00E+08 1.00E+08 3.81E+06 4.31E+06 18.46 18.39 18.42
60 1.38E+08 1.28E+08 1.22E+08 1.30E+08 8.34E+06 9.43E+06 18.75 18.67 18.62
72 1.58E+08 1.72E+08 1.65E+08 1.65E+08 7.29E+06 8.24E+06 18.88 18.96 18.92
84 1.99E+08 1.95E+08 1.85E+08 1.93E+08 7.34E+06 8.31E+06 19.11 19.09 19.04
96 1.66E+08 1.56E+08 1.61E+08 1.61E+08 4.99E+06 5.64E+06 18.93 18.87 18.90
108 1.80E+08 1.66E+08 1.64E+08 1.70E+08 8.77E+06 9.92E+06 19.01 18.93 18.92
120 1.74E+08 1.70E+08 1.52E+08 1.65E+08 1.19E+07 1.35E+07 18.97 18.95 18.8417.5
18.0
18.5
19.0
19.5
0 20 40 60 80 100
ln [
Cel
ls m
L-1
]
Specific growth rate (h-1
)
Trial 1 0.018
Trial 2 0.019
Trial 3 0.019
Average 0.019
STDEV 0.000
95% CI 0.000
y = 0.0182x + 17.597
y = 0.0189x + 17.548
y = 0.0187x + 17.521
17.5
18.0
18.5
19.0
19.5
0 20 40 60 80 100
Elapsed time (h)
ln [
Cel
ls m
L-1
]
Figure G.74. Specific growth rate calculations for Trial 1 (open circles), Trial 2 (open
squares), and Trial 3 (open triangles).
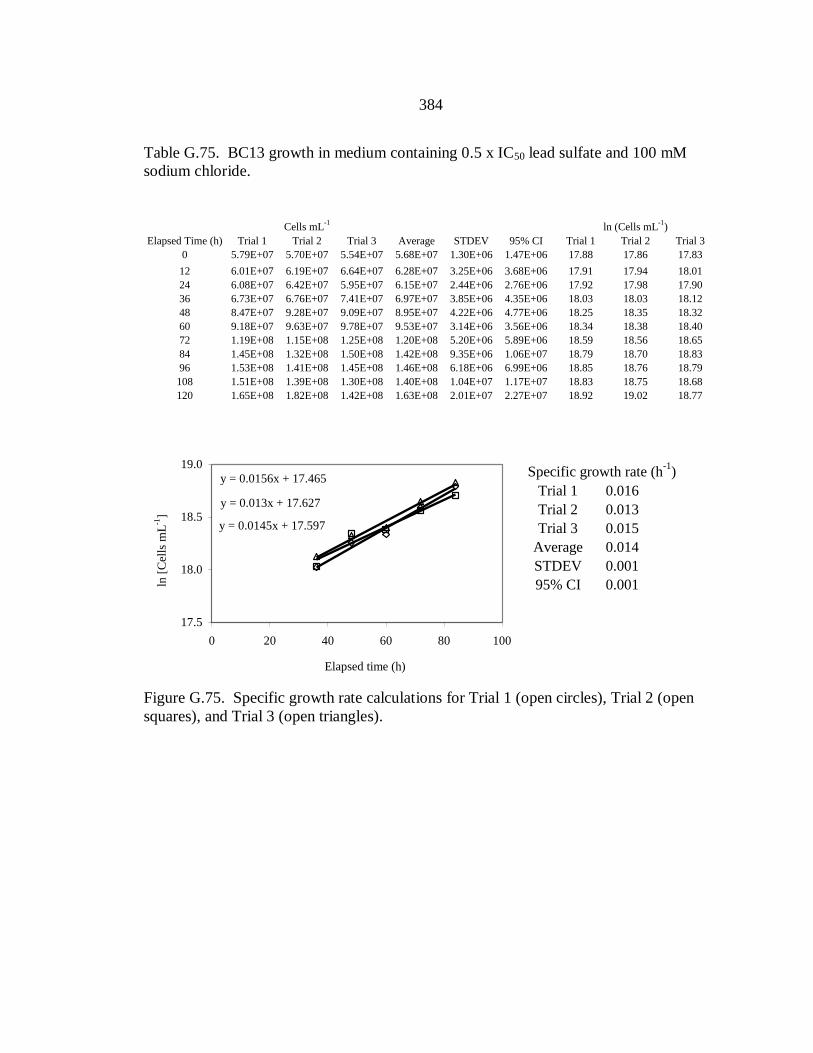
384
Table G.75. BC13 growth in medium containing 0.5 x IC50 lead sulfate and 100 mM
sodium chloride.
Cells mL
-1ln (Cells mL
-1)
Elapsed Time (h) Trial 1 Trial 2 Trial 3 Average STDEV 95% CI Trial 1 Trial 2 Trial 3
0 5.79E+07 5.70E+07 5.54E+07 5.68E+07 1.30E+06 1.47E+06 17.88 17.86 17.83
12 6.01E+07 6.19E+07 6.64E+07 6.28E+07 3.25E+06 3.68E+06 17.91 17.94 18.01
24 6.08E+07 6.42E+07 5.95E+07 6.15E+07 2.44E+06 2.76E+06 17.92 17.98 17.90
36 6.73E+07 6.76E+07 7.41E+07 6.97E+07 3.85E+06 4.35E+06 18.03 18.03 18.12
48 8.47E+07 9.28E+07 9.09E+07 8.95E+07 4.22E+06 4.77E+06 18.25 18.35 18.32
60 9.18E+07 9.63E+07 9.78E+07 9.53E+07 3.14E+06 3.56E+06 18.34 18.38 18.40
72 1.19E+08 1.15E+08 1.25E+08 1.20E+08 5.20E+06 5.89E+06 18.59 18.56 18.65
84 1.45E+08 1.32E+08 1.50E+08 1.42E+08 9.35E+06 1.06E+07 18.79 18.70 18.83
96 1.53E+08 1.41E+08 1.45E+08 1.46E+08 6.18E+06 6.99E+06 18.85 18.76 18.79
108 1.51E+08 1.39E+08 1.30E+08 1.40E+08 1.04E+07 1.17E+07 18.83 18.75 18.68
120 1.65E+08 1.82E+08 1.42E+08 1.63E+08 2.01E+07 2.27E+07 18.92 19.02 18.77
17.5
18.0
18.5
19.0
0 20 40 60 80 100
ln [
Cel
ls m
L-1
]
Specific growth rate (h-1
)
Trial 1 0.016
Trial 2 0.013
Trial 3 0.015
Average 0.014
STDEV 0.001
95% CI 0.001
y = 0.0156x + 17.465
y = 0.013x + 17.627
y = 0.0145x + 17.597
17.5
18.0
18.5
19.0
0 20 40 60 80 100
Elapsed time (h)
ln [
Cel
ls m
L-1
]
Figure G.75. Specific growth rate calculations for Trial 1 (open circles), Trial 2 (open
squares), and Trial 3 (open triangles).
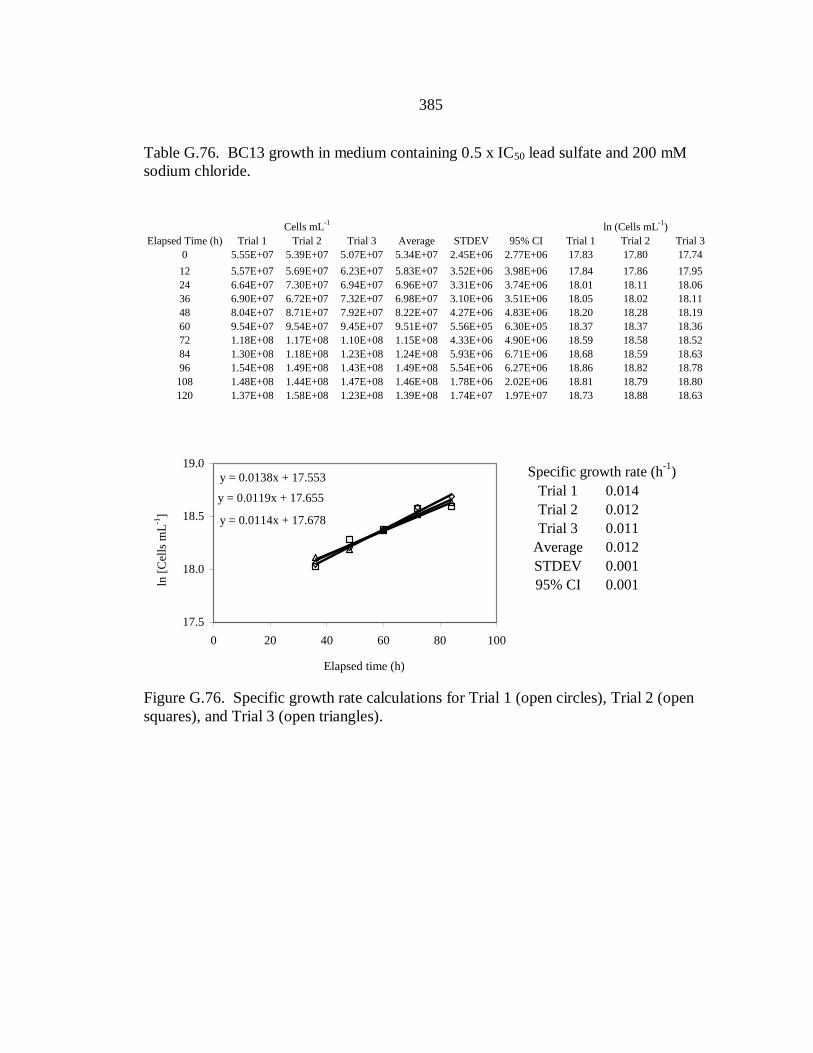
385
Table G.76. BC13 growth in medium containing 0.5 x IC50 lead sulfate and 200 mM
sodium chloride.
Cells mL
-1ln (Cells mL
-1)
Elapsed Time (h) Trial 1 Trial 2 Trial 3 Average STDEV 95% CI Trial 1 Trial 2 Trial 3
0 5.55E+07 5.39E+07 5.07E+07 5.34E+07 2.45E+06 2.77E+06 17.83 17.80 17.74
12 5.57E+07 5.69E+07 6.23E+07 5.83E+07 3.52E+06 3.98E+06 17.84 17.86 17.95
24 6.64E+07 7.30E+07 6.94E+07 6.96E+07 3.31E+06 3.74E+06 18.01 18.11 18.06
36 6.90E+07 6.72E+07 7.32E+07 6.98E+07 3.10E+06 3.51E+06 18.05 18.02 18.11
48 8.04E+07 8.71E+07 7.92E+07 8.22E+07 4.27E+06 4.83E+06 18.20 18.28 18.19
60 9.54E+07 9.54E+07 9.45E+07 9.51E+07 5.56E+05 6.30E+05 18.37 18.37 18.36
72 1.18E+08 1.17E+08 1.10E+08 1.15E+08 4.33E+06 4.90E+06 18.59 18.58 18.52
84 1.30E+08 1.18E+08 1.23E+08 1.24E+08 5.93E+06 6.71E+06 18.68 18.59 18.63
96 1.54E+08 1.49E+08 1.43E+08 1.49E+08 5.54E+06 6.27E+06 18.86 18.82 18.78
108 1.48E+08 1.44E+08 1.47E+08 1.46E+08 1.78E+06 2.02E+06 18.81 18.79 18.80
120 1.37E+08 1.58E+08 1.23E+08 1.39E+08 1.74E+07 1.97E+07 18.73 18.88 18.63
17.5
18.0
18.5
19.0
0 20 40 60 80 100
ln [
Cel
ls m
L-1
]
Specific growth rate (h-1
)
Trial 1 0.014
Trial 2 0.012
Trial 3 0.011
Average 0.012
STDEV 0.001
95% CI 0.001
y = 0.0138x + 17.553
y = 0.0119x + 17.655
y = 0.0114x + 17.678
17.5
18.0
18.5
19.0
0 20 40 60 80 100
Elapsed time (h)
ln [
Cel
ls m
L-1
]
Figure G.76. Specific growth rate calculations for Trial 1 (open circles), Trial 2 (open
squares), and Trial 3 (open triangles).
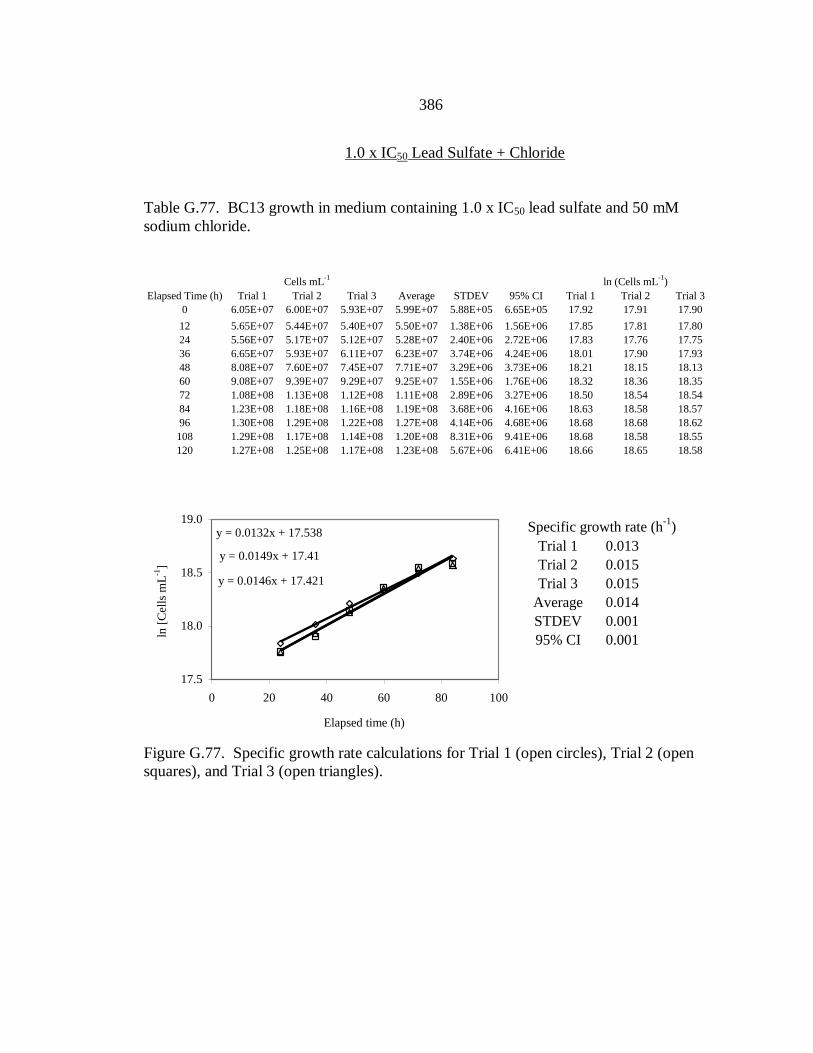
386
1.0 x IC50 Lead Sulfate + Chloride
Table G.77. BC13 growth in medium containing 1.0 x IC50 lead sulfate and 50 mM
sodium chloride.
Cells mL
-1ln (Cells mL
-1)
Elapsed Time (h) Trial 1 Trial 2 Trial 3 Average STDEV 95% CI Trial 1 Trial 2 Trial 3
0 6.05E+07 6.00E+07 5.93E+07 5.99E+07 5.88E+05 6.65E+05 17.92 17.91 17.90
12 5.65E+07 5.44E+07 5.40E+07 5.50E+07 1.38E+06 1.56E+06 17.85 17.81 17.80
24 5.56E+07 5.17E+07 5.12E+07 5.28E+07 2.40E+06 2.72E+06 17.83 17.76 17.75
36 6.65E+07 5.93E+07 6.11E+07 6.23E+07 3.74E+06 4.24E+06 18.01 17.90 17.93
48 8.08E+07 7.60E+07 7.45E+07 7.71E+07 3.29E+06 3.73E+06 18.21 18.15 18.13
60 9.08E+07 9.39E+07 9.29E+07 9.25E+07 1.55E+06 1.76E+06 18.32 18.36 18.35
72 1.08E+08 1.13E+08 1.12E+08 1.11E+08 2.89E+06 3.27E+06 18.50 18.54 18.54
84 1.23E+08 1.18E+08 1.16E+08 1.19E+08 3.68E+06 4.16E+06 18.63 18.58 18.57
96 1.30E+08 1.29E+08 1.22E+08 1.27E+08 4.14E+06 4.68E+06 18.68 18.68 18.62
108 1.29E+08 1.17E+08 1.14E+08 1.20E+08 8.31E+06 9.41E+06 18.68 18.58 18.55
120 1.27E+08 1.25E+08 1.17E+08 1.23E+08 5.67E+06 6.41E+06 18.66 18.65 18.58
17.5
18.0
18.5
19.0
0 20 40 60 80 100
ln [
Cel
ls m
L-1
]
Specific growth rate (h-1
)
Trial 1 0.013
Trial 2 0.015
Trial 3 0.015
Average 0.014
STDEV 0.001
95% CI 0.001
y = 0.0132x + 17.538
y = 0.0149x + 17.41
y = 0.0146x + 17.421
17.5
18.0
18.5
19.0
0 20 40 60 80 100
Elapsed time (h)
ln [
Cel
ls m
L-1
]
Figure G.77. Specific growth rate calculations for Trial 1 (open circles), Trial 2 (open
squares), and Trial 3 (open triangles).
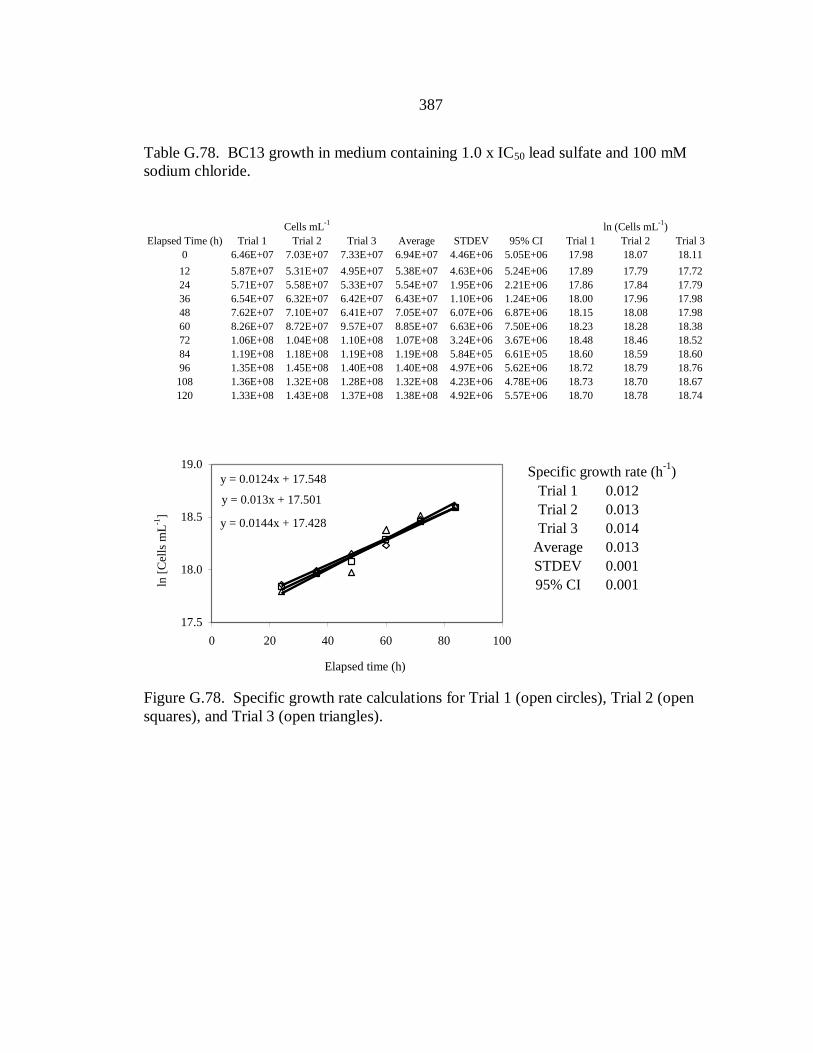
387
Table G.78. BC13 growth in medium containing 1.0 x IC50 lead sulfate and 100 mM
sodium chloride.
Cells mL
-1ln (Cells mL
-1)
Elapsed Time (h) Trial 1 Trial 2 Trial 3 Average STDEV 95% CI Trial 1 Trial 2 Trial 3
0 6.46E+07 7.03E+07 7.33E+07 6.94E+07 4.46E+06 5.05E+06 17.98 18.07 18.11
12 5.87E+07 5.31E+07 4.95E+07 5.38E+07 4.63E+06 5.24E+06 17.89 17.79 17.72
24 5.71E+07 5.58E+07 5.33E+07 5.54E+07 1.95E+06 2.21E+06 17.86 17.84 17.79
36 6.54E+07 6.32E+07 6.42E+07 6.43E+07 1.10E+06 1.24E+06 18.00 17.96 17.98
48 7.62E+07 7.10E+07 6.41E+07 7.05E+07 6.07E+06 6.87E+06 18.15 18.08 17.98
60 8.26E+07 8.72E+07 9.57E+07 8.85E+07 6.63E+06 7.50E+06 18.23 18.28 18.38
72 1.06E+08 1.04E+08 1.10E+08 1.07E+08 3.24E+06 3.67E+06 18.48 18.46 18.52
84 1.19E+08 1.18E+08 1.19E+08 1.19E+08 5.84E+05 6.61E+05 18.60 18.59 18.60
96 1.35E+08 1.45E+08 1.40E+08 1.40E+08 4.97E+06 5.62E+06 18.72 18.79 18.76
108 1.36E+08 1.32E+08 1.28E+08 1.32E+08 4.23E+06 4.78E+06 18.73 18.70 18.67
120 1.33E+08 1.43E+08 1.37E+08 1.38E+08 4.92E+06 5.57E+06 18.70 18.78 18.74
17.5
18.0
18.5
19.0
0 20 40 60 80 100
ln [
Cel
ls m
L-1
]
Specific growth rate (h-1
)
Trial 1 0.012
Trial 2 0.013
Trial 3 0.014
Average 0.013
STDEV 0.001
95% CI 0.001
y = 0.0124x + 17.548
y = 0.013x + 17.501
y = 0.0144x + 17.428
17.5
18.0
18.5
19.0
0 20 40 60 80 100
Elapsed time (h)
ln [
Cel
ls m
L-1
]
Figure G.78. Specific growth rate calculations for Trial 1 (open circles), Trial 2 (open
squares), and Trial 3 (open triangles).

388
Table G.79. BC13 growth in medium containing 1.0 x IC50 lead sulfate and 200 mM
sodium chloride.
Cells mL
-1ln (Cells mL
-1)
Elapsed Time (h) Trial 1 Trial 2 Trial 3 Average STDEV 95% CI Trial 1 Trial 2 Trial 3
0 5.36E+07 5.24E+07 5.32E+07 5.31E+07 5.83E+05 6.60E+05 17.80 17.77 17.79
12 6.55E+07 6.61E+07 7.05E+07 6.74E+07 2.76E+06 3.12E+06 18.00 18.01 18.07
24 6.73E+07 7.29E+07 7.71E+07 7.24E+07 4.93E+06 5.58E+06 18.02 18.10 18.16
36 6.99E+07 6.36E+07 6.80E+07 6.65E+07 3.23E+06 3.65E+06 18.06 17.97 18.04
48 7.90E+07 7.23E+07 7.63E+07 7.59E+07 3.35E+06 3.79E+06 18.18 18.10 18.15
60 8.75E+07 9.13E+07 8.25E+07 8.71E+07 4.41E+06 4.99E+06 18.29 18.33 18.23
72 9.73E+07 9.53E+07 1.00E+08 9.76E+07 2.51E+06 2.84E+06 18.39 18.37 18.42
84 1.04E+08 1.05E+08 9.97E+07 1.03E+08 2.81E+06 3.18E+06 18.46 18.47 18.42
96 1.15E+08 1.05E+08 1.11E+08 1.10E+08 5.44E+06 6.16E+06 18.56 18.46 18.52
108 1.30E+08 1.25E+08 1.15E+08 1.23E+08 7.99E+06 9.04E+06 18.69 18.64 18.56
120 1.29E+08 1.34E+08 1.37E+08 1.33E+08 3.81E+06 4.31E+06 18.68 18.71 18.73
17.5
18.0
18.5
19.0
0 20 40 60 80 100 120
ln [
Cel
ls m
L-1
]
Specific growth rate (h-1
)
Trial 1 0.008
Trial 2 0.009
Trial 3 0.008
Average 0.008
STDEV 0.000
95% CI 0.000
y = 0.0082x + 17.784
y = 0.0087x + 17.711
y = 0.0082x + 17.756
17.5
18.0
18.5
19.0
0 20 40 60 80 100 120
Elapsed time (h)
ln [
Cel
ls m
L-1
]
Figure G.79. Specific growth rate calculations for Trial 1 (open circles), Trial 2 (open
squares), and Trial 3 (open triangles).

389
0.5 x IC50 Zinc Sulfate + Chloride
Table G.80. BC13 growth in medium containing 0.5 x IC50 zinc sulfate and 50 mM
sodium chloride.
Cells mL
-1ln (Cells mL
-1)
Elapsed Time (h) Trial 1 Trial 2 Trial 3 Average STDEV 95% CI Trial 1 Trial 2 Trial 3
0 5.47E+07 5.13E+07 5.48E+07 5.36E+07 1.97E+06 2.22E+06 17.82 17.75 17.82
12 5.76E+07 5.92E+07 5.59E+07 5.76E+07 1.64E+06 1.86E+06 17.87 17.90 17.84
24 6.53E+07 6.74E+07 6.77E+07 6.68E+07 1.31E+06 1.49E+06 17.99 18.03 18.03
36 8.55E+07 9.27E+07 8.14E+07 8.65E+07 5.75E+06 6.50E+06 18.26 18.35 18.21
48 1.00E+08 1.07E+08 9.65E+07 1.01E+08 5.44E+06 6.16E+06 18.42 18.49 18.38
60 1.27E+08 1.31E+08 1.19E+08 1.26E+08 5.92E+06 6.70E+06 18.66 18.69 18.60
72 1.43E+08 1.41E+08 1.45E+08 1.43E+08 1.99E+06 2.25E+06 18.78 18.76 18.79
84 1.43E+08 1.54E+08 1.52E+08 1.50E+08 5.92E+06 6.70E+06 18.78 18.85 18.84
96 1.56E+08 1.58E+08 1.57E+08 1.57E+08 1.41E+06 1.59E+06 18.86 18.88 18.87
108 1.55E+08 1.76E+08 1.77E+08 1.69E+08 1.26E+07 1.43E+07 18.86 18.99 18.99
120 1.74E+08 1.78E+08 1.65E+08 1.73E+08 6.75E+06 7.64E+06 18.98 19.00 18.9217.5
18.0
18.5
19.0
0 20 40 60 80
ln [
Cel
ls m
L-1
]
Specific growth rate (h-1
)
Trial 1 0.016
Trial 2 0.015
Trial 3 0.016
Average 0.016
STDEV 0.000
95% CI 0.000
y = 0.016x + 17.661
y = 0.0154x + 17.722
y = 0.0158x + 17.647
17.5
18.0
18.5
19.0
0 20 40 60 80
Elapsed time (h)
ln [
Cel
ls m
L-1
]
Figure G.80. Specific growth rate calculations for Trial 1 (open circles), Trial 2 (open
squares), and Trial 3 (open triangles).

390
Table G.81. BC13 growth in medium containing 0.5 x IC50 zinc sulfate and 100 mM
sodium chloride.
Cells mL
-1ln (Cells mL
-1)
Elapsed Time (h) Trial 1 Trial 2 Trial 3 Average STDEV 95% CI Trial 1 Trial 2 Trial 3
0 5.78E+07 6.19E+07 6.01E+07 5.99E+07 2.04E+06 2.31E+06 17.87 17.94 17.91
12 5.86E+07 5.95E+07 5.90E+07 5.90E+07 4.42E+05 5.00E+05 17.89 17.90 17.89
24 6.18E+07 6.35E+07 6.50E+07 6.34E+07 1.58E+06 1.78E+06 17.94 17.97 17.99
36 6.86E+07 6.69E+07 6.10E+07 6.55E+07 3.99E+06 4.51E+06 18.04 18.02 17.93
48 8.57E+07 8.08E+07 8.30E+07 8.32E+07 2.50E+06 2.82E+06 18.27 18.21 18.23
60 8.97E+07 8.45E+07 9.05E+07 8.82E+07 3.22E+06 3.65E+06 18.31 18.25 18.32
72 1.15E+08 1.06E+08 1.04E+08 1.08E+08 6.22E+06 7.03E+06 18.56 18.48 18.46
84 1.43E+08 1.38E+08 1.42E+08 1.41E+08 2.71E+06 3.06E+06 18.78 18.74 18.77
96 1.58E+08 1.69E+08 1.78E+08 1.68E+08 1.02E+07 1.15E+07 18.88 18.95 19.00
108 1.55E+08 1.58E+08 1.54E+08 1.56E+08 2.06E+06 2.34E+06 18.86 18.88 18.85
120 1.52E+08 1.40E+08 1.44E+08 1.45E+08 5.84E+06 6.61E+06 18.84 18.76 18.78
17.5
18.0
18.5
19.0
19.5
0 20 40 60 80 100 120
ln [
Cel
ls m
L-1
]
Specific growth rate (h-1
)
Trial 1 0.014
Trial 2 0.015
Trial 3 0.017
Average 0.015
STDEV 0.001
95% CI 0.002
y = 0.0141x + 17.54
y = 0.0154x + 17.424
y = 0.0169x + 17.335
17.5
18.0
18.5
19.0
19.5
0 20 40 60 80 100 120
Elapsed time (h)
ln [
Cel
ls m
L-1
]
Figure G.81. Specific growth rate calculations for Trial 1 (open circles), Trial 2 (open
squares), and Trial 3 (open triangles).
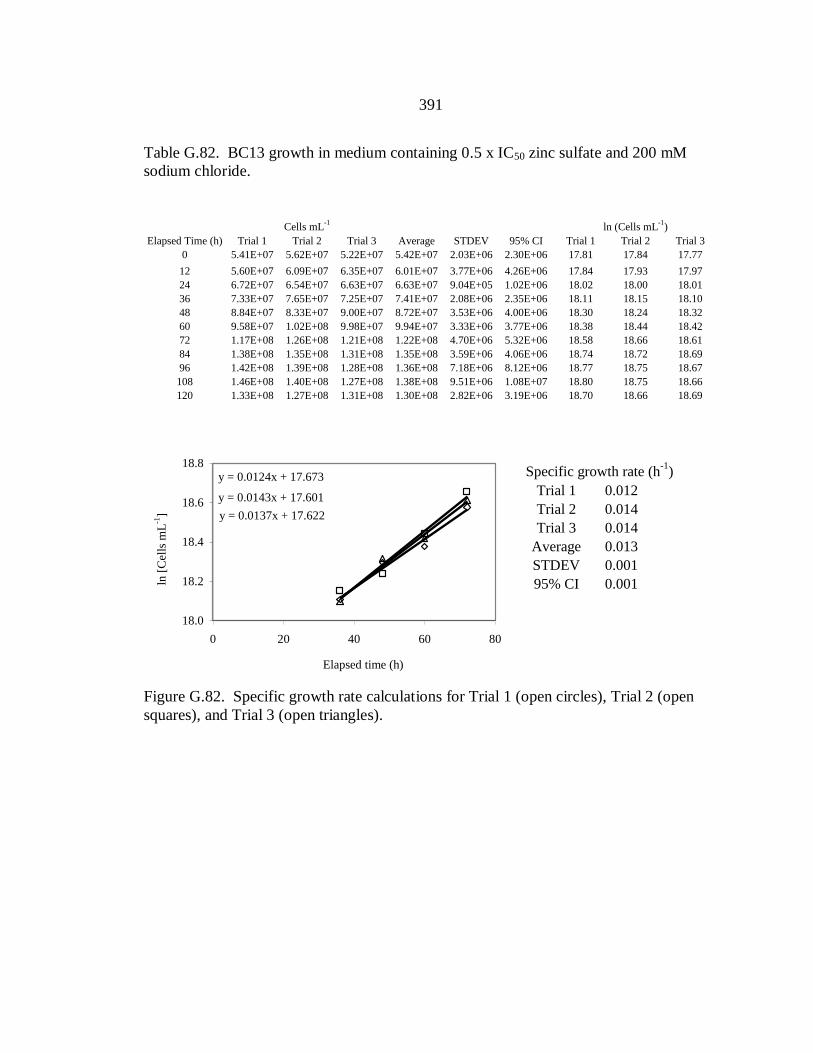
391
Table G.82. BC13 growth in medium containing 0.5 x IC50 zinc sulfate and 200 mM
sodium chloride.
Cells mL
-1ln (Cells mL
-1)
Elapsed Time (h) Trial 1 Trial 2 Trial 3 Average STDEV 95% CI Trial 1 Trial 2 Trial 3
0 5.41E+07 5.62E+07 5.22E+07 5.42E+07 2.03E+06 2.30E+06 17.81 17.84 17.77
12 5.60E+07 6.09E+07 6.35E+07 6.01E+07 3.77E+06 4.26E+06 17.84 17.93 17.97
24 6.72E+07 6.54E+07 6.63E+07 6.63E+07 9.04E+05 1.02E+06 18.02 18.00 18.01
36 7.33E+07 7.65E+07 7.25E+07 7.41E+07 2.08E+06 2.35E+06 18.11 18.15 18.10
48 8.84E+07 8.33E+07 9.00E+07 8.72E+07 3.53E+06 4.00E+06 18.30 18.24 18.32
60 9.58E+07 1.02E+08 9.98E+07 9.94E+07 3.33E+06 3.77E+06 18.38 18.44 18.42
72 1.17E+08 1.26E+08 1.21E+08 1.22E+08 4.70E+06 5.32E+06 18.58 18.66 18.61
84 1.38E+08 1.35E+08 1.31E+08 1.35E+08 3.59E+06 4.06E+06 18.74 18.72 18.69
96 1.42E+08 1.39E+08 1.28E+08 1.36E+08 7.18E+06 8.12E+06 18.77 18.75 18.67
108 1.46E+08 1.40E+08 1.27E+08 1.38E+08 9.51E+06 1.08E+07 18.80 18.75 18.66
120 1.33E+08 1.27E+08 1.31E+08 1.30E+08 2.82E+06 3.19E+06 18.70 18.66 18.69
18.0
18.2
18.4
18.6
18.8
0 20 40 60 80
ln [
Cel
ls m
L-1
]
Specific growth rate (h-1
)
Trial 1 0.012
Trial 2 0.014
Trial 3 0.014
Average 0.013
STDEV 0.001
95% CI 0.001
y = 0.0124x + 17.673
y = 0.0143x + 17.601
y = 0.0137x + 17.622
18.0
18.2
18.4
18.6
18.8
0 20 40 60 80
Elapsed time (h)
ln [
Cel
ls m
L-1
]
Figure G.82. Specific growth rate calculations for Trial 1 (open circles), Trial 2 (open
squares), and Trial 3 (open triangles).
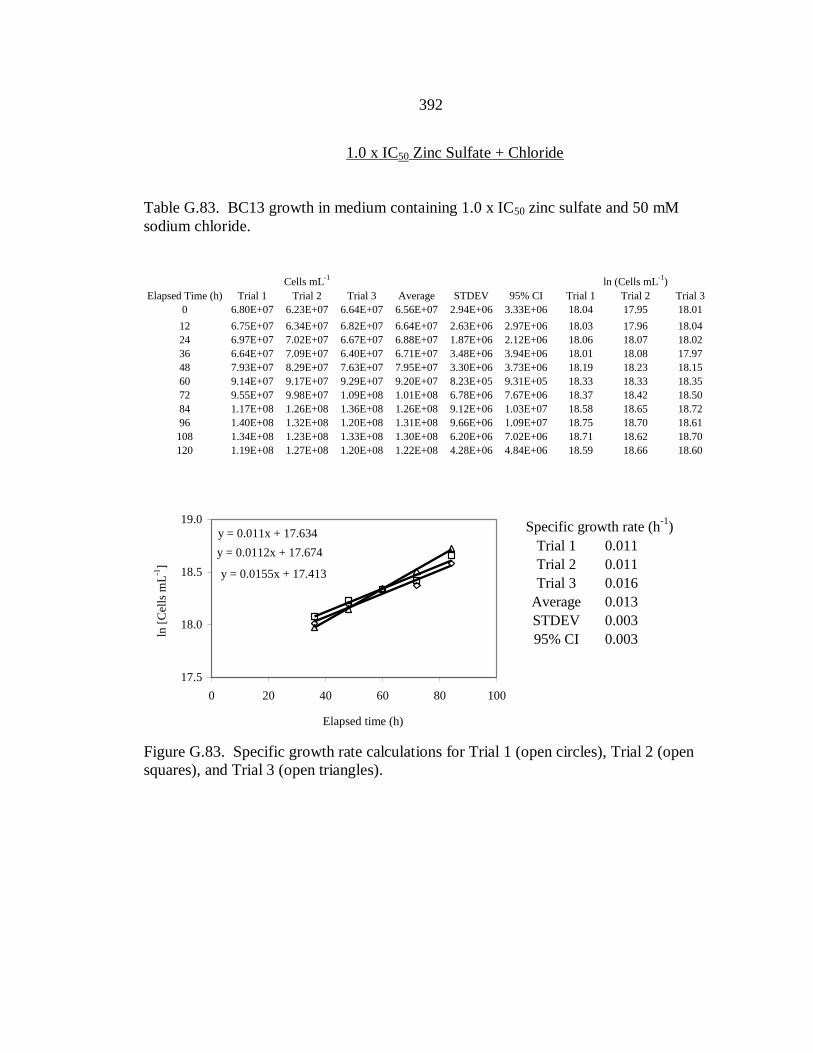
392
1.0 x IC50 Zinc Sulfate + Chloride
Table G.83. BC13 growth in medium containing 1.0 x IC50 zinc sulfate and 50 mM
sodium chloride.
Cells mL
-1ln (Cells mL
-1)
Elapsed Time (h) Trial 1 Trial 2 Trial 3 Average STDEV 95% CI Trial 1 Trial 2 Trial 3
0 6.80E+07 6.23E+07 6.64E+07 6.56E+07 2.94E+06 3.33E+06 18.04 17.95 18.01
12 6.75E+07 6.34E+07 6.82E+07 6.64E+07 2.63E+06 2.97E+06 18.03 17.96 18.04
24 6.97E+07 7.02E+07 6.67E+07 6.88E+07 1.87E+06 2.12E+06 18.06 18.07 18.02
36 6.64E+07 7.09E+07 6.40E+07 6.71E+07 3.48E+06 3.94E+06 18.01 18.08 17.97
48 7.93E+07 8.29E+07 7.63E+07 7.95E+07 3.30E+06 3.73E+06 18.19 18.23 18.15
60 9.14E+07 9.17E+07 9.29E+07 9.20E+07 8.23E+05 9.31E+05 18.33 18.33 18.35
72 9.55E+07 9.98E+07 1.09E+08 1.01E+08 6.78E+06 7.67E+06 18.37 18.42 18.50
84 1.17E+08 1.26E+08 1.36E+08 1.26E+08 9.12E+06 1.03E+07 18.58 18.65 18.72
96 1.40E+08 1.32E+08 1.20E+08 1.31E+08 9.66E+06 1.09E+07 18.75 18.70 18.61
108 1.34E+08 1.23E+08 1.33E+08 1.30E+08 6.20E+06 7.02E+06 18.71 18.62 18.70
120 1.19E+08 1.27E+08 1.20E+08 1.22E+08 4.28E+06 4.84E+06 18.59 18.66 18.60
17.5
18.0
18.5
19.0
0 20 40 60 80 100
ln [
Cel
ls m
L-1
]
Specific growth rate (h-1
)
Trial 1 0.011
Trial 2 0.011
Trial 3 0.016
Average 0.013
STDEV 0.003
95% CI 0.003
y = 0.011x + 17.634
y = 0.0112x + 17.674
y = 0.0155x + 17.413
17.5
18.0
18.5
19.0
0 20 40 60 80 100
Elapsed time (h)
ln [
Cel
ls m
L-1
]
Figure G.83. Specific growth rate calculations for Trial 1 (open circles), Trial 2 (open
squares), and Trial 3 (open triangles).
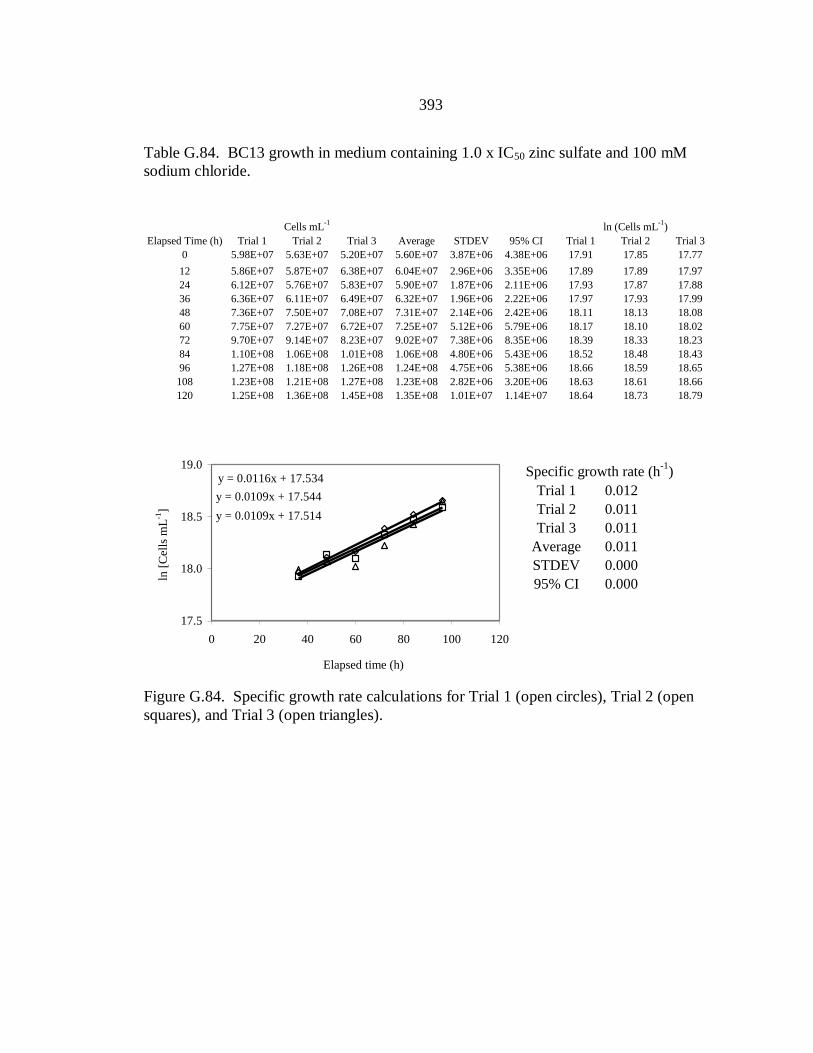
393
Table G.84. BC13 growth in medium containing 1.0 x IC50 zinc sulfate and 100 mM
sodium chloride.
Cells mL
-1ln (Cells mL
-1)
Elapsed Time (h) Trial 1 Trial 2 Trial 3 Average STDEV 95% CI Trial 1 Trial 2 Trial 3
0 5.98E+07 5.63E+07 5.20E+07 5.60E+07 3.87E+06 4.38E+06 17.91 17.85 17.77
12 5.86E+07 5.87E+07 6.38E+07 6.04E+07 2.96E+06 3.35E+06 17.89 17.89 17.97
24 6.12E+07 5.76E+07 5.83E+07 5.90E+07 1.87E+06 2.11E+06 17.93 17.87 17.88
36 6.36E+07 6.11E+07 6.49E+07 6.32E+07 1.96E+06 2.22E+06 17.97 17.93 17.99
48 7.36E+07 7.50E+07 7.08E+07 7.31E+07 2.14E+06 2.42E+06 18.11 18.13 18.08
60 7.75E+07 7.27E+07 6.72E+07 7.25E+07 5.12E+06 5.79E+06 18.17 18.10 18.02
72 9.70E+07 9.14E+07 8.23E+07 9.02E+07 7.38E+06 8.35E+06 18.39 18.33 18.23
84 1.10E+08 1.06E+08 1.01E+08 1.06E+08 4.80E+06 5.43E+06 18.52 18.48 18.43
96 1.27E+08 1.18E+08 1.26E+08 1.24E+08 4.75E+06 5.38E+06 18.66 18.59 18.65
108 1.23E+08 1.21E+08 1.27E+08 1.23E+08 2.82E+06 3.20E+06 18.63 18.61 18.66
120 1.25E+08 1.36E+08 1.45E+08 1.35E+08 1.01E+07 1.14E+07 18.64 18.73 18.79
17.5
18.0
18.5
19.0
0 20 40 60 80 100 120
ln [
Cel
ls m
L-1
]
Specific growth rate (h-1
)
Trial 1 0.012
Trial 2 0.011
Trial 3 0.011
Average 0.011
STDEV 0.000
95% CI 0.000
y = 0.0116x + 17.534
y = 0.0109x + 17.544
y = 0.0109x + 17.514
17.5
18.0
18.5
19.0
0 20 40 60 80 100 120
Elapsed time (h)
ln [
Cel
ls m
L-1
]
Figure G.84. Specific growth rate calculations for Trial 1 (open circles), Trial 2 (open
squares), and Trial 3 (open triangles).

394
Table G.85. BC13 growth in medium containing 1.0 x IC50 zinc sulfate and 200 mM
sodium chloride.
Cells mL
-1ln (Cells mL
-1)
Elapsed Time (h) Trial 1 Trial 2 Trial 3 Average STDEV 95% CI Trial 1 Trial 2 Trial 3
0 5.58E+07 5.07E+07 5.53E+07 5.39E+07 2.78E+06 3.15E+06 17.84 17.74 17.83
12 5.68E+07 5.62E+07 5.49E+07 5.60E+07 9.71E+05 1.10E+06 17.86 17.84 17.82
24 5.53E+07 5.79E+07 6.11E+07 5.81E+07 2.94E+06 3.33E+06 17.83 17.87 17.93
36 6.20E+07 6.59E+07 7.04E+07 6.61E+07 4.23E+06 4.79E+06 17.94 18.00 18.07
48 7.05E+07 7.12E+07 7.50E+07 7.22E+07 2.41E+06 2.72E+06 18.07 18.08 18.13
60 7.51E+07 6.92E+07 7.87E+07 7.43E+07 4.80E+06 5.43E+06 18.13 18.05 18.18
72 9.23E+07 9.39E+07 8.52E+07 9.05E+07 4.64E+06 5.25E+06 18.34 18.36 18.26
84 1.09E+08 1.05E+08 1.10E+08 1.08E+08 2.52E+06 2.85E+06 18.51 18.47 18.52
96 1.17E+08 1.12E+08 1.08E+08 1.12E+08 4.50E+06 5.09E+06 18.58 18.53 18.50
108 1.27E+08 1.25E+08 1.35E+08 1.29E+08 4.86E+06 5.50E+06 18.66 18.65 18.72
120 1.22E+08 1.24E+08 1.15E+08 1.20E+08 4.96E+06 5.61E+06 18.62 18.64 18.56
17.5
18.0
18.5
19.0
0 20 40 60 80 100 120
ln [
Cel
ls m
L-1
]
Specific growth rate (h-1
)
Trial 1 0.011
Trial 2 0.010
Trial 3 0.009
Average 0.010
STDEV 0.001
95% CI 0.001
y = 0.0105x + 17.568
y = 0.0095x + 17.629
y = 0.0088x + 17.706
17.5
18.0
18.5
19.0
0 20 40 60 80 100 120
Elapsed time (h)
ln [
Cel
ls m
L-1
]
Figure G.85. Specific growth rate calculations for Trial 1 (open circles), Trial 2 (open
squares), and Trial 3 (open triangles).
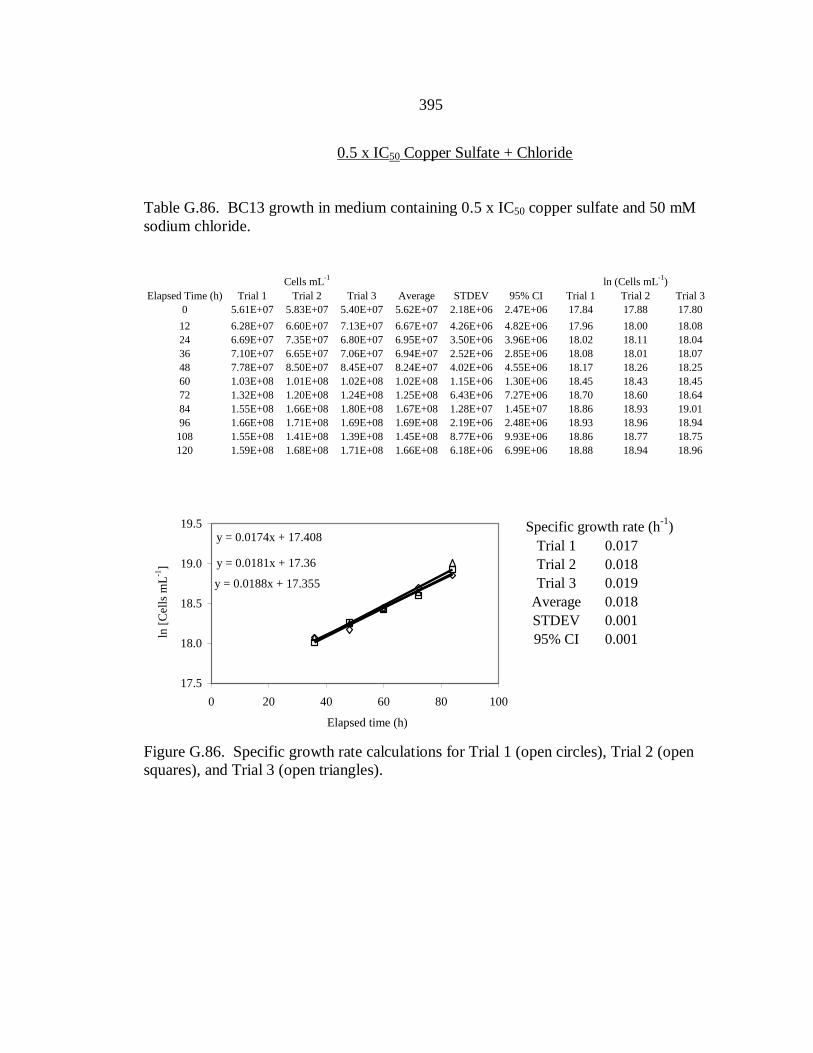
395
0.5 x IC50 Copper Sulfate + Chloride
Table G.86. BC13 growth in medium containing 0.5 x IC50 copper sulfate and 50 mM
sodium chloride.
Cells mL
-1ln (Cells mL
-1)
Elapsed Time (h) Trial 1 Trial 2 Trial 3 Average STDEV 95% CI Trial 1 Trial 2 Trial 3
0 5.61E+07 5.83E+07 5.40E+07 5.62E+07 2.18E+06 2.47E+06 17.84 17.88 17.80
12 6.28E+07 6.60E+07 7.13E+07 6.67E+07 4.26E+06 4.82E+06 17.96 18.00 18.08
24 6.69E+07 7.35E+07 6.80E+07 6.95E+07 3.50E+06 3.96E+06 18.02 18.11 18.04
36 7.10E+07 6.65E+07 7.06E+07 6.94E+07 2.52E+06 2.85E+06 18.08 18.01 18.07
48 7.78E+07 8.50E+07 8.45E+07 8.24E+07 4.02E+06 4.55E+06 18.17 18.26 18.25
60 1.03E+08 1.01E+08 1.02E+08 1.02E+08 1.15E+06 1.30E+06 18.45 18.43 18.45
72 1.32E+08 1.20E+08 1.24E+08 1.25E+08 6.43E+06 7.27E+06 18.70 18.60 18.64
84 1.55E+08 1.66E+08 1.80E+08 1.67E+08 1.28E+07 1.45E+07 18.86 18.93 19.01
96 1.66E+08 1.71E+08 1.69E+08 1.69E+08 2.19E+06 2.48E+06 18.93 18.96 18.94
108 1.55E+08 1.41E+08 1.39E+08 1.45E+08 8.77E+06 9.93E+06 18.86 18.77 18.75
120 1.59E+08 1.68E+08 1.71E+08 1.66E+08 6.18E+06 6.99E+06 18.88 18.94 18.9617.5
18.0
18.5
19.0
19.5
0 20 40 60 80 100
ln [
Cel
ls m
L-1
]
Specific growth rate (h-1
)
Trial 1 0.017
Trial 2 0.018
Trial 3 0.019
Average 0.018
STDEV 0.001
95% CI 0.001
y = 0.0174x + 17.408
y = 0.0181x + 17.36
y = 0.0188x + 17.355
17.5
18.0
18.5
19.0
19.5
0 20 40 60 80 100
Elapsed time (h)
ln [
Cel
ls m
L-1
]
Figure G.86. Specific growth rate calculations for Trial 1 (open circles), Trial 2 (open
squares), and Trial 3 (open triangles).

396
Table G.87. BC13 growth in medium containing 0.5 x IC50 copper sulfate and 100 mM
sodium chloride.
Cells mL
-1ln (Cells mL
-1)
Elapsed Time (h) Trial 1 Trial 2 Trial 3 Average STDEV 95% CI Trial 1 Trial 2 Trial 3
0 5.34E+07 5.20E+07 4.89E+07 5.14E+07 2.32E+06 2.63E+06 17.79 17.77 17.71
12 6.00E+07 5.67E+07 5.45E+07 5.70E+07 2.74E+06 3.10E+06 17.91 17.85 17.81
24 5.81E+07 5.74E+07 5.68E+07 5.74E+07 6.09E+05 6.89E+05 17.88 17.87 17.86
36 6.99E+07 6.68E+07 6.49E+07 6.72E+07 2.51E+06 2.84E+06 18.06 18.02 17.99
48 8.22E+07 7.64E+07 7.80E+07 7.89E+07 2.98E+06 3.37E+06 18.22 18.15 18.17
60 8.88E+07 9.32E+07 9.47E+07 9.22E+07 3.04E+06 3.44E+06 18.30 18.35 18.37
72 1.15E+08 1.21E+08 1.13E+08 1.16E+08 4.13E+06 4.67E+06 18.56 18.61 18.54
84 1.32E+08 1.38E+08 1.47E+08 1.39E+08 7.56E+06 8.55E+06 18.70 18.75 18.81
96 1.42E+08 1.32E+08 1.36E+08 1.36E+08 4.96E+06 5.61E+06 18.77 18.70 18.73
108 1.43E+08 1.47E+08 1.48E+08 1.46E+08 2.78E+06 3.14E+06 18.78 18.81 18.81
120 1.52E+08 1.53E+08 1.48E+08 1.51E+08 2.92E+06 3.31E+06 18.84 18.85 18.81
17.5
18.0
18.5
19.0
0 20 40 60 80 100
ln [
Cel
ls m
L-1
]
Specific growth rate (h-1
)
Trial 1 0.014
Trial 2 0.015
Trial 3 0.016
Average 0.015
STDEV 0.001
95% CI 0.001
y = 0.0136x + 17.556
y = 0.0152x + 17.471
y = 0.0157x + 17.439
17.5
18.0
18.5
19.0
0 20 40 60 80 100
Elapsed time (h)
ln [
Cel
ls m
L-1
]
Figure G.87. Specific growth rate calculations for Trial 1 (open circles), Trial 2 (open
squares), and Trial 3 (open triangles).

397
Table G.88. BC13 growth in medium containing 0.5 x IC50 copper sulfate and 200 mM
sodium chloride.
Cells mL
-1ln (Cells mL
-1)
Elapsed Time (h) Trial 1 Trial 2 Trial 3 Average STDEV 95% CI Trial 1 Trial 2 Trial 3
0 5.92E+07 5.75E+07 5.66E+07 5.78E+07 1.34E+06 1.52E+06 17.90 17.87 17.85
12 5.79E+07 6.15E+07 5.71E+07 5.89E+07 2.36E+06 2.67E+06 17.87 17.94 17.86
24 6.92E+07 6.59E+07 6.86E+07 6.79E+07 1.75E+06 1.99E+06 18.05 18.00 18.04
36 7.39E+07 7.81E+07 7.73E+07 7.64E+07 2.21E+06 2.50E+06 18.12 18.17 18.16
48 8.66E+07 7.87E+07 7.87E+07 8.13E+07 4.53E+06 5.12E+06 18.28 18.18 18.18
60 1.02E+08 9.60E+07 9.77E+07 9.87E+07 3.20E+06 3.62E+06 18.44 18.38 18.40
72 1.20E+08 1.02E+08 1.15E+08 1.12E+08 9.40E+06 1.06E+07 18.61 18.44 18.56
84 1.18E+08 1.26E+08 1.17E+08 1.20E+08 4.85E+06 5.48E+06 18.59 18.65 18.57
96 1.43E+08 1.35E+08 1.35E+08 1.38E+08 4.76E+06 5.39E+06 18.78 18.72 18.72
108 1.39E+08 1.32E+08 1.36E+08 1.36E+08 3.64E+06 4.11E+06 18.75 18.70 18.73
120 1.48E+08 1.33E+08 1.22E+08 1.34E+08 1.30E+07 1.47E+07 18.81 18.71 18.62
18.0
18.2
18.4
18.6
18.8
19.0
0 20 40 60 80 100 120
ln [
Cel
ls m
L-1
]
Specific growth rate (h-1
)
Trial 1 0.011
Trial 2 0.010
Trial 3 0.010
Average 0.010
STDEV 0.000
95% CI 0.000
y = 0.0105x + 17.777
y = 0.01x + 17.765
y = 0.0098x + 17.784
18.0
18.2
18.4
18.6
18.8
19.0
0 20 40 60 80 100 120
Elapsed time (h)
ln [
Cel
ls m
L-1
]
Figure G.88. Specific growth rate calculations for Trial 1 (open circles), Trial 2 (open
squares), and Trial 3 (open triangles).
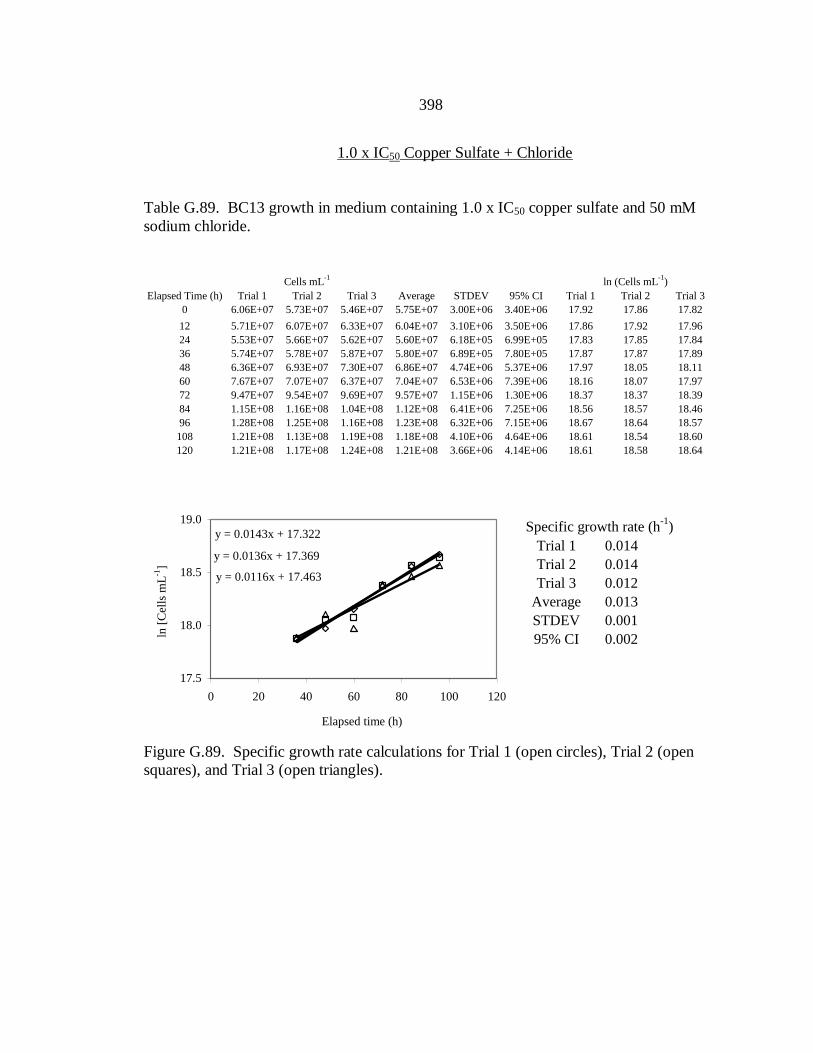
398
1.0 x IC50 Copper Sulfate + Chloride
Table G.89. BC13 growth in medium containing 1.0 x IC50 copper sulfate and 50 mM
sodium chloride.
Cells mL
-1ln (Cells mL
-1)
Elapsed Time (h) Trial 1 Trial 2 Trial 3 Average STDEV 95% CI Trial 1 Trial 2 Trial 3
0 6.06E+07 5.73E+07 5.46E+07 5.75E+07 3.00E+06 3.40E+06 17.92 17.86 17.82
12 5.71E+07 6.07E+07 6.33E+07 6.04E+07 3.10E+06 3.50E+06 17.86 17.92 17.96
24 5.53E+07 5.66E+07 5.62E+07 5.60E+07 6.18E+05 6.99E+05 17.83 17.85 17.84
36 5.74E+07 5.78E+07 5.87E+07 5.80E+07 6.89E+05 7.80E+05 17.87 17.87 17.89
48 6.36E+07 6.93E+07 7.30E+07 6.86E+07 4.74E+06 5.37E+06 17.97 18.05 18.11
60 7.67E+07 7.07E+07 6.37E+07 7.04E+07 6.53E+06 7.39E+06 18.16 18.07 17.97
72 9.47E+07 9.54E+07 9.69E+07 9.57E+07 1.15E+06 1.30E+06 18.37 18.37 18.39
84 1.15E+08 1.16E+08 1.04E+08 1.12E+08 6.41E+06 7.25E+06 18.56 18.57 18.46
96 1.28E+08 1.25E+08 1.16E+08 1.23E+08 6.32E+06 7.15E+06 18.67 18.64 18.57
108 1.21E+08 1.13E+08 1.19E+08 1.18E+08 4.10E+06 4.64E+06 18.61 18.54 18.60
120 1.21E+08 1.17E+08 1.24E+08 1.21E+08 3.66E+06 4.14E+06 18.61 18.58 18.64
17.5
18.0
18.5
19.0
0 20 40 60 80 100 120
ln [
Cel
ls m
L-1
]
Specific growth rate (h-1
)
Trial 1 0.014
Trial 2 0.014
Trial 3 0.012
Average 0.013
STDEV 0.001
95% CI 0.002
y = 0.0143x + 17.322
y = 0.0136x + 17.369
y = 0.0116x + 17.463
17.5
18.0
18.5
19.0
0 20 40 60 80 100 120
Elapsed time (h)
ln [
Cel
ls m
L-1
]
Figure G.89. Specific growth rate calculations for Trial 1 (open circles), Trial 2 (open
squares), and Trial 3 (open triangles).
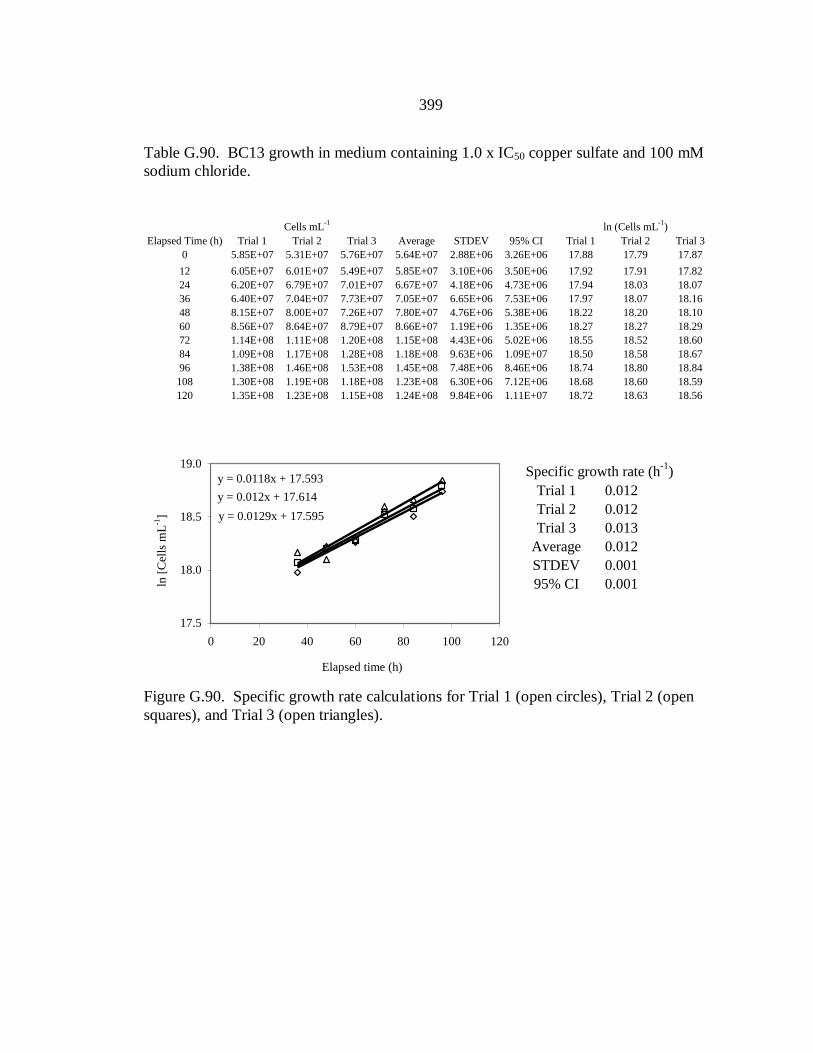
399
Table G.90. BC13 growth in medium containing 1.0 x IC50 copper sulfate and 100 mM
sodium chloride.
Cells mL
-1ln (Cells mL
-1)
Elapsed Time (h) Trial 1 Trial 2 Trial 3 Average STDEV 95% CI Trial 1 Trial 2 Trial 3
0 5.85E+07 5.31E+07 5.76E+07 5.64E+07 2.88E+06 3.26E+06 17.88 17.79 17.87
12 6.05E+07 6.01E+07 5.49E+07 5.85E+07 3.10E+06 3.50E+06 17.92 17.91 17.82
24 6.20E+07 6.79E+07 7.01E+07 6.67E+07 4.18E+06 4.73E+06 17.94 18.03 18.07
36 6.40E+07 7.04E+07 7.73E+07 7.05E+07 6.65E+06 7.53E+06 17.97 18.07 18.16
48 8.15E+07 8.00E+07 7.26E+07 7.80E+07 4.76E+06 5.38E+06 18.22 18.20 18.10
60 8.56E+07 8.64E+07 8.79E+07 8.66E+07 1.19E+06 1.35E+06 18.27 18.27 18.29
72 1.14E+08 1.11E+08 1.20E+08 1.15E+08 4.43E+06 5.02E+06 18.55 18.52 18.60
84 1.09E+08 1.17E+08 1.28E+08 1.18E+08 9.63E+06 1.09E+07 18.50 18.58 18.67
96 1.38E+08 1.46E+08 1.53E+08 1.45E+08 7.48E+06 8.46E+06 18.74 18.80 18.84
108 1.30E+08 1.19E+08 1.18E+08 1.23E+08 6.30E+06 7.12E+06 18.68 18.60 18.59
120 1.35E+08 1.23E+08 1.15E+08 1.24E+08 9.84E+06 1.11E+07 18.72 18.63 18.56
17.5
18.0
18.5
19.0
0 20 40 60 80 100 120
ln [
Cel
ls m
L-1
]
Specific growth rate (h-1
)
Trial 1 0.012
Trial 2 0.012
Trial 3 0.013
Average 0.012
STDEV 0.001
95% CI 0.001
y = 0.0118x + 17.593
y = 0.012x + 17.614
y = 0.0129x + 17.595
17.5
18.0
18.5
19.0
0 20 40 60 80 100 120
Elapsed time (h)
ln [
Cel
ls m
L-1
]
Figure G.90. Specific growth rate calculations for Trial 1 (open circles), Trial 2 (open
squares), and Trial 3 (open triangles).

400
Table G.91. BC13 growth in medium containing 1.0 x IC50 copper sulfate and 200 mM
sodium chloride.
Cells mL
-1ln (Cells mL
-1)
Elapsed Time (h) Trial 1 Trial 2 Trial 3 Average STDEV 95% CI Trial 1 Trial 2 Trial 3
0 6.95E+07 7.47E+07 7.00E+07 7.14E+07 2.84E+06 3.22E+06 18.06 18.13 18.06
12 6.76E+07 7.40E+07 7.43E+07 7.20E+07 3.82E+06 4.32E+06 18.03 18.12 18.12
24 7.10E+07 7.41E+07 6.68E+07 7.06E+07 3.64E+06 4.12E+06 18.08 18.12 18.02
36 7.47E+07 7.66E+07 8.26E+07 7.80E+07 4.15E+06 4.69E+06 18.13 18.15 18.23
48 7.70E+07 8.09E+07 8.19E+07 8.00E+07 2.57E+06 2.91E+06 18.16 18.21 18.22
60 9.27E+07 9.02E+07 9.49E+07 9.26E+07 2.38E+06 2.69E+06 18.34 18.32 18.37
72 9.34E+07 9.79E+07 8.99E+07 9.37E+07 4.00E+06 4.53E+06 18.35 18.40 18.31
84 9.40E+07 9.65E+07 9.74E+07 9.60E+07 1.77E+06 2.01E+06 18.36 18.38 18.39
96 1.08E+08 1.09E+08 1.04E+08 1.07E+08 2.59E+06 2.93E+06 18.50 18.51 18.46
108 1.23E+08 1.21E+08 1.12E+08 1.19E+08 6.22E+06 7.04E+06 18.63 18.61 18.53
120 1.28E+08 1.16E+08 1.14E+08 1.19E+08 7.29E+06 8.25E+06 18.66 18.57 18.55
18.0
18.2
18.4
18.6
18.8
0 20 40 60 80 100 120
ln [
Cel
ls m
L-1
]
Specific growth rate (h-1
)
Trial 1 0.007
Trial 2 0.006
Trial 3 0.005
Average 0.006
STDEV 0.001
95% CI 0.001
y = 0.0067x + 17.867
y = 0.0061x + 17.928
y = 0.0045x + 18.027
18.0
18.2
18.4
18.6
18.8
0 20 40 60 80 100 120
Elapsed time (h)
ln [
Cel
ls m
L-1
]
Figure G.91. Specific growth rate calculations for Trial 1 (open circles), Trial 2 (open
squares), and Trial 3 (open triangles).
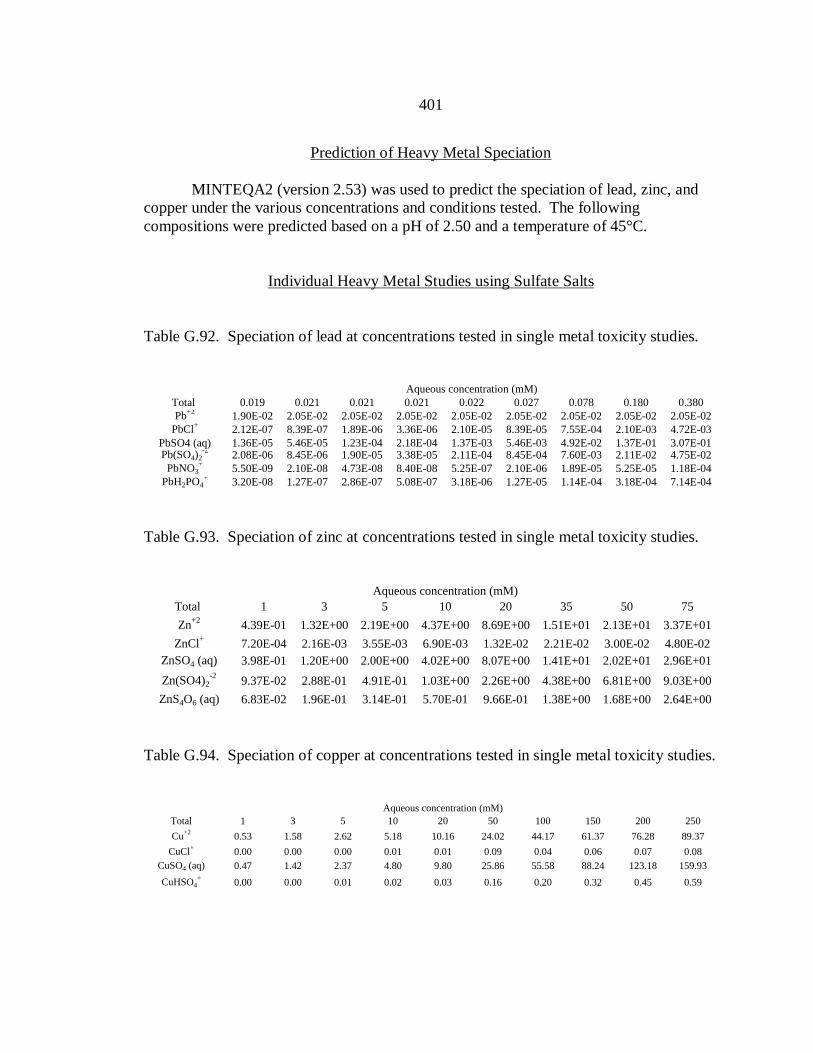
401
Prediction of Heavy Metal Speciation
MINTEQA2 (version 2.53) was used to predict the speciation of lead, zinc, and
copper under the various concentrations and conditions tested. The following
compositions were predicted based on a pH of 2.50 and a temperature of 45°C.
Individual Heavy Metal Studies using Sulfate Salts
Table G.92. Speciation of lead at concentrations tested in single metal toxicity studies.
Aqueous concentration (mM)
Total 0.019 0.021 0.021 0.021 0.022 0.027 0.078 0.180 0.380
Pb+2
1.90E-02 2.05E-02 2.05E-02 2.05E-02 2.05E-02 2.05E-02 2.05E-02 2.05E-02 2.05E-02
PbCl+
2.12E-07 8.39E-07 1.89E-06 3.36E-06 2.10E-05 8.39E-05 7.55E-04 2.10E-03 4.72E-03
PbSO4 (aq) 1.36E-05 5.46E-05 1.23E-04 2.18E-04 1.37E-03 5.46E-03 4.92E-02 1.37E-01 3.07E-01Pb(SO4)2
-22.08E-06 8.45E-06 1.90E-05 3.38E-05 2.11E-04 8.45E-04 7.60E-03 2.11E-02 4.75E-02
PbNO3+
5.50E-09 2.10E-08 4.73E-08 8.40E-08 5.25E-07 2.10E-06 1.89E-05 5.25E-05 1.18E-04
PbH2PO4+
3.20E-08 1.27E-07 2.86E-07 5.08E-07 3.18E-06 1.27E-05 1.14E-04 3.18E-04 7.14E-04
Table G.93. Speciation of zinc at concentrations tested in single metal toxicity studies.
Aqueous concentration (mM)
Total 1 3 5 10 20 35 50 75
Zn+2
4.39E-01 1.32E+00 2.19E+00 4.37E+00 8.69E+00 1.51E+01 2.13E+01 3.37E+01
ZnCl+
7.20E-04 2.16E-03 3.55E-03 6.90E-03 1.32E-02 2.21E-02 3.00E-02 4.80E-02
ZnSO4 (aq) 3.98E-01 1.20E+00 2.00E+00 4.02E+00 8.07E+00 1.41E+01 2.02E+01 2.96E+01
Zn(SO4)2-2
9.37E-02 2.88E-01 4.91E-01 1.03E+00 2.26E+00 4.38E+00 6.81E+00 9.03E+00
ZnS4O6 (aq) 6.83E-02 1.96E-01 3.14E-01 5.70E-01 9.66E-01 1.38E+00 1.68E+00 2.64E+00
Table G.94. Speciation of copper at concentrations tested in single metal toxicity studies.
Aqueous concentration (mM)
Total 1 3 5 10 20 50 100 150 200 250
Cu+2
0.53 1.58 2.62 5.18 10.16 24.02 44.17 61.37 76.28 89.37
CuCl+
0.00 0.00 0.00 0.01 0.01 0.09 0.04 0.06 0.07 0.08
CuSO4 (aq) 0.47 1.42 2.37 4.80 9.80 25.86 55.58 88.24 123.18 159.93
CuHSO4+
0.00 0.00 0.01 0.02 0.03 0.16 0.20 0.32 0.45 0.59

402
Multivariate Statistical Analysis of the Effect of Heavy Metal Speciation on Observed
Specific Growth Rates of BC13
Lead
210 420 0.00160.00080.0000 0.0300.0150.000
8
4
0
2
1
0
0.050
0.025
0.0004
2
0
0.50
0.25
0.000.0016
0.0008
0.0000 0.010
0.005
0.000
840
0.030
0.015
0.000
0.0500.0250.000 0.500.250.00 0.0100.0050.000
Tota
l le
ad
Pb+
2P
bC
l+P
bSO
4 (
aq)
Pb(S
O4)2
-2P
bN
O3+
PbH
2P
O4+
Total lead
u_pb
Pb+2 PbCl+ PbSO4 (aq) Pb(SO4)2-2 PbNO3+ PbH2PO4+ u_pb
Matrix Plot of Total lead, Pb+2, ... vs Total lead, Pb+2, ...
0.40.30.20.10.0-0.1-0.2-0.3-0.4
0.9
0.8
0.7
0.6
0.5
0.4
0.3
0.2
0.1
0.0
First Component
Se
co
nd
Co
mp
on
en
t
u_pb
PbH2PO4+PbNO3+Pb(SO4)2-2PbSO4 (aq)PbCl+Pb+2
Loading Plot of Pb+2, ..., u_pb
Figure G.92. Matrix plot (top) and primary component analysis of the effects of lead
speciation on the observed specific growth rate of BC13.

403
Zinc
80
40
0
30150 30150 210
30
15
0
0.04
0.02
0.0030
15
010
5
0
2
1
0
80400
0.030
0.015
0.000
0.040.020.00 1050 0.0300.0150.000
Tota
l Zin
cZn+
2ZnC
l+ZnSO
4 (
aq)
Zn(S
O4)2
-2ZnS2O
3 (
aq)
Total Zinc
u_zn
Zn+2 ZnCl+ ZnSO4 (aq) Zn(SO4)2-2 ZnS2O3 (aq) u_zn
Matrix Plot of Total Zinc, Zn+2, ... vs Total Zinc, Zn+2, ...
0.50.40.30.20.10.0-0.1-0.2-0.3-0.4
0.75
0.50
0.25
0.00
-0.25
-0.50
First Component
Se
co
nd
Co
mp
on
en
t
u_zn
ZnS2O3 (aq)
Zn(SO4)2-2
ZnSO4 (aq)
ZnCl+
Zn+2
Loading Plot of Zn+2, ..., u_zn
Figure G.93. Matrix plot (top) and primary component analysis of the effects of zinc
speciation on the observed specific growth rate of BC13.
ZnS4O6 (aq)

404
Copper
100500 160800 0.0300.0150.000
200
100
0100
50
0 0.10
0.05
0.00160
80
0
0.50
0.25
0.00
2001000
0.030
0.015
0.000
0.100.050.00 0.500.250.00
Tota
l C
opper
Cu+
2C
uC
l+C
uSO
4 (
aq)
CuH
SO
4+
Total Copper
u_cu
Cu+2 CuCl+ CuSO4 (aq) CuHSO4+ u_cu
Matrix Plot of Total Copper, Cu+2, ... vs Total Copper, Cu+2, ...
0.500.250.00-0.25-0.50
0.50
0.25
0.00
-0.25
-0.50
-0.75
-1.00
First Component
Se
co
nd
Co
mp
on
en
t u_cu
CuHSO4+
CuSO4 (aq)
CuCl+
Cu+2
Loading Plot of Cu+2, ..., u_cu
Figure G.94. Matrix plot (top) and primary component analysis of the effects of copper
speciation on the observed specific growth rate of BC13.
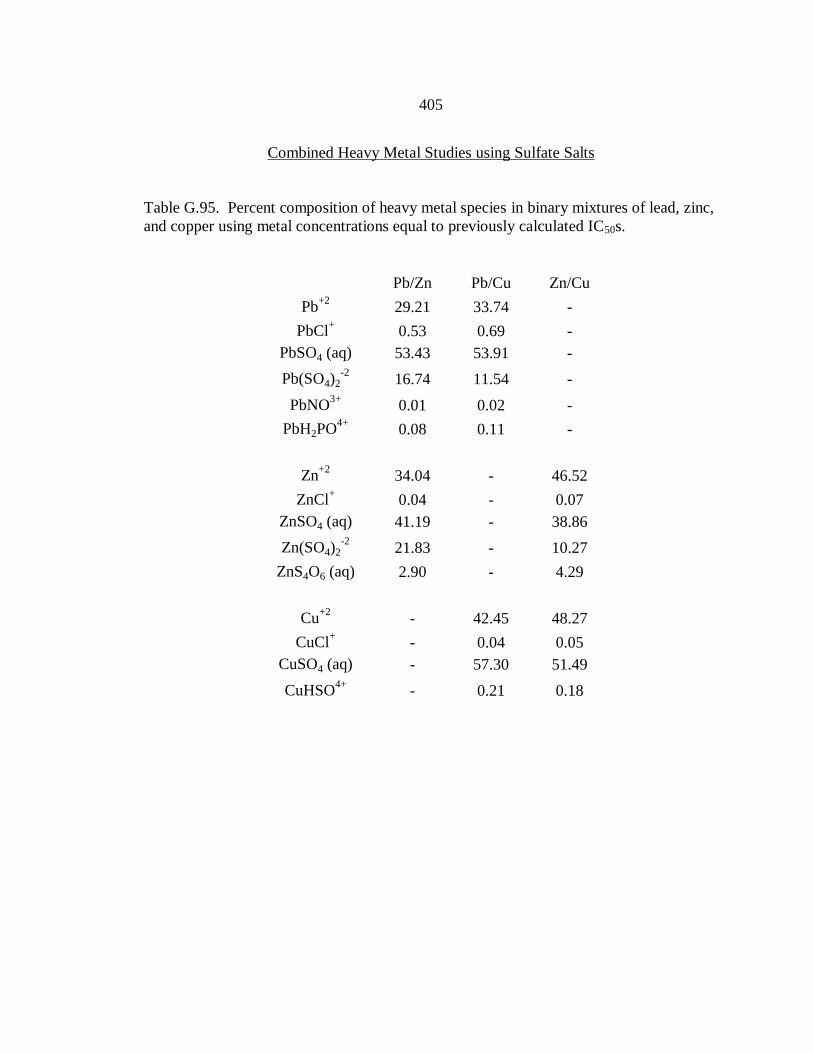
405
Combined Heavy Metal Studies using Sulfate Salts
Table G.95. Percent composition of heavy metal species in binary mixtures of lead, zinc,
and copper using metal concentrations equal to previously calculated IC50s.
Pb/Zn Pb/Cu Zn/Cu
Pb+2
29.21 33.74 -
PbCl+
0.53 0.69 -
PbSO4 (aq) 53.43 53.91 -
Pb(SO4)2-2
16.74 11.54 -
PbNO3+
0.01 0.02 -
PbH2PO4+
0.08 0.11 -
Zn+2
34.04 - 46.52
ZnCl+
0.04 - 0.07
ZnSO4 (aq) 41.19 - 38.86
Zn(SO4)2-2
21.83 - 10.27
ZnS4O6 (aq) 2.90 - 4.29
Cu+2
- 42.45 48.27
CuCl+
- 0.04 0.05
CuSO4 (aq) - 57.30 51.49
CuHSO4+
- 0.21 0.18

406
Heavy Metal Speciation in the Presence of Ferrous Iron
Table G.96. Percent composition of heavy metals when present at their previously
calculated IC50s with 100 mM ferrous sulfate.
Pb+2
30.21 Zn+2
40.29 Cu+2
40.97
PbCl+
0.60 ZnCl+
0.05 CuCl+
0.04
PbSO4 (aq) 54.65 ZnSO4 (aq) 40.33 CuSO4 (aq) 58.77
Pb(SO4)2-2
14.51 Zn(SO4)2-2
15.99 CuHSO4+
0.21
PbNO3+
0.02 ZnS4O6 (aq) 3.34
PbH2PO4+
0.02
Table G.97. Percent composition of 100 mM ferrous sulfate when present with the
previously calculated IC50s of lead, zinc, or copper.
Lead Zinc Copper
78.24 68.41 56.39
0.02 0.02 0.01
21.47 31.31 43.34
0.27 0.26 0.26

407
Heavy Metal Speciation when Added as Chloride Salts
Table G.98. Percent composition of lead, zinc, and copper when added as chloride salts
to the previously calculated IC50s of corresponding sulfate salts.
Pb+2
36.35 Zn+2
60.71 Cu+2
71.37
PbCl+
1.43 ZnCl+
4.27 CuCl+
9.12
PbSO4 (aq) 53.96 ZnSO4 (aq) 0.03 CuSO4 (aq) 0.57
Pb(SO4)2-2
8.10 Zn(SO4)2-2
0.33 CuHSO4+
18.85
PbNO3+
0.02 ZnS4O6 (aq) 26.00
PbH2PO4+
0.13

408
APPENDIX H
CHAPTER FIVE RAW DATA

409
Effects of pH on Heavy-Metal Sorption to BC13
Lead
Table H.1. Sorption, Qt, of lead to viable BC13 cells with time at pH 1.5 and 45ºC.
Initial concentrations were the highest tested for lead, 0.241 mM.
Qt (mmol g-1
)
Elapsed Time (min) Trial 1 Trial 2 Trial 3 Average STDEV 95% CI
0 0.000 0.000 0.000 0.000 0.000 0.000
1 0.057 0.056 0.053 0.056 0.002 0.003
5 0.065 0.064 0.065 0.065 0.000 0.000
15 0.065 0.065 0.063 0.064 0.002 0.002
30 0.068 0.067 0.067 0.067 0.001 0.001
60 0.072 0.073 0.071 0.072 0.001 0.001
Table H.2. Equilibrium sorption, Qe, and solution, Ce, concentrations of lead in the
presence of viable BC13 cells at pH 1.5 and 45ºC, with varying concentrations, Co.
Qe (mmol g-1
) Ce (mmol L-1
)
Co (mmol L-1
) Trial 1 Trial 2 Trial 3 Trial 1 Trial 2 Trial 3
0.029 0.027 0.026 0.027 0.026 0.026 0.026
0.039 0.034 0.034 0.035 0.035 0.035 0.035
0.048 0.039 0.039 0.038 0.044 0.044 0.045
0.072 0.053 0.053 0.052 0.067 0.067 0.067
0.121 0.061 0.058 0.061 0.115 0.115 0.115
0.241 0.072 0.073 0.071 0.234 0.234 0.234
0
10
20
30
40
0 10 20 30 40
Ce-1 (L mmol-1)
Qe
-1 (
g m
mol
-1)
Figure H.1. Lineweaver-Burk plot relating equilibrium lead concentrations.

410
Table H.3. Sorption, Qt, of lead to viable BC13 cells with time at pH 2.5 and 45ºC.
Initial concentrations were the highest tested for lead, 0.241 mM.
Qt (mmol g-1
)
Elapsed Time (min) Trial 1 Trial 2 Trial 3 Average STDEV 95% CI
0 0.000 0.000 0.000 0.000 0.000 0.000
1 0.122 0.134 0.126 0.127 0.006 0.007
5 0.157 0.172 0.170 0.166 0.008 0.009
15 0.191 0.198 0.188 0.192 0.005 0.006
30 0.199 0.210 0.203 0.204 0.006 0.006
60 0.208 0.212 0.203 0.208 0.004 0.005
Table H.4. Equilibrium sorption, Qe, and solution, Ce, concentrations of lead in the
presence of viable BC13 cells at pH 2.5 and 45ºC, with varying concentrations, Co.
Qe (mmol g-1
) Ce (mmol L-1
)
Co (mmol L-1
) Trial 1 Trial 2 Trial 3 Trial 1 Trial 2 Trial 3
0.029 0.102 0.099 0.100 0.019 0.019 0.019
0.039 0.128 0.127 0.130 0.026 0.026 0.026
0.048 0.148 0.157 0.153 0.034 0.033 0.033
0.072 0.166 0.173 0.169 0.056 0.055 0.056
0.121 0.186 0.186 0.188 0.102 0.102 0.102
0.241 0.208 0.212 0.203 0.220 0.220 0.221
0
3
6
9
12
0 10 20 30 40 50 60
Ce-1 (L mmol-1)
Qe-1
(g m
mol-1
)
Figure H.2. Lineweaver-Burk plot relating equilibrium lead concentrations.

411
Table H.5. Sorption, Qt, of lead to viable BC13 cells with time at pH 4.0 and 45ºC.
Initial concentrations were the highest tested for lead, 0.241 mM.
Qt (mmol g-1
)
Elapsed Time (min) Trial 1 Trial 2 Trial 3 Average STDEV 95% CI
0 0.000 0.000 0.000 0.000 0.000 0.000
1 0.166 0.171 0.165 0.167 0.004 0.004
5 0.192 0.194 0.191 0.192 0.002 0.002
15 0.200 0.210 0.206 0.205 0.005 0.006
30 0.210 0.225 0.212 0.216 0.008 0.009
60 0.221 0.225 0.204 0.217 0.011 0.012
Table H.6. Equilibrium sorption, Qe, and solution, Ce, concentrations of lead in the
presence of viable BC13 cells at pH 4.0 and 45ºC, with varying concentrations, Co.
Qe (mmol g-1
) Ce (mmol L-1
)
Co (mmol L-1
) Trial 1 Trial 2 Trial 3 Trial 1 Trial 2 Trial 3
0.029 0.123 0.124 0.117 0.017 0.017 0.017
0.039 0.151 0.146 0.139 0.023 0.024 0.025
0.048 0.170 0.164 0.172 0.031 0.032 0.031
0.072 0.204 0.198 0.204 0.052 0.053 0.052
0.121 0.209 0.214 0.209 0.100 0.099 0.100
0.241 0.221 0.225 0.214 0.219 0.219 0.220
0
2
4
6
8
10
0 20 40 60 80
Ce-1 (L mmol-1)
Qe
-1 (
g m
mol-1
)
Figure H.3. Lineweaver-Burk plot relating equilibrium lead concentrations.

412
Table H.7. Sorption, Qt, of lead to viable BC13 cells with time at pH 5.5 and 45ºC.
Initial concentrations were the highest tested for lead, 0.241 mM.
Qt (mmol g-1
)
Elapsed Time (min) Trial 1 Trial 2 Trial 3 Average STDEV 95% CI
0 0.000 0.000 0.000 0.000 0.000 0.000
1 0.262 0.270 0.259 0.264 0.006 0.007
5 0.287 0.307 0.302 0.299 0.010 0.012
15 0.291 0.307 0.299 0.299 0.008 0.009
30 0.296 0.300 0.283 0.293 0.009 0.010
60 0.305 0.325 0.323 0.317 0.011 0.013
Table H.8. Equilibrium sorption, Qe, and solution, Ce, concentrations of lead in the
presence of viable BC13 cells at pH 5.5 and 45ºC, with varying concentrations, Co.
Qe (mmol g-1
) Ce (mmol L-1
)
Co (mmol L-1
) Trial 1 Trial 2 Trial 3 Trial 1 Trial 2 Trial 3
0.029 0.150 0.149 0.154 0.014 0.014 0.014
0.039 0.178 0.172 0.174 0.021 0.021 0.021
0.048 0.204 0.199 0.207 0.028 0.028 0.028
0.072 0.238 0.236 0.238 0.049 0.049 0.049
0.121 0.277 0.273 0.276 0.093 0.093 0.093
0.241 0.305 0.325 0.323 0.211 0.209 0.209
0
2
4
6
8
0 20 40 60 80
Ce-1 (L mmol-1)
Qe
-1 (
g m
mol-1
)
Figure H.4. Lineweaver-Burk plot relating equilibrium lead concentrations.
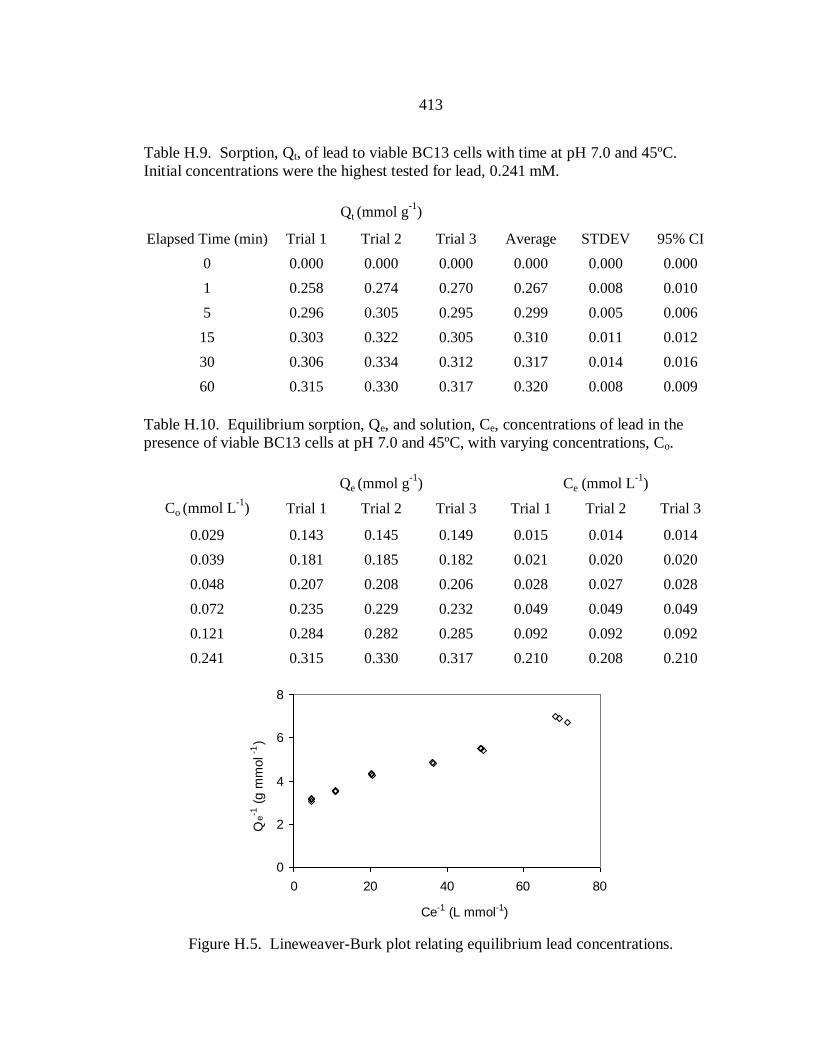
413
Table H.9. Sorption, Qt, of lead to viable BC13 cells with time at pH 7.0 and 45ºC.
Initial concentrations were the highest tested for lead, 0.241 mM.
Qt (mmol g-1
)
Elapsed Time (min) Trial 1 Trial 2 Trial 3 Average STDEV 95% CI
0 0.000 0.000 0.000 0.000 0.000 0.000
1 0.258 0.274 0.270 0.267 0.008 0.010
5 0.296 0.305 0.295 0.299 0.005 0.006
15 0.303 0.322 0.305 0.310 0.011 0.012
30 0.306 0.334 0.312 0.317 0.014 0.016
60 0.315 0.330 0.317 0.320 0.008 0.009
Table H.10. Equilibrium sorption, Qe, and solution, Ce, concentrations of lead in the
presence of viable BC13 cells at pH 7.0 and 45ºC, with varying concentrations, Co.
Qe (mmol g-1
) Ce (mmol L-1
)
Co (mmol L-1
) Trial 1 Trial 2 Trial 3 Trial 1 Trial 2 Trial 3
0.029 0.143 0.145 0.149 0.015 0.014 0.014
0.039 0.181 0.185 0.182 0.021 0.020 0.020
0.048 0.207 0.208 0.206 0.028 0.027 0.028
0.072 0.235 0.229 0.232 0.049 0.049 0.049
0.121 0.284 0.282 0.285 0.092 0.092 0.092
0.241 0.315 0.330 0.317 0.210 0.208 0.210
0
2
4
6
8
0 20 40 60 80
Ce-1 (L mmol-1)
Qe
-1 (
g m
mol-1
)
Figure H.5. Lineweaver-Burk plot relating equilibrium lead concentrations.

414
Table H.11. Sorption, Qt, of lead to dehydrated BC13 cells with time at pH 1.5 and 45ºC.
Initial concentrations were the highest tested for lead, 0.241 mM.
Qt (mmol g-1
)
Elapsed Time (min) Trial 1 Trial 2 Trial 3 Average STDEV 95% CI
0 0.000 0.000 0.000 0.000 0.000 0.000
1 0.026 0.027 0.027 5.581 0.001 0.001
5 0.037 0.039 0.035 7.667 0.002 0.002
15 0.038 0.041 0.039 8.123 0.002 0.002
30 0.039 0.043 0.042 8.588 0.002 0.002
60 0.040 0.042 0.040 8.248 0.001 0.002
Table H.12. Equilibrium sorption, Qe, and solution, Ce, concentrations of lead in the
presence of dehydrated BC13 cells at pH 1.5 and 45ºC, with varying concentrations, Co.
Qe (mmol g-1
) Ce (mmol L-1
)
Co (mmol L-1
) Trial 1 Trial 2 Trial 3 Trial 1 Trial 2 Trial 3
0.029 0.019 0.018 0.017 0.027 0.027 0.027
0.039 0.023 0.023 0.022 0.036 0.036 0.036
0.048 0.027 0.027 0.026 0.046 0.046 0.046
0.072 0.032 0.031 0.031 0.069 0.069 0.069
0.121 0.036 0.035 0.035 0.117 0.117 0.117
0.241 0.040 0.042 0.040 0.237 0.237 0.237
0
15
30
45
60
75
0 10 20 30 40
Ce-1 (L mmol-1)
Qe
-1 (
g m
mol-1
)
Figure H.6. Lineweaver-Burk plot relating equilibrium lead concentrations.

415
Table H.13. Sorption, Qt, of lead to dehydrated BC13 cells with time at pH 2.5 and 45ºC.
Initial concentrations were the highest tested for lead, 0.241 mM.
Qt (mmol g-1
)
Elapsed Time (min) Trial 1 Trial 2 Trial 3 Average STDEV 95% CI
0 0.000 0.000 0.000 0.000 0.000 0.000
1 0.107 0.116 0.115 0.113 0.005 0.006
5 0.120 0.124 0.117 0.121 0.004 0.004
15 0.121 0.133 0.121 0.125 0.007 0.008
30 0.123 0.125 0.118 0.122 0.004 0.004
60 0.128 0.136 0.127 0.131 0.005 0.006
Table H.14. Equilibrium sorption, Qe, and solution, Ce, concentrations of lead in the
presence of dehydrated BC13 cells at pH 2.5 and 45ºC, with varying concentrations, Co.
Qe (mmol g-1
) Ce (mmol L-1
)
Co (mmol L-1
) Trial 1 Trial 2 Trial 3 Trial 1 Trial 2 Trial 3
0.029 0.075 0.074 0.073 0.021 0.022 0.022
0.039 0.082 0.084 0.082 0.030 0.030 0.030
0.048 0.088 0.087 0.083 0.039 0.040 0.040
0.072 0.104 0.101 0.098 0.062 0.062 0.063
0.121 0.116 0.116 0.114 0.109 0.109 0.109
0.241 0.128 0.136 0.127 0.229 0.228 0.229
0
3
6
9
12
15
0 10 20 30 40 50
Ce-1 (L mmol-1)
Qe
-1 (
g m
mol-1
)
Figure H.7. Lineweaver-Burk plot relating equilibrium lead concentrations.
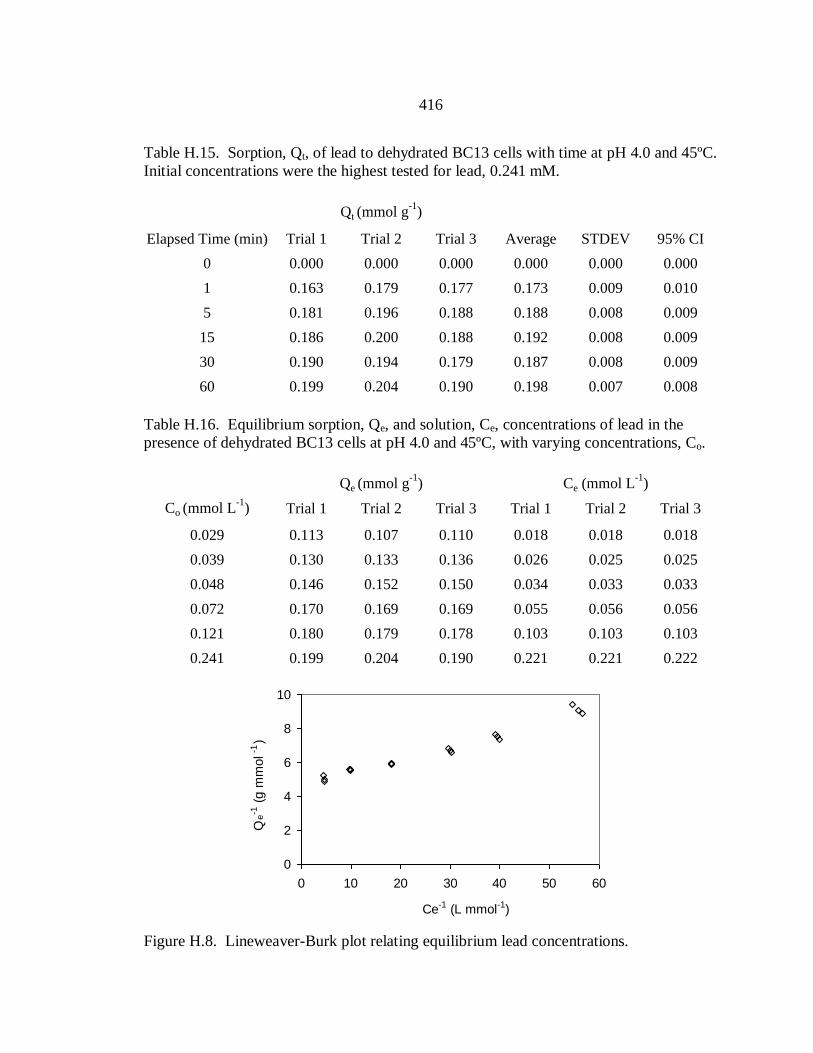
416
Table H.15. Sorption, Qt, of lead to dehydrated BC13 cells with time at pH 4.0 and 45ºC.
Initial concentrations were the highest tested for lead, 0.241 mM.
Qt (mmol g-1
)
Elapsed Time (min) Trial 1 Trial 2 Trial 3 Average STDEV 95% CI
0 0.000 0.000 0.000 0.000 0.000 0.000
1 0.163 0.179 0.177 0.173 0.009 0.010
5 0.181 0.196 0.188 0.188 0.008 0.009
15 0.186 0.200 0.188 0.192 0.008 0.009
30 0.190 0.194 0.179 0.187 0.008 0.009
60 0.199 0.204 0.190 0.198 0.007 0.008
Table H.16. Equilibrium sorption, Qe, and solution, Ce, concentrations of lead in the
presence of dehydrated BC13 cells at pH 4.0 and 45ºC, with varying concentrations, Co.
Qe (mmol g-1
) Ce (mmol L-1
)
Co (mmol L-1
) Trial 1 Trial 2 Trial 3 Trial 1 Trial 2 Trial 3
0.029 0.113 0.107 0.110 0.018 0.018 0.018
0.039 0.130 0.133 0.136 0.026 0.025 0.025
0.048 0.146 0.152 0.150 0.034 0.033 0.033
0.072 0.170 0.169 0.169 0.055 0.056 0.056
0.121 0.180 0.179 0.178 0.103 0.103 0.103
0.241 0.199 0.204 0.190 0.221 0.221 0.222
0
2
4
6
8
10
0 10 20 30 40 50 60
Ce-1 (L mmol-1)
Qe
-1 (
g m
mol-1
)
Figure H.8. Lineweaver-Burk plot relating equilibrium lead concentrations.

417
Table H.17. Sorption, Qt, of lead to dehydrated BC13 cells with time at pH 5.5 and 45ºC.
Initial concentrations were the highest tested for lead, 0.241 mM.
Qt (mmol g-1
)
Elapsed Time (min) Trial 1 Trial 2 Trial 3 Average STDEV 95% CI
0 0.000 0.000 0.000 0.000 0.000 0.000
1 0.242 0.250 0.234 0.242 0.008 0.009
5 0.249 0.253 0.229 0.244 0.013 0.015
15 0.255 0.263 0.243 0.254 0.010 0.011
30 0.260 0.263 0.258 0.260 0.003 0.003
60 0.269 0.271 0.252 0.264 0.010 0.012
Table H.18. Equilibrium sorption, Qe, and solution, Ce, concentrations of lead in the
presence of dehydrated BC13 cells at pH 5.5 and 45ºC, with varying concentrations, Co.
Qe (mmol g-1
) Ce (mmol L-1
)
Co (mmol L-1
) Trial 1 Trial 2 Trial 3 Trial 1 Trial 2 Trial 3
0.029 0.136 0.135 0.135 0.015 0.015 0.015
0.039 0.167 0.163 0.163 0.022 0.022 0.022
0.048 0.191 0.188 0.191 0.029 0.029 0.029
0.072 0.214 0.213 0.217 0.051 0.051 0.051
0.121 0.237 0.241 0.233 0.097 0.097 0.097
0.241 0.269 0.271 0.252 0.214 0.214 0.216
0
2
4
6
8
0 20 40 60 80
Ce-1 (L mmol-1)
Qe-1
(g m
mol-1
)
Figure H.9. Lineweaver-Burk plot relating equilibrium lead concentrations.

418
Table H.19. Sorption, Qt, of lead to dehydrated BC13 cells with time at pH 7.0 and 45ºC.
Initial concentrations were the highest tested for lead, 0.241 mM.
Qt (mmol g-1
)
Elapsed Time (min) Trial 1 Trial 2 Trial 3 Average STDEV 95% CI
0 0.000 0.000 0.000 0.000 0.000 0.000
1 0.193 0.208 0.198 0.200 0.008 0.009
5 0.200 0.214 0.210 0.208 0.007 0.008
15 0.206 0.214 0.197 0.206 0.009 0.010
30 0.214 0.217 0.214 0.215 0.001 0.002
60 0.220 0.227 0.216 0.221 0.006 0.006
Table H.20. Equilibrium sorption, Qe, and solution, Ce, concentrations of lead in the
presence of dehydrated BC13 cells at pH 7.0 and 45ºC, with varying concentrations, Co.
Qe (mmol g-1
) Ce (mmol L-1
)
Co (mmol L-1
) Trial 1 Trial 2 Trial 3 Trial 1 Trial 2 Trial 3
0.029 0.117 0.121 0.124 0.017 0.017 0.017
0.039 0.145 0.151 0.155 0.024 0.023 0.023
0.048 0.176 0.169 0.171 0.031 0.031 0.031
0.072 0.194 0.199 0.205 0.053 0.053 0.052
0.121 0.231 0.241 0.231 0.098 0.097 0.098
0.241 0.220 0.227 0.216 0.219 0.219 0.220
0
2
4
6
8
10
0 20 40 60 80
Ce-1 (L mmol-1)
Qe-1
(g m
mol
-1)
Figure H.10. Lineweaver-Burk plot relating equilibrium lead concentrations.
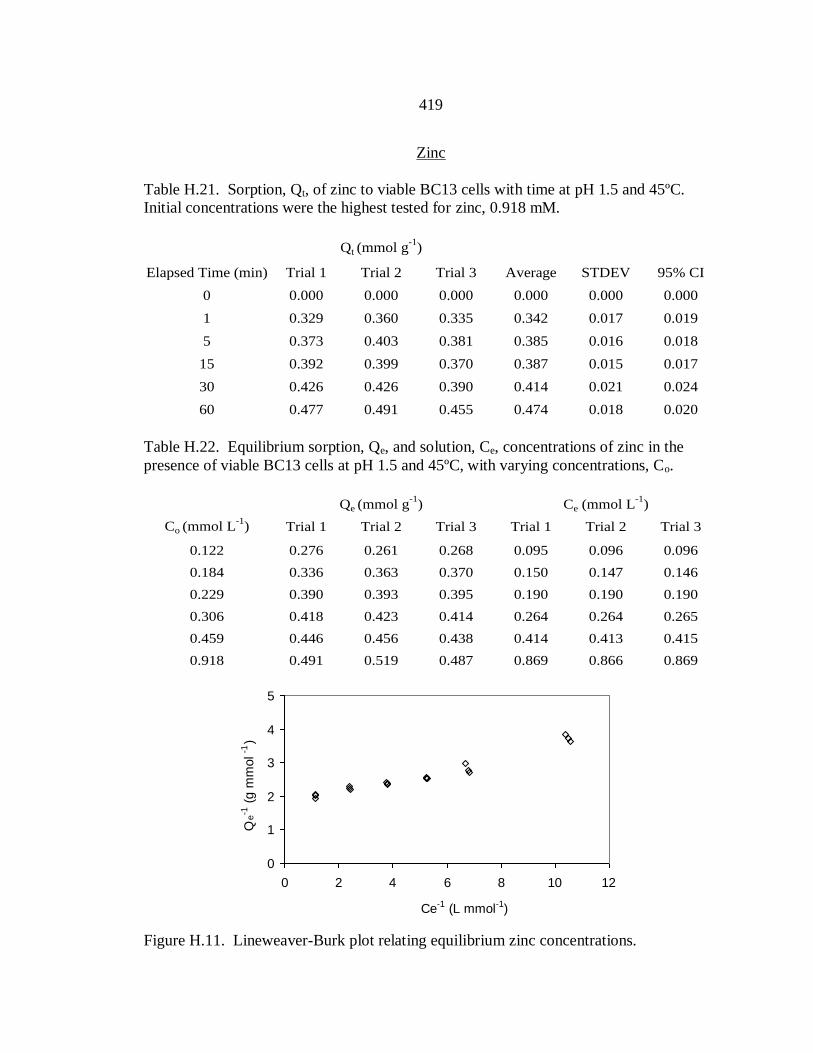
419
Zinc
Table H.21. Sorption, Qt, of zinc to viable BC13 cells with time at pH 1.5 and 45ºC.
Initial concentrations were the highest tested for zinc, 0.918 mM.
Qt (mmol g-1
)
Elapsed Time (min) Trial 1 Trial 2 Trial 3 Average STDEV 95% CI
0 0.000 0.000 0.000 0.000 0.000 0.000
1 0.329 0.360 0.335 0.342 0.017 0.019
5 0.373 0.403 0.381 0.385 0.016 0.018
15 0.392 0.399 0.370 0.387 0.015 0.017
30 0.426 0.426 0.390 0.414 0.021 0.024
60 0.477 0.491 0.455 0.474 0.018 0.020
Table H.22. Equilibrium sorption, Qe, and solution, Ce, concentrations of zinc in the
presence of viable BC13 cells at pH 1.5 and 45ºC, with varying concentrations, Co.
Qe (mmol g-1
) Ce (mmol L-1
)
Co (mmol L-1
) Trial 1 Trial 2 Trial 3 Trial 1 Trial 2 Trial 3
0.122 0.276 0.261 0.268 0.095 0.096 0.096
0.184 0.336 0.363 0.370 0.150 0.147 0.146
0.229 0.390 0.393 0.395 0.190 0.190 0.190
0.306 0.418 0.423 0.414 0.264 0.264 0.265
0.459 0.446 0.456 0.438 0.414 0.413 0.415
0.918 0.491 0.519 0.487 0.869 0.866 0.869
0
1
2
3
4
5
0 2 4 6 8 10 12
Ce-1 (L mmol-1)
Qe
-1 (
g m
mol
-1)
Figure H.11. Lineweaver-Burk plot relating equilibrium zinc concentrations.
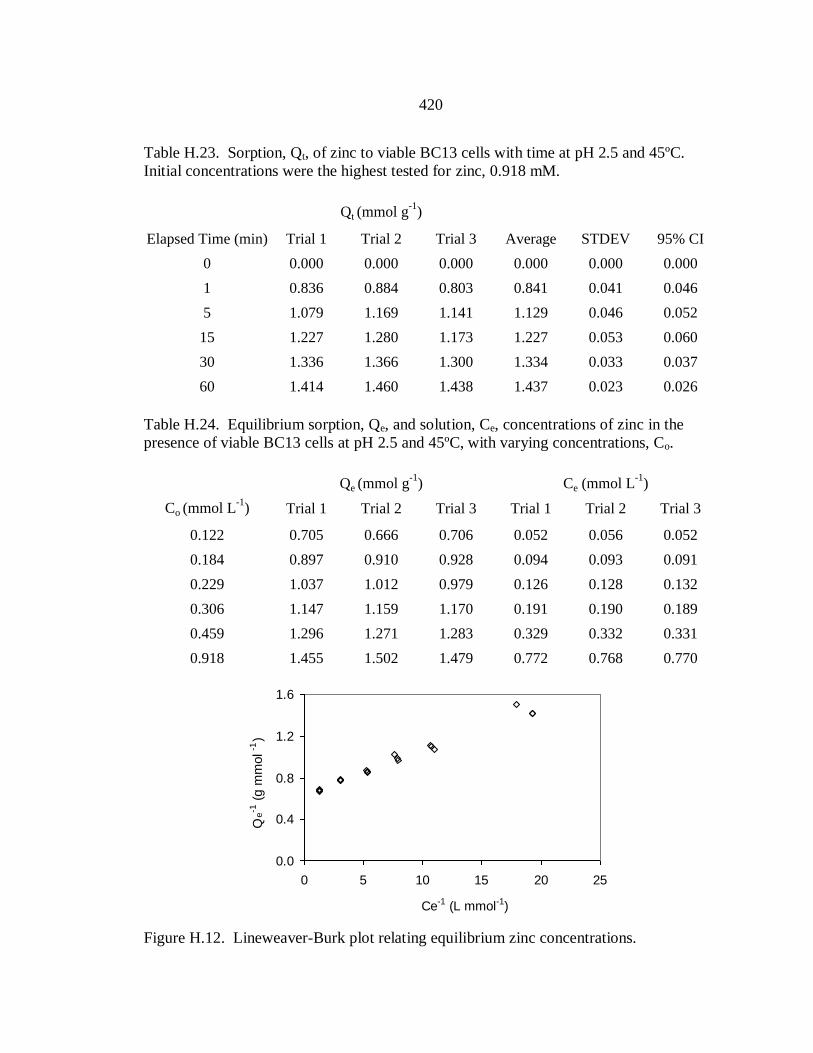
420
Table H.23. Sorption, Qt, of zinc to viable BC13 cells with time at pH 2.5 and 45ºC.
Initial concentrations were the highest tested for zinc, 0.918 mM.
Qt (mmol g-1
)
Elapsed Time (min) Trial 1 Trial 2 Trial 3 Average STDEV 95% CI
0 0.000 0.000 0.000 0.000 0.000 0.000
1 0.836 0.884 0.803 0.841 0.041 0.046
5 1.079 1.169 1.141 1.129 0.046 0.052
15 1.227 1.280 1.173 1.227 0.053 0.060
30 1.336 1.366 1.300 1.334 0.033 0.037
60 1.414 1.460 1.438 1.437 0.023 0.026
Table H.24. Equilibrium sorption, Qe, and solution, Ce, concentrations of zinc in the
presence of viable BC13 cells at pH 2.5 and 45ºC, with varying concentrations, Co.
Qe (mmol g-1
) Ce (mmol L-1
)
Co (mmol L-1
) Trial 1 Trial 2 Trial 3 Trial 1 Trial 2 Trial 3
0.122 0.705 0.666 0.706 0.052 0.056 0.052
0.184 0.897 0.910 0.928 0.094 0.093 0.091
0.229 1.037 1.012 0.979 0.126 0.128 0.132
0.306 1.147 1.159 1.170 0.191 0.190 0.189
0.459 1.296 1.271 1.283 0.329 0.332 0.331
0.918 1.455 1.502 1.479 0.772 0.768 0.770
0.0
0.4
0.8
1.2
1.6
0 5 10 15 20 25
Ce-1 (L mmol-1)
Qe-1
(g m
mol
-1)
Figure H.12. Lineweaver-Burk plot relating equilibrium zinc concentrations.

421
Table H.25. Sorption, Qt, of zinc to viable BC13 cells with time at pH 4.0 and 45ºC.
Initial concentrations were the highest tested for zinc, 0.918 mM.
Qt (mmol g-1
)
Elapsed Time (min) Trial 1 Trial 2 Trial 3 Average STDEV 95% CI
0 0.000 0.000 0.000 0.000 0.000 0.000
1 0.922 1.006 0.979 0.969 0.043 0.048
5 1.273 1.284 1.263 1.274 0.011 0.012
15 1.371 1.441 1.338 1.383 0.052 0.059
30 1.543 1.630 1.542 1.572 0.050 0.057
60 1.568 1.699 1.551 1.606 0.081 0.091
Table H.26. Equilibrium sorption, Qe, and solution, Ce, concentrations of zinc in the
presence of viable BC13 cells at pH 4.0 and 45ºC, with varying concentrations, Co.
Qe (mmol g-1
) Ce (mmol L-1
)
Co (mmol L-1
) Trial 1 Trial 2 Trial 3 Trial 1 Trial 2 Trial 3
0.122 0.745 0.718 0.728 0.048 0.051 0.050
0.184 0.924 0.891 0.928 0.091 0.094 0.091
0.229 1.007 0.991 0.997 0.129 0.130 0.130
0.306 1.175 1.188 1.141 0.188 0.187 0.192
0.459 1.278 1.299 1.275 0.331 0.329 0.331
0.918 1.614 1.598 1.595 0.756 0.758 0.758
0.0
0.4
0.8
1.2
1.6
0 5 10 15 20 25
Ce-1 (L mmol-1)
Qe-1
(g m
mol
-1)
Figure H.13. Lineweaver-Burk plot relating equilibrium zinc concentrations.
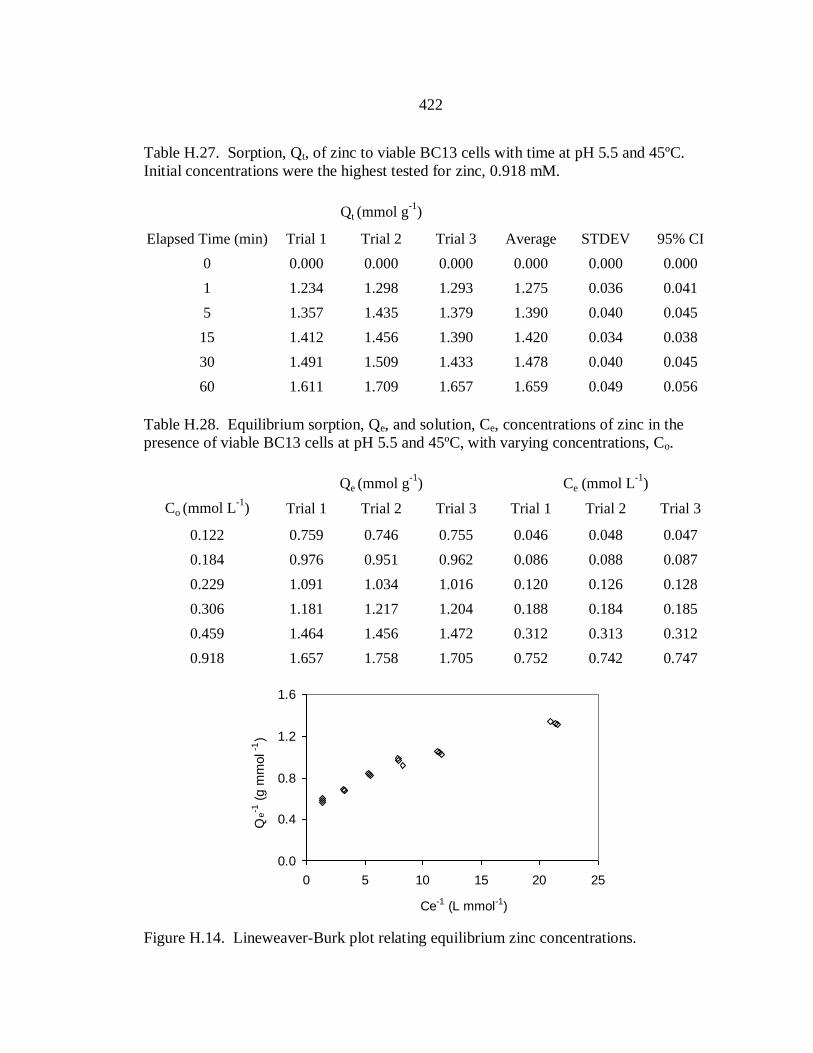
422
Table H.27. Sorption, Qt, of zinc to viable BC13 cells with time at pH 5.5 and 45ºC.
Initial concentrations were the highest tested for zinc, 0.918 mM.
Qt (mmol g-1
)
Elapsed Time (min) Trial 1 Trial 2 Trial 3 Average STDEV 95% CI
0 0.000 0.000 0.000 0.000 0.000 0.000
1 1.234 1.298 1.293 1.275 0.036 0.041
5 1.357 1.435 1.379 1.390 0.040 0.045
15 1.412 1.456 1.390 1.420 0.034 0.038
30 1.491 1.509 1.433 1.478 0.040 0.045
60 1.611 1.709 1.657 1.659 0.049 0.056
Table H.28. Equilibrium sorption, Qe, and solution, Ce, concentrations of zinc in the
presence of viable BC13 cells at pH 5.5 and 45ºC, with varying concentrations, Co.
Qe (mmol g-1
) Ce (mmol L-1
)
Co (mmol L-1
) Trial 1 Trial 2 Trial 3 Trial 1 Trial 2 Trial 3
0.122 0.759 0.746 0.755 0.046 0.048 0.047
0.184 0.976 0.951 0.962 0.086 0.088 0.087
0.229 1.091 1.034 1.016 0.120 0.126 0.128
0.306 1.181 1.217 1.204 0.188 0.184 0.185
0.459 1.464 1.456 1.472 0.312 0.313 0.312
0.918 1.657 1.758 1.705 0.752 0.742 0.747
0.0
0.4
0.8
1.2
1.6
0 5 10 15 20 25
Ce-1 (L mmol-1)
Qe-1
(g m
mol
-1)
Figure H.14. Lineweaver-Burk plot relating equilibrium zinc concentrations.
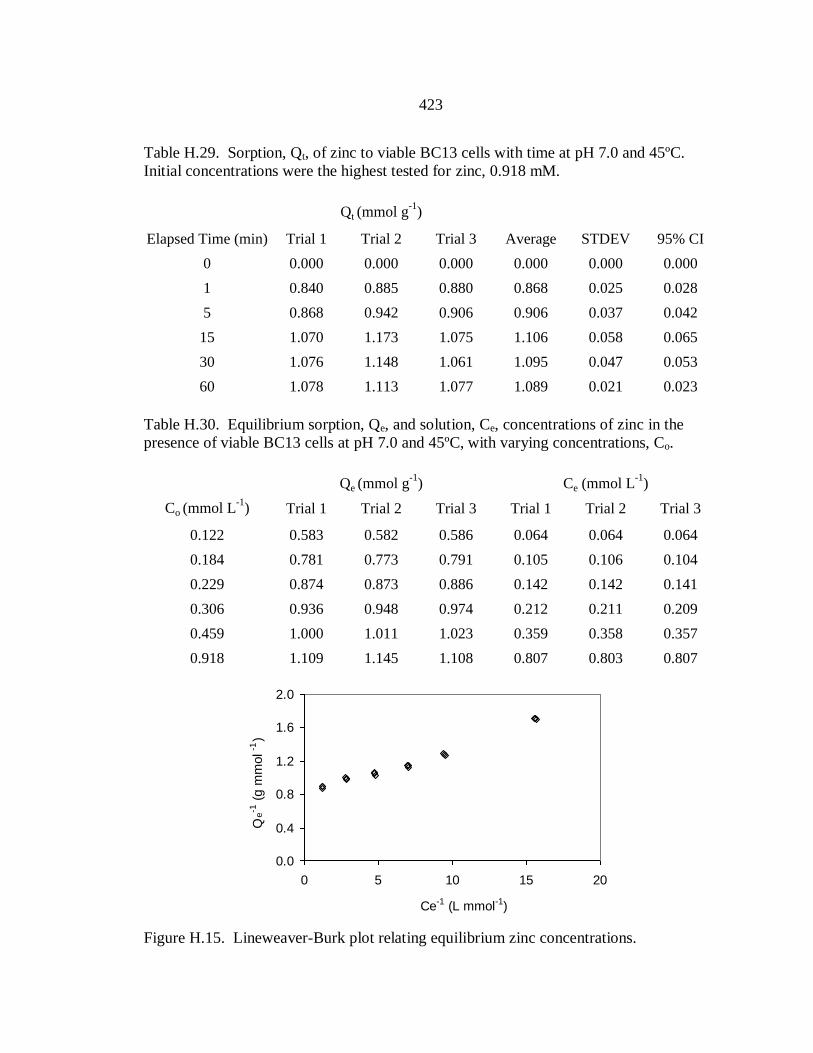
423
Table H.29. Sorption, Qt, of zinc to viable BC13 cells with time at pH 7.0 and 45ºC.
Initial concentrations were the highest tested for zinc, 0.918 mM.
Qt (mmol g-1
)
Elapsed Time (min) Trial 1 Trial 2 Trial 3 Average STDEV 95% CI
0 0.000 0.000 0.000 0.000 0.000 0.000
1 0.840 0.885 0.880 0.868 0.025 0.028
5 0.868 0.942 0.906 0.906 0.037 0.042
15 1.070 1.173 1.075 1.106 0.058 0.065
30 1.076 1.148 1.061 1.095 0.047 0.053
60 1.078 1.113 1.077 1.089 0.021 0.023
Table H.30. Equilibrium sorption, Qe, and solution, Ce, concentrations of zinc in the
presence of viable BC13 cells at pH 7.0 and 45ºC, with varying concentrations, Co.
Qe (mmol g-1
) Ce (mmol L-1
)
Co (mmol L-1
) Trial 1 Trial 2 Trial 3 Trial 1 Trial 2 Trial 3
0.122 0.583 0.582 0.586 0.064 0.064 0.064
0.184 0.781 0.773 0.791 0.105 0.106 0.104
0.229 0.874 0.873 0.886 0.142 0.142 0.141
0.306 0.936 0.948 0.974 0.212 0.211 0.209
0.459 1.000 1.011 1.023 0.359 0.358 0.357
0.918 1.109 1.145 1.108 0.807 0.803 0.807
0.0
0.4
0.8
1.2
1.6
2.0
0 5 10 15 20
Ce-1 (L mmol-1)
Qe-1
(g m
mol
-1)
Figure H.15. Lineweaver-Burk plot relating equilibrium zinc concentrations.

424
Table H.31. Sorption, Qt, of zinc to dehydrated BC13 cells with time at pH 1.5 and 45ºC.
Initial concentrations were the highest tested for zinc, 0.918 mM.
Qt (mmol g-1
)
Elapsed Time (min) Trial 1 Trial 2 Trial 3 Average STDEV 95% CI
0 0.000 0.000 0.000 0.000 0.000 0.000
1 0.148 0.150 0.148 0.149 0.001 0.001
5 0.168 0.177 0.177 0.174 0.005 0.006
15 0.184 0.194 0.186 0.188 0.005 0.006
30 0.180 0.181 0.176 0.179 0.002 0.003
60 0.189 0.204 0.198 0.197 0.008 0.009
Table H.32. Equilibrium sorption, Qe, and solution, Ce, concentrations of zinc in the
presence of dehydrated BC13 cells at pH 1.5 and 45ºC, with varying concentrations, Co.
Qe (mmol g-1
) Ce (mmol L-1
)
Co (mmol L-1
) Trial 1 Trial 2 Trial 3 Trial 1 Trial 2 Trial 3
0.122 0.103 0.102 0.104 0.112 0.112 0.112
0.184 0.121 0.117 0.119 0.171 0.172 0.172
0.229 0.133 0.134 0.134 0.216 0.216 0.216
0.306 0.147 0.149 0.151 0.291 0.291 0.291
0.459 0.161 0.170 0.163 0.443 0.442 0.443
0.918 0.194 0.210 0.203 0.898 0.897 0.897
0
3
6
9
12
0 2 4 6 8 10
Ce-1 (L mmol-1)
Qe-1
(g m
mol
-1)
Figure H.16. Lineweaver-Burk plot relating equilibrium zinc concentrations.

425
Table H.33. Sorption, Qt, of zinc to dehydrated BC13 cells with time at pH 2.5 and 45ºC.
Initial concentrations were the highest tested for zinc, 0.918 mM.
Qt (mmol g-1
)
Elapsed Time (min) Trial 1 Trial 2 Trial 3 Average STDEV 95% CI
0 0.000 0.000 0.000 0.000 0.000 0.000
1 0.435 0.444 0.415 0.431 0.015 0.017
5 0.428 0.467 0.427 0.441 0.023 0.026
15 0.439 0.479 0.478 0.465 0.023 0.026
30 0.492 0.512 0.500 0.501 0.010 0.011
60 0.516 0.549 0.546 0.537 0.018 0.021
Table H.34. Equilibrium sorption, Qe, and solution, Ce, concentrations of zinc in the
presence of dehydrated BC13 cells at pH 2.5 and 45ºC, with varying concentrations, Co.
Qe (mmol g-1
) Ce (mmol L-1
)
Co (mmol L-1
) Trial 1 Trial 2 Trial 3 Trial 1 Trial 2 Trial 3
0.122 0.330 0.339 0.329 0.089 0.088 0.089
0.184 0.383 0.383 0.380 0.145 0.145 0.146
0.229 0.404 0.419 0.416 0.189 0.188 0.188
0.306 0.438 0.445 0.440 0.262 0.261 0.262
0.459 0.457 0.451 0.471 0.413 0.414 0.412
0.918 0.531 0.565 0.562 0.865 0.861 0.862
0
1
2
3
4
0 2 4 6 8 10 12
Ce-1 (L mmol-1)
Qe-1
(g m
mol
-1)
Figure H.17. Lineweaver-Burk plot relating equilibrium zinc concentrations.
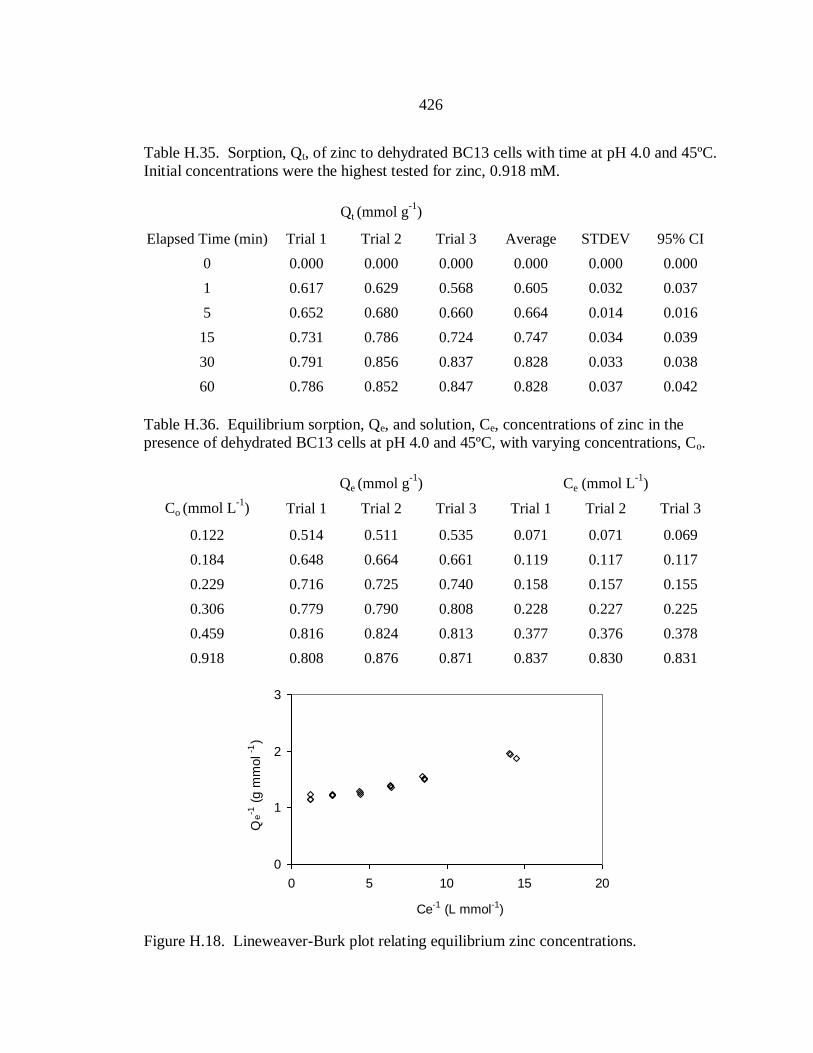
426
Table H.35. Sorption, Qt, of zinc to dehydrated BC13 cells with time at pH 4.0 and 45ºC.
Initial concentrations were the highest tested for zinc, 0.918 mM.
Qt (mmol g-1
)
Elapsed Time (min) Trial 1 Trial 2 Trial 3 Average STDEV 95% CI
0 0.000 0.000 0.000 0.000 0.000 0.000
1 0.617 0.629 0.568 0.605 0.032 0.037
5 0.652 0.680 0.660 0.664 0.014 0.016
15 0.731 0.786 0.724 0.747 0.034 0.039
30 0.791 0.856 0.837 0.828 0.033 0.038
60 0.786 0.852 0.847 0.828 0.037 0.042
Table H.36. Equilibrium sorption, Qe, and solution, Ce, concentrations of zinc in the
presence of dehydrated BC13 cells at pH 4.0 and 45ºC, with varying concentrations, Co.
Qe (mmol g-1
) Ce (mmol L-1
)
Co (mmol L-1
) Trial 1 Trial 2 Trial 3 Trial 1 Trial 2 Trial 3
0.122 0.514 0.511 0.535 0.071 0.071 0.069
0.184 0.648 0.664 0.661 0.119 0.117 0.117
0.229 0.716 0.725 0.740 0.158 0.157 0.155
0.306 0.779 0.790 0.808 0.228 0.227 0.225
0.459 0.816 0.824 0.813 0.377 0.376 0.378
0.918 0.808 0.876 0.871 0.837 0.830 0.831
0
1
2
3
0 5 10 15 20
Ce-1 (L mmol-1)
Qe
-1 (
g m
mol-1
)
Figure H.18. Lineweaver-Burk plot relating equilibrium zinc concentrations.

427
Table H.37. Sorption, Qt, of zinc to dehydrated BC13 cells with time at pH 5.5 and 45ºC.
Initial concentrations were the highest tested for zinc, 0.918 mM.
Qt (mmol g-1
)
Elapsed Time (min) Trial 1 Trial 2 Trial 3 Average STDEV 95% CI
0 0.000 0.000 0.000 0.000 0.000 0.000
1 0.729 0.776 0.770 0.758 0.026 0.030
5 0.764 0.766 0.716 0.749 0.028 0.032
15 0.772 0.781 0.707 0.753 0.041 0.046
30 0.785 0.814 0.748 0.783 0.033 0.037
60 0.802 0.855 0.813 0.823 0.028 0.031
Table H.38. Equilibrium sorption, Qe, and solution, Ce, concentrations of zinc in the
presence of dehydrated BC13 cells at pH 5.5 and 45ºC, with varying concentrations, Co.
Qe (mmol g-1
) Ce (mmol L-1
)
Co (mmol L-1
) Trial 1 Trial 2 Trial 3 Trial 1 Trial 2 Trial 3
0.122 0.512 0.507 0.513 0.071 0.072 0.071
0.184 0.632 0.642 0.630 0.120 0.119 0.121
0.229 0.722 0.724 0.743 0.157 0.157 0.155
0.306 0.760 0.748 0.735 0.230 0.231 0.232
0.459 0.803 0.785 0.808 0.379 0.380 0.378
0.918 0.825 0.880 0.837 0.835 0.830 0.834
0
1
2
3
0 5 10 15
Ce-1 (L mmol-1)
Qe-1
(g m
mol
-1)
Figure H.19. Lineweaver-Burk plot relating equilibrium zinc concentrations.
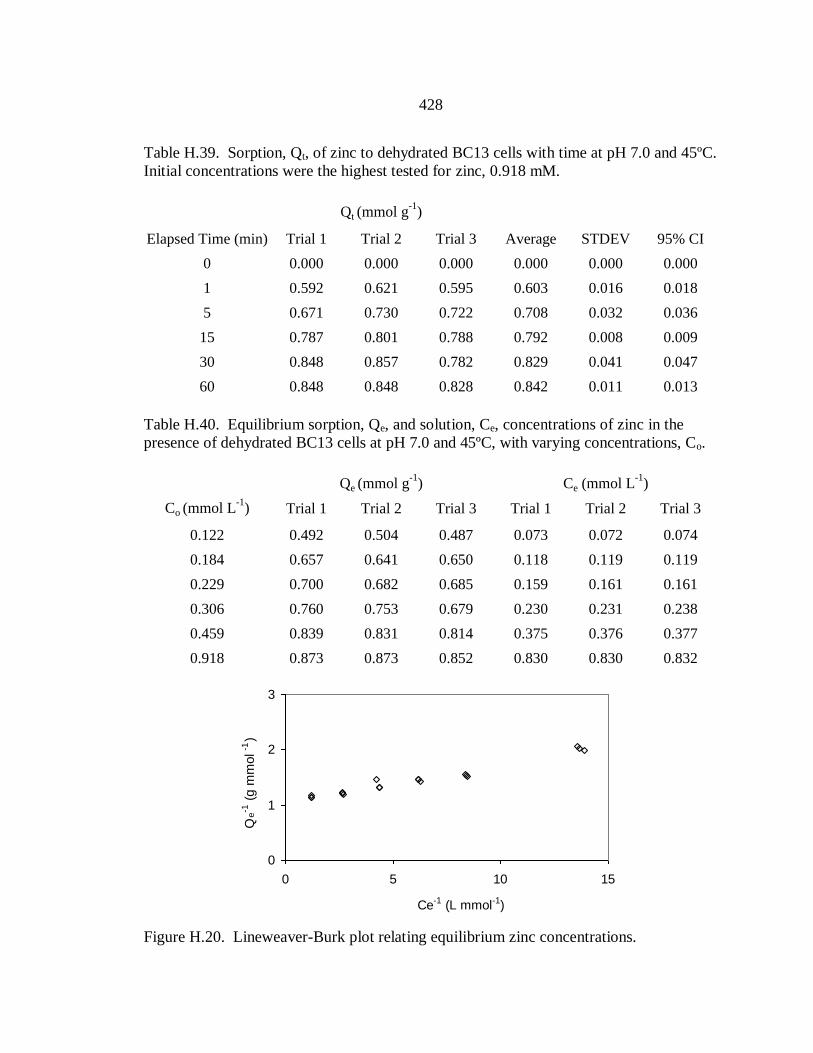
428
Table H.39. Sorption, Qt, of zinc to dehydrated BC13 cells with time at pH 7.0 and 45ºC.
Initial concentrations were the highest tested for zinc, 0.918 mM.
Qt (mmol g-1
)
Elapsed Time (min) Trial 1 Trial 2 Trial 3 Average STDEV 95% CI
0 0.000 0.000 0.000 0.000 0.000 0.000
1 0.592 0.621 0.595 0.603 0.016 0.018
5 0.671 0.730 0.722 0.708 0.032 0.036
15 0.787 0.801 0.788 0.792 0.008 0.009
30 0.848 0.857 0.782 0.829 0.041 0.047
60 0.848 0.848 0.828 0.842 0.011 0.013
Table H.40. Equilibrium sorption, Qe, and solution, Ce, concentrations of zinc in the
presence of dehydrated BC13 cells at pH 7.0 and 45ºC, with varying concentrations, Co.
Qe (mmol g-1
) Ce (mmol L-1
)
Co (mmol L-1
) Trial 1 Trial 2 Trial 3 Trial 1 Trial 2 Trial 3
0.122 0.492 0.504 0.487 0.073 0.072 0.074
0.184 0.657 0.641 0.650 0.118 0.119 0.119
0.229 0.700 0.682 0.685 0.159 0.161 0.161
0.306 0.760 0.753 0.679 0.230 0.231 0.238
0.459 0.839 0.831 0.814 0.375 0.376 0.377
0.918 0.873 0.873 0.852 0.830 0.830 0.832
0
1
2
3
0 5 10 15
Ce-1 (L mmol-1)
Qe-1
(g m
mol
-1)
Figure H.20. Lineweaver-Burk plot relating equilibrium zinc concentrations.

429
Copper
Table H.41. Sorption, Qt, of copper to viable BC13 cells with time at pH 1.5 and 45ºC.
Initial concentrations were the highest tested for copper, 1.574 mM.
Qt (mmol g-1
)
Elapsed Time (min) Trial 1 Trial 2 Trial 3 Average STDEV 95% CI
0 0.000 0.000 0.000 0.000 0.000 0.000
1 1.112 1.197 1.120 1.143 0.047 0.053
5 1.280 1.360 1.321 1.320 0.040 0.045
15 1.361 1.370 1.256 1.329 0.064 0.072
30 1.428 1.458 1.344 1.410 0.059 0.067
60 1.484 1.627 1.545 1.552 0.072 0.081
Table H.42. Equilibrium sorption, Qe, and solution, Ce, concentrations of copper in the
presence of viable BC13 cells at pH 1.5 and 45ºC, with varying concentrations, Co.
Qe (mmol g-1
) Ce (mmol L-1
)
Co (mmol L-1
) Trial 1 Trial 2 Trial 3 Trial 1 Trial 2 Trial 3
0.189 0.956 0.944 0.924 0.093 0.094 0.096
0.236 1.110 1.123 1.094 0.125 0.124 0.127
0.315 1.241 1.170 1.190 0.191 0.198 0.196
0.393 1.271 1.277 1.307 0.266 0.266 0.263
0.787 1.392 1.399 1.375 0.648 0.647 0.649
1.574 1.484 1.514 1.504 1.425 1.422 1.423
0.0
0.2
0.4
0.6
0.8
1.0
1.2
0 2 4 6 8 10 12
Ce-1 (L mmol-1)
Qe-1
(g m
mol
-1)
Figure H.21. Lineweaver-Burk plot relating equilibrium copper concentrations.

430
Table H.43. Sorption, Qt, of copper to viable BC13 cells with time at pH 2.5 and 45ºC.
Initial concentrations were the highest tested for copper, 1.574 mM.
Qt (mmol g-1
)
Elapsed Time (min) Trial 1 Trial 2 Trial 3 Average STDEV 95% CI
0 0.000 0.000 0.000 0.000 0.000 0.000
1 1.337 1.436 1.398 1.390 0.050 0.057
5 2.280 2.493 2.390 2.387 0.106 0.120
15 2.731 2.746 2.677 2.718 0.036 0.041
30 2.836 2.959 2.943 2.913 0.067 0.076
60 2.888 2.894 2.732 2.838 0.092 0.104
Table H.44. Equilibrium sorption, Qe, and solution, Ce, concentrations of copper in the
presence of viable BC13 cells at pH 2.5 and 45ºC, with varying concentrations, Co.
Qe (mmol g-1
) Ce (mmol L-1
)
Co (mmol L-1
) Trial 1 Trial 2 Trial 3 Trial 1 Trial 2 Trial 3
0.189 1.542 1.528 1.521 0.035 0.036 0.037
0.236 1.786 1.804 1.811 0.057 0.056 0.055
0.315 2.102 2.132 2.114 0.104 0.102 0.103
0.393 2.272 2.220 2.236 0.166 0.171 0.170
0.787 2.684 2.763 2.285 0.518 0.510 0.558
1.574 2.888 2.850 2.732 1.285 1.289 1.300
0.0
0.2
0.4
0.6
0.8
0 10 20 30 40
Ce-1 (L mmol-1)
Qe
-1 (
g m
mol
-1)
Figure H.22. Lineweaver-Burk plot relating equilibrium copper concentrations.

431
Table H.45. Sorption, Qt, of copper to viable BC13 cells with time at pH 4.0 and 45ºC.
Initial concentrations were the highest tested for copper, 1.574 mM.
Qt (mmol g-1
)
Elapsed Time (min) Trial 1 Trial 2 Trial 3 Average STDEV 95% CI
0 0.000 0.000 0.000 0.000 0.000 0.000
1 3.647 3.546 3.318 3.036 0.169 0.191
5 4.153 3.951 4.039 3.825 0.101 0.114
15 4.701 4.571 4.372 4.286 0.166 0.188
30 4.872 4.722 4.553 4.487 0.159 0.180
60 4.964 4.915 4.898 4.628 0.034 0.039
Table H.46. Equilibrium sorption, Qe, and solution, Ce, concentrations of copper in the
presence of viable BC13 cells at pH 4.0 and 45ºC, with varying concentrations, Co.
Qe (mmol g-1
) Ce (mmol L-1
)
Co (mmol L-1
) Trial 1 Trial 2 Trial 3 Trial 1 Trial 2 Trial 3
0.189 1.740 1.731 1.744 0.015 0.016 0.014
0.236 2.130 2.101 2.098 0.023 0.026 0.026
0.315 2.744 2.696 2.665 0.040 0.045 0.048
0.393 3.389 3.264 3.310 0.055 0.067 0.062
0.787 4.663 4.724 4.741 0.320 0.314 0.313
1.574 4.964 4.915 4.898 1.077 1.082 1.084
0.0
0.2
0.4
0.6
0.8
0 20 40 60 80
Ce-1 (L mmol-1)
Qe
-1 (
g m
mol
-1)
Figure H.23. Lineweaver-Burk plot relating equilibrium copper concentrations.

432
Table H.47. Sorption, Qt, of copper to viable BC13 cells with time at pH 5.5 and 45ºC.
Initial concentrations were the highest tested for copper, 1.574 mM.
Qt (mmol g-1
)
Elapsed Time (min) Trial 1 Trial 2 Trial 3 Average STDEV 95% CI
0 0.000 0.000 0.000 0.000 0.000 0.000
1 4.098 4.290 4.078 4.155 0.117 0.132
5 4.181 4.572 4.558 4.437 0.222 0.251
15 4.270 4.353 3.950 4.191 0.213 0.241
30 4.526 4.651 4.608 4.595 0.063 0.071
60 4.723 4.991 4.512 4.742 0.240 0.271
Table H.48. Equilibrium sorption, Qe, and solution, Ce, concentrations of copper in the
presence of viable BC13 cells at pH 5.5 and 45ºC, with varying concentrations, Co.
Qe (mmol g-1
) Ce (mmol L-1
)
Co (mmol L-1
) Trial 1 Trial 2 Trial 3 Trial 1 Trial 2 Trial 3
0.189 1.657 1.649 1.642 0.023 0.024 0.025
0.236 2.115 2.067 2.065 0.025 0.029 0.030
0.315 2.679 2.656 2.604 0.047 0.049 0.054
0.393 3.154 3.109 3.094 0.078 0.083 0.084
0.787 4.270 4.446 4.348 0.360 0.342 0.352
1.574 4.553 4.522 4.393 1.118 1.122 1.134
0.0
0.2
0.4
0.6
0.8
0 10 20 30 40 50
Ce-1 (L mmol-1)
Qe-1
(g m
mol
-1)
Figure H.24. Lineweaver-Burk plot relating equilibrium copper concentrations.

433
Table H.49. Sorption, Qt, of copper to viable BC13 cells with time at pH 7.0 and 45ºC.
Initial concentrations were the highest tested for copper, 1.574 mM.
Qt (mmol g-1
)
Elapsed Time (min) Trial 1 Trial 2 Trial 3 Average STDEV 95% CI
0 0.000 0.000 0.000 0.000 0.000 0.000
1 3.342 3.625 3.581 3.516 0.152 0.173
5 3.942 4.053 3.917 3.970 0.073 0.082
15 4.151 4.477 4.447 4.358 0.180 0.204
30 4.410 4.445 4.411 4.422 0.020 0.022
60 4.380 4.776 4.585 4.580 0.198 0.224
Table H.50. Equilibrium sorption, Qe, and solution, Ce, concentrations of copper in the
presence of viable BC13 cells at pH 7.0 and 45ºC, with varying concentrations, Co.
Qe (mmol g-1
) Ce (mmol L-1
)
Co (mmol L-1
) Trial 1 Trial 2 Trial 3 Trial 1 Trial 2 Trial 3
0.189 1.598 1.587 1.610 0.029 0.030 0.028
0.236 1.973 1.988 1.909 0.039 0.037 0.045
0.315 2.604 2.635 2.621 0.054 0.051 0.053
0.393 2.979 2.774 2.887 0.096 0.116 0.105
0.787 4.074 3.829 3.955 0.379 0.404 0.391
1.574 4.380 4.776 4.585 1.136 1.096 1.115
0.0
0.2
0.4
0.6
0.8
0 10 20 30 40
Ce-1 (L mmol-1)
Qe-1
(g m
mol
-1)
Figure H.25. Lineweaver-Burk plot relating equilibrium copper concentrations.
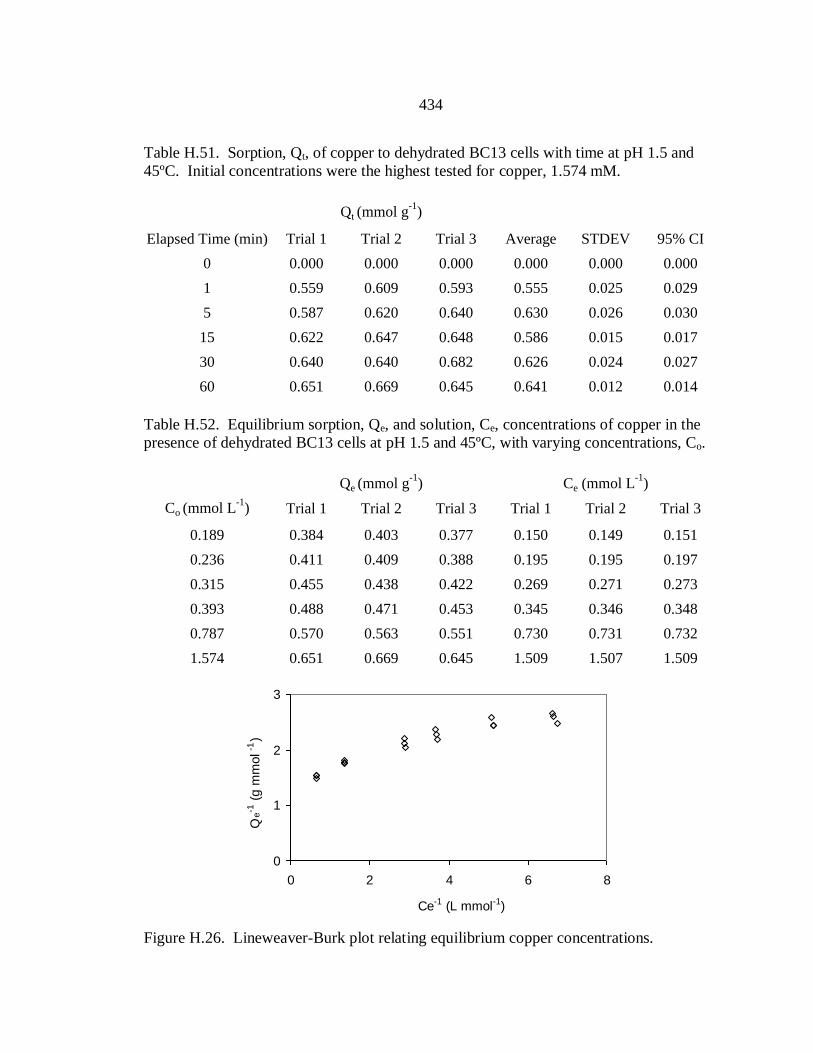
434
Table H.51. Sorption, Qt, of copper to dehydrated BC13 cells with time at pH 1.5 and
45ºC. Initial concentrations were the highest tested for copper, 1.574 mM.
Qt (mmol g-1
)
Elapsed Time (min) Trial 1 Trial 2 Trial 3 Average STDEV 95% CI
0 0.000 0.000 0.000 0.000 0.000 0.000
1 0.559 0.609 0.593 0.555 0.025 0.029
5 0.587 0.620 0.640 0.630 0.026 0.030
15 0.622 0.647 0.648 0.586 0.015 0.017
30 0.640 0.640 0.682 0.626 0.024 0.027
60 0.651 0.669 0.645 0.641 0.012 0.014
Table H.52. Equilibrium sorption, Qe, and solution, Ce, concentrations of copper in the
presence of dehydrated BC13 cells at pH 1.5 and 45ºC, with varying concentrations, Co.
Qe (mmol g-1
) Ce (mmol L-1
)
Co (mmol L-1
) Trial 1 Trial 2 Trial 3 Trial 1 Trial 2 Trial 3
0.189 0.384 0.403 0.377 0.150 0.149 0.151
0.236 0.411 0.409 0.388 0.195 0.195 0.197
0.315 0.455 0.438 0.422 0.269 0.271 0.273
0.393 0.488 0.471 0.453 0.345 0.346 0.348
0.787 0.570 0.563 0.551 0.730 0.731 0.732
1.574 0.651 0.669 0.645 1.509 1.507 1.509
0
1
2
3
0 2 4 6 8
Ce-1 (L mmol-1)
Qe-1
(g m
mol
-1)
Figure H.26. Lineweaver-Burk plot relating equilibrium copper concentrations.

435
Table H.53. Sorption, Qt, of copper to dehydrated BC13 cells with time at pH 2.5 and
45ºC. Initial concentrations were the highest tested for copper, 1.574 mM.
Qt (mmol g-1
)
Elapsed Time (min) Trial 1 Trial 2 Trial 3 Average STDEV 95% CI
0 0.000 0.000 0.000 0.000 0.000 0.000
1 1.735 1.843 1.715 1.764 0.069 0.078
5 1.788 1.809 1.751 1.783 0.029 0.033
15 1.835 1.952 1.858 1.882 0.062 0.070
30 1.815 1.943 1.912 1.890 0.067 0.076
60 1.851 1.986 1.821 1.886 0.088 0.099
Table H.54. Equilibrium sorption, Qe, and solution, Ce, concentrations of copper in the
presence of dehydrated BC13 cells at pH 2.5 and 45ºC, with varying concentrations, Co.
Qe (mmol g-1
) Ce (mmol L-1
)
Co (mmol L-1
) Trial 1 Trial 2 Trial 3 Trial 1 Trial 2 Trial 3
0.189 1.257 1.217 1.236 0.063 0.067 0.065
0.236 1.383 1.395 1.330 0.098 0.097 0.103
0.315 1.499 1.490 1.505 0.165 0.166 0.164
0.393 1.578 1.598 1.626 0.236 0.234 0.231
0.787 1.768 1.734 1.731 0.610 0.613 0.614
1.574 1.851 1.986 1.821 1.389 1.375 1.392
0.0
0.2
0.4
0.6
0.8
1.0
0 5 10 15 20
Ce-1 (L mmol-1)
Qe
-1 (
g m
mol
-1)
Figure H.27. Lineweaver-Burk plot relating equilibrium copper concentrations.
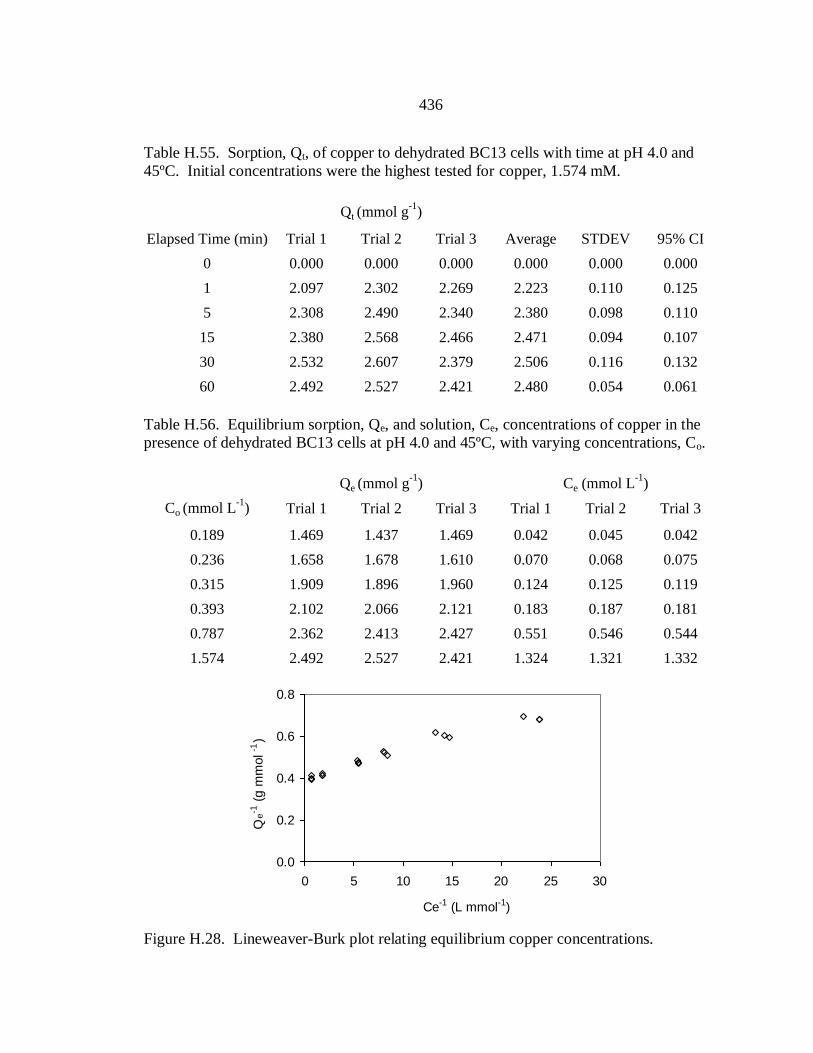
436
Table H.55. Sorption, Qt, of copper to dehydrated BC13 cells with time at pH 4.0 and
45ºC. Initial concentrations were the highest tested for copper, 1.574 mM.
Qt (mmol g-1
)
Elapsed Time (min) Trial 1 Trial 2 Trial 3 Average STDEV 95% CI
0 0.000 0.000 0.000 0.000 0.000 0.000
1 2.097 2.302 2.269 2.223 0.110 0.125
5 2.308 2.490 2.340 2.380 0.098 0.110
15 2.380 2.568 2.466 2.471 0.094 0.107
30 2.532 2.607 2.379 2.506 0.116 0.132
60 2.492 2.527 2.421 2.480 0.054 0.061
Table H.56. Equilibrium sorption, Qe, and solution, Ce, concentrations of copper in the
presence of dehydrated BC13 cells at pH 4.0 and 45ºC, with varying concentrations, Co.
Qe (mmol g-1
) Ce (mmol L-1
)
Co (mmol L-1
) Trial 1 Trial 2 Trial 3 Trial 1 Trial 2 Trial 3
0.189 1.469 1.437 1.469 0.042 0.045 0.042
0.236 1.658 1.678 1.610 0.070 0.068 0.075
0.315 1.909 1.896 1.960 0.124 0.125 0.119
0.393 2.102 2.066 2.121 0.183 0.187 0.181
0.787 2.362 2.413 2.427 0.551 0.546 0.544
1.574 2.492 2.527 2.421 1.324 1.321 1.332
0.0
0.2
0.4
0.6
0.8
0 5 10 15 20 25 30
Ce-1 (L mmol-1)
Qe
-1 (
g m
mol
-1)
Figure H.28. Lineweaver-Burk plot relating equilibrium copper concentrations.
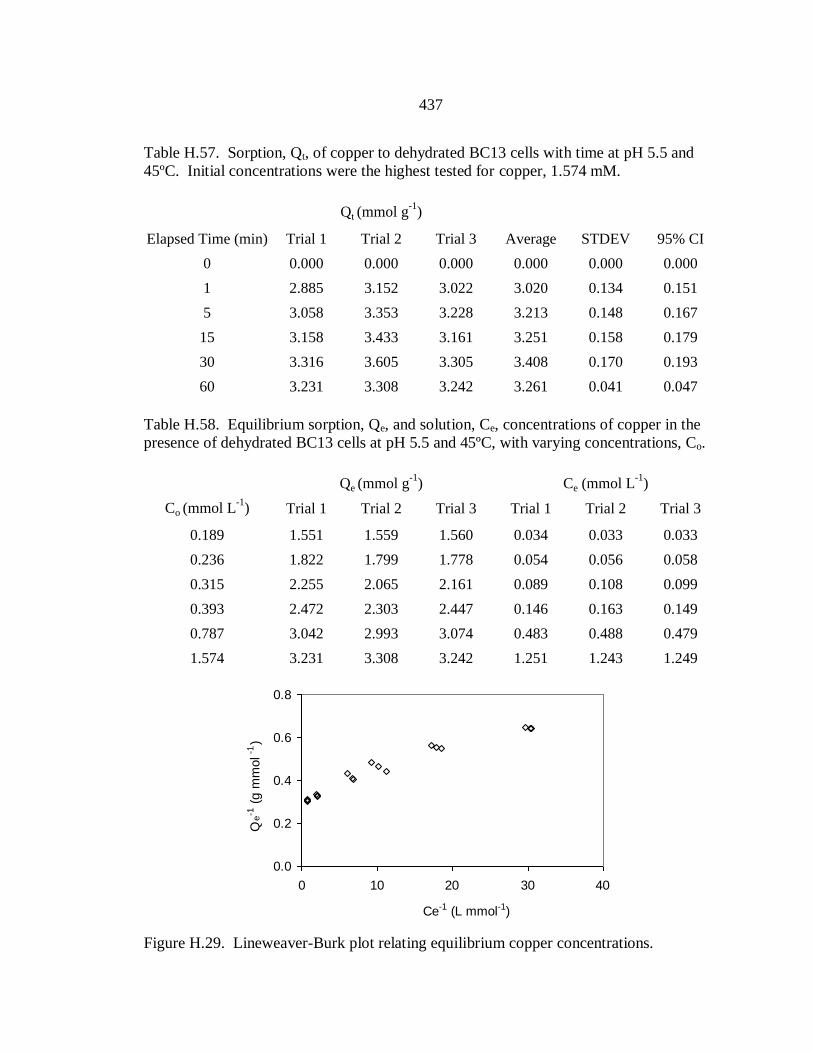
437
Table H.57. Sorption, Qt, of copper to dehydrated BC13 cells with time at pH 5.5 and
45ºC. Initial concentrations were the highest tested for copper, 1.574 mM.
Qt (mmol g-1
)
Elapsed Time (min) Trial 1 Trial 2 Trial 3 Average STDEV 95% CI
0 0.000 0.000 0.000 0.000 0.000 0.000
1 2.885 3.152 3.022 3.020 0.134 0.151
5 3.058 3.353 3.228 3.213 0.148 0.167
15 3.158 3.433 3.161 3.251 0.158 0.179
30 3.316 3.605 3.305 3.408 0.170 0.193
60 3.231 3.308 3.242 3.261 0.041 0.047
Table H.58. Equilibrium sorption, Qe, and solution, Ce, concentrations of copper in the
presence of dehydrated BC13 cells at pH 5.5 and 45ºC, with varying concentrations, Co.
Qe (mmol g-1
) Ce (mmol L-1
)
Co (mmol L-1
) Trial 1 Trial 2 Trial 3 Trial 1 Trial 2 Trial 3
0.189 1.551 1.559 1.560 0.034 0.033 0.033
0.236 1.822 1.799 1.778 0.054 0.056 0.058
0.315 2.255 2.065 2.161 0.089 0.108 0.099
0.393 2.472 2.303 2.447 0.146 0.163 0.149
0.787 3.042 2.993 3.074 0.483 0.488 0.479
1.574 3.231 3.308 3.242 1.251 1.243 1.249
0.0
0.2
0.4
0.6
0.8
0 10 20 30 40
Ce-1 (L mmol-1)
Qe
-1 (
g m
mol-1
)
Figure H.29. Lineweaver-Burk plot relating equilibrium copper concentrations.
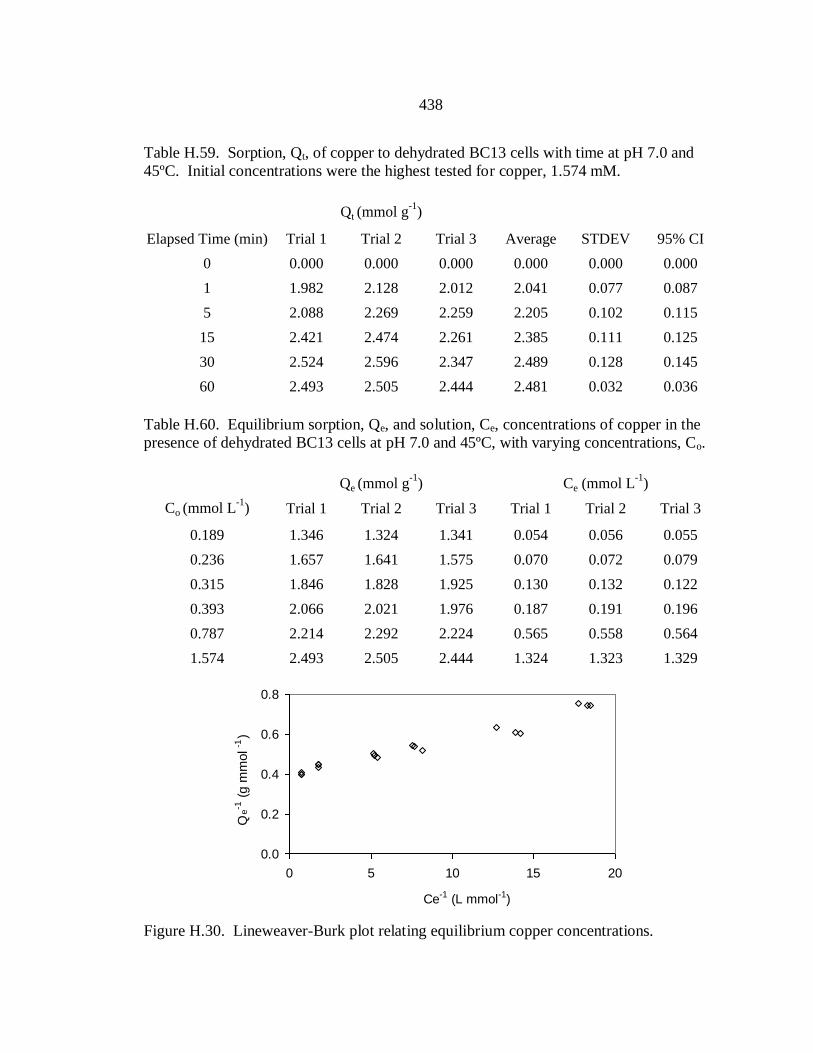
438
Table H.59. Sorption, Qt, of copper to dehydrated BC13 cells with time at pH 7.0 and
45ºC. Initial concentrations were the highest tested for copper, 1.574 mM.
Qt (mmol g-1
)
Elapsed Time (min) Trial 1 Trial 2 Trial 3 Average STDEV 95% CI
0 0.000 0.000 0.000 0.000 0.000 0.000
1 1.982 2.128 2.012 2.041 0.077 0.087
5 2.088 2.269 2.259 2.205 0.102 0.115
15 2.421 2.474 2.261 2.385 0.111 0.125
30 2.524 2.596 2.347 2.489 0.128 0.145
60 2.493 2.505 2.444 2.481 0.032 0.036
Table H.60. Equilibrium sorption, Qe, and solution, Ce, concentrations of copper in the
presence of dehydrated BC13 cells at pH 7.0 and 45ºC, with varying concentrations, Co.
Qe (mmol g-1
) Ce (mmol L-1
)
Co (mmol L-1
) Trial 1 Trial 2 Trial 3 Trial 1 Trial 2 Trial 3
0.189 1.346 1.324 1.341 0.054 0.056 0.055
0.236 1.657 1.641 1.575 0.070 0.072 0.079
0.315 1.846 1.828 1.925 0.130 0.132 0.122
0.393 2.066 2.021 1.976 0.187 0.191 0.196
0.787 2.214 2.292 2.224 0.565 0.558 0.564
1.574 2.493 2.505 2.444 1.324 1.323 1.329
0.0
0.2
0.4
0.6
0.8
0 5 10 15 20
Ce-1 (L mmol-1)
Qe-1
(g m
mol
-1)
Figure H.30. Lineweaver-Burk plot relating equilibrium copper concentrations.
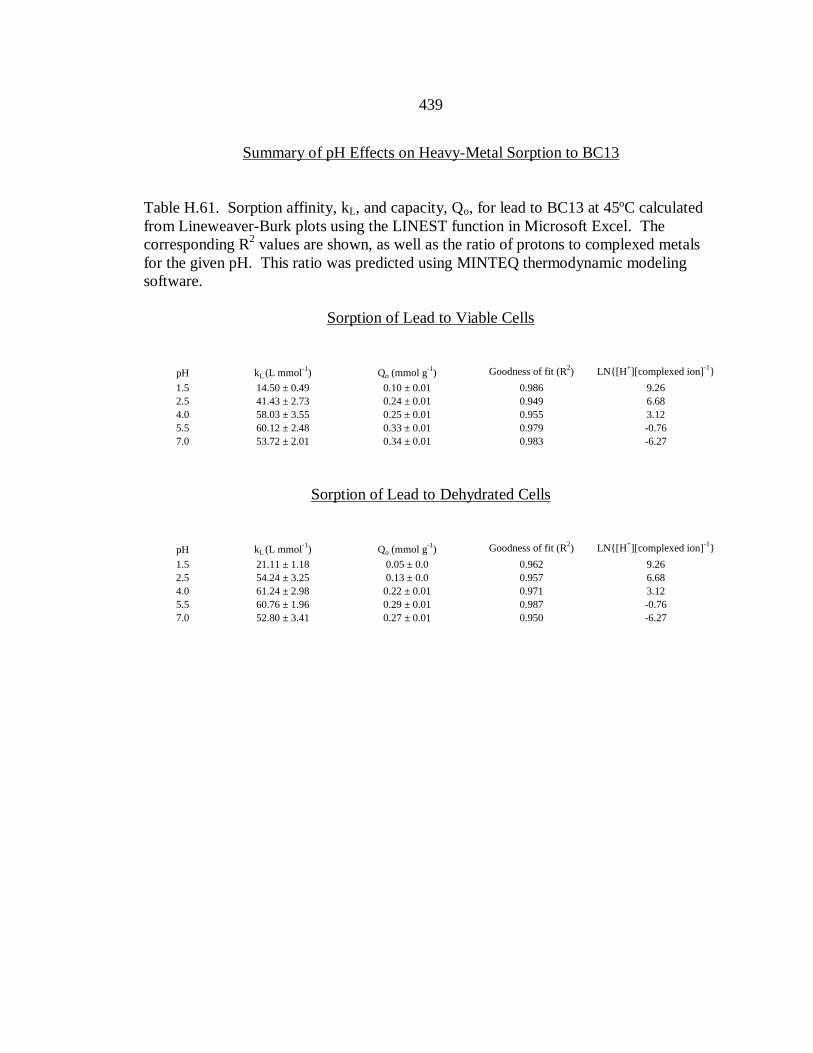
439
Summary of pH Effects on Heavy-Metal Sorption to BC13
Table H.61. Sorption affinity, kL, and capacity, Qo, for lead to BC13 at 45ºC calculated
from Lineweaver-Burk plots using the LINEST function in Microsoft Excel. The
corresponding R2 values are shown, as well as the ratio of protons to complexed metals
for the given pH. This ratio was predicted using MINTEQ thermodynamic modeling
software.
Sorption of Lead to Viable Cells
pH kL (L mmol
-1) Qo (mmol g
-1) Goodness of fit (R
2) LN{[H
+][complexed ion]
-1}
1.5 14.50 ± 0.49 0.10 ± 0.01 0.986 9.26
2.5 41.43 ± 2.73 0.24 ± 0.01 0.949 6.68
4.0 58.03 ± 3.55 0.25 ± 0.01 0.955 3.12
5.5 60.12 ± 2.48 0.33 ± 0.01 0.979 -0.76
7.0 53.72 ± 2.01 0.34 ± 0.01 0.983 -6.27
Sorption of Lead to Dehydrated Cells
pH kL (L mmol
-1) Qo (mmol g
-1) Goodness of fit (R
2) LN{[H
+][complexed ion]
-1}
1.5 21.11 ± 1.18 0.05 ± 0.0 0.962 9.26
2.5 54.24 ± 3.25 0.13 ± 0.0 0.957 6.68
4.0 61.24 ± 2.98 0.22 ± 0.01 0.971 3.12
5.5 60.76 ± 1.96 0.29 ± 0.01 0.987 -0.76
7.0 52.80 ± 3.41 0.27 ± 0.01 0.950 -6.27
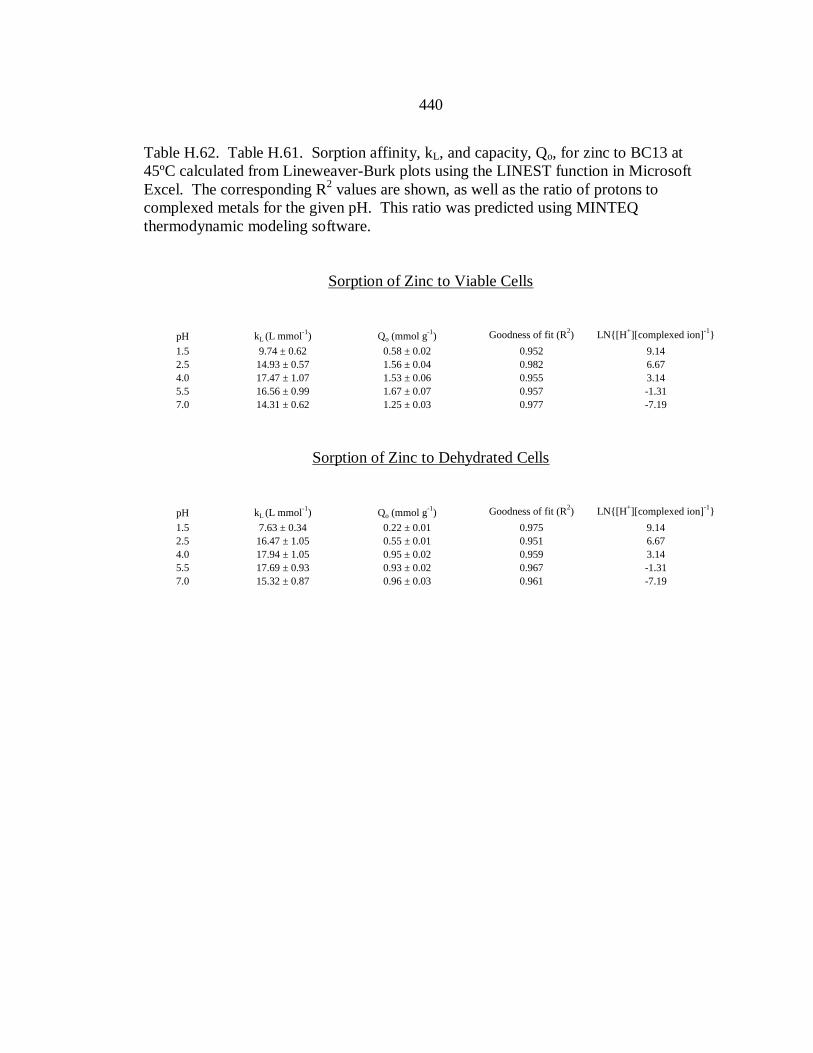
440
Table H.62. Table H.61. Sorption affinity, kL, and capacity, Qo, for zinc to BC13 at
45ºC calculated from Lineweaver-Burk plots using the LINEST function in Microsoft
Excel. The corresponding R2 values are shown, as well as the ratio of protons to
complexed metals for the given pH. This ratio was predicted using MINTEQ
thermodynamic modeling software.
Sorption of Zinc to Viable Cells
pH kL (L mmol
-1) Qo (mmol g
-1) Goodness of fit (R
2) LN{[H
+][complexed ion]
-1}
1.5 9.74 ± 0.62 0.58 ± 0.02 0.952 9.14
2.5 14.93 ± 0.57 1.56 ± 0.04 0.982 6.67
4.0 17.47 ± 1.07 1.53 ± 0.06 0.955 3.14
5.5 16.56 ± 0.99 1.67 ± 0.07 0.957 -1.31
7.0 14.31 ± 0.62 1.25 ± 0.03 0.977 -7.19
Sorption of Zinc to Dehydrated Cells
pH kL (L mmol
-1) Qo (mmol g
-1) Goodness of fit (R
2) LN{[H
+][complexed ion]
-1}
1.5 7.63 ± 0.34 0.22 ± 0.01 0.975 9.14
2.5 16.47 ± 1.05 0.55 ± 0.01 0.951 6.67
4.0 17.94 ± 1.05 0.95 ± 0.02 0.959 3.14
5.5 17.69 ± 0.93 0.93 ± 0.02 0.967 -1.31
7.0 15.32 ± 0.87 0.96 ± 0.03 0.961 -7.19

441
Table H.63. Table H.61. Sorption affinity, kL, and capacity, Qo, for copper to BC13 at
45ºC calculated from Lineweaver-Burk plots using the LINEST function in Microsoft
Excel. The corresponding R2 values are shown, as well as the ratio of protons to
complexed metals for the given pH. This ratio was predicted using MINTEQ
thermodynamic modeling software.
Sorption of Copper to Viable Cells
pH kL (L mmol
-1) Qo (mmol g
-1) Goodness of fit (R
2) LN{[H
+][complexed ion]
-1}
1.5 17.48 ± 0.98 1.55 ± 0.03 0.962 7.26
2.5 35.20 ± 1.93 2.72 ± 0.06 0.964 4.844.0 36.11 ± 1.89 4.75 ± 0.02 0.955 1.125.5 24.60 ± 1.45 4.76 ± 0.03 0.959 -4.647.0 18.93 ± 1.16 4.63 ± 0.03 0.955 -9.42
Sorption of Copper to Dehydrated Cells
pH kL (L mmol
-1) Qo (mmol g
-1) Goodness of fit (R
2) LN{[H
+][complexed ion]
-1}
1.5 8.78 ± 0.76 0.65 ± 0.03 0.914 7.26
2.5 29.59 ± 1.75 1.85 ± 0.03 0.958 4.84
4.0 31.60 ± 1.63 2.47 ± 0.05 0.968 1.12
5.5 28.35 ± 1.88 3.09 ± 0.11 0.948 -4.64
7.0 22.04 ± 1.20 2.51 ± 0.06 0.964 -9.42
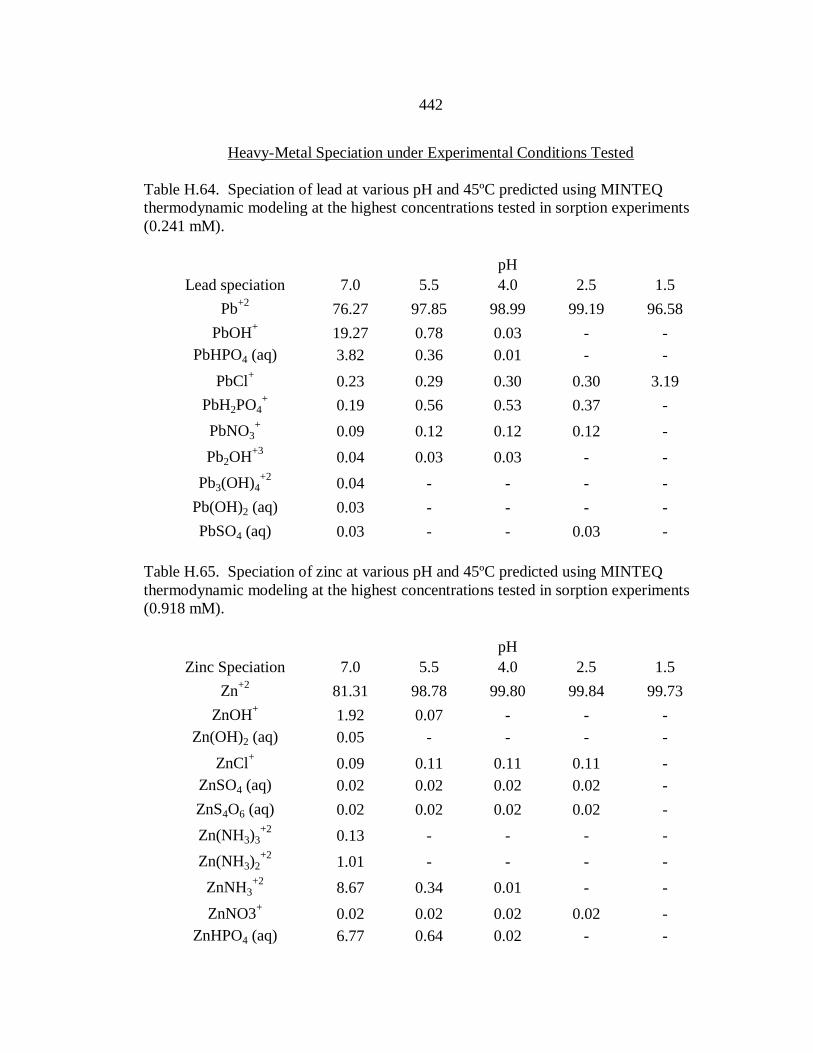
442
Heavy-Metal Speciation under Experimental Conditions Tested
Table H.64. Speciation of lead at various pH and 45ºC predicted using MINTEQ
thermodynamic modeling at the highest concentrations tested in sorption experiments
(0.241 mM).
pH
Lead speciation 7.0 5.5 4.0 2.5 1.5
Pb+2
76.27 97.85 98.99 99.19 96.58
PbOH+
19.27 0.78 0.03 - -
PbHPO4 (aq) 3.82 0.36 0.01 - -
PbCl+
0.23 0.29 0.30 0.30 3.19
PbH2PO4+
0.19 0.56 0.53 0.37 -
PbNO3+
0.09 0.12 0.12 0.12 -
Pb2OH+3
0.04 0.03 0.03 - -
Pb3(OH)4+2
0.04 - - - -
Pb(OH)2 (aq) 0.03 - - - -
PbSO4 (aq) 0.03 - - 0.03 -
Table H.65. Speciation of zinc at various pH and 45ºC predicted using MINTEQ
thermodynamic modeling at the highest concentrations tested in sorption experiments
(0.918 mM).
pH
Zinc Speciation 7.0 5.5 4.0 2.5 1.5
Zn+2
81.31 98.78 99.80 99.84 99.73
ZnOH+
1.92 0.07 - - -
Zn(OH)2 (aq) 0.05 - - - -
ZnCl+
0.09 0.11 0.11 0.11 -
ZnSO4 (aq) 0.02 0.02 0.02 0.02 -
ZnS4O6 (aq) 0.02 0.02 0.02 0.02 -
Zn(NH3)3+2
0.13 - - - -
Zn(NH3)2+2
1.01 - - - -
ZnNH3+2
8.67 0.34 0.01 - -
ZnNO3+
0.02 0.02 0.02 0.02 -
ZnHPO4 (aq) 6.77 0.64 0.02 - -
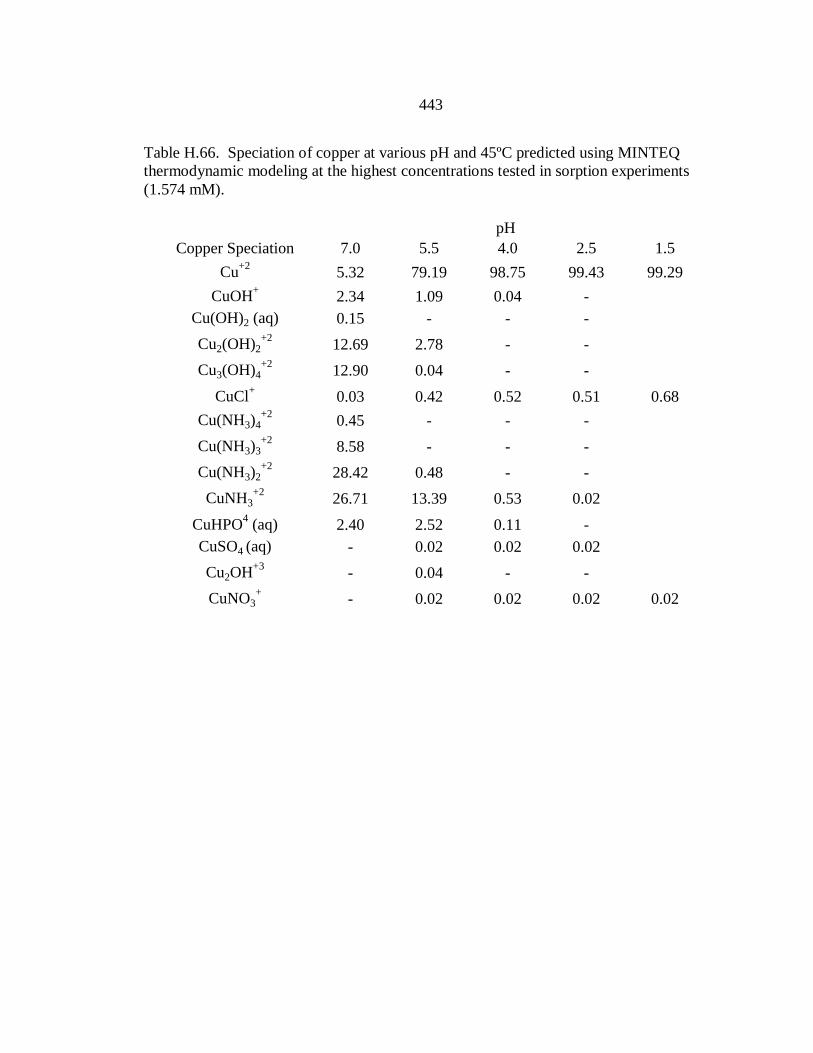
443
Table H.66. Speciation of copper at various pH and 45ºC predicted using MINTEQ
thermodynamic modeling at the highest concentrations tested in sorption experiments
(1.574 mM).
pH
Copper Speciation 7.0 5.5 4.0 2.5 1.5
Cu+2
5.32 79.19 98.75 99.43 99.29
CuOH+
2.34 1.09 0.04 -
Cu(OH)2 (aq) 0.15 - - -
Cu2(OH)2+2
12.69 2.78 - -
Cu3(OH)4+2
12.90 0.04 - -
CuCl+
0.03 0.42 0.52 0.51 0.68
Cu(NH3)4+2
0.45 - - -
Cu(NH3)3+2
8.58 - - -
Cu(NH3)2+2
28.42 0.48 - -
CuNH3+2
26.71 13.39 0.53 0.02
CuHPO4 (aq) 2.40 2.52 0.11 -
CuSO4 (aq) - 0.02 0.02 0.02
Cu2OH+3
- 0.04 - -
CuNO3+
- 0.02 0.02 0.02 0.02
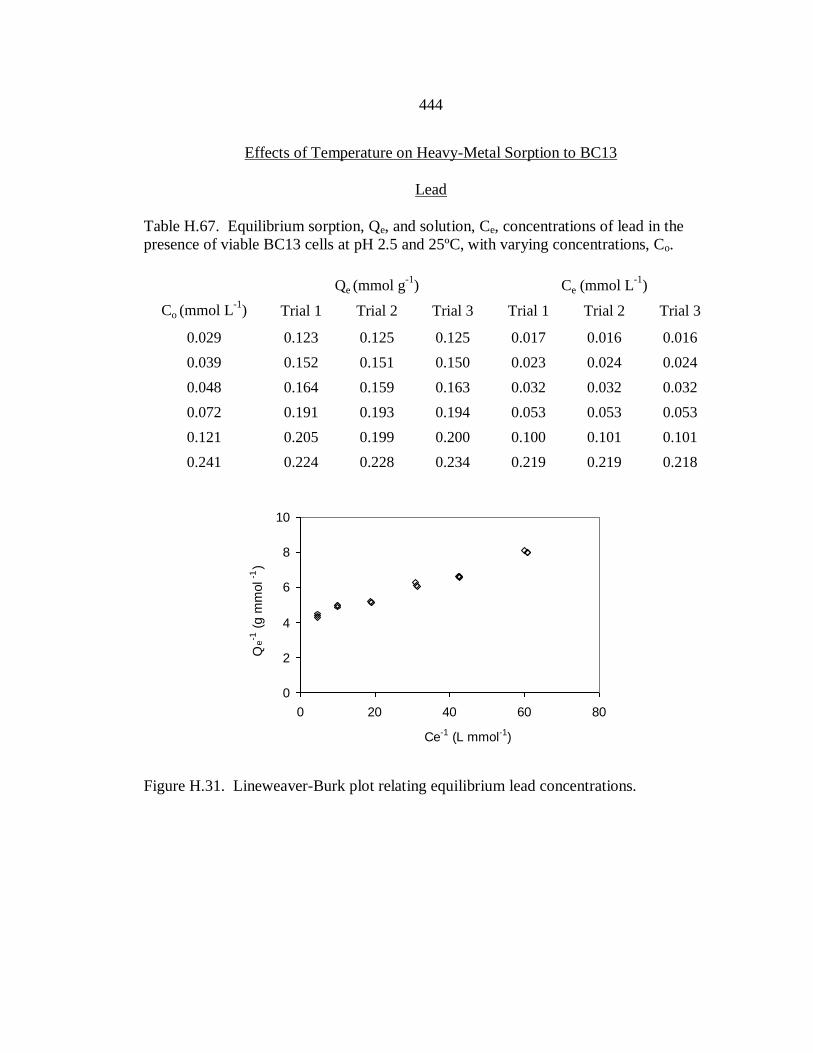
444
Effects of Temperature on Heavy-Metal Sorption to BC13
Lead
Table H.67. Equilibrium sorption, Qe, and solution, Ce, concentrations of lead in the
presence of viable BC13 cells at pH 2.5 and 25ºC, with varying concentrations, Co.
Qe (mmol g-1
) Ce (mmol L-1
)
Co (mmol L-1
) Trial 1 Trial 2 Trial 3 Trial 1 Trial 2 Trial 3
0.029 0.123 0.125 0.125 0.017 0.016 0.016
0.039 0.152 0.151 0.150 0.023 0.024 0.024
0.048 0.164 0.159 0.163 0.032 0.032 0.032
0.072 0.191 0.193 0.194 0.053 0.053 0.053
0.121 0.205 0.199 0.200 0.100 0.101 0.101
0.241 0.224 0.228 0.234 0.219 0.219 0.218
0
2
4
6
8
10
0 20 40 60 80
Ce-1 (L mmol-1)
Qe
-1 (
g m
mol-1
)
Figure H.31. Lineweaver-Burk plot relating equilibrium lead concentrations.
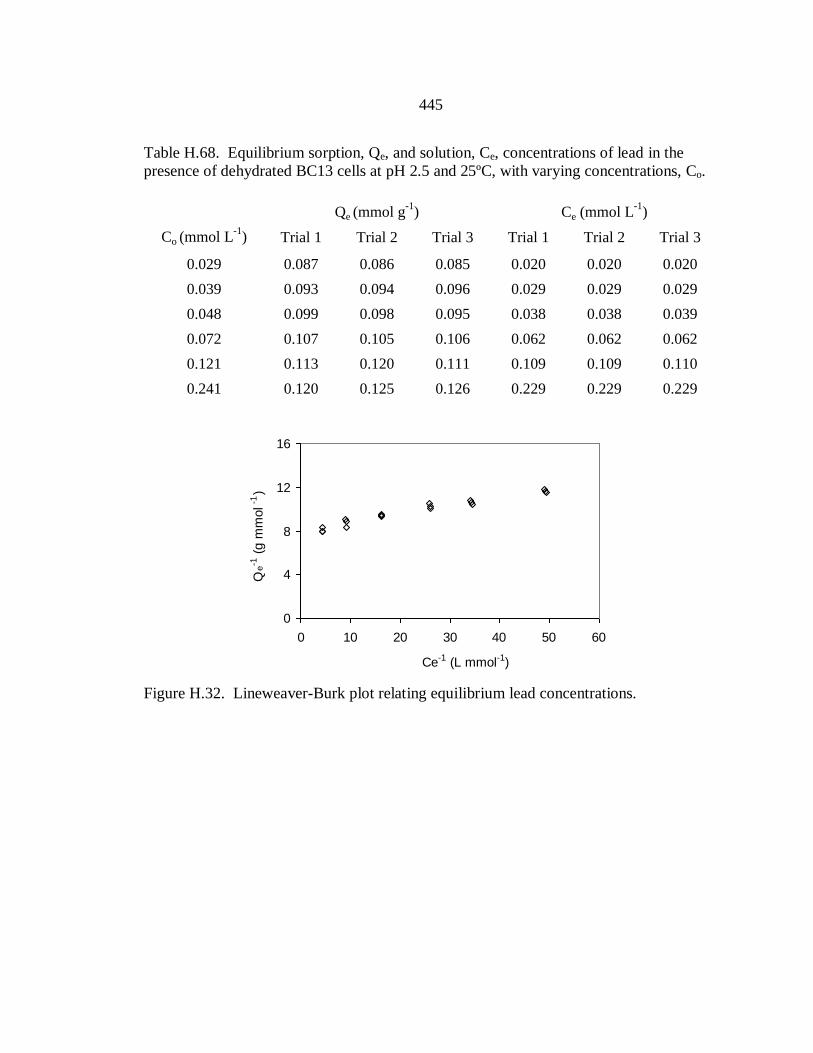
445
Table H.68. Equilibrium sorption, Qe, and solution, Ce, concentrations of lead in the
presence of dehydrated BC13 cells at pH 2.5 and 25ºC, with varying concentrations, Co.
Qe (mmol g-1
) Ce (mmol L-1
)
Co (mmol L-1
) Trial 1 Trial 2 Trial 3 Trial 1 Trial 2 Trial 3
0.029 0.087 0.086 0.085 0.020 0.020 0.020
0.039 0.093 0.094 0.096 0.029 0.029 0.029
0.048 0.099 0.098 0.095 0.038 0.038 0.039
0.072 0.107 0.105 0.106 0.062 0.062 0.062
0.121 0.113 0.120 0.111 0.109 0.109 0.110
0.241 0.120 0.125 0.126 0.229 0.229 0.229
0
4
8
12
16
0 10 20 30 40 50 60
Ce-1 (L mmol-1)
Qe-1
(g m
mol-1
)
Figure H.32. Lineweaver-Burk plot relating equilibrium lead concentrations.
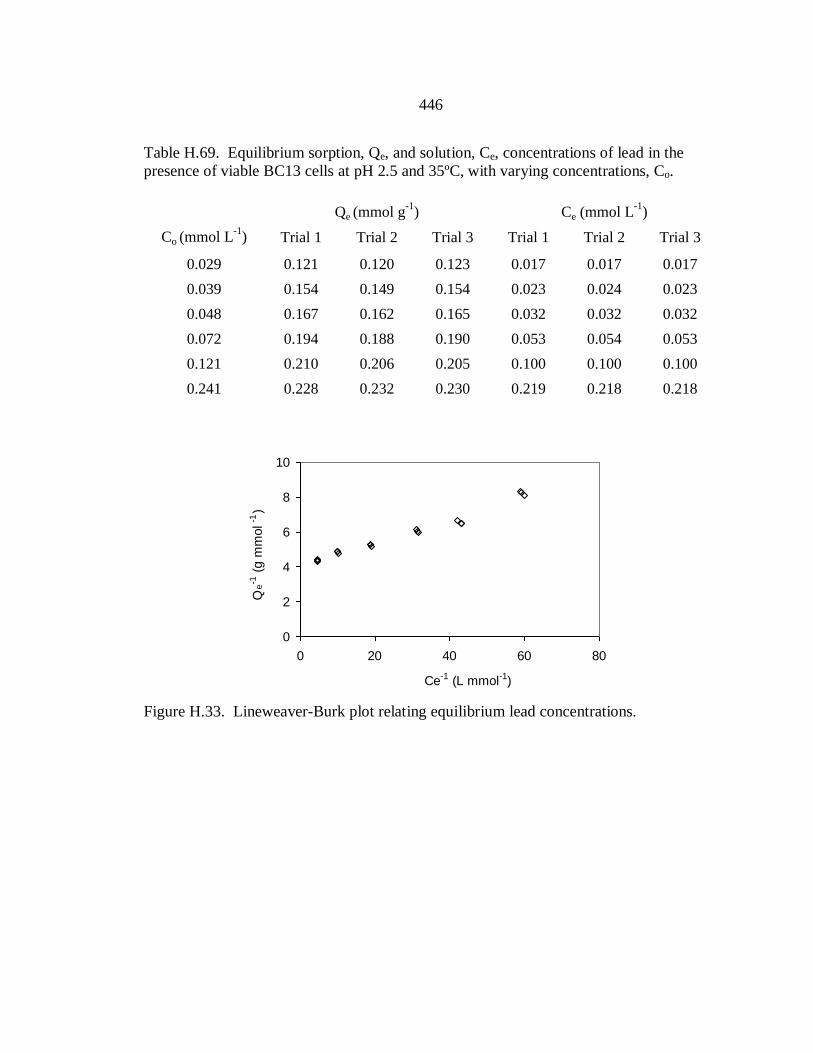
446
Table H.69. Equilibrium sorption, Qe, and solution, Ce, concentrations of lead in the
presence of viable BC13 cells at pH 2.5 and 35ºC, with varying concentrations, Co.
Qe (mmol g-1
) Ce (mmol L-1
)
Co (mmol L-1
) Trial 1 Trial 2 Trial 3 Trial 1 Trial 2 Trial 3
0.029 0.121 0.120 0.123 0.017 0.017 0.017
0.039 0.154 0.149 0.154 0.023 0.024 0.023
0.048 0.167 0.162 0.165 0.032 0.032 0.032
0.072 0.194 0.188 0.190 0.053 0.054 0.053
0.121 0.210 0.206 0.205 0.100 0.100 0.100
0.241 0.228 0.232 0.230 0.219 0.218 0.218
0
2
4
6
8
10
0 20 40 60 80
Ce-1 (L mmol-1)
Qe-1
(g m
mol-1
)
Figure H.33. Lineweaver-Burk plot relating equilibrium lead concentrations.
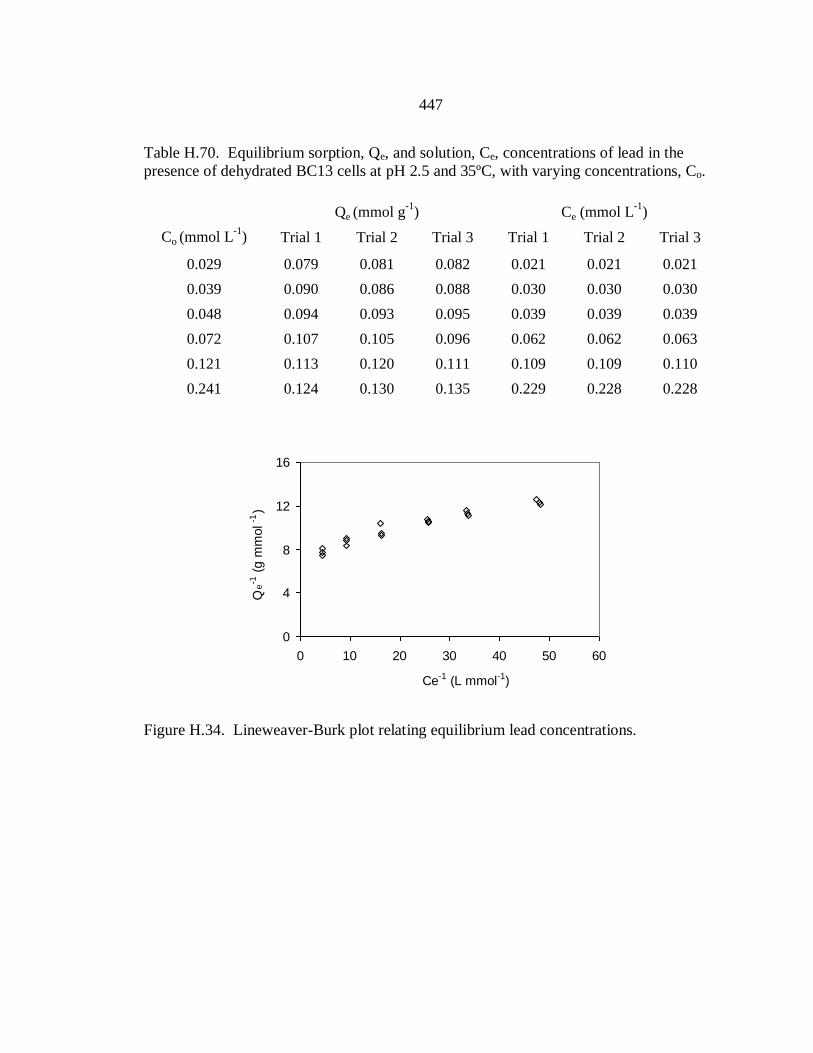
447
Table H.70. Equilibrium sorption, Qe, and solution, Ce, concentrations of lead in the
presence of dehydrated BC13 cells at pH 2.5 and 35ºC, with varying concentrations, Co.
Qe (mmol g-1
) Ce (mmol L-1
)
Co (mmol L-1
) Trial 1 Trial 2 Trial 3 Trial 1 Trial 2 Trial 3
0.029 0.079 0.081 0.082 0.021 0.021 0.021
0.039 0.090 0.086 0.088 0.030 0.030 0.030
0.048 0.094 0.093 0.095 0.039 0.039 0.039
0.072 0.107 0.105 0.096 0.062 0.062 0.063
0.121 0.113 0.120 0.111 0.109 0.109 0.110
0.241 0.124 0.130 0.135 0.229 0.228 0.228
0
4
8
12
16
0 10 20 30 40 50 60
Ce-1
(L mmol-1
)
Qe
-1 (
g m
mol-1
)
0
4
8
12
16
0 10 20 30 40 50 60
Ce-1 (L mmol-1)
Qe-1
(g m
mol-1
)
Figure H.34. Lineweaver-Burk plot relating equilibrium lead concentrations.
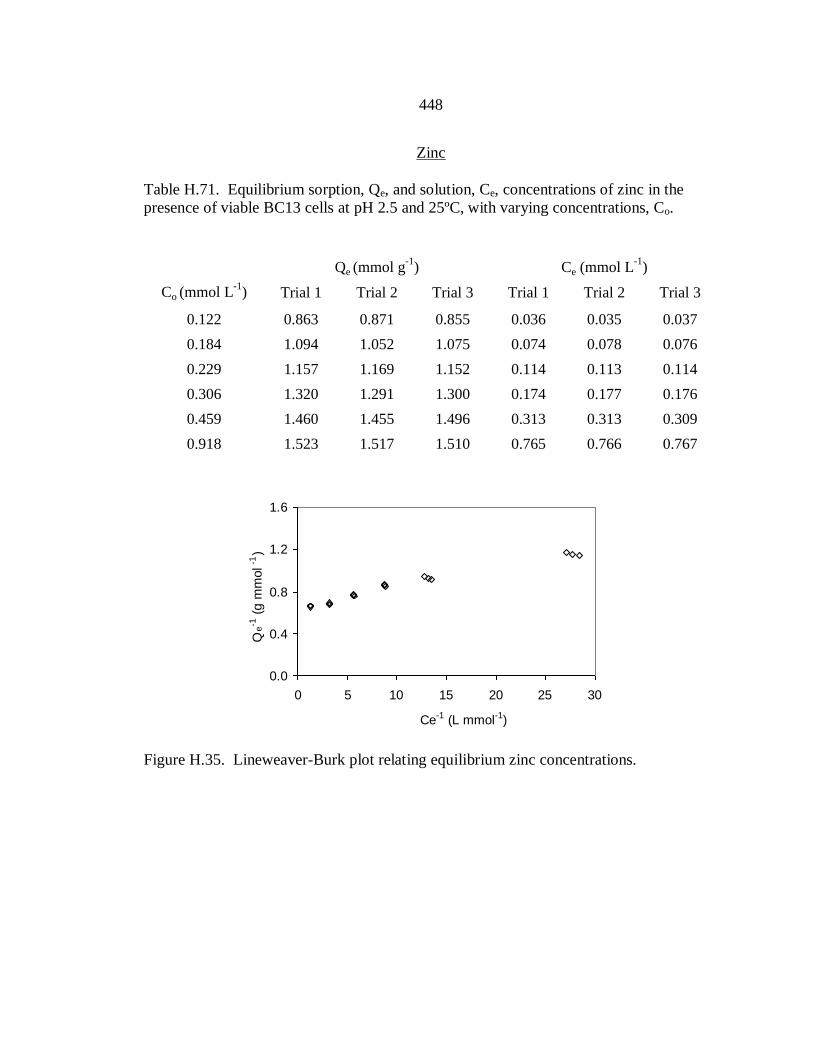
448
Zinc
Table H.71. Equilibrium sorption, Qe, and solution, Ce, concentrations of zinc in the
presence of viable BC13 cells at pH 2.5 and 25ºC, with varying concentrations, Co.
Qe (mmol g-1
) Ce (mmol L-1
)
Co (mmol L-1
) Trial 1 Trial 2 Trial 3 Trial 1 Trial 2 Trial 3
0.122 0.863 0.871 0.855 0.036 0.035 0.037
0.184 1.094 1.052 1.075 0.074 0.078 0.076
0.229 1.157 1.169 1.152 0.114 0.113 0.114
0.306 1.320 1.291 1.300 0.174 0.177 0.176
0.459 1.460 1.455 1.496 0.313 0.313 0.309
0.918 1.523 1.517 1.510 0.765 0.766 0.767
0.0
0.4
0.8
1.2
1.6
0 5 10 15 20 25 30
Ce-1 (L mmol-1)
Qe-1
(g m
mol
-1)
Figure H.35. Lineweaver-Burk plot relating equilibrium zinc concentrations.

449
Table H.72. Equilibrium sorption, Qe, and solution, Ce, concentrations of zinc in the
presence of dehydrated BC13 cells at pH 2.5 and 25ºC, with varying concentrations, Co.
Qe (mmol g-1
) Ce (mmol L-1
)
Co (mmol L-1
) Trial 1 Trial 2 Trial 3 Trial 1 Trial 2 Trial 3
0.122 0.412 0.422 0.410 0.081 0.080 0.081
0.184 0.440 0.435 0.431 0.140 0.140 0.140
0.229 0.465 0.462 0.470 0.183 0.183 0.182
0.306 0.480 0.471 0.463 0.258 0.259 0.260
0.459 0.523 0.515 0.515 0.407 0.407 0.407
0.918 0.543 0.552 0.524 0.863 0.863 0.865
0
1
2
3
0 5 10 15
Ce-1 (L mmol-1)
Qe-1
(g m
mol
-1)
Figure H.36. Lineweaver-Burk plot relating equilibrium zinc concentrations.

450
Table H.73. Equilibrium sorption, Qe, and solution, Ce, concentrations of zinc in the
presence of viable BC13 cells at pH 2.5 and 35ºC, with varying concentrations, Co.
Qe (mmol g-1
) Ce (mmol L-1
)
Co (mmol L-1
) Trial 1 Trial 2 Trial 3 Trial 1 Trial 2 Trial 3
0.122 0.802 0.815 0.823 0.042 0.041 0.040
0.184 1.054 0.974 0.992 0.078 0.086 0.084
0.229 1.203 1.154 1.160 0.109 0.114 0.113
0.306 1.301 1.258 1.277 0.176 0.180 0.178
0.459 1.497 1.450 1.462 0.309 0.314 0.313
0.918 1.590 1.543 1.556 0.759 0.763 0.762
0.0
0.4
0.8
1.2
1.6
0 5 10 15 20 25 30
Ce-1 (L mmol-1)
Qe-1
(g m
mol-1
)
Figure H.37. Lineweaver-Burk plot relating equilibrium zinc concentrations.
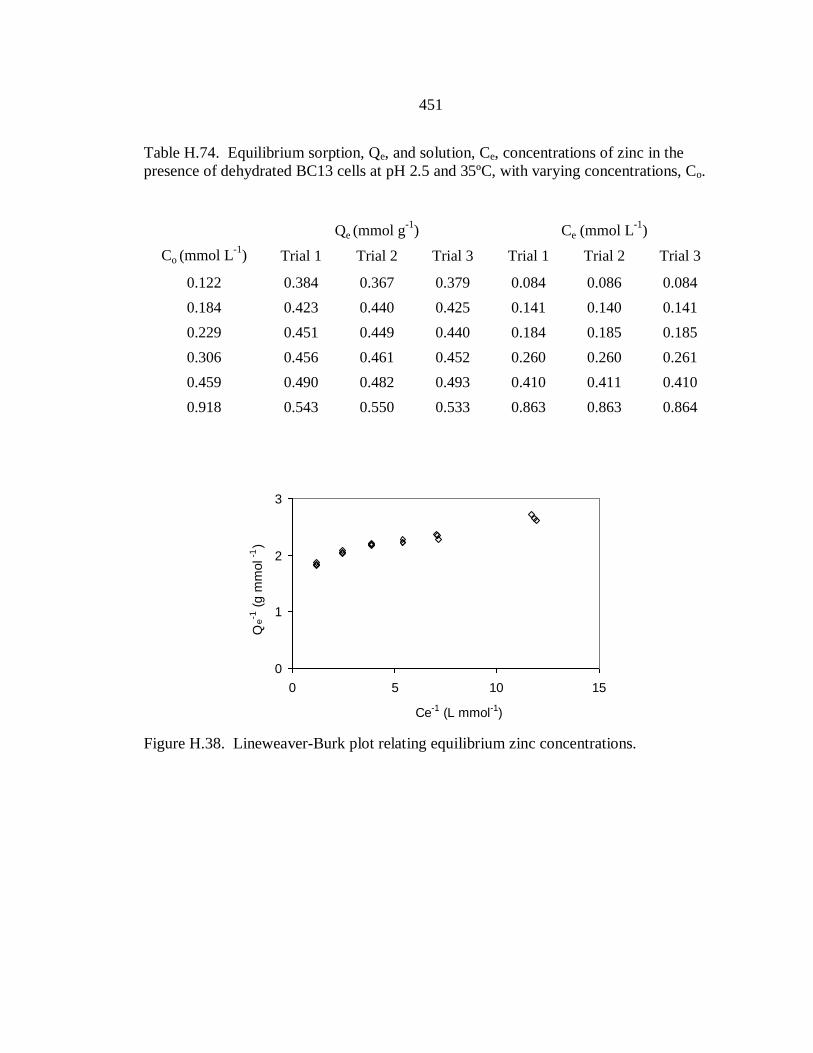
451
Table H.74. Equilibrium sorption, Qe, and solution, Ce, concentrations of zinc in the
presence of dehydrated BC13 cells at pH 2.5 and 35ºC, with varying concentrations, Co.
Qe (mmol g-1
) Ce (mmol L-1
)
Co (mmol L-1
) Trial 1 Trial 2 Trial 3 Trial 1 Trial 2 Trial 3
0.122 0.384 0.367 0.379 0.084 0.086 0.084
0.184 0.423 0.440 0.425 0.141 0.140 0.141
0.229 0.451 0.449 0.440 0.184 0.185 0.185
0.306 0.456 0.461 0.452 0.260 0.260 0.261
0.459 0.490 0.482 0.493 0.410 0.411 0.410
0.918 0.543 0.550 0.533 0.863 0.863 0.864
0
1
2
3
0 5 10 15
Ce-1 (L mmol-1)
Qe-1
(g m
mol-1
)
Figure H.38. Lineweaver-Burk plot relating equilibrium zinc concentrations.
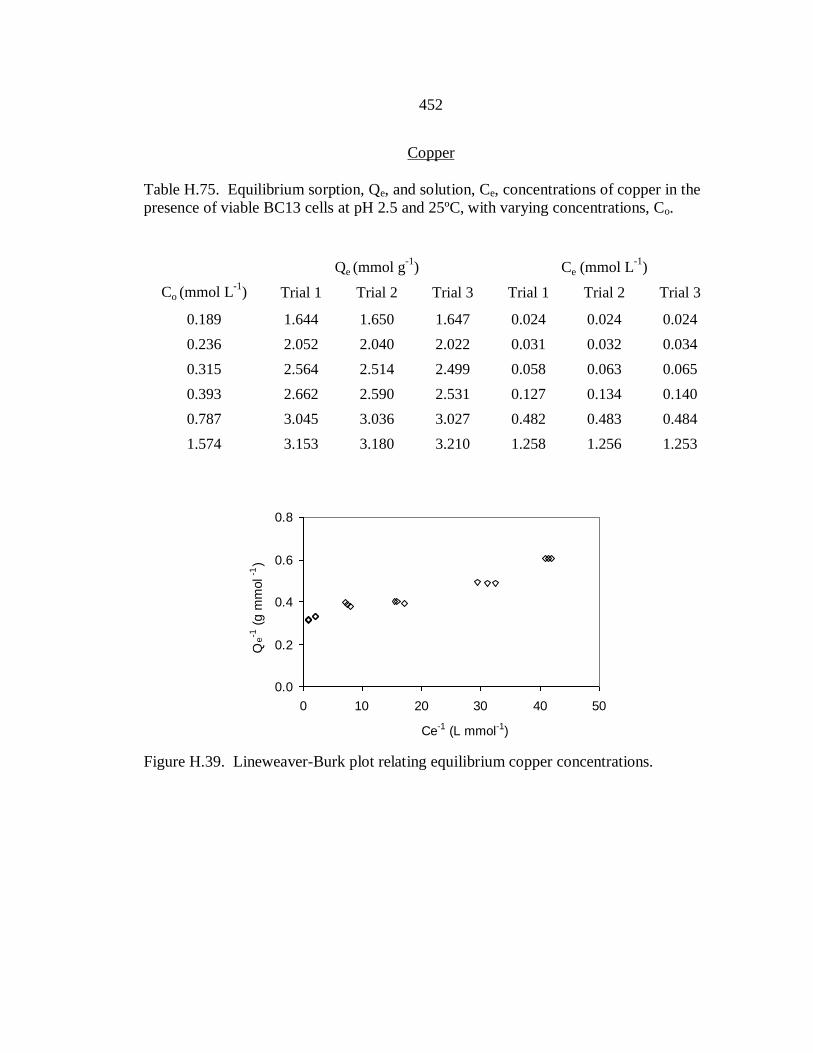
452
Copper
Table H.75. Equilibrium sorption, Qe, and solution, Ce, concentrations of copper in the
presence of viable BC13 cells at pH 2.5 and 25ºC, with varying concentrations, Co.
Qe (mmol g-1
) Ce (mmol L-1
)
Co (mmol L-1
) Trial 1 Trial 2 Trial 3 Trial 1 Trial 2 Trial 3
0.189 1.644 1.650 1.647 0.024 0.024 0.024
0.236 2.052 2.040 2.022 0.031 0.032 0.034
0.315 2.564 2.514 2.499 0.058 0.063 0.065
0.393 2.662 2.590 2.531 0.127 0.134 0.140
0.787 3.045 3.036 3.027 0.482 0.483 0.484
1.574 3.153 3.180 3.210 1.258 1.256 1.253
0.0
0.2
0.4
0.6
0.8
0 10 20 30 40 50
Ce-1 (L mmol-1)
Qe-1
(g m
mol-1
)
Figure H.39. Lineweaver-Burk plot relating equilibrium copper concentrations.
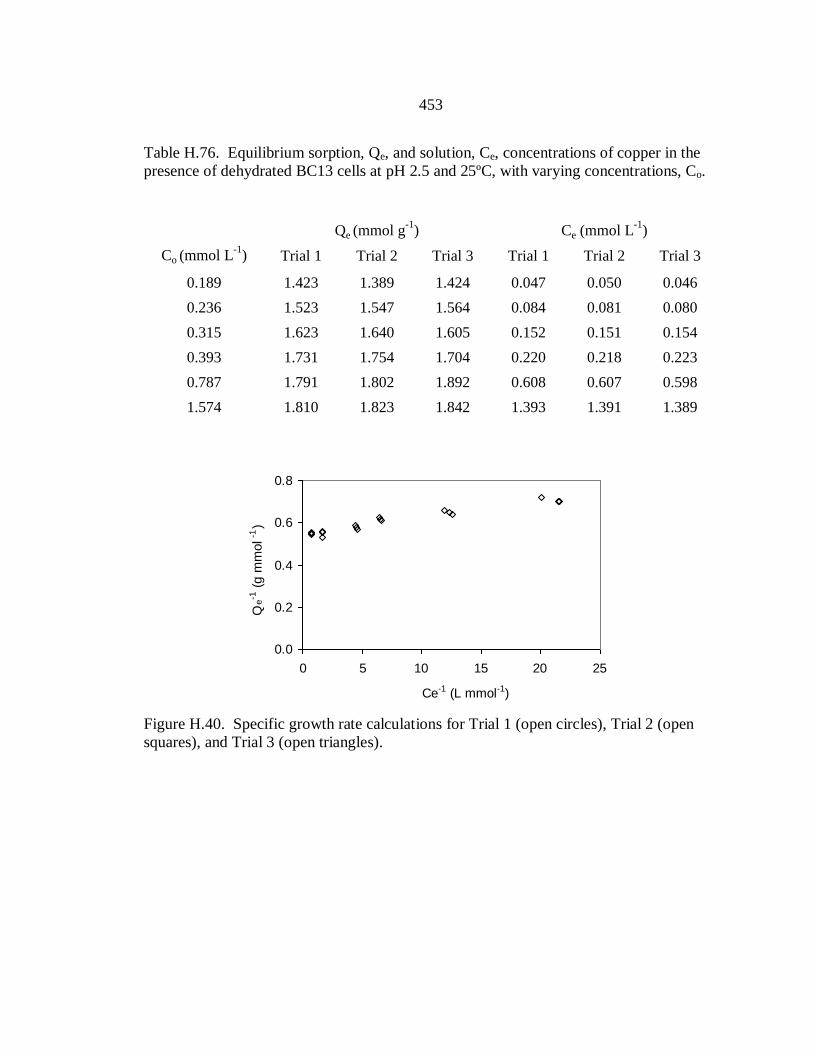
453
Table H.76. Equilibrium sorption, Qe, and solution, Ce, concentrations of copper in the
presence of dehydrated BC13 cells at pH 2.5 and 25ºC, with varying concentrations, Co.
Qe (mmol g-1
) Ce (mmol L-1
)
Co (mmol L-1
) Trial 1 Trial 2 Trial 3 Trial 1 Trial 2 Trial 3
0.189 1.423 1.389 1.424 0.047 0.050 0.046
0.236 1.523 1.547 1.564 0.084 0.081 0.080
0.315 1.623 1.640 1.605 0.152 0.151 0.154
0.393 1.731 1.754 1.704 0.220 0.218 0.223
0.787 1.791 1.802 1.892 0.608 0.607 0.598
1.574 1.810 1.823 1.842 1.393 1.391 1.389
0.0
0.2
0.4
0.6
0.8
0 5 10 15 20 25
Ce-1 (L mmol-1)
Qe-1
(g m
mol
-1)
Figure H.40. Specific growth rate calculations for Trial 1 (open circles), Trial 2 (open
squares), and Trial 3 (open triangles).
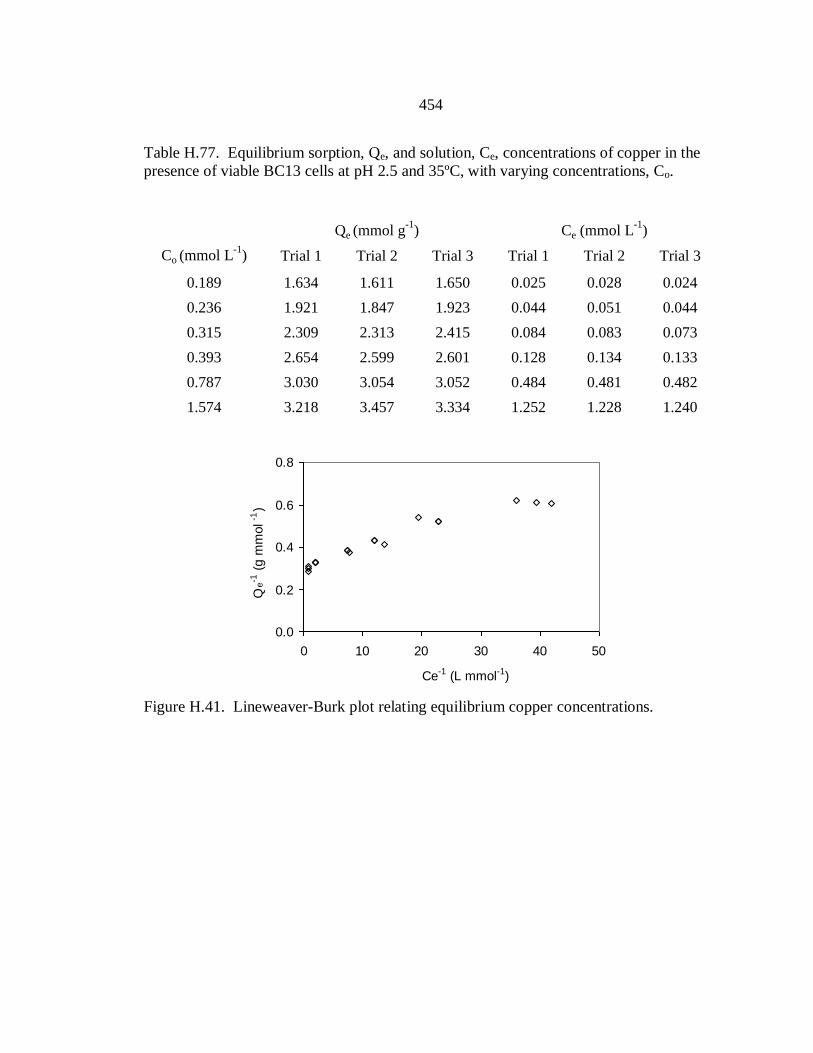
454
Table H.77. Equilibrium sorption, Qe, and solution, Ce, concentrations of copper in the
presence of viable BC13 cells at pH 2.5 and 35ºC, with varying concentrations, Co.
Qe (mmol g-1
) Ce (mmol L-1
)
Co (mmol L-1
) Trial 1 Trial 2 Trial 3 Trial 1 Trial 2 Trial 3
0.189 1.634 1.611 1.650 0.025 0.028 0.024
0.236 1.921 1.847 1.923 0.044 0.051 0.044
0.315 2.309 2.313 2.415 0.084 0.083 0.073
0.393 2.654 2.599 2.601 0.128 0.134 0.133
0.787 3.030 3.054 3.052 0.484 0.481 0.482
1.574 3.218 3.457 3.334 1.252 1.228 1.240
0.0
0.2
0.4
0.6
0.8
0 10 20 30 40 50
Ce-1 (L mmol-1)
Qe-1
(g m
mol-1
)
Figure H.41. Lineweaver-Burk plot relating equilibrium copper concentrations.

455
Table H.78. Equilibrium sorption, Qe, and solution, Ce, concentrations of copper in the
presence of dehydrated BC13 cells at pH 2.5 and 35ºC, with varying concentrations, Co.
Qe (mmol g-1
) Ce (mmol L-1
)
Co (mmol L-1
) Trial 1 Trial 2 Trial 3 Trial 1 Trial 2 Trial 3
0.189 1.320 1.365 1.354 0.057 0.052 0.053
0.236 1.450 1.425 1.456 0.091 0.094 0.090
0.315 1.580 1.602 1.596 0.157 0.155 0.155
0.393 1.700 1.623 1.648 0.223 0.231 0.229
0.787 1.791 1.802 1.892 0.608 0.607 0.598
1.574 1.840 1.830 1.825 1.390 1.391 1.391
0.0
0.2
0.4
0.6
0.8
0 5 10 15 20 25
Ce-1 (L mmol-1)
Qe-1
(g m
mol-1
)
Figure H.42. Lineweaver-Burk plot relating equilibrium copper concentrations.
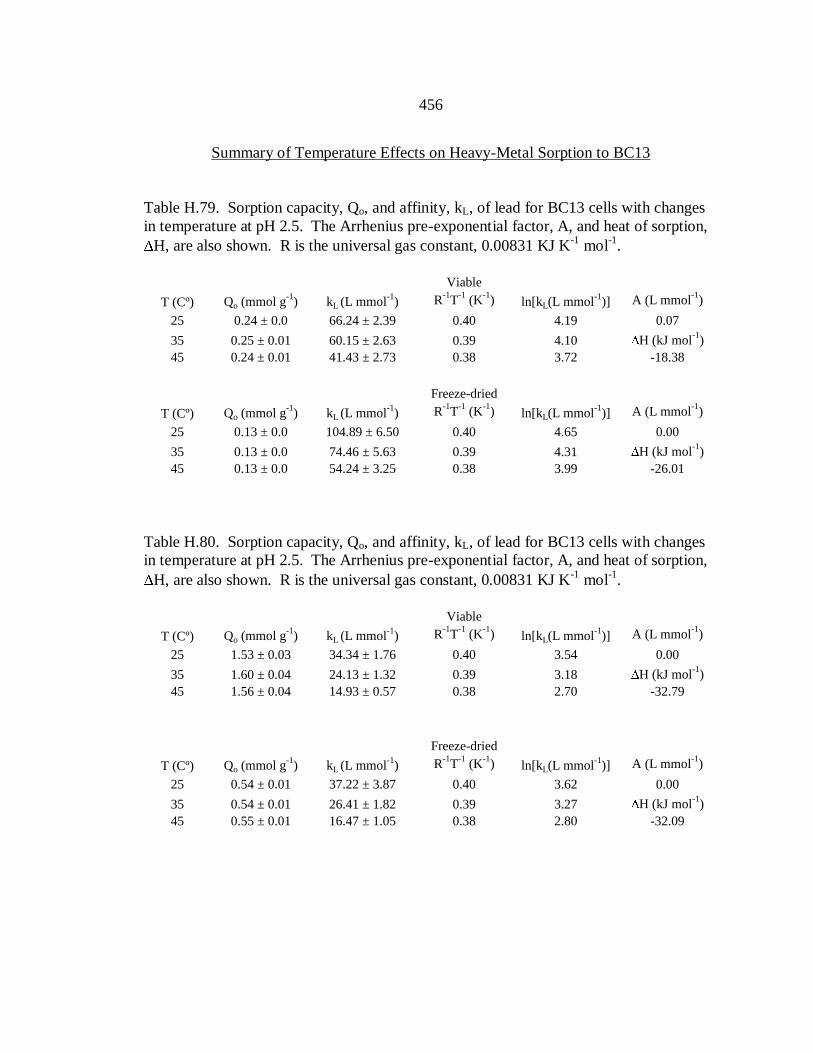
456
Summary of Temperature Effects on Heavy-Metal Sorption to BC13
Table H.79. Sorption capacity, Qo, and affinity, kL, of lead for BC13 cells with changes
in temperature at pH 2.5. The Arrhenius pre-exponential factor, A, and heat of sorption,
H, are also shown. R is the universal gas constant, 0.00831 KJ K-1
mol-1
.
Viable
T (Cº) Qo (mmol g-1
) kL (L mmol-1
) R-1
T-1
(K-1
) ln[kL(L mmol-1
)] A (L mmol-1
)
25 0.24 ± 0.0 66.24 ± 2.39 0.40 4.19 0.07
35 0.25 ± 0.01 60.15 ± 2.63 0.39 4.10 H (kJ mol-1
)
45 0.24 ± 0.01 41.43 ± 2.73 0.38 3.72 -18.38
Freeze-dried
T (Cº) Qo (mmol g-1
) kL (L mmol-1
) R-1
T-1
(K-1
) ln[kL(L mmol-1
)] A (L mmol-1
)
25 0.13 ± 0.0 104.89 ± 6.50 0.40 4.65 0.00
35 0.13 ± 0.0 74.46 ± 5.63 0.39 4.31 H (kJ mol-1
)
45 0.13 ± 0.0 54.24 ± 3.25 0.38 3.99 -26.01
Table H.80. Sorption capacity, Qo, and affinity, kL, of lead for BC13 cells with changes
in temperature at pH 2.5. The Arrhenius pre-exponential factor, A, and heat of sorption,
H, are also shown. R is the universal gas constant, 0.00831 KJ K-1
mol-1
.
Viable
T (Cº) Qo (mmol g-1
) kL (L mmol-1
) R-1
T-1
(K-1
) ln[kL(L mmol-1
)] A (L mmol-1
)
25 1.53 ± 0.03 34.34 ± 1.76 0.40 3.54 0.00
35 1.60 ± 0.04 24.13 ± 1.32 0.39 3.18 H (kJ mol-1
)
45 1.56 ± 0.04 14.93 ± 0.57 0.38 2.70 -32.79
Freeze-dried
T (Cº) Qo (mmol g-1
) kL (L mmol-1
) R-1
T-1
(K-1
) ln[kL(L mmol-1
)] A (L mmol-1
)
25 0.54 ± 0.01 37.22 ± 3.87 0.40 3.62 0.00
35 0.54 ± 0.01 26.41 ± 1.82 0.39 3.27 H (kJ mol-1
)
45 0.55 ± 0.01 16.47 ± 1.05 0.38 2.80 -32.09

457
Table H.81. Sorption capacity, Qo, and affinity, kL, of lead for BC13 cells with changes
in temperature at pH 2.5. The Arrhenius pre-exponential factor, A, and heat of sorption,
H, are also shown. R is the universal gas constant, 0.00831 KJ K-1
mol-1
.
Viable
T (Cº) Qo (mmol g-1
) kL (L mmol-1
) R-1
T-1
(K-1
) ln[kL(L mmol-1
)] A (L mmol-1
)
25 3.20 ± 0.09 47.82 ± 2.84 0.40 3.87 0.36
35 3.16 ± 0.10 39.22 ± 2.60 0.39 3.67 H (kJ mol-1
)
45 2.72 ± 0.06 35.20 ± 1.93 0.38 3.56 -12.12
Freeze-dried
T (Cº) Qo (mmol g-1
) kL (L mmol-1
) R-1
T-1
(K-1
) ln[kL(L mmol-1
)] A (L mmol-1
)
25 1.84 ± 0.02 67.62 ± 4.56 0.40 4.21 0.00
35 1.84 ± 0.03 47.07 ± 3.39 0.39 3.85 H (kJ mol-1
)
45 1.85 ± 0.03 29.59 ± 1.75 0.38 3.39 -32.54
Viable (lead)
y = 18.384x - 3.1758
R2 = 0.8846
Viable (zinc)
y = 32.785x - 9.664
R2 = 0.9887
Viable (copper)
y = 12.119x - 1.0341
R2 = 0.9777
Freeze-dried (lead)
y = 26.012x - 5.8408
R2 = 1
Freeze-dried (zinc)
y = 32.085x - 9.3012
R2 = 0.988
Freeze-dried (copper)
y = 32.542x - 8.8926
R2 = 0.9919
0
1
2
3
4
5
0.375 0.380 0.385 0.390 0.395 0.400 0.405
R-1
T-1
(mmol J-1
)
ln[k
L(L
mm
ol
-1)]
Viable (lead)
Viable (zinc)
Viable (copper)
Freeze-dried (lead)
Freeze-dried (zinc)
Freeze-dried (copper)
Figure H.43. Arrhenius plot used to calculate the pre-exponential factor (natural
logarithm of the y-intercept) and the heat of sorption (negative of the slope).
Zinc
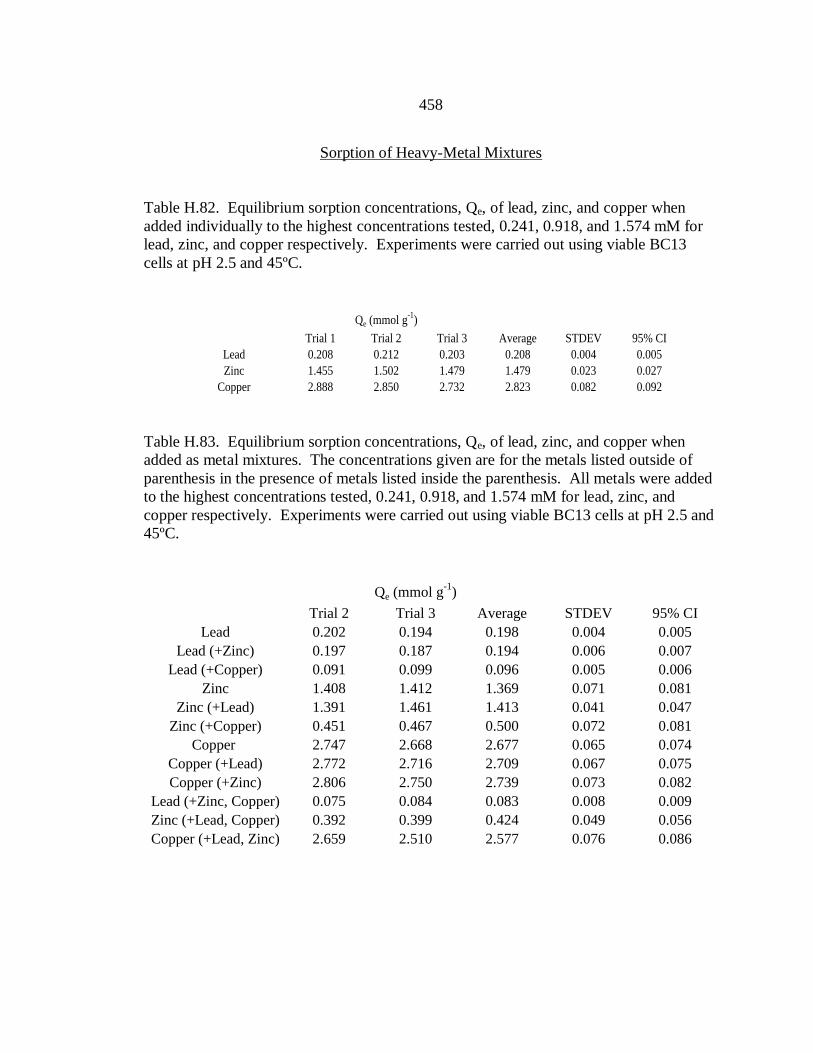
458
Sorption of Heavy-Metal Mixtures
Table H.82. Equilibrium sorption concentrations, Qe, of lead, zinc, and copper when
added individually to the highest concentrations tested, 0.241, 0.918, and 1.574 mM for
lead, zinc, and copper respectively. Experiments were carried out using viable BC13
cells at pH 2.5 and 45ºC.
Qe (mmol g-1
)
Trial 1 Trial 2 Trial 3 Average STDEV 95% CI
Lead 0.208 0.212 0.203 0.208 0.004 0.005
Zinc 1.455 1.502 1.479 1.479 0.023 0.027
Copper 2.888 2.850 2.732 2.823 0.082 0.092
Table H.83. Equilibrium sorption concentrations, Qe, of lead, zinc, and copper when
added as metal mixtures. The concentrations given are for the metals listed outside of
parenthesis in the presence of metals listed inside the parenthesis. All metals were added
to the highest concentrations tested, 0.241, 0.918, and 1.574 mM for lead, zinc, and
copper respectively. Experiments were carried out using viable BC13 cells at pH 2.5 and
45ºC.
Qe (mmol g-1
)
Trial 2 Trial 3 Average STDEV 95% CI
Lead 0.202 0.194 0.198 0.004 0.005
Lead (+Zinc) 0.197 0.187 0.194 0.006 0.007
Lead (+Copper) 0.091 0.099 0.096 0.005 0.006
Zinc 1.408 1.412 1.369 0.071 0.081
Zinc (+Lead) 1.391 1.461 1.413 0.041 0.047
Zinc (+Copper) 0.451 0.467 0.500 0.072 0.081
Copper 2.747 2.668 2.677 0.065 0.074
Copper (+Lead) 2.772 2.716 2.709 0.067 0.075
Copper (+Zinc) 2.806 2.750 2.739 0.073 0.082
Lead (+Zinc, Copper) 0.075 0.084 0.083 0.008 0.009
Zinc (+Lead, Copper) 0.392 0.399 0.424 0.049 0.056
Copper (+Lead, Zinc) 2.659 2.510 2.577 0.076 0.086

459
APPENDIX I
CHAPTER SIX RAW DATA

460
Growth of BC13 in Spent Growth Medium Containing Heavy Metals
Table I.1. BC13 growth in spent medium containing no heavy metals.
Cells mL
-1ln (Cells mL
-1)
Elapsed Time (h) Trial 1 Trial 2 Trial 3 Average STDEV 95% CI Trial 1 Trial 2 Trial 3
0 5.40E+07 5.04E+07 4.32E+07 4.92E+07 5.50E+06 6.22E+06 17.80 17.74 17.58
12 5.76E+07 5.40E+07 4.68E+07 5.28E+07 5.50E+06 6.22E+06 17.87 17.80 17.66
24 6.48E+07 6.84E+07 6.48E+07 6.60E+07 2.08E+06 2.35E+06 17.99 18.04 17.99
36 7.20E+07 6.48E+07 8.64E+07 7.44E+07 1.10E+07 1.24E+07 18.09 17.99 18.27
48 1.22E+08 1.19E+08 1.08E+08 1.16E+08 7.49E+06 8.48E+06 18.62 18.59 18.50
60 1.73E+08 1.58E+08 1.62E+08 1.64E+08 7.49E+06 8.48E+06 18.97 18.88 18.90
72 2.12E+08 2.12E+08 2.09E+08 2.11E+08 2.08E+06 2.35E+06 19.17 19.17 19.16
84 2.27E+08 2.48E+08 2.34E+08 2.36E+08 1.10E+07 1.24E+07 19.24 19.33 19.27
96 2.45E+08 2.56E+08 2.59E+08 2.53E+08 7.49E+06 8.48E+06 19.32 19.36 19.37
108 2.70E+08 2.77E+08 2.70E+08 2.72E+08 4.16E+06 4.70E+06 19.41 19.44 19.41
120 3.02E+08 2.45E+08 2.56E+08 2.68E+08 3.06E+07 3.46E+07 19.53 19.32 19.36
Specific growth rates (h-1
)
Trial 1 0.029
Trial 2 0.025
Trial 3 0.026
Average 0.027
STDEV 0.002
95% CI 0.002
y = 0.0248x + 17.375
y = 0.026x + 17.281
y = 0.0289x + 17.202
17.5
18.0
18.5
19.0
19.5
0 10 20 30 40 50 60 70
Elapsed time (h)
ln [
Cel
ls m
L-1
]
Figure I.1. Specific growth rate calculations for Trial 1 (open circles), Trial 2 (open
squares), and Trial 3 (open triangles).

461
Table I.2. BC13 growth in spent medium containing lead.
Cells mL
-1ln (Cells mL
-1)
Elapsed Time (h) Trial 1 Trial 2 Trial 3 Average STDEV 95% CI Trial 1 Trial 2 Trial 3
0 4.5E+07 5.2E+07 4.7E+07 4.80E+07 3.44E+06 3.89E+06 17.62 17.76 17.67
12 4.5E+07 5.2E+07 5.4E+07 5.03E+07 4.68E+06 5.30E+06 17.62 17.76 17.80
24 5.9E+07 6.1E+07 5.9E+07 5.93E+07 1.30E+06 1.47E+06 17.88 17.92 17.88
36 6.8E+07 7.0E+07 7.2E+07 6.98E+07 2.25E+06 2.55E+06 18.03 18.06 18.09
48 8.6E+07 9.5E+07 9.5E+07 9.15E+07 5.20E+06 5.88E+06 18.26 18.36 18.36
60 1.1E+08 1.2E+08 1.2E+08 1.19E+08 3.90E+06 4.41E+06 18.56 18.62 18.62
72 1.3E+08 9.9E+07 1.0E+08 1.11E+08 1.70E+07 1.93E+07 18.68 18.41 18.45
84 1.5E+08 1.3E+08 1.3E+08 1.38E+08 1.30E+07 1.47E+07 18.84 18.68 18.68
96 1.3E+08 1.3E+08 1.2E+08 1.27E+08 9.37E+06 1.06E+07 18.72 18.68 18.57
108 1.5E+08 1.2E+08 1.3E+08 1.29E+08 1.50E+07 1.70E+07 18.80 18.57 18.65
120 1.5E+08 1.1E+08 1.4E+08 1.35E+08 2.04E+07 2.31E+07 18.83 18.53 18.78
Specific growth rates (h-1
)
Trial 1 0.021
Trial 2 0.019
Trial 3 0.020
Average 0.020
STDEV 0.001
95% CI 0.001
y = 0.0205x + 17.376
y = 0.0199x + 17.406
y = 0.0188x + 17.393
17.5
18.0
18.5
19.0
0 10 20 30 40 50 60 70
Elapsed time (h)
ln [
Cel
ls m
L-1
]
Figure I.2. Specific growth rate calculations for Trial 1 (open circles), Trial 2 (open
squares), and Trial 3 (open triangles).

462
Table I.3. BC13 growth in spent medium containing zinc.
Cells mL
-1ln (Cells mL
-1)
Elapsed Time (h) Trial 1 Trial 2 Trial 3 Average STDEV 95% CI Trial 1 Trial 2 Trial 3
0 5.0E+07 4.7E+07 4.5E+07 4.73E+07 2.25E+06 2.55E+06 17.72 17.67 17.62
12 5.0E+07 4.7E+07 4.5E+07 4.73E+07 2.25E+06 2.55E+06 17.72 17.67 17.62
24 6.8E+07 5.2E+07 5.4E+07 5.78E+07 8.52E+06 9.64E+06 18.03 17.76 17.80
36 7.7E+07 7.2E+07 6.3E+07 7.05E+07 6.87E+06 7.78E+06 18.15 18.09 17.96
48 9.0E+07 9.4E+07 8.2E+07 8.83E+07 6.17E+06 6.98E+06 18.32 18.35 18.22
60 1.3E+08 1.2E+08 1.0E+08 1.18E+08 1.59E+07 1.80E+07 18.69 18.64 18.42
72 1.5E+08 4.2E+07 1.6E+08 1.18E+08 6.59E+07 7.45E+07 18.82 17.55 18.90
84 1.6E+08 1.3E+08 1.3E+08 1.41E+08 1.31E+07 1.48E+07 18.87 18.72 18.70
96 1.5E+08 1.6E+08 1.4E+08 1.50E+08 6.28E+06 7.10E+06 18.83 18.86 18.78
108 1.7E+08 1.4E+08 1.5E+08 1.54E+08 1.27E+07 1.44E+07 18.94 18.78 18.83
120 1.5E+08 1.5E+08 1.6E+08 1.52E+08 4.26E+06 4.82E+06 18.84 18.81 18.87
Specific growth rates (h-1
)
Trial 1 0.018
Trial 2 0.024
Trial 3 0.018
Average 0.020
STDEV 0.004
95% CI 0.004
y = 0.0176x + 17.361
y = 0.024x + 17.202
y = 0.0178x + 17.547
17.5
18.0
18.5
19.0
0 10 20 30 40 50 60 70
Elapsed time (h)
ln [
Cel
ls m
L-1
]
Figure I.3. Specific growth rate calculations for Trial 1 (open circles), Trial 2 (open
squares), and Trial 3 (open triangles).

463
Table I.4. BC13 growth in spent medium containing copper.
Cells mL
-1ln (Cells mL
-1)
Elapsed Time (h) Trial 1 Trial 2 Trial 3 Average STDEV 95% CI Trial 1 Trial 2 Trial 3
0 5.76E+07 3.96E+07 5.04E+07 4.92E+07 9.06E+06 1.03E+07 17.87 17.49 17.74
12 5.76E+07 4.68E+07 5.40E+07 5.28E+07 5.50E+06 6.22E+06 17.87 17.66 17.80
24 5.76E+07 5.04E+07 6.48E+07 5.76E+07 7.20E+06 8.15E+06 17.87 17.74 17.99
36 7.56E+07 5.76E+07 7.92E+07 7.08E+07 1.16E+07 1.31E+07 18.14 17.87 18.19
48 1.01E+08 7.56E+07 1.08E+08 9.48E+07 1.70E+07 1.93E+07 18.43 18.14 18.50
60 1.30E+08 1.08E+08 1.44E+08 1.27E+08 1.81E+07 2.05E+07 18.68 18.50 18.79
72 1.37E+08 1.30E+08 1.34E+08 1.34E+08 3.60E+06 4.07E+06 18.74 18.68 18.71
84 1.66E+08 1.23E+08 1.66E+08 1.52E+08 2.49E+07 2.82E+07 18.93 18.63 18.93
96 1.73E+08 1.48E+08 2.02E+08 1.74E+08 2.70E+07 3.06E+07 18.97 18.81 19.12
108 1.84E+08 1.66E+08 2.06E+08 1.85E+08 1.98E+07 2.24E+07 19.03 18.93 19.14
120 1.80E+08 1.77E+08 2.13E+08 1.90E+08 1.98E+07 2.24E+07 19.01 18.99 19.18
Specific growth rates (h-1
)
Trial 1 0.023
Trial 2 0.021
Trial 3 0.023
Average 0.022
STDEV 0.001
95% CI 0.001
y = 0.0225x + 17.417
y = 0.0213x + 17.165
y = 0.0227x + 17.327
17.5
18.0
18.5
19.0
0 10 20 30 40 50 60 70
Elapsed time (h)
ln [
Cel
ls m
L-1
]
Figure I.4. Specific growth rate calculations for Trial 1 (open circles), Trial 2 (open
squares), and Trial 3 (open triangles).

464
Heavy Metal Concentrations Remaining in Spent Medium Preceding Re-inoculation
Table I.5. Concentration of lead, zinc, or copper remaining in spent medium following
initial exposure to BC13. Concentration is given as a percentage of the previously
calculated IC50s, and was used to predict an expected toxicity of the fresh inoculum.
Percent of IC50 95% CI
Lead 59.26 15.57
Zinc 63.64 1.71
Copper 77.33 1.28
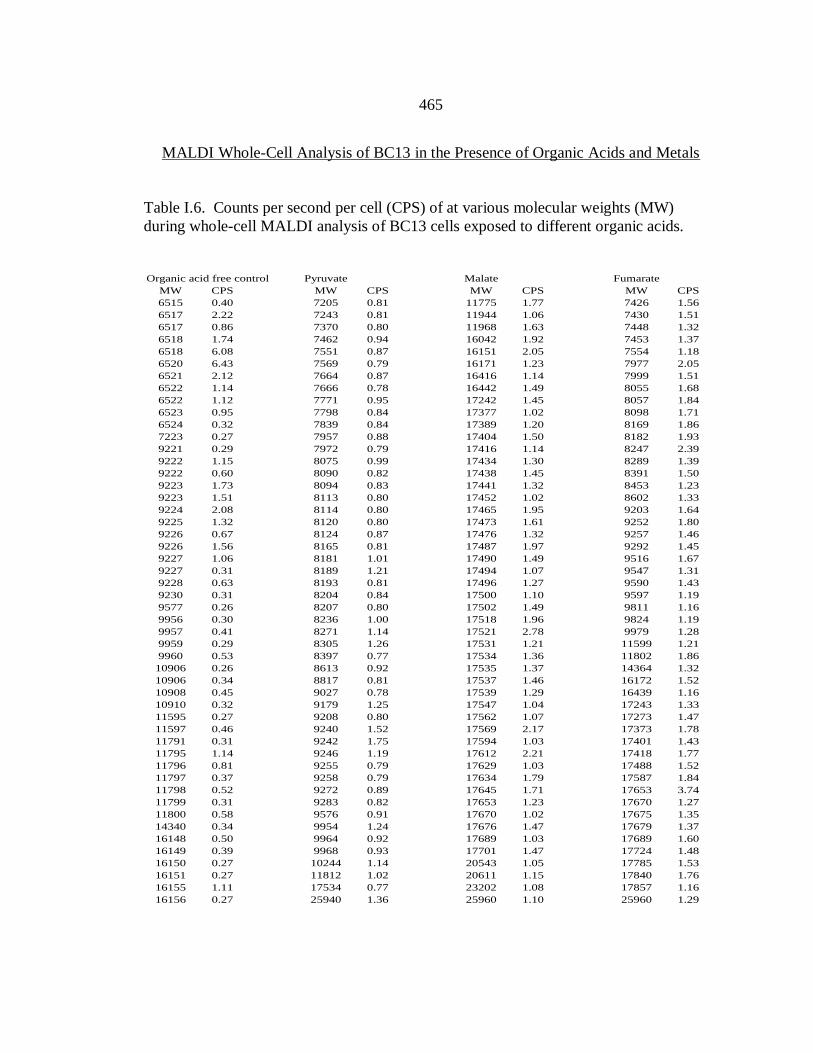
465
MALDI Whole-Cell Analysis of BC13 in the Presence of Organic Acids and Metals
Table I.6. Counts per second per cell (CPS) of at various molecular weights (MW)
during whole-cell MALDI analysis of BC13 cells exposed to different organic acids.
Organic acid free control Pyruvate Malate Fumarate
MW CPS MW CPS MW CPS MW CPS
6515 0.40 7205 0.81 11775 1.77 7426 1.56
6517 2.22 7243 0.81 11944 1.06 7430 1.51
6517 0.86 7370 0.80 11968 1.63 7448 1.32
6518 1.74 7462 0.94 16042 1.92 7453 1.37
6518 6.08 7551 0.87 16151 2.05 7554 1.18
6520 6.43 7569 0.79 16171 1.23 7977 2.05
6521 2.12 7664 0.87 16416 1.14 7999 1.51
6522 1.14 7666 0.78 16442 1.49 8055 1.68
6522 1.12 7771 0.95 17242 1.45 8057 1.84
6523 0.95 7798 0.84 17377 1.02 8098 1.71
6524 0.32 7839 0.84 17389 1.20 8169 1.86
7223 0.27 7957 0.88 17404 1.50 8182 1.93
9221 0.29 7972 0.79 17416 1.14 8247 2.39
9222 1.15 8075 0.99 17434 1.30 8289 1.39
9222 0.60 8090 0.82 17438 1.45 8391 1.50
9223 1.73 8094 0.83 17441 1.32 8453 1.23
9223 1.51 8113 0.80 17452 1.02 8602 1.33
9224 2.08 8114 0.80 17465 1.95 9203 1.64
9225 1.32 8120 0.80 17473 1.61 9252 1.80
9226 0.67 8124 0.87 17476 1.32 9257 1.46
9226 1.56 8165 0.81 17487 1.97 9292 1.45
9227 1.06 8181 1.01 17490 1.49 9516 1.67
9227 0.31 8189 1.21 17494 1.07 9547 1.31
9228 0.63 8193 0.81 17496 1.27 9590 1.43
9230 0.31 8204 0.84 17500 1.10 9597 1.19
9577 0.26 8207 0.80 17502 1.49 9811 1.16
9956 0.30 8236 1.00 17518 1.96 9824 1.19
9957 0.41 8271 1.14 17521 2.78 9979 1.28
9959 0.29 8305 1.26 17531 1.21 11599 1.21
9960 0.53 8397 0.77 17534 1.36 11802 1.86
10906 0.26 8613 0.92 17535 1.37 14364 1.32
10906 0.34 8817 0.81 17537 1.46 16172 1.52
10908 0.45 9027 0.78 17539 1.29 16439 1.16
10910 0.32 9179 1.25 17547 1.04 17243 1.33
11595 0.27 9208 0.80 17562 1.07 17273 1.47
11597 0.46 9240 1.52 17569 2.17 17373 1.78
11791 0.31 9242 1.75 17594 1.03 17401 1.43
11795 1.14 9246 1.19 17612 2.21 17418 1.77
11796 0.81 9255 0.79 17629 1.03 17488 1.52
11797 0.37 9258 0.79 17634 1.79 17587 1.84
11798 0.52 9272 0.89 17645 1.71 17653 3.74
11799 0.31 9283 0.82 17653 1.23 17670 1.27
11800 0.58 9576 0.91 17670 1.02 17675 1.35
14340 0.34 9954 1.24 17676 1.47 17679 1.37
16148 0.50 9964 0.92 17689 1.03 17689 1.60
16149 0.39 9968 0.93 17701 1.47 17724 1.48
16150 0.27 10244 1.14 20543 1.05 17785 1.53
16151 0.27 11812 1.02 20611 1.15 17840 1.76
16155 1.11 17534 0.77 23202 1.08 17857 1.16
16156 0.27 25940 1.36 25960 1.10 25960 1.29

466
Table I.7. Counts per second per cell (CPS) of at various molecular weights (MW)
during whole-cell MALDI analysis of BC13 cells exposed to heavy metals.
Metal free control Lead Zinc Copper
MW CPS MW CPS MW CPS MW CPS
6515 0.40 6517 0.20 6212 0.84 6515 1.01
6517 2.22 6517 0.13 6519 1.15 6516 0.72
6517 0.86 6518 0.28 6519 2.16 6517 1.15
6518 1.74 6520 0.18 6521 1.30 6518 3.60
6518 6.08 6521 0.41 6522 0.87 6518 14.42
6520 6.43 6523 0.22 8089 0.96 6519 2.38
6521 2.12 8090 0.16 8090 1.12 6520 17.23
6522 1.14 8092 0.23 8091 0.80 6521 3.03
6522 1.12 8846 0.19 9220 2.23 6522 1.08
6523 0.95 9223 0.43 9221 2.40 6522 1.73
6524 0.32 9224 1.94 9222 12.52 6524 1.73
7223 0.27 9226 0.54 9223 8.06 6532 0.72
9221 0.29 9227 0.38 9224 13.12 6535 0.72
9222 1.15 9227 0.23 9225 24.18 6537 0.87
9222 0.60 9229 0.26 9226 11.32 7222 1.21
9223 1.73 9230 0.17 9227 4.46 7224 0.99
9223 1.51 9231 0.21 9228 5.23 7226 0.99
9224 2.08 9576 0.17 9229 1.54 7230 0.76
9225 1.32 9958 0.27 9957 0.89 8087 0.80
9226 0.67 9959 0.19 9958 0.89 8088 0.96
9226 1.56 9960 0.11 9959 2.67 9223 1.37
9227 1.06 9961 0.17 9962 1.43 9224 1.20
9227 0.31 9963 0.19 10906 0.93 9225 1.03
9228 0.63 9964 0.25 10909 1.31 9226 1.20
9230 0.31 10906 0.20 11599 0.96 9229 1.03
9577 0.26 10908 0.16 11600 2.12 9818 0.88
9956 0.30 11600 0.14 11601 0.96 9956 0.89
9957 0.41 11670 0.14 11668 0.77 9958 1.51
9959 0.29 11673 0.13 11672 0.96 9959 1.96
9960 0.53 11794 0.19 11675 0.77 9962 1.60
10906 0.26 11796 0.19 11676 0.77 11793 0.97
10906 0.34 11797 0.27 11795 2.13 11794 2.13
10908 0.45 11799 0.48 11796 1.75 11796 2.33
10910 0.32 11800 0.32 11798 2.33 11797 1.84
11595 0.27 11958 0.27 11798 0.78 11799 1.94
11597 0.46 11959 0.15 11801 0.97 11799 1.16
11791 0.31 11961 0.17 11802 0.97 11801 0.87
11795 1.14 11962 0.27 11958 1.07 11802 1.36
11796 0.81 11963 0.20 11961 0.98 11809 1.36
11797 0.37 12238 0.12 12815 0.91 11817 0.97
11798 0.52 16041 0.11 12819 0.81 14335 0.75
11799 0.31 16073 0.28 12984 1.02 14336 0.75
11800 0.58 16149 0.11 16149 2.61 14337 1.50
14340 0.34 16151 0.41 16151 3.29 14343 0.86
16148 0.50 16152 0.23 16152 1.48 16153 0.91
16149 0.39 16155 0.11 16153 2.84 16154 0.79
16150 0.27 16157 0.11 16156 4.20 16399 0.80
16151 0.27 16159 0.11 16157 1.36 16435 0.92
16155 1.11 16426 0.11 16172 0.91 17518 1.18
16156 0.27 25956 0.76 25957 0.86 25967 0.72
0
5
10
15
20
25
30
5000 10000 15000 20000 25000
467
APPENDIX J
PROTOCOLS FOR PROTEIN SEPARATION AND ANALYSIS
468
Appendix J.1. Recipe for phosphate buffer used in protein separation protocols.
Dissolve the following in 800ml nanopure water (18.4 M )
8g of NaCl
0.2g of KCl
1.44g of Na2HPO4
0.24g of KH2PO4
Adjust pH to 7.4.
Adjust volume to 1L with nanopure water (18.4 M )
Sterilize by autoclaving
Appendix J.2. Recipe for denaturing buffer used in protein separation protocols.
20 mL glycerol
12 mL 1M tris-HCl pH 6.8
4 g sodium dodecyl sulfate
400 L of 1% stock bromophenol blue
Add nanopure water (18.4 M ) to 50 mL
Make 0.5 mL aliquots and store at -20oC
Add 1M DTT before use (1 L for each 5 L buffer)
Appendix J.3. Recipe for rehydration buffer used in protein separation protocols.
25 mL of 30 mM tris-HCl (pH 8.5)
10.51 g urea
3.8 g thiourea
1 g CHAPS
0.345 g ASB-14
Mix until proteins are solublized then add:
Protease inhibitor cocktail (20 L)
100 µL 1% Bromophenol blue
2 µL DNase/Rnase
Make 1 mL aliquots and store at -80oC

469
Appendix J.4. Recipe for equilibration buffer used in protein separation protocols.
Equilibration Buffer
72.1 g urea
84.2 g glycerine
4 g sodium dodecyl sulfate
10 mL of 75 mM tris-HCl (pH 8.8)
400 L of 1% stock bromophenol blue
Appendix J.5. Recipe for running buffer used in protein separation protocols.
10X SDS Running Buffer
144 g glycine
30 g tris base
Add nanopure water (18.4 M ) to 1L and filter
10 g sodium dodecyl sulfate
Appendix J.6. Recipe for coomassie blue used in protein separation protocols.
Dissolve 2g Coomassie Blue in 250 mL nanopure water (18.4 M ).
Add 75 mL of glacial acetic acid
Add 500 mL of ethanol
Add nanopure water (18.4 M ) to a volume of 1 L

470
Appendix J.7. Protocol for cell fractionation.
Spin down cells at 4,700 rpm for 15 minutes
Remove supernatant and wash cells with 4 mL of 25 mM Phosphate buffer saline
Spin down cells at 4,700 rpm for 15 minutes
Remove supernatant and wash cells with 1.5 mL of 25 mM PBS
Spin down cells at 4,700 rpm for 15 minutes
Remove supernatant and resuspend pellet in 1.0 mL of 25 mM PBS
Add 5 L DNAse/RNAse and 20 L of protease inhibitor cocktail to each sample.
Freeze in liquid nitrogen and then thaw, repeat 3 times.
Transfer samples to 15 mL falcon tubes
Sonicate samples twice, 1 minutes each, and then incubate at room temperature
for 15 minutes
Spin samples at 15,000 g for 35 minutes at 4°C
Save supernatant at -80°C (Soluble 1)
Resuspend pellet in 0.5 M NaCl in 20 mM Sodium Acetate with 20 L PIC and 5
L DNAse/RNAse added.
Spin down sample at 15,000xg for 25 minutes and save supernatant at -80°C
(Soluble 2)
Resuspend pellet in 150-200 L of 0.4% triton X-100 in 25 mM PBS
Spin down sample for 25 minutes at 13,000xg
Save supernatant at -80°C (detergent fraction/ Peripheral proteins)
Resuspend pellet in 150-200 L of 25 mM PBS (integral membrane proteins)
471
Appendix J.8. Protocol for IEF separation.
IEF Strip Loading
Measuring the sample protein concentration to determine the volume needed
Add Urea buffer to sample to give desired total volume and protein
Add DTT to a concentration of 40 mM (19.2 L of 1 M stock to 450 L sample)
Add IPG Buffer to sample. The final conc. should be 0.5% of IPG Buffer
Mix the sample at room temperature 15 min for complete solubilization
Spin the sample at 15,000 RPM @ 20°C for 10 min
Load the desired volume onto the IEF strip, being careful to avoid any
unsolubilized particulate at the bottom of the tube (even if you don‟t see one)
Load your IEF strip into ceramic strip holder with the gel facing down and cover
with 3 ml of mineral oil
Cover the strip holder with its plastic cover and load it onto the IEF instrument
Cover the instrument with black sheet to prevent light if you are using Cydye or
Zedye in your sample
Follow the IEF focusing progress by monitoring the movement of the
bromophenol blue dye towered the anode side (+). The blue dye should be at the
end of the strip by the end of the focusing protocol
Remove the strip from the holder and proceed with equilibration steps or freeze
your strips at -80°C
IEF Strip Equilibration
Place strips in plastic holders, gel side facing up
Set-aside two aliquots of equilibration buffers
o Add 100 mg/ 10 mL DTT to the first and 250 mg/10 mL iodoacitimide to
the second
o Mix each solution until it dissolves
Add 3 mL of first equilibration solution to each strip, cover and shake for 15
minutes
Decant first equilibration solution and add 3 mL of the second equilibration
solution and cover and shake another 15 minutes before carefully decanting this
solution. Strips are now ready for second dimension

472
Appendix J.9. Protocol for 2nd
dimension separation.
2nd
Dimension Preparation
Acrylamide from the refrigerator ~ 1 hour before use
Collect necessary gel plates and spacers and rinse with nanopure water
Place identification labels between gel plates as you load them into the Amersham
casting box. Be sure to leave a plastic spacer between each plate
Adjust the lower drain on the casting box so that it is facing upwards and cover it
with parafilm
Fill casting box with water to the “fill line” to determine the necessary gel
volume. Allow water to sit for at least 10 minutes to make sure there are no leaks
Prepare 1.5 M Tris
o pH Tris to 8.8 using concentrated HCl
o Vacuum filter using 0.45 m filters
o Prepare 10% SDS (by weight) in nanopure water
o Prepare 10% APS (by weight) in nanopure, this should be fresh
o Mix Tris, 10% SDS, acrylmide, and nanopure using the volumes for the
desired % gel listed below
Per 100 mL
10% 11% 12% 13%
40% Acrylamide 25 27.5 30 32.5
1.5 M Tris-HCl pH 8.8 25 25 25 25
10% SDS 1 1 1 1
nanopure water 48.5 46 43.5 41
TEMED 0.05 0.05 0.05 0.05
10% APS 0.5 0.5 0.5 0.5
Total 100.05 100.05 100.05 100.05
Degas mixture using vacuum for at least 5 minutes
Empty water from casting box and re-seal drain using parafilm
Add APS to gel solution
Add TEMED to gel solution
Pour gel into casting box using a glass funnel
Use spray bottle to evenly cover each gel with 1-2 mL of water
Cover and allow gels to polymerize overnight
Fill Daltwelve box with 10 L nanopure water
Re-fill box with 9 L of nanopure water
Add 1 L of 10 x sodium dodecyl sulfate running buffer

473
Add 1x SDS running buffer to the top of the gel
Insert IEF strips
Insert marker paper at end of strips, dotted with 200 L of a molecular weight
marker
Add 0.75% agarose in 1xSDS running buffer smoothly to the top of the gel, being
careful to avoid bubbles
Turn on pump and powersource (4W per gel) and run until the blue line migrates
out of the gel
Appendix J.10. Protocol for trypsin digest.
Stain gel
Excise bands of interest using sterile techniques
Wash samples 3 x 10 minutes with 25 mM ammonium bicarbonate in 50%
acetonitrile
Dry samples in a vacuum centrifuge for 10 minutes at 30°C
Reduce samples for 40 minutes at 56°C using a solution of 10 mM DTT, 25 mM
ammonium bicarbonate in 50% acetonitrile
Dehydrate samples for 5 minutes using 50/50 methanol/acetonitrile
Alkylate samples for 30 minutes at room temperuature in a 25 mM solution of
ammonium bicarbonate containing 55 mM iodoacetimide
Wash samples using 25 mM ammonium bicarbonate for 10 minutes, and then
dehydrate using 50/50 methanol/acetonitrile and repeat three times
Dry samples in a vacuum centrifuge for 10 minutes at 30°C
Rehydrate cells on ice for 30 minutes with a 40 ng L-1
tyrpsin solution in 25 mM
ammonium bicarbonate. Then incubate for 24 hours at 37°C
474
Appendix J.11. Gradients used in mass-spectrometry analysis.
Nano Pump
Time (min) Percent B
0 0
1 0
23 100
27 100
29 0
Capillary Pump
Time (min) Percent B
0 0
9 100
10 100
12 0

475
APPENDIX K
16S rRNA GENE SEQUENCE

476
Table K.1. 16S rRNA gene sequence for strain used in experiments.
gatctggaggaacaccagtggcgaaggcggtcacctggcccaatactgacgttgaggcgcgaaagcgtggggagcaaacag
gattagataccctggtagtccacgccctaaacgatggatactggatgtttggcgccttaggtgctgagtgtcgtagctaacgcgat
aagtatcccgcctgggaagtacggccgcaaggttaaaactcaaaggaattgacgggggcccgcacaagcggtggagcatgtg
gtttaattcgatgcaacgcgaagaaccttacctgggcttgacatgtccggaaccctgcagagatgtgggggtgcccttcgggga
atcggaacacaggtgctgcatggctgtcgtcagctcgtgtcgtgagatgttgggttaagtcccgcaacgagcgcaacccttgttc
ctagttgccagcggttcggccgggcactctagggagactgccggtgacaaaccggaggaaggtggggatgacgtcaagtcct
catggcctttatgtccagggctacacacgtgctacaatggcgcgtacagagggaagccaagccgcgaggtcgcgagcagacc
ccagaaagcgcgtcgtagttcggattgcagtctgcaactcgactgcatgaagtcggaatcgctagtaatcgcggatcagcatgc
cgcggtgaatacgttcccgggccttgtacacaccgcccgtaagaccatgggagtggatgg
Sequencing results: > 99% similarity to multiple Acidithobacillus caldus strains.

![S2 Science Acids and Metals - Grangemouth292166]S2_Me… · S2 Science Acids and Metals Page 2 Success Criteria Level Success Criteria - Acids 3 List some uses of the three most common](https://img.dokumen.tips/doc/110x75/5f539d07c9e72a7e9510dc05/s2-science-acids-and-metals-grangemouth-292166s2me-s2-science-acids-and-metals.jpg)