Embed Size (px)
Citation preview

ILASS Americas, 19th Annual Conference on Liquid Atomization and Spray Systems, Toronto, Canada, May 2006
Effects of Nozzle Geometry on Cone Angles of High-Pressure Diesel Spray in Near-Nozzle
Region
Seong-Kyun Cheong, Christopher F. Powell, Kyoung-su Im, Xin Liu, and Jin Wang*
Argonne National Laboratory
Argonne, IL 60439 USA
Ming-Chia Lai
Wayne State University
Detroit, MI 48202 USA
Abstract
For diesel injection systems, the injector nozzle geometry has a significant effect on fuel atomization. Time-
resolved x-radiography was employed to measure fuel mass distributions in the near-nozzle region of sprays from
two single-hole mini-sac nozzles. One nozzle has a hydroground orifice inlet, the other one has not been subjected to
the hydro-grinding process, which has sharp inlet edges. The injection was performed at 1000 bar of injection pres-
sure and to 1 bar ambient pressure of helium gas at room temperature. For sprays during a short injection duration,
the spray cone angles were directly correlated with the pintle motion in the injection nozzles. During a relatively
long injection event (1 ms), drastically different cone angles were observed for the sprays from the two nozzles in
the near-nozzle region (< 5 mm from the orifice exit). The result has demonstrated that liquid-fuel breakup is ex-
tremely sensitive to nozzle internal geometry, especially at a quasi-steady condition when the injector pintle is fully
opened. Under these testing conditions, we can attribute the different spray cone angles to the internal-cavitation-
induced jet breakup. A three-dimensional transient CFD simulation of the internal flow is in progress to confirm this
breakup mechanism.
*Corresponding author, [email protected]

Introduction
The stability and disintegration of liquid jets has
been of theoretical and experimental interest for more
than one hundred years because of its technological
significance [1]. In the application of fuel injection for
internal combustion engines using direct injection (DI)
technology, the fundamental knowledge on fuel-
injection dynamics is vital for improving combustion
efficiency and reducing pollutant emission. Recent
advances in diesel engine technologies have employed
increasingly high injection pressures (>150 MPa),
smaller orifice diameters (< 100 !m), and multiply
transient (< 500 !s duration) injections for achieving
better atomization of the fuel sprays. These require-
ments have brought even greater impetus to the under-
standing of fluid dynamics of fuel inside the nozzle
orifice and the fuel sprays immediately outside the noz-
zle exit, and their dependence on the nozzle geometry.
More specifically, the breakup process in the sprays is
ultimately responsible for the nonuniform combustion
in engine cylinders. One aspect of this broad research
area has been to investigate the qualitative and quantita-
tive correlation between the nozzle geometry and liquid
breakup characteristics [2-4]. For high-pressure, high-
speed injection such as diesel injection, there are many
possible breakup mechanisms including turbulences of
internal flows, spatial gradient and temporal pulsation
of nozzle internal pressure, internal cavitation due to
nozzle physical geometry, and change of velocity pro-
file at the nozzle exit [5-7]. Visualization of the near-
nozzle sprays is crucial for verifying the theoretical
speculations on jet breakup. However, this near-nozzle
region has been difficult, if not impossible, to study due
to its optical opacity caused by a large amount of small
liquid droplets surrounding the jets. Recently, a time-
resolved, synchrotron-based x-ray absorption technique
has been developed for probing the diesel fuel distribu-
tion quantitatively outside DI injector orifices with a
!s-temporal resolution [8-10]. The results have pro-
vided a tremendous amount of dynamic information on
high-pressure fuel sprays in the optically dense near-
nozzle region. Such structural and dynamical proper-
ties of the fuel sprays are closely related to the nozzle
orifice geometry and structure on a !m-length scale,
and the microstructure-induced fluid dynamics, such as
cavitation and turbulence, inside the orifice. Therefore,
an interrogation of the entire injection process is re-
quired to understand the fuel-spray phenomena both
outside and inside an injection orifice. Although stud-
ies have been done primarily with scaled-up nozzles or
transparent nozzles made of plastic materials [11], the
direct evidence to link the nozzle geometry and the
spray dynamics has not been established. Also, a pre-
vious attempt to identify the nozzle geometry effects on
the spray characteristics was virtually unsuccessful [12]
because the measurement was performed under injec-
tion conditions not appropriate to reveal the effects. In
this brief paper, we wish to illustrate the influence of
nozzle geometry on the properties of high-pressure,
high-speed spray in an unambiguous manner by using
the synchrotron x-ray-based radiographic technique.
Experiment and Results
It has been speculated that the liquid breakup can
be caused by in-nozzle flow turbulence, cavitation, and
ambient aerodynamics outside of the nozzle. To illus-
trate the sole effect of the nozzle geometry, we chose
two nominally axial-symmetric, single-orifice nozzles
with a fine but distinctive feature difference: one has a
hydroground orifice inlet and the other does not. The
one without has sharp inlet edges as shown schemati-
cally in Figure 1.
Figure 1. Schematics of two single-orifice nozzles
studied: with hydroground inlet (left) and nonhydro-
ground inlet (right), as highlighted in the dashed rec-
tangles. The schematics are drawn approximately to
scale.
The remaining geometric parameters of the two
nozzles are almost identical. To obtain the sole effects
of nozzle geometry on the near-nozzle jet breakup, we
used the following testing conditions. 1) The injection
was performed into a spray chamber filled with helium
gas at 1 bar pressure and at room temperature (typically
25-28°C). Helium, the lightest inert gas (molecular
weight of 4), was used to reduce the aerodynamics-
assisted fuel breakup [13, 14]. 2) The nominal injection
time was chosen from 400 to 1 ms. With the longer
injection time (1 ms), a quasi-steady flow can be estab-
lished, free of the effect of the pintle motion, within a
large fraction of the injection duration. With an inde-
pendent method, we directly measured the pintle mo-
tion, and such a quasi-steady flow state can be con-
firmed (data not shown). The radiographic images of
the sprays were collected by a focused and monochro-
matic synchrotron x-ray beam, 8 keV, 200 (H) x 30 (V)
µm2, at the XOR 1-BM beamline of the Advanced Pho-
ton Source (APS), in conjunction with a fast avalanche
photodiode (APD) point detector [10]. The data were

collected by positioning the transient fuel spray be-
tween the x-ray beam and an APD and recording the
time-resolved response of the detector on a transient
digitizing oscilloscope. For single-wavelength x-rays
transmitting through a nonuniformly distributed mate-
rial (fuel jet), the analysis of the fuel mass (
!
M ) in the
beam from measured x-ray transmission (
!
I I0
) and
the fuel mass absorption coefficient (
!
µM
) of the at-
tenuating material is straightforward, as
!
M = "1
µM
lnI
I0
#
$ %
&
' ( . (1)
Figure 2. Microscopic cone angle measurement of the
fuel sprays by x-radiography, with a short injection
duration of nominal 400 !s from the hydroground noz-
zle into He gas, within 5.3 mm from the orifice exit at
a) and d) 120 !s (during needle opening); b) and e) 330
!s (needle opened); and c) and f) 480 !s (during the
needle closing). The upper panels (a-c) display the
composite spray images and the lower ones (d-f) show
the projected (line-of-sight integrated) fuel mass
distribution at several axial locations highlighted by the
dashed lines in a.
Thus, the time evolution of the measured x-ray
transmission can be simply transformed into integrated,
line-of-sight mass data at each point in the image of the
fuel spray. The spray was generated with 1000-bar
injection pressure using the hydroground nozzle. The
nominal injection time was set to 400 !s. The spray
cone angle can be determined by measuring the abso-
lute fuel distribution (two-dimensional, 2D, line-of-
sight projection) in the radial direction of the spray, as
shown in Figure 2. The full-width-at-half-maximum
(FWHM) of the fuel mass distribution at various posi-
tions (e.g., 0.2, 3.2, and 5.2 mm from the orifice exit,
marked as dashed lines) was measured at specific time
instances, 120, 330, and 480 !s from the start of injec-
tion (SOI). The microscopic half cone angles are shown
in each of the lower panels: 2.39° at 120 !s, 0.24° at
330 !s, and 1.24° at 480 !s after SOI, as also shown in
Figure 2. It is obvious that the cone angle is signifi-
cantly affected by the length of time after SOI and,
more fundamentally, by the transient state of the needle.
For the nonhydroground nozzle, we also observed
similar time-dependent microscopic spray cone angle
changes (Figure 3) although the cone angle did not
reach the sub-1° low angles as seen in the hydroground
case. This temporal variation indicates that the spray
breakup during most of the injection process is mainly
controlled by the pintle motion inside the nozzle.
Figure 3. Time-dependent microscopic spray cone an-
gle for the nonhydroground nozzle using the same in-
jection and measurement conditions as in Figure 2.
When a longer injection time (1 ms) was applied,
the spray behavior became distinctively different for the
sprays generated by the two nozzles. Figure 4 shows
snapshots of the sprays injected also at 1000 bar to he-
lium gas. During the pintle opening process, larger
spray cone angles are present (Figures 4a and 4f), simi-
lar to those seen in the 400-!s-injection-time case (Fig-
ure 2a) for both nozzles. After the nozzle is fully
opened at 500 !s after SOI, the spray patterns are dras-
tically different. For sprays from the hydroground noz-
zle, the spray cone angle approaches 0° showing as a
steady jet with minimum breakup (Figures 4b – 4d).
During the same time, the spray from the nonhydro-
ground nozzle is also steady, but the liquid breakup is
apparent as indicated by the finite spray angles (Figures
4g – 4i). In both cases, the cone angle stays as a con-
stant until the pintle starts to close. The cone angles
increase near the end of the injection (Figures 4e and 4j,
more obvious in Figure 4e) to a value similar to that in
the short-injection case, a signature of the pintle-
motion-induced breakup.
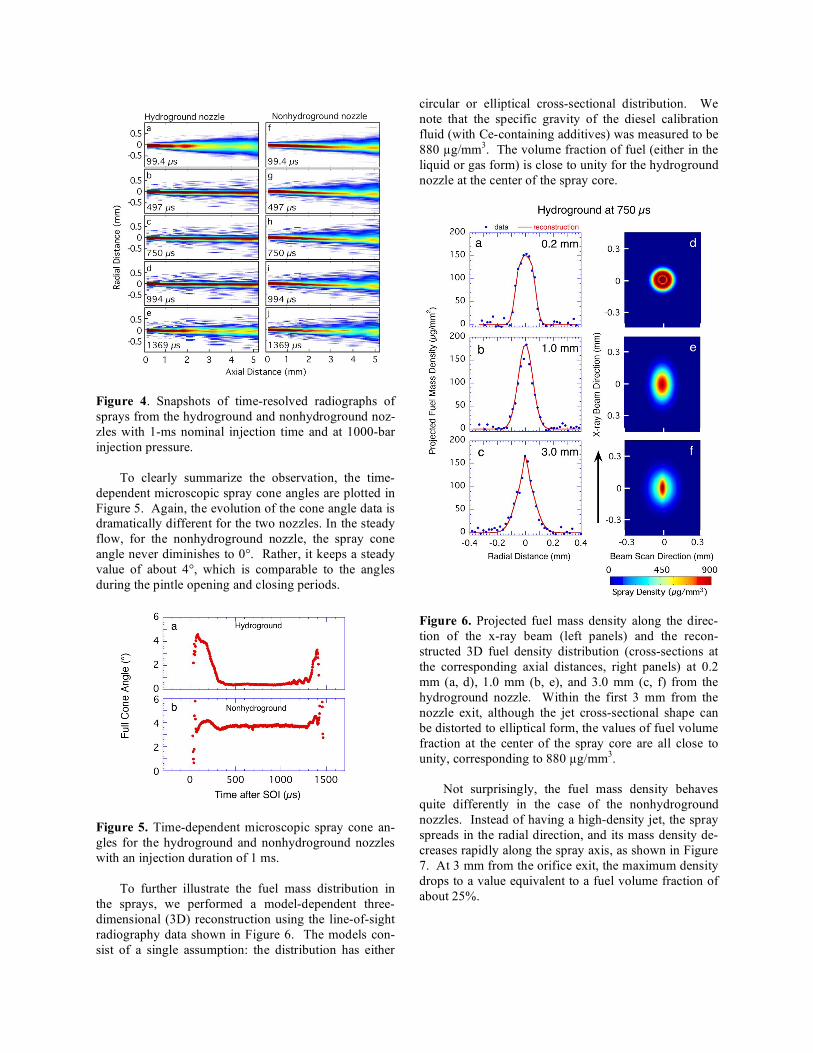
Figure 4. Snapshots of time-resolved radiographs of
sprays from the hydroground and nonhydroground noz-
zles with 1-ms nominal injection time and at 1000-bar
injection pressure.
To clearly summarize the observation, the time-
dependent microscopic spray cone angles are plotted in
Figure 5. Again, the evolution of the cone angle data is
dramatically different for the two nozzles. In the steady
flow, for the nonhydroground nozzle, the spray cone
angle never diminishes to 0°. Rather, it keeps a steady
value of about 4°, which is comparable to the angles
during the pintle opening and closing periods.
Figure 5. Time-dependent microscopic spray cone an-
gles for the hydroground and nonhydroground nozzles
with an injection duration of 1 ms.
To further illustrate the fuel mass distribution in
the sprays, we performed a model-dependent three-
dimensional (3D) reconstruction using the line-of-sight
radiography data shown in Figure 6. The models con-
sist of a single assumption: the distribution has either
circular or elliptical cross-sectional distribution. We
note that the specific gravity of the diesel calibration
fluid (with Ce-containing additives) was measured to be
880 !g/mm3. The volume fraction of fuel (either in the
liquid or gas form) is close to unity for the hydroground
nozzle at the center of the spray core.
Figure 6. Projected fuel mass density along the direc-
tion of the x-ray beam (left panels) and the recon-
structed 3D fuel density distribution (cross-sections at
the corresponding axial distances, right panels) at 0.2
mm (a, d), 1.0 mm (b, e), and 3.0 mm (c, f) from the
hydroground nozzle. Within the first 3 mm from the
nozzle exit, although the jet cross-sectional shape can
be distorted to elliptical form, the values of fuel volume
fraction at the center of the spray core are all close to
unity, corresponding to 880 !g/mm3.
Not surprisingly, the fuel mass density behaves
quite differently in the case of the nonhydroground
nozzles. Instead of having a high-density jet, the spray
spreads in the radial direction, and its mass density de-
creases rapidly along the spray axis, as shown in Figure
7. At 3 mm from the orifice exit, the maximum density
drops to a value equivalent to a fuel volume fraction of
about 25%.

Figure 7. Projected fuel mass density along the direc-
tion of the x-ray beam (left panels) and the recon-
structed 3D fuel density distribution (right panels) at
0.2 mm (a, d), 1.0 mm (b, e), and 3.0 mm (c, f) from the
nonhydroground nozzle. The values of fuel volume
fraction at the center of the spray core decreases dra-
matically along the spray axis.
Discussion
Although the above quantitative 3D-reconstruction
provides the spray mass distribution, the data so far
have not resolved an ambiguity in explaining the spray
cone angle difference for the two nozzles. The small
cone angles in the case of the hydroground nozzle can
be attributed to the material reduction at the ambient
gas/liquid interface even in the light-density surround-
ing gas–helium. Liquid could be peeled off from the jet
as a result of primary breakup, resulting in a thinner
liquid jet along the jet axis. This argument can be
tested with further analysis of the quantitative x-ray
radiographic images obtained in this measurement. At
the quasi-steady condition, e.g., at the 750-!s time in-
stance during the 1-ms injection process, the fuel mass
integrated in the planes perpendicular to the spray axis
will yield the linear fuel density in the spray. If the
injection is steady, the spray velocity should be rela-
tively constant within the first several millimeters from
the orifice exit to maintain the conservation of the fuel
mass flux if all the spray mass is accounted for by the
x-ray measurement. If the jet is evaporative or the liq-
uid breakup is strong, this mass-flux conservation can
be verified by this experiment due to the fact that x-rays
are not very sensitive to small liquid droplets and fuel
vapor. Figure 8 shows the so-integrated linear mass
density distribution along the spray axis for both noz-
zles at 750 !s after SOI. Indeed, for both cases, the
density distribution is close to constant, indicating that
the mass flux is conserved. Therefore, all the fuel mass
has been accounted for in the measurement and the
measurement reveals the fuel mass distribution truth-
fully.
Figure 8. Integrated (linear) mass density distribution
along the spray axis at 750 !s after SOI when the injec-
tions are in a quasi-steady state. In both hydroground
and nonhydroground cases, the conservation of the
mass flux is observed if the jet velocity is considered to
be constant over the small spatial range (< 5 mm from
the orifice exits).
We can now be confident that this measurement of
spray mass distribution and spray cone angles is reliable
and can be used to understand the correlation between
the nozzle geometry and the spray behaviors. It is well
known that cavitation in injection nozzles has a strong
impact on liquid jet breakup and spray formation.
However, it is difficult, at least for now, to directly
visualize the cavitation inside actual high-pressure in-
jection nozzles such as the ones used in this experiment.
Efforts are being made to use numerical simulation to
improve the understanding of the cavitation-assisted
liquid breakup phenomena at a lower injection pressure
condition [15]. We also propose to carry out further
numerical simulation of complex internal flows with
realistic boundary conditions to assess the degree of
cavition, how it affects the internal flow, and its interac-
tion with the external liquid jets.
Conclusion
We used time-resolved x-radiography to measure
the fuel mass distributions in the near-nozzle region of
sprays from two single-hole mini-sac nozzles with and
without a hydroground orifice inlet. During a relatively
long injection event (1 ms), we demonstrated drastically
different cone angles for the sprays from the two noz-
zles in the near-nozzle region (< 5 mm from the orifice
exit). This result strongly indicates that the liquid fuel
breakup is extremely sensitive to the nozzle internal
geometry, especially, at a quasi-steady condition when
the injector pintle is fully opened. We attributed the
different spray cone angles to internal-cavitation-
induced jet breakup.
Acknowledgement
We acknowledge collaborative work with K. Fez-
zaa and W.-K. Lee at the APS on direct imaging of the
injection nozzles. We thank J. Schaller for providing
the nozzles. We are also grateful to the sponsorship of
U.S. Department of Energy (DoE) FreedomCAR and
Vehicle Technology Program. This work and the use of
the APS are supported by the DoE, Office of Science,
Office of Basic Energy Sciences, under contract No. W-
31-ENG-38.
References
1. Rayleigh, L., Proc. London Math. Soc. 10:4-13
(1878).
2. Chen, H.H., and Brenner, M.P., Phys. Rev. Lett.
92:166106(166104) (2004).
3. McCarthy, M.J., and Molloy, N.A., Chem. Eng. J.
7:1-20 (1974).
4. McGuinness, P., Drenckhan, W., and Weaire, D., J.
Phys. D: Appl. Phys. 38:3382-3386 (2005).
5. Kaminoto, T., Spray Formation and Combustion.
In Advanced Combustion Science, Someya, T., Ed.
Springer-Verlag: Tokyo, 1993.
6. Reitz, R.D. Atomization and Other Breakup Re-
gimes of a Liquid Jet. Princeton University, Prince-
ton, NJ, 1978.
7. Rietz, R.D., Atomisation Sprays Techology 3:309-
337 (1987).
8. Cai, W., Powell, C.F., Yue, Y., Narayanan, S.,
Wang, J., Tate, M.W., Renzi, M.J., Ercan, A., Fon-
tes, E., and Gruner, S.M., Appl. Phys. Lett.
83:1671-1673 (2003).
9. MacPhee, A., Tate, M.W., Powell, C.F., Yue, Y.,
Renzi, M.J., Ercan, A., Narayanan, S., Fontes, E.,
Walter, J., Schaller, J., Gruner, S.M., and Wang, J.,
Science 295:1261-1263 (2002).
10. Powell, C.F., Yue, Y., Poola, R., and Wang, J., J.
Synchrotron Rad. 7:356-360 (2000).
11. Blessing, M., König, G., Krüger, C., Michels, U.,
and Schwarz, V., SAE Technical Paper 2003-01-
1358.
12. Powell, C.F., Ciatti, S.A., Cheong, S.-K., Liu, J.,
and Wang, J., SAE Technical Paper 2004-2001-
2011.
13. Clark, C.J., and Dombrowski, N., Pro. R. Soc.
Lond. A. 329:467-478 (1972).
14. Xu, L., Zhang, W.W., and Nagel, S.R., Phys. Rev.
Lett. 94:184505(184504) (2005).
15. Yuan, W., and Schnerr, G.H., J. Fluids Eng.
125:963-969 (2003).