Embed Size (px)
Citation preview

EFFECTS OF MECHANICAL STRESSES ON LITHIUM ION BATTERIES
by
Hyoncheol Kim
A dissertation submitted in partial fulfillment of the requirements for the degree of
Doctor of Philosophy (Mechanical Engineering)
in The University of Michigan 2009
Doctoral Committee: Professor Ann Marie Sastry, Chair Professor James R. Barber Associate Professor Christian M. Lastoskie Associate Professor Wei Lu

©
€
Hyoncheol KimAll Rights Reserved
2009

ii
To My Parents

iii
ACKNOWLEDGEMENTS
First of all, I would like to thank Prof. Ann Marie Sastry for her guidance and support. I
was lucky to have her as my advisor because I have learned not only how to solve
problems in science and technology from her great expertise, but also and more
importantly how we can contribute to the world with what we can do for the better future.
Her enthusiasm toward life and work is the most valuable thing I have learned at school
and will always guide me throughout my life and career.
Many thanks go to my committee members, Prof. James R. Barber, Prof.
Christian M. Lastoskie, and Prof. Wei Lu for serving on my committee and providing
your valuable advices on my thesis.
I am very grateful to all of our current and former group members, Dr. Myounggu
Park, Mr. Xiangchun Zhang, Mr. Myoungdo Chung, Mr. Min Zhu, Mr. Sangwoo Han,
Mr. Dong Hoon Song, Ms. Qiuye Jin, Dr. Chia-Wei Wang, Dr. Munish V. Inamdar, Dr.
Fabio Albano, Dr. Yenhung Chen, Dr. Kimberly Cook, Dr. Yun-Bo Yi, Dr. Taeyong
Kim, Ms. Tahira Reid, and Mr. Peter Verhees for their support and sharing the wonderful
moments for the past years.
I also would like to thank my friends, Jiwon, Chi-Shan, Jung Kap and Jong-Hoon
for their help and encouragement. Most importantly, I would like to thank my parents Ip
Kwon Kim and Bup Jin Song, and my sister Hyun Hee for their love and support. I also
would like to thank my parents in-law, Jeong Hong Chung and Myung Sook Lee, and

iv
finally, I would like to thank my lovely wife, Ja Won for her being with me.
Also, support for my thesis work by the U.S. Army Research Office, Dr. Bruce
LaMattina, Program Monitor, is gratefully acknowledged.

v
TABLE OF CONTENTS
DEDICATION . . . . . . . . . . . . . . . . . . . . . . . . . . . . . . . . . . . . . . . . . . . . . . . . . . . . . . . . . ii
ACKNOWLEDGEMENTS . . . . . . . . . . . . . . . . . . . . . . . . . . . . . . . . . . . . . . . . . . . . . . iii
LIST OF TABLES. . . . . . . . . . . . . . . . . . . . . . . . . . . . . . . . . . . . . . . . . . . . . . . . . . . . . vii
LIST OF FIGURES . . . . . . . . . . . . . . . . . . . . . . . . . . . . . . . . . . . . . . . . . . . . . . . . . . . viii
ABSTRACT . . . . . . . . . . . . . . . . . . . . . . . . . . . . . . . . . . . . . . . . . . . . . . . . . . . . . . . . . x
CHAPTER
I. INTRODUCTION . . . . . . . . . . . . . . . . . . . . . . . . . . . . . . . . . . . . . . . . . . . . . . . . . . . . 1
BIBLIOGRAPHY. . . . . . . . . . . . . . . . . . . . . . . . . . . . . . . . . . . . . . . . . . . . . . . . . 5
II. MULTIFUNCTIONAL COMPOSITE MATERIALS: CONSIDERATION OF
LOADS IN EMBEDDED AND INTEGRATED LI BATTERIES . . . . . . . . . . . . . . . 6
INTRODUCTION . . . . . . . . . . . . . . . . . . . . . . . . . . . . . . . . . . . . . . . . . . . . . . . . 6
METHODS . . . . . . . . . . . . . . . . . . . . . . . . . . . . . . . . . . . . . . . . . . . . . . . . . . . . . 10
STRUCTURAL SIMULATIONS . . . . . . . . . . . . . . . . . . . . . . . . . . . . 10
MICRO-STRUCTURAL SIMULATIONS . . . . . . . . . . . . . . . . . . . . . 15
RESULTS . . . . . . . . . . . . . . . . . . . . . . . . . . . . . . . . . . . . . . . . . . . . . . . . . . . . . . 20
DISCUSSION . . . . . . . . . . . . . . . . . . . . . . . . . . . . . . . . . . . . . . . . . . . . . . . . . . . 27
CONCLUSIONS AND FUTURE WORK . . . . . . . . . . . . . . . . . . . . . . . . . . . . 28
BIBLIOGRAPHY . . . . . . . . . . . . . . . . . . . . . . . . . . . . . . . . . . . . . . . . . . . . . . . 29

vi
III. COUPLING EFFECTS OF MECHANICAL STRESSES AND ELECTROCHEMICAL CYCLES IN A CARBON FIBER LITHIUM ION BATTERY: EXPERIMENTAL STUDY . . . . . . . . . . . . . . . . . . . . . . . . . . . . . . . . . . . 31
INTRODUCTION.............................................................................................. 31
METHODS……….............................................................................................. 33
MATERIALS AND BATTERY CONFIGURATION........................ 33
EXPERIMENT SETUP AND MECHANICAL TESTS …................ 35
ELECTROCHEMICAL TECHNIQUES ............................................ 35
RESULTS AND DISCUSSION…..................................................................... 42
CONCLUSIONS AND FUTURE WORK …................................................... 55
BIBLIOGRAPHY................................................................................................57
IV. MOLECULAR DYNAMICS SIMULATION OF LITHIUM ION DIFFUSION IN GRAPHITE UNDER MECHANICAL STRESSES...............................................59
INTRODUCTION...............................................................................................59
METHODS………...............................................................................................61
POTENTIAL FUNCTIONS ..................................................................61
SIMULATION AND MEASUREMENT ............................................. 65
RESULTS AND DISCUSSION…..................................................................... 67
CONCLUSIONS AND FUTURE WORK …................................................... 70
BIBLIOGRAPHY................................................................................................74
V. CONCLUSION AND FUTURE WORK………..................................................... 76

vii
LIST OF TABLES
Table 2.1: Battery powered unmanned aero vehicle: component mass and power requirement . . . . . . . . . . . . . . . . . . . . . . . . . . . . . . . . . . . . . . . . . . . . . . . . . . . . .7
Table 2.2: Thickness and material properties of layers in WASP wing . . . . . . . . . . . . . 14
Table 2.3: Thickness and material properties of layers in PowerFiber . . . . . . . . . . . . . . 17
Table 2.4: Material properties and simulation configurations used for micro-scale simulation . . . . . . . . . . . . . . . . . . . . . . . . . . . . . . . . . . . . . . . . . . . . . . . . . . . . .19
Table 2.5: Maximum von Mises stresses from various sources . . . . . . . . . . . . . . . . . . . 21
Table 4.1: Parameters for Brenner Potential . . . . . . . . . . . . . . . . . . . . . . . . . . . . . . . . . . 64
Table 4.2: Parameters for Lennard-Jones Potential…………………………….………..66

viii
LIST OF FIGURES
Figure 1.1: Advances in primary battery specific energy, adapted and modified from the reference..……………….…..............................................................................2
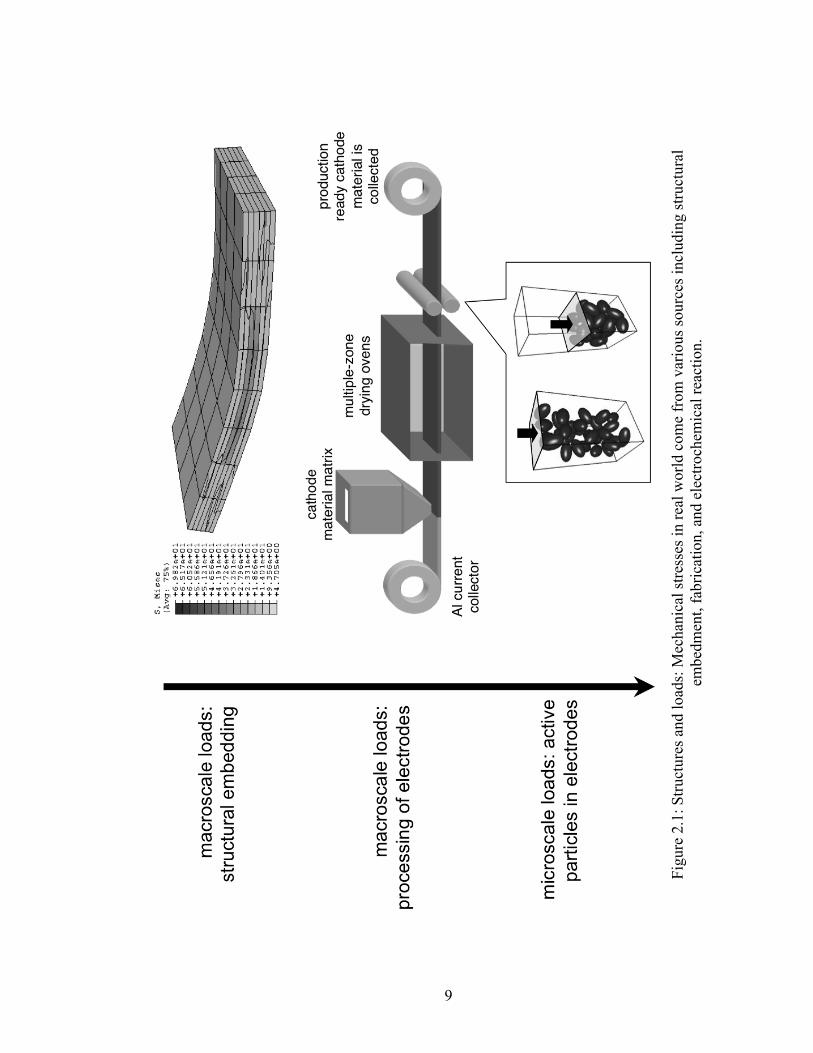
Figure 2.1: Structures and loads: Mechanical stresses in real world come from various sources including structural embedment, fabrication, and electrochemical reaction.……………….….................................................................................9
Figure 2.2: WASP (callout) plane strain beam model showing layered structure……….12
Figure 2.3: Layered structure of PowerFiber…………………………………………….16
Figure 2.4: (top) Compression model of particulate electrode (bottom) maximum von
Mises stress vs. volume fraction of active material………………………….18
Figure 2.5: Maximum von Mises stress distribution due to structural loadings in WASP
wing section………………………………………………………………….22
Figure 2.6: Maximum von Mises stress distribution due to structural loadings in
PowerFiber under bending…………………………………………………...23
Figure 2.7: Maximum von Mises stress distribution due to structural loadings in PowerFiber under torsion..…………………………………………………...24
Figure 2.8: Maximum von Mises stress distribution due to thermal expansion in
WASP………………………………………………………………………..25
Figure 2.9: Maximum von Mises stress distribution due to thermal expansion in
PowerFiber…………………………………………………………………...26
Figure 3.1: Schematic of battery configuration and fabricated battery………………….34
Figure 3.2: battery loaded in a material tester and connected to a potentiostat……...…..36
Figure 3.3: (a) load-elongation curve of battery under uni-axial tension ……………… 37
Figure 3.3: (b): carbon fibers are gradually aligned as the tow is stretched, but uniform
strain cannot applied to individual fibers ………………………………….. 38
Figure 3.4: change in potential is measured while battery is discharged with a constantly imposed current in galvanostatic cycling. ………………………………….. 40
Figure 3.5: in cyclic voltammetry, (a) potential is controlled as a triangular function with various potential scan rates and (b) resulting current in a reversible system
shows peaks in both scan directions. ………………………………………. 41

ix
Figure 3.6: galvanostatic discharge/charge curve, (top inset) showing gentle curve due to electrolyte decomposition, (bottom inset) voltage plateau due to staging
effects…………………………………………………………………….…..44
Figure 3.7: cyclic voltammogram with potential scan rates between 0.1 and 1.6 mV/s in a
control sample……………………………..…………………………………45
Figure 3.8: distinct current peaks appear when graphite is cycled with very low potential
scan rate (1mV/s) .………………………..………………………………… 47
Figure 3.9: cyclic voltammogram with various strains…………………………..………48
Figure 3.10: peak current vs. square root of potential scan rate. Regression lines are added to see changes in the relationship with respect to the applied loadings ……………………………………………………………………………… 50
Figure 3.11: slopes from Figure 3.7 are plotted against strain. Slopes vary, but not in a significant pattern………………………………………………………...…..51
Figure 3.12: measured load changes as lithium ions intercalate into graphite as shown with the charge and current curves……………………………………..……53
Figure 3.13: change in measured loads is directly proportional to the amount of lithium ions inserted into graphite……………………………………………………54
Figure 4.1: inter atomic angle configuration among atoms i, j, and k . . . . . . . . . . . . . . . 63 alkjfaljfa
Figure 4.2: visualization of lithium intercalated graphite at stage 1…………….……….68
Figure 4.3: diffusion coefficient of lithium ions in graphite (left) no strain was applied to graphite (right) graphite was stretched by 1% in the perpendicular direction of graphene lattice…………………………………………………………...….69
Figure 4.4: graphite lattice spacing during stage 1 . . . . . . . . . . . . . . . . . . . . . . . . . . . . . 72 al;dja;lja
Figure 4.5: stress-strain curve of graphite stretched in perpendicular direction to the graphene lattice. . . . . . . . . . . . . . . . . . . . . . . . . . . . . . . . . . . . . . . . . . . . . . . 73 al;dj;ad

x
ABSTRACT
Structural batteries are multifunctional materials that are expected to perform
multiple roles, i.e. power generation and mechanical support. Properly realized, the
concept can dramatically improve gravimetric properties by elimination of parasitic
masses tolerated in conventional devices. However, the significant structural loads that
such batteries would be expected to bear, given their multiple roles, would exceed those
experienced by conventional batteries, and thus must be studied and understood in the
context of device safety, lifetime and cost.
Key sources of mechanical stresses were identified and quantified in this effort,
including manufacturing-induced loads, thermal loads, kinetic loads and structural loads.
It was found that stresses due to compression during electrode fabrication can be as large
as 2000 MPa, thus having the potential to induce mechanical failure of constituent
materials, while stresses induced by structural loads in an unmanned vehicle example
studied, were less than 1 MPa. Thermal stresses were found in one embodiment, to
exceed 100 MPa, largely due to mechanical confinement of batteries embedded for
structural support.
Supporting experiments were conceived in this work to study the effect of loads
on electrochemical performance. A novel design of a structural battery was developed, to
simultaneously conduct mechanical and electrochemical experiments. Diffusion
coefficients were determined while various loadings were applied. Also, stresses exerted
on the battery were observed while the battery was charged and discharged. Statistically

xi
meaningful correlation was not observed for diffusion coefficients with respect to
stresses, but forces applied to carbon fiber significantly varied during
charging/discharging of batteries, and the magnitude of variance of force was strongly
correlated with the number of charges.
Molecular dynamics simulations, finally, were performed to examine findings
from experiments. Diffusion coefficients of lithium ions were measured while graphite
lattices were stressed. Simulation results differed substantially from experimental
findings, in that substantial alterations in diffusivities were predicted with application of
load. Future work should focus on rationalizing the differences in these elements, by
development of improved experiments, and improved accounting for disorder, in
simulations.

1
CHAPTER I
INTRODUCTION
Since Alessandro Volta developed the first electric cell in 1800, batteries have
multiplied their capacity through innovations in material selection and processing (Figure
1.1) [1]. The maximum capacity of a battery, however, is limited by the materials’
theoretical capacity in any circumstances. Looking at this limitation out of the box, a new
concept has emerged, known as a structural battery. Structural battery is a multifunctional
material that can store electric energy and also function as a structural member. This type
of battery is expected to have outstanding gravimetric properties such as specific energy
and specific power by removing parasitic masses of canisters that were unavoidable in
conventional batteries. Structural batteries can be used in applications where gravimetric
properties are critical such as micro air vehicles, satellites, and portable military devices.
Despite of the promising features of a structural battery, it is of our great concern
whether the stresses externally exerted on a battery will affect the performance of the
battery and vice versa. Although all types of batteries are subject to mechanical stresses
throughout their lifetime from fabrication processes, chemical reactions, and thermal
expansions, the detrimental stress effects in this type of battery may be more significant
than those in conventional batteries due to the load-bearing role of the structural battery.
It is known with conventional batteries that the mechanical stresses may cause material

Figure 1.1: Advances in primary battery specific energy, adapted and modified from the reference [1]
2
actual specific energy
theoretical specific energy of a practical battery

3
failures, consequently shortening battery lifetime and also affect the performance while
batteries are in use [2-4]. Since most previous works on the correlation between
mechanical stresses and electrochemistry have used porous electrode materials, common
in conventional batteries, they have observed the effects of particle packing during
fabrication [2-4] or the stress generation due to charge-carrying ion transport [5-7], but
certainly not the effects of externally applied stresses on a electrode material during
operation as in a structural battery. Thus, in this work, the correlation between battery
functions and mechanical stresses was investigated in experimental and computational
ways, and the technical details were introduced in the following chapters.
Firstly, various sources of mechanical stresses present in batteries were reviewed
in Chapter II. Stresses induced by structural loadings and thermal expansions were
evaluated using finite element analysis on selected applications from a purely structural
point of view without considerations on electrochemistry. These stresses, were then
compared with those generated during fabrication and chemical reactions. Computational
methods to assess fabrication and intercalation induced stresses were also briefly
introduced. Significance of each type of stress on battery function was discussed.
In Chapter III, experiments on structural batteries are presented. A novel design of
a structural battery was made to simultaneously conduct mechanical and electrochemical
tests. Diffusion coefficients of lithium ions in carbon fiber electrodes as a measure of a
battery power performance were determined while various levels of strains were applied.
Also, stresses exerted on the battery were observed while the battery was
electrochemically charged and discharged. The correlation between mechanical stress and
battery function was discussed.

4
Molecular dynamics simulation was conducted to investigate the underlying
mechanisms in findings of Chapter III. As in the experiments, graphite was deformed by
prescribed strains and the change in diffusion coefficients as well as the reaction forces
were calculated. Details of simulation are presented in Chapter IV.
In Chapter V, the major findings in the current work were summarized and future
directions were suggested.

5
BIBLIOGRAPHY
1. Linden, D., 2001, “Ch. 1: Basic Concepts,” in Handbook of batteries 3rd ed., D. Linden and T.B. Reddy ed., p.1.17, The McGraw-Hill Companies, Inc., New York.
2. Striebel, K.A., Sierra, A., Shim, J., Wang, C.-W., and Sastry, A.M., 2004, “The effect of compression on natural graphite anode performance and matrix conductivity,” Journal of Power Sources, v.134, pp.241-251.
3. Wang, C.-W., Yi, Y.-B., Sastry, A.M., Shim, J. and Striebel, K.A., 2004, “Particle Compression and Conductivity in Li-ion Anodes with Graphite Additives,” Journal of the Electrochemical Society, v. 151 (9), pp. 1489-1498.
4. Yi, Y.-B., Wang, C.-W. and Sastry, A.M., 2006, “Compression of Packed Particulate Systems: Simulations and Experiments in Graphitic Li-ion Anodes,” ASME Journal of Engineering Materials and Technology, v. 128(1), pp. 73-80.
5. Choi, Y.-M., and Pyun, S.-I., 1997, “Effects of intercalation-induced stress on lithium transport through porous LiCoO2 electrod,” Solid State Ionics, v.99, pp.173-183.
6. Christensen, J., and Newman, J., 2006, “A Mathematical Model of Stress Generation and Fracture in Lithium Manganese Oxide,” Journal of the Electrochemical Society, v. 153 (6), pp. A1019-A1030.
7. Zhang, X.-C., Shyy, W., and Sastry, A.M., 2007, “Numerical Simulation of Intercalation-Induced Stress in Li-Ion Battery Electrode Particles,” Journal of the Electrochemical Society, v. 154 (10), pp. A910-A916.

6
CHAPTER II
MULTIFUNCTIONAL COMPOSITE MATERIALS: CONSIDERATION OF LOADS IN EMBEDDED AND INTEGRATED LI BATTERIES1
INTRODUCTION
Realization of the most novel power sources must necessarily invoke modeling
capability, especially if these materials are expected to perform multiple roles, i.e. power
generation and mechanical support. While the most promising electrochemical power
supplies have only been realized with the ability to reproducibly fabricate high-surface
area electrodes, which are necessarily composites, a structural battery can dramatically
improve gravimetric/volumetric properties by removing parasitic masses that were
unavoidable in conventional devices. Applications include satellites, unmanned aero-
vehicles, and other military equipment where gravimetric properties are critical.
Examples of pioneer work are WASP and PowerFiber where lithium ion batteries were
integrated to wings and fabric, respectively [1]. Table 2.1 shows several types of battery-
powered unmanned aero-vehicles in operation or under development along with their
power requirement, mass distribution, and their missions. One can notice that
battery/total mass ratio was significantly improved by utilizing battery as structural
members in WASP.
1 Material in this chapter is an unpublished paper in progress: H. C. Kim and A. M. Sastry, Multifunctional Composite Materials: Consideration of Loads in Embedded and Integrated Li Batteries, Journal of Composite Materials (2009).

Tabl
e 2.
1: B
atte
ry p
ower
ed u
nman
ned
aero
veh
icle
: com
pone
nt m
ass
and
pow
er re
quire
men
t.
7

8
Exploitation of structural batteries requires advanced analysis and simulation of
mechanics and electrochemistry due to their interdisciplinary nature. For example, when
structural batteries are in operations, they may be subject to various external loadings,
which may affect electrochemical functions of batteries depending on applications. Here,
we focus on evaluating various types of mechanical stress sources that may exist in
batteries since mechanical failures of active materials in Li batteries are blamed for their
lifetime limitation. Four different sources of mechanical stresses exerted on a battery
were examined in this study: structural, thermal, fabrication and kinetics (Figure 2.1).
Manufacturing loads are applied while battery electrodes are compressed to achieve
desired volume fraction to improve their volumetric properties as well as conductivities.
Heat generated by exothermic reactions and electrical resistance in batteries produces
repetitive thermal expansion and contraction of the materials. Kinetic loads are due to
chemical reactions in the battery. Lithium ion insertion into and extractions out of lattices
of the active materials during charging or discharging causes the lattices to experience
repetitive volume changes.
There have been theoretical and experimental efforts to identify failure
mechanisms due to these mechanical loadings in battery active materials. A series of
studies showed that compression of carbonaceous electrode materials during
manufacturing not only improves their performances, but also can damage the materials,
resulting conductivity decrease [6-8]. Mathematical models suggested that stresses
induced during lithium ion insertion and extraction can be larger than the strength of the
active materials [9, 10]. A numerical study revealed how particle size and aspect ratio
affect stresses induced by intercalation in a LiMn2O4 particle [11]. Strains in battery
Figu
re 2
.1: S
truct
ures
and
load
s: M
echa
nica
l stre
sses
in re
al w
orld
com
e fr
om v
ario
us so
urce
s inc
ludi
ng st
ruct
ural
em
bedm
ent,
fabr
icat
ion,
and
ele
ctro
chem
ical
reac
tion.
9

10
electrodes at macro-scale [12] and micro-fractures in active material particles have been
empirically found [13-15].
Despite the numerous efforts to understand the mechanical stresses in batteries,
there has been little attention paid to various sources of loadings applied to batteries,
other than intercalation-induced stresses. This is probably because batteries in
conventional applications are not intended to bear any structural load and assumed to be
kept in a stress free environment. However, even batteries in conventional applications
are subject to compressive loadings during fabrication. Evaluating possible sources of
loads and designing batteries is thus important.
Our overarching objectives are to determine how materials architecture,
electrochemistry, and charge/discharge processes influence load transfer within and
outside the cell. In this study, as a preliminary step, we first aimed to systematically
identify mechanical loads applied to batteries from various sources at different scales and
quantify their relative contributions without considering the coupling effects of
electrochemistry. The loadings at device scale were studied with selected structural
battery applications, and the induced stresses at microscale were computed with particle
models using finite element analysis.
METHODS
STRUCTURAL SIMULATIONS
Application scale finite element analysis was conducted to quantify loadings from
structural and thermal sources. For a practical purpose, a micro air vehicle WASP and
PowerFiber were chosen as examples to assess the level of external loadings in realistic

11
situations where structural batteries are employed. Loading and boundary conditions
deduced from the examples were applied to simplified structure assuming the worst-case
scenario.
Lifts on airfoil of WASP were obtained using two-dimensional CFD simulation
using COMSOL multiphysics. The turbulent flow was modeled by the Reynolds-
averaged Navier-Stokes equation as
(1)
where is the density, is the averaged velocity field, is the fluctuating part, and
and are pressure and body force, respectively. Two additional closure relations
relating the turbulence kinetic energy, , and the dissipation rate of turbulence energy, ,
are
and (2)
(3)
where and are respectively dynamic and turbulent viscosity, and and are
model constants determined experimentally. For this analysis, the general purpose Clark
Y type airfoil was used with the chord length 15 cm and the angle-of-attack 10 degree.
The size of the simulation domain was 1 m x 1 m. The velocity of the inlet airflow was
14 m/s, the outlet pressure was set to zero, and all the rest boundaries had no-slip
conditions. The pressure obtained in the CFD analysis was then introduced to the
structure analysis as loading conditions.

Figure 2.2: WASP (callout) plane strain beam model showing layered structure.
12
x y
z
battery packaging
wing shell
z
y
x
y

13
In the structural analysis, two-dimensional plane strain beam was constructed.
The cross section of the beam in Figure 2.2 shows layers of materials in the wingspan
direction. The cells enclosed in polymer packaging were placed between two Styrofoam
shells. Mechanical and thermal material properties used in this model are listed in Table
2.2. Mechanical loading and thermal loading were exclusively applied. When structural
loading was considered, one end of the beam close to the fuselage was structurally fixed
and the maximum pressures obtained from CFD analysis were applied to the top and the
bottom surface of the beam. When the thermal loading was in consideration, constant
temperature, 300K was prescribed at the fuselage side end, and convective heat transfer
to flowing air was prescribed with coefficient h = 20 W/m2K at all the rest boundaries.
Constant heat sources, 1000W/m3 were designated to the battery layers. The steady state
heat transfer problem was fist solved and the resulting temperature field was used for
further thermal-structure analysis as shown in the following equations.
and (4)
(5)
where and are stress and strain tensor, and are thermal expansion
coefficients tensor, temperature, and stiffness tensor, respectively.
Similarly, an FEM model of PowerFiber was constructed using COMSOL. As
shown in the reference [16], the PowerFiber can be embedded in polymer resin to be used
as PowerComposite. In this configuration, the fibers may experience bending and torsion
as a flat PowerComposite ribbon is twisted. To simulate this condition, a 100 µm long
fiber was subject to prescribed boundary conditions mimicking the ribbon under torsion

Tabl
e 2.
2: T
hick
ness
and
mat
eria
l pro
perti
es o
f lay
ers i
n W
ASP
win
g.
14

15
and bending by 90 degrees from its reference state. For thermal loading simulation, the
active materials in the fiber were designated as heat source, and the outer surface was
exposed to free convection of air with h = 10 W/m2K. The detailed composition of
materials and their properties are described in Figure 2.3 and Table 2.3, respectively.
MICRO-STRUCTURAL SIMULATIONS
Loads on particles in electrodes due to rolling process during fabrication can be
determined with compression simulation. For this simulation, 1000 spherical particles
were randomly distributed in a box with rigid walls as seen in Figure 2.4. Then the
particles were compressed to achieve a certain volume fraction, typically 60% in
commercial batteries (Figure 2.1 bottom). LiMn2O4 was used as a cathode material in this
study, the mean diameter was 8.96 µm, the elastic modulus was 10 GPa and the
simulation domain size was 224 µm x 224 µm x 672 µm (Table 2.4). Friction coefficient
between particles and between particles and walls were set to zero. More detailed
descriptions on computation can also be found in the reference [8].
Stresses due to kinetics of chemical reactions in batteries were determined using a
single particle simulation. Intercalation-induced stresses were formulated as an analogy
to thermal stresses in the elasticity as shown by
(6)
where is the Poisson’s ratio, is the concentration of the diffusion species, and is
the partial molar volume of the species. Then the generalized diffusion equation was
coupled to incorporate electrochemical processes as
(7)

Figure 2.3: Layered structure of PowerFiber.
16
20µm
cathode
electrolyte
anode
~
anode protectant
fiber substrate

Tabl
e 2.
3: T
hick
ness
and
mat
eria
l pro
perti
es o
f lay
ers i
n Po
wer
Fibe
r.
17
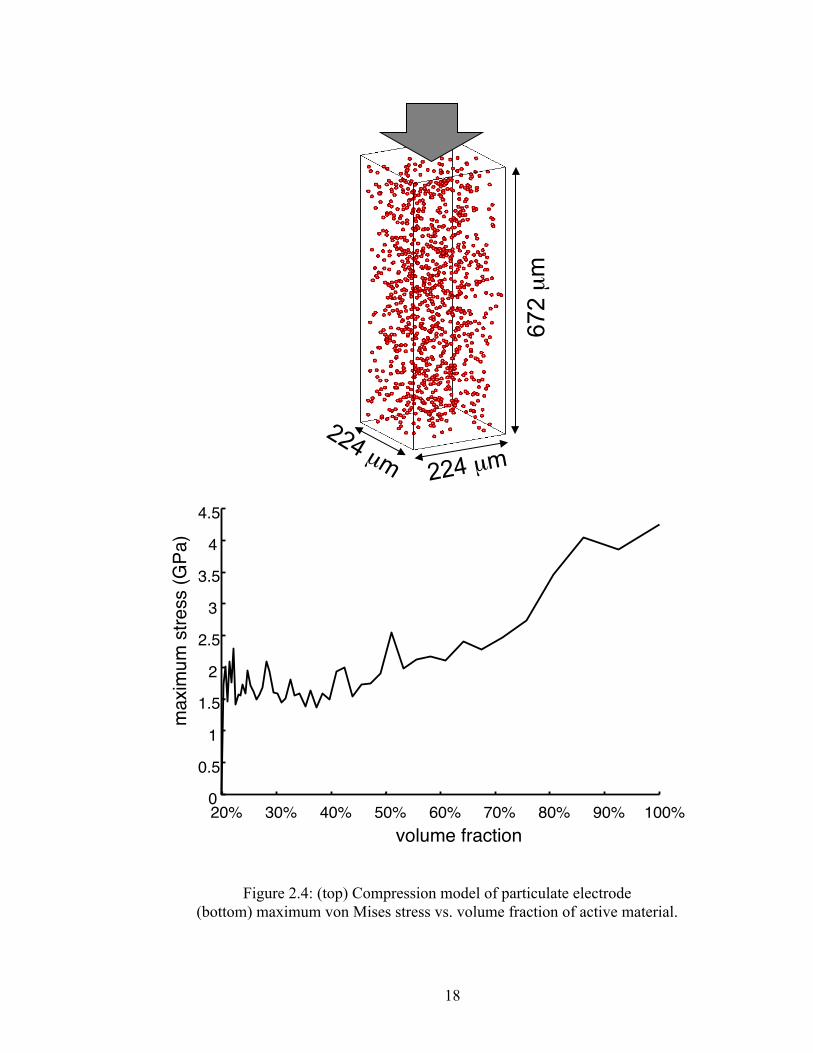
Figure 2.4: (top) Compression model of particulate electrode (bottom) maximum von Mises stress vs. volume fraction of active material.
18
224 µm
672 µ
m
0 0.5
1 1.5
2 2.5
3 3.5
4 4.5
20% 30% 40% 50% 60% 70% 80% 90% 100% volume fraction
max
imum
stre
ss (G
Pa)

Table 2.4: Material properties and simulation configurations used for micro-scale simulation.
19
material LiMn2O4
particle size (µm) 8.96
modulus (GPa) 10
cell size (µm3) 224×224×672
diffusion coefficient (m2/s) 7.08×10⁻¹⁵
stoichiometric maximum concentration
(mol/m3) 2.29×10⁴
partial molar volume (m3/mol) 3.497×10⁻⁶

20
where is time, is the diffusion coefficient, is the universal gas constant, and
is the hydrostatic stress. A LiMn2O4 particle was studied with respect to various
discharge current densities, particle sizes, and aspect ratios. The computation was
done with COMSOL Mutiphysics. Material properties used in this model are listed
in Table 2.4. More detailed descriptions can be found in the reference [11].
RESULTS
Finite element analysis simulations showed that structural battery applications
including WASP and PowerFiber exhibited maximum von Mises stresses in the range of
0.2 ~ 0.5 MPa in their battery portions while conducting their typical missions (Table
2.5). Though there were larger stress values in the structures than these values, stresses in
the battery portion were considered here since battery material was our prior concern.
Stresses induced by specific type of structural loadings are shown in Figure 2.5, 2.6 and
2.7 and the maximum stress values were in the same order among different cases.
Thermal stresses in the applications, on the other hand, were not only one or two
orders of magnitude larger than those by structural loadings, but also were different from
WASP to PowerFiber. WASP had about 9 MPa of maximum von Mises stresses induced
by thermal expansion throughout batteries imbedded in the layered wing structure and
PowerFiber had 100 MPa of maximum von Mises stress in the anode portion (Table 2.5,
Figure 2.8 and 2.9).
In microscopic simulations, single LiMn2O4 particle had von Mises stress as large
as 2000 MPa due to compression (Table 2.5, Figure 2.4). This value is several orders
larger than those from structural loading case. Lithium intercalation into the cathode

Table 2.5: Maximum von Mises stresses from various sources.
21
sources maximum von Mises stress (MPa)
external /
structural
WASP 0.2
PowerFiber (bending / torsion) 0.5 / 0.4
thermal
WASP 9
PowerFiber 100
manufacturing 2000
intercalation 45

Figure 2.5: Maximum von Mises stress distribution due to structural loadings in WASP wing section.
22
batte
ries
(MPa) 0.30
0.25
0.20
0.15
0.10
0.05

Figure 2.6: Maximum von Mises stress distribution due to structural loadings in PowerFiber under bending.
23
(Mpa)
3.0
2.5
2.0
1.5
1.0
0.5

Figure 2.7: Maximum von Mises stress distribution due to structural loadings in PowerFiber under torsion.
24
(Mpa) 2.0 1.8 1.6 1.4 1.2 1.0 0.8 0.6 0.4 0.2

Figure 2.8: Maximum von Mises stress distribution due to thermal expansion in WASP.
25
(MPa) 20 18 16 14 12 10
8 6 4 2
batte
ries

Figure 2.9: Maximum von Mises stress distribution due to thermal expansion in PowerFiber.
26
(Mpa) 100
90 80 70 60 50 40 30 20 10

27
particle induced about 45 MPa of von Mises stresses when the aspect ratio of the particles
remained between 1 and 2 (Table 2.5).
DISCUSSION
Stresses induced by structural loadings were relatively low compared to other
sources of stresses. This is likely because structural batteries are mostly light duty
applications and they adopt composite structures. For an example, pressures exerted on
WASP wings are naturally low (O(100Pa)) due to lightweight of the vehicle and low
speed (<15m/s) during mission. Also, layered composite structure helps batteries avoid
large stresses by diverting those to reinforcement.
However, thermal expansion in PowerFiber produced significant stresses. Since
ultimate strength in most oxide materials is about 100 MPa [10], the thermal stresses in
this case may cause material failure, resulting in failure as power storage. This relatively
high stress was also caused by layered structure. Differently from the structural loading
case, reinforcement materials with higher elastic modulus functioned as rigid
confinement. Thus, when designing structural batteries, not only beneficial features of
composites such as lightweight and high strength, but also their adverse effects as stress
sources when combined with thermal expansion should be carefully considered.
Micro-scale simulation showed that the maximum stresses during particle
compression up to volume fraction 60% reached 2 GPa, much higher than the material
strength. Since the simulation assumed that particles are perfectly sphere and all in the
same size, the actual electrode particles with various sizes and aspect ratios would have
lower stress than predicted. Nonetheless, the stresses during fabrication are considered as

28
a critical source which causes mechanical failure of particles [8]. However, compression
process during fabrication can be avoided if electrodes are made as thin films as in
PowerFiber using various deposition techniques.
CONCLUSIONS AND FUTURE WORK
Four different sources of mechanical stresses exerted on a battery implemented in
a structure were examined in this study: structural, thermal, fabrication and kinetics.
Finite element analysis showed that compression of conventional particulate electrode
material would produce stresses as high as 2 GPa and thermal expansion of batteries
embedded in a structure had stress of 100 MPa. Considering strength of typical oxide
materials, these values may cause mechanical failure in electrode particles. On the other
hand, stresses due to structural loadings and intercalation kinetics were relatively low,
ranging from 0.2 to 45 MPa. Reinforcement materials in composite structures function as
load bearing component when structural loading was applied, but as rigid constraint,
leading to critical stresses when thermal loading was considered. Also, in a structural
battery, the stresses exerted to the structure can be altered as large as 20 % of the initially
applied value during charge/discharge cycles of the battery. Thus, when designing
structural battery applications, one needs to consider the trade-offs in functions of
reinforcement in composites as well as the influence of electrochemistry to the structural
stability.

29
BIBLIOGRAPHY
8. Christodoulou, L. and Venables, J.D. (2003). Multifunctional Material Systems:
The First Generation, JOM, 55: 39-45.
9. Pornsin-Sirirak, T.N., Tai, Y.C., Ho, C.H. and Keenon, M. (2001). Microbat-A Palm-Sized Electrically Powered Ornithopter, NASA/JPL Workshop on Biomorphic Robotics, Pasadena, CA.
10. Kroo, I., Shantz, M., Kunz, P., Fay, G., Cheng, S., Fabian, T., and Partridge, C. (2000). The Mesicopter: A Miniature Rotorcraft Concept, Phase II Interim Report, http://adg.stanford.edu/mesicopter.
11. Foch, R.J. (2001), Dragon Eye, Airborne Sensor System for Small Units, Solicitation No. N00173-01-R-MS01, Attachment 6, NRL Code 5712, http://heron.nrl.navy.mil/contracts/closed/01ms01/presentation.pps.
12. Thomas, J.P., Qidwai, M.A., Matic, P., Everett, R.K., Gozdz, A.S., Keennon, M.T., and Grasmeyer, J.M. (2002). Multifunctional Structure-Plus-Power Concepts, 43rd AIAA/ASME/ASCE/AHS/ASC Structures, Structural Dynamics, and Materials Con., Denver, Colorado, AIAA 2002-1239.
13. Striebel, K.A., Sierra, A., Shim, J., Wang, C.-W. and Sastry, A.M. (2004). The Effect of Compression on Natural Graphite Anode Performance and Matrix Conductivity, Journal of Power Sources, 134(2): 241-251.
14. Wang, C.-W., Yi, Y.-B., Sastry, A.M., Shim, J. and Striebel, K.A. ( 2004). Particle Compression and Conductivity in Li-ion Anodes with Graphite Additives, Journal of the Electrochemical Society, 151(9): 1489-1498.
15. Yi, Y.-B., Wang, C.-W. and Sastry, A.M. (2006). Compression of Packed Particulate Systems: Simulations and Experiments in Graphitic Li-ion Anodes, ASME Journal of Engineering Materials and Technology, 128(1): 73-80.
16. Christensen, J. and Newman, J. (2006). Stress generation and fracture in lithium insertion materials, Journal of Solid State Electrochemistry, 10(5): 293-319.
17. Christensen, J. and Newman, J. (2006). A mathematical model of stress generation and fracture in lithium manganese oxide, Journal of Electrochemical Society, 153(6): A1019-A1030.
18. Zhang, X., Shyy, W., and Sastry, A.M. (2007). Numerical Simulation of Intercalation-Induced Stress in Li-Ion Battery Electrode Particles, Journal of The Electrochemical Society, 154(10): A910-A916.
19. Hahn, M., Buqa, H., Ruch, P.W., Goers, D., Spahr, M.E., Ufheil, J., Novak, P., and Kotz, R. (2008). A Dilatometric Study of Lithium Intercalation into Powder-

30
Type Graphite Electrodes, Electrochemical and Solid-State Letters, 11(9): A151-A154.
20. Wang, H., Jang, Y.-I, Huang, B., Sadoway, D.R., and Chiang, Y.-M. (1999). TEM Study of Electrochemical Cycling-Induced Damage and Disorder in LiCoO2 Cathodes for Rechargeable Lithium Batteries, Journal of The Electrochemical Society, 146(2): 473-480.
21. Lim, M.-R., Cho, W.-I., Kim, K.-B. (2001). Preparation and characterization of gold-codeposited LiMn2O4 electrodes, Journal of Power Sources, 92:168-176.
22. Wang, D., Wu, X., Wang, Z., and Chen, L. (2005). Cracking causing cyclic instability of LiFePO4 cathode material, Journal of Power Sources, 140:125-128.
23. Neudecker, B.J., Benson, M.H., and Emerson, B.K. (2003). Powerfibers: thin-film batteries on fiber substrates, In: Proceedings of the 14th international conference on composite materials (ICCM 14), Society of Manufacturing Engineers, San Diego, CA.

31
CHAPTER III
COUPLING EFFECTS OF MECHANICAL STRESSES AND ELECTROCHEMICAL CYCLES IN A CARBON FIBER LITHIUM ION
BATTERY: EXPERIMENTAL STUDY2
INTRODUCTION
Batteries are under various mechanical stresses during fabrication due to material
preparations and assembly with compression processes and while performing their duties
owing to chemical reactions, thermal expansions, and external loadings. These stresses
not only cause failure of batteries, limiting their lifetime, but also possibly affect their
performances even during their lifetime. Here, the performance can be described as
energy and power density and both densities are the key parameters to be improved for
applications requiring high energy and power such as electric vehicles. Thus,
understanding how mechanical stresses affect battery performances may help us reduce
factors detrimental to battery performance and further architect a material structure in a
desired way.
Work on the effect of mechanical stresses on battery functions has been mostly
done with graphite electrode under compressive loadings. Conductivity and formation
cycle of compressed natural graphite were examined and it was found that cyclability
tends to improve with compression mainly due to improvement of conductivity [1].
2 Material in this chapter is an unpublished paper in progress: H. C. Kim and A. M. Sastry, Coupling Effects of Mechanical Stresses and electrochemical cycles in a Carbon Fiber Lithium Ion battery: Experimental Study, Journal of the Electrochemical Society (2009).

32
Experiments coupled with computer simulations also showed that the improvement of
conductivity originated from the decreased contact resistance between active materials
and the current collector, and excessive pressure caused particle breakages [2]. This work
was extended to include friction, morphology, and deformability of particles, and
estimated friction coefficient and pressure at failure in real system [3]. Choi and Pyun
discussed contact resistance and lithium ion diffusivity in LiCoO2 as a function of lithium
intercalation induced stress and found that the ion diffusivity decreased as intercalation
induced stress increased [4].
Despite there have been a series of studies on this topic, it has not been possible to
identify the direct correlation between mechanical stresses and battery functions. This is
probably because all the previous work dealt with porous materials. In porous materials,
the applied stresses largely alternate the packing state of multi-particulate systems rather
than the actual active materials.
Thus, our goal in this work was to examine the direct correlation between
mechanical stresses and battery performances, especially as results of deformation of
active materials, not porosities. For this study, we aimed to achieve the following specific
objectives:
1. To devise and fabricate lithium batteries which enable us to directly apply
mechanical stresses to the active materials in the system.
2. To conduct coupled mechanical and electrochemical experiments to investigate
the relationship between mechanical stresses and battery performances.
3. To understand the underlying mechanisms in this correlation.

33
METHODS
A half-cell was constructed with carbon fibers as a working electrode and metal
lithium as a counter and reference electrode. The battery was encased in a plastic tube
with parts of carbon fiber exposed to the environment for mechanical testing while
keeping the materials inside of the battery safe from the moisture and oxygen.
MATERIALS AND BATTERY CONFIGURATION
Pitch based carbon fiber DIALEAD-K13D2U was received from Mitsubishi
Chemical Inc. A tow of fiber consists of 2000 filaments of the diameter, 11 µm. The yield
of a tow is 2702 m/kg and the ultimate elongation is 0.4 %. Tensile modulus and strength
are 935 GPa and 3700 MPa, respectively and thermal conductivity is over 800 W/mK.
The fibers were sized with epoxy resin by 2 % of the total mass, and then cut into 16 cm
long piece. Then two 1 cm wide bands separated by 4 cm between them around the center
of the tow were coated with polyethylene (PE) to prevent leaking of electrolyte due to
capillary effect. The center 4 cm between the coated bands was carefully kept intact from
PE to be used as active materials. The center part of the tow was wrapped with a
separator, Celgard 3401, a lithium foil (99.9%, 40 mm × 12 mm × 0.38 mm, Sigma-
Aldrich), and a copper wire as a current collector, sequentially. This assembly was
placed in a PE tube of ¼ inch inner diameter and 6 cm length. Gaps between the tube and
the carbon fiber at both ends were heat sealed with PE glue after introducing electrolyte,
1M LiPF6 in Ethylene Carbonate (EC, 99%, anhydrous, Sigma-Aldrich) + Diethyl
Carbonate (DEC, +99%, anhydrous, Sigma-Aldrich) (Figure 3.1). The entire

Figu
re 3
.1:s
chem
atic
of b
atte
ry c
onfig
urat
ion
and
fabr
icat
ed b
atte
ry.
34
PE
cas
ing
lithi
um
(cou
nter
ele
ctro
de)
carb
on fi
ber
(wor
king
ele
ctro
de)
sepa
rato
r P
E s
topp
er
elec
troly
te
copp
er w
ire
(cur
rent
col
lect
or)
4 cm

35
process was done in an argon-filled glove box. The moisture and oxygen level was
maintained below 1 ppm.
EXPERIMENT SETUP AND MECHANICAL TESTS
Both carbon fiber ends extruding out of the battery were fixed in wooden blocks
with epoxy for mechanical test grip (Figure 3.2). Then the battery was loaded in the
universal material tester, Instron 3366 and also connected to the potentiostat Biologic
VMP3. Since a carbon fiber tow contains 2000 filaments, all the filaments could not be
aligned so that they can be evenly strained by the equal amount. Instead, the fibers were
strained until the applied load reached a certain value, say 50 N, then the point where
most fibers were engaged with the tension was found from the load-elongation curve
(Figure 3.3). Then the engagement point was recorded, and the cross head of the material
tester was returned to the starting point. When we applied different values of strains, this
engagement point was used as a pre-strain so that the actual elongation was the sum of
the pre-strain and the strain we set as an experiment level. Electrochemical tests were
done while 0, 0.15, and 0.3 % of strain were applied to the battery.
ELECTROCHEMICAL TECHNIQUES
Two basic electrochemical techniques were used in this study: galvanostatic
cycling (GC) and cyclic voltammetry (CV). In GC, changes in potential of a battery are
measured while it is charged/discharged with a constantly imposed current (Figure 3.4).
Using this technique, the actual capacity of a battery can be obtained by the product of
the imposed current and the elapsed time. In CV, potential of a battery is controlled

Figure 3.2: battery loaded in a material tester and connected to a potentiostat .
36
UTM grip
battery

Figu
re 3
.3 (a
): lo
ad-e
long
atio
n cu
rve
of b
atte
ry u
nder
uni
-axi
al te
nsio
n.
37

38
1 2
4 3
Figure 3.3 (b): carbon fibers are gradually aligned as the tow is stretched, but uniform strain cannot applied to individual fibers.

39
following triangular function with respect to time, and the resulting current is measured.
It is known that current peaks appear in both cathodic and anodic scan direction when an
electrochemically reversible system is considered (Figure 3.5).
Fabricated batteries were galvanostatically cycled once with a current, C/30
or 0.184 mA between 0.01 and 1.5 V for a formation cycle. A formation cycle is first
few cycles during which organic electrolytes decompose and solid‐electrolyte
interphase forms. Since charges consumed during this process are irreversible, this
cycle should precede any measurement of interest. Cyclic voltammetry (CV) was
then employed to obtain diffusion coefficients of lithium ions in carbon fibers with
voltage scan rate from 0.1 to 3.2 mV/s between 0.01 and 1.5 V. Since fibers have a
circular cross section, the diffusion equation was formulated in a cylindrical coordinate
system as
, (1)
where is the concentration, is the radius of a single filament, and is the time. The
boundary condition that the net flux of diffusing species at the electrode surface is equal
to zero can be expressed as
(2)
where ’s are the diffusion coefficients of oxidizing and reducing species, and is the
radius of a fiber.
In CV, the electric potential can be expressed with the initial potential and
voltage scan rate as
. (3)

Figure 3.4: change in potential is measured while battery is discharged with a constantly imposed current in galvanostatic cycling.
40
0.0
-0.1
-0.2
-0.3
curr
ent (
mA
)

Figure 3.5: in cyclic voltammetry, (a) potential is controlled as a triangular function with various potential scan rates and (b) resulting current in a reversible system
shows peaks in both scan directions.
41
potential (V)
curr
ent (
mA
)
time
pote
ntia
l (V
)
(a)
(b)

42
Nernst equation combined with equation 3 gives
, (4‐a)
or , (4‐b)
where is the universal gas constant, is the absolute temperature, is the charge-
transfer number, and is the Faraday constant.
Nicholson solved these equations by a finite difference method [5]. From the
following relationship between current and concentration gradient,
, (5)
the current can be expressed as
, (6)
where is the electrode surface area and values of are available from the references
[5,6].
RESULTS AND DISCUSSION
One of the tensile test results of a battery is shown in Figure 3.3(a,b). As the
fibers were stretched, the load stayed close to zero up to a certain point, here about 0.7
mm, where most fibers were straightened and started to be actually loaded, and then the
load rapidly increased as more filaments were engaged in tension at about 0.90 mm. The
tensile modulus of this sample was 360 GPa, which is about 38 % of the actual value, and

43
the ultimate elongation was 0.3 %, which is also smaller than the value provided by the
manufacturer, indicating the applied load was not evenly distributed among filaments.
Figure 3.6 shows galvanostatic discharge/charge curves with a C/30 current. The
initial voltage of a fresh battery was around 3.3 V and it dropped rapidly as the battery
was discharged. The discharge curve became gentle from 1.8 V down to 0.4 V implying
electrolyte DEC and EC decomposition [7]. Then the discharge curve plateaued at a few
different potentials, referred as staging phenomena due to lithium ion intercalation into
graphite (Figure 3.6 insets). The first discharge and charge capacities were 186 mAh/g
and 162 mAh/g, respectively. These values correspond to 43~50% of theoretical capacity
of graphite, 372 mAh/g. Limited graphite contents or degree of graphitization of the fiber
are thought to be the major cause of the battery having lower utilization. It is well known
that the capacity of carbon-based electrode is largely dependent on the graphitization
degree [8-11]. Another reason of having lower utilization may be sought from the battery
configuration. For the purpose of the experiment, compression between two electrodes
could not be applied which is common procedure in conventional batteries. Finite
distance between the two electrodes may cause the battery to have lower capacity owing
to excessive concentration polarization.
Cyclic voltammetry with various scan rates ranging from 0.1 to 1.6 mV/s were
conducted and the results of a control sample are shown in Figure 3.7. As the applied
voltage scan rate increased, peak currents increased from 0.8945 to 1.613 mA and the
position of anodic peak also shifted from 0.3706 to 0.6708 V. At very low potential scan
rate, it is known that distinct peaks corresponding to different stages described with

Figu
re 3
.6: g
alva
nost
atic
dis
char
ge/c
harg
e cu
rve,
(top
inse
t) sh
owin
g ge
ntle
cur
ve d
ue to
ele
ctro
lyte
de
com
posi
tion,
(bot
tom
inse
t) vo
ltage
pla
teau
due
to st
agin
g ef
fect
s.
44

Figu
re 3
.7: c
yclic
vol
tam
mog
ram
with
pot
entia
l sca
n ra
tes b
etw
een
0.1
and
1.6
mV
/s in
a c
ontro
l sam
ple.
45

46
galvanostatic charge-discharge appear in voltammogram (Figure 3.8), but they merge into
one peak as scan rate increases [12].
From Equation 3.6, the peak current is the function of the diffusion coefficient
and the square roots of potential scan rates. When the peak current is plotted against the
square roots of the potential scan rates, the proportionality of these two values can be
used to obtain a diffusion coefficient. From the result shown in Figure 3.7, the diffusion
coefficient of lithium ions in the control carbon fibers was 3.1×10⁻⁶ cm2/s using Equation
6.
Figure 3.9 presents a cyclic voltammogram with the fixed scan rate 0.1 mV/s and
0, 0.15, and 0.30 % of strains. The peak current increased from 0.5191 to 0.5583 to
0.6661 mA as the applied strain increased. Changes in peak position shifting from 0.3509
to 0.3596 to 0.3526 V were not as significant as the peak current changes with respect to
scan rate variances. For a reversible system, increase of potential scan rates induces
increase of peak currents while keeping the distance between cathodic and anodic peak
positions constant. However, in a quasi-reversible system as in this study, potential scan
rate affects both peak current and peak positions [13]. Given that the potential scan rate
and peak position remained constant, we can deduce that the peak currents were
increased by altered kinetic parameters, especially diffusivity.
In Figure 3.10, the peak currents from cyclic voltammogram of a sample under
different tensions are plotted against the square roots of potential scan rates, and
interpolated with linear functions. The slopes of these regression lines vary from 0.35 to
0.61 mA/(mV/s)1/2 and diffusion coefficients corresponding to these slopes can be
obtained in the range, 8.06×10⁻⁷ ~2.4×10⁻⁶ cm2/s. Though the slopes in Figure 3.10 and in

1 µV/s
Figure 3.8: distinct current peaks appear when graphite is cycled with very low potential scan rate (1µV/s).
47

Figu
re 3
.9: c
yclic
vol
tam
mog
ram
with
var
ious
stra
ins.
48

49
other samples changed with respect to the applied strains, they did not seem to have a
statistically meaningful trend among various samples as shown in Figure 3.11.
The diffusion coefficients obtained from the experiments were in the same order
with those Takami et al. reported using EIS [14], but 3 to 4 orders of magnitude larger
compared to other studies measuring diffusivity of carbon fibers with various techniques
[15-17]. Takami and co-workers explained that the high diffusivity of lithium ions in
carbon fibers was attributed to the radial texture of filament microstructure. In literature,
however, diffusivity of lithium ions in graphite is not in good agreement and various
depending on physical and chemical characteristics of materials and electrochemical
techniques used for the diffusivity measurement [18].
One reason that the diffusivity varies in strained carbon fibers may be the
deformation of microstructures. Imanish et al. studied how the microstructure of a carbon
fiber affects the capacity and cyclability [19]. They explained the dependence of battery
functions on crystallite structure as the difference in susceptibility to structural failure and
lithium ion accessibility. Shioya and Takaku [20] reported re-orientations of crystallites
in carbon fibers under tension using X-ray diffraction. Therefore, the alteration of
diffusion path due to rigid rotation of crystallites under tension might be an important
cause of the change in diffusivities. Another possible cause came from the uncertainty of
the tensile test. As seen in Figure 3.3, when fibers were stretched, individual fibers were
subject to different strains from each other due to technical difficulty of alignment of
multiple fibers. Consequently, the diffusion coefficient of tested battery was the averaged
results obtained with differently strained fibers, in which the strain was an important
control parameter.

Figu
re 3
.10:
pea
k cu
rren
t vs.
squa
re ro
ot o
f pot
entia
l sca
n ra
te. R
egre
ssio
n lin
es a
re
adde
d to
see
chan
ges i
n th
e re
latio
nshi
p w
ith re
spec
t to
the
appl
ied
load
ings
50

Figu
re 3
.11:
slop
es fr
om F
igur
e 3.
10 a
re p
lotte
d ag
ains
t stra
in. S
lope
s var
y, b
ut n
ot in
a si
gnifi
cant
pat
tern
.
51

52
When strains were applied to a structural battery, and the battery was
charged/discharged, the battery experienced change in stresses. As seen in Figure 3.12,
the load measured with the materials tester decreased from 55 down to 44 N during
discharging and recovered the initial loading at the completion of one full
electrochemical cycle. The pattern of the measured load was precisely consistent with
that of charges (Figure 3.12), and the magnitude of change in load during cycling was
also directly proportional to the amount of charges (Figure 3.13), implying the number of
lithium ions inserted into graphite was a key factor.
Previous experimental work using X-ray [15,21,22] and computational work [23]
showed that graphite lattices expand as lithium ions intercalate into graphite and agreed
that the change in spacing between lattices was less than 10 %. Thus, we can deduce that
the measured load change up to 20 % originated not only from the elongated lattices, but
also more likely from other factors in the carbon fiber due to lithium intercalation. In
carbon fibers, the graphite lattices are aligned along fiber direction. In other words, the c-
axis of graphite is perpendicular to the fiber to have higher stiffness and strength although
all the graphite lattices are not perfectly aligned within a fiber [24]. This fact strengthens
the postulation that the changes in the measured load shown in Figure 3.12 and 3.13 are
more likely intrinsic.
Considering design of structural batteries or battery-implemented applications, the
findings in this experimental study may be used as a criterion. Since the intrinsic property
of an active material significantly changes during battery operation, one cannot adopt
materials properties reported for uses in typical structural applications. Instead,
significantly conservative design criteria should be applied. Changes in battery functions,

Figu
re 3
.12:
mea
sure
d lo
ad c
hang
es a
s lith
ium
ions
inte
rcal
ate
into
gra
phite
as s
how
n w
ith th
e ch
arge
and
cur
rent
cur
ves.
53

Figu
re 3
.13:
cha
nge
in m
easu
red
load
s is d
irect
ly p
ropo
rtion
al to
the
amou
nt o
f lit
hium
ions
inse
rted
into
gra
phite
.
54

55
though they were not as significant as structural aspects from this study, should also be
carefully considered.
As the final thought on the experiment, differently from porous materials,
tensions applied to the fibers may not cause the fibers to contract laterally as a whole so
that individual filaments can better contact to each other. This is because there is no
structural connection between individual fibers. Even though the contact between fibers
may slightly differ from relaxed fibers to strained ones, the electronic conduction in
carbon fibers mainly occur along the longitudinal direction due to high anisotropy of
graphite. This reasoning made the assumption feasible that we alter the actual material
differently from previous work using porous materials.
CONCLUSIONS AND FUTURE WORK
In this study, we studied the effects of mechanical stresses on electrochemical
performance of batteries. A carbon fiber - lithium battery was fabricated for a coupled
mechanical-electrochemical experiments. The diffusion coefficients of lithium ions in
carbon fiber were measured using CV and the load applied to the fiber was monitored
while the carbon fiber (working electrode) was stretched with a material tester. The
diffusivity obtained from experiments under strains of 0 ~ 0.3% varied from 8.06×10⁻⁷ to
2.4×10⁻⁶ cm2/s within the same sample. The change in lithium ion diffusivity may be
caused by alteration of diffusion path due to microstructure changes during tension tests,
but did not result a statistically meaningful trend. Load measured during electrochemical
cycling strongly depended on the amount of lithium ions intercalated into graphite.
Considering findings from previous work and arrangement of graphite lattices, the

56
changes in measured loadings may be caused by materials property change rather than
expansion of the material. It is recommended that this possibility of material property
change should be considered when designing a structural battery.
To better understand the underlying mechanism in the change of diffusivity under
external mechanical stresses, characterization of the carbon fiber microstructure would be
required. Observation of lattice parameter and orientation change of the carbon fiber
using X-ray during tension tests may clarify the direct cause of change in diffusivity.
One of the difficulties in this study was to make filaments evenly align with the
loading so that every single filament is under the same strain. We can resolve this
problem by testing a single filament instead of a tow of fibers. However, designing a
battery that can be used in this type of coupled experiments is not trivial, considering
grabbing a brittle fiber for tension tests and sealing the battery while allowing motion for
material tests.

57
BIBLIOGRAPHY
24. Striebel, K.A., Sierra, A., Shim, J., Wang, C.-W., and Sastry, A.M., 2004, “The effect of
compression on natural graphite anode performance and matrix conductivity,” Journal of Power Sources, v.134, pp.241-251.
25. Wang, C.-W., Yi, Y.-B., Sastry, A.M., Shim, J. and Striebel, K.A., 2004, “Particle Compression and Conductivity in Li-ion Anodes with Graphite Additives,” Journal of the Electrochemical Society, v. 151 (9), pp. 1489-1498.
26. Yi, Y.-B., Wang, C.-W. and Sastry, A.M., 2006, “Compression of Packed Particulate Systems: Simulations and Experiments in Graphitic Li-ion Anodes,” ASME Journal of Engineering Materials and Technology, v. 128(1), pp. 73-80.
27. Choi, Y.-M., and Pyun, S.-I., 1997, “Effects of intercalation-induced stress on lithium transport through porous LiCoO2 electrod,” Solid State Ionics, v.99, pp.173-183.
28. Nicholson, M.M., 1954, “Diffusion Currents at Cylindrical Electrodes. A Study of Organic Sulfides,” Journal of the American Chemical Society, v.76, pp.2539-2545.
29. Delahay, P., 1954, New Instrumental Methods in Electrochemistry, p.121, Interscience Publishers, Inc., New York.
30. Choi, Y.-K., Chung, K.-I., Kim, W.-S. and Sung, Y.-E., 2001, “Electrochemical properties of passivation film on mesophase pitch-based carbon fiber electrode,” Microchemical Journal, v.68, pp.61-70.
31. Iijima, T., Suzuki, K. and Matsuda, Y., 1995, “Electrodic characteristics of various carbon materials for lithium rechargeable batteries,” Synthetic Metals, V.73, pp.9-20.
32. Ohsaki, T., Kanda, M., Aoki, Y., Shiroki, H., and Suzuki, S., 1997, “High-capacity lithium-ion cells using graphitized mesophase-pitch-based carbon fiber anodes,” Journal of Power Sources, v.68, pp.102-105.
33. Flandrois, S. and Simon, B., 1999, “Carbon materials for lithium-ion rechargeable batteries,” Carbon, v.37, pp.165-180.
34. Kinoshita, K. and Zaghib, K., 2002, “Negative electrodes for Li-ion batteries,” Journal of Power Sources, v.110, pp.416-423.
35. Kulova, T.L. and Skundin, A.M., 2006, “Balance between Reversible and Irreversible Processes during Lithium Intercalation in Graphite,” Russian Journal of Electrochemistry, v.42, pp.251-258.
36. Bard, A.J. and Faulkner, L.R., Electrochemical Methods, Fundamentals and Applications, p.239, John Wiley & Sons, Inc., Hoboken, NJ (2001).
37. Takami, N., Satoh, A., Hara, M. and Ohsaki, T., 1995, “Structural and Kinetic Characterization of Lithium Intercation into Carbon Anodes for Secondary Lithium Batteries,” Journal of the Electrochemimcal Society, v.142, pp.371-379.
38. Uchida, T., Morikawa, Y., Ikuta, H., and Wakihara, M., 1996, “Chemical Diffusion Coefficient of Lithium in Carbon Fiber,” Journal of the Electrochemical Society, v.143, pp.2606-2610.
39. Morita, M., Nishimura, N.and Matsuda, Y., 1993, “Charge/Discharge Cycling Behavior of Pitch-based Carbon Fiber in Organic Electrolyte Solution,” Electrochimica Acta, v.38, pp.1721-1726
40. Verbrugge, M.W. and Koch, B.J., 1996, “Modeling Lithium Intercalation of Single-Fiber Carbon Microelectrodes,” Journal of The Electrochemical Society, v.143, pp.600-608.

58
41. Yu, P., Popov, B.N., Ritter, J.A. and White, R.E., 1999, “Determination of the Lithium Ion Diffusion Coefficient in Graphite,” Journal of the Electrochemical Society, v.146, pp.8-14.
42. Imanishi, N., Kashiwagi, H., Ichikawa, T., Takeda, Y. and Yamamoto, O., 1993, “Charge-Discharge Characteristics of Mesophase-Pitch-Based Carbon Fibers for Lithium Cells,” Journal of the Electrochemical Society, v.140, pp.315-320.
43. Shioya, M. and Takaku, A., 1994, “Rotation and Extension of Crystallites in Carbon Fibers by Tensile Stress,” Carbon, v.32, pp.615-619.
44. Skundin, A.M., Grigoreva, O.Y., Kulova, T.L., and Pouchko, S.V., 2003, “The lithium intercalation into graphite from electrolyte and from solid lithium,” Journal of Solid State Electrochemistry, v.8, pp.11-14.
45. Hahn, M., Buqa, H., Ruch, P.W., Goers, D., Spahr, M.E., Ufheil, J., Novak, P., and Kotz, R., 2008, “A Dilatometric Study of Lithium Intercalation into Powder-Type Graphite Electrodes,” Electrochemical and Solid-State Letters, v.11, pp.A151-A154.
46. Marquez, A., and Balbuena, P.B., 2001, “Molecular Dynamics Study of Graphite/Electrolyte Interafaces,” Journal of the Electrochemical Society, v.148, pp.A624-A635.
47. Chung, D., Carbon Fiber Composites, Butterworth-Heinemann, Newton, MA.

59
CHAPTER IV
MOLECULAR DYNAMICS SIMULATION OF LITHIUM ION DIFFUSION IN GRAPHITE UNDER MECHANICAL STRESSES3
INTRODUCTION
There are multiple sources of mechanical stresses exerted on batteries during their
fabrication and operation. Compression is a typical process to compact porous materials
and to decrease contact resistance within active materials and between active materials
and current collectors. While batteries are in operation, they experience cyclic loadings
from chemical reactions such as lithium intercalation into host materials and thermal
expansion and contraction. These mechanical stresses have been blamed for the
mechanical failure of active materials, and consequently the failure of batteries due to
loss of conduction path. Moreover, these mechanical stresses may also affect the
functionality of battery while they are in operation such as capacity, cyclability, and rapid
charge-discharge capability.
Molecular dynamics (MD) simulation is a method that enables us to directly
understand how each species of interest behaves at an atomic level. This method has been
adopted in simulating battery system for the last two decade. Using Monte Carlo
3 Material in this chapter is an unpublished paper in progress: H. C. Kim and A. M. Sastry, Molecular Dynamics Simulation of Lithium Ion Diffusion in Graphite under Mechanical Stresses, Journal of the Electrochemical Society, (2009).

60
simulation, Lehnert and Schmickler investigated the diffusion of lithium atoms in
graphite lattice and found that lithium atoms are ionized by donating their valence
electron to the host material, lithium ions diffuse parallel to graphite planes rather than
across planes due to energy barrier difference and the ions diffuse by thermal activation
[1]. Shimizu and Tachikawa compared the migration process of lithium atoms and ions
using molecular dynamics simulation, and found that lithium ions form ionic bonding
with carbon atoms, but lithium atoms covalently bond with carbons [2]. Marquez et al.
conducted molecular dynamics simulations of reactions at graphite/electrolyte interfaces
and they evaluated staging phenomena, structural change in graphite, charge distribution
on the atoms, and lithium ion diffusion coefficient as a function of lithium concentration
in graphite [3].
On the other hand, MD has been intensively applied to understand mechanics of
carbon nanotube (CNT). Mechanical properties such as Young’s modulus, Poisson’s
ratio, and tensile strength were calculated using the multi-body potential function of
embedded atom method [4], the modified Morse potential [5], and the Brenner potential
[6]. The tensile and compressive properties of bundles of CNTs were also measured with
Brenner potential and Lennard-Jones potential together [7]. Fracture of CNTs was also
investigated using MD [8,9].
As listed above, applications of MD to structural and electrochemical analyses
have been separately made. However, considering the detrimental effects of mechanical
stresses to battery performances and lifetime, it is worth to investigate the relation
between stresses and battery functions. MD seems to be the best approach to this problem

61
since it can be conveniently done to quantify specific values such as stresses and
diffusivities.
In this article, thus, we analyzed the effects of mechanical stresses on lithium ion
battery functions using molecular dynamics simulation with the Brenner potential widely
used for modeling of graphite and diamond. Our specific objectives are as follows:
1. To measure the difference in lithium ion diffusivities in graphite when
it is relaxed and stressed.
2. To observe changes in lattice parameters and stresses due to lithium
intercalation.
3. To quantify material properties of graphite and lithium intercalated
graphite.
METHODS
MD simulations of lithium-ion diffusion in graphite lattices were performed with a
canonical ensemble or NVT where the number of particles N, the volume V, and the
temperature T were kept constant. Lithium ions were placed between 4 lattices of
graphite each containing 88 carbon atoms. The Verlet algorithm was used for integration,
and velocity rescaling was used for adjustment of temperature to 300 K. The time step
used for the simulation was 0.5 fs and the total running time was 5 ps. Ion diffusivity was
calculated with different boundary conditions to evaluate the mechanical stress effects.
POTENTIAL FUNCTIONS

62
The Brenner potential is a bond-order empirical potential which describes the
covalent bonding energy, in hydrocarbon molecules, graphite and diamond [10].
The potential is expressed as the difference of a repulsion term and an attraction term
modified with ,
. (1)
The term is the bond order which depends on the number of bonds or types of sp
hybridization in carbon-containing molecules. The repulsion and attraction terms are
expressed as exponential functions as
, (2a)
and , (2b)
where is the potential well depth, is the equilibrium constant, and is the cut-off
function which thins between and expressed as
and . (3)
As explained above, the term incorporate the bond order by taking the bond angles
into account among the atoms , , and as in the following equation and in Figure 4.1.
, (4)
where . All the parameters used with Brenner potential
are listed in Table 4.1.

63
i
k
j
Figure 4.1: inter atomic angle configuration among atoms i, j, and k

Tabl
e 4.
1: P
aram
eter
s for
Bre
nner
Pot
entia
l.
64

65
Non-bonding potentials consist of Lennard-Jones potential and Coulomb
potential . These potentials describe the interactions between graphite lattices and
the interaction between lithium ions and graphite as
, (5)
and , (6)
where is the potential well depth, and is the equilibrium length, is the
Coulomb constant, and is the electric charge associated with ith atom. The parameters
used for the non-bonding potentials are listed in Table 4.2.
The net charge in lithium ion intercalated graphite is zero since the number of
lithium ions is equivalent to that of electrons transferred through electric circuit. These
electrons are evenly distributed in the graphene layer due to the delocalized unoccupied
molecular orbital of graphite. Thus, the charge each carbon atom contains is equal to
1/6 of that each lithium ion has in the stage 1 as in the following equation,
. (7)
Song and co-workers calculated the charges in lithium intercalated graphite at various
stages using local density functional approximation [11]. We adopted these values,
e.g. in stage 1, for the simulations in this study.
SIMULATIONS AND MEASUREMENT
Simulations were performed to mimic uni-axial tension tests. All the boundary
atoms on edge planes were fixed for control simulations and either edge or basal planes

66
DC(kcal/mol) 0.1050
DLi(kcal/mol) 0.0250
σC(Å) 3.8510
σLi(Å) 2.4510
Table 4.2: Parameters for Lennard-Jones Potential.

67
of the graphite lattices were stretched by the prescribed strain 1% of the dimension under
consideration for tension test simulations. When tensions were applied, reaction forces
exerted on the boundaries were measured.
While tension tests were conducted, diffusivity of a lithium ion was calculated
using time-dependent square displacement (TSD) method. TSD type diffusion coefficient
can be expressed as
, (8)
where is the position of the ion at step , and is the total simulation time. Diffusion
coefficients were measured at the stage 1 as shown in Figure 4.2.
RESULTS AND DISCUSSION
The diffusion coefficient of lithium ions in graphite was measured as (6.30 ±
0.08) × 10-7 cm2/s at the room temperature. This value lies close to 9.0×10⁻⁷ cm2/s which
was obtained with a semi-empirical method, AM1 [12], but one or two orders larger than
1.0×10⁻⁹ ~ 2.1×10⁻⁸ cm2/s calculated with the universal force field [3]. The diffusivities
obtained with atomistic computer simulation are relatively in good agreement since most
experimental results of lithium diffusivity include pore diffusion and also depend on
material preparation, resulting large range of diffusivities from 5.0×10⁻¹¹ to 1.0×10⁻⁷
cm2/s as Marquez and Balbuena discussed [3].
Diffusivity of lithium ions appeared to significantly vary depending on whether
graphite was strained or not (Figure 4.3). Diffusivities were measured as (6.50 ± 0.03) ×
10-7 cm2/s when 1 % strain was applied in the perpendicular direction to graphene

68
Figure 4.2: visualization of lithium intercalated graphite at stage 1.

69
control 1 % strain
Figure 4.3: diffusion coefficient of lithium ions in graphite (left) no strain was applied to graphite (right) graphite was stretched by 1% in
the perpendicular direction of graphene lattice

70
lattices, and this value is about 3 % larger than that in relaxed graphite. Since lithium ions
diffuse by thermal vibrations which overcomes potential energy barrier [1], larger
spacing, i.e. less energy barrier, may allow lithium ions to move more easily, resulting a
larger diffusivity.
Figure 4.4 shows spacing between lattices increased from the initial value 3.35 Å
to 3.385 Å due to lithium ion intercalation. Expansion of lattice spacing had been
previously studied using X-ray during electrochemical cycling of lithium ion batteries
[13-15]. Figure 4.5 shows the stress-strain curve of graphite where graphite was stretched
in the perpendicular direction of graphene lattices. The elastic modulus in this direction
was obtained as about 180 GPa, and that of lithium intercalated graphite was about 400
GPa, more than twice of pristine graphite. This is probably because carbon atoms in
lithium intercalated graphite are more strongly constrained by Coulombic force with
lithium ions.
CONCLUSIONS AND FUTURE WORK
Molecular dynamics simulation was conducted to evaluate the effects of
mechanical stresses on battery function. Diffusion coefficients were measured with two
different strain conditions and change in diffusion coefficients was found. Diffusivity of
lithium ions in graphite was increased by 3% when graphite was strained 1% in the
perpendicular direction to graphite lattices. Intercalated lithium caused the graphite lattice
spacing to expand by 1%. Despite of the widened distance among carbon atoms, elastic
modulus in perpendicular direction to lattices was increased due to attractive interactions
with lithium ions.

71
As mentioned earlier, diffusivity in real battery always has larger variance than in
computer model since the real system depends largely on material preparation and other
limiting factors. It is important to consider other factors in analyses because diffusion
processes are dominated by the slowest one. Thus, it is recommended to examine
diffusions in the interface between graphite and electrolyte or solid-electrolyte interphase
itself.

72
Figure 4.4: graphite lattice spacing during stage 1

73
Figure 4.5: stress-strain curve of graphite stretched in perpendicular direction to the graphene lattice

74
BIBLIOGRAPHY
48. Lehnert, W. and Schmickler, W., 1992, "The diffusion of lithium through
graphite: a Monte Carlo simulation based on electronic structure calculations," Chemical Physics, v.163, pp.331-337.
49. Shimizu, A. and Tachikawa, H., 2001, "The dynamics on migrations of Li+ Ion and Li atom at 700 K around the circumference of graphite cluster model: A direct molecular dynamics study," Chimcal Physics Letters, v.339, pp.110-116.
50. Marquez, A. and Balbuena, P.B., 2001, "Molecular Dynamics Study of Graphite/Electrolyte Interfaces," Journal of the Electrochemical Society, v.148, pp.A624-A635.
51. Yao, Z.H., Zhu, C.C., Cheng, M., and Liu, J.H., 2001, “Mechanical properties of carbon nanotube by molecular dynamics simulation,” Computational Materials Science, v.22, pp.180-184.
52. Xiao, J.R., Gama, B. A., and Gillespie, J.W., 2005, “An analytical molecular structural mechanics model for the mechanical properties of carbon nanotubes,” International Journal of Solids and Structures, v.42, pp.3075-3092.
53. Agrawa, P.M., Sudalayandi, B.S., Raff, L.M., and Komanduri, R., 2008, “Molecular dyanamics (MD) simulations of the dependence of C-C bond length and bond angles on the tnensile strain in single-wall carbon nanotubes (SWCNT),” Computational Materials Science, v.41, pp.450-456.
54. Liew, K.M., Wong, C.H., and Tan, M.J., 2006, “Tensile and compressive properties of carbon nanotube bundles,” Acta Materialia, v.54, pp.225-231.
55. Yakobson, B.I., Campbell, M.P., Brabec, C.J., and BErnholc, J., 1997, “High strain rate fracture and C-chain unraveling in carbon nanotubes,” Computational Materials Science, v.8, pp.341-348.
56. Meo, M. and Rossi, M., 2006, “Tensile failure prediction of single wall carbon nanotube,” Engineering Fracture Mechanics, v.73, pp.2589-2599.
57. Brenner, D.W., 1990, "Empirical potential for hydrocarbons for use In simulating the chemical vapor deposition of diamond films," Physical Review B, v.42, pp.9458-9471.
58. Song, M.K., Hong, S.D., and No, K.T., 2001, “The Structure of Lithium Intercalated Graphite Using an Effective Atomic Charge of Lithium,” Journal of the Electrochemical Society, v.148, pp.A1159-A1163.
59. Tachikawa, H., and Shimizu, A., 2005, “Diffusion dynamics of the Li+ ion on a model surface of amorphous carbon: A direct molecular orbital dynamics study,” Journal of Physical Chemistry B, v.109, pp.13255-13262.
60. Uchida, T., Morikawa, Y., Ikuta, H., and Wakihara, M., 1996, “Chemical Diffusion Coefficient of Lithium in Carbon Fiber,” Journal of the Electrochemical Society, v.143, pp.2606-2610.

75
61. Skundin, A.M., Grigoreva, O.Y., Kulova, T.L., and Pouchko, S.V., 2003, “The lithium intercalation into graphite from electrolyte and from solid lithium,” Journal of Solid State Electrochemistry, v.8, pp.11-14.
62. Hahn, M., Buqa, H., Ruch, P.W., Goers, D., Spahr, M.E., Ufheil, J., Novak, P., and Kotz, R., 2008, “A Dilatometric Study of Lithium Intercalation into Powder-Type Graphite Electrodes,” Electrochemical and Solid-State Letters, v.11, pp.A151-A154.

76
CHAPTER V
CONCLUSIONS AND FUTURE WORK
Effects of mechanical stresses on lithium ion battery were studied using experiments and
computer simulations. In the 2nd chapter about structural analysis of battery, it was
intended to identify and quantify various sources of mechanical stresses that may exist in
battery applications. Focus was made on structural batteries since this new applications
aim to utilize batteries as structural members in devices, but the assessment of structural
loadings exerted on batteries and the consequence has not been reported. It was found
that stresses due to compressive process during fabrication can be as large as 2000 MPa,
possible to break materials and stresses from external loadings were the smallest having
less than 1 MPa. As to reasons why the structural loadings affect so little, it is possible
that the structural battery examples considered in this study are not intended to be used in
severe environments. However, loadings from thermal stress can be as high as 100 MPa
since embedding batteries in structure played as confinement hindering thermal
expansion.
A battery using carbon fiber was fabricated to directly evaluate the effects of
mechanical stresses on battery performance. Diffusion coefficients of lithium ions in
carbon fibers were measured while tension tests were applied to the battery. At the same
time, loadings supported by carbon fibers were measured while electrochemical cycling
was performed. Statistically meaningful relation was not observed for diffusion
coefficients depending on different stresses, but force applied to carbon fiber changed

77
significantly during charging/discharging of batteries, and the magnitude of change in
force was strongly correlated with the amount of charges.
Molecular dynamics simulations were performed to examine findings from
Chapter 3. Diffusion coefficients of lithium ions were measured while graphite lattices
were stressed. Differently from experimental results, significant change in diffusivities
was observed. The stiffness in perpendicular direction to graphite lattice also showed
change from pure graphite to lithium intercalated one. The sign of change in stiffness was
opposite to findings from experiments, clarifying the load variation observed in
experiments was caused by other factors.
In summary, structural loadings in a structural battery are not critically
detrimental, but caution should be made because the effects may vary depending on
applications. A special attention should be paid since loadings a structural battery bears
can substantially vary during operation. The perturbation of loads in a structural battery
may not be caused by change in stiffness or spacing between graphite lattices, but more
likely change in stacking sequence of graphite layers. Further study using X-ray
diffraction method may be used to verify the relation between the degree of lattice
stacking sequence and the amount of lithium ions intercalated into graphite, or more
directly an experimental method can be devised to find how much elongation the change
in stacking sequence causes.