Embed Size (px)
Citation preview
Pak. J. Bot., 52(6): 1899-1910, 2020. DOI: http://dx.doi.org/10.30848/PJB2020-6(23)
EFFECTS OF IRRADIANCE ON GROWTH AND MORPHOPHYSIOLOGY
IN CATALPA BUNGEI PLANTLETS
QUAN QIU1, JUNHUI WANG2*, NA LIN1, YAN SU1, JIANWEI MA3, JIYUE LI1* AND QIAN HE1*
1Guangdong Key Laboratory for Innovative Development and Utilization of Forest Plant Germplasm,
College of Forestry and Landscape Architecture, South China Agricultural University, 510642,
Guangzhou, People’s Republic of China 2State Key Laboratory of Tree Genetics and Breeding, Key Laboratory of Tree Breeding and Cultivation of State
Forestry Administration, Research Institute of Forestry, Chinese Academy of Forestry,
Beijing 100091, People’s Republic of China 3Xiaolongshan Forestry Science and Technology Research Institute, 741022, Tianshui Gansu,
People’s Republic of China *Corresponding author’s email: [email protected]; [email protected]; [email protected]
Abstract
With the aim of examining the effect of irradiance on growth and morphophysiology in Catalpa bungei, and its
acclimation strategy to different shade intensity treatments, a pot experiment was conducted to determine the growth,
morphological, and physiological parameters of C. bungei clone 008-1 plantlets under high (HI), medium (MI), and low (LI)
irradiance levels, i.e. at approximately 80, 50, and 30% of full sunlight, respectively. Irradiance provoked significant and
varied changes in phenotypic plasticity index (PPI) values for growth (ca. 0.44), morphology (ca. 0.37), and physiology (ca.
0.28). Shade treatments (MI and HI) reduced growth, biomass yield, crown leaf area per plant, expansion rate of newly
emerged leaves and their size at the end of expansion (length, width, and area), specific leaf weight, net photosynthetic rate,
stomatal conductance, intercellular CO2 concentration, transpiration rate, instantaneous water use efficiency, and δ13C values,
whereas specific leaf area (SLA), leaf chlorophyll concentration, and leaf nitrogen (N) concentration were greatly decreased.
MI did not affect maximum quantum yield of PSII (Fv/Fm) values; however, LI induced a significant decrease in Fv/Fm.
Shaded plantlets generally had higher or similar non-structural carbohydrate (NSC) concentrations than HI plantlets. Overall,
growth traits linearly decreased with decreasing irradiance, but morphological and physiological traits exhibited different
dynamic trends. Our results showed that C. bungei coped with shade through morphophysiological adjustments, i.e.
increasing SLA, leaf chlorophyll content, and NSC reserves; however, shade (ca. 30–50% full sunlight) still induced a
significant reduction in plantlet growth due to photosynthesis restriction (MI: stomatal closure; LI: stomatal closure and
lower photosystem II efficiency) and changes in NSC allocation strategy, preferring to maintain metabolism and survival
rather than growth investment.
Key words: Irradiance, Growth, Physiology, Catalpa bungei.
Introduction
Irradiance plays an important role in determining
plant growth and metabolism. Irradiance is widely known
to cause significant variation in plant growth, biomass
allocation and accumulation, leaf morphology, structure,
and physiology (Yeh and Atherton, 1999; Avramov et al.,
2007; Zheng et al., 2009; Moraes et al., 2010; Jarcuska et
al., 2011; Hallik et al., 2012; Chmura et al., 2017; Wang
et al., 2017; Díaz-Barradas et al., 2018). Morphological
responses (e.g. length, width, and area) are readily
observed in leaves under changing environmental factors
(e.g. light and water), especially in newly emerged leaves;
these responses generally alter their expansion process as
extrinsic factors change (Hieke et al., 2002; Zhu et al.,
2005; Murphy et al., 2012). In previous studies,
physiological measures such as photosynthesis rate,
stomatal conductance (Cond), transpiration rate (Tr),
photosynthetic pigment content, and chlorophyll
fluorescence were commonly measured to determine
physiological adaptations in response to changing
irradiance (Zheng et al., 2009; Hallik et al., 2012; Yao et
al., 2014). Recently, researchers have begun to focus on
plant water use efficiency (WUE) and carbohydrate
metabolism in response to irradiance (Ahemd et al., 2016;
Maguire & Kobe, 2016; Mcausland et al., 2016; Piper &
Fajardo, 2016). WUE is generally studied at two levels:
instantaneous (WUEi) and long-term (WUEl). WUEi has
been widely used to assess irradiance effects on
physiology (Ahemd et al., 2016; Mcausland et al., 2016);
however, WUEl has seldom been applied in this context.
Leaf carbon isotope composition (δ13C) is a stable index
that reliably estimates leaf WUEl (Farquhar et al., 1989)
and photosynthetic capacity (Flanagan & Farquhar,
2014); it has been shown to be significantly influenced
by irradiance (Berry et al., 1997). Carbohydrates
represent the main photosynthate reserves, and comprise
structural and non-structural carbohydrates (NSCs) (Luo
et al., 2006). In general, NSC reserves in plants,
predominantly soluble sugars and starches, are used for
cell growth and maintenance, including respiratory
metabolism and osmotic adjustment (McDowell, 2011),
and plant NSC reserves are often consumed to maintain
metabolism and defences when subjected to
environmental stressors such as low light, drought, and
low temperature. Many studies have used NSC
concentration as a useful physiological index that reflects
environmentally adaptive strategies (Myers & Kitajima,
2007; Poorter & Kitajima, 2007). Therefore, changes in
plant NSC reserves can provide data that allow accurate
assessment of carbohydrate storage, supply, and
consumption in plants under different light conditions.
QUAN QIU ET AL., 1900
Catalpa bungei, native to China, is grown widely in
temperate regions of China due to its economic benefits
and beauty; several recent studies have reported its
physiological characteristics and growth in response to
water stress and nitrogen (N) application (Qiu et al.,
2016; Wu et al., 2017; Zheng et al., 2017). As a result,
water and fertiliser management strategies for this
species are well developed in cultivation and
afforestation practices, and contribute greatly to
increased productivity. However, density control
approaches (e.g. thinning and pruning) suitable for C.
bungei plantation have become a serious technological
bottleneck to increased productivity, due to poor
understanding of its adaptation to changing light
conditions. Hence, new research on irradiance effects on
the growth and morphophysiology of C. bungei is
needed. Wu et al., (2017) examined the effects of
irradiance on the growth, mature leaf morphology,
WUEi, photosynthetic capacity, photosynthetic pigment
content, and chlorophyll fluorescence of C. bungei clone
9-1, and a few similar studies focusing on other clones
have been conducted. The expansion process of a single
newly emerged leaf, WUEl, and NSC reserves have
proven to be effective indicators of the morphological
responses of C. bungei to irradiance, yet have rarely
been applied in this context.
In this study, we conducted a pot experiment to
determine the growth, morphological, and physiological
parameters of C. bungei clone 008-1 plantlets under
different irradiance levels. We then applied these data to
analyse growth and morphophysiology responses to
changing irradiance. Our objective was to examine the
effect of irradiance on the growth and
morphophysiology of C. bungei, evaluate its acclimation
strategies for different shade intensity levels, and
provide a basic structure for future density control
strategies for C. bungei plantations.
Material and Methods
Plant material and growth conditions: C. bungei clone
008-1 plantlets were obtained from Luoyang City, Henan
Province, China, and transplanted into flower pots in early
March 2015. The flower pots measured 30 cm (top
diameter) × 30 cm (bottom diameter) × 45 cm (height).
Plastic pellets were placed at the bottom of each flower
pot to reduce water and soil loss, and the empty space was
filled with potting soil. Soil field capacity (FC) and bulk
density (BD) were determined using the core cutter
method, and soil chemical properties were measured
following the methods described by Lu (2000). Soil FC
was 31.95% (in volume), BD was 1.04 g cm–3, pH was
6.86, organic matter content was 64.70 g kg–1, total N
content was 2.30 g kg–1, total phosphorus (P) content was
0.80 g kg–1, total potassium (K) content was 18.14 g kg–1,
available N content was 178.94 mg kg–1, available P
content was 25.46 mg kg–1, and available K content was
179.08 mg kg–1. The plantlets were planted and allowed to
acclimate for 3 months in a plastic film greenhouse
measuring 60.0 m × 8.0 m × 1.6 m, with an arch height of
3.0 m, arch space of 1.0 m, and total area of 480.0 m2.
During acclimation, plantlets were abundantly watered
daily and protected against insects and disease. The study
site was located at the Xiaolongshan Forestry Science and
Technology Research Institution, Tianshui, Gansu
Province (34º29' N, 105º48' E, 1160 m a.s.l.), which is in
a temperate zone within a semi-humid monsoon climatic
region. The average annual rainfall and evaporation
capacity at the site are 600–800 mm and 1,290 mm,
respectively. The average annual temperature is 11°C, and
the frost-free period lasts ca. 180 days. During the
experiment, the daily average temperature in the
greenhouse ranged from 20 to 38°C, and daily average
humidity was 40–65%. Before treatment, the average
stem height (SH) and basal diameter of the plantlets were
0.49 m and 8.63 mm, respectively. An explanation of
symbols and abbreviations is provided in Table 1.
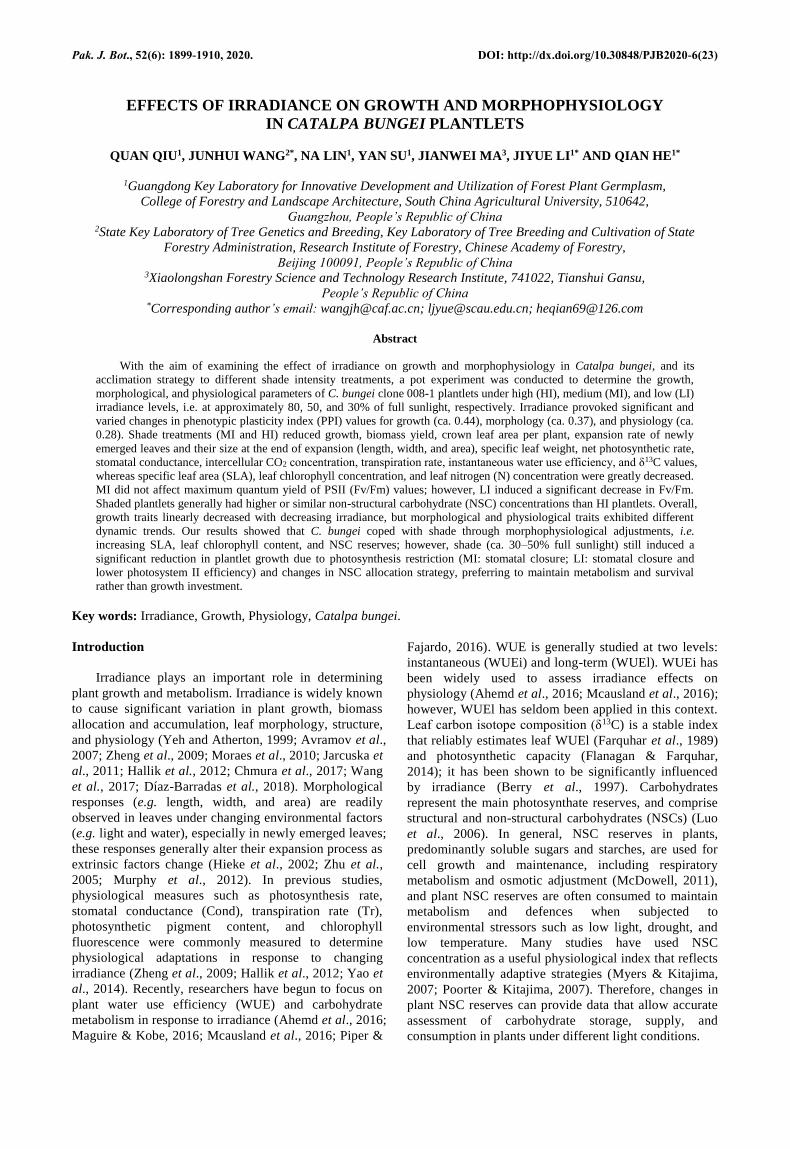
Experimental design: On 1 June, 2015, 30 pots of
biennial C. bungei plantlets were transplanted into three
fixed-light environments in a greenhouse to create low
(LI), medium (MI), and high (HI) irradiance treatments,
which received ca. 30, 50, and 80% of full sunlight, with
10 plantlets in each treatment. The actual light
environments in all treatments were measured as shown in
Fig. 1. The LI and MI treatments were produced using
black shade nets with different light transmittance values,
and the HI treatment was wide open (i.e. the light
transmittance of the greenhouse was ca. 80% of full
sunlight). During the experimental period (early June to
early September), abundant irrigation (> 80% FC) and N
fertilisation (2 g N month–1 in early June, early July, and
early August 2015) was performed to satisfy the water
and fertiliser requirements of healthy plantlets.
Growth and morphological determination: The SH
and ground diameter (GD) were measured at 15-day
intervals from the start of light treatments (1 June, 2015).
GD was determined approximately 0.5 cm above ground
level using digital callipers. SH and GD were recorded
and crown leaf area per plant (CLA) was measured using
an LI-3100 leaf area meter (LI-COR Inc., Lincoln, NE,
USA) at the end of the experimental period (1
September, 2015). Plantlets were then harvested and
oven dried at 75°C for 72 h to calculate biomass yield
(BY; including root, stem, and leaf; Singh & Singh
2006). To examine possible changes in leaf emergence
in association with changes in irradiance, we determined
single-leaf morphological parameters. On 1 July and 1
August, one newly emerged leaf (area > 1 cm2) per plant
was selected to determine its length (LL, from the leaf
base to the tip; Fig. 2), maximum width (LW; Fig. 2),
and area (LA) at 3-day intervals during the duration of
leaf expansion (DLE). If there was no change in LL or
LW between two consecutive observations, leaf
expansion was considered complete (Zhu et al., 2005).
LL, LW, and LA at the end of leaf expansion were
recorded as mature single-leaf morphological parameters;
the mean single-leaf expansion rate (MLER) was
calculated as MLER = LA/DLE.
EFFECTS OF IRRADIANCE ON GROWTH AND MORPHOPHYSIOLOGY IN CATALPA BUNGEI 1901
Table 1. Symbols and abbreviations used in this study. PSII: photosystem II; SPAD: Soil and Plant Analysis Development.
Abbreviation Description Precision
δ13C Carbon isotope composition 0.01‰
BY Total biomass yield 0.01 g
Ci Intercellular CO2 concentration 0.01 µmol CO2 mol–1
CLA Crown leaf area per plant 0.01 m2 plant–1
Cond Stomatal conductance 0.01 mol H2O m–2 s–1
DLE Duration of leaf expansion 1 d
Fv/Fm Maximum quantum yield of PSII /
GD Ground diameter 0.01 mm
LA Single newly emerged leaf area 0.01 cm2
LL Single newly emerged leaf length 0.1 cm
LN Leaf nitrogen concentration 0.01 g kg–1
LW Single newly emerged leaf width 0.1 cm
MLER Mean single leaf expansion rate 0.01 cm2 d–1
NSC Non-structural carbohydrate /
[NSC]root NSC concentration in root 0.01 mg g–1
[NSC]stem NSC concentration in stem 0.01 mg g–1
[NSC]leaf NSC concentration in leaf 0.01 mg g–1
Pn Net photosynthetic rate 0.01 μmol CO2 m–2 s–1
PPFD Photosynthetic photon flux density 1 μmol m–2 s–1
PPI Phenotypic plasticity index /
SH Stem height 0.01 m
SLA Specific leaf area 0.01 cm2 g–1
SLW Specific leaf weight 0.01 g m–2
SPAD SPAD-502 leaf chlorophyll metre readings /
Tr Transpiration rate 0.01 mmol H2O m–2 s–1
WUE Water use efficiency /
WUEi Instantaneous WUE 0.01 μmol CO2 mmol–1 H2O
WUEl Long-term WUE /
NSC measurements: Following BY measurements,
samples were crushed, sieved through a 100-mesh screen,
stored in sample bags, and prepared for NSC measurements.
NSC concentrations in roots ([NSC]root), stems ([NSC]stem),
and leaves ([NSC]leaf) were calculated as the sum of total
soluble sugar concentration ([TSS]) and starch
concentration ([Starch]). [TSS] and [Starch] were measured
using the anthrone–sulphuric acid colourimetric method
(Zou, 1995) and expressed as mg g–1 dry matter.
Gas exchange parameter measurements: Net
photosynthetic rate (Pn), Cond, intercellular CO2
concentration (Ci), and Tr were determined monthly (mid-
June, mid-July, and mid-August 2015) in the morning
(09:00–11:00) on the fourth fully expanded leaf (from the
apex) of each plant. Pn values were recorded using a
portable photosynthesis system (LI-6400; LI-COR Inc.). To
obtain stable measurements and simulate actual external
environmental conditions, in accordance with actual light
conditions under different irradiance treatments,
photosynthetic photon flux density (PPFD) at the leaf
surface was set at 1,000 μmol m–2 s–1 (HI), 600 μmol m–2 s–
1 (MI), or 300 μmol m–2 s–1 (LI), and the temperature at the
leaf surface was set at 35°C, with 42.3% relative humidity
and a reference carbon dioxide (CO2) concentration of
403.74 μmol mol–1. WUEi was calculated as WUEi = Pn/Tr.
Leaf maximum quantum yield of photosystem II (PSII)
(Fv/Fm) and soil and plant analysis development
(SPAD) measurements: Leaf SPAD and Fv/Fm values
were respectively determined monthly (mid-June, mid-
July, and mid-August 2015) using a portable chlorophyll
meter (SPAD-502; Minolta Camera Co. Ltd., Tokyo,
Japan) and a portable chlorophyll fluorometer (MINI-
PAM; Walz, Effeltrich, Germany) on the fourth and fifth
fully expanded leaves from the apex.
Leaf N concentration and δ13C measurements: Leaf
samples were collected in mid-June, mid-July, and mid-
August 2015. Each sample comprised 3–5 whole fresh
leaves (fourth and fifth fully expanded leaves from the
apex) from each plant. After washing, samples were oven
dried at 75°C for 72 h (Singh and Singh, 2006), collected
in numbered sample bags, crushed, and sieved through a
100-mesh screen. These samples were used to measure
leaf N concentration, which was determined following the
method described by Lu (2000). Only leaf samples
collected in mid-August 2015 were used to measure leaf
δ13C values. As described by Bidartondo et al., (2004),
Yang et al., (2012), and Qiu et al., (2016), leaf δ13C
values were determined in a stable isotope laboratory at
the Chinese Academy of Forestry (Beijing, China); the
overall analytical precision was ± 0.1‰.
QUAN QIU ET AL., 1902
(a)
Time
8:00 10:00 12:00 14:00 16:00 18:00
PA
R (
mo
l m
-2 s
-1)
0
200
400
600
800
1000
1200
1400
(b)
Time
8:00 10:00 12:00 14:00 16:00 18:00
(c)
Time
8:00 10:00 12:00 14:00 16:00 18:00
HL
ML
LL
Fig. 1. Diurnal variation in photosynthetically active radiation (PAR) at the leaf level under three irradiance treatments: high (HI), medium
(MI), and low (LI), at ca. 80, 50, and 30% of full sunlight, respectively. a, b, and c represent June, July, and August, respectively.
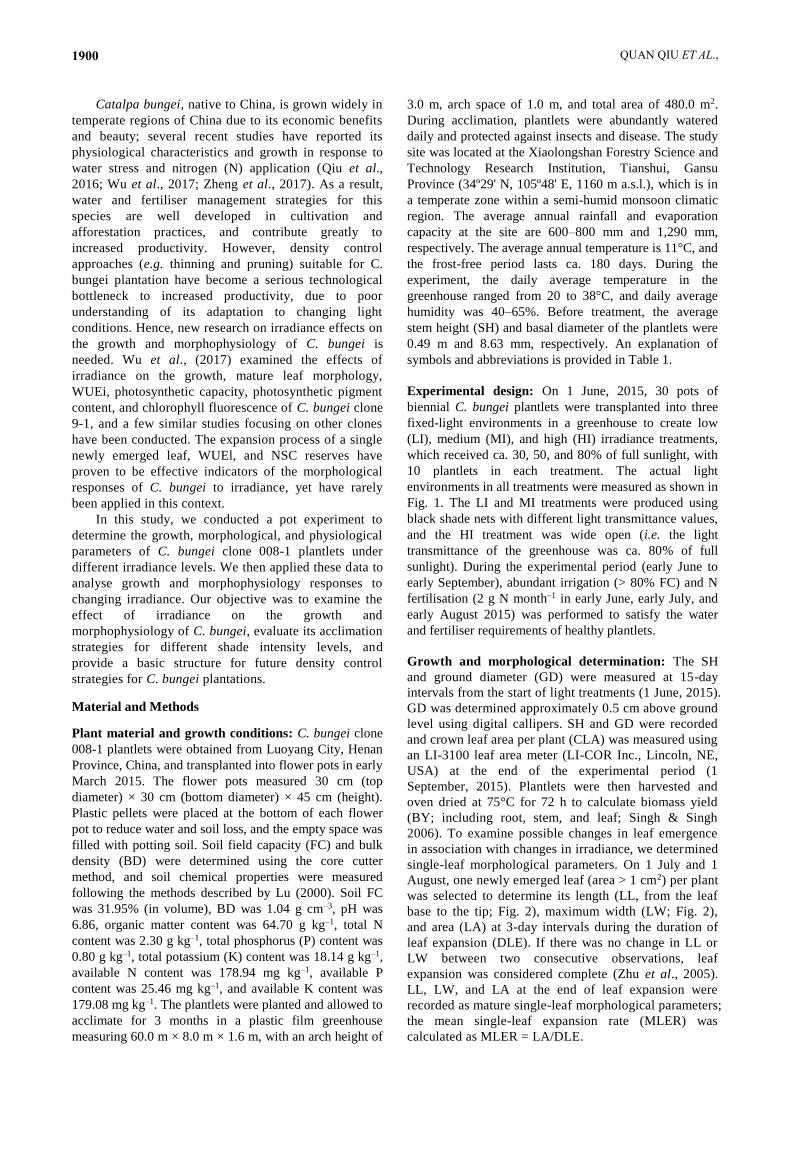
Fig. 2. Morphology of single mature leaves under HI (a), MI (b), and LI (c) treatments. LL: leaf length; LW: leaf width. Images
captured in July 2015.
Statistical analyses
Effects of irradiance on plant traits were evaluated
using a Kruskal–Wallis test followed by pairwise
multiple comparisons. Bivariate relationships among
plant traits were calculated using Pearson’s correlation.
The phenotypic plasticity index [PPI = |(max –
min)/max|, where max and min represent mean
maximum and minimum values for each plant trait,
respectively] was calculated separately for each
morphological and physiological parameter (Valladares
et al., 2000). Data represent means ± standard deviation
(SD). All statistical analyses were conducted using SPSS
software (ver. 20.0; SPSS Inc., Chicago, IL, USA).
Figures were constructed using SigmaPlot software (ver.
10.0; Systat Software, Inc., Richmond, CA, USA).
Results
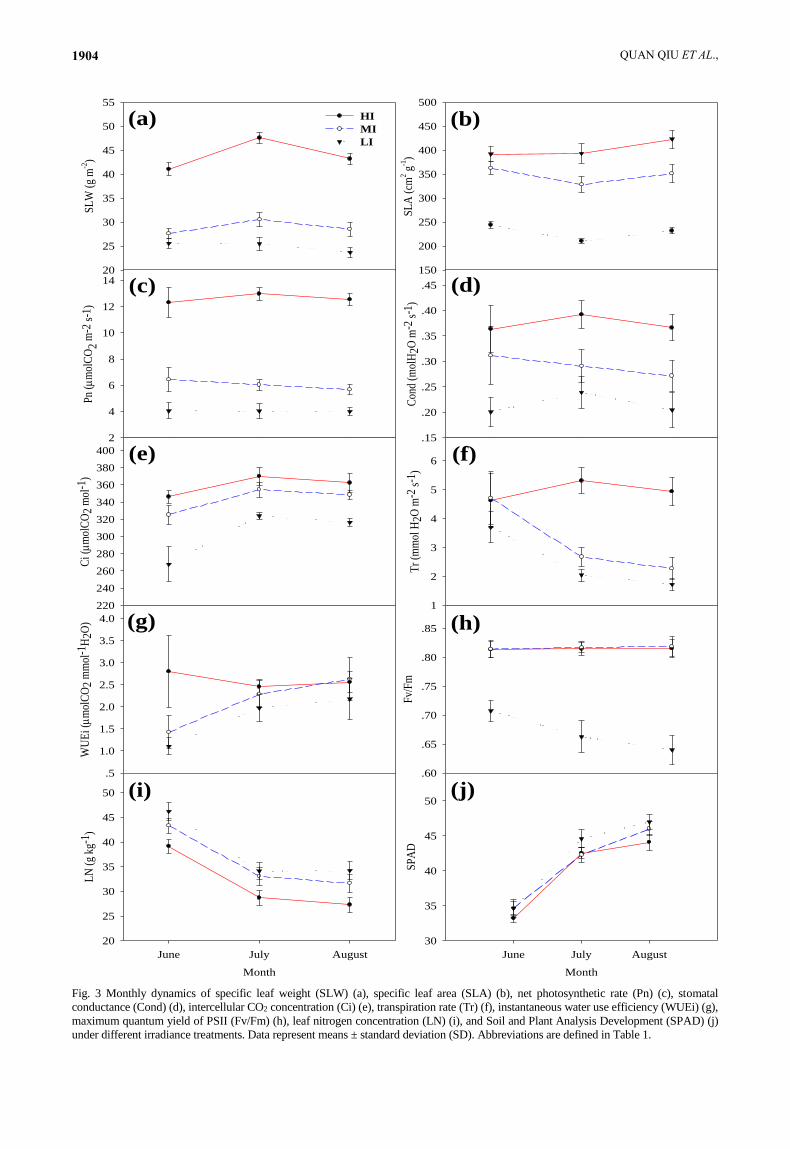
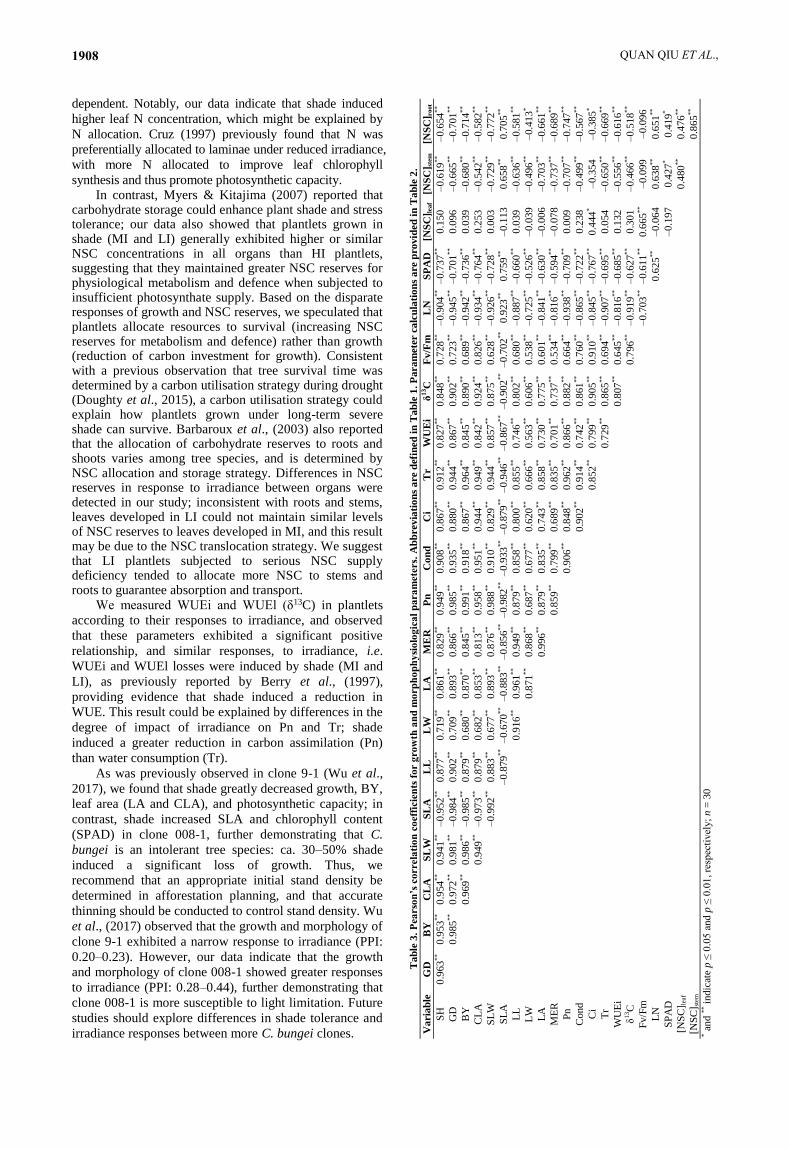
Growth and leaf morphological response: Monthly
dynamics of specific leaf weight (SLW) (Fig. 3a), specific
leaf area (SLA) (Fig. 3b), and single newly expanded leaf
morphological parameters (LL, LW, and LA; Fig. 4)
demonstrated that these traits all changed dramatically as
the growth period progressed; therefore, we calculated
their mean values to represent leaf morphological
responses to irradiance. As shown in Fig. 4, irradiance did
not affect DLE in July and August (DLE = 21 d).
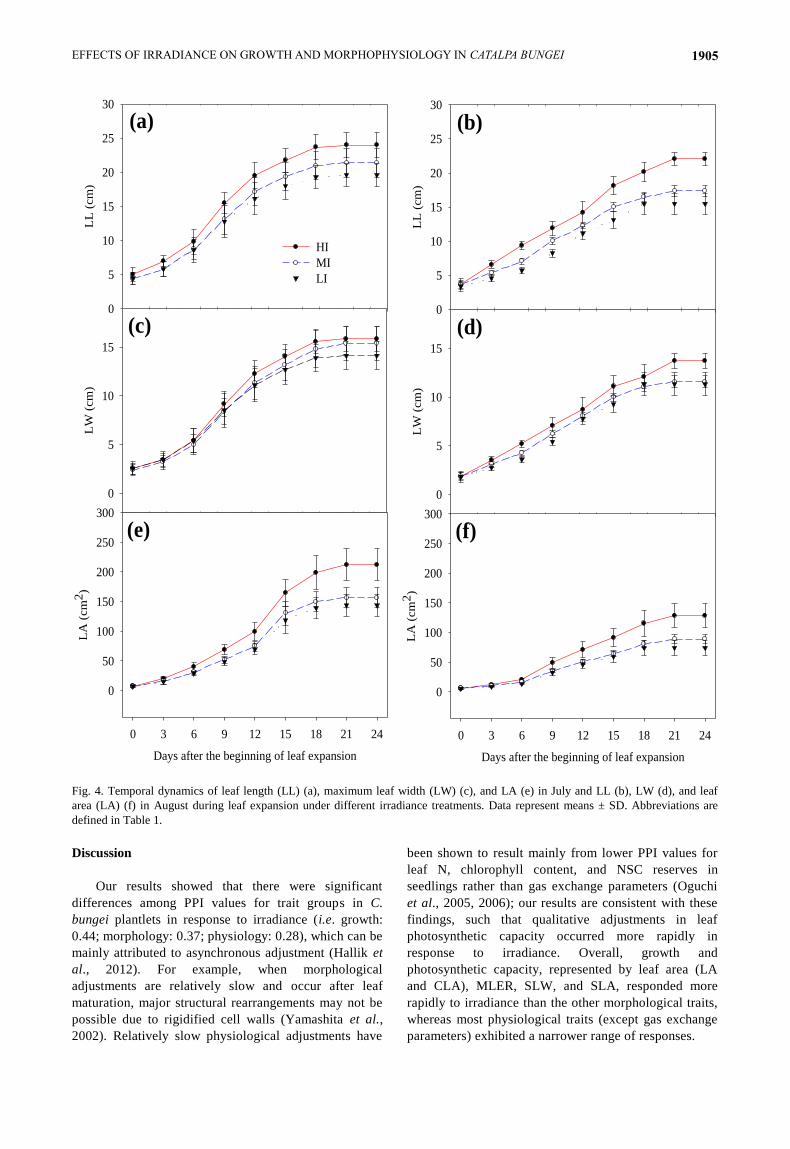
Kruskal–Wallis results showed that growth and
morphological parameters were all significantly different
between irradiance treatments (Table 2). SH (Fig. 5a), GD
(Fig. 5b), BY (Fig. 5c), CLA (Fig. 5d), and SLW (Fig. 5e)
decreased significantly with decreasing irradiance; SLA
(Fig. 3) increased significantly with decreasing irradiance;
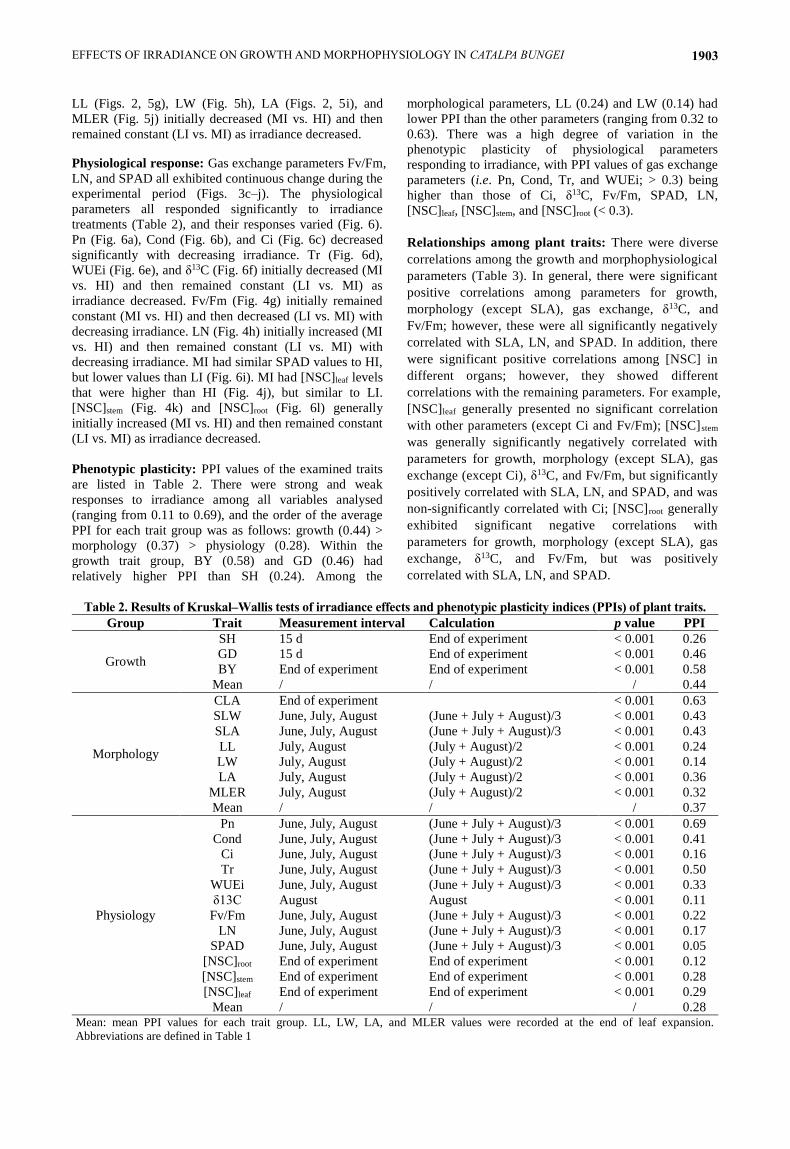
EFFECTS OF IRRADIANCE ON GROWTH AND MORPHOPHYSIOLOGY IN CATALPA BUNGEI 1903
LL (Figs. 2, 5g), LW (Fig. 5h), LA (Figs. 2, 5i), and
MLER (Fig. 5j) initially decreased (MI vs. HI) and then
remained constant (LI vs. MI) as irradiance decreased.
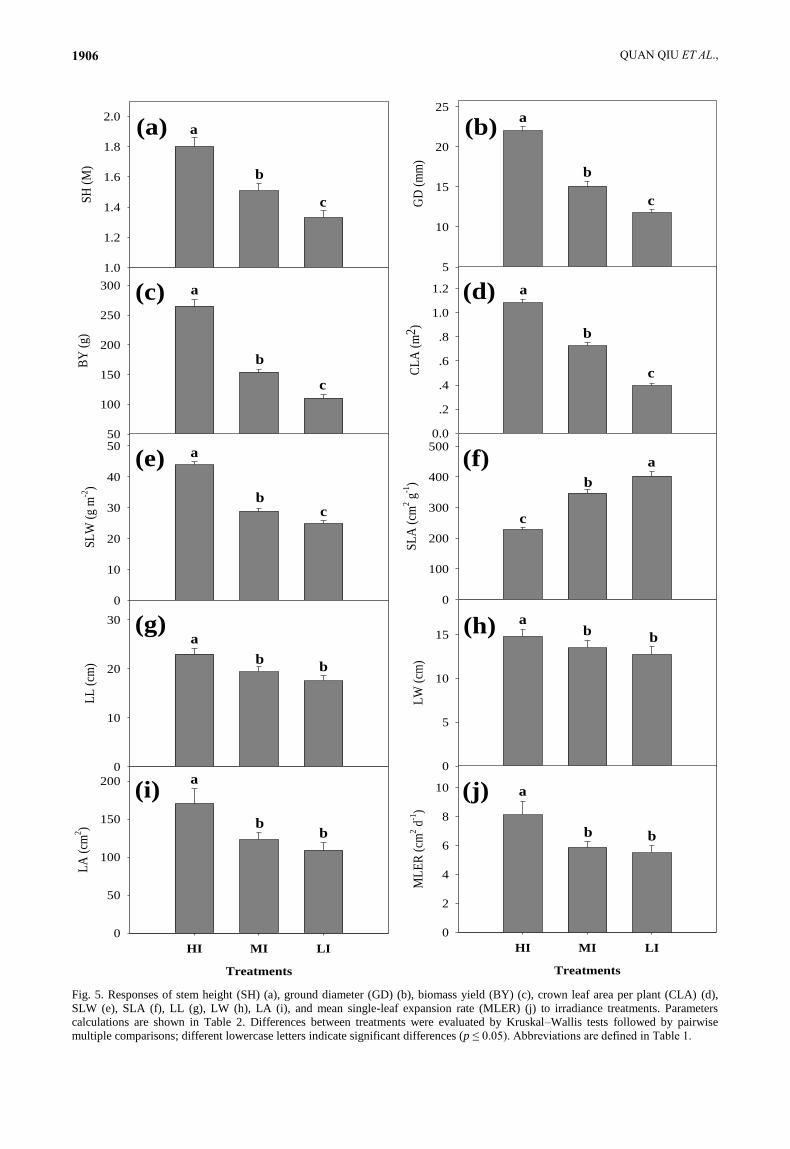
Physiological response: Gas exchange parameters Fv/Fm,
LN, and SPAD all exhibited continuous change during the
experimental period (Figs. 3c–j). The physiological
parameters all responded significantly to irradiance
treatments (Table 2), and their responses varied (Fig. 6).
Pn (Fig. 6a), Cond (Fig. 6b), and Ci (Fig. 6c) decreased
significantly with decreasing irradiance. Tr (Fig. 6d),
WUEi (Fig. 6e), and δ13C (Fig. 6f) initially decreased (MI
vs. HI) and then remained constant (LI vs. MI) as
irradiance decreased. Fv/Fm (Fig. 4g) initially remained
constant (MI vs. HI) and then decreased (LI vs. MI) with
decreasing irradiance. LN (Fig. 4h) initially increased (MI
vs. HI) and then remained constant (LI vs. MI) with
decreasing irradiance. MI had similar SPAD values to HI,
but lower values than LI (Fig. 6i). MI had [NSC]leaf levels
that were higher than HI (Fig. 4j), but similar to LI.
[NSC]stem (Fig. 4k) and [NSC]root (Fig. 6l) generally
initially increased (MI vs. HI) and then remained constant
(LI vs. MI) as irradiance decreased.
Phenotypic plasticity: PPI values of the examined traits
are listed in Table 2. There were strong and weak
responses to irradiance among all variables analysed
(ranging from 0.11 to 0.69), and the order of the average
PPI for each trait group was as follows: growth (0.44) >
morphology (0.37) > physiology (0.28). Within the
growth trait group, BY (0.58) and GD (0.46) had
relatively higher PPI than SH (0.24). Among the
morphological parameters, LL (0.24) and LW (0.14) had
lower PPI than the other parameters (ranging from 0.32 to
0.63). There was a high degree of variation in the
phenotypic plasticity of physiological parameters
responding to irradiance, with PPI values of gas exchange
parameters (i.e. Pn, Cond, Tr, and WUEi; > 0.3) being
higher than those of Ci, δ13C, Fv/Fm, SPAD, LN,
[NSC]leaf, [NSC]stem, and [NSC]root (< 0.3).
Relationships among plant traits: There were diverse
correlations among the growth and morphophysiological
parameters (Table 3). In general, there were significant
positive correlations among parameters for growth,
morphology (except SLA), gas exchange, δ13C, and
Fv/Fm; however, these were all significantly negatively
correlated with SLA, LN, and SPAD. In addition, there
were significant positive correlations among [NSC] in
different organs; however, they showed different
correlations with the remaining parameters. For example,
[NSC]leaf generally presented no significant correlation
with other parameters (except Ci and Fv/Fm); [NSC]stem
was generally significantly negatively correlated with
parameters for growth, morphology (except SLA), gas
exchange (except Ci), δ13C, and Fv/Fm, but significantly
positively correlated with SLA, LN, and SPAD, and was
non-significantly correlated with Ci; [NSC]root generally
exhibited significant negative correlations with
parameters for growth, morphology (except SLA), gas
exchange, δ13C, and Fv/Fm, but was positively
correlated with SLA, LN, and SPAD.
Table 2. Results of Kruskal–Wallis tests of irradiance effects and phenotypic plasticity indices (PPIs) of plant traits.
Group Trait Measurement interval Calculation p value PPI
Growth
SH 15 d End of experiment < 0.001 0.26
GD 15 d End of experiment < 0.001 0.46
BY End of experiment End of experiment < 0.001 0.58
Mean / / / 0.44
Morphology
CLA End of experiment < 0.001 0.63
SLW June, July, August (June + July + August)/3 < 0.001 0.43
SLA June, July, August (June + July + August)/3 < 0.001 0.43
LL July, August (July + August)/2 < 0.001 0.24
LW July, August (July + August)/2 < 0.001 0.14
LA July, August (July + August)/2 < 0.001 0.36
MLER July, August (July + August)/2 < 0.001 0.32
Mean / / / 0.37
Physiology
Pn June, July, August (June + July + August)/3 < 0.001 0.69
Cond June, July, August (June + July + August)/3 < 0.001 0.41
Ci June, July, August (June + July + August)/3 < 0.001 0.16
Tr June, July, August (June + July + August)/3 < 0.001 0.50
WUEi June, July, August (June + July + August)/3 < 0.001 0.33
δ13C August August < 0.001 0.11
Fv/Fm June, July, August (June + July + August)/3 < 0.001 0.22
LN June, July, August (June + July + August)/3 < 0.001 0.17
SPAD June, July, August (June + July + August)/3 < 0.001 0.05
[NSC]root End of experiment End of experiment < 0.001 0.12
[NSC]stem End of experiment End of experiment < 0.001 0.28
[NSC]leaf End of experiment End of experiment < 0.001 0.29
Mean / / / 0.28 Mean: mean PPI values for each trait group. LL, LW, LA, and MLER values were recorded at the end of leaf expansion.
Abbreviations are defined in Table 1
QUAN QIU ET AL., 1904
SL
W (
g m
-2)
20
25
30
35
40
45
50
55
HI
MI
LI
SL
A (
cm2 g
-1)
150
200
250
300
350
400
450
500
Pn
(m
olC
O2
m-2
s-1
)
2
4
6
8
10
12
14
Con
d (m
olH
2O m
-2 s
-1)
.15
.20
.25
.30
.35
.40
.45
Ci
(m
olC
O2
mol
-1)
220
240
260
280
300
320
340
360
380
400
Tr
(mm
ol H
2O m
-2 s
-1)
1
2
3
4
5
6
WU
Ei
(m
olC
O2
mm
ol-1
H2O
)
.5
1.0
1.5
2.0
2.5
3.0
3.5
4.0
Month
June July August
LN
(g
kg-1
)
20
25
30
35
40
45
50
Fv/
Fm
.60
.65
.70
.75
.80
.85
Month
June July August
SP
AD
30
35
40
45
50
(a) (b)
(c) (d)
(e) (f)
(g) (h)
(i) (j)
Fig. 3 Monthly dynamics of specific leaf weight (SLW) (a), specific leaf area (SLA) (b), net photosynthetic rate (Pn) (c), stomatal
conductance (Cond) (d), intercellular CO2 concentration (Ci) (e), transpiration rate (Tr) (f), instantaneous water use efficiency (WUEi) (g),
maximum quantum yield of PSII (Fv/Fm) (h), leaf nitrogen concentration (LN) (i), and Soil and Plant Analysis Development (SPAD) (j)
under different irradiance treatments. Data represent means ± standard deviation (SD). Abbreviations are defined in Table 1.
EFFECTS OF IRRADIANCE ON GROWTH AND MORPHOPHYSIOLOGY IN CATALPA BUNGEI 1905
LL
(cm
)
0
5
10
15
20
25
30
HI
MI
LI
LW
(cm
)
0
5
10
15
LL
(cm
)
0
5
10
15
20
25
30
Days after the beginning of leaf expansion
0 3 6 9 12 15 18 21 24
LA
(cm
2)
0
50
100
150
200
250
300
LW
(cm
)
0
5
10
15
Days after the beginning of leaf expansion
0 3 6 9 12 15 18 21 24
LA
(cm
2)
0
50
100
150
200
250
300
(a) (b)
(c) (d)
(e) (f)
Fig. 4. Temporal dynamics of leaf length (LL) (a), maximum leaf width (LW) (c), and LA (e) in July and LL (b), LW (d), and leaf
area (LA) (f) in August during leaf expansion under different irradiance treatments. Data represent means ± SD. Abbreviations are
defined in Table 1.
Discussion
Our results showed that there were significant
differences among PPI values for trait groups in C.
bungei plantlets in response to irradiance (i.e. growth:
0.44; morphology: 0.37; physiology: 0.28), which can be
mainly attributed to asynchronous adjustment (Hallik et
al., 2012). For example, when morphological
adjustments are relatively slow and occur after leaf
maturation, major structural rearrangements may not be
possible due to rigidified cell walls (Yamashita et al.,
2002). Relatively slow physiological adjustments have
been shown to result mainly from lower PPI values for
leaf N, chlorophyll content, and NSC reserves in
seedlings rather than gas exchange parameters (Oguchi
et al., 2005, 2006); our results are consistent with these
findings, such that qualitative adjustments in leaf
photosynthetic capacity occurred more rapidly in
response to irradiance. Overall, growth and
photosynthetic capacity, represented by leaf area (LA
and CLA), MLER, SLW, and SLA, responded more
rapidly to irradiance than the other morphological traits,
whereas most physiological traits (except gas exchange
parameters) exhibited a narrower range of responses.
QUAN QIU ET AL., 1906
Treatments
HI MI LI
SH
(M
)
1.0
1.2
1.4
1.6
1.8
2.0
Treatments
HI MI LI
GD
(m
m)
5
10
15
20
25
Treatments
HI MI LI
BY
(g)
50
100
150
200
250
300
Treatments
HI MI LI
CL
A (
m2 )
0.0
.2
.4
.6
.8
1.0
1.2
Treatments
HI MI LI
SL
W (
g m
-2)
0
10
20
30
40
50
Treatments
HI MI LI
SL
A (
cm2 g
-1)
0
100
200
300
400
500
Treatments
HI MI LI
LL
(cm
)
0
10
20
30
Treatments
HI MI LI
LW
(cm
)
0
5
10
15
Treatments
HI MI LI
LA
(cm
2 )
0
50
100
150
200
Treatments
HI MI LI
ML
ER
(cm
2 d-1
)
0
2
4
6
8
10
(a) (b)
(c) (d)
(e) (f)
(g) (h)
(i) (j)
a
b
c
a
b
c
a
b
c
a
b
c
a
bc
a
bb
ab
b
a
bb
a
b b
c
b
a
Fig. 5. Responses of stem height (SH) (a), ground diameter (GD) (b), biomass yield (BY) (c), crown leaf area per plant (CLA) (d),
SLW (e), SLA (f), LL (g), LW (h), LA (i), and mean single-leaf expansion rate (MLER) (j) to irradiance treatments. Parameters
calculations are shown in Table 2. Differences between treatments were evaluated by Kruskal–Wallis tests followed by pairwise
multiple comparisons; different lowercase letters indicate significant differences (p ≤ 0.05). Abbreviations are defined in Table 1.
EFFECTS OF IRRADIANCE ON GROWTH AND MORPHOPHYSIOLOGY IN CATALPA BUNGEI 1907
Treatments
HI MI LI
Pn
(
mo
lCO
2 m
-2 s
-1)
0
2
4
6
8
10
12
14
Treatments
HI MI LI
Co
nd
(m
olH
2O
m-2
s-1)
0.0
.1
.2
.3
.4
.5
TreatmentsHI MI LI
Ci
( m
olC
O2
mol-1
)
200
250
300
350
400
HI MI LI
Tr
(mm
ol
H2O
m-2
s-1)
0
2
4
6
HI MI LI
WU
Ei
( m
olC
O2 m
mol-1
H2O
)
0
1
2
3
HI MI LI
C
(‰
)
-32
-30
-28
-26
-24
HI MI LI
Fv/F
m
0.0
.2
.4
.6
.8
1.0
HI MI LI
LN
(g k
g-1
)
20
25
30
35
40
45
HI MI LI
SP
AD
30
35
40
45
Treatments
HI MI LI
[NS
C]l
eaf
(mg
g-1
)
0
50
100
150
Treatments
HI MI LI
[NS
C]s
tem
(m
g g
-1)
0
50
100
150
200
250
Treatments
HI MI LI
[NS
C]r
oo
t (m
g g
-1)
0
100
200
300
a a
b
(a) (b) (c)
(d) (e) (f)
(g) (h) (i)
(j) (k) (l)
a
b
c
a
b
c
ab
c
a
b
b
a
bb
a
b
b
b
aa
bab
a
ab b
a
b
aa
b
a
Fig. 6. Responses of Pn (a), Cond (b), Ci (c), Tr (d), WUEi (e), leaf carbon isotope composition (δ13C) (f), Fv/Fm (g), LN (h), SPAD
(i), NSC concentration in leaves ([NSC]leaf) (j), NSC concentration in stems ([NSC]stem) (k), and NSC concentration in roots ([NSC]root)
(l) to irradiance treatments. Parameter calculations are provided in Table 2. Differences between treatments were evaluated using
Kruskal–Wallis tests followed by pairwise multiple comparisons; different lowercase letters indicate significant differences (p≤0.05).
In several studies, plants exhibited varied
ecophysiological responses to cope with shade (Dai et al.,
2009; Díaz-Barradas et al., 2018). Dai et al., (2009)
reported that shade limited light interception and carbon
assimilation, and led to decreased plant growth; similarly,
we also observed lower growth levels (represented by SH,
GD, and BY) in plantlets grown in shade, which we
attribute to the loss of photosynthetic capacity (positive
relationship shown in Table 3) and carbohydrate
metabolism and allocation strategy. It is widely accepted
that environmental stress-induced variability in leaf
photosynthesis can be mediated by stomatal closure
(stomatal limitation) and caused by non-stomatal
limitations (Ni & Pallardy, 1992; Broeckx et al., 2014). In
the current study, we observed that light shade (MI)
induced a decrease in light interception and stomatal
limitation (Cond and Ci both decreased with decreasing
irradiance; SPAD and Fv/Fm maintained relatively high
levels; Fig. 6) and a decrease in Pn. In contrast, extreme
shade (LI) induced a greater loss of photosynthetic capacity
due to a combined mechanism of stomatal and nonstomatal
limitations, as suggested by the decreases in Cond, Ci, and
Fv/Fm; in particular, lower Fv/Fm values suggest that
leaves that developed in severe shade exhibited lower PSII
photochemical efficiency (Fig. 6g), caused by the response
of plants to an imbalance between energy absorbed and
utilized through photosynthesis when there is an increased
employment of photoprotective energy dissipation (Huner
et al., 1998). Numerous studies have demonstrated that
leaves grown in shade are generally characterised by lower
photosynthetic capacity, lower N content per unit leaf area,
higher pigment content per unit leaf dry mass, and higher
SLA (Niinemets, 2007; 2010; Dai et al., 2009; Hallik et al.,
2012). In the present study, plantlets grown in shade (MI
and LI) also exhibited smaller leaves (CLA and LA),
slower MLER, higher pigment content, lower
photosynthetic capacity (SLW and Pn), and greater SLA.
Leaves developed in shade produce enlarged light-
harvesting structures and increased chlorophyll content,
thus capturing more photons and enhancing light
interception (Hallik et al., 2012). Hallik et al., (2012)
suggested that dry-mass-based N content was unrelated to,
or increased, with decreasing irradiance, and it appears that
leaf N content responses to irradiance are species-
QUAN QIU ET AL., 1908
dependent. Notably, our data indicate that shade induced
higher leaf N concentration, which might be explained by
N allocation. Cruz (1997) previously found that N was
preferentially allocated to laminae under reduced irradiance,
with more N allocated to improve leaf chlorophyll
synthesis and thus promote photosynthetic capacity. In contrast, Myers & Kitajima (2007) reported that
carbohydrate storage could enhance plant shade and stress tolerance; our data also showed that plantlets grown in shade (MI and LI) generally exhibited higher or similar NSC concentrations in all organs than HI plantlets, suggesting that they maintained greater NSC reserves for physiological metabolism and defence when subjected to insufficient photosynthate supply. Based on the disparate responses of growth and NSC reserves, we speculated that plantlets allocate resources to survival (increasing NSC reserves for metabolism and defence) rather than growth (reduction of carbon investment for growth). Consistent with a previous observation that tree survival time was determined by a carbon utilisation strategy during drought (Doughty et al., 2015), a carbon utilisation strategy could explain how plantlets grown under long-term severe shade can survive. Barbaroux et al., (2003) also reported that the allocation of carbohydrate reserves to roots and shoots varies among tree species, and is determined by NSC allocation and storage strategy. Differences in NSC reserves in response to irradiance between organs were detected in our study; inconsistent with roots and stems, leaves developed in LI could not maintain similar levels of NSC reserves to leaves developed in MI, and this result may be due to the NSC translocation strategy. We suggest that LI plantlets subjected to serious NSC supply deficiency tended to allocate more NSC to stems and roots to guarantee absorption and transport.
We measured WUEi and WUEl (δ13C) in plantlets
according to their responses to irradiance, and observed
that these parameters exhibited a significant positive
relationship, and similar responses, to irradiance, i.e.
WUEi and WUEl losses were induced by shade (MI and
LI), as previously reported by Berry et al., (1997),
providing evidence that shade induced a reduction in
WUE. This result could be explained by differences in the
degree of impact of irradiance on Pn and Tr; shade
induced a greater reduction in carbon assimilation (Pn)
than water consumption (Tr).
As was previously observed in clone 9-1 (Wu et al.,
2017), we found that shade greatly decreased growth, BY,
leaf area (LA and CLA), and photosynthetic capacity; in
contrast, shade increased SLA and chlorophyll content
(SPAD) in clone 008-1, further demonstrating that C.
bungei is an intolerant tree species: ca. 30–50% shade
induced a significant loss of growth. Thus, we
recommend that an appropriate initial stand density be
determined in afforestation planning, and that accurate
thinning should be conducted to control stand density. Wu
et al., (2017) observed that the growth and morphology of
clone 9-1 exhibited a narrow response to irradiance (PPI:
0.20–0.23). However, our data indicate that the growth
and morphology of clone 008-1 showed greater responses
to irradiance (PPI: 0.28–0.44), further demonstrating that
clone 008-1 is more susceptible to light limitation. Future
studies should explore differences in shade tolerance and
irradiance responses between more C. bungei clones.
Ta
ble
3. P
earso
n’s
corre
lati
on
co
effi
cie
nts
for g
row
th a
nd
mo
rp
ho
ph
ysi
olo
gic
al
para
mete
rs.
Ab
brevia
tio
ns
are
def
ined
in
Ta
ble
1. P
ara
mete
r c
alc
ula
tio
ns
are
pro
vid
ed
in
Ta
ble
2.
Va
ria
ble
G
D
BY
C
LA
S
LW
S
LA
L
L
LW
L
A
ME
R
Pn
C
on
d
Ci
Tr
WU
Ei
δ1
3C
F
v/F
m
LN
S
PA
D
[NS
C] l
ea
f [N
SC
] ste
m
[NS
C] r
oot
SH
0
.963
**
0.9
53
**
0.9
54
**
0.9
41
**
–0.9
52
**
0.8
77
**
0.7
19
**
0.8
61
**
0.8
29
**
0.9
49
**
0.9
08
**
0.8
67
**
0.9
12
**
0.8
27
**
0.8
48
**
0.7
28
**
–0.9
04
**
–0.7
37
**
0.1
50
–0.6
19
**
–0.6
54
**
GD
0.9
85
**
0.9
72
**
0.9
81
**
–0.9
84
**
0.9
02
**
0.7
09
**
0.8
93
**
0.8
66
**
0.9
85
**
0.9
35
**
0.8
80
**
0.9
44
**
0.8
67
**
0.9
02
**
0.7
23
**
–0.9
45
**
–0.7
01
**
0.0
96
–0.6
65
**
–0.7
01
**
BY
0
.969
**
0.9
86
**
–0.9
85
**
0.8
79
**
0.6
80
**
0.8
70
**
0.8
45
**
0.9
91
**
0.9
18
**
0.8
67
**
0.9
64
**
0.8
45
**
0.8
90
**
0.6
89
**
–0.9
42
**
–0.7
36
**
0.0
39
–0.6
80
**
–0.7
14
**
CL
A
0
.949
**
–0.9
73
**
0.8
79
**
0.6
82
**
0.8
53
**
0.8
13
**
0.9
58
**
0.9
51
**
0.9
44
**
0.9
49
**
0.8
42
**
0.9
24
**
0.8
26
**
–0.9
34
**
–0.7
64
**
0.2
53
–0.5
42
**
–0.5
82
**
SL
W
–0.9
92
**
0.8
83
**
0.6
77
**
0.8
93
**
0.8
76
**
0.9
88
**
0.9
10
**
0.8
29
**
0.9
44
**
0.8
57
**
0.8
75
**
0.6
28
**
–0.9
26
**
–0.7
28
**
0.0
03
–0.7
29
**
–0.7
72
**
SL
A
–
0.8
79
**
–0.6
70
**
–0.8
83
**
–0.8
56
**
–0.9
82
**
–0.9
33
**
–0.8
79
**
–0.9
46
**
–0.8
67
**
–0.9
02
**
–0.7
02
**
0.9
23
**
0.7
59
**
–0.1
13
0.6
58
**
0.7
05
**
LL
0
.916
**
0.9
61
**
0.9
49
**
0.8
79
**
0.8
58
**
0.8
00
**
0.8
55
**
0.7
46
**
0.8
02
**
0.6
80
**
–0.8
87
**
–0.6
60
**
0.0
39
–0.6
36
**
–0.5
81
**
LW
0.8
71
**
0.8
68
**
0.6
87
**
0.6
77
**
0.6
20
**
0.6
66
**
0.5
63
**
0.6
06
**
0.5
38
**
–0.7
25
**
–0.5
26
**
–0.0
39
–0.4
96
**
–0.4
13
*
LA
0
.996
**
0.8
79
**
0.8
35
**
0.7
43
**
0.8
58
**
0.7
30
**
0.7
75
**
0.6
01
**
–0.8
41
**
–0.6
30
**
–0.0
06
–0.7
03
**
–0.6
61
**
ME
R
0
.859
**
0.7
99
**
0.6
89
**
0.8
35
**
0.7
01
**
0.7
37
**
0.5
34
**
–0.8
16
**
–0.5
94
**
–0.0
78
–0.7
37
**
–0.6
89
**
Pn
0.9
06
**
0.8
48
**
0.9
62
**
0.8
66
**
0.8
82
**
0.6
64
**
–0.9
38
**
–0.7
09
**
0.0
09
–0.7
07
**
–0.7
47
**
Cond
0
.902
**
0.9
14
**
0.7
42
**
0.8
61
**
0.7
60
**
–0.8
65
**
–0.7
22
**
0.2
38
–0.4
99
**
–0.5
67
**
Ci
0.8
52
**
0.7
99
**
0.9
05
**
0.9
10
**
–0.8
45
**
–0.7
67
**
0.4
44
*
–0.3
54
–0.3
85
*
Tr
0
.729
**
0.8
65
**
0.6
94
**
–0.9
07
**
–0.6
95
**
0.0
54
–0.6
50
**
–0.6
69
**
WU
Ei
0.8
07
**
0.6
45
**
–0.8
16
**
–0.6
85
**
0.1
32
–0.5
56
**
–0.6
16
**
δ1
3C
0.7
96
**
–0.9
19
**
–0.6
27
**
0.3
01
–0.4
66
**
–0.5
18
**
Fv/F
m
–0.7
03
**
–0.6
11
**
0.6
65
**
–0.0
99
–0.0
96
LN
0.6
25
**
–0.0
64
0.6
38
**
0.6
51
**
SP
AD
–
0.1
97
0.4
27
*
0.4
19
*
[NS
C] l
eaf
0
.480
**
0.4
76
**
[NS
C] s
tem
0.8
65
**
* a
nd *
* i
ndic
ate
p ≤
0.0
5 a
nd
p ≤
0.0
1, re
spec
tivel
y;
n =
30
EFFECTS OF IRRADIANCE ON GROWTH AND MORPHOPHYSIOLOGY IN CATALPA BUNGEI 1909
Conclusions
Various irradiance treatments induced significant and
different changes in the growth (PPI = 0.44), morphology
(PPI = 0.37), and physiology (PPI = 0.28) of C. bungei
plantlets. Shade (MI and LI) reduced growth, BY, leaf
area (CLA), newly emerged leaf expansion rate (MLER),
size at the end of expansion (LL, LW, and LA), SLW, Pn,
Cond, CI, Tr, and WUE (WUEi and δ13C), and greatly
increased SLA, LN, and SPAD. MI and HI had similar
Fv/Fm values, but LI values were significantly lower.
Shaded plantlets generally exhibited higher or similar
NSC concentrations in all organs than HI plantlets.
Generally, as irradiance decreased, all growth traits
decreased linearly, but morphological and physiological
traits exhibited varying dynamics. Overall, irradiance was
an important driving factor controlling growth,
morphology, and physiology in C. bungei. C. bungei
could cope with shade through morphophysiological
adjustments, i.e. increasing SLA, leaf chlorophyll
concentration, and NSC reserves (especially in stems and
roots); however, shade (ca. 30–50% full sunlight) still
induced significant decreases in plantlet growth due to
photosynthesis restriction (MI: stomatal closure; LI:
stomatal closure and lower PSII efficiency) and a change
in NSC allocation strategy (maintenance metabolism and
survival rather than growth investment). This study
provides a basis for effective density control planning in
C. bungei plantations.
Acknowledgements
This work was supported by the National Key R&D
Program of China (2017YFD0600604; 2017YFD0600
60404).
References
Ahemd, H.A., A.A. Al-Faraj and A.M. Abdel-Ghany. 2016.
Shading greenhouses to improve the microclimate, energy
and water saving in hot regions: a review. Sci. Hort., 201:
36-45.
Avramov, S., D. Pemac and B. Tucić. 2007. Phenotypic
plasticity in response to an irradiance gradient in Iris
Pumila: adaptive value and evolutionary constraints. Plant
Ecol., 190: 275-290.
Barbaroux, C., N. Bréda and E. Dufrêne. 2003. Distribution of
above-ground and below-ground carbohydrate reserves in
adult trees of two contrasting broad-leaved species
(Quercus petraea and Fagus sylvatica). New Phytol., 157:
605-615.
Berry, S.C., G.T. Varney and L.B. Flanagan.1997. Leaf δ13C in
Pinus resinosa trees and understory plants: variation
associated with light and CO2 gradients. Oecologia, 109:
499-506.
Bidartondo, M.I., B. Burghardt, G. Gebauer, T.D. Bruns and D.J.
Read. 2004. Changing partners in the dark: isotopic and
molecular evidence of ectomycorrhizal liaisons between
forest orchids and trees. P. Roy. Soc. B–Biol. Sci., 271:
1799-1806.
Broeckx, L.S., R. Fichot, M.S. Verlinden and R. Ceulemans.
2014. Seasonal variations in photosynthesis, intrinsic
water-use efficiency and stable isotope composition of
poplar leaves in a short-rotation plantation. Tree Physiol.,
34: 701-715.
Chmura, D.J., J. Modrzyński, P. Chmielarz and M.G. Tjoelker.
2017. Plasticity in seedling morphology, biomass allocation
and physiology among ten temperate tree species in
response to shade is related to shade tolerance and not leaf
habit. Plant Biol., 19: 172-182.
Cruz, P. 1997. Effect of shade on the carbon and nitrogen
allocation in a perennial tropical grass, Dichanthium
aristatum. J. Exp. Bot., 48: 15-23.
Dai, Y.J., Z.G. Shen, L. Ying, L.L. Wang, D. Hannaway and
H.F. Lu. 2009. Effects of shade treatments on the
photosynthetic capacity, chlorophyll fluorescence, and
chlorophyll content of Tetrastigma hemsleyanum Diels et
Gilg. Environ. Exp. Bot., 65: 177-182.
Díaz-Barradas, M.C., M. Zunzunegui, L. Alvarez-Cansino, M.P.
Esquivias, J. Valera and H. Rodríguez. 2018. How do
mediterranean shrub species cope with shade?
ecophysiological response to different light intensities.
Plant Biol., 20: 296-306.
Doughty, C.E., D.B. Metcalfe, C.A.J. Girardin, F.F. Amézquita,
D.G. Cabrera, W.H. Huasco, J.E. Silva-Espejo, A. Araujo-
Murakami, M.C. da Costa and W. Rocha. 2015. Drought
impact on forest carbon dynamics and fluxes in Amazonia.
Nature, 519: 78-82.
Farquhar, G.D., J.R. Ehleringer and K.T. Hubick. 1989. Carbon
isotope discrimination and photosynthesis. Ann. Rev. Plant
Physiol. Plant Mol. Biol., 40: 503-537.
Flanagan, L.B. and G.D. Farquhar. 2014. Variation in the carbon
and oxygen isotope composition of plant biomass and its
relationship to water-use efficiency at the leaf- and
ecosystem-scales in a northern Great Plains grassland.
Plant Cell Environ., 37: 425-438.
Hallik, L., U. Niinemets and O. Kull. 2012. Photosynthetic
acclimation to light in woody and herbaceous species: a
comparison of leaf structure, pigment content and
chlorophyll fluorescence characteristics measured in the
field. Plant Biol., 14: 88-99.
Hieke, S., C.M. Menzel and P. Lüdders. 2002. Effects of light
availability on leaf gas exchange and expansion in lychee
(Litchi chinensis). Tree Physiol., 22: 1249-1256.
Huner, N.P.A., G. Öquist and F. Sarhan. 1998. Energy balance and
acclimation to light and cold. Trends Plant Sci., 3: 224-230.
Jarcuska, B. and M. Barna. 2011. Plasticity in above-ground
biomass allocation in Fagus sylvatica L. saplings in
response to light availability. Ann. For. Res. 54: 151-160.
Lu, R.K. 2000. Analytical methods of soil agricultural chemistry.
Beijing: China Agricultural Science and Technology Press,
pp 12-18, 106, 146-194 (in Chinese).
Luo, Z.B., C. Calfapietra, M. Liberloo, G. Scarascia-Mugnozza
and A. Polle. 2006. Carbon partitioning to mobile and
structural fractions in poplar wood under elevated CO2
(EUROFACE) and N fertilization. Global Change Biol., 12:
272-283.
Maguire, A.J and R.K. Kobe. 2016. Drought and shade deplete
nonstructural carbohydrate reserves in seedlings of five
temperate tree species. Ecol. Evol., 5: 5711-5721.
Mcausland, L., S. Vialet-Chabrand, P. Davey, N.R. Baker, O.
Brendel and T. Lawson. 2016. Effects of kinetics of light-
induced stomatal responses on photosynthesis and water-
use efficiency. New Phytol., 211: 1209-1220.
McDowell, N.G. 2011. Mechanisms linking drought, hydraulics,
carbon metabolism, and vegetation mortality. Plant
Physiol., 155: 1051-1059.
Moraes, G.A.B.K., A.R.M. Chaves, S.C.V. Martins, R.S. Barros
and F.M. Damatta. 2010. Why is it better to produce coffee
seedlings in full sunlight than in the shade? a
morphophysiological approach. Photosynthetica, 48: 199-207.
QUAN QIU ET AL., 1910
Murphy, M.R.C., G.J. Jordan and T.J. Brodribb. 2012.
Differential leaf expansion can enable hydraulic
acclimation to sun and shade. Plant Cell Environ., 35:
1407-1418.
Myers, J.A. and K. Kitajima. 2007. Carbohydrate storage
enhances seedling shade and stress tolerance in a
neotropical forest. J. Ecol., 95: 383-395.
Ni, B.R. and S.G. Pallardy. 1992. Stomatal and nonstomatal
limitations to net photosynthesis in seedlings of woody
angiosperms. Plant Physiol., 99: 1502-1508.
Niinemets, Ü. 2007. Photosynthesis and resource distribution
through plant canopies. Plant Cell Environ., 30: 1052-1071.
Niinemets, Ü. 2010. A review of light interception in plant
stands from leaf to canopy in different plant functional
types and in species with varying shade tolerance. Ecol.
Res., 25: 693-714.
Oguchi, R., K. Hikosaka and T. Hirose. 2005. Leaf anatomy as a
constraint for photosynthetic acclimation: differential
responses in leaf anatomy to increasing growth irradiance
among three deciduous trees. Plant Cell Environ., 28: 916-927.
Oguchi, R., K. Hikosaka, T. Hiura and T. Hirose. 2006. Leaf
anatomy and light acclimation in woody seedlings after gap
formation in a cool-temperate deciduous forest. Oecologia,
149: 571-582.
Piper, F.I. and A. Fajardo. 2016. Carbon dynamics of Acer
pseudoplatanus seedlings under drought and complete
darkness. Tree Physiol., 36: 1400-1408.
Poorter, L. and K. Kitajima. 2007. Carbohydrate storage and
light requirements of tropical moist and dry forest tree
species. Ecol., 88: 1000-1011.
Qiu, Q., Q. He, J.H. Wang, Y. Su, J.W. Ma, J.W. Wu and J.Y.
Li. 2016. Interactions between soil water and fertilizer on
leaf photosynthesis and δ13C of Catalpa bungei seedlings.
Dendrobiology, 76: 25-34.
Singh, B. and G. Singh. 2006. Effects of controlled irrigation on
water potential, nitrogen uptake and biomass production in
Dalbergia sissoo seedlings. Environ. Exp. Bot., 55: 209-219.
Valladares, F., E. Martinez-Ferri, L. Balaguer, E. Perez-Corona
and E. Manrique. 2000. Low leaf-level response to light and
nutrients in mediterranean evergreen oaks: a conservative
resource-use strategy?. New Phytol., 148: 79-91.
Wang, J., H.J. Huang., S. Jia, X.M. Zhong., F.H. Li., K.Y.
Zhang and Z.S. Shi. 2017. Photosynthesis and chlorophyll
fluorescence reaction to different shade stresses of weak
light sensitive maize. Pak. J. Bot., 49: 1681-1688.
Wu, J.W., J.Y. Li, Y. Su, Q. He, J.H. Wang, Q. Qiu and J.W.
Ma. 2017. A morphophysiological analysis of the effects of
drought and shade on Catalpa bungei plantlets. Acta
Physiol. Plant., 39: 80. https://doi.org/ 10.1007/s11738-
017-2380-2.
Yamashita, N., N. Koike and A. Ishida. 2002. Leaf ontogenetic
dependence of light acclimation in invasive and native
subtropical trees of different successional status. Plant Cell
Environ., 25: 1341-1356.
Yang, Y., X. Yi, M. Peng and Y. Zhou. 2012. Stable carbon and
nitrogen isotope signatures of root-holoparasitic
Cynomorium songaricum and its hosts at the Tibetan
plateau and the surrounding Gobi desert in China. Isot.
Environ. Healt. S., 48: 483-493.
Yao, Z., C. Xu, Y. Chai and H. We. 2014. Effect of light
intensities on the photosynthetic characteristics of Abies
holophylla seedlings from different provenances. Ann. For.
Res., 57: 181-192.
Yeh, D.M. and J.G. Atherton. 1999. Effects of irradiance on
growth and flowering in the shade plant, cineraria. Ann.
App. Biol., 134: 329-334.
Zheng, H.F., X. Zhang, W.J. Ma, J. Song, S.U. Rahman, J.H.
Wang and Y. Zhang. 2017. Morphological and
physiological responses to cyclic drought in two
contrasting genotypes of Catalpa bungei. Environ. Exp.
Bot., 138: 77-87.
Zheng, Y.L., Y.L. Feng, W.X. Liu and Z.Y. Liao. 2009. Growth,
biomass allocation, morphology, and photosynthesis of
invasive Eupatorium adenophorum and its native congeners
grown at four irradiances. Plant Ecol., 203: 263-271.
Zhu, X.B., Y.M. Liu and S.C. Sun. 2005. Leaf expansion of the
dominant woody species of three deciduous oak forests in
Nanjing, east China. Acta Phytoecologica Sinica, 29: 128-
136 (in Chinese).
Zou, Q. 1995. Guidance of plant physiological and biochemical
experiments. China Agriculture Press, Beijing, pp 53-55 (in
Chinese).
(Received for publication 1 November 2018)


![Inter-hour direct normal irradiance forecast with multiple ... · ahead solar irradiance forecast [11, 12] and long-term solar irradiance estimation [13]. However, for an inter-hour](https://img.dokumen.tips/doc/110x75/5f43655640b4404ee374a6b6/inter-hour-direct-normal-irradiance-forecast-with-multiple-ahead-solar-irradiance.jpg)