Embed Size (px)
Citation preview
International Journal of Arts and Commerce ISSN 1929-7106 www.ijac.org.uk
84
Effects of Integrated Cassava Value Chain Intervention on Socio Economic Development of
Smallholder Farmers in Rongo District Kenya.
Raphael Mwiti Gikunda
Chuka University
Godffrey Nyongesa Nato
Technical University of Mombasa
Samuel Obino Mokaya
Jomo Kenyatta University of Agriculture and Technology Kenya
Abstract
Value chain development has become a key approach in both research and policy fields, with an increasing
number of bilateral and multilateral aid organizations adopting it to guide their development interventions.
AICAD/JICA-Project supported by the three East African States of Kenya, Uganda and Tanzania together
with Japan International Cooperation Agency, adopted this approach to improve the livelihoods of the
farming communities living in Rongo District of Migori County. The communities used to grow a lot of
cassava which was however, wiped out by African Cassava Mosaic Disease in 1980s. Although, farmers
resorted to maize and sugarcane farming, the yields were low due to the poor soils, lack of finances to
purchase adequate farm inputs and presence of striga weed; a parasitic plant that has devastating effect on
the yield of cereal crops. The project was aimed at re-introducing cassava crop in the District and
empowering the community on how to produce, process, utilize and market its products for poverty
alleviation and socio-economic development. The study, was conducted to assess the effects of the project
intervention on the socio-economic development of the farmers, involved a sample of 40 beneficiaries
obtained through stratified proportionate random sampling. Descriptive and inferential statistical tools
were used to analyze the collected data with the aid of SPSS computer programme. The results show that
besides a significant increase in the average acreage under cassava ( from 0.4 acres to 0.98), the
production, processing and marketing interventions had a positive and significant effects on the
socioeconomic indicators among the small holders farmers.
Key Words: value chain interventions, socio-economic impact, livelihood, disease resistant cassava,
smallholder.
Introduction
Value chain interventions have become increasingly popular as a development tool. In recent years, a range
of organizations are employing value chain tools includes donors such as the Deutsche Gesellschaft für
Technische Zusammenarbit (GTZ) and the United States Agency for International Development (USAID).
According to Ruijter, Elliott, & Hitchings (2006), a value chain describes the full range of activities required
to bring a product from conception to its end use and beyond. This includes activities such as design,
production, marketing, distribution and support to the final consumer. Henriksen et al (2010) contends that
value chain development has become a key approach in both research and policy fields, with an increasing
number of bilateral and multilateral aid organizations adopting it to guide their development interventions.
International Journal of Arts and Commerce Vol. 2 No. 5 May 2013
85
Cassava represents a major food crop in Africa where it provides a livelihood for millions of smallholders.
In developed countries, cassava is mainly imported to manufacture animal feed and starch. For instance,
Thailand grows cassava primarily for export to European markets for animal feed manufacture. In Africa,
about 70% of cassava is produced for human consumption (CIAT, 2002). In West Africa, cassava is mainly
consumed as gari. This accounts for about 70% of cassava consumption in Nigeria, 40% in Ghana and 30%
in the Ivory Coast (Dorosh, 1989). Cassava is grown virtually throughout Kenya. However, the Western,
Coastal and semi-arid (Eastern) regions of Kenya have the highest production in that order (Njeru and
Munga, 2003). Cassava (Manihot esculenta Crantz) is second only to maize in importance in western and
coastal regions of Kenya. The country produces 600,000 MT annually with farmers realizing yield between
7-9 MT/Ha (FAO, 2004). Nangayo et al., (2007) indicate that major studies conducted on cassava at the end
of the 20th century have predicted the growing importance of this crop in Africa’s economic development.
Communities living in Rongo District of Migori County used to grow a lot of cassava. However, it was
wiped out by African Cassava Mosaic Disease (ACMD) between 1984 and 1990 (Thresh, et al., 1997).
Farmers resorted to maize and sugarcane farming for their livelihoods. However, due to the poor soils and
lack of resources to purchase fertilizers, the maize yields have never been impressive. This is compounded
by the presence of striga weed in the area, a parasitic plant that has devastating effect on the yield of cereal
crops. Consequently, proceeds from sugarcane are relatively low and intermittent. It is due to these
challenges that AICAD initiated and implemented a project between 2007 and 2012 to restore cassava
production in the District.
The project aimed at empowering the community to produce, process, utilize and market the crop as well as
its products for poverty alleviation and socio-economic development. Two selected TMS varieties
(MM95/0193 and MH95/0183) that are of high yielding and adaptable to the local conditions were acquired
from Agricultural Training Centre in Kisii in 2010 screened and bulked. The cassava cuttings were
distributed after Ten months to farmers in the District. The farmers were empowered at various stages of the
cassava value chain ranging from production, post harvest, processing, utilization and marketing through
training programmes, demonstrations, field days, exhibitions and market survey. The study therefore aimed
at establishing the socioeconomic impact of the crop’s value chain interventions.
Study Area
The survey was conducted in Rongo District of Migori County in western province. It involved 40 cassava
farmers, who benefited from the interventions, spread within four administrative locations namely West
Kamagambo, East Kamagambo, North Sakwa and West Sakwa.
Methods and methods
The study adopted a survey research design. The sample of 40 small scale farmers was selected from four
administrative locations of Rongo District through stratified proportionate random sampling. The survey
employed a structured questionnaire which captured information relating to farmer’s characteristics, cassava
production, income levels, processing, utilization, marketing and community empowerment in general.
Descriptive and inferential statistical tools were used to analyze the collected data with the aid of Statistical
Package for Social Sciences computer programme. The mean, frequencies and percentages were used to
describe the variable characteristics while multiple regression was run to analyze the contribution of the
interventions on the socioeconomic development in the area.
International Journal of Arts and Commerce ISSN 1929-7106 www.ijac.org.uk
86
Results and Discusion
Demographic characteristics
The study involved a sample distribution of 53% female farmers and 47% male. This implies that more
women are engaged in cassava production than men. Majority of the respondents (52%) were aged between
20 and 49 years. The mean family size was 9 persons per household. The distribution of the respondent by
their literacy status shows that 78% of the respondents had attained primary education, 20% had attained
secondary education and 2% had attained college education. The average land size per farmer was 5.181
acres, meaning that all the farmers had adequate land to expand the production of the crop.
Adoption of Cassava Value Chain Technologies
The study sought to establish the level of adoption of appropriate cassava value chain technologies among
the beneficiaries. According to the results in Table 1, 83% of the respondents had cultivated cassava crop in
less than half an acre before the implementation of the project while 65% had cultivated the crop in a piece
of land, between 1 and 3 acres after its implementation. The average acreage under cassava crop increased
from 0.4 acres before the project to 0.98 after its implementation.
Table 1: Land under cassava crop
Land Size (acres) Land under cassava crop (before
project)
Land under cassava crop (now)
Frequency percent Frequency percent
0.000 7 17.5 1 2.5
0.125 4 10.0 0 0
0.250 12 30.0 3 7.5
0.500 10 25.0 10 25.0
1.000 6 15.0 19 47.5
1.500 1 2.5 2 5.0
2.000 0 0 3 7.5
2.500 0 0 1 2.5
3.000 0 0 1 2.5
Total 40 100.0 40 100.0
Mean acreage =0.4000 mean acreage =0 .98125
Application of Farming Systems
The production interventions which were exposed to farmers include crop rotation and appropriate
agronomic practices such as timely land preparation, planting recommended cultivars, weeding and pest
control practices. The findings are presented in Table 2. According to the results crop rotation was being
practiced by 70% of the respondents (before the project) as compared to 80% who are currently practicing it.
Only 15% of the respondents were practicing mono cropping before implementation of the project as
compared to the current 80%. Agro forestry was being practiced by 18% of the respondents as compared to
current 55%. Only 13% of the respondents were practicing organic farming before project as compared to
53% who are practicing it at present. Generally, the number of farmers applying appropriate farming
systems has been on the increase since the initiation of the project.

International Journal of Arts and Commerce Vol. 2 No. 5 May 2013
87
Table 2: Application of the recommended farming systems
Before implementation
Farming Systems Farmers practicing Farmers not practicing
Frequency Percent Frequency Percent
Crop rotation 28 70.0 12 30.0
Mono cropping 6 15.0 34 85.0
Agro forestry 7 17.5 33 82.5
Organic farming 5 12.5 35 87.5
After implementation
Crop rotation 32 80.0 8 20.0
Mono cropping 32 80.0 8 20.0
Agro forestry 22 55.0 18 45.0
Organic farming 21 52.5 19 47.5
Application of Recommended Agronomic Practices
The application of recommended agronomic practices was also assessed. According to the results in Table 3,
the number of farmers practicing timely land preparation increased from 45% before the project was
implemented to 88% after implementation, those practicing timely planting increased from 38% to 95%,
those using recommended planting material rose from 28% to 98%, those applying timely weeding
increased from 20% to 100% and those practicing timely disease & pest control increased from 28% to 98%.
This shows that there was a general improvement in the application of the recommended practices as a result
of the implementation of the project.
Table 3: Application of recommended agronomic practices
Before implementation
Agronomic practices Farmers practicing Farmers not practicing
Frequency Percent Frequency Percent
Timely land preparation 18 45.0 22 55.0
Timely planting 15 37.5 25 62.5
Recommended planting material 11 27.5 29 72.5
Timely weeding 8 20.0 32 80.0
Timely disease & pest control 11 27.5 29 72.5
After implementation
Timely land preparation 35 87.5 5 12.5
Timely planting 38 95.0 2 5.0
Recommended planting material 39 97.5 1 2.5
Timely weeding 40 100.0 0 0
Timely disease & pest control 39 97.5 1 2.5
Application of Processing Technologies
When asked to indicate whether they were processing cassava into various products, 12% indicated they
were not while 88% were processing as shown in Figure 1. This shows that majority of the respondents were
already practicing the processing technologies they had been trained on.
International Journal of Arts and Commerc
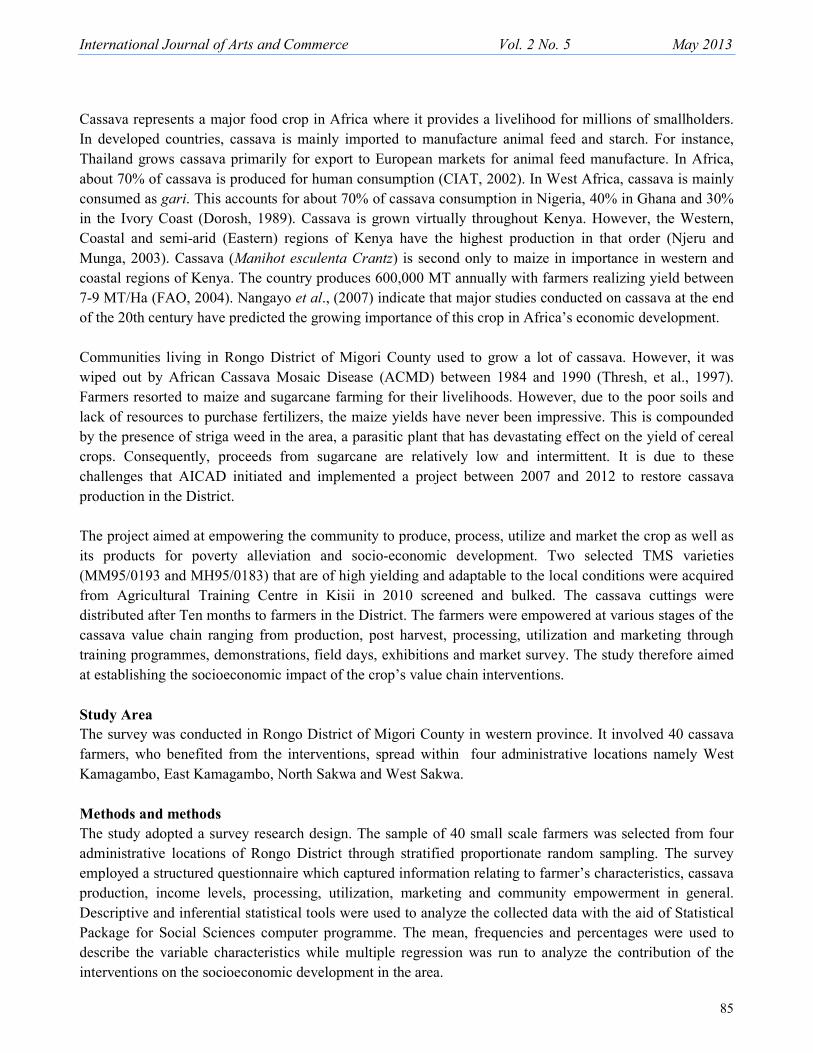
Cassava Processed Products
The respondents were further asked to in
illustrated in Figure 1, 95% were process
cassava into cakes, 30% were processing t
scones and 20% were processing their cass
processing their cassava into cassava flour.
Figure 1: Processed cassava product
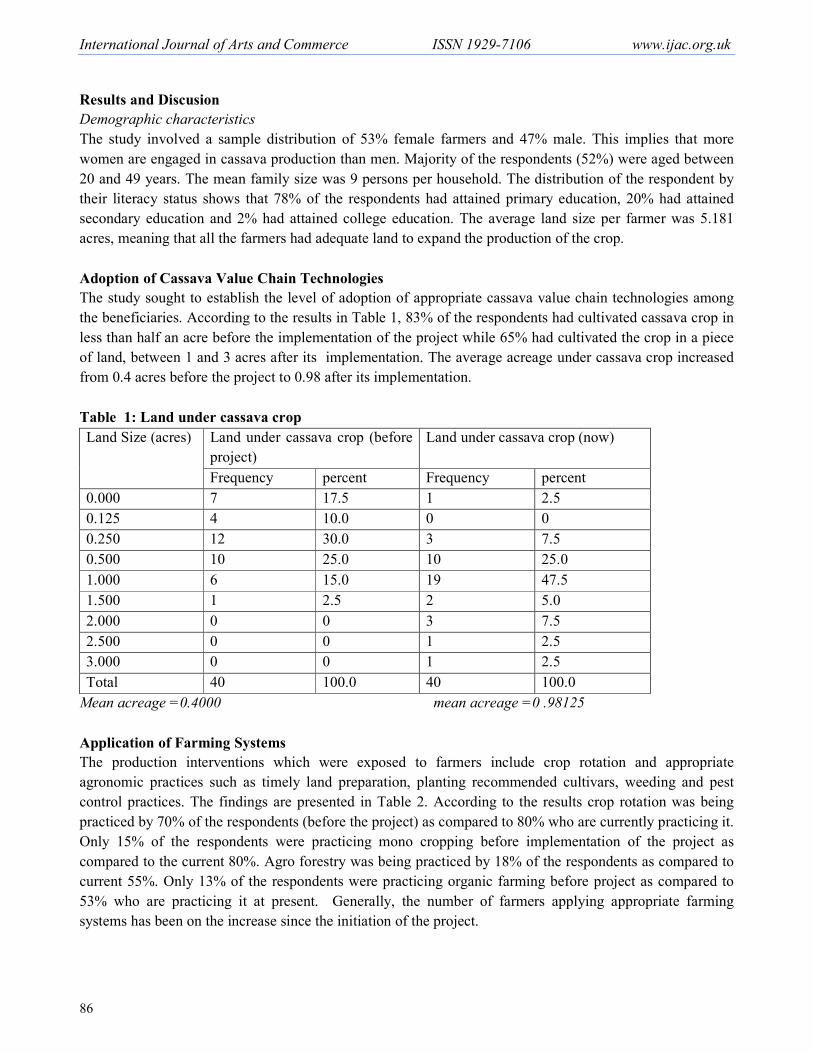
Packaging of Cassava Products
When asked to indicate whether they pack
45% were not as shown in Figure 2. This
after they had been trained on the same.
Figure 2: Percentage of farmers packagin
Application of Marketing Technologies
The target farmers had been trained on mar
of adoption of these technologies. Among
market survey and exhibition.
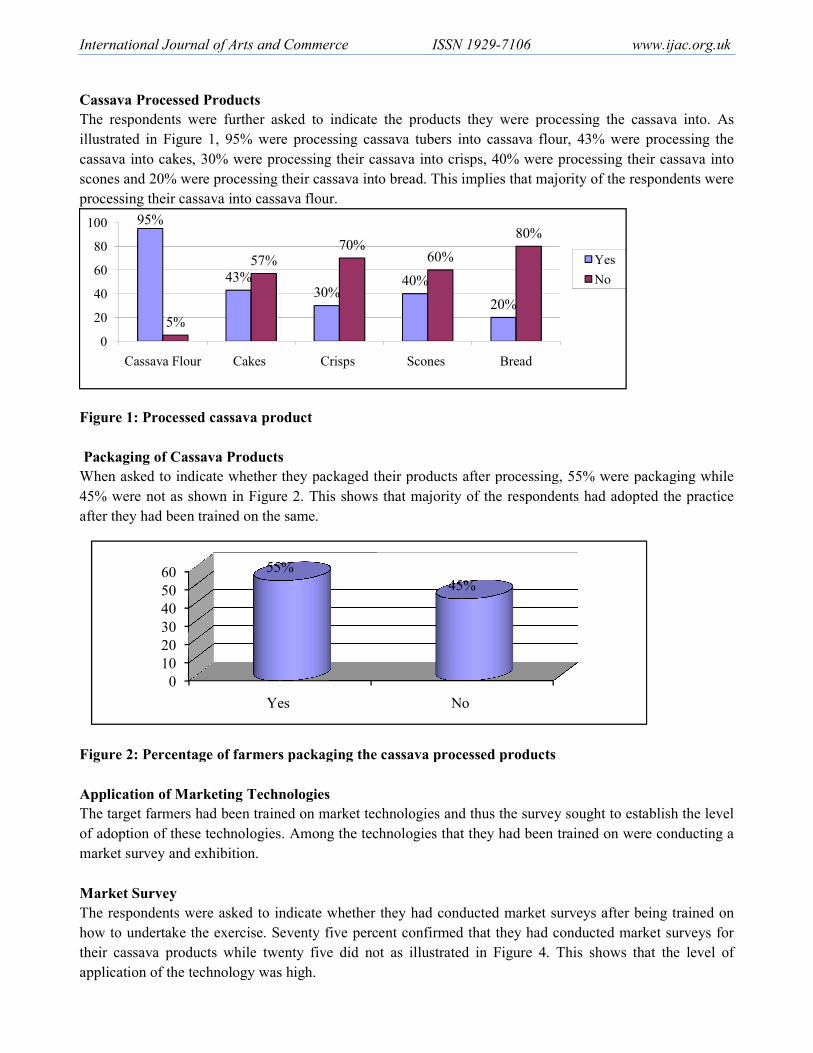
Market Survey
The respondents were asked to indicate wh
how to undertake the exercise. Seventy fiv
their cassava products while twenty fiv
application of the technology was high.
95%
43%30%
5%
57%
0
20
40
60
80
100
Cassava Flour Cakes
0
10
20
30
40
50
60
Yes
55%
Commerce ISSN 1929-7106
r asked to indicate the products they were processing the
ere processing cassava tubers into cassava flour, 43% we
processing their cassava into crisps, 40% were processing
ng their cassava into bread. This implies that majority of the
assava flour.
er they packaged their products after processing, 55% were
. This shows that majority of the respondents had ad
the same.
ers packaging the cassava processed products
chnologies
ained on market technologies and thus the survey sought to
ies. Among the technologies that they had been trained on w
o indicate whether they had conducted market surveys afte
. Seventy five percent confirmed that they had conducted m
twenty five did not as illustrated in Figure 4. This shows
30%40%
20%
70%60%
80%
Crisps Scones Bread
Yes
No
No
45%
www.ijac.org.uk
ocessing the cassava into. As
our, 43% were processing the
e processing their cassava into
ajority of the respondents were
g, 55% were packaging while
dents had adopted the practice
ey sought to establish the level
n trained on were conducting a
surveys after being trained on
conducted market surveys for
. This shows that the level of
Yes
No
International Journal of Arts and Commerc
Figure 3: Percentage of farmers conduct
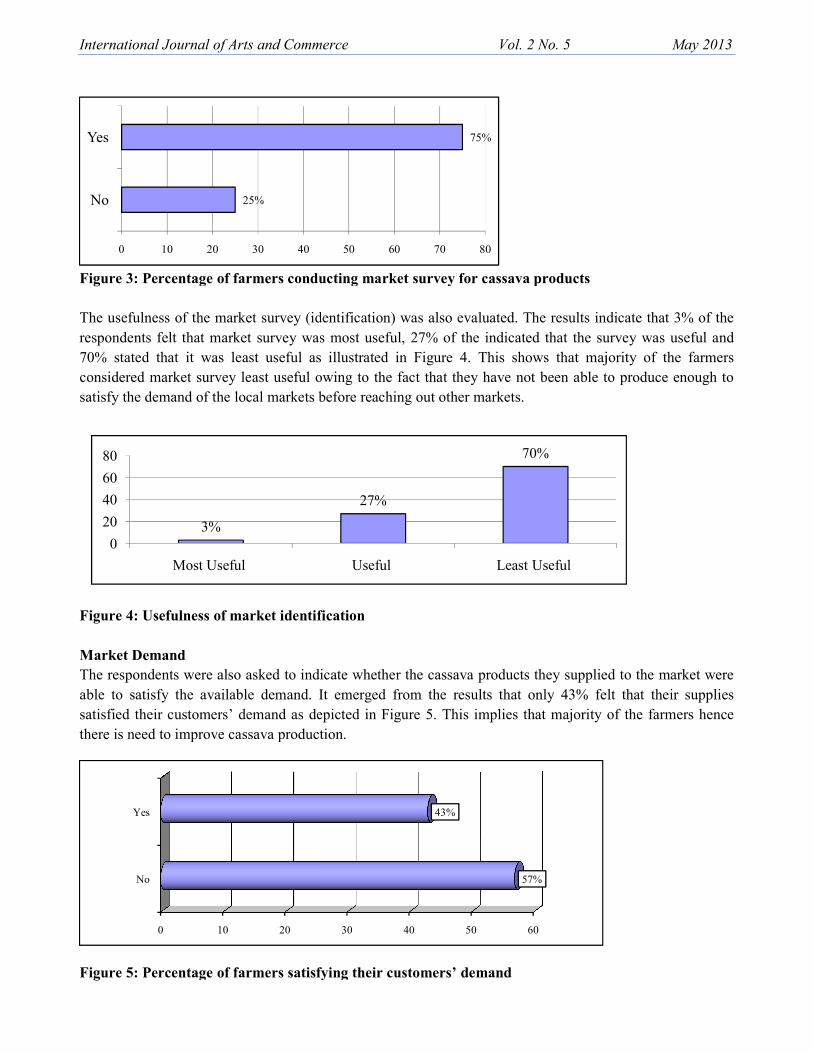
The usefulness of the market survey (ident
respondents felt that market survey was
70% stated that it was least useful as ill
considered market survey least useful owin
satisfy the demand of the local markets befo
Figure 4: Usefulness of market identifica
Market Demand
The respondents were also asked to indicat
able to satisfy the available demand. It e
satisfied their customers’ demand as depic
there is need to improve cassava production
Figure 5: Percentage of farmers satisfyin
25%
0 10 20 30 40
No
Yes
0 10 20
No
Yes
3%
0
20
40
60
80
Most Useful
Commerce Vol. 2 No. 5
ers conducting market survey for cassava products
ey (identification) was also evaluated. The results indic
urvey was most useful, 27% of the indicated that the surve
seful as illustrated in Figure 4. This shows that majori
t useful owing to the fact that they have not been able to p
markets before reaching out other markets.
et identification
ed to indicate whether the cassava products they supplied to
demand. It emerged from the results that only 43% felt t
and as depicted in Figure 5. This implies that majority of
va production.
ers satisfying their customers’ demand
75%
50 60 70 80
30 40 50 60
57%
43%
27%
70%
Useful Least Useful
May 2013
results indicate that 3% of the
hat the survey was useful and
that majority of the farmers
een able to produce enough to
ey supplied to the market were
y 43% felt that their supplies
majority of the farmers hence
International Journal of Arts and Commerce ISSN 1929-7106 www.ijac.org.uk
90
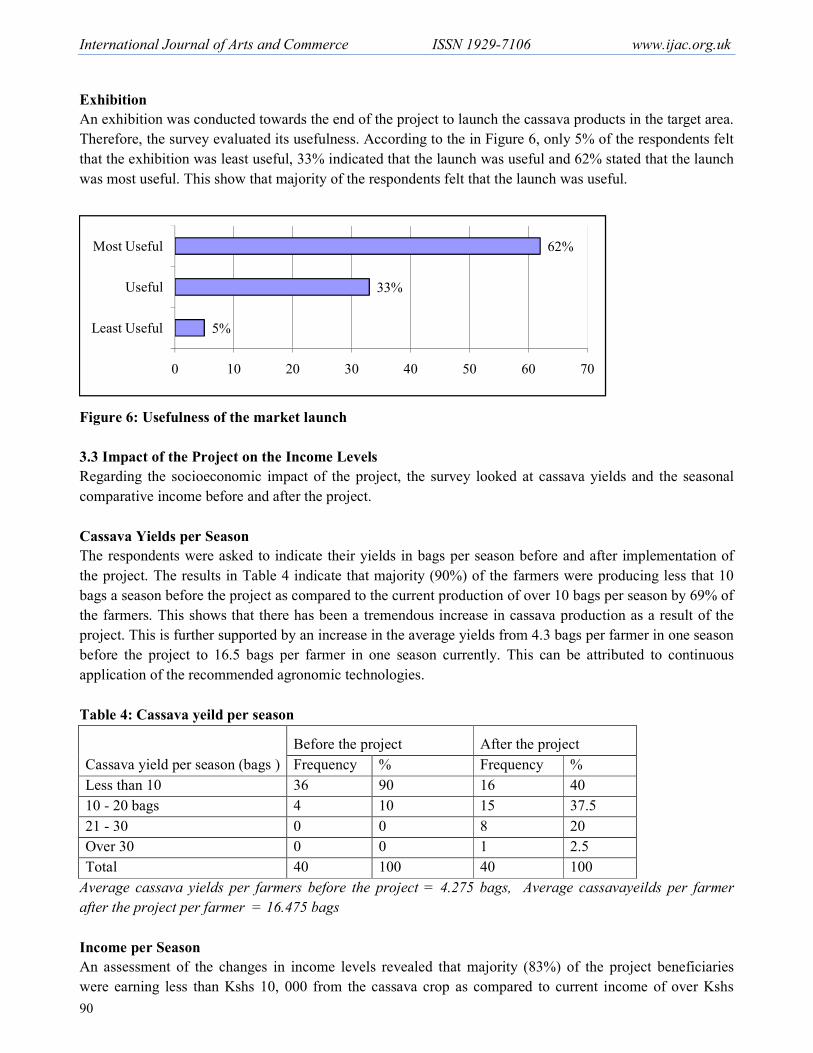
Exhibition
An exhibition was conducted towards the end of the project to launch the cassava products in the target area.
Therefore, the survey evaluated its usefulness. According to the in Figure 6, only 5% of the respondents felt
that the exhibition was least useful, 33% indicated that the launch was useful and 62% stated that the launch
was most useful. This show that majority of the respondents felt that the launch was useful.
Figure 6: Usefulness of the market launch
3.3 Impact of the Project on the Income Levels
Regarding the socioeconomic impact of the project, the survey looked at cassava yields and the seasonal
comparative income before and after the project.
Cassava Yields per Season
The respondents were asked to indicate their yields in bags per season before and after implementation of
the project. The results in Table 4 indicate that majority (90%) of the farmers were producing less that 10
bags a season before the project as compared to the current production of over 10 bags per season by 69% of
the farmers. This shows that there has been a tremendous increase in cassava production as a result of the
project. This is further supported by an increase in the average yields from 4.3 bags per farmer in one season
before the project to 16.5 bags per farmer in one season currently. This can be attributed to continuous
application of the recommended agronomic technologies.
Table 4: Cassava yeild per season
Cassava yield per season (bags )
Before the project After the project
Frequency % Frequency %
Less than 10 36 90 16 40
10 - 20 bags 4 10 15 37.5
21 - 30 0 0 8 20
Over 30 0 0 1 2.5
Total 40 100 40 100
Average cassava yields per farmers before the project = 4.275 bags, Average cassavayeilds per farmer
after the project per farmer = 16.475 bags
Income per Season
An assessment of the changes in income levels revealed that majority (83%) of the project beneficiaries
were earning less than Kshs 10, 000 from the cassava crop as compared to current income of over Kshs
5%
33%
62%
0 10 20 30 40 50 60 70
Least Useful
Useful
Most Useful

International Journal of Arts and Commerc
10,000 earned most (85%) of the farmers a
increased from Kshs 5,760 before the proje
increase in income which can be attributed
Table 5: Income per season
Income per season
Before
Frq
Less than 10,000 33
10,001 - 20,000 7
20,001 - 30,000 0
30,001 - 40,000 0
40,001 - 50,000 0
Over 50,000 0
Total 40
Mean income per season before the projec
31,475
Food Security
When asked to indicate the level in which
secure as a result of increased cassava p
(97%) confirmed that the increased produc
percentage of respodents who confirmed th
in the community.
Figure 7: Food security issue
3.4 Social Empowerment
The third objective sought to determine t
Rongo model region. The survey mainly
activities as well as the benefits.
Participation in Group Activities
When asked to indicate whether their parti
beggining of the project, majority (90%) o
while 10% stated that it had declined
0 10
Strongly
Disagree
Agree
Strongly
Agreed
3%
Commerce Vol. 2 No. 5
the farmers as shown in Table 9. The mean income per farm
fore the project to Kshs 31,475 after implementation. This sh
be attributed to the increased production.
Before the project After the project
% Frq %
82.5 6 15
17.5 11 27.5
0 5 12.5
0 3 7.5
0 9 22.5
0 6 15
100 40 100
he project = Kshs 5,760. Mean income per season after t
vel in which they agreed with the opinion that the commun
ed cassava production attributable to the project, majority
eased production had boosted the food security status. Figure
confirmed that the project had impacted positively on the fo
determine the effects of the Project on social empowerm
urvey mainly focused on the group formation, participat
er their participation in the project activities increased or de
rity (90%) of the respodents confirmed that their participat
ined as illustrated in Figure 9. When asked to indicat
20 30 40 50
43%
54
May 2013
me per farmer in a season had
ation. This shows an incredible
27.5
12.5
22.5
100
on after the project = Kshs
the community was now food
ct, majority of the respodents
status. Figure 12 illustrates the
ely on the food security status
l empowerment of farmers in
n, participation in communal
creased or decreased since the
eir participation had increased
ed to indicate what led to the
60
54%
International Journal of Arts and Commerc
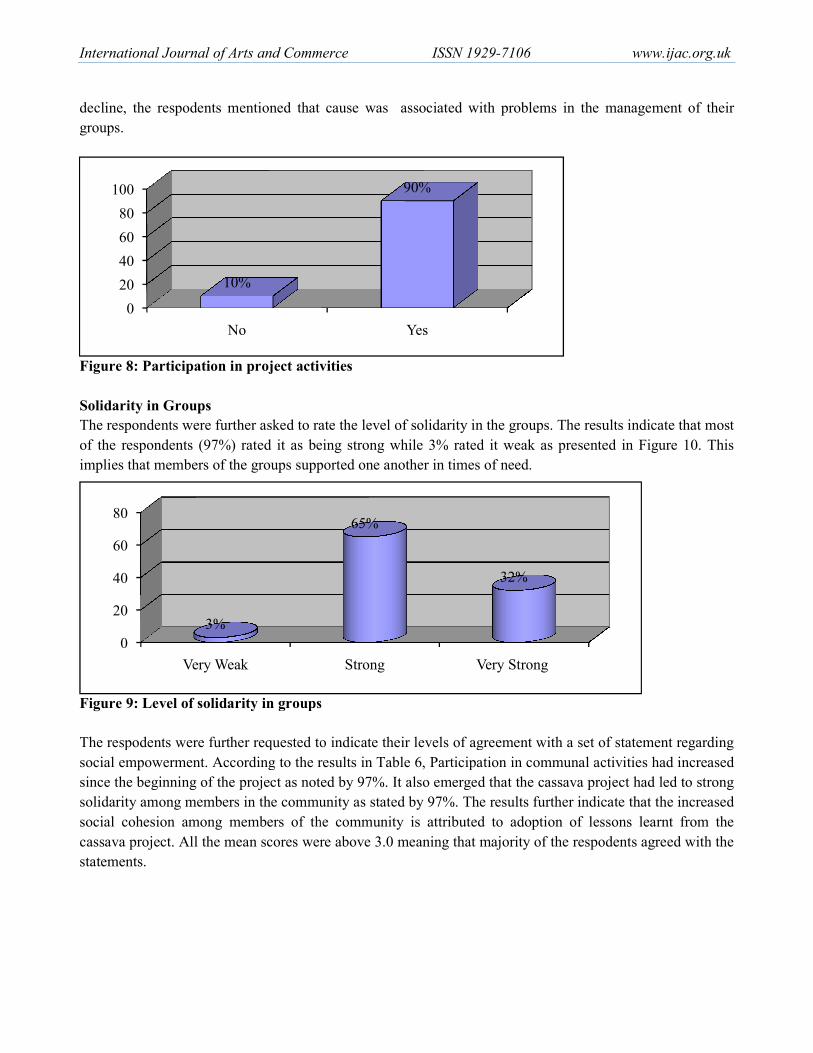
decline, the respodents mentioned that ca
groups.
Figure 8: Participation in project activiti
Solidarity in Groups
The respondents were further asked to rate
of the respondents (97%) rated it as being
implies that members of the groups support
Figure 9: Level of solidarity in groups
The respodents were further requested to in
social empowerment. According to the resu
since the beginning of the project as noted
solidarity among members in the communit
social cohesion among members of the c
cassava project. All the mean scores were a
statements.
0
20
40
60
80
100
No
10%
0
20
40
60
80
Very Weak
3%
Commerce ISSN 1929-7106
oned that cause was associated with problems in the man
activities
asked to rate the level of solidarity in the groups. The results
d it as being strong while 3% rated it weak as presented i
oups supported one another in times of need.
in groups
quested to indicate their levels of agreement with a set of st
ng to the results in Table 6, Participation in communal activi
ject as noted by 97%. It also emerged that the cassava projec
the community as stated by 97%. The results further indicate
bers of the community is attributed to adoption of lesson
scores were above 3.0 meaning that majority of the respoden
Yes
90%
Strong Very Strong
65%
32%
www.ijac.org.uk
s in the management of their
. The results indicate that most
s presented in Figure 10. This
ith a set of statement regarding
munal activities had increased
ssava project had led to strong
rther indicate that the increased
on of lessons learnt from the
the respodents agreed with the

International Journal of Arts and Commerce Vol. 2 No. 5 May 2013
93
Table 6: Social capital
Statement/ item Strongly
Disagree
Disagree Agree Strongly
Agree
Mean
Fq % Fq % Fq % Fq %
Participation in communal activities
has increased since the beginning of the
project
1 2.5 0 0 17 42.5 22 55.0
3.50
The Cassava Project has led to strong
solidarity among members in the
community
1 2.5 0 0 16 40 23 57.5
3.53
The increased social cohesion among
members of the community is
attributed to adoption of lessons learnt
from the cassava project
1 2.5 0 0 19 47.5 20 50.0
3.45
Contribution of Value Chain Interventions to Socioeconomic Development
The study had hypothesized that production; processing and marketing cassava interventions are capable of
propelling socioeconomic development in Rongo District.
Regression Analysis
Regression analysis was run to determine how each independent variable (production intervention,
processing interventions, and marketing interventions) affects the dependent variable (socio economic
development).
The regression model is summarized as;
Y = B1+x1(PI) + x2(PRI) + x3(MI)
Where; Y is Socioeconomic development, PI is production interventions, PRI is processing intervention, and
MI is marketing interventions. B1 is Alpha while x1, x2 and x3 are constants.
According to study findings in Table 7, cassava production; processing and marketing cassava interventions
accounts for 63% (R-Square, 0.629) of variation in socioeconomic development in Rongo District. The
estimation of socioeconomic development using this model had an error margin of 0.4517%.
Table 7: Model Summary
Model R R Square Adjusted R Square Std. Error of the Estimate
1 0.793(a) 0.629 0.598 0.4517
Predictors: (constant) Production intervention, processing interventions, marketing interventions
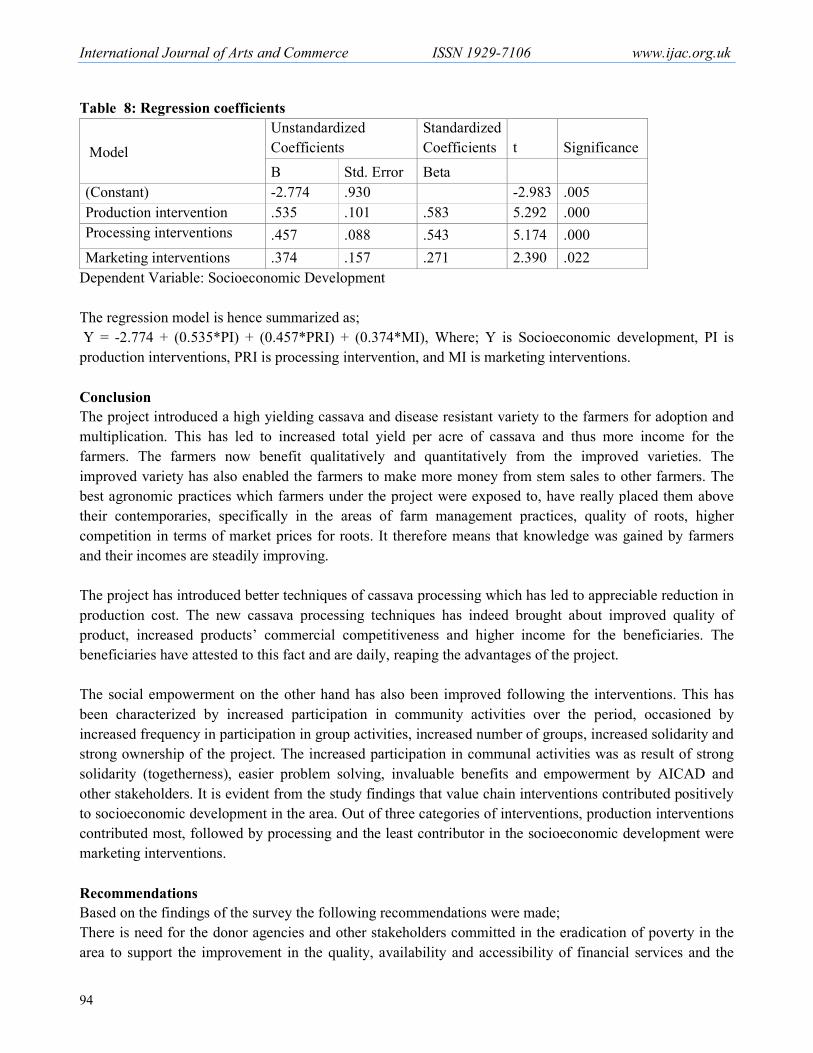
The findings (Table 8) further indicate that an increase in score by one unit of production, processing and
marketing interventions would increase socioeconomic development by 0.535, 0.457 and 0.374 respectively.
This shows that production interventions contributed most, followed by processing and the least contributor
in the socioeconomic development were marketing interventions. It is also important to note that all the
independent variables have positive effects on dependent variable.
International Journal of Arts and Commerce ISSN 1929-7106 www.ijac.org.uk
94
Table 8: Regression coefficients
Model
Unstandardized
Coefficients
Standardized
Coefficients t Significance
B Std. Error Beta
(Constant) -2.774 .930 -2.983 .005
Production intervention .535 .101 .583 5.292 .000
Processing interventions .457 .088 .543 5.174 .000
Marketing interventions .374 .157 .271 2.390 .022
Dependent Variable: Socioeconomic Development
The regression model is hence summarized as;
Y = -2.774 + (0.535*PI) + (0.457*PRI) + (0.374*MI), Where; Y is Socioeconomic development, PI is
production interventions, PRI is processing intervention, and MI is marketing interventions.
Conclusion
The project introduced a high yielding cassava and disease resistant variety to the farmers for adoption and
multiplication. This has led to increased total yield per acre of cassava and thus more income for the
farmers. The farmers now benefit qualitatively and quantitatively from the improved varieties. The
improved variety has also enabled the farmers to make more money from stem sales to other farmers. The
best agronomic practices which farmers under the project were exposed to, have really placed them above
their contemporaries, specifically in the areas of farm management practices, quality of roots, higher
competition in terms of market prices for roots. It therefore means that knowledge was gained by farmers
and their incomes are steadily improving.
The project has introduced better techniques of cassava processing which has led to appreciable reduction in
production cost. The new cassava processing techniques has indeed brought about improved quality of
product, increased products’ commercial competitiveness and higher income for the beneficiaries. The
beneficiaries have attested to this fact and are daily, reaping the advantages of the project.
The social empowerment on the other hand has also been improved following the interventions. This has
been characterized by increased participation in community activities over the period, occasioned by
increased frequency in participation in group activities, increased number of groups, increased solidarity and
strong ownership of the project. The increased participation in communal activities was as result of strong
solidarity (togetherness), easier problem solving, invaluable benefits and empowerment by AICAD and
other stakeholders. It is evident from the study findings that value chain interventions contributed positively
to socioeconomic development in the area. Out of three categories of interventions, production interventions
contributed most, followed by processing and the least contributor in the socioeconomic development were
marketing interventions.
Recommendations
Based on the findings of the survey the following recommendations were made;
There is need for the donor agencies and other stakeholders committed in the eradication of poverty in the
area to support the improvement in the quality, availability and accessibility of financial services and the

International Journal of Arts and Commerce Vol. 2 No. 5 May 2013
95
development of modern financial institutions and sustainable microfinance operations. This will boost
access to financial services and hence an expansion of cassava production, processing and marketing.
The survey recommends that donor agencies should establish a link between the cassava processing machine
fabricators and the farmers to ensure that enable them access the machines and after sale services when need
arises.
Although most farmers in the model region consider farming as a business, emphasis should be put towards
encouraging the farmers to keep records in order to monitor the progress of their enterprises. This will
enable the farmers determine what, when and how to produce.
There is need for the donor agencies to replicate the project in other areas with similar climatic conditions as
Rongo to ensure that more people in the country are food secure and also to uplift their living standards.
References
Centro Internacional de Agricultura Tropical (CIAT) (2002): Adding Value to Root and Tuber Crops. A
Manual on Product Development. Colombia: Centro Internacional de Agricultura Tropical.
Dorosh, P. (1989): Economics of Cassava in Africa. In: Sarma, J.S. (Ed.) (1989): Summary Proceedings of a
Workshop on Trends and Prospects of Cassava in the Third World. Washington: IFPRI.
FAO. (2004). FAO online statistical database. Rome, Italy (www.fao.org)
Henriksen L.F., Riisgaard L., Ponte S., Hartwich F., Kormawa P. (2010) Agro-Food Value Chain
Interventions in Asia. A review and analysis of case studies. Working Paper December 2010. IFAD.
Nang’ayo, F., Omanya, G., Bokanga, M., Odera, M., Muchiri, N., Ali, Z., and Werehire, P. (eds). 2007. A
strategy for industrialization of cassava in Africa: Proceedings of a small group meeting 14-18 Nov, 2005.
Ibadan, Nigeria. Nairobi, Kenya
Njeru R.W. and T.L. Munga. (2003). Current status of Cassava Brown Streak Disease in Kenya. In Legg J.P
and Hillocks, R.J. (eds) Cassava Brown Streak Virus Disease: Past, Present and Future. Proceedings of an
international workshop,Mombasa Kenya, 27-30 October 2002. p12-13. Natural Resources International,
Aylesford
Ruijter de Wildt M., Elliott D., and Hitchins R., (2006) Making Markets Work for the Poor: Comparative
Approaches to Private Sector Development, Berne: Swill Agency for Development and Cooperation.
Thresh J.M., Otim-Nape G.W., Legg J.P. and Fargette D. (1997). African Cassava Mosaic Disease;
Magnitude of the problem. African Journal of Root and Tuber Crops. 2, 13-18.