Embed Size (px)
Citation preview

Journal of the Eastern Asia Society for Transportation Studies, Vol.13, 2019
2260
Effects of Incentive Policy on Maritime Stakeholders in Japanese Local
Ports
Tomoya KAWASAKI a, Hoshi TAGAWAb, Takumi TAMANEc,
Shinya HANAOKAd, Toshihiro WATANABEe
a,b,d,eDepartment of Transdisciplinary Science and Engineering, Tokyo Institute of Technology
aE-mail:[email protected]
bE-mail: [email protected]
cE-mail: [email protected]
dE-mail: [email protected]
eFaculty of Business Administration,Ishinomaki Senshu University
eE-mail: [email protected]
Abstract: This study simulates the effects of “incentive policy” on maritime stakeholders in
Japanese local ports. In incentive policy,local government (owner of the port) provides
monetary support for shippers and/or shipping company in order to obtain more containers.
We employ a multi-agent simulation model to express interactions among stakeholders, such
as port manager, shipping company, and shipper. The model is applied to the case study for
local ports in Kyushu region, Japan where three local ports (i.e. Miike, Kumamoto, and
Yatsushiro ports) plus one major port (i.e. Hakata port) are available. We find that incentive
policy for shipper is not effective in terms of total surplus in spite of slight increase in
container volume are observed. On the other hand, incentives for shipping company is able to
increase both container volume and total surplus only if shipping company could increase
their port of calls (i.e. frequency) by the monetary support given by local government.
Keywords:Incentive Policy, Subsidy, Local Port, Multi-agent Simulation Model, Japan
1.INTRODUCTION
There are more than 80 ports dealing with containers in Japan (MOF, 2018). The most of the
ports deal with small volume of containers (e.g. less than 20,000 TEU per year) comparing to
Japanese major ports (i.e. Tokyo, Yokohama, Kobe, etc.). These small-scale local ports highly
compete with one another. In this situation, local ports support a part of port charges as a
subsidy or exempt port charges for shippers and/or shipping company,which is an ocean
carrier, in orderto obtain more containers from other rival ports in proximity. In Japan, this
policy is called as “incentive policy”, which 65 Japanese local ports have been enforced since
1990s. Since similar incentive policy in terms of amount of incentives among rival ports,
effectiveness of incentive policy is questioned (Kayano and Ishiguro, 2014). Several local
governments are discussing change in incentive policy for more effective implementation in
terms of providing more amount of incentives, stopping incentive policy, and changing
incentive beneficiaries. Several studies (e.g. Brooks(2004); Helling and Poister(2000);
Haralambides,(2014)) argue effectiveness of port subsidy; however, its effect on each
stakeholder are not addressed. Thus, it is necessary to explore how incentive policy can be
more effective in terms of container volume and total surplus of all stakeholders in local
Corresponding author.

Journal of the Eastern Asia Society for Transportation Studies, Vol.13, 2019
2261
maritime industry. For each type of incentive policy, effect on each stakeholder is expected to
be different. For example, increase in the amount of incentives would be resulted in increase
in cargo volume and consumer surplus while profit of port manger would be decreased. In this
way, several stakeholders would be differently affected by each incentive policy. Therefore,
the objective of this study is set as; (i) to develop a multi-agent simulation model to evaluate
the effect of incentive policy on each stakeholder and (ii) to explore the effective incentive
policies in terms of container volume and total surplus of the region.
The effects of incentive policy are examined by using indicators such as container cargo
volume, total surplus, profit of shipping lines, consumer surplus, etc. Port management is
fairly complex due to the involvement of several stakeholders and interaction with one
another. Bonabeau (2002) states that the benefit of the multi-agent simulation model, which is
defined as a simulation model for simulating the actions and interactions of agents to assess
their effects on the whole system, is the provision of a natural description of a complex
system in which behavior of stakeholders interact with each other. Thus, in this study,
multi-agent simulation model is developed to describe the port management and operation
systems. The model is applied to case study for local ports in Kyushu region, Japan where
three local ports (i.e. Miike, Kumamoto, Yatsushiro ports) plus one major port (i.e. Hakata
port) are compete one another.
The rest of this paper is structured as follows. Section 2 conducts extensive reviews of
the existing literature regarding port competition and subsidy policy. Section 3 explains the
target of the study and actual situation of target ports and incentive policies. In Section 4, a
simulation model is developed form multi-agent perspective considering interaction among
the stakeholders. Subsequently, as a case study, the developed model is applied to Kyushu
region and the effects of incentive policies are examined in Section 5. Finally, conclusions
and directions for further researches are given in Section 6.
2.LITERATURE REVIEWS
Main purpose of incentive policy is to make their ports superior to rival ports. Thus, papers
related to port competition are firstly reviewed. As Slack (1985) suggests, port charges and
level of service are fundamental factors for port competitiveness. Heaver (1995) finds
appropriate public port policies and strategies of port managements are needed to be
competitive. Cullinane et al. (2004) and Yap et al. (2006) analyze port competition in East
Asia where Hong Kong and Busan port are the distinctive beneficiaries from inter-port
competition in the region for the past three decades. Ishii et al. (2013) examines the effect of
inter-port competition between two ports by game theoretical approach. Since Kobe port
missed to make port charges lower at proper timing, large portion of container cargoes were
shifted to Busan port. Luo et al. (2012) analyses port competition considering both pricing
and capacity expansion strategy. From the result, smaller ports with elastic demand and lower
operation/investment cost are more preferable to expand in an increasing market. Wang et al.
(2014) discuss the competition among various carriers using game theory to set the optimum
price to maximize profits. With increasing container demand in the market, expanding ship
capacity setting is preferable due to its low marginal cost. Other several studies explore port
competition (e.g. Anderson et al. 2008, Hoshino 2010, Agarwal and Ergun, 2010, and
Alverez-San et al. 2015) and find that port competitiveness are highly dependent on strategies
taken by port manager.
Papers related to port subsidy can be found as many as port competition. Heaver(1995)
describesthat inefficiencies are likely to arise if subsidies or other institutional interventions

Journal of the Eastern Asia Society for Transportation Studies, Vol.13, 2019
2262
distort the competitive relationship between the ports. Regarding the US ports, Brooks(1992)
argues unfair subsidies such as government loans, tax-exempt revenue bonds and dredging by
US Army Corps of Engineers have been denounced and promoted an uneven playing field
between ports both nationally and internationally. Helling and Poister(2000) argue subsidized
port competition in the US may have causedexcessive port development; in particular, subsidy
distorts the price formation and overcapacity. Terada (2002) also points out investment and
subsidy by Japanese port authority are excessed. Regarding the subsidy from port
authority,Qu et al. (2017) divide maritime stakeholders into three (mainline carriers, feeder
carriers, and shippers) and analyze the effect of subsidies to each stakeholder. The result
shows that port subsidies change the market equilibrium. Subsidies to mainline carriers
increase the profit of the entire mainline-feeder liner while those to shippers decrease the
equilibrium of freight rates. As for subsidies to feeder carriers, it reduces operational costs and
increase profitability. Xu et al. (2015) simulate the case where forwarders are provided
subsidy and concluded that repositioning problems can be solved by the subsidy. As for
subsidies to maritime passengers, Jimenez et al. (2018) analyze the efficiency of subsidies in
European maritime passenger routes and concludes subsidized routes make price per
kilometer around 40% up and nonresident passengers suffer higher prices. Yan et al. (2014)
mention that a favorable port charge system and subsidies are also needed to increase the use
of domestic container carrier shifted from land transportation in Taiwanese case. Seo and Ha
(2010) reveals that the port size and incentives play an important role for user’s port selection
by using analytic network process. Almen and Hernandez(2014) argue that promoting port
efficiency in EU’s short sea shipping might be a more suitable target to increase the modal
split of short sea shipping, rather than subsidizing firms to transfer cargo from road to sea.In
Japanese context, study on port subsidy is fairly limited. Only Kayano and Ishiguro (2014)
analyze the effect of incentive policy in Japanese local ports. From the result, effectiveness of
Japanese incentive policy is fairly small due to the implementation of almost identical
incentives with rival ports. Thus, one needs to change the amount or beneficiaries of
incentives so that its effectiveness is improved. In accordance with economic
principle,appropriate price of port charge can lead a port to prosperity and growth; however,
the inappropriate priceand subsidy would guide to inefficiency (Haralambides,2014).As seen
in several papers regarding port subsidies, there is no study regarding the evaluation of
subsidy for shipper and shipping company and its effect on each port stakeholder.
3.STUDYAREAAND INCENTIVE POLICY
The target ports of this study are three local ports in Kyushu region, Japan such as Miike,
Kumamoto and Yatsushiro ports plus one major port such as Hakata port as shown in Figure 1.
Three local ports are located in proximity one another, while Hakata port is located
geographically far from Kumamoto city (i.e. 120km). However, Hakata port is also one of the
competitors of three local ports for hinterland containers of local ports due to its high level of
service (e.g. frequency of trunk lines). Figure 2 shows the share of final port loaded (first port
unloaded) for international shipping for Kumamoto and Fukuoka prefecture. Note that
Kumamoto and Yatsushiro ports belong to Kumamoto Prefecture and Hakata and Miike ports
belong to Fukuoka prefecture. In both prefectures, more than 60% of cargoes choose Hakata
port as final/first port for international shipping in 2013. Interestingly,Hakata port deals with
large portion of containers attracted/generated at Kumamoto prefecture even though ports in
Kumamoto prefecture are geographically much superior to Hakata port. According to
statistics from each prefecture website, the majority of main destination of these containers

Journal of the Eastern Asia Society for Transportation Studies, Vol.13, 2019
2263
isChina. Therefore, this study considers only Chinese route for the purpose of simplicity of
the model.
There is also competition among three local ports, which are owned and operated by
each local government. In order to obtain more containers from rival ports, each local
government had started “incentive policy”which is defined as subsidy provided by local
government (i.e. port manager) to shipper and/or shipping company in order to support
shipping cost for shipper and operating costs for shipping company. The contents of current
incentive policy of three local ports are shown in Table 1. In these ports, incentive policy is
implemented by almost same timing (i.e. early 2010s) and its beneficiary is only shipper; in
other words, shipping company is out of support. Note that some of the ports in Japan (e.g.
Yokohama, Shimizu ports, etc.) support shipping company as beneficiary of incentive policy.
As shown in Table 1, shippers newly use the port are given twice amount of incentives than
existing shippers. This is because each port intends to obtain shippers from other ports.
Figure 1. Port position of target port
(a) Kumamoto Prefecture
(Hinterland of Kumamoto and Yatsushiro Port) (b) Fukuoka Prefecture
(Hinterland of Miike port)
Figure 2. Final port loaded/first port unloaded for international shipping of each prefecture
(Source: MLIT, 2014)
Table 1.Current incentive policy of three local ports
(Source: website of each port) Port Miike port Kumamoto port Yatsushiro port
Start year 2010 2011 2012
Beneficiary Shipper Shipper Shipper
Amount of incentive
(JPY/TEU)
10,000 (New user)
5,000 (existing user)
20,000 (New user)
15,000 (existing user)
20,000 (New user)
15,000 (existing user)

Journal of the Eastern Asia Society for Transportation Studies, Vol.13, 2019
2264
4.SIMULATION MODEL
4.1Interrelationships among Stakeholders
Port management and operation is complex and several stakeholders are involved and interact
one another. Bonabeau (2002) states that the benefit of the multi-agent simulation model is to
provide a natural description of a complex system in which stakeholders interact with one
another and no stakeholder has centralized administrative power. Therefore, in this study, the
multi-agent simulation model is applied to describe the port management systems and three
stakeholders such as port manager, shipping company and shipper are considered. The
relationships among stakeholders (details will be addressed in following sections) are shown
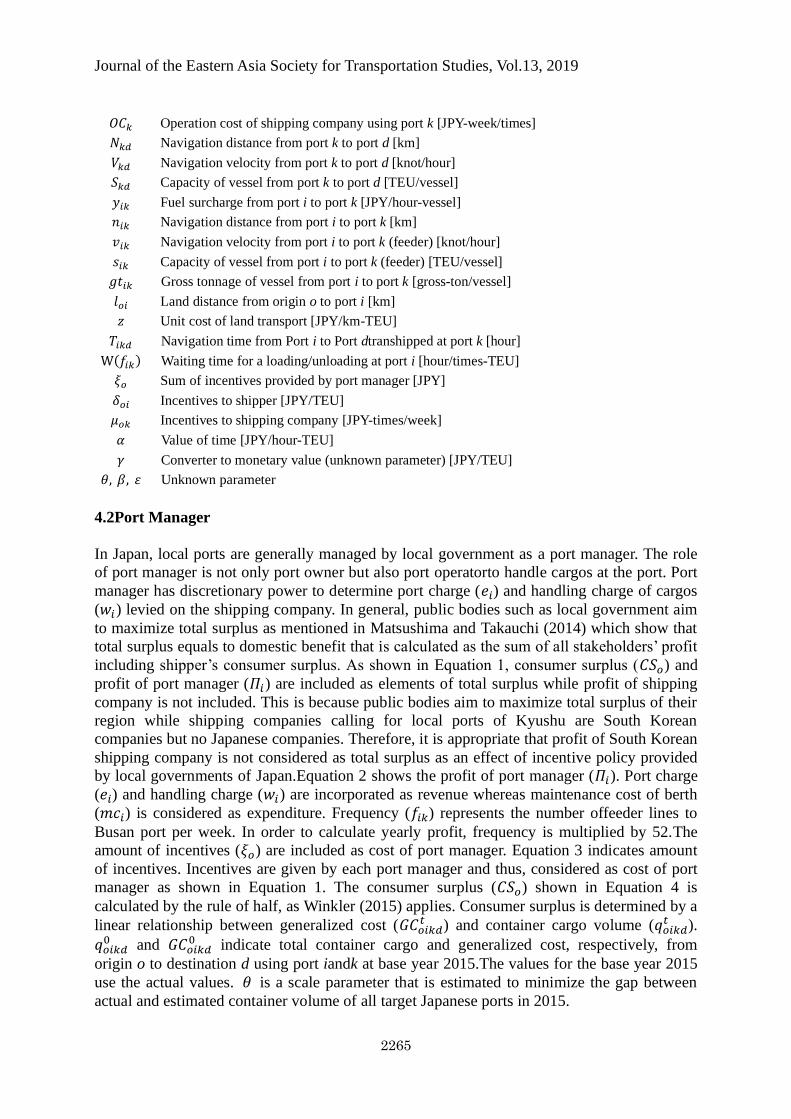
in Figure 3 while notations for simulation model are shown as followings. In this study,
Japanese Yen (JPY) is used for the currency (1USD=110JPY as of February 2018).
Figure 3. Interrelationships among stakeholders
Notations:
𝑜 Origin of cargo (Hinterland of Port i)
𝑖 Origin port
𝑘 Transhipment port
𝑑 Destination of cargo
𝛱𝑖 Profit of port manager of port i [JPY]
𝐶𝑆𝑜 Consumer surplus at origin o [JPY]
𝑇𝑆𝑜 Total surplus at origin o [JPY]
𝑃𝑠𝑘 Profit of shipping company using port k [JPY]
𝐺𝐶𝑜𝑖𝑘𝑑 Generalized cost of shipper from origin o to destination d using port i and k [JPY/TEU]
𝐺𝐶𝑜𝑖𝑘𝑑𝑡
Generalized cost of shipper from origin o to destination d using port i and k at year t
[JPY/TEU]
𝑒𝑖 Port charge of port i [JPY/gross-ton]
𝑤𝑖 Handling charge of port i [JPY/TEU]
𝜏𝑖𝑘 Freight rate from port i to port k [JPY/TEU]
𝑓𝑖𝑘 Frequency of vessel from port i to port k [times/week]
𝑄𝑖 Total container cargo using port i [TEU]
𝑞𝑜𝑖𝑘𝑑𝑡 Total container cargo from origin o to destination d using port i and port k at year t [TEU]
𝑞𝑖𝑘 Total container cargo from port i to port k [TEU]
𝑄𝑂𝑜𝑑 Total container cargo from origin o to destination d [TEU]
𝐾𝑖 Annual handling capacity at port i [TEU/year]
𝑚𝑐𝑖 Maintenance cost at port i [JPY/TEU]
Journal of the Eastern Asia Society for Transportation Studies, Vol.13, 2019
2265
𝑂𝐶𝑘 Operation cost of shipping company using port k [JPY-week/times]
𝑁𝑘𝑑 Navigation distance from port k to port d [km]
𝑉𝑘𝑑 Navigation velocity from port k to port d [knot/hour]
𝑆𝑘𝑑 Capacity of vessel from port k to port d [TEU/vessel]
𝑦𝑖𝑘 Fuel surcharge from port i to port k [JPY/hour-vessel]
𝑛𝑖𝑘 Navigation distance from port i to port k [km]
𝑣𝑖𝑘 Navigation velocity from port i to port k (feeder) [knot/hour]
𝑠𝑖𝑘 Capacity of vessel from port i to port k (feeder) [TEU/vessel]
𝑔𝑡𝑖𝑘 Gross tonnage of vessel from port i to port k [gross-ton/vessel]
𝑙𝑜𝑖 Land distance from origin o to port i [km]
𝑧 Unit cost of land transport [JPY/km-TEU]
𝑇𝑖𝑘𝑑 Navigation time from Port i to Port dtranshipped at port k [hour]
W(𝑓𝑖𝑘) Waiting time for a loading/unloading at port i [hour/times-TEU]
𝜉𝑜 Sum of incentives provided by port manager [JPY]
𝛿𝑜𝑖 Incentives to shipper [JPY/TEU]
𝜇𝑜𝑘 Incentives to shipping company [JPY-times/week]
𝛼 Value of time [JPY/hour-TEU]
𝛾 Converter to monetary value (unknown parameter) [JPY/TEU]
𝜃, 𝛽, 휀 Unknown parameter
4.2Port Manager
In Japan, local ports are generally managed by local government as a port manager. The role
of port manager is not only port owner but also port operatorto handle cargos at the port. Port
manager has discretionary power to determine port charge (𝑒𝑖) and handling charge of cargos
(𝑤𝑖) levied on the shipping company. In general, public bodies such as local government aim
to maximize total surplus as mentioned in Matsushima and Takauchi (2014) which show that
total surplus equals to domestic benefit that is calculated as the sum of all stakeholders’ profit
including shipper’s consumer surplus. As shown in Equation 1, consumer surplus (𝐶𝑆𝑜) and
profit of port manager (𝛱𝑖) are included as elements of total surplus while profit of shipping
company is not included. This is because public bodies aim to maximize total surplus of their
region while shipping companies calling for local ports of Kyushu are South Korean
companies but no Japanese companies. Therefore, it is appropriate that profit of South Korean
shipping company is not considered as total surplus as an effect of incentive policy provided
by local governments of Japan.Equation 2 shows the profit of port manager (𝛱𝑖). Port charge
(𝑒𝑖) and handling charge (𝑤𝑖) are incorporated as revenue whereas maintenance cost of berth
(𝑚𝑐𝑖) is considered as expenditure. Frequency (𝑓𝑖𝑘) represents the number offeeder lines to
Busan port per week. In order to calculate yearly profit, frequency is multiplied by 52.The
amount of incentives (𝜉𝑜) are included as cost of port manager. Equation 3 indicates amount
of incentives. Incentives are given by each port manager and thus, considered as cost of port
manager as shown in Equation 1. The consumer surplus (𝐶𝑆𝑜) shown in Equation 4 is
calculated by the rule of half, as Winkler (2015) applies. Consumer surplus is determined by a
linear relationship between generalized cost (𝐺𝐶𝑜𝑖𝑘𝑑𝑡 ) and container cargo volume (𝑞𝑜𝑖𝑘𝑑
𝑡 ).
𝑞𝑜𝑖𝑘𝑑0 and 𝐺𝐶𝑜𝑖𝑘𝑑
0 indicate total container cargo and generalized cost, respectively, from
origin o to destination d using port iandk at base year 2015.The values for the base year 2015
use the actual values. 𝜃 is a scale parameter that is estimated to minimize the gap between
actual and estimated container volume of all target Japanese ports in 2015.

Journal of the Eastern Asia Society for Transportation Studies, Vol.13, 2019
2266
max𝑒𝑖,𝑤𝑖
𝑇𝑆𝑜 = 𝐶𝑆𝑜 +∑𝛱𝑖
𝑖∈𝑜
(1)
𝛱𝑖 = ∑(52 ∙ 𝑓𝑖𝑘 ∙ 𝑒𝑖𝑔𝑡𝑖𝑘 + 𝑤𝑖𝑞𝑖𝑘)
𝑘
−𝑚𝑐𝑖𝐾𝑖 − 𝜉𝑜 (2)
𝜉𝑜 = ∑∑∑𝛿𝑜𝑖 ∙
𝑑
𝑞𝑜𝑖𝑘𝑑𝑘𝑖∈𝑜
+∑∑𝜇𝑜𝑘 ∙ 52 ∙ 𝑓𝑖𝑘𝑘𝑖∈𝑜
(3)
𝐶𝑆𝑜 =∑∑∑1
2(𝑞𝑜𝑖𝑘𝑑
0 + 𝑞𝑜𝑖𝑘𝑑𝑡 )(𝐺𝐶𝑜𝑖𝑘𝑑
0 − 𝐺𝐶𝑜𝑖𝑘𝑑𝑡 )
𝑑𝑘𝑖
(4)
𝑞𝑜𝑖𝑘𝑑𝑡 = 𝑄𝑂𝑜𝑑
exp(−𝜃 ∙ 𝐺𝐶𝑜𝑖𝑘𝑑𝑡 )
∑ ∑ exp(−𝜃 ∙ 𝐺𝐶𝑖𝑘𝑡 )𝑘 𝑖
(5)
4.3Shipping Company
Shipping company is a private enterprise and determines freight rate (𝜏𝑖𝑘) and frequency (𝑓𝑖𝑘)
to call for each port in order to maximize own profit, as shown in Equation 6. As Sheng et al.
(2017) and Yin et al. (2014) discuss, the following costs are considered for the shipping
company. The fuel cost (𝑦𝑖𝑘) is proportionally changed with navigation distance (𝑛𝑖𝑘) as
Notteboom (2009) assumes. The loading/unloading cost (𝑤𝑖) proportionally changes with
container cargo volumes. Operation cost (𝑂𝐶𝑘), which includes the cost of crews, insurance
and so on, is included in Equation 6. Port charge (𝑒𝑖) set by port manager is considered as
expenditure of the shipping company. Finally, incentive to shipping company (𝜇𝑜𝑘 ) is
considered asrevenue and is exogenously given as scenario. There are several ways to
alleviate the burden of shipping company, such as tax exemption or reduction of the port
charge. Either way is able to reduce shipper’s generalized cost of haulage. In case shipping
company is supported by incentives, shipping company might discount freight rate to collect
more cargoes. In this study, subsidies in the scheme of incentive policy for the case of
shipping company is provided for one port of call.
𝑃𝑠𝑘 =∑(𝜏𝑖𝑘 − 𝑤𝑖)𝑞𝑖𝑘 − 52 ∙ 𝑓𝑖𝑘 {휀 ∙𝑦𝑖𝑘𝑛𝑖𝑘𝑣𝑖𝑘
+ 𝑒𝑖𝑔𝑡𝑖𝑘 + 𝑂𝐶𝑘}
𝑖
+ 52 ∙ 𝑓𝑖𝑘𝜇𝑜𝑘 (6)
4.4 Shipper
The shipper chooses a route by logit model based on generalized cost (𝐺𝐶𝑜𝑖𝑘𝑑) of haulage, as
shown in Equation 7, which indicates total container cargos from origin o to destination d
through port i and k. Note that freight forwarders sometimes conducta route, port, and mode
choice instead of shippersin practical; however, their behavior is also minimization of
generalized cost of shipper since they are the agents of shippers. Therefore, in this study,
shipper and freight forwarders are not explicitly separated as independent players; in other
words, shipper is assumed to be a player to choose a route, port, and mode of the
haulage.Equation 8 indicates total container cargos at port i. Generalized cost is calculated by
Equation 9 and is changed as a result of the behavior of other stakeholders. It consists of lead
time, port congestion cost, and freight rate, which are identified as important cost factors for
shippers in several studies (e.g., Kawasaki and Matsuda 2015; Kavirathna, et al.,2018). The
Journal of the Eastern Asia Society for Transportation Studies, Vol.13, 2019
2267
congestion cost is incorporated as 𝑄𝑖/𝐾𝑖 on the basis of De Borger and Van Dender (2006)
and Basso and Zhang (2008). The freight rate (𝜏𝑖𝑘) is also components of generalized cost.
Land transportation cost (𝐿𝑜𝑖) can be calculated as shown in Equation 12. In this study, unit
land transport cost (𝑧 ) is set as 151 yen/km-TEU and 8,915 is an intercept derived
byMatsukura and Seta (2016). Following Tran and Takebayashi (2018), navigation time and
waiting time are calculated by Equations 10 and 11, respectively. Incentive to shipper (𝛿𝑜)
reduces shipper’s generalized cost.There are several ways to alleviate the burden of shippers,
such as tax exemption or reduction of port charge. Either way is able to reduce shipper’s
generalized cost of haulage. In this study, subsidies in the scheme of incentive policy are
provided for one container for the purpose of simplicity. To consider the unit of generalized
cost (JPY/TEU), incentives of shipper can be calculated in Equation 9.
𝑞𝑖𝑘 =∑∑𝑄𝑂𝑜𝑑exp(−𝜃 ∙ 𝐺𝐶𝑜𝑖𝑘𝑑)
∑ ∑ exp(−𝜃 ∙ 𝐺𝐶𝑜𝑖𝑘𝑑)𝑖𝑘𝑑𝑜
(7)
𝑄𝑖 =∑𝑞𝑖𝑘𝑘
(8)
𝐺𝐶𝑜𝑖𝑘𝑑(𝜏𝑖𝑘,𝑊(𝑓𝑖𝑘)) = 𝛼[𝑇𝑖𝑘𝑑 + 𝛽 ∙ 𝑊(𝑓𝑖𝑘)] + 𝛾 ∙𝑄𝑖𝐾𝑖
+ 𝜏𝑖𝑘+𝐿𝑜𝑖 − 𝛿𝑜𝑖 (9)
𝑇𝑖𝑘𝑑 = 𝑛𝑖𝑘𝑣𝑖𝑘
+𝑁𝑘𝑑
𝑉𝑘𝑑 (10)
𝑊(𝑓𝑖𝑘) = 7 ∙ 24
𝑓𝑖𝑘 (11)
𝐿𝑜𝑖 = 𝑧 ∙ 𝑙𝑜𝑖 + 8,915 (12)
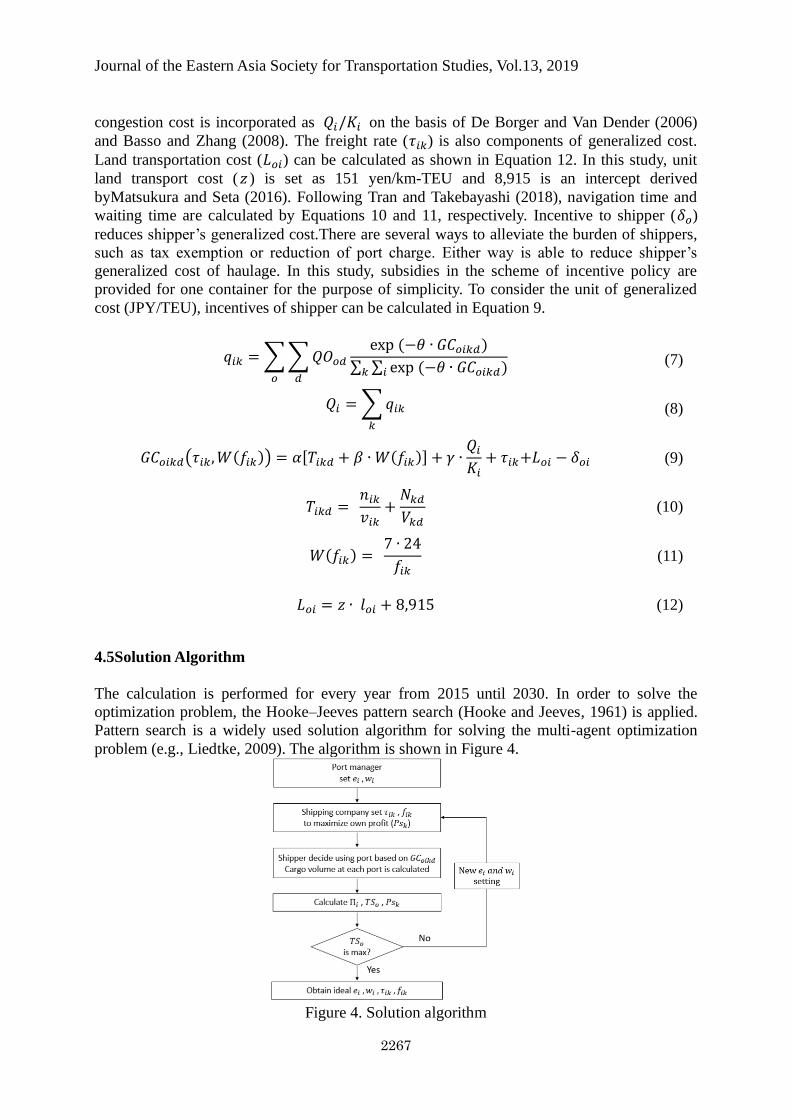
4.5Solution Algorithm
The calculation is performed for every year from 2015 until 2030. In order to solve the
optimization problem, the Hooke–Jeeves pattern search (Hooke and Jeeves, 1961) is applied.
Pattern search is a widely used solution algorithm for solving the multi-agent optimization
problem (e.g., Liedtke, 2009). The algorithm is shown in Figure 4.
Figure 4. Solution algorithm

Journal of the Eastern Asia Society for Transportation Studies, Vol.13, 2019
2268
Port manager first sets port charge (𝑒𝑖) and handling charge (𝑤𝑖). Thereafter, shipping
company sets the frequency of vessel (𝑓𝑖𝑘) and freight rate (𝜏𝑖𝑘) based on Equation 6.
Generalized cost of shipper can be calculated after decision making of shipping company.
Based on this, shipper makes a decision to choose a route based on Equation 6. It makes
possible to calculate profit of port manager (𝛱𝑖), profit of shipping company (𝑃𝑠𝑘) and total
surplus (𝑇𝑆𝑜 ). Finally, total surplus is repeatedly calculated until maximum values are
obtained, so that optimum 𝑒𝑖 and 𝑤𝑖 are obtained. In order to avoid divergence and to
reduce computational complexity, the range of value is set for each variable (i.e., 1.0 ≤𝑒𝑖≤ 3.0,
250 ≤𝑤𝑖≤ 350, 550 ≤𝜏𝑖𝑘≤ 750, and 0 ≤𝑓𝑖𝑘≤ 7).As for 𝑓𝑖𝑘, minimum value is set as zero, which
means shipping company is allowed to skip local port of Japan.
5.NUMERICAL ANALYSIS
5.1 Input Values and Assumptions
In order to simulate the effect of incentives, input values are prepared, as shown in Table 2.
Those values are differed depending on origins. Navigation velocity from port k to port d
(𝑉𝑘𝑑=17.2;Notteboom, 2009) and value of time (α=2,300; WAVE, 2011) are common values
at all routes and ports. The values such as 𝑚𝑐𝑖 and 𝑂𝐶𝑘 cannot be acquired as real data. For
such values,identical value in threelocal ports based on interviews with port managerssuch as
𝑚𝑐𝑖=110 and 𝑂𝐶𝑘=88,000 are set.As one of the input data, future container cargo volume is
needed. In this study, future container cargo volume at each year, which is forecasted on the
basis of future macroeconomic conditions by MLIT (2011), is used. As for port charges in
Kumamoto and Yatsushiro ports, which is determined based on gross-tonnage of the vessels,
they are zero as real situation. In Japan, several local ports set port charge as zero (MLIT,
2017) to attract shipping companies and shippers. Thus, we set input value of port charge of
Kumamoto and Yatsushiro port as zero as shown in Table 2.
Table 2. Input values Input values Miike Kumamoto Yatsushiro Hakata Source
Port charge of port iin 2015 [JPY/gross-ton] (𝑒𝑖)
2.7 0 0 n/a Website of each port manager
Terminal handling charge of porti in 2015 [JPY/TEU] (𝑤𝑖)
113 124 124 n/a Website of each port manager
Freight rate from port i to port k in 2015 [JPY/TEU] (𝜏𝑖𝑘)
330 300 280 500 Searates.com
Frequency of vessel from port i to port k in 2015 [times/week] (𝑓𝑖𝑘)
2 2 3 7 Website of each port manager
Annual handling capacity at port i [TEU/year] (𝐾𝑖)
1,200 720 770 n/a Website of each port manager
Fuel surcharge from port i to port k [JPY/hour-vessel] (𝑦𝑖𝑘)
650.1 658.6 677.5 n/a Notteboom (2009)
Navigation velocity from port i to port k (feeder) [knot/hour] (𝑣𝑖𝑘)
9.7 14.7 12.1 15.3 Marine Traffic.com
Capacity of vessel from port i to port k (feeder) [TEU/vessel] (𝑠𝑖𝑘)
600 360 385 2,000 Marine Traffic.com
Gross tonnage of vessel from port i to port k [gross-ton/vessel] (𝑔𝑡𝑖𝑘)
3,809 3,866 3,825 9,600 Marine Traffic.com

Journal of the Eastern Asia Society for Transportation Studies, Vol.13, 2019
2269
Figure 5. Conceptual network of the study
In this study, there are several assumptions. The first assumption is that destination port
is assumed to be Shanghai port only for the purpose of simplicity as shown in Figure 5 while
cargo volume is used for all containers between target cities and China.The trade volume
from/to Kyushu region is mostly with China as mentioned in section 2. By assuming
destination port as Shanghai port, navigation distances (𝑁𝑘𝑑) between port k and d can be
obtained. Besides, target three ports currently have Busan route only (i.e. no domestic route
and Shanghai route from three local ports). Thus, transshipment port k denotes Busan port
only. The second assumption is that,according to interview surveys with several shipping lines,
Hakata port is not very likely to well consider other three local ports as competitors owing to
small scale of three local ports. Thus, this simulation model does not include Hakata port as
one of the stakeholders, which means service level of Hakata port is constant over the
year.From this reason, freight rate (𝜏𝑖𝑘, 500 JPY/TEU) and frequency (𝑓𝑖𝑘, 7 times/week) of
vessels to call for Hakata port are constant over the years from 2015 (base year) to 2030.
Consequently, four input values (port charge (ei), terminal handling charge (wi), annual
handling capacity(Ki), and fuel surcharge (yik)) of Hakata port, which affect service level of
shipping company to call for Hakata port, are not needed in this simulation model. From this
reason, these four input values are not applicable (n/a) as shown in Table 2.The third
assumption is that the capacity of vessel (𝑠𝑖𝑘,𝑆𝑘𝑑) is determined as the average size of actually
operated vessels in 2018 and is fixed over the year. By determining vessel size, it becomes
possible to calculate and determine navigation speed, gross tonnage of vessels, and fuel
surcharge by referring to Notteboom (2009).
5.2Simulation Results and Discussion
5.2.1 Reproducibility of developed model (Base case)
In order to simulate several scenarios related to incentive policies, first of all, current situation
is reproduced for the year 2015, where incentives for shippers at Miike, Kumamoto, and
Yatsushiro ports are currently being implemented as shown in Table 1. Current amount of
incentives for shippers are differed between new and existing users. For the simplicity of the
model calculation, current situation is reproduced for existing user case such as 5,000
JPY/TEU for Miike port and15,000 JPY/TEU for Kumamoto and Yatsushiro ports.Parameter
estimation is done as minimizingthe gap between actual and estimated container volumes in
2015. As a result, parameters are estimated as 𝛽=10, 𝛾=40,휀=0.01 and 𝜃=0.00119. Figure6
shows actual and estimated container volume at three local ports and Hakata port in 2015. In
overall, these values are fit well in terms of ratio of port choice although slight difference
between actual and estimated values are observed. Using simulation model developed above,
several scenarios related to incentive policies are conducted in following sections.
Hinterland of
Miike port
Kumamoto port
Yatsushiro port
Kumamoto Port
Miike Port
Yatsushiro Port
Hakata Port
Busan
Port
Origin o Port i
Transshipment
Destination d
Land transport International maritime shipping
Port k
Shanghai
Port

Journal of the Eastern Asia Society for Transportation Studies, Vol.13, 2019
2270
Figure 6. Actual and estimated container volume ateach port
5.2.2 No incentives in all ports (Scenario 1)
As scenario 1, the case where all port manager stops incentive policy is analyzed. From this
scenario, it can be compared thatthe impact of with- and without-incentive policy. Simulation
results of the year 2030 are shown in Table 3. Note that simulation results other than the year
2030 (between 2015 and 2029)were also obtained; however, they are not shown in the paper
because any notable different trends from 2030 can be obtained.
Table 3. Simulation results of without incentive case for all local ports in 2030 case Miike Kumamoto Yatsushiro Hakata
Container cargo volume
[TEU]
Base case 22,599 18,678 27,454 1,309,587
Without
incentive
21,505
(-4.8 %)
16,595
(-11.2 %)
23,514
(-14.4 %)
1,316,704
(0.5%)
Consumer surplus
[thousand JPY]
Base case 12,015 10,244 28,787 -
Without
incentive
11,503
(-4.3 %)
9,098
(-11.2 %)
24,909
(-13.5%) -
Profit of port manager
[thousand JPY]
Base case 504,843 429,544 487,971 -
Without
incentive
687,432
(36.2 %)
628,918
(46.4 %)
745,032
(52.7 %)
-
Total surplus
[thousand JPY]
Base case 516,858 439,787 516,757 -
Without
incentive
698,935
(35.2 %)
638,130
(45.1 %)
769,941
(49.0 %) -
*Values in parenthesis indicate percent change from base case
From the results, container volume of all local ports would be decreased while that of
Hakata port is expected to be increased. Accordingly, consumer surplus is decreased while
profit of port manager is increased due to stopping incentive policy as expenditure. Finally,
total surplus of all three local ports is increased.Almost no shift between local ports and some
shift from local port to Hakata ports are observed if incentive policy is stopped in three local
ports. Thus, generalized cost for all route through local ports is equally changed since almost
identical incentive policy is simultaneously conducted in local ports. Consequently, in case
incentives are stopped in all local ports, containers are just shifted to Hakata port from local
ports.
From this result, we can understand that obtaining one containers from Hakata port
needs much higher cost than cost of incentives. Consequently, incentive policy for all three
ports currently being conducted can increase container volume; however, total surplus would
be decreased since benefit from increase in one container is smaller than the cost (i.e.
incentive) of obtaining one container from Hakata port.

Journal of the Eastern Asia Society for Transportation Studies, Vol.13, 2019
2271
5.2.3Combination of with and without incentive cases (Scenario 2)
As second scenario, the case of different combinations of with and without incentive policy
amongst three local ports is discussed. The contents of current incentive policy being
implemented at three local ports are similar one another. As seen in the results of scenario 1,
stopping incentive policy is beneficial in terms of total surplus although container volume and
consumer surplus are decreased. Therefore, some of the port manager would possibly stop the
incentive policy to maximize total surplus of the region. In scenario 2, we assume that two
ports (i.e. Miike and Kumamoto ports) stop incentive policy while one port (i.e. Yatsushiro
port) continues current incentive policy. The simulation results are shown in Table 4. As
expected, Yatsushiro port which continues incentive policy increases containervolumeby 7.3%
comparing to base case in 2030. On the other hand, unexpected positive results are obtained
for total surplus. As shown in Table 4, total surplus is increased in all three ports. As for Miike
and Kumamoto ports, profit of port manager is increased due to stopping incentive policy
which is expenditure of port manager. On the other hand, profit of port manager in Yatsushiro
is increased since container cargo volume is increased. Although different reasons contribute
on increase in profit of port manger, these are the main reason to increase total surplus of each
port.
Table 4. Simulation results of with incentivesfor only one port (Yatsushiro port) in 2030 case Miike Kumamoto Yatsushiro Hakata
Container cargo volume
[TEU]
Base case 22,599 18,678 27,454 1,309,587
Only
Yatsushiro
20,187
(-11.9%)
15,697
(-19.0%)
29,626
(7.3%)
1,312,808
(0.2%)
Consumer surplus
[thousand JPY]
Base case 12,015 10,244 28,787 -
Only
Yatsushiro
10,832
(-9.8 %)
8,613
(-15.9 %)
31,343
(8.9 %) -
Profit of port manager
[thousand JPY]
Base case 504,843 429,544 487,971 -
Only
Yatsushiro
643,803
(27.5 %)
595,261
(38.6 %)
547,503
(12.2 %) -
Total surplus
[thousand JPY]
Base case 516,858 439,787 516,757 -
Only
Yatsushiro
657,636
(26.7 %)
603,874
(37.3 %)
578,846
(12.0 %) -
*Values in parenthesis indicate percent change from base case
Although we identify that incentive for only one port is better than currentincentive
policy in terms of total surplus, one needs to explore how indicators including total surplus
will be changed when the amount of incentives changed from current amount. Thus,we
assume additional cases where the incentive amountsof Yatsushiro port is changed while other
two ports are still no incentives. The results are shown in Figure 7. As incentive amount of
Yatsushiro port increases from zero, container volume, consumer surplus, and profit of port
manager increase due to obtaining containers from other ports including Hakata port. On the
contrary, total surplus of all ports decreases especially Yatsushiro port. This is because
obtaining one container needs higher cost than obtaining profit from one container for port
managers. Thus, profit of port manager in Yatsushiro is dramatically decreased as incentives
increase.

Journal of the Eastern Asia Society for Transportation Studies, Vol.13, 2019
2272
(a) Container cargo volume(b) Total surplus
(c) Consumer surplus in target ports (d) Profit of port manager
Figure 7. Impact of change in incentive amount of Yatsushiro port oneach indicator
*No incentives are given at Miike and Kumamoto ports
Table 5. Comparison of total surplus for combinations of with and without incentive policies
in 2030
Incentive policy Total surplus [thousand JPY]
Miike port
Kumamoto
port
Yatsushiro
port Miikeport
Kumamoto
port
Yatsushiro
port
Case 1 (current) with with with 516,858 439,787 516,757
Case 2 with with without 550,909 465,731 695,331
Case 3 with without with 551,626 586,024 553,466
Case 4 with without without 591,908 617,506 739,068
Case 5 without with with 616,621 454,097 538,226
Case 6 without with without 654,410 482,484 721,587
Case 7 without without with 654,635 603,874 578,846
Case 8 without without without 698,935 638,016 769,941
Other combinations of with and without incentive policy among three local ports are
simulatedin order to explore appropriate combinations of incentive policies.Table 5 shows
total surplus of each case. Since incentive policies are implemented by public entity who
maximizes total surplus in their own region’s total surplus is observed for each case. Note that
incentive amount is same as base case in case port(s) implement incentive policy (with
case).From Table 5, total surplusof all regions is the smallest when all ports are implementing
incentive policy (i.e. current case) while the highest total surplus can be received when no
incentive conducted. The simulation results reveal that, if Kumamoto prefecture (Kumamoto
and Yatsushiro ports) implement incentive policy, it is better to focus on either port to increase
sum of the total surplus of Kumamoto prefecture.
10,000
15,000
20,000
25,000
30,000
35,000
0 5,000 10,000 15,000 20,000
TEU
Incentive amount at Yatsushiro port (JPY/TEU)(Base case)
400,000
500,000
600,000
700,000
800,000
0 5,000 10,000 15,000 20,000
Tho
usa
nd
JPY
Incentive amount at Yatsushiro port (JPY/TEU)
Miike
Kumamoto
Yatsushiro
(Base case)
0
5,000
10,000
15,000
20,000
25,000
30,000
35,000
40,000
0 5,000 10,000 15,000 20,000
Tho
usa
nd
JPY
Incentive amount at Yatsushiro port (JPY/TEU)(Base case)
400,000
500,000
600,000
700,000
800,000
0 5000 10000 15000 20000
Tho
usa
nd
JPY
Incentive amount at Yatsushiro port (JPY/TEU)
Miike
Kumamoto
Yatsushiro
(Base case)

Journal of the Eastern Asia Society for Transportation Studies, Vol.13, 2019
2273
5.2.4Incentives for shipping company(Scenario 3)
In scenario 3, the case where subsidies as incentive policy is provided for shipping
company calling for local port is discussed. Note that incentives in three portsare currently
provided for shippers onlywhile some of the Japanese ports (e.g. Shimizu port)currently
implement incentive policy for shipping company as exempting port charges. In general, port
charge is levied on the basis of gross tonnage of vessel called for. The ratio of port charge in
total cost of shipping company is fairly small.Thus, shipping company does not so much care
about port charge compared to other operational costs such as fuel cost. Therefore, in this
study, the amount of incentive for shipping company is increased to observe the change in
behavior of shipping company and shipper. As an example, shipping company that calls for
Yatsushiro port is assumed to be given incentives by 500, 750, 800, and 1,000 thousand JPY
per a port of call per a vessel.The simulation results are shown in Figure 8.
Compared to base case (no incentive for shipping company), total surplus of hinterland
in Yatsushiro is slightly decreased until the incentive is 750 thousand yen. Nevertheless,
incentives are increased up to 800 thousand JPY, total surplus turns to increase. This is due to
increase in frequency of shipping company thanks to incentives.Monetary support more than
800 thousand JPY enable shipping company to increase frequency.Increase in frequency
induces more containers at the port and consequently, consumer surplus and total surplus
increases.Note that profit of port manager is decreased due to providing incentives for
shipping company.Compared to incentive policy for shipper, incentive for shipping company
would contribute more on strengthening competitiveness of the port and total surplus due to
increase in frequency of the vessels. Therefore, it can be concluded that incentives for
shipping company is more effective than that for shipper in case incentives are given to
shipping company till increasing frequency to call for the port.
(a) Container volume oftarget ports (b) Total surplus in target ports
(c) Consumer surplus in target ports (d) Profit of port manager
Figure 8.Impact of incentives for shipping company oneach indicator in 2030
0
1
2
3
4
5
6
7
16,000
18,000
20,000
22,000
24,000
26,000
28,000
30,000
No incentive(Base case)
500 750 800 1,000
freq
uen
cy (t
imes
/wee
k)
Co
nta
iner
Vo
lum
e (T
EU)
Incentive amount at Yatsushiro port (Thousand JPY)
0
1
2
3
4
5
6
7
400,000
420,000
440,000
460,000
480,000
500,000
520,000
540,000
No incentive(Base case)
500 750 800 1,000
freq
uen
cy (t
imes
/wee
k)
Tota
l su
rplu
s (t
ho
usa
nd
JPY)
Incentive amount at Yatsushiro port (Thousand JPY)
frequency
Miike
Kumamoto
Yatsushiro
0
1
2
3
4
5
6
7
4,000
8,000
12,000
16,000
20,000
24,000
28,000
32,000
No incentive(Base case)
500 750 800 1,000
fre
qu
en
cy [t
ime
s/w
ee
k]
Co
nsu
mer
Su
rplu
s (t
ho
usa
nd
JPY)
Incentive amount at Yatsushiro port (Thousand JPY)

Journal of the Eastern Asia Society for Transportation Studies, Vol.13, 2019
2274
6.CONCLUSION
In this study, amulti-agent simulation model was applied to simulate the effects of several
incentive policies on container volume, each stakeholder, and total surplus. In the model,
interaction among stakeholders, such as the port manager, shipping company, and shipper are
considered. As incentive policies, subsidies are provided for shipper or shipping company.
Throughout of this study, the following are mainly found.
First of all, currentincentive policy seems to be not effective from the perspective of
total surplus; however, container volume can be increased. Therefore, current incentive policy
does not dramatically change shipper’s port choice and makes port manager’s cost higher. In
case the amount of incentives are increased, total surplus is dramatically decreased even
though container volume can be obtained from other rival ports. On the other hand, in case
incentive policy is not implemented at all in three ports, container cargo volume of three ports
is decreased (i.e. flowing out to Hakata port). However, total surplus in all ports can be
increased comparing to current practice due to no expenditure for incentive policy.
Second, incentive policy for shipper is not effective in terms of increase in total surplus
of the region regardless of any combination of with/without incentives and amount of
incentives.Total surplus is less than the case of no incentives. This is mainly because
obtaining one container by incentive needs higher cost comparing to benefit (e.g. port charge,
handling charge, etc.) gained from one container.
Finally, incentives for shipping company is able to increase frequency of port of calls.
Increase in frequency makes container volume increase and total surplus increase. However,
incentives for shipping company is not effective if amount of incentive is not sufficient to
increase frequency of shipping company; in this case, total surplus equally decreases as
incentive provided for shipping company. Consequently, incentives for shipping company is
more effective than for shipper only if shipping company could increase frequency of the port
of calls with sufficient incentive amounts.
Several issues remain for further research. Target ports of this simulation are only small
ports, which trade partner is mostly China. Thus, transshipment port is Busan port only and
there is no competitiveness between transshipment ports. For example, other large port such
as Kobe port have more routes; in this case, competitiveness between transshipment ports and
domestic and international shipping company would occurred. This remains for future work.

Journal of the Eastern Asia Society for Transportation Studies, Vol.13, 2019
2275
REFERENCES
1. Almen, A. S., Hernandez, A. (2014) Incentives to reduce port inefficiency: a
theoretical approach, Maritime Policy & Management, 41(5), 462-479.
2. Alvarez-San, J. Ó., Cantos-Sánchez, P., Moner-Colonques, R.,
Sempere-Monerris, J. J. (2015) The impact on port competition of the
integration of port and inland transport services. Transportation Research Part
B: Methodological, 80, 291–302
3. Agarwal, R., Ergun, Ö., (2010) Network design and allocation mechanisms for
carrier alliances in liner shipping. Operations Research, 58(6), 1726–1742.
4. Anderson, C. M., Park, Y. A., Chang, Y. T., Yang, C. H., Lee, T. W., Luo, M.
(2008)A game-theoretic analysis of competition among container port hubs: the
case of Busan and Shanghai. Maritime Policy & Management, 35(1), 5-26.
5. Bonabeau, E. (2002) Agent-based modeling: Methods and techniques for
simulating human systems. Proceedings of the National Academy of Sciences,
99 (3), 7280–7287.
6. Basso, L. J. and Zhang, A. (2008) Sequential peak-load pricing: The case of
airports and airlines. Canadian Journal of Economics,41(3), 1087–1119.
7. Brooks, M.R. (1992) Issues in North American Container Port Competitiveness,
Journal of the Transportation Research Forum, 32, 333-343.
8. Cullinane, K., Fei, W. T., Cullinane, S. (2004) Container terminal development
in Mainland China and its impact on the competitiveness of the Port of Hong
Kong. Transport Reviews, 24(1) 33-56,
9. De Borger, B. Van Dender, K. (2006) Prices, capacities and service levels in a
congestible Bertrand duopoly. Journal of Urban Economics,60(2), 264–283.
10. Haralambides. H. (2014) Port Management, Palgrave Readers in Economics.
11. Heaver, T. D. (1995) The implications of increased competition among ports for
port policy and management. Maritime Policy &Management, 22(2), 125-133.
12. Helling, A., Poister, T. H. (2000) US maritime ports :Trends, policy implications,
and research needs.Economic Development Quarterly, 14, 300-317.
13. Hooke, R. and Jeeves, T. A. (1961) Direct search solution of numerical and
statistical problems. Journal of the Association for Computing Machinery, 8(2),
212–229.
14. Hoshino, H. (2010) Competition and collaboration among container ports. The
Asian Journal of Shipping and Logistics, 26(1), 031-048.
15. Ishii, M., Lee, P. T. W., Tezuka, K., Chang, Y. T. (2013) A game theoretical
analysis of port competition. Transportation Research Part E: Logistics and
Transportation Review 49(1), 92-106.
16. Jimenez, J. L., Valido, J., Moran, N. (2018) Do Maritime Passengers’ subsidies
in Europe affect prices? Maritime Policy & Management 45(7), 911-923.
17. Kavirathna, C., Kawasaki, T., Hanaoka, S. (2018) Transshipment hub port
competitiveness of the Port of Colombo against the major Southeast Asian hub
ports. The Asian Journal of Shipping Logistics, 34(2), 71-82.
18. Kawasaki, T. Matsuda, T. (2015) Containerization of bulk trades: A case study of
US–Asia wood pulp transport. Maritime Economics & Logistics, 17(2), 179-197.
19. Kayano, H., and Ishiguro, K. (2014) Vessel calling schedule shippers’ port
choice behavior. Infrastructure Planning and Management, 70(5), 789-799 (in
Japanese).
20. Liedtke, G. (2009) Principles of micro-behavior commodity transport modeling,
Journal of the Eastern Asia Society for Transportation Studies, Vol.13, 2019
2276
Transportation Research Part E: Logistics and Transportation Review, 45(5),
795-809.
21. Luo, M., Liu, L., Gao, F. (2012) Post-entry container port capacity expansion.
Transportation Research Part B: Methodological,46(1), 120-138.
22. Matsushima, N., Takauchi, K. (2014) Port privatization in an international
oligopoly. Transportation Research Part B: Methodological, 67, 382–397.
23. Matsukura, Y., Seta, T. (2016) Development of evaluation method of measures
and policies for unit load land and sea intermodal transportation - Analysis of
incentive system for coastal shipping-. Journal of The Japan Society of Naval
Architects and Ocean engineers, 23, 213-222.
24. Ministry of Land, Infrastructure, Transport and Tourism (MLIT). (2011).
Outlook for cargo handling volume at ports.
http://www.mlit.go.jp/common/000145228.pdf. (in Japanese) [Accessed on 1st
November, 2018]
25. Ministry of Land, Infrastructure, Transport and Tourism (MLIT). (2017). Income
and expenditure reports for important ports.
http://www.mlit.go.jp/kowan/kowan_fr1_000051.html. (in Japanese) [Accessed
on 14thJune, 2019]
26. Ministry of Finance, Japan (MOF) (2018) Trade statistics of Japan.
http://www.customs.go.jp/ toukei/info/tsdl_e.htm [Accessed on 1stNovember
2018]
27. Ministry of Land, Infrastructure, Transport and Tourism (MLIT) (2014) The
Japanese National Survey on Import/Export Container Cargo Flow in
2013.http://www.mlit.go.jp/report/press/port03_hh_000018.html [Accessed on
15th May 2018]
28. Notteboom, T. (2009) Complementarity and substitutability among adjacent
gateway ports. Environment and PlanningA,41(3), 743–762.
29. Qu, C., Wang, G. W. Y., Zeng, Q. (2017) Modeling port subsidy policies
considering pricing decisions of feeder carriers. Transportation Research Part
E: Logistics and transportation Review, 99, 115–133.
30. Seo, J. S. and Ha, Y. S. (2010)The Role of Port Size and Incentives in the Choice
of Location by Port Users: A Game-Theoretic Approach. The Asian Journal of
Shipping and Logistics, 26(1), 49-65.
31. Sheng, D., Li, Z. C., Fu, X. Gillen, D. (2017) Modeling the effects of unilateral
and uniform emission regulations under shipping company and port competition.
Transportation Research Part E: Logistics and Transportation Review, 101,
99–114.
32. Slack, B. (1985) Containerization, inter-port competition, and port selection.
Maritime Policy & Management, 12(4), 293-303.
33. Terada, H. (2002) An analysis of the overcapacity problem under the
decentralized management system of container ports in Japan, Maritime Policy
& Management, 29(1), 3-15.
34. Tran, T. A. T., Takebayashi, M. (2018) Feasibility analysis of partial cooperation
between government and port in the multiple port system. Transport Policy
Studies' Review, 20, 30-39.
35. Waterfront Vitalization and Environment Research Foundation (WAVE). (2011)
“Handbook for the evaluation of port investment.” WAVE. (in Japanese)
36. Wang, H., Meng, Q., Zhang, X. (2014). Game-theoretical models for
competition analysis in a new emerging liner container shipping market.

Journal of the Eastern Asia Society for Transportation Studies, Vol.13, 2019
2277
Transportation Research Part B: Methodological, 70, 201–227.
37. Winkler, C. (2015) Transport user benefits calculation with the ‘Rule of a Half’
for travel demand models with constraints. Research in Transportation
Economics, 49, 36–42.
38. Xu, L., Govindan, K., Bu, X., Yin, Y. (2015) Pricing and balancing of the
sea–cargo service chain with empty equipment repositioning. Computers &
Operations Research, 54, 286–294.
39. Yang, C. C., Tai, H. H., Chiu, H. W. (2014) Factors influencing container
carriers’ use of coastal shipping, Maritime Policy & Management, 41(2),
192–208.
40. Yap, W. Y., Lam, J. S. J., Notteboom, T. (2006) Developments in container port
competition in East Asia. Transport Reviews, 26(2), 167-188,
41. Yin, J., Fan, L., Yang, Z., Li, K. X. (2014) Slow steaming of liner trade: Its
economic and environmental impacts. Maritime Policy & Management, 41(2),
149–158.