Embed Size (px)
Citation preview

University of Central Florida University of Central Florida
STARS STARS
Electronic Theses and Dissertations, 2004-2019
2011
Effects Of Hospital Structural Complexity And Process Adequacy Effects Of Hospital Structural Complexity And Process Adequacy
On The Prevalence Of Systemic Adverse Events And Compliance On The Prevalence Of Systemic Adverse Events And Compliance
Issues A Biomedical Engineering Technician Perspective Issues A Biomedical Engineering Technician Perspective
Beth Ann Fiedler University of Central Florida
Part of the Public Affairs Commons
Find similar works at: https://stars.library.ucf.edu/etd
University of Central Florida Libraries http://library.ucf.edu
This Doctoral Dissertation (Open Access) is brought to you for free and open access by STARS. It has been accepted
for inclusion in Electronic Theses and Dissertations, 2004-2019 by an authorized administrator of STARS. For more
information, please contact [email protected].
STARS Citation STARS Citation Fiedler, Beth Ann, "Effects Of Hospital Structural Complexity And Process Adequacy On The Prevalence Of Systemic Adverse Events And Compliance Issues A Biomedical Engineering Technician Perspective" (2011). Electronic Theses and Dissertations, 2004-2019. 1926. https://stars.library.ucf.edu/etd/1926

EFFECTS OF HOSPITAL STRUCTURAL COMPLEXITY AND PROCESS ADEQUACY ON THE PREVALENCE OF SYSTEMIC ADVERSE EVENTS
AND COMPLIANCE ISSUES: A BIOMEDICAL ENGINEERING TECHNICIAN PERSPECTIVE
by
BETH ANN FIEDLER
A.A., St. Petersburg College, 1984 B.Sc., Aero-Space Institute, 1992 A.Sc., Florida State College, 2005 M.Sc., Kettering University, 2007
A dissertation submitted in partial fulfillment of the requirements for the degree of Doctor of Philosophy
in the Doctoral Program in Public Affairs in the College of Health and Public Affairs
at the University of Central Florida Orlando, Florida
Summer Term 2011
Major Professor: Thomas T.H. Wan

ii
©2011 Beth Ann Fiedler, All Rights Reserved.

iii
I dedicate this dissertation to the memory of my parents—Betty J. Myhre and Sandor Fiedler,
and of those friends, family and fellow students whom I have lost during this journey. Though no
longer on this earth, they will continue to remain part of me for so many reasons.

iv
ABSTRACT
Active interdepartmental participation of the biomedical engineering technician (BMET)
with clinicians is an opportunity to reduce systemic events guided by empirical evidence that 1)
establishes adverse events with medical equipment and 2) associates nursing effectiveness with
access to functioning equipment. Though prior research has documented interdependency in
nurse-physician relationships (and in such non-clinical health support services as laboratory and
pharmaceutical departments), few studies in mainstream literature on quality have related
medical professional interdependencies to the BMET. The promotion of National Patient Safety
Goals, federal legislation (the Safe Device Act of 1990), and recommendations from agencies—
The Joint Commission and the United States Center for Disease Control and Prevention (CDC),
all point to a multidisciplinary approach for detecting and resolving systemic problems.
Therefore, comprehending the interdependent role of the BMET in hospital care is important for
reducing persistent problems like Nosocomial Infections (NI) and other adverse systemic events
that affect clinical outcomes.
Industry research documents the positive contributions of BMET professional integration
into facility management in Management Information Systems (MIS), and empirical evidence
has shown that their professional contributions influence nursing performance and thus, patient
outcomes. Yet, BMET integration to departments like Infection Control and Central Sterile
where BMETs’ specific knowledge of medical equipment can apply directly is rare, if not
entirely absent. Delaying such professional integration can hamper effective response to offset
the Centers for Medicare and Medicaid (CMS) payment reductions that went into effect on
October 1, 2008. The CMS denies payment for treatment of infections it deems ‘preventable’ by

v
proper interdependent precautions. Infections already under scrutiny as preventable include
mediastenitis, urinary tract infections, and catheter-related blood stream infections. Furthermore,
formal Medicare Conditions of Participation (CoP) now require hospitals to develop initiatives to
reduce medical errors by identifying and addressing threats to patient safety. In both these
challenges the medical equipment used in clinical care can adversely affect patient outcomes.
Clearly, the health care system must tackle the common healthcare associated infections (HAI)
just mentioned as well as others that may be added to the CMS list, or face overwhelming
financial costs. Understanding the BMET professional relationship with nursing, given the
structural and process considerations of the level of quality (LOQ) as measured by Clinical
Effectiveness, Clinical Efficiency, and Regulatory Compliance, will be essential for meeting this
challenge.
This study’s extensive literature review led to the development of a conceptual
hypothesized model based on Donabedian’s 1988 Triad of Structure, Process, and Outcome and
fused with Integrated Empirical Ethics as a foundation for BMET professional interdependency
and for consolidated attack on adverse systemic events. This theoretical integration has the
potential to advance quality of clinical care by illuminating the factors directly or indirectly
influencing patient outcomes. Primary data were gathered through the Biomedical Engineering
Interdepartmental Survey that collected BMETs’ professional perceptions of organizational
factors (Structural Complexity), process factors (Process Adequacy), and Level of Quality and
Control variables yielding information about the individual respondents and the facilities where
they work. The unit of analysis in this study is the biomedical engineering technician functioning
in hospital support services to ensure patient safety and quality of care. Initial survey results
underwent data cleansing to eliminate the impact of missing items. Next, Confirmatory Factor

vi
Analysis applied to the survey data determined the construct validity and reliability of the
measurement instrument. Statistically tested regression models identified structure and process
factors that may affect the LOQ in terms of systemic adverse events and lack of compliance.
The statistical analysis and assumption tests that confirm internal validity infer that
hospital Level of Quality is significantly influenced at R2=88.1% by Structural Complexity. The
combined measurement model and models for each latent construct achieved Cronbach α results
>0.7, indicating internal reliability of the Biomedical Engineering Interdepartmental (BEI)
survey instrument.
The final measurement models of the latent constructs—structural complexity (six
factors), process adequacy (five factors), and level of quality (six factors) are correlated and
significant at t>1.96, p<.001 (2-tailed). The Structural Equation Model without controls are
correlated and significant at t>1.96 on all factors, indicating an approximate standard distribution
at p<.001 level (2-tailed). Goodness of fit model analysis findings indicates that the models
reasonably fit the data. The largest correlation is expressed between structural complexity and
process adequacy (0.217 to 0.461), p=.01 (2-tailed). Respondent and facility control variables
added to the Structural Equation Model are correlated with low impact but not statistically
significant.
The findings have implications for theory, methodology, external policy, and internal
hospital administrative management. The theoretical contributions of the study include the
instrument development, measurement models, and the Structural Equation Model for hospital
level of quality. The statistical analysis of the relationships of Donabedian’s Triad indicates that
both structural complexity and process adequacy are explanatory for the outcome variable of
level of quality. Several statistically significant predictors of quality support an integrated
vii
approach to systemic problems. They are Uniform Standards, Inter-Professional Training,
Coordination Evidence, Interdepartmental Work and Device Failure Recognition. Moreover, the
application of Integrated Empirical Ethics provides a foundation for management resolution that
can improve the hospital level of quality by consolidating divergent internal and external
controls by providing implementation guidance to overcome medical plurality as empirical
evidence continues to emerge. The study defines the outcome measures of Quality—
Effectiveness, Efficiency, and Regulatory Compliance in the context of Clinical Engineering.
The study results suggest pertinent external policy recommendations, foremost of which
arises from the responses to the item concerning Uniform Standards: “Standards are applied
equally across all departments.” In the BMET community, only about 20 per cent strongly agree
with this statement; approximately 33 per cent agree. Because of divergent ethical and national
regulatory policies applied to professional affiliations rather than the medical community at
large, a policy adapting regulatory initiatives having the same focus on patient outcomes (e.g.,
CMS CoP; National Patient Safety Goals) would generate the best initiatives for reducing
systemic adverse events and policy conflicts. Finally, results suggest that internal hospital
administrators can improve the level of quality through internal process changes, in particular by
addressing the process adequacy factor of Regular Meetings for the survey item: “Nursing and
biomedical engineering conduct regularly scheduled meetings on equipment issues.” Less than
10 per cent of the BMETs surveyed strongly agreed and about one-third agreed that this aspect of
interdepartmental teamwork was accepted.
The study confirms the evolution of the interdependent professional dynamic within
healthcare exemplified by the combination of multiple predictors of the Level of Quality from
Organizational Culture, Level of Coordination and Interdepartmental Medical Device

viii
Management. Hospital administrators can find simple, cost-effective solutions to improve
clinical effectiveness (a key indicator of quality) in the components of the intervening variable of
process adequacy. For example, statistical evidence shows that regular meetings between nursing
and biomedical staff about equipment issues and/or linking the BMET department goals to
Organization Objectives are ways to improve quality.

ix
ACKNOWLEDGMENTS
As for any great personal milestone, it is my privilege to acknowledge those who have
aided this quest. Several friends both old and new, family, and academicians have provided
physical, spiritual, academic and financial support in many ways—great and small. This task was
difficult with their support, improbable without it.
First, I extend my gratitude to the Chairman of my dissertation committee, Dr. Thomas
T.H. Wan, for his ability to translate large concepts during small windows of opportunity. I am
indebted for his introduction to Structural Equation Modeling. I want also to thank the members
of my committee: Dr. Stephen Sivo, Dr. Reid M. Oetjen, and Dr. Roger A. Bowles, each of
whom reflect unique facets within the respective contents of this document—statistics, hospital
quality management, and biomedical engineering technician knowledge. Their cumulative
contribution to my knowledge has been a tremendous benefit advancing this dissertation. I can
only hope that I have applied the knowledge adequately to do them all justice.
Finally, I would like to thank the men and women of the Biomedical Engineering
Technician community for taking the time to complete the study survey, and for their daily
dedication to patient safety. In particular, I thank Mr. Patrick Lynch, Biomedical Support
Specialist at Global Medical Imaging in Charlotte, North Carolina for providing the initial
contact list of Biomedical Engineering Technicians. My appreciation of this act of trust is
especially heartfelt; it is indicative of how the health support services community is truly
dedicated to supporting optimal patient outcomes.

x
TABLE OF CONTENTS
LIST OF FIGURES ............................................................................................................... xii LIST OF TABLES ................................................................................................................ xiii LIST OF ACRONYMS ........................................................................................................ xiv CHAPTER 1 : INTRODUCTION .......................................................................................... 1
1.1 Problem Statement and Research Questions ............................................................ 1 1.2 Study Significance ..................................................................................................... 6 1.3 Study Scope .............................................................................................................. 12 1.4 Theoretical Premise ................................................................................................. 14 1.5 New Literary Contributions..................................................................................... 15
CHAPTER 2 : LITERATURE REVIEW ............................................................................. 17 2.1 Organizational Performance in Healthcare and Other Industries ......................... 18 2.2 Organizational Performance Metrics in Clinical Engineering .............................. 26 2.3 Summary................................................................................................................... 32
CHAPTER 3 : THEORETICAL FRAMEWORK ............................................................... 34 3.1 The Structure-Process-Outcome Theory ................................................................ 36
3.1.1 Structural Complexity: Latent Exogenous Construct and Measurement Variables…. ............................................................................................................ 41 3.1.2 Process Adequacy: Latent Intervening Construct and Measurement Variables……. ........................................................................................................ 50 3.1.3 Level of Quality: Latent Endogenous Construct and Measurement Variables……… ..................................................................................................... 64
3.2 Integrated Empirical Ethics Theory ........................................................................ 69 3.3 Control Variables ..................................................................................................... 73
3.3.1 Respondent Information................................................................................ 73 3.3.2 Organizational or Facility Information ........................................................ 74
3.4 Hypothesis Statements ............................................................................................. 74 3.5 Theoretical Summary............................................................................................... 75
CHAPTER 4 : METHODOLOGY ....................................................................................... 76 4.1 Participants and Data Cleansing ............................................................................. 77 4.2 Sampling ................................................................................................................... 78 4.3 Materials, Instrumentation Reliability, and General Procedure ............................ 80 4.4 Design of the Study.................................................................................................. 88
4.4.1 Multi-Normal Distribution Assumptions ..................................................... 89 4.5 Variables ................................................................................................................... 92
4.5.1 Endogenous Variable: The Level of Quality ............................................... 92 4.5.2 Exogenous Variable: Structural Complexity ............................................... 93 4.5.3 Process Adequacy: An Endogenous Intervening Variable ......................... 93 4.5.4 Operational Definitions ................................................................................. 94 4.5.5 Control Variables .......................................................................................... 98
4.6 Structural Equation Modeling and Goodness of Fit Metrics............................... 100 CHAPTER 5 : FINDINGS .................................................................................................. 102
5.1 Descriptive Statistics.............................................................................................. 103 5.2 Correlation Statistics .............................................................................................. 107

xi
5.2.1 Correlation Between Structural Complexity and Process Adequacy ....... 107 5.2.2 Correlation Analysis of Structural Complexity and Level of Quality ..... 108 5.2.3 Correlation Analysis of Process Adequacy and Level of Quality ............ 109 5.2.4 Correlation Analysis of Control Variables ................................................ 110
5.3 Measurement Models............................................................................................. 111 5.3.1 Structural Complexity Measurement Model ............................................. 112 5.3.2 Process Adequacy Measurement Model .................................................... 116 5.3.3 Measurement Model for Level of Quality ................................................. 120 5.3.4 Structural Equation Model and Findings of the BEI Survey .................... 123
5.4 Hypothesis Test Results......................................................................................... 137 5.5 Final Reliability Analysis SEM Model ................................................................ 138 5.6 Additional Findings: Intervening Status of Process Adequacy........................... 140 5.7 Control Variable Frequency Distribution ............................................................. 143 5.8 Response Distribution for the Observed Variables .............................................. 147
CHAPTER 6 : DISCUSSION AND RECOMMENDATIONS ........................................ 149 6.1 Discussion............................................................................................................... 149
6.1.1 Level of Quality ........................................................................................... 150 6.1.2 Structural Complexity ................................................................................. 153 6.1.3 Process Adequacy........................................................................................ 154 6.1.4 Clinical Effectiveness, Clinical Efficiency, and Regulatory Compliance155
6.2 Implications ............................................................................................................ 156 6.2.1 Theoretical Implications ............................................................................. 156 6.2.2 External Policy ............................................................................................ 157 6.2.3 Internal Hospital Administrative Management Policy.............................. 158
6.3 Limitations.............................................................................................................. 160 6.4 Recommendations for Future Study ..................................................................... 162 6.5 Summary................................................................................................................. 162
APPENDIX A: STUDY AUTHORIZATION AND IMPLEMENTATION .................... 164 APPENDIX B: INTERNAL REVIEW BOARD LETTER OF APPROVED RESEARCH....................................................................................................................................... ……166 APPENDIX C: RELIABILITY ANALYSIS ..................................................................... 169 APPENDIX D: ASSUMPTION TESTS ............................................................................ 173 APPENDIX E: REGRESSION ANALYSIS .................................................................... 183 APPENDIX E 1: DETAILED REGRESSION ANALYSIS ............................................. 198 APPENDIX F: BIOMEDICAL ENGINEERING INTERDEPARTMENTAL SURVEY INSTRUMENT .................................................................................................................... 207 LIST OF REFERENCES .................................................................................................... 228

xii
LIST OF FIGURES Figure 3.1 Modified Structure-Process-Outcome Model .....................................................39 Figure 3.2 Conceptual Model of Structure-Process-Outcome Dimensions of the Biomedical Engineering Technician Healthcare Support Personnel ..................................40 Figure 3.3 Unconditioned Analytical Model with Three Latent Variables Indicating Hypothesized Relationships Between Predictor Variables and the Level of Quality in Clinical Engineering as Measured by the Contributions of the Biomedical Engineering Technician ...............................................................................................................................75 Figure 5.1 Final Revised Measurement Model of Structural Complexity ....................... 114 Figure 5.2 Final Revised Measurement Model of Process Adequacy ............................. 118 Figure 5.3 Final Revised Measurement Model of Level of Quality ................................ 121 Figure 5.4 Intermittent Revised Congeneric Structural Equation Model of Structural Complexity and Process Adequacy as Organizational Determinants of Level of Quality in the Hospital Environment of Care ...................................................................................... 126 Figure 5.5 Structural Equation Model for the BEI Survey with Control Variables ........ 130
xiii
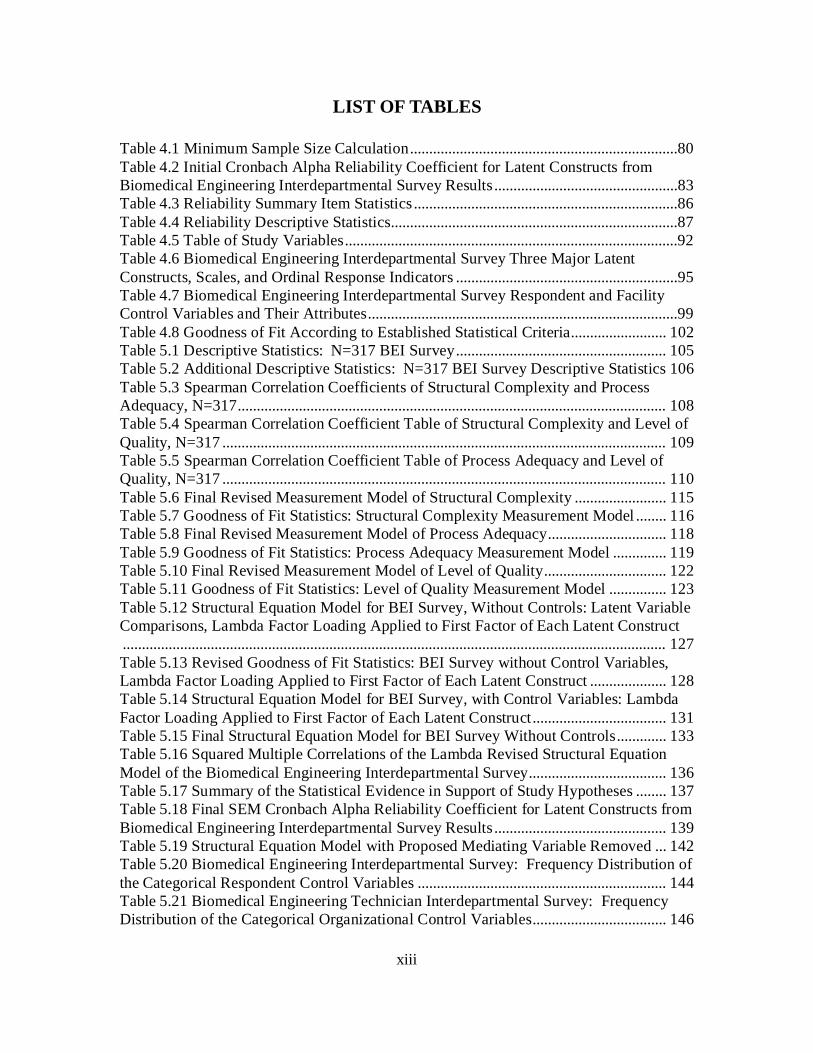
LIST OF TABLES Table 4.1 Minimum Sample Size Calculation ......................................................................80 Table 4.2 Initial Cronbach Alpha Reliability Coefficient for Latent Constructs from Biomedical Engineering Interdepartmental Survey Results ................................................83 Table 4.3 Reliability Summary Item Statistics .....................................................................86 Table 4.4 Reliability Descriptive Statistics...........................................................................87 Table 4.5 Table of Study Variables .......................................................................................92 Table 4.6 Biomedical Engineering Interdepartmental Survey Three Major Latent Constructs, Scales, and Ordinal Response Indicators ..........................................................95 Table 4.7 Biomedical Engineering Interdepartmental Survey Respondent and Facility Control Variables and Their Attributes .................................................................................99 Table 4.8 Goodness of Fit According to Established Statistical Criteria......................... 102 Table 5.1 Descriptive Statistics: N=317 BEI Survey ....................................................... 105 Table 5.2 Additional Descriptive Statistics: N=317 BEI Survey Descriptive Statistics 106 Table 5.3 Spearman Correlation Coefficients of Structural Complexity and Process Adequacy, N=317 ................................................................................................................ 108 Table 5.4 Spearman Correlation Coefficient Table of Structural Complexity and Level of Quality, N=317 .................................................................................................................... 109 Table 5.5 Spearman Correlation Coefficient Table of Process Adequacy and Level of Quality, N=317 .................................................................................................................... 110 Table 5.6 Final Revised Measurement Model of Structural Complexity ........................ 115 Table 5.7 Goodness of Fit Statistics: Structural Complexity Measurement Model ........ 116 Table 5.8 Final Revised Measurement Model of Process Adequacy ............................... 118 Table 5.9 Goodness of Fit Statistics: Process Adequacy Measurement Model .............. 119 Table 5.10 Final Revised Measurement Model of Level of Quality ................................ 122 Table 5.11 Goodness of Fit Statistics: Level of Quality Measurement Model ............... 123 Table 5.12 Structural Equation Model for BEI Survey, Without Controls: Latent Variable Comparisons, Lambda Factor Loading Applied to First Factor of Each Latent Construct .............................................................................................................................................. 127 Table 5.13 Revised Goodness of Fit Statistics: BEI Survey without Control Variables, Lambda Factor Loading Applied to First Factor of Each Latent Construct .................... 128 Table 5.14 Structural Equation Model for BEI Survey, with Control Variables: Lambda Factor Loading Applied to First Factor of Each Latent Construct ................................... 131 Table 5.15 Final Structural Equation Model for BEI Survey Without Controls ............. 133 Table 5.16 Squared Multiple Correlations of the Lambda Revised Structural Equation Model of the Biomedical Engineering Interdepartmental Survey .................................... 136 Table 5.17 Summary of the Statistical Evidence in Support of Study Hypotheses ........ 137 Table 5.18 Final SEM Cronbach Alpha Reliability Coefficient for Latent Constructs from Biomedical Engineering Interdepartmental Survey Results ............................................. 139 Table 5.19 Structural Equation Model with Proposed Mediating Variable Removed ... 142 Table 5.20 Biomedical Engineering Interdepartmental Survey: Frequency Distribution of the Categorical Respondent Control Variables ................................................................. 144 Table 5.21 Biomedical Engineering Technician Interdepartmental Survey: Frequency Distribution of the Categorical Organizational Control Variables ................................... 146

xiv
LIST OF ACRONYMS
• BEI Survey - Biomedical Engineering Interdepartmental Survey • BMET - Biomedical Engineering Technician • CE - Clinical Engineering • EC - Environment of Care • IEE - Integrated Empirical Ethics • LOQ - Level of Quality • MI - Modification Indices • PA – Process Adequacy • SC – Structural Complexity • SEM – Structural Equation Model • SPO – Structure, Process, Outcome
1
CHAPTER 1: INTRODUCTION The objectives of this study are to: 1) determine if the modified Structural-
Process-Outcome model is measureable, 2) assess the relevance of the survey instrument
to the study population, 3) identify hospital structural characteristics and process factors
that affect the level of quality (LOQ) in US hospitals, and 4) understand the relationships
between the LOQ and three healthcare outcomes (e.g., clinical effectiveness, clinical
efficiency, and regulatory compliance).
1.1 Problem Statement and Research Questions The purpose of this research is posited under Organizational Performance Theory.
The theoretical premise elicits a general question: “Can integration of biomedical
engineering technicians (BMETs) in the general hospital environment of care (EC)
contribute to improved quality performance by reducing the likelihood of systemic
adverse events and compliance issues?”
Hospital acquired infections (HAIs) in the United States have been linked to
approximately 100,000 deaths and an excessive financial burden of $20-$30 billion due
to complications and their subsequent treatment for 2 million patients (McFee, 2009,
p.423; Stock, McFadden, & Gowen, 2007, p. 368; Gowen, McFadden, Hoobler, &
Tallon, 2006, p. 765; Burke, 2003, p. 651).
Recent findings of a Department of Health and Human Services study of 780
randomly selected Medicare beneficiaries during October 2008, reported by the Office of
the Inspector General, estimate that 135,000 patients annually experience at least one

2
adverse medical event resulting from medical care (Office of the Inspector General, 2010,
p. 15). Those 135,000 patients are the 13.5% of Medicare recipients in the retrospective
study that received medical treatment and were discharged reporting an adverse event.
An adverse medical event is defined in terms of patient harm under the following
criteria: that a medical practitioner has established that an event occurred, and that the
event could be categorized as a Serious Reportable Event or as one of Medicare Hospital-
Acquired Conditions (HAC). The National Quality Forum defined Serious Reportable
Events as those occurring in the administration of pharmaceutical products, in patient
care including surgical or other procedures in the general environment of care, and in the
use of medical equipment (National Quality Forum, 2007, p.7 as cited in OIG, 2010,
p.37). Medicare HACs span infections from the use of medical equipment, from patient
falls, or from poor treatment of co-morbidity conditions such as diabetes (Federal
Register, 2008, p. 48434, 48471 as cited in OIG, 2010, p. 38). Estimates of the impact of
adverse events are deaths numbering “15,000 is a single month” (OIG, p. 19) or
approximately 180,000 annually that may at least contribute to patient mortality. The
financial impact of temporary morbidity (less debilitating adverse events) approached
$4.5 billion dollars annually in 2008 (OIG, p. 27).
Reported morbidity and mortality for the last decade as related to several areas of
health care and administration implies that a broad systems approach addressing multiple
interfaces between individuals and organizational policy-driven processes must be
developed. The justification for this approach includes the moderately successful hand
sanitation campaigns (Kevin Sack, New York Times for October 8, 2008) and healthcare

3
industry guidelines to reduce patient mortality and morbidity from adverse events —
specifically medical error and HAIs (Francis, 2008).
Nosocomial or healthcare-acquired infections (HAI) are the most prevalent
adverse events in hospitalization and are in the top tier of causes of death in the United
States (McFee, 2009; Gowen et al., 2006; McCaughey, 2005). The number of adverse
events persists despite the many quality management initiatives that have attempted to
reduce them (Burke, 2003). Despite the established link between adverse medical events
and medical devices, since the early 1960’s the biomedical engineering technicians
(BMETs) have had limited opportunities to fulfill their role in risk prevention by
addressing problems beyond their duties in medical equipment electrical safety (Cohen,
Bakuzonis, Friedman, & Roa, 1995; Anderson, 1992; United States Association of
Military Trained BMETs, n.d.). As a result, only a handful of quality measures with the
BMET community have been introduced recognizing BMETs as an internal mechanism
to improve hospital quality of care (QOC) (Ridgeway, Atles, & Subhan, 2009; Williams,
2009; Dey & Hariharan, 2006; Dondelinger, 2006; Cram, Stephens, & Lessard, 2004).
Schutz-Stubner, Hauer, and Dettenkofer (2003, p. 442) assert that the particular
maintenance services that the BMET is qualified to perform are an “indispensible
prerequisite for successful disinfection and sterilization.” The BMET is the only
professional staff member with the ability and authorization to perform a complete cycle
of electrical medical equipment’s disassembly, cleansing, and return to operational status,
under the federal Occupational Safety and Health Act of 1970. The OSHA Act created
electrical safety standards for medical equipment. Though a few studies of nursing have
noted the reliance on BMET professionals for this important function, significant analysis
4
of this arena is lacking. Yet, formidable data are available that link nursing performance
measurement objectives to “workplace practices [that] include organizational
performance, interdisciplinary collaboration, equipment failures, and documentation
burden” (Needleman, Kurtzman, & Kizer, 2007, p. 11S).
According to the United States Centers for Disease Control and Prevention
(2003), the current procedures for cleaning and transfer of medical equipment between
patients by non-BMETs may comprise only superficial cleaning (Hall, 2008) that has
minimal effectiveness against bacteria, particularly Methicillin-Resistant Staphylococcus
Aureus (MRSA) and various strains of Nosocomial Infection. Though non-BMET
personnel adhere to hospital protocols, they are not allowed to disassemble components
that may require more elaborate cleansing which limits their ability to perform complete
cleansing and sanitation.
Moreover, at present, BMET medical equipment protocols and professional
definitions do not identify cleansing as part of the BMETs occupational definition. The
generally acknowledged professional duties of a BMET include “maintenance, repair,
and calibration of medical electronic equipment found in hospitals, including ventilators,
infusion pumps, patient monitors, defibrillators, and ultrasound machines (Bowles, 2008,
p.1). For risk prevention, however, the proposition of an integrated BMET role is salient
according to industry representatives (Fennigkoh, 2005, Cram et al., 2004; Baker, 2003;
Cohen et al., 1995, Anderson, 1992).
Burke (2003) reported that recognition of the causal relationship of NI disease to
HAIs had prompted a change in payment by the Centers for Medicare and Medicaid
Services (CMS): effective October 1, 2008, they no longer pay for three infections they

5
have deemed preventable, namely mediastenitis, urinary tract infections, and catheter-
related bloodstream infections. Those three diseases account for about 80% of
nosocomial infections (Burke, 2003, p. 651). They are grouped in four specific types: 1)
urinary tract infection (usually catheter-associated), 2) surgical site infection, 3)
bloodstream infection (usually associated with intravascular device use), and 4)
pneumonia (usually associated with ventilator use). “For each of the device-associated
infections, multiple risk factors are related to the patient, the personnel caring for the
patient, the procedures they use, and the actual device” (Burke, 2003, p. 652). As targeted
data about those risk factors are gathered, the potential expansion of HAIs excluded from
reimbursement may further strain an already constricted industry.
The causal relationships between medical equipment and patient infection that
have been widely documented by scholars include but are not limited to cardiac catheters,
colonoscopy gastrointestinal endoscopes, stethoscopes, and ventilators (McFee, 2009;
Schabrun & Chipchase, 2006; McCaughey, 2005; Burke, 2003). Halcomb, Griffiths, and
Fernandez conclude specifically that there is a ‘link between the environment and
hospital equipment and the transmission of MRSA within the acute hospital setting”
(2008, p. 50) recognized by the U.S. Department of Health and Human Services, Center
for Disease Control and Prevention (2003). Schraburn and Chipchase (2006) have
provided a systematic review of healthcare equipment as a repository for nosocomial
infection. In addition, Henderson (2008, p.294) has attributed the potential for increased
risk due to the “blind reliance on the safety and efficacy of new (presumably safer)
devices and procedures.” The above findings coupled with the rigor required for
successful cleansing and disinfection in complex operational and maintenance procedures

6
supports the expanded role of the BMETs in effective health care. Currently responsible
for preventative maintenance and repair of medical equipment, the BMET may be a key
element in a systems approach that would succeed in reducing adverse events such as
medical errors and HAI.
Recognizing the complex nature of the healthcare industry in multi-disciplinary
environments, this study considers multiple latent and observed indicators derived from
the responses to a custom questionnaire distributed to the BMET study population. The
study addresses the following research questions:
RQ1: Are the constructs Structural Complexity, Process Adequacy, and Level of Quality measurable? RQ2: What is the relationship between structural complexity and process adequacy? RQ3: What is the relationship between structural complexity and the level of quality in the hospital environment of care? RQ4: What is the relationship between process adequacy and the level of quality in the hospital environment of care?
1.2 Study Significance
Despite the plethora of evidence that multi-disciplinary teamwork can improve
patient outcomes (Edmond, 2009; Hagtvedt, Griffin, Keskinocak, & Roberts, 2009;
Fewster-Thuente & Velsor-Friedrich, 2008; Molleman, Broekhuis, Stoffels, & Jaspers,
2008; Xyrichis & Lowton, 2008; D’Amour, Ferrada-Videla, Rodriguez, & Beaulieu,
2005; Yeager, 2005; McFadden, Towell, and Stock, 2004; Connor, Ponte, & Conway,
2002), consideration of the BMET profession potential to improve quality of care, and
the relevant empirical studies or non-empirical case studies have appeared only in

7
biomedical and clinical engineering literature (Williams, 2009; Dondelinger, 2008;
Ebben, Gieras, & Gosbee, 2008; Hall, 2008; Wayre, 2008; Bakuzonis et al., 2007;
Hunter, 2007; Williams, 2007; Fennigkoh, 2005; Subhan, 2005; Cram et al., 2004; Xu et
al., 1997; Moniz, Calvin, & Stankiewicz, 1995; Yadin & Rohe, 1986).
A few policy applications recognizing how the BMET function of preventive
medical equipment maintenance contributes to quality efficiencies have made their way
to the mainstream literature (Podgorelec, Grasic, & Pavlic, 2009; Dey and Hariharan,
2006; Podgorelec and Kokol, 2001). With Infection Control now a primary target of
National Patient Safety Goals (McFee, 2009; McFadden et al., 2004), inclusion of the
BMET skill set in the infection control department (historically a nursing domain)
receives serious attention due to the link between nursing effectiveness and the
availability of operational medical equipment (Needleman et al., 2007; Schutz-Stubner et
al., 2003; Carr, 1994; Yadin & Rohe, 1986).
Clinical Engineers (CEs), BMETs, and other medical technology professionals
now recognize the necessity to communicate their expertise in patient safety issues so
that their unique abilities are made full use of in the healthcare community. Inter-
professional information transfer to senior management, administrators, and clinical
personnel is critical to furthering effective response to systemic problems. “Keeping the
clinical staff informed helps administrators and budget officers better see how safety is an
integral element in the delivery of patient care" (Bakuzonis et al., 2007, p. 68-69).
This study aims to address that concern in three ways: 1) use of a custom survey
derived from Donabedian’s Triad and existing literature to measure the perceptions of
LOQ among a national sample of the BMET population (and future healthcare

8
professionals); 2) examination of how structural complexity and process adequacy affect
the LOQ of hospital care; and 3) using the BMET profession as the unit of analysis to
capture the relationship of LOQ, Clinical Effectiveness, Clinical Efficiency, and
Regulatory Compliance.
The study aims have two regulatory foundations. First, the United States
regulatory body—The Joint Commission (formerly the Joint Commission on
Accreditation of Healthcare Organizations or JCAHO) has current Infection Control
Guidelines IC.8.10 that explicitly recommend organizational collaboration to combat
systemic problems by establishing an Infection Control Department (Baran, 2004).
Recent studies have found sparse or no evidence of such efforts by clinicians,
administration, or health care support services (e.g., biomedical engineering technicians
who maintain and repair medical equipment; hospital epidemiologists; facility
maintenance staff) (Edmond, 2009; Hagtvedt, et al., 2009; Patel, Srinivasan & Perz,
2008; Anderson, Rasch, Hochlin, Jensen, Wismar, & Fredrickson, 2006; Hota, 2004;
McFadden et al., 2004). The second key regulatory impetus is The Joint Commission
Environment of Care or EC.4.1 Guidelines (JCAHO, 2001, p.3) that require a healthcare
facility to monitor, collect information (EC.4.1.a), and use an integrated organizational
response (EC.4.1.b) to conditions that threaten patient outcomes. Directives for
collaborative corrective action are also embedded in the intent of EC.4.3, which requires
measurements to be reported to a multidisciplinary team responsible for correcting EC
problems.
Healthcare administrators have responded to the regulatory pressure by tracking
various strains of NI when they appear 48 hours or more after hospital admission or
9
within 30 days of discharge. But, there has been little empirical research to discover
whether the tracking information reaches the appropriate personnel and prompts
corrective action. In a reported instance when TJC required response to a sentinel event,
unanswered questions persisted: “For example, does it reduce repetition of the event in
question?” and “Does it indicate that a significant event at one location is reflective of a
general problem?” (Bakuzonis et al., 2007, p.69). Calculation of the number of sentinel
events is only the beginning for a comprehensive, in-depth analysis that should drive
preventive measures, not simply continue a reactive response.
In 2010, CMS issued a Final Quality Assessment and Performance Improvement
(QAPI) program that set forth additional Medicare Conditions of Participation (CoP). The
new rules require hospitals to develop initiatives that reduce medical errors by identifying
the threats to patient safety. The Final Rule in the Public Register stipulates that events be
reported so that knowledge about processes is documented with information technology
to ensure actions are taken to solve the problem. Thus, the CoP advocates a complete
cycle of identification, solution, implementation, and monitoring for solution evaluation.
The CoP update to QAPI also consolidates quality standards across all facilities eligible
for Medicare reimbursements, to supersede divergent regulations organizations encounter
in private or state accreditations.
TJC’s National Patient Safety Goals (NPSG) effective July 1, 2010 listed goals to
improve these problems: patient identification, communication among caregivers,
medication safety, health-care associated infections, medication reconciliations across the
continuum of care, risk of patient falls, pressure ulcers and general safety. The
applications of these goals vary with the types of service (Ambulatory Health Care,
10
Behavioral Health Care, Critical Access Hospitals, Home Care Hospitals, Laboratory
Services, Long Term Care, Medicaid and Medicare Long Term Care, and Office-Based
Surgery) and their associated mortality risks.
The NPSG are a basis for system goals in healthcare quality. The most effective
professional impact possible through collaboration, communication, and teamwork is
essential to those goals (Beckett & Kipnis, 2009). This study’s focus is reduction of the
risk of iatrogenic illnesses, so its emphasis is on NPSG Goals 2 and 7: “Improve the
effectiveness of communication among caregivers” and “Reduce the risk of healthcare-
associated infections.”
The absence of the BMET profession from the analysis of healthcare quality
stands in contradiction to several key circumstances: the evidence that medical equipment
is implicated in the increase of HAI (OIG, 2008; Burke, 2003), the necessity to tackle
systemic problems like HAI by including all key personnel as recommended by
Donabedian (1989); TJC accreditation according to Environment of Care (EC)
stipulations that all key personnel be involved in combatting systemic problems, and the
rising costs of health care. It follows that hospital management must understand and
apply all healthcare professional skills in order to achieve cohesive solutions across the
multiple professions at work in the hospital EC.
The lack of biomedical engineering technician (BMET) representation in hospital
Infection Control and Central Sterile Departments is confirmed in a pilot study of the
BMET community using a convenience sample (Fiedler & Agarwal, 2009). However, the
limited BMET integration that has occurred in the Management Information Systems
(MIS) departments of hospital organizations (CE-IT Integration from the IT Perspective,

11
2009) is in partial recognition of their valid contribution to patient health through
equipment monitoring, interfacing and implementation (Moorman, 2008; Bakuzonis et
al., 2007; Anderson et al., 2006). Researchers emphasize the importance for risk
reduction by recognizing the complexity of medical equipment (Beyea, 2009; Chaudhury,
Mahmood, & Valente, 2009; Anderson et al., 2006) due to the fact that “device interface
complexity is a great predictor of operator errors” (Baker, 2003, p. 188).
The levels of technology inherent in the complexity of medical equipment apply
to the adverse events related to medical errors but are not, however, the only causal
consideration in systemic infection control. For example, Falagas & Karagerogopoulos
(2009, p. 345) note that “relevant infection control measures should focus on reducing
patient-to-patient transmission via the inanimate environment, hospital personnel, and
medical equipment”. Therefore action against systemic problems must consider the
organizational environment where patient care is given and the complex
interdependencies there among healthcare personnel, medical equipment, and patients.
Better development of the inter-professional communication and knowledge translation
in a hospital’s organizational culture should be a priority (Waterson, 2009; Allegranzi,
Storr, Dziekan, Leotsakos, Donaldson, & Pittet, 2007; Connor et al., 2002).
At present the environmental outcomes and regulatory conditions in the hospital
EC require increased attention. A balanced approach to patient safety that emphasizes
concomitance in addressing medical errors and infection control issues should include an
understanding of complex professional relationships and their context (Waterson, 2009;
Fewster-Thuente & Velsor-Friedrich, 2008; Molleman et al., 2008; Fennigkoh, 2005).
Examination of a practical design for the interdepartmental integration of BMETs with

12
other medical professionals to meet regulatory requirements, taking into account the
interdependent relationships among patients, healthcare personnel, and medical
equipment, is called for.
1.3 Study Scope
Previous studies of the level of hospital quality of care with regard to systemic
problems have been limited not only by the exclusion of health support services such as
the BMET, but also by constrained access to clinical data on HAI tracking, and to
financial data such as equipment costs. Though access to dependable data is a pervasive
issue in healthcare research in terms of confounding factors (Lindsay, Schull, &
Bronskill, 2002), the development of new strategies for healthcare outcomes that
incorporate the BMET professional contributions can increase the generalizability of
interdependent findings across multiple platforms.
The literature on the relationship of the BMET’s contribution to the performance
of other healthcare professions is reviewed here. The benefits and potential shortcomings
of LOQ in relation to the BMET are discussed. A theoretical framework is constructed
for the measurement of outcome/quality indicators in relation to organizational and
contextual factors directly related to the maintenance and consequent availability of
medical equipment in the hospital EC. Survey respondents’ characteristics and facility
information are also used as control factors in the analysis. Statistical procedures:
correlation analysis, confirmatory factor analysis and the structural equation model,
analyze the study variables. The relationships between each predictor variable and LOQ
with selected healthcare outcomes recognized in the BMET field, is systematically

13
analyzed. Clinical effectiveness, efficiency, and regulatory compliance are the
measurement indicators for the dependent variable of level of quality. Organizational
characteristics of the hospital where the BMET is employed are independent variables.
The process of care or process adequacy is considered an intervening variable and
analysis in Section 5.6 investigates whether the contextual factor could serve as
moderating or mediating in the relationship between organizational factors and LOQ. The
results and their implications regarding the theoretical, methodological, and policy
applications are detailed and directions for future research are noted.
The BMET is a vital component of the spectrum of healthcare and understanding
it means evaluating BMETs’ potential to reduce the number of harmful patient events in
conjunction with nursing. This assumption is based on two premises: first, that an
approach to systemic issues must consider the organizational environment for patient
care; second, that the complex relationships among healthcare personnel, medical
equipment, and patients in an EC require a full understanding and development of the
inter-professional communication and knowledge translation inherent in its
organizational culture (Waterson, 2009; Allegranzi et al., 2007; Connor et al., 2002). The
examination of a possible design for interdepartmental integration between BMETs and
other medical professionals is an opportunity to close a gap in management of systemic
problems by better understanding of key personnel and their relationships.

14
1.4 Theoretical Premise
Donabedian’s (1966) Structure-Process-Outcomes (S-P-O) approach to healthcare
performance coupled with his quality assurance perspective on systemic problems (1989)
suggests that to promote systemic resolutions to problems of organizational performance,
it is necessary to incorporate multiple parties within the organization in that effort. The
current requirements under The Joint Commission’s Environment of Care (EC)
specifications and the Safe Medical Device Act of 1990 are strong motivations for
integrating key personnel in the effort to eliminate or avoid medical errors and hospital
acquired infections (HAIs).
Both theoretical considerations and regulatory conditions demand more attention
to the estimated 100,000-180,000 US deaths as well as the financial burden of treatments
($5-$30 billion) that result from such adverse events as hospital acquired infections (OIG,
2010, p. 19; McFee, 2009, p.423; Stock et al., 2007, p. 368; Gowen et al., 2006, p. 765;
Burke, 2003, p. 651).
The nursing profession has emphasized patient outcomes through the directives of
its Nursing Code of Ethics. However, the BMET occupation has been recognized as well,
as indirectly involved with patient outcomes through regulatory objectives for the
monitoring and maintenance of the medical equipment essential for the quality of patient
care. Because healthcare is driven by accountability objectives and metrics, a second
theoretical premise underpins this research—Integrated Empirical Ethics (IEE).
Fundamentally, “IEE refers to studies in which ethicists and descriptive scientists
cooperate together intensively” to reach a normative solution that balances moral theory

15
with the empirical data derived and applied in a social practice (Molewijk, Stiggelbout,
Otten, Dupuis, & Kievit, 2004, p.57).
Balancing science and ethics through IEE employs science to develop and apply
policies that recognize the contributions of individual practitioners, or in this case of
professional autonomy, in social practice. Interactive cooperation between participating
professionals such as BMETs and nurses can blend moral and scientific objectives to
establish practice norms in the EC that embody fundamental priorities across diverse
healthcare directives. Those norms should improve patient services and the quality of
their care (Molewijk, 2004; Molewijk et al., 2004). Together, the two theoretical
premises presented above are used to formulate three major hypotheses as detailed in
Chapter 3.
1.5 New Literary Contributions
Examination of the relationship between health support services and clinicians
using Donabedian’s Triad will illuminate how the dimensions of structural complexity
and process adequacy promote quality healthcare in a new era of collaboration. Multiple
research variables are included in deference to the fact that when the original
Organizational Performance theoretical principles were derived, hospital care was
primarily hierarchical and allowed less opportunity for interaction. This study’s approach
recognizes the continuous need for empirical information to promote successful
integration of the healthcare services that address systemic problems in interdependent
care. That approach hopes to elicit new factors from the statistical analysis that uniquely
combine the representative variables in the primary constructs of structure, process and

16
outcomes. Therefore, the research anticipates the formation of unique factors as
composites of important determinants in the relationships between variables that reflect
the complex interdepartmental and professional interactions necessary to pursue the
national goals for patient safety specifically, infection control and medical errors.
An account of current research on the quality of healthcare appears in Chapter 2:
Literature Review. The Theoretical Framework in Chapter 3 introduces Organizational
Performance Theory and the conceptual theoretical model. Methodology, Chapter 4,
contains the steps followed to develop a new survey instrument, sampling selection, and
the statistical analysis methods: Confirmatory Factor Analysis and Structural Equation
Modeling using SPSS, Inc. statistical software. Chapter 5 is a detailed analysis of the
results from the Biomedical Engineering Interdepartmental Survey. Finally, Chapter 6
provides Discussion and Recommendations, with specific implications for biomedical
engineering technicians and other healthcare support personnel.

17
CHAPTER 2: LITERATURE REVIEW
The previous chapter introduced the problem statement and research questions,
the study’s significance and scope, the fundamental theoretical premises, and expected
contributions of the investigation. This chapter is a literature review of the empirical
evidence for the use of performance metrics in developing the model and hypothesis.
The historical application of the major model constructs and the relevance of the
observed variables used as proxy measures are discussed.
Testing the hospital organizational level of quality as an indicator of performance
is premised on the acknowledgment that successful professional interdependency leads to
better quality in healthcare as well as in other industry sectors. In particular, this study
seeks to establish the contribution of the biomedical engineering technician in terms of
clinical engineering with patient care services associated with nursing. Scholars have
noted limitations in healthcare that arise from overlooking the relationship of non-clinical
health support to the clinical environment of care. Studies have focused primarily on
physician-nurse relationships and to some extent on nurse-pharmacy relationships. Given
this scenario, measurements in the literature will be reviewed for their relevance to this
study’s consideration of indicators of performance and performance as an evaluation
outcome, literary evidence validating the performance theoretical framework, and
hypothesis development. Further, evidence of the elements of organizational performance
in relation to interdepartmental measures of clinical engineering is used to test the
relationship of organizational structural complexity and processes in relation to hospital
level of quality as measured by effectiveness, efficiency, and regulatory compliance.

18
Nine independent latent constructs of hospital organizational structure and
interdepartmental processes and three dependent latent constructs of the quality of
clinical engineering outcomes and their observed variables were extracted by searching
an extensive academic online database of peer reviewed articles (MEDLINE, PsychInfo,
Education Resource Information Center (ERIC), Social Science Citation Index (SSCI),
GOOGLE SCHOLAR) and specialized biomedical and clinical engineering journals
(Biomedical Instrumentation & Technology, Journal of Clinical Engineering). The
following keywords were combined in multiple searches for pertinent items:
organizational performance, patient outcomes, quality, performance metrics, healthcare,
evidence-based, outcome measurement, healthcare outcomes, health care, and empirical
research.
Multiple empirical examples of organizational performance as an organizational
outcome in clinical engineering as well as in and other industries support the model and
hypothesis development in this study. The following sections—Organizational
Performance in Healthcare and Other Industries, and Organizational Performance in
Clinical Engineering—validate the theoretical framework and selection of predictive
latent constructs on the premise that quality is an outcome indicator of performance
predicted by organizational and operational features measurable by a survey of a national
sample of biomedical engineering technicians.
2.1 Organizational Performance in Healthcare and Other Industries
During the last twenty-five years, global competition among industrial leaders that
manufacture items ranging from automobiles to personal computers has shifted the focus
from traditional financial measurements to less tangible metrics such as consumer or

19
client satisfaction (Gomes, Yasin, & Lisboa, 2004) or to “culture, communication, and
knowledge” in Israeli local government operations (Carmeli & Tishler, 2004). As
production capacity limits to improve were realized from individual manufacturing
factors that calculated errors in terms of parts per million, and as service industries
emerged where administrative process improvements did not apply, the influence of
relationships within the work environment and to the client provided an alternative way
to measure organizational performance.
Despite variance in organizational performance indicators due to industry
perspectives, some general concepts are shared. For example, proponents have spent
decades identifying and defining core elements in the organization using policy analysis
with “classic economic criteria of effectiveness, efficiency, and equity” (Salamon, 2001,
p. 24) to improve levels of product and service delivery in the public and private sectors.
Those three criteria can objectively address the fundamental operational status of an
organization by answering certain questions. Did the organization meet their stated
objectives? Did the benefits exceed the costs? Did the organization manufacture,
distribute, or provide goods and/or services to address the needs of the vulnerable
populations? In short, the manufacturing vernacular would be to achieve effectiveness by
“doing the right things” and then “doing things right” to achieve efficiency (Tenner &
DeToro, 2000, p. 93)
The Institute of Medicine (2001) officially established effectiveness, efficiency,
and equity as the criteria to evaluate the quality of health care. Historically, Donabedian
equated clinical effectiveness to the degree of application of “current science and
technology” (1988, p.1743) to improve patient health. On the other hand, efficiency could

20
be achieved only if practitioners recognized that care should be limited when its’ cost
exceeded the value assigned to the incremental gains in health. In corporate terms,
quality means that best practices are applied, waste is avoided and coordination of care is
provided without prejudice (Mayberry, Nicewander, Qin, & Ballard, 2008).
Though not often noted, the formation of interpersonal relationships bound by
fundamental ethical standards is another important dimension of Donabedian’s timeless
approach to organizational performance in terms of quality. “The conduct of the
interpersonal process must also meet individual and social expectations and standards,
whether these aid or hamper technical performance” (Donabedian, 1988, p. 1744). Steer
(1975) also believed that employee relations could be a significant organizational metric.
Therefore, it should not be surprising that researchers have extracted structural predictors
that rely on relationships (e.g., leadership, organizational culture, coordination,
cooperation, integration) and the associated processes (e.g., collaboration, teamwork,
communication) that influence various components of organizational performance
outcomes. In this study, quality is measured by the perceptions of interdepartmental
processes delivering professional services in healthcare that improve patient outcomes
(Lohr and Schroeder, 1990; Donabedian, 1988).
Similarly, it is not unexpected that these indicators may have both positive and
negative associations with organizational performance. For example, Blegen, Sehgal,
Alldredge, Gearhart, Auerbach, and Wachter (2010) positively associate an increase in
patient safety with an integrated process across professional boundaries (nurse, physician,
and pharmacist) through communication and teamwork. In contrast, Ballard and Siebold

21
(2006) warn of a potential adverse effect of interdepartmental communication: loss of
job satisfaction—which also is a performance measure.
Since the late twentieth century, practices to increase organizational performance
through cooperation, collaboration, and integration practices have proven successful in
the manufacturing and information systems industries (Flynn, Schroeder, & Sakakibara,
1994; Schonberger, 1983). Cost efficiency objectives (Hwang & Herndon, 2007)
accompanied an evolution in the pursuit of healthcare quality—“an integral part of the
hospital organizational performance equation” (Raju & Lonial, 2001) in which high
standards and goals, interdepartmental coordination, and resource sharing were embraced
to increase efficiency (Flood, Zinn, & Scott, 2006). Donabedian (1980, as cited by Hsiao
& Boult, 2008, p. 302) characterized high-quality care as an “account of the balance of
expected gains and losses that attend the process of care in all its parts” in order to
capture the “inclusive measure of patient welfare.”
The search for quality in the ‘parts’ before the “whole” can be fully understood is
dominant in the literature. Researchers have focused on hospital units within the
organization and on the nurse-physician relationship. For example, Minvielle, Dervaux,
Retbi et al. (2005) built an organizational assessment tool modeled from Shortell,
Rousseau, Gillies et al., (1991). Minvielle, Aegerter, Dervaux et al. (2008) used that
instrument (an organizational performance score derived from five factors including
coordination and communication) to assess the influences of organizational culture on the
nurse-physician relationship in Intensive Care Units (ICUs) in Paris, France. Minvielle et
al. (2008) used comparative organizational performance scores to suggest changes in the
cultural values in the ICU that could lead to improvements. Morey, Simon, Jay et al.

22
(2002) extended the concept of nurse-physician pairs to also include atypical participants
like technicians, admitting nurses, and patients in their study on error reduction in
emergency departments in nine hospitals designated as civilian, military teaching or
community. The authors conclude that formal training in teamwork (“working together
does not equal teamwork”—Morey et al., 2000, p. 1572) can help form behavior and
attitudes that reduce errors that can harm patients.
Other researchers have isolated many facets of organizational performance
outcomes. Principal outcomes of healthcare organizational performance include patient
and organizational safety (Blegen et al., 2010; Morey et al., 2002); patient outcomes
(Beckett & Kipnis, 2009; Schmalenberg, Kramer, King & Krugman, 2005); professional
performance such as nursing (Mark, Salyer, & Wan, 2003). With few exceptions, most
studies emphasize the nurse-physician relationship; while some extend to non-clinical
areas like Pharmacy.
Opposing views on two other organizational performance outcomes—patient
satisfaction and regulatory compliance, are evident. For example, several researchers
believe that patient satisfaction is a positive performance indicator for coordination,
collaboration and communication (Fewster-Thuente & Velsor-Friedrich, 2008); for
collaboration, knowledge management and teamwork (Yeager, 2005); and for nurse-
physician coordination (Corser, 1998). However, contrasting findings resulted for
researchers in Taiwan who surveyed 661 patients from gynecology, surgery and internal
medicine (Cheng, Ho, & Chung, 2002) and from a national survey in the United States:
Consumers’ Experiences With Patient Safety and Quality Information (Kaiser Family
Foundation, AHRQ, and Harvard School of Public Health, 2005). These studies found

23
that most patients either based their responses simply on personal experience or were not
able to recognize systemic quality problems because they had no specific knowledge of
hospital administrative policy, clinical expertise, or quality-related skills, especially in
relation to rates of hospital associated infection in Taiwan and medical errors in the US.
Similarly, “despite the fact that patients are recognized as the ultimate justification for
providing collaboration care” (D’Amour et al., 2005, p. 116) patient satisfaction cannot
be fully realized as a major performance indicator until there is a methodology for their
active participation in the health care team.
In the same manner, regulatory compliance has been positively associated with
organizational performance, in terms of interagency coordination of social services in the
United Kingdom (Alaszewski & Harrison, 1988) and of interdisciplinary effectiveness in
a cross-sectional study of 1,784 community hospitals by Weiner, Alexander, Shortell, et
al. (2006). However, Chuang and Inder (2009) believe that existing literature has not
generated empirical evidence for the notion that a regulatory hospital accreditation
system can improve the quality of care.
However, accreditation agencies like The Joint Commission (2010) have
implemented patient-centric core measures that are evidence-based and focus on direct
patient conditions such as acute myocardial infarctions and community-acquired
pneumonia. Researchers at Stanford Hospitals and Clinics in Stanford, CA have
established accountability initiatives through interdisciplinary teams in these academic
medical centers that have improved unit performance in four areas (Pardini-Kiely,
Greenlee, Hopkins, Szaflarski, & Tabb, 2010). These areas were heart failure, acute
myocardial infarction, community-acquired pneumonia, and surgical quality. Pardini-

24
Kiely et al. (2010) and Sorensen and Iedema (2008) attribute performance improvements
to the implementation of unit interdisciplinary teams using communication to consolidate
diverse medical perspectives and establish accountability in order to improve patient
outcomes.
Recently, Patient Safety Indicators (PSIs) designed by the Agency for Health Care
Research and Quality (2008) have been successfully applied. Weiner et al. (2006) used
AHRQ PSIs to outline a broad approach extending system capabilities by improving
work process. The authors concluded that organizational effectiveness depends on
interdepartmental collaboration to “implement across many conditions, disciplines, and
departments” (Weiner et al., 2009, p. 309). Researchers at the Mayo Clinic Rochester
hospital (Naessens, Campbell, Huddleston et al., 2009) tested several known measures of
adverse events, including the AHRQ PSIs, and concluded that multiple methods are
necessary to identify the greatest range of them. Analysis of Veterans Administration
(VA) medical discharge records for 1997-2005 found that rare adverse events in inpatient
care could not be measured using AHRQ PSIs measures. AHRQ PSI may exclude VA or
other medical facilities that perform only outpatient surgery without anesthesia, are not
classified to perform the major surgeries for which the PSIs are designed (Romano, Mull,
Rivard, et al., 2008) or experience other reliability limits on rare adverse events (West,
Weeks, & Bagian, 2007). For example, patients at long-term-care facilities are most
susceptible to nosocomial infection (Stevenson and Loeb, 2004), but its occurrence there
may be overlooked in this facility because it could not be related to a surgical procedure.
Patient harm from an adverse event is generally attributed to a combination of individual
error and systemic failure (Kohn, Corrigan, & Donaldson, 2000). Therefore, measures

25
that account for variation in both the medical facility and ancillary services should be
considered.
Beckett and Kipnis (2009) suggest TJC NPSG as the basis for healthcare systemic
goals such as the reduction of adverse events and the elimination of hospital-acquired
infections. Optimal professional achievement through collaboration, communication, and
teamwork is essential to quality care and safety (Beckett & Kipnis, 2009), to bridging the
gaps in scientific knowledge among the interdependent healthcare professionals
(D’Amour et al., 2005). The literature suggests that interdisciplinary dynamics may be
an intangible aspect of organizational performance that has not been significantly
explored.
This section has demonstrated that the overarching measure of organizational
performance premises effectiveness, efficiency, equity and ethical professional
relationships to support quality. Consequently, analysis must include multiple factors
whose impact in combination with processes on the quality of healthcare can be assessed.
The next section establishes a broad spectrum of elements comprising organizational
performance and intangible dimensions for measurement drawn from the literature, to
develop the conceptual framework and theoretical support for outcome measures of the
quality of patient care. The literature review has indicated reservations about the use of
patient safety indicators because they do not capture the adverse events in all types of
healthcare facilities. Finally, the literature suggests that use of the NPSG can produce
effective, efficient and equitable outcomes.

26
2.2 Organizational Performance Metrics in Clinical Engineering
The literature recounts several applications of the factor of effectiveness and a scant
few applications in efficiency in metrics for clinical engineering organizational
performance. In the US effectiveness is equated with a health system’s quality of clinical
care measured by outcomes as opposed to the internationally recognized definition of
effectiveness as the completion of system goals (Arah, Klazinga, Delnoij, Ten Asbroek,
& Custers, 2003). This section details some specific clinical engineering models, the
departmental link to nursing performance, and performance metrics established in the
literature.
A clinical engineering effectiveness model was developed by Frize in her 1989
doctoral dissertation which established organizational culture as a causal link to the
effectiveness of clinical engineering in Canadian hospitals. The model, which used
organizational characteristics, managerial policies and practices, external environment,
organizational climate and employee characteristics, was later applied by her protégé
(Cao, 2003) in the assessment of Third World clinical engineering departments. Since
that time, a few quality models have noted the relevance of medical equipment and/or
personnel to the environment of care in a progressive interdepartmental/interdisciplinary
approach to quality: Logical Framework Analysis (LFA) to reduce adverse events (Dey
& Hariharan, 2006); Critical Success Factors (CSF) captured in “PROCESS” as an
effective system to reduce medical errors (McFadden et al., 2004); and diagnostic
process optimization framework (DPOF) to increase hospital efficiency (Podgorelec et
al., 2009; Podgorelec & Kokol, 2001).
27
LFA is a project management framework that uses group dynamics to elicit
objectives, incremental monitoring and evaluation methods to improve processes. The
framework was used by hospital administrators, practitioners, and support staff in a 650-
bed tertiary care facility in Barbados to improve service utilization in the operating room
and emergency room, and improve perceived poor care in the intensive care unit. The
group encounter elicited several consistent factors concerning medical equipment and
improper communication structure (both within and between departments) that
contributed to adverse patient outcomes. Items were first delineated into Donabedian’s
Structure-Process-Outcome model. Implementation of the objectives improved the use of
services in OR and ER, remarkably reduced overall adverse patient events, and increased
patient satisfaction. (Dey & Hariharan, 2006).
PROCESS is an acronym developed by McFadden et al. (2004) that stands for
critical success factors in reducing errors: (P)artnership of all stakeholders, (R)eporting
errors without blame, (O)pen-ended focus groups, (C)ultural shift, (E)ducation and
training programs, (S)tatistical analysis of error data, and (S)ystem redesign (McFadden
et al., p. 65). The authors contend that to achieve effectiveness, a system-wide
implementation of these suggested practices in the hospital environment of care must
include practitioners, physical therapists, and non-clinical personnel such as pharmacists.
In their proposition, “a ‘system’ includes the functioning of equipment and technology, or
the procedures that people follow when administering the needs of patients” (McFadden
et al., 2004, p. 65). McFadden et al. performed a case analysis of the effectivenss of the
PROCESS model in 4 Illinois hospitals (2 teaching, 2 community) and with a total of 8
representatives. Relevant results include the assignment of a high level of importance to

28
all the PROCESS factors on average, except for ‘open-ended focus groups’ which may be
considered a communication factor. This study is one of the few that incorporate multiple
structural components (organizational culture, coordination, cooperation, social forces)
and processes (communication, partnerships) with the objective of improving the quality
of care by reducing errors through the assessment of adverse events.
Though healthcare management has responded to the drive for efficiency by
absorbing competitors, such consolidation has not increased efficiency (Podgorelec &
Kokol, 2001). These authors instead propose additional efficiency measures identified by
a diagnostic process optimization framework (known as DIAPRO, later revised as DPOF)
that focused efforts on the “diagnostic-therapeutic cycle” that consists of the traditional
clinical methods of observation, diagnosis, and therapy (Podgorelec et al., 2009, p. S56).
Together, Podgorelec et al. (2009) formulated a solution that minimized the diagnostic
process by optimizing external inputs (regulated by clinicians, laboratory personnel,
pharmacists, and equipment technicians) that matched available and qualified personnel
with the most reliable equipment, increasing efficiency through knowledge management
by maximizing two relevant organizational components—personnel and equipment.
Podgorelec et al. (2009) applied the DPOF in a case study of mitral valve prolapse
syndrome in a regional hospital presumably in Slovenia where the authors are located. In
this instance, translating the tacit knowledge of departmental personnel to explicit
(quantitative) data enabled efficient practices incorporating localized and/or individual
information (lab turnover time, equipment sanitation schedules, personnel, patient health
history) into the diagnostic process. The DPOF methodology is a solid application of the

29
structure, process, and outcome premise of a system-wide approach to efficiency at
multiple levels: individual, departmental, and organizational integration.
Several studies have agreed on the relevance of the BMET department as the
primary supplier of medical devices for the EC. Gurses and Carayon (2007) in their
survey of 2727 Wisconsin intensive care nurses, cite insufficient or malfunctioning
equipment as a major obstacle to nursing performance profession and a factor destructive
to the quality of working life. Although greater contributions from other areas were found
(e.g. noisy work environment, 46%; family distractions, 42%) problems with equipment
availability contributed 32% of perceived performance obstacles and 20% of time was
wasted searching for equipment (Gurses & Carayon, p. 189). In another study
(Needleman et al., 2009, p. 11S), nursing performance measurement objectives were
linked to “workplace practices [that] include organizational culture, interdisciplinary
collaboration, equipment failures, and documentation burden”.
Researchers in Japan have also considered the use of medical devices in clinical
care as a major aspect of patient safety. Matsubara, Hagihara, and Nobutomo (2008)
surveyed multiple healthcare professionals, including nurses and physicians, in 9 non-
teaching hospitals. Healthcare support personnel, as well as various services, included
technical staff and pharmacy staff. Major organizational factors evaluated included
equipment availability and the role of social structure in the acquisition of needed
equipment. Responses from the 1878 participants in Fukuoka Prefecture indicated that
64.3% of total variance in organizational factors could be attributed to three aspects of
safety leadership (supervisors, allied professionals’, patient safety committee) and to
rules/equipment availability (Matsubara et al., 2008, p. 213).

30
Organizational performance metrics in clinical engineering have been developed.
One of the first practical benchmark indicators was the calculation of value derived from
total clinical engineering (CE) expenses/total equipment cost, introduced by Cohen et al.
(1995) and validated by statistically significant correlations in Cohen’s follow-up study
in 1997. The use of ratio relationships to measure effectiveness has been advocated by
Andersen (2006). Consequently, this study recognizes additional clinical engineering
measurement ratios—Capital Index Planning (Wang, Eliason, Richards, Hertzler, &
Koenigshof, 2008) and Global Failure Rate or GFR (Wang, Eliason, & Vanderzee, 2006).
The Capital Planning Index advocated by Wang et al. (2008) is a technology
assessment in which the total cost of management and maintenance of medical equipment
(AKA Total Clinical Engineering or Total CE Expenses) is divided by the total capital
maintenance costs, from continuous financial data provided by study participants. Wang
et al. (2006) proposes the GFR: the ratio between the number of completed repair work
orders and the number of devices, as having potential for use as a systemic outcome
metric. The proposition is based on recognition that properly managed and accessible
equipment promotes delivery in healthcare services and can be considered an
environmental condition controllable by the BMET department. Early research was
conducted by the Association for the Advancement of Medical Instrumentation using this
method on a small sample size, did not consider this as a promising metric. However,
Wang et al. (2006) assessed data from the Integrated Systems Information System with a
larger study sample at 24 sites that were managed by ServiceMaster during 2001-2003.
Although independent use of the GFR was not recommended, the tool provided valuable
information as a component of a more comprehensive performance tool such as the

31
balanced-scorecard approach. A potential barrier for use of the GFR is that comparisons
between organizations may be difficult due to different data collection methods or to
proprietary limits on data sharing among organizations and between departments in the
same organization. Wang et al. (2008) offer suggestions for refined analysis, including
more "detailed knowledge of operational characteristics and financial analysis" such as
"type of equipment supported, values of maintenance contracts, and external Time &
Material expenses" (Wang et al., 2008, p. 34).
Wang et al. (2008, p. 25) compiles an extensive list of existing methods to assess
effectiveness through measurements of outcome in four critical categories: operational,
staffing, financial and staffing. Operational outcomes that measure internal processes
include scheduled maintenance completion rate, percentage of repairs completed within
24 hours and within 1 week, full time employees/number of capital devices, and number
of scheduled maintenances/number of capital devices. Staffing outcomes that measure
learning and growth include staff turnover rate, percentage of CE budget devoted to
training, staff qualifications and competency, and employee satisfaction score. Outcome
measures of customer satisfaction include customer satisfaction score, Global Failure
Rate (GFR) and group failure rate for high-risk equipment, uptime for mission-critical
equipment, and percentage of equipment-related patient incidents. Finally, outcome
measures for financial indicators include the calculation of total CE expense as a
percentage of total acquisition cost or value=total CE expenses/total equipment costs;
total CE expense per adjusted patient discharge and/or patient day; total CE expense per
staffed patient bed; and total CE expense as a percentage of hospital total operating cost.
32
This section has demonstrated that research has used the measurement of
effectiveness and efficiency to some extent in assessing quality in clinical engineering,
which supports the claim that access to operational medical equipment—a function of the
biomedical engineer in clinical engineering, is a causal factor in nursing performance.
This section provided several examples of outcome measures for organizational
performance in operations, staffing, financial, and customer satisfaction. The barriers to
organizational study comparisons presented by constrained access and divergent data
reporting are acknowledged.
2.3 Summary
This chapter reviewed the literature on empirical evidence supporting the use of
performance metrics in model and hypothesis development. Organizational Performance
Theory has been successfully applied to studies of hospital units in healthcare (e.g., ICU,
ED) and to other industries such as policy analysis and manufacturing, using derivatives
from the classic criteria of effectiveness, efficiency, and/or equity. However, healthcare
studies have emphasized nurse-physician clinical relationships, and they have often
measured only a small number of predictors in relation to one aspect of organizational
performance such as financial or other administrative categories. Further, the literature
revealed an inability to capture interdependent relationships. The literature does support
an inclusive approach to systemic problems that extends research by using multiple
predictors in relation to a range of practitioners and non-clinical personnel (e.g.,
biomedical engineering technicians) on the basis of their indirect impact on patient
health. Previous findings have captured a variety of individual predictors and aspects of

33
organizational performance outcome measures, with some contrasting results. For
example, a multidisciplinary approach using communication as a predictor has mixed
results for the outcomes of patient safety and job satisfaction. Difficulties with analysis
using core measures and patient safety indicators in relation to adverse events were
discussed and alternatives introduced. This section also identified the use of critical
evaluation criteria in research on clinical engineering performance, the departmental link
to nursing performance, and listed current performance metrics as well as the barriers to
divergent financial data collection. The next describes the theories used to develop the
study’s conceptual framework and the hypotheses.

34
CHAPTER 3: THEORETICAL FRAMEWORK The preceding chapter’s literature review on empirical evidence in healthcare, in
other industries, and in clinical engineering supports the use of predictor and outcome
metrics for organizational performance predictor for this study’s model and hypothesis
development. This chapter provides the theoretical framework used to develop the study
model, research questions, and hypotheses.
John Brunner, 20th century British science fiction author: There are two kinds of fools, one that says, "This is old, and therefore good.” And one that says, "This is new, and therefore better.”
The healthcare industry has seen a paradigm shift in quality management since
Donabedian (1970) recognized the organizational limits of physician-only solutions to
patient care. That recognition impelled the movement from isolated efforts to improve
quality (identified by inpatient service delivery by physicians assessed by management’s
interpretation of financial indicators) to consideration of personnel, structural
characteristics and associated processes in the environment of care (EC). Guided by
Donabedian, the nursing profession was the first to move beyond the constraints of
traditional patient care, as they stepped into the role of patient advocates to address
broad-based community problems such as access to care. Quality initiatives during the
late 1980’s indicated a widening span of professional concern. As a result, changes in the
structural components of the hospital EC in conjunction with the processes of care were
recognized as keys to eliminating or at least reducing adverse events that affect patient
health. The processes involved in patient monitoring and the administrative oversight of
35
those tasks were recognized as vital to optimal outcomes. These components—structure,
process and outcome of the quality of care, known as the Donabedian Triad, have
become standard measures since their introduction by Donabedian (1966) as fundamental
constructs of Organizational Performance Theory. However, four decades after
Donabedian recognized the need to fully engage nursing in addressing healthcare quality,
no notable advances in other healthcare professions and ancillary services have followed.
Since health care outcomes are products of multiple health care personnel and
characteristics, the continued endeavor to address systemic quality problems by engaging
specialized clinical and non-clinical professionals is the next logical application of the
Donabedian Triad. The challenge is to identify the systemic clinical and non-clinical
practices and the EC conditions that ensure the most effective, efficient, and equitable
patient care.
One systemic problem is the pervasiveness of iatrogenic illness which means
illness “brought forth by a healer” (Francis, 2008, p. 223). Iatrogenesis includes medical
errors (including those related to medical devices and equipment), nosocomial infections
(NI), and other hospital associated infections (HAIs) known to increase mortality and
morbidity rates and extend hospital stays and thus to increase healthcare costs. The
supplemental care required is not associated with the original progression of disease or
illness that brought the patient into care (Brady, Redmond, Curtis, Fleming, Keenan,
Malone, & Sheerin, 2009; Francis, 2008).
Though ubiquitous hand sanitation campaigns have produced some satisfaction, the
overall incidence of iatrogenic rate has continued to rise, and the healthcare industry has
struggled to find solutions (Fakuda, Imanaka, Hirose, & Hayashida, 2009; Corrigendum,
36
2009). However, the dilemma opens the door for efforts to mitigate impact systemic
problems by turning to expanded roles for the full range of healthcare professionals,
much as Donabedian’s work roused nursing to professional standards of patient
advocacy. “Infection control programs were among the first organized efforts to improve
the quality of healthcare delivered to patients” (Stevenson & Loeb, 2004). Today,
infection control and communication among practitioners remain principal targets of
National Patient Safety Goals in the United States (JCT NPSG, 2010). Hence, analysis
using the Donabedian Triad may shed additional light on the endeavor.
The following sections define the fundamental theoretical premise and distinguish
the elements used to develop the study model. In addition, Integrated Empirical Ethics is
introduced as a supporting theoretical premise. Respondent and organizational control
variables are specified and the hypothesis statements for the study are presented.
3.1 The Structure-Process-Outcome Theory
This section defines the basic components of Donabedian’s Triadic Theory:
structure, process, and outcome. In accordance with them, specific elements of this study
(Structural Complexity, Process Adequacy, and Level of Quality) are detailed.
Donabedian (1989, p.11) found the following: While the primary reliance in our quest for quality is on the knowledge, skill, motivation, integrity, and dedication of health care practitioners, we cannot expect them to be unflaggingly heroic or self-sacrificing in the service of quality. It is the responsibility of the organization, rather, to create the conditions under which good practice is as effortless and rewarding as it can possibly be.
37
Donabedian’s (1988, 1966) organizational performance theory appropriately
begins with assessment measures derived by identifying the multiple conditions that
characterize the location where health care is received and those who provide it. Upon
this foundation, the elements of the theoretical premise arise: structure (the health care
practitioner attributes or organizational features defining material resources that affect
performance), process (activities related to caregiver responsibilities and patient
responses to care), and outcome (evidence such as health status gathered from the
recipients of care).
As guided by Donabedian’s (1989) quality approach to systemic issues, process
assessment emphasizes system design and performance monitoring. Corporately, this step
requires large-scale collaboration among multiple units across the entire operation to
achieve large-scale effectiveness, efficiency, and regulatory compliance. The assessment
establishes the dimension of systemic change, and performance monitoring gathers
information by “(1) systematically collecting information about the process and outcome
of care, (2) identifying patterns of practice, (3) explaining these patterns, (4) acting to
correct deficiencies, and (5) verifying the effects of remedial actions” (Donabedian, 1989,
p. 3).
For example, the documented relationship between infections and medical
equipment suggests that existing processes may need revisions that require adding
atypical personnel. Support for this conjecture can be found in the systemic approach to
the reduction of HAI in England, where outbreaks were generally attributed to deviations
in established processes over time that progressed to adverse events (Waterson, 2009).
Four of the five factors contributing to outbreaks were controllable within existing
38
organizational boundaries. They include: 1) organizational management, 2) clinical
management in hospital wards, 3) infection control involvement, and 4) specific factors
of hygiene and equipment. The significance of the approach is the use of a risk reduction
modeling framework to identify “dynamic interaction between levels within large-scale
sociotechnical systems” (Rasmussen, 1997 as cited by Waterson, 2009, p. 166). At
minimum, this perspective validates Donabedian’s call to incorporate diverse elements of
care across professional boundaries, which requires a collective understanding of their
responsibilities in the EC to be reached through collaborative processes.
Consideration of a controlled, quality-assurance driven Organizational
Performance Theory approach to hospital management reflects the industry’s move away
from rigid hierarchies as the result of several inputs: the rapid rise of merged services
across many clinical practices, conflicting regulatory obligations, emergent shared
medical record-keeping platforms, and a multitude of additional contextual factors that
call for a broad evaluation of the structural, process, and outcome complexities. The
premise is based on communication among multiple entities without a consistent level of
authority. Consequently, theoretical analysis requires knowledge management that can
effectively communicate and incorporate knowledge across professional, departmental, or
other cultural barriers. However, the absence of complete systemic information requires
the application of Triadic analysis for a better understanding of the ‘missing parts’ of
healthcare delivery. Runciman et al. (2009, p.1) recognized the “physical infrastructure
and biomedical engineering support systems, as well as how healthcare services are
organized with respect to… the availability of the necessary equipment and supplies” as
important elements of structure. Section 2.2 detailed the prevailing focus in research on

39
physician-nurse relationships and hospital units such as the ER, OR, or ICU. Given the
historic emphasis on unit studies as well as the importance of medical equipment for
nursing performance and the association of iatrogenesis with medical equipment,
processes performed by biomedical engineering technicians in clinical engineering are
salient in healthcare. Finally, the commonality of healthcare measured by effectiveness,
efficiency, and equity suggests that outcome measures in terms of clinical engineering
effectiveness, clinical engineering efficiency and regulatory compliance are appropriate
proxy measures of the level of quality. Therefore, Donabedian’s (1966) modified
Structure, Process, and Outcome Model of Organizational Performance is the basis for
this study’s use of latent constructs to enhance understanding of the indicators and
associated processes that improve the quality of care.
Figure 3.1 Modified Structure-Process-Outcome Model
Figure 3.1 demonstrates the fundamental theoretical components in the temporal
sequence that is the basis for further analysis. Structure, process, and outcome
components delineate quality of care through methods that ensure the highest level of
care at the least cost (Donabedian, 1989). Quality as an outcome should therefore include

40
factors that represent internal measures of cost efficiency, the span of reach or
effectiveness, and the extent to which external factors such as regulatory policy to
promote those objectives.
The theoretical premise established three primary latent constructs supported by
the literature: Structural Complexity, Process Adequacy, and Level of Quality, which
represent the complexity in healthcare composed of multi-management interfaces.
Therefore, independent variables were not eliminated until analysis had examined their
inter-relationships in detail. Concurrent examination of the variables may reveal
important relationships that have not been cumulatively assessed heretofore in this
context (Figure 3.2).
Figure 3.2 Conceptual Model of Structure-Process-Outcome Dimensions of the
Biomedical Engineering Technician Healthcare Support Personnel

41
The following section elaborates on each of the nine content-based categories
established from the literature review, which focused on organizational and process
determinants in the hospital EC, the personnel integration proposition, and the quality-
focused BMET/CE outcomes representing interdependent professional reliance on
medical equipment to achieve performance goals. The interrelationships of the study
variables should be evident. They represent observable variables of the Structural
Components and Process Adequacy latent constructs. Three observable measurement
variables for the latent endogenous variable of the Level of Quality also follow.
(Appendix A1).
3.1.1 Structural Complexity: Latent Exogenous Construct and Measurement Variables
This section discusses the four observable variables of the latent exogenous
construct of structural complexity used in this study. They are organizational culture,
level of coordination, medical equipment complexity, and interdepartmental medical
device management. Although scholars have concluded that structural changes alone do
not automatically become a source of improvement in healthcare quality (Flood et al.,
2006), Donabedian’s quality assessment and monitoring cycle (2003, p. xxviii) requires
an analysis of current conditions to identify variances in resource, capacity and other
factors.

42
3.1.1.1 Organizational Culture
Research on organizational culture has yielded mixed interpretive results for the
level of added value (Waterson, 2009; Minvielle, et al., 2008, 2005; Stock et al., 2007;
Scott, Mannion, Davies & Marshall, 2003a). The lack of consensus about appropriate
models multiplies the subjective interpretations. Despite the divergent views on the very
broad notion of organizational culture, scholars generally agree that environmental
conditions influence individuals through the social queues in a particular institution.
Hence, the role of culture is vital to understanding organizational contexts.
Examining the divergent formulations of organizational culture can yield a more
manageable component for analysis. According to Scott et al. (2003a), the problematic
definition of organizational culture can be narrowed to two primary approaches: that of a
general metaphor or that of an attribute. The authors describe organizational culture as an
emergent property related to a social institution’s status. They argue that therefore
“culture is not assumed a priori to be controllable” and “that its main characteristics can
at least be described and assessed in terms of their functional contribution to broaden
managerial and organizational objectives” (Scott et al., 2003a, p. 112).
Garnett, Marlowe, & Pandey (2008) distinguish those two perspectives on
organizational culture. As an attribute, organizational culture is defined by the physical
description of the climate or culture. The metaphorical, or symbolic, perspective
interprets organizational culture from stories of events that provide a general
understanding of how it functions.
Stock et al., (2007) defines the construct of organizational culture in great detail
by using a scale of locus of control that features an x- and y-axis relationship. The x-axis

43
ranges from ‘internal’ at the left to ‘external’ at the right and the y-axis is central to the x-
axis and is represented by ‘control’ below the intersection point and ‘flexibility’ above it.
Thus four major quadrants of organizational culture are delineated: Development Culture
in the mathematically designated quadrant I, located at 0 to 90°, is characterized by more
external indicators such as resource acquisition and more flexible components such as
risk taking. Successive quadrants move counter-clockwise. The second quadrant, Group
Culture, is characterized by teamwork, as a more flexible characteristic, and by personal
relations, as more representative of internal controls. The third major quadrant is
Hierarchical Culture, characterized by internal indicators of formal rules and structure,
the control being coordination and internal efficiency. The fourth quadrant represents
Rational Culture characterized by control indicators of market leadership and
competitiveness, showing the results-orientation of the organization.
It has been shown that an organizational culture may hamper efforts to improve
the quality of care by enlisting a range of professionals through interdepartmental
partnerships facilitating cooperation and coordination (McFadden et al., 2004).
Specifically, an organizational culture may or may not support cooperative integration
among hospital support personnel as sought with proponents in the BMET profession
(Dondelinger, 2008; Fennigkoh, 2005) and/or researchers who recognize the potential
contributions to quality of medical equipment technicians (Falagas & Karagerogopoulos,
2009; Dey & Hariharan, 2006). Infection-control measures should focus on limiting
transmission by paying attention to the contribution of the “inanimate environment,
hospital personnel, and medical equipment” (Falagas & Karagerogopoulos, 2009, p. 345).
The findings from studies of cooperation have recognized the contribution of health

44
support professionals in reducing overall patient risk through corporate participation
(McFee, 2009; Mark et al., 2003).
In healthcare, organizational culture has intervening effects on measures of
quality policy and procedure through normative processes that improve patient care
(Minvielle et al., 2008; Dey & Hariharan, 2006; Scott, Mannion, Davies, & Marshall,
2003b). In addition, Minvielle et al. (2008, 2005) in their study of 26 intensive care units
in Paris, France, found a strong relationship between the types of shared cultural values
and organizational performance.
Organizational culture has also, however, been considered a substantial barrier to
improving organizational performance in the field of healthcare, specifically among
BMETs and other professionals. For example, McFadden et al. (2004) showed that
quality efforts can be thwarted by administrative and social forces that prohibit the
cooperation and coordination necessary to accomplish change. Leading BMET
professionals (Dondelinger, 2008; Fennigkoh, 2005) agree that although cooperative
integration among hospital support personnel is a fundamental component of systemic
change, the professional opposition has been intransigent. However, increasing numbers
of non-BMET professionals have recognized the contribution to quality of medical
equipment technicians (Falagas & Karagerogopoulos, 2009; Dey & Hariharan, 2006).
These examples of an inclusive approach in healthcare show its traditional
operational silos are opening to interdependent efforts on behalf of patient care.
(Waterson, 2009; Allegranzi et al., 2007; Connor et al., 2002).
Indicators of organizational culture in this study have been drawn from the
multiple sources noted above. Primary items used to measure organizational culture in

45
this study include whether biomedical engineering technicians value contributions to
other staff members’ professional development; whether they receive training in their job
functions, and whether standards are applied equally across departments.
3.1.1.2 Level of Coordination
The second factor of structural complexity in this study is the level of
coordination. Wells et al. (1998, as cited in Fewster-Thuente & Velsor-Friedrich 2008, p.
41) defined the attributes of collaboration as “open communication, cooperation,
assertiveness, negotiation, and coordination.” D’Amour et al.’s (2005) formulated the
conceptual basis for interpersonal collaboration and advocated interdisciplinary
collaboration between nurses and physicians. Such efforts have led to successful
coordination of admission planning and many clinical improvements including the
reduction of adverse events.
Lack of coordination among the various social services in the UK during attempts
at reform in the early 1960 and the 1970’s were shown to increase healthcare costs
(Alaszewski & Harrison, 1988). Cost reductions then appeared when the multiple inputs
from administrative and clinical services were focused on patient needs. The authors
present a case for the rational model that depicts complex coordination, defined by them
as a combination of communication and structure (p. 637), as essential to a
comprehensive approach that improves patient outcomes.
Research in the last decade has been dominated by the notion of coordination as
an output of collaboration (D’Amour et al., 2005; Wells et al., 1998; Corser, 1998). Other
researchers (Alaszewski & Harrison, 1988) chose to view coordination as concurrent with

46
collaboration in a more inclusive perspective that presumes both are necessary to cover
the span of interagency activity. However, whether a subordinate or a lateral position is
assigned to coordination with respect to collaboration, understanding the interdependent
nature of coordination is vital to advancing quality. “More formally organized
professional staffs with well-defined coordination and conflict management processes”
and “higher levels of differentiation and coordination of medical staff” are generally
associated with better quality of care (Flood et al., 2006, p. 430).
In this study, indicators of the level of coordination have been drawn from the
multiple sources noted above. The primary indicators are whether biomedical engineering
technicians receive and/or provide inter-departmental input in order to complete work
successfully; whether they pursue inter-departmental solutions to systemic problems, and
whether any results of inter-departmental coordination are visible.
3.1.1.3 Medical Equipment Complexity
The third structural complexity factor of this study is medical equipment
complexity. The introduction of highly complex medical equipment technology together
with persistent use of antiquated standard safety measures that do not take this aspect
into account means that the criteria needed to reduce adverse events are missing (Hwang
& Herndon, 2007; Fennigkoh, 2005; Baker, 2003). The deterrent to taking corrective
action has been the cost attributed to doing so. For example, directives that rural
providers invest in advanced equipment and personnel to reduce medical errors have been
noted by Wakefield (2008). But the existing policy and administrative procedures may
block such technology advances that diagnose, treat, and in some cases formulate

47
evidence-based care. Nevertheless, the rise in adverse events and subsequent financial
liabilities has impelled administrators to consider more accurate reporting mechanisms in
order to reduce adverse events, to review diagnostic and treatment processes that use
medical equipment, and to create new standards of safety for patient care.
Hwang et al. (2007, p. 21) presented this important finding:
Many safe practices and quality enhancing improvements, such as computer provider order entry, proper infection surveillance, telemedicine intensive care, and registered nurse staffing are in fact cost-effective.
The new focus on patient safety has persuaded healthcare managers of the long-
term benefits of technology despite their fear of its initial costs. However, the consistent
reporting of adverse events that is requisite to improving the quality of care is stalled by
cultural taboos and fears of litigation. Moreover, in the absence of information
integration, access to the level of information that can sustain, operate, and efficiently
manage complex equipment across the EC remains short of what is needed for quality of
care.
Medical technologists and other members of the BMET community are aware of
such problems, which they know must be addressed to advance industry standards to
manage medical equipment’s complexity. In particular, Fennigkoh (2005) cited the
increased importance of clinical engineers for managing the significant environmental
factors presented by high-tech and often dangerous equipment.
The regulatory lag with regard to the maintenance and operation of complex
medical equipment ignores the potential contribution to patient safety of the BMET.
Current regulations still focus on preventive maintenance comprising electrical safety
checks. These checks, though important, are outdated because they are an inadequate
48
form of preventive maintenance. They do not engage the BMETs broad spectrum of skills
for reducing risk through their knowledge of design and high-tech safety engineering
(Cram et al., 2004; Baker, 2003).
An emphasis on "equipment complexity… more likely to induce human error"
(Baker, p. 185) shifts the focus from fixed electrical safety checks to such professional
considerations s “annual performance checks and regular cleaning or visual inspection”
(Baker, 2003, p. 184). The BMET and/or clinical engineering role in lowering patient risk
should include consultation about selection of standardization and user training that
supports successful introduction to equipment (Cram et al., 2004).
As the level of complexity of medical equipment increases, so does the
importance of the BMET’s expertise in the overall community of care, to lower the
clinical risk factors arising from “technology frustration and inadvertent user error”
(Cram et al., 2004). The level of medical equipment complexity should drive not only
advances in the BMET profession, but also the identification of internal administrative
and external regulatory changes expected that are essential for patient safety and the
quality of care in an up-to-date and cost-effective EC.
The study’s indicators of medical equipment complexity have been drawn from
the sources noted above. The primary indicators are whether biomedical engineering
technicians have adequate knowledge of all of the equipment’s available functions,
whether the BMETs believe that excessive operations on the equipment are increasing the
difficulty of using it, and whether BMETs need help to understand the equipment’s
operation and/or maintenance.

49
3.1.1.4 Interdepartmental Medical Device Management
The fourth and final structural complexity factor of this study is interdepartmental
medical device management. Healthcare risk assessments have noted the highly visible
impact of equipment downtime on patient care, but experts do not always agree on the
best method to assess or establish the effectiveness of a facility's equipment maintenance
(Ridgway, Atles, & Subhan, 2009; Brush, 1994, 1993). A study by Agnew, Komaromy,
and Smith (2006) emphasizes relationships between adverse events involving medical
devices and the number of settings on a device, use of the same model type across all
ECs, and the environment where the equipment is used as factors that affect the
“condition, sustainability, and availability of equipment” (Agnew et al., 2006, p. 521).
There is little information about interdepartmental medical device maintenance
management beyond the departmental repair orders for service that are stored in
management maintenance systems. This data has been used for the ratio of equipment
inspected in compliance with JCT regulations and so has been maintained in relative
departmental isolation. Data on medical device management is risk relevant, however,
since the availability of alternative equipment with the highest operational status must be
included in the report of an adverse event involving medical equipment. This
information is included in order to determine if the use of another device might have
prevented the incident.
An isolated example of coordinated efforts by nurses and BMET staff to respond
to a threat to quality is recounted by Robert Stanford, biomedical manager at the
University Hospital in Augusta, GA (Williams, 2006). Responding to nursing concerns
about dirty, broken, or missing equipment, Stanford orchestrated relocation of his
50
department near the Central Sterile location where used equipment was returned by
hospital staff after patient use. The move placed his department in a position to formally
implement new equipment inspection procedures including cleansing and sanitation that
improved patient services and reduced complaints. The change increased awareness of
the departments’ contribution to the hospital EC.
Indicators of interdepartmental medical device management have been drawn
from sources noted above. The primary indicators for interdepartmental medical device
management in this study are whether medical devices (models and types) are consistent
across departments, whether the biomed department is centrally located for easy access,
and whether specific training is provided in recognizing medical device failure.
3.1.2 Process Adequacy: Latent Intervening Construct and Measurement Variables
Since structural complexity is expected to affect process adequacy in our
modified Donabedian Triad S-P-O model, process adequacy is defined as a latent
intervening construct until data analysis determines its moderating or mediating status.
This section establishes five key process elements noted in the literature:
Interdepartmental Collaboration, Knowledge Management, Complexity of Sanitation
Methods, Interdepartmental Communication, and Interdepartmental Teamwork, detailed
below.

51
3.1.2.1 Interdepartmental Collaboration
The first process adequacy factor of this study is interdepartmental collaboration.
The complex relationship between coordination and collaboration has been previously
noted. But the depth of significance of these factors in terms of their combined
organizational impact may not be fully appreciated. "Collaboration is a complex process
that requires intentional knowledge sharing and joint responsibility for patient care"
(Lindeke & Siecker, 2005 as cited in Fewster-Thuente & Velsor-Friedrich, 2008, p. 41).
A Canadian study by D’Amour et al. (2005) categorized the notion of
collaboration in five underlying concepts: 1) sharing, 2) partnership, 3) power, 4)
interdependency, and 5) process. The research emphasized the essential contribution to
quality of care made by collaborative patient-centered care in the context of teamwork.
The authors found little literature examining interdependent relationships in healthcare.
Their conclusions note a consolidated version of the definition of collaboration to guide
for further understanding.
“The term collaboration conveys the ideas of sharing and implies collective action oriented toward a common goal, in a spirit of harmony and trust, particularly in the context of health professionals.” (D’Amour et al., 2005, p. 116).
A limited though relevant focus on nurse-physician collaboration to improve
patient outcomes as well as provider satisfaction dominates research on healthcare
collaboration (Francis, 2008; Lindeke & Sieckert, 2005; Larson, 1999) For example,
proactive nurse-physician collaborations in nursing strategies to reduce HAI have
featured consultations about using invasive devices that are linked to infections (e.g.,
catheters) only when deemed necessary by the physician (Francis, 2008).

52
The collaborative approach to improving patient outcomes relies on recognition of
the specialized contribution of each discipline. The nursing profession is committed to
autonomy and accountability as fundamental to successful patient outcomes (Larson,
1999). Collaborations with physicians may have commitment side-effects. For example,
without clear role delineation, responsibilities can become grey areas, with deleterious
consequences for patient outcomes (Larson, 1999).
Collaborative research by nurses, physicians, and other support groups has led to
positive patient outcomes associated with the nursing profession (Mark et al., 2003).
However in that study the subject of analysis was not the hospital organization or health
support services, but rather the impact of context and structure on the effectiveness of
nursing professionals. Unique to this study was the simultaneous measure of support
services and patient-related technology. Results indicated a proximate impact on the
positive patient outcomes. Support services were represented by laboratory specimen
collection, patient transportation, order entries (such as those to fill prescriptions), and
internal administrative services like coordination of patient discharge.
The lukewarm interest in collaboration in healthcare may well be a sign that its
expected outputs conflict with long-standing hierarchical management objectives.
“[A]ttributes of collaboration include shared power based on knowledge, authority of
role, and lack of hierarchy” (Kraus, 1980 as cited by Fewster-Thuente & Velsor-
Friedrich, 2008). A shift towards those characteristics is a shift away from personal
interests that are difficult to deconstruct towards an emphasis on collective interests.
Consequently, healthcare’s survival-mode has continued to rely on short-term responses
in daily operations rather than making the long-term changes that are necessary.

53
The interaction between clinicians and the biomedical engineering technician
department in particular has not been explored in detail. However, one significant
extension of the role of the BMET as an intermediary is outlined by Ebben et al. (2008, p.
326), who suggest collaboration to extend their equipment knowledge across what they
term “the chasm between technology developers and technology integration.” Their
suggestion is an example of how inter-professional training can expand to address
systemic problems that contribute to medical errors. In their example, medical errors can
be reduced through collaboration between the original equipment manufacturers (OEMs)
and the end users of health technology, with the BMET as an intermediary. The authors
recommend increased visibility in the process of purchasing new medical equipment to
develop liaison relationships between OEMs and the clinical staff who use the equipment
in patient diagnosis and treatment.
The study’s indicators of interdepartmental collaboration have been drawn from
the sources noted above. The primary indicators are whether biomedical engineering
technicians receive and/or provide advice about new equipment purchases; whether the
BMETs trust the equipment/clinical knowledge of other departments; and whether the
BMETs recognize other departments as professional equals.
3.1.2.2 Knowledge Management
The second process adequacy factor of this study is knowledge management.
Intensive management research in manufacturing and information systems at the end of
the last century has established the potential of knowledge management which is equally
relevant in health care. Indeed, knowledge management through interactive decision-

54
support systems, has produced successful patient safety guidelines in the diagnosis and
treatment of patients with acute myocardial infarction (Quinn & Mannion, 2005), and has
aided in the development of evidenced-based practices embodied in many treatment
standards of The Joint Commission and other healthcare agencies.
Historically, knowledge management has been important in understanding
fundamental research (Alavi & Leidner, 2001), system capacity (Gold, Malhotra, &
Segars, 2001), the impact of cultural barriers (De Long & Fahey, 2000) and
organizational performance (Choi, Poon, & Davis, 2008). In the hospital EC, knowledge
management has practical application: the ability to translate vital patient information or
to determine the availability of emergency personnel or equipment, as demonstrated by
Podgorelec et al. (2009) and Podgorelec & Kokol (2001). Ultimately, constraint on
information exchange in any system of care is problematic because patient outcomes will
reflect any less than optimal information on which diagnosis and treatment decisions
were based.
The delicate combination of collaboration, information, and patient care that is
inherent in knowledge management can be either an avenue to successful patient
outcomes or a significant barrier to solving systemic problems. In the hospital EC,
knowledge management is an opportunity for intentional exchange through collaboration
in order to elicit patient care among those jointly responsible (Lindeke & Sieckert, 2005).
The conceptual approach to improved patient outcomes has roots in a Hage, Aiken &
Marrett (1971, p. 860-1) study that traced how various ‘linkage mechanisms’ promoted a
multi-party approach to the “transmission of new information [through] coordination by
feedback and mutual adjustment.”
55
Professional data integration that supports knowledge management in the hospital
EC requires significant collaboration to incorporate healthcare data that span laboratories,
human resources, clinicians, and equipment specialists (Podgorelec et al, 2009).
Podgorelec’s approach recognizes both the individual and organizational roles of support
services in providing cost-effective services while instilling the value of their
interdependent role that ensures the availability of complete, professional data.
Hagtvedt et al. (2009) present an interdisciplinary response to the problem of
HAI. In their study, a team of experts in engineering, economics, and medicine, gathered
from Georgia Tech and Cook County Hospital in Chicago, simulated a model including
such typical protocols as hand sanitation and isolation of the patients and/or unit under
investigation. However, the model also incorporated economic considerations such as
demand and costs. Their findings recognized a “complex interplay of factors” that
“suggest that a systems-level approach to infection-control procedures will be required to
contain health-care-associated infections” (Hagtvedt et al., p. 256).
However, for an individual to translate tacit knowledge and experience in an
interdisciplinary professional realm is not a simple task even in the same EC. A system-
level approach thus requires “inclusion of healthcare personnel with specific knowledge
required to address systemic issues” (Edmond, 2009, p. 75). Knowledge management
may be the key to presenting competencies so that expertise is appropriately sought and
can help avoid adverse events. The BMET brings unique understanding of hospital
medical equipment and regulatory guidelines—knowledge that is a prerequisite for
advanced infection control and for reducing adverse events caused by errors in using
equipment (Cram, et al., 2004).

56
The study’s indicators of knowledge management have been drawn from the
sources noted above. The primary indicators are whether biomedical engineering
technicians share informal knowledge to benefit patient care, whether the BMETs have
access to formal knowledge within the department, and whether BMETs have access to
cross-functional knowledge through electronic or other methods.
3.1.2.3 Complexity of Sanitation Methods
The third process adequacy factor of this study is complexity of sanitation
methods. The advent of complex medical equipment has required more complex
disinfection and sanitation methods. Though manual cleansing and disinfection processes
are universally required, less complex methods of decontamination have been used in the
general EC. For example, the use of hydrogen peroxide or other cleaning agents for
pathogenic surface decontamination is prevalent, but these agents have only a limited
ability to reduce NIs. Newer decontamination methods extend decontamination
parameters to include internal equipment components and apply beyond the hospital EC
to other contents of care such as ambulatory transport.
The level of sanitation needed for reusable medical devices and instruments is
directly related to the amount of contact with sterile patient tissues during invasive
procedures. Consequently, all medical equipment requires cleaning. Minimum instrument
contact with unbroken patient skin is categorized as noncritical (e.g., blood pressure
cuffs) and requires only low level disinfection. Semi-critical items that invade mucous
tissue (endoscopes) or critical items (surgical instruments), require high levels of
disinfection and sterilization. (Rutala & Weber, 2004).

57
Halcomb et al. (2008) conclude that the conventional solutions and materials used
in terminal cleaning are not completely effective against HAIs. More intensive systems
are required to guarantee sterile equipment (Dubois, 2001). Recognition of the difficulty
in eradicating or even reducing NI transmission has markedly spawned international high
technology solutions to overcome the deficiencies in manual cleaning methods.
Schabrun and Chipchase (2006, p. 239) analyzed quality documents dating from
January 1972 to December 2004 to identify medical equipment’s contamination levels
and cleaning protocols and found that approximately “one-third of all NIs may be
prevented by adequate cleaning of equipment.” The authors established an 86.8%
equipment contamination rate, which declined to 4.7% after regular cleanings by
equipment using 70% alcohol concentrations. Other experimental researchers in the UK
seeking ways to reduce HAI transmission rates approximated hospital cleaning
environments by using a solution of microbiological agents and adenosine triphosphate
(which is common to human muscle tissue and helps to translate stored energy) to
simulate human tissue transference residue that may be contaminated with HAI and
remain after manual sanitation efforts (Lewis, Griffith, Gallo, & Weinbren, 2008). Both
of these studies focused on surface cleaning methods that improve sanitation
incrementally, but are not complete systemic solutions. Though the methods employed
substantially reduced the risk of NI transmission and were relatively cost effective with
simple implementation measures, complete eradication of pathogens did not occur. As a
result, alternate methodologies must be considered.
In Norway, Anderson et al. (2006) tested a programmable device developed by
Gloster Sante Europe called Sterinis that disburses a dry fume containing 5% hydrogen

58
peroxide. The Norwegian research team recognized the importance of decontaminating
the internal components of medical equipment, which can be reservoirs for HAIs in
portable equipment like infusion pumps. In particular, internal fans used to recirculate air
to cool motors on equipment in patient environments require more extensive internal
decontamination. Consequently, the team introduced alternatives to “manual chemical
disinfection (that) is both time and labour consuming” and has inherent defects that may
result in inadequate coverage (Anderson, et al, 2006, p. 150). French researchers have
introduced agents that meet the special requirements of heat-sensitive medical equipment
to aid in the development of systemic solutions to HAI transmission (Lehmann, et al.,
2009).
The consequences of the increased complexity of medical equipment and
sanitation processes call for the option of BMET integration. A case in point occurred
during a recent study of a Maine healthcare facility (Lessa et al., 2008). The study
assessed the impact of a lapse in sterilization of the equipment used in prostate biopsies
during the period of January 30, 2004 through January 27, 2006. Though there was
insufficient evidence of a direct link to transmission of HAIs, analysis of the event
revealed that the original equipment manufacturer (OEM) did not provide cleaning
brushes for the reusable needle in the product kit. The researchers deemed advanced
review of the OEMs reprocessing procedure to be ‘critical’ in order “to establish
appropriate procedures to avert potential pathogen transmission and subsequent patient
concerns” (Lessa et al., 2008, p. 289). Integration of a BMET with the nursing and
technician staff may have been able to avoid the problem.

59
The indicators of complexity of sanitation equipment have been drawn from the
sources noted above. The primary indicators are whether biomedical engineering
technicians use manual sanitation methods on the surface of medical equipment, whether
BMETs have introduced new high technology methods that cleanse and sanitize internal
parts of medical equipment, and whether high technology methods for internal sanitation
have been adopted as a standard at their facility.
3.1.2.4 Interdepartmental Communication
The fourth process adequacy factor of this study is interdepartmental
communication. “[C]ommunication is conceptualized as the central social process in the
provision of healthcare delivery and the promotion of public health” because information
sharing is “essential in guiding strategic health behaviors, treatments, and decisions”
(Kreps, 1988 as cited in Nanda et al., p. 4).
The information system age has made the relay of information quicker and more
accessible, but has not formulated a universal method of doing so. Sentinel events
reported to the Joint Commission indicate that as much as 70% have resulted from gaps
in communication and collaboration (Fewster-Thuente & Velsor-Friedrich, 2008, p. 40).
Various independent studies are consistent with a 60-85% range of independent
contribution from communication (Fewster-Theunte & Velsor-Friedrich, 2008, p. 40;
Fennigkoh, 2005, p. 310; Provonost et al., 2003, p. 71).
Other research has also confirmed that communication has tremendous impact in
the EC. Ballard and Siebold’s (2006) studies on the impact of delayed responses in
interdepartmental communication concluded that a breakdown in the relay of information

60
between units has a negative systemic impact. Specifically, a decline in job satisfaction
was attributed to communication gaps that disrupted the linear work patterns of focused
responses to patients.
Communication failure has been attributed to several general factors: time-
sensitive responses, partial content or accuracy, excluded stakeholders, and unaddressed
clinical issues given low priority until a critical situation is reached (Fenningkoh, 2005).
Recognition of the impact of “failure to communicate” (Fennigkoh, 2005, p. 310) has
moved swiftly throughout the healthcare community. As a result, internal and external
improvements and relationships with end users have now been targeted across the
hospital EC because researchers have reported that increased levels of communication
were related to better patient care (Minvielle et al., 2008, 2005; Ballard & Siebold, 2006;
Provonost et al., 2003).
Efforts by the BMET community to keep inter-departmental communication are
evident. Fennigkoh (2005), Xu et al. (1997), and Moniz et al. (1995) have recognized the
BMET role in the dissemination of vital information to medical staff. Moniz et al. cites
the development of equipment safety classes for new nurses as an example of BMETs’
consistent effort to reduce adverse events. Xu et al. applied increased intra-departmental
communication between the BMET supervisor and technicians in order to promote a top
down approach to increasing internal communication and communication external to the
department.
Finally, Fennigkoh (2005) applied a human factors approach modeled after
Reason’s Swiss Cheese Model of Error Management to reduce communication errors
(Reason, 2000). Reason, a pioneer in Human Factors Theory, defines system failure from

61
the viewpoint of hospital adverse events. Recognizing the direct impact of unsafe actions
by medical personnel that arose from environmental circumstances, he sought ways to
optimize relationships to reduce negative events. Fennigkoh used Reason’s recognition of
the natural tendencies for errors as an opportunity to proactively introduce an inter-
disciplinary systems approach that optimized information through increased
communication.
The study’s indicators of interdepartmental communication have been drawn from
the sources noted above. The primary indicators are whether biomedical engineering
technicians can easily discuss equipment issues, whether BMETs receive and/or provide
training on the proper operation of equipment, and whether BMETs receive and/or
provide clean, operational equipment in a timely fashion.
3.1.2.5 Interdepartmental Teamwork
The fifth and final process adequacy factor of this study is interdepartmental
teamwork. D’Amour et al. (2005) pays homage to a plethora of groundbreakers in the
area of interdepartmental teamwork and quality healthcare. He effectively consolidates
the relationship between collaboration and teamwork that Schmalenberg et al. (2005)
propound: that if there is a claim to collaboration, there should be evidence of teamwork.
D’Amour et al. (2005, p. 119) found that: Teamwork has become a sine qua non condition for effective practice in health-related institutions. Indeed, collaboration is essential in order to ensure quality health care and teamwork is the main context in which collaborative patient-ordered care is provided.”
62
Several defining characteristics of teamwork are interspersed with collaboration
and are found across the literature described by similar terms for the concept. D’Amour
et al. (2005) define inter-professional collaboration five underlying concepts: sharing,
partnership, power, interdependency, and process, which suggest teamwork. The term
interdisciplinary collaboration occurs in many research vignettes on the roles of gender,
safety, and teamwork in high-risk nursing areas that indicate a positive relation between
nurse-physician relationships and patient satisfaction (Fewster-Thuente & Velsor-
Friedrich, 2008; Yeager, 2005; Corser, 1998). Regardless of the preferred terminology,
the goal of reducing the approximately 70% of adverse events attributed to lack of
communication and collaboration as reported by the Joint Commission (Fewster-Thuente
& Velsor-Friedrich, p. 40), is the same.
Case studies by hospital quality improvement teams may continue to raise
awareness of the need to shift measures of systemic quality that embrace teamwork. For
example, Docque’s (1993) dissertation noted how departmentalization impeded quality
efforts to improve the quality of care for multi-discipline input. The experiment produced
factions drawn from established departmental and/or professional alliances that were
judgmental and lacked the avenues for communication that were needed to achieve
innovative and collaborative solutions. Docque concluded, “The facilitators were
inhibited from doing team building by the existing administrative structure” (1993, p. iv).
Yeager (2005) emphasizes how higher levels of patient illness and the consequent
demands on information management that compete with patient access to an increasing
body of knowledge require further inter-discipline collaboration in the EC. The
prominent teamwork of nurses and physicians is just one positive step in that direction

63
(Francis, 2008). Interaction among a range of healthcare professionals is still far from
what is required to reduce infections derived from invasive devices and/or preventable
errors.
Inter-professional teamwork has been a logical response to the need for multiple
inputs to address the complications of long-term care (Xyrichis & Lowton, 2008), the
growing need for information management (Yeager, 2005), and the level of cooperation
with healthcare support services necessary to meet service requirements (Molleman,
Broekhuis, Stoffels, & Jaspers, 2008). Xychris and Lowton review the literature
regarding a theoretical basis for an integrated approach to primary care. Molleman et al.
(p.329) conclude that “health professionals increasingly face patients with complex
health problems and this [pressures] them to cooperate.” However, Xychris and Lowton
point to evidence that multi-discipline teamwork has not achieved the expected benefits
and suggest that the temporary nature of team formations may be problematic. They
advocate permanent inter-professional teamwork that recognizes the benefits of persistent
interdependent practices, which is a recommendation consistent with this study.
The study’s indicators of interdepartmental teamwork have been drawn from the
sources noted above. The primary indicators are whether biomedical engineering
technicians receive and/or provide detailed information about out-of-service equipment,
whether BMETs receive and/or provide training in how to properly clean and sanitize
equipment between patient uses, and whether nursing and biomedical engineering
conduct regularly scheduled meetings on equipment issues.

64
3.1.3 Level of Quality: Latent Endogenous Construct and Measurement Variables
This section introduces the endogenous construct of the level of quality. Three
positive observable measurement indicators of the Level of Quality are used to quantify
outcomes. They are Clinical Engineering Effectiveness, Clinical Engineering Efficiency,
and Regulatory Compliance. This selection of outcome measures follows Donabedian’s
evaluation criteria to assess personnel and their perception of interdepartmental processes
and the delivery of professional services to improve patient outcomes (Lohr & Schroeder,
1990; Donabedian, 1988).
The clinical measurements found in AHRQ PSIs and TJC NPSGs (Section 2.1)
used in conjunction with financial and other administrative information considers to some
extent the combined effects of intangible and tangible measures. However, access to and
availability of consistent administrative data is limited by the diversity in hospital care,
the variety of reporting parameters, and proprietary concern about liabilities for adverse
events and/or nosocomial infections. This study, therefore, uses proxy measures.
3.1.3.1 Clinical Engineering Effectiveness
The first quality measurement in this study is Clinical Engineering Effectiveness.
The global definition of organizational effectiveness is the “degree to which
organizational goals and objectives are successfully met” (Flood et al., 2006, p. 420).
Since daily interaction with some form of medical equipment is necessary in patient care,
the ability to tie BMET objectives to such organizational goals as the reduction of
systemic adverse events related to medical equipment is critical for organizational

65
performance. Given that fact, performance outcome measures using only work
productivity data based on the calculation of the number of repairs may offer only a
tangible but incomplete measure (Section 2.2). Consequently, scholars and biomedical
experts agree that intangible elements of productivity, quality, and job satisfaction are
important for accurate measurement.
The "decision-making process surrounding acquisition and standardization" and
"the facility management process" (Yadin & Rohe, 1986; Mullally, 2008, p. 9, 23) are
factors in clinical engineering that influence organizational productivity and the level of
quality. Hence, a strategy that integrates biomedical engineering across atypical platforms
by increasing the opportunities for communication with other units follows this logic.
These events capitalize on educational opportunities to cross-train nurses on equipment,
the establishment of both corrective and preventive maintenance of equipment, and user
acceptance testing on new equipment.
The literature has not explored the interaction between clinicians and the
biomedical engineering technician department in detail. However, several salient
outcome measures of clinical engineering effectiveness are cited: “penetration of other
fields, incoming inspections, user education, pre-purchase consultation, clinical research,
quality assurance, and satisfaction with reporting authority” (Yadin & Rohe, 1986, p.
435). Other researchers concur. For example, Ebben et al. (2008) recommend increased
visibility in the process of purchasing new medical equipment, and increased technology
development and integration. Mullally’s (2008) study also finds that satisfaction with
reporting authorities contributes to CE effectiveness.

66
The indicators of clinical engineering effectiveness have been drawn from the
sources noted above. The primary indicators are the basis for proxy observable variables
in the BMET department, including whether the BMET is integrated into the process of
purchasing medical equipment, whether the BMET is represented in facility management
positions like Central Sterile, Infection Control, and Management Information Systems,
whether department goals are derived from organizational objectives, and the BMET
perception of job satisfaction with reporting authorities.
3.1.3.2 Clinical Engineering Efficiency
The second measure of the level of quality for this study is Clinical Engineering
Efficiency. Hwang and Herndon et al. (2007, p. 23) submit that "healthcare is an enormous
sector with tremendous room for improvement in cost efficiency, much of which is closely
tied to increased quality.” But recognized variations in hospital size, case mix, and the
resources available to acquire medical equipment and technology still present continued
obstacles to measurement (Wang, Ozcan, Wan, & Harrison, 1999). As a result, four proxy
components are used here to determine the conditions conducive to efficiency in the EC
and specifically in Clinical Engineering. The proxy components are 1) an existing system
for tracking device failure, 2) an existing medical device inventory, 3) implemented cost
assessment metrics, and 4) productivity assessment.
“Technology frustration and inadvertent user error” (Cram et al., 2004)
contribute to the clinical risk factors generally equated with medical equipment and the
consequent mortality and financial loss. Therefore, the contributions from an efficient
clinical engineering department can advance safe practices that reduce costs and

67
minimize adverse events. Hence, a system for tracking medical device equipment failure
is advocated for the BMET department since properly managed and accessible equipment
is an instance of controllable environmental conditions (Needleman et al., 2007; Wang et
al., 2006). Availability of equipment presumes the presence of accurate inventory of
medical devices with their costs for acquisition and associated maintenance and repairs.
These explain the contribution of the first three proxy measures.
Justification for the use of the final proxy factor—productivity assessments rests
on the association between labor costs and the number of hours directly dedicated to
medical devices, since organization performance is linked to the costs associated with
resource availability and the activities of patient care (Dey, Hariharan, & Clegg, 2006;
Donabedian,1988). Thus, clinical engineering efficiency is measured in terms of
personnel cost and maintenance costs for devices used in patient care.
The study indicators of clinical engineering efficiency are drawn from the sources
noted above. The primary indicators are the basis for proxy observable variables in the
BMET department: whether biomedical engineering tracks device failure through a
system for repair work orders, whether the BMET maintains an inventory of medical
devices, measures cost, and measures labor costs as a function of productivity.
3.1.3.3 Regulatory Compliance
The third measure of the level of quality determines Regulatory Compliance with
healthcare directives. The latent construct is derived from “a monumental study of nine
large U.S. government bureaus by Kaufman and Couzens (1973) who found that seven of
the nine bureaus clearly had enough administrative feedback to detect noncompliance of

68
agency policy—one indicator of performance” (cited in Garnett et al., 2006, p. 268). In
addition, Waterson (2009, p. 170) recently noted, "Poor communication, confusion of
responsibilities and accountabilities between and within the various regulatory bodies
delayed the time in which they could react to the outbreaks.” Even so, the relationship
between performance and accreditation has been a topic of debate; some researchers
report that accreditation is not statistically related to the hospital EC (Miller, Provonost,
Donithan, Zeger, Zhan, Morlock, & Meyer, 2005), others that regulation is a necessary
component in clinical engineering quality (Subhan, 2005).
Differences across departments may result from of a simple difference—BMETs
are dominated by compliance regulations whereas nursing staff are normally patient or
outcome-focused. But this notion has received scant notice in literature. Conflicts
between regulatory requirements and practical patient applications present disunity in
terms of the overall EC that may be rectified through some unification efforts without
jeopardizing the unique contributions of each profession. Consequently, proof of
compliance with standard quality criteria will suggest a measure of quality performance,
but may also provide insights into each profession’s unique perspectives that may suggest
points of collaboration to advance systemic quality initiatives.
The study indicators of regulatory compliance are drawn from the sources noted
above. The primary indicators provide the basis for proxy observable variables in the
BMET department: whether biomedical engineering understands medical equipment
regulatory policy, whether biomedical engineering applies medical equipment regulatory
policy, whether the department can be decisive when faced with policy conflicts between

69
compliance with medical equipment regulations and patient-centered outcomes, and
whether all departments have access to data on hospital-acquired infections.
In this study the application of standards in clinical engineering can represent the
‘equity’ component of critical evaluation tools. Though application of standards has
mixed findings in the literature, an examination of methods to resolve medical plurality in
healthcare performance and evaluation may also require a more direct and combined
application of the concept of ‘equity’ detailed in Section 3.2.
3.2 Integrated Empirical Ethics Theory
Though the phrase “First, do no harm” uttered by Hippocrates (circa 460 B.C.) may
be the most recognized prime directive of caregiver medical ethics, the emergent
literature on Integrated Empirical Ethics Theory (Molewijk, 2004) is an opportunity to
generate active academic response to the divergent healthcare professional mandates that
can affect hospital quality. This section introduces the relevance of that perspective as
multidisciplinary efforts seek commonalities in order to manage complex, long-term
patient care requirements and the moral challenges stemming from advanced health
technologies.
As empirical evidence grows about structure and processes that can improve
hospital quality outcomes (Section 3.1), the formulation of common goals that
consolidate and align the approach to patient care is required for implementation. The
concept of “embedded ethics and interactive practice improvement” (Abma, Baur,

70
Molewijk, & Widdershoven, 2010) in the medical community provides a foundation for
professional interdependency advancing hospital quality.
Balancing science and ethics, IEE represents the scientific development and
application of policies that recognize the contribution of individual practitioners— or in
this case, professional autonomy, in social practice. Interactive cooperation between
participating members such as BMETs and the nurses can blend moral with scientific
objectives for normative practices that improve patient services by prioritizing diverse
healthcare directives (Widdershoven, Abma, & Molewijk, 2009; Widdershoven,
Molewijk, & Abma, 2009; Molewijk, Stiggelbout, Otten, Dupuis, & Kievit, 2004;
Molewijk, 2004).
The literature has noted the relevance of professional and ethical considerations in
the environment of care (EC) that may affect priorities and perceptions of patient care
needs among clinicians (physicians and nurses), healthcare administrators, and
biomedical engineers (Laxmisan, Malhotra, Keselman, Johnson, & Patel, 2005). The
Laxmisan et al. study (2005) found that in simulated scenarios, common medical errors
generated anxiety about actionable problems, along with concern with expertise. For
example, practitioners were highly focused on human errors in clinical environments whereas
administrators emphasized clinical documentation and the need for skills development. Not
surprisingly, the BMETs focused on device function errors. But, awareness of the interpretive
differences among professionals is only the beginning of the resolution debate. The
overarching premise of Integrated Empirical Ethics (IEE) supports management resolution
of the divergent internal and external controls that can reduce hospital level of quality in such
scenarios.

71
An example of a normative practice solution may be the emphasis on achieving
patient safety concerns through an interdisciplinary approach to reduce adverse medical
events. The interdisciplinary approach to systemic errors is noted in National Patient Safety
Goals, Joint Commission Infection Control recommendations and other efforts that overcome
diverse regulation and control problems through multidisciplinary involvement that focuses
on universal objectives. In that respect, IEE can be a necessary component in translating
analysis results from Donabedian’s Triad into actionable items while respecting the
individual responsibilities of professions within the healthcare EC.
Despite a lack of cohesive healthcare ethics, many healthcare professionals are
guided by a code of ethics such as the American Medical Association (AMA, 2004)
physicians’ principles of medical ethics. Though no professional hospital BMET code of
ethics is in place, biomedical organizations such as the Biomedical Engineering Society
(BES) and the American College of Clinical Engineering (ACCE) provide guidelines that
emphasize patient safety. In particular, the BES ethics statement notes BMET responsibilities
in health care including honoring patient privacy rights and cost containment (Christe, 2009,
p. 41). The ACCE provides the Clinical Engineer with specific guidelines for their role in
patient safety, technology application and knowledge management, and implicitly restricts
services to those within their area of medical equipment expertise (Christe, p. 42). In contrast,
the revised 2001 American Nurses Association professional code of ethics (Mappes &
DeGrazia, 2006) is patient-centered with specific quality objectives that stress collaboration
with direct application to the hospital EC. Given this dichotomy, IEE is an opportunity to
open communication channels (Widdershoven et al., 2009) about appropriate quality efforts
to address systemic problems through empirical efforts designed to minimize professional
bias.

72
As other health support professionals extend the principles of medical ethics like
those of the American Medical Association (2004) for physicians, professional and ethical
roles in the hospital EC can be strongly delineated to ensure clearly defined service expertise.
Such an approach can secure the inclusion of the unique expert knowledge in each profession
and overcome the potential for harm to patient outcomes from collaborations where too much
crossover of roles can lead to accountability ‘grey areas’ (Larson, 1999).
That approach has some methodological difficulties, since the theoretical premise is
in its infancy there is scant, if any, empirical evidence relevant to IEE. IEE also has
encountered criticism. Musschenga (2005) contends that identification of moral issues in the
hospital EC is affected by context sensitivities (cultural or institutional) that may blur the
distinction between philosophical ethics and medical ethics. Abma, Molewijk, and
Widdershoven (2009) and Molewijk, Abma, Stolper, and Widdershoven (2008) argue that
clinical morality does not arise from moral experience in the clinical environment, but instead
from ethics instilled during education, by theoretical ‘moral case deliberation’. Moral case
deliberation inserts a moral question into an actual clinical case and invites practitioners to
consider alternative actions (Abma et al., 2009; Verkerk et al., 2004).
Others imply that to extract relevant data, the type of study datum, analysis methods,
and study population must first be defined (Holm, Soren, & Jones, 2004). A common barrier
in ethical discussion is the lack of crossover in the analytical methods used by practitioners,
ethicists, and health support services not attuned to statistical evaluation. However, such
general issues are associated with the preliminary research required to perform any project.
In summation, integrated empirical ethics is a basis for research that attempts to
identify and resolve potential professional conflicts and the associated priorities in the
clinical environment known as medical plurality. Once supported by research, IEE is a

73
methodology that can mesh divergent professional inputs and accountabilities in order to
benefit patient outcomes through the collaborative dialogue of multidisciplinary teams. At
present, the concept of IEE can support the development of a code of ethics that establishes
clear professional responsibilities for hospital healthcare support services (Davis, 1992). The
expected benefits of doing so are a more inclusive professional participation, expanded
efforts for systemic quality, and clarity about the respective duties in multidisciplinary
teamwork, and the possibility of solving problems objectively through open dialogue across
professions. Future research is required to examine these expected outcomes.
3.3 Control Variables
A multitude of confounding factors influence the context of a health care
environment, so research must obtain some facility and respondent characteristics so that
conclusions are accurate. The following items are basic individual and organizational
differences to be taken into consideration when evaluating study results.
3.3.1 Respondent Information
Individual control variables are respondent’s profession, years of experience and
education. Professional identification helps to establish perspective and can be used in
future analysis of variance among nursing and other professionals responsible for quality
of care. The level of education is included because of its association in the literature with
improved productivity and influence on “organizational efficiency and effectiveness”
(Carmeli & Tishler, 2004). Finally, respondent’s years of experience indicates the

74
applicant’s capacity to respond to survey questions based on prolonged exposure to their
work environment.
3.3.2 Organizational or Facility Information
Hospital organization information comprises state, The Joint Commission
accreditation, number of operational beds, facility type, and general location designation.
These organizational control variables as recommended by scholars include system
design elements. Differences in organizations are measured by physical characteristics:
hospital size in terms of number of beds and location of facilities such as urban or rural;
accreditation status; state, and facility type (public, private, non-profit, university
affiliated) (Donabedian, 1989; Mark, et al., 2003; Flood et al., 2006).
3.4 Hypothesis Statements
The objective of this research is to determine the efficacy of applying Donabedian’s
Triad to the function of biomedical engineering technician in clinical engineering. To
examine the potential effects of the BMET profession on quality of care, the study
develops a measureable SEM model within the context of a medical environment of care.
The hypothesis statements derived from the theoretical premise of Organizational
Performance Theory and the existing literature follow.
Hypothesis1: Structural complexity positively affects process adequacy in the
hospital environment of care.
Hypothesis2: Structural complexity positively affects level of quality in the hospital
environment of care.

75
Hypothesis3: Process adequacy positively affects level of quality in the hospital
environment of care.
Figure 3.3 illustrates the analytic model of the proposed relationships among
Structural Complexity, Process Adequacy, and Level of Quality. No control variables
appear in this model.
Organizational Culture
Interdepartmental Medical Device Management
Medical Equipment Complexity
Level of Coordination
Interdepartmental Communicaiton
Complexity of Sanitation Devices
Knowledge Management
Interdepartmental Collaboration
Interdepartmental Teamwork
Regulatory Compliance
Clinical Engineering Efficiency
Clinical Engineering
Effectiveness
Level of Quality
H2
H1
H3
Struc
tural
Comp
lexity
Proce
ss Ad
equa
cy
Figure 3.3 Unconditioned Analytical Model with Three Latent Variables Indicating
Hypothesized Relationships Between Predictor Variables and the Level of Quality in Clinical Engineering as Measured by the Contributions of the Biomedical Engineering Technician
3.5 Theoretical Summary
This section provides the theoretical principles of Organizational Performance
Theory, applying the Donabedian Triadic approach of structure, process and outcome to
biomedical engineering technicians in clinical engineering. Details of the translation of
the critical aspects of clinical engineering effectiveness, clinical engineering efficiency,

76
and regulatory compliance yield outcome measures of the quality of care. Predictor
variables of structural complexity and process adequacy are derived as potential
explanatory factors of quality performance. The study variables and hypothesis
statements are presented in an unconditioned analytical model with three latent variables
indicating the hypothesized relationships between predictor variables and the level of
quality in clinical engineering that is measured by the contributions of the biomedical
engineering technician. The next chapter presents the methodology used in this study.
CHAPTER 4: METHODOLOGY Structural Equation Modeling (SEM) with Confirmatory Factor and Path
Analysis, a versatile multivariate approach to the measurement of latent variables and the
structural relationships among the study variables (Wan, 2002), is used to determine
whether the exogenous (independent) variables are causally related to the endogenous
(dependent) variables. This research method is a form of multivariate correlational
statistics that tests the hypothesized relationships among three component factors of the
theoretical S-P-O model.
This technique uses two statistical analyses. First, Confirmatory Factor Analysis
evaluates the validity of the indicators associated with the underlying theoretical
constructs. Second, multivariate analysis of the structural relationships among the study
variables provides support of a theoretically specified framework and conclusions for
improving the quality of care.

77
4.1 Participants and Data Cleansing
Participants in the BEI Survey were sought from 1307 Biomedical Engineering
Technicians in a professional contact database provided by Mr. Patrick Lynch,
Biomedical Support Specialist at Global Medical Imaging, in Charlotte, NC. The contact
list spans 49 states except for Wyoming and the District of Columbia in the United States,
Puerto Rico, and the US Virgin Islands. The BMET professional was selected as the unit
of analysis because of the reliance by nursing staff on medical equipment as an element
of nursing performance. Review of the contact list revealed instances of the same person
listed twice or duplication of email addresses. About five items were removed because of
duplication and several more because they listed non-US regions. About another 300
email addresses were not current. Finally, close to 50 individuals indicated that they were
either not interested or not biomedical engineering technicians. The final population
sample is 953 of whom 395 from 736 hospitals responded to the survey.
The study’s inclusion parameters require input from the BMET profession for
initial interdepartmental comparisons. Participants were asked to complete a
questionnaire intended to gauge their perception of the current status of several factors
under analysis.
The Tailored Design Method (TDM) for surveys was implemented to help reduce
non-response, beginning with correspondence to introduce the topic to participants
(Dillman et al., 2009). Potential participants were contacted on January 7, 2011 via an e-
mail that notified them of the Biomedical Engineering Interdepartmental Survey

78
availability on January 15th, requested informed consent, and offered the option to
remove their names from the actual e-mail notification. The UCF Institutional Review
Board approved the survey before its distribution (Appendix B).
Next, the survey population received a second notice thanking them for their
participation, providing specific instructions and the survey link designation. (Please note
that limits in the number of emails sent daily in Hotmail required delivery in batches over
a period of 3-5 days.) On January 15, 2011, 950 potential respondents were notified that
the survey was available at URL link: http://www.surveymonkey.com/s/KWCKSCK, In
the event that participants required clarification or a channel for concerns about the study,
relevant instructions and contact information were provided. Finally, three days before
the conclusion of the study, participants were reminded that the survey would close at
midnight, January 31, 2011.
4.2 Sampling
To ensure sample size, all eligible BMET contact persons were e-mailed with an
invitation. Criteria that led to the use of the convenience sampling in lieu of simple
random selection were threefold: 1) existing diversity and national representation in the
contact list, 2) the statistical software requirements to achieve a minimum sample of 200,
and 3) the historical low response rate within the medical community.
The primary consideration for sampling is to achieve minimum levels of
participants through the use of power analysis, effect size, and statistical units such as
mean and standard deviation. Power analysis is used to offset the impact of Type I and
Type II measurement errors.

79
-Type I errors appear in the form of hypothesis statements that have been
falsely rejected when they are true. A method to reduce Type 1 error is to set the level of
significance, or the alpha level, α <.05.
-A Type II error occurs when the hypothesis is accepted when it is false.
This error can be reduced by setting the Beta (β) to >.80.
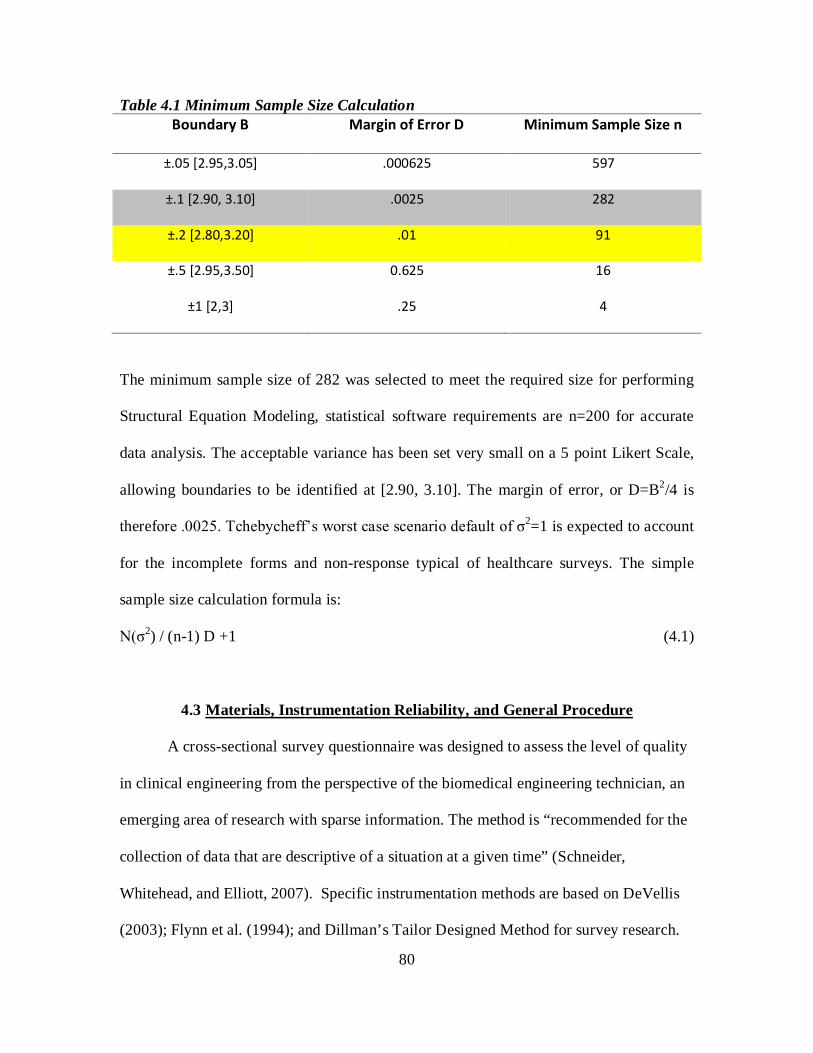
80
Table 4.1 Minimum Sample Size Calculation Boundary B Margin of Error D Minimum Sample Size n
±.05 [2.95,3.05] .000625 597
±.1 [2.90, 3.10] .0025 282
±.2 [2.80,3.20] .01 91
±.5 [2.95,3.50] 0.625 16
±1 [2,3] .25 4
The minimum sample size of 282 was selected to meet the required size for performing
Structural Equation Modeling, statistical software requirements are n=200 for accurate
data analysis. The acceptable variance has been set very small on a 5 point Likert Scale,
allowing boundaries to be identified at [2.90, 3.10]. The margin of error, or D=B2/4 is
therefore .0025. Tchebycheff’s worst case scenario default of σ2=1 is expected to account
for the incomplete forms and non-response typical of healthcare surveys. The simple
sample size calculation formula is:
N(σ2) / (n-1) D +1 (4.1)
4.3 Materials, Instrumentation Reliability, and General Procedure A cross-sectional survey questionnaire was designed to assess the level of quality
in clinical engineering from the perspective of the biomedical engineering technician, an
emerging area of research with sparse information. The method is “recommended for the
collection of data that are descriptive of a situation at a given time” (Schneider,
Whitehead, and Elliott, 2007). Specific instrumentation methods are based on DeVellis
(2003); Flynn et al. (1994); and Dillman’s Tailor Designed Method for survey research.

81
The questions pertaining to structural complexity in the Biomedical Engineering
Interdepartmental Survey were used to form the indicators or measures of that exogenous
latent variable. Process Adequacy, an intervening and theoretical construct, is posited to
be affected by structural complexity and to directly influence the quality of care. Process
Adequacy, in this capacity, serves the role of both an endogenous and exogenous study
variable relative to the other constructs.
The 39 questionnaire items associated with the three latent variables or constructs
are based on a 5-point Likert scale. The response ranges from 1- (strongly agree) to 5
(strongly disagree) on three questions for each initial indicator of Structural Complexity
and of Process Adequacy. Structural Complexity comprises four scale factors
(Organizational Culture, Level of Coordination, Medical Equipment Complexity, and
Interdepartmental Medical Device Management) that contribute 12 indicators or
variables. Process Adequacy comprises five scale factors (Interdepartmental
Collaboration, Knowledge Management, Complexity of Sanitation Methods,
Interdepartmental Communication, and Interdepartmental Teamwork) that contribute 15
indicators or variables. The Level of Quality contains three subscales: Clinical
Engineering Effectiveness, Clinical Engineering Efficiency, and Regulatory Compliance,
each having 4 questions.
Three questions about Respondent Information and five questions about Facility
Information are measured on the questionnaire, for a total of eight control variables.
Those variables were added to reduce the effects of extraneous confounding factors in the
sample.
82
Reliability Analysis of the Measurements
The initial application of the Biomedical Engineering Interdepartmental Survey to
the sample population of biomedical engineering technicians has undergone reliability
analysis (Appendix Tables C.1 Reliability Item Descriptive Statistics and C.2 Reliability
Item-Total Statistics) to determine internal consistencies of the scales derived through the
calculation of the Cronbach alpha (α) coefficient on the overall measurement. PASW
(version 18.0.0) statistical software reported a range of initial respondent ratings for each
latent construct of Structural Complexity, Process Adequacy, and Level of Quality from
Cronbach α coefficients 0.774 to 0.833, expressing good internal consistency of >0.7
(DeVellis, 2003). (Table 4.2). This data revealed that all items had some contribution,
since no values were reported at zero. The case processing summary indicated that
78/395 or 19.7% of the surveys were excluded from analysis due to missing values.

83
Table 4.2 Initial Cronbach Alpha Reliability Coefficient for Latent Constructs from Biomedical Engineering Interdepartmental Survey Results
Latent Constructs and Factors Initial Cronbach's α
N=395
Final Cronbach's α
N=317 Structural Complexity Construct All 0.774 0.826
Organizational Culture 0.771 0.771 Level of Coordination 0.833 0.833 Medical Equipment Complexity -0.177 ----- Interdepartmental Medical Device Management
0.469 0.469
Process Adequacy Constructs All 0.833 0.833
Interdepartmental Collaboration 0.644 0.644 Knowledge Management 0.748 0.748 Complexity of Sanitation Methods 0.639 0.639 Interdepartmental Communication 0.688 0.688 Interdepartmental Teamwork 0.568 0.568
Level of Quality Constructs All 0.791 0.825
Clinical Engineering Effectiveness 0.782 0.782 Clinical Engineering Efficiency 0.695 0.695 Regulatory Compliance 0.444 0.607
Subscale items in the main constructs had a range of initial Cronbach α coefficient
from –0.177 to .833. The negative Cronbach Alpha in the subscale for Medical
Equipment Complexity (MEC) was -0.177, containing three scales: Knowledge Limits
(MEC1), “I have limited knowledge of all of the equipment functions available to me”;
Excessive Options (MEC2), “There are excessive operations on equipment that increase
the difficulty of use”; and Expert Knowledge Requirements (MEC3), “I require outside
assistance to understand operation and/or maintenance”. The Structural Complexity
constructs Cronbach Alpha improved from 0.774 to 0.826. No additional records were
included from this change.

84
Six subscale constructs rated the highest on the scales, expressing good internal
consistency near or greater than .7 (DeVellis, 2003). They were 1) Organizational Culture
(0.771), 2) Level of Coordination (0.833), 3) Knowledge Management (0.748), 4)
Interdepartmental Communication (0.688), 5) Clinical Effectiveness (0.782), and 6)
Clinical Efficiency (.695). The reliability item analysis was then performed.
Reliability Item Analysis
A new baseline Cronbach α was established for N=9 items of Structural
Complexity (0.826) with the removal of Medical Equipment Complexity; for N=15 items
of Process Adequacy (0.833), and for N=12 items Level of Quality (0.791). Subsequent
reliability item analysis within the subscales began with a review of the Inter-Item
Correlation Matrix and the Item-Total Correlations for negative correlations, specifically
those items reporting Cronbach α <0.5. Each negative corrected item total correlation
scale question was reviewed for miscoding and response options with opposite scales.
However, none were found to need this potential adjustment to scale criterion.
Regulatory Compliance, a factor in the main construct of Level of Quality,
showed a relatively low Cronbach Alpha of 0.444 and a negative correlation. Hence, the
variable of Regulatory Compliance—Competing Regulatory Application (RC3), was
removed from further analysis. The change improved Cronbach Alpha from 0.444 to
0.607, and the Level of Quality latent construct from 0.791 to 0.825.

85
Reliability Results
Reliability analysis that included corrected item-total correlation and a review of
item analysis resulted in a final latent construct Cronbach α for Structural Complexity of
0.826, for Process Adequacy of 0.833, and for Level of Quality of 0.825 with a reduction
in the total number of questions from 39 to 35 items.
Reliability Results Confirmation
Reliability results were confirmed by the Mean Inter-Item Correlation, used when
scales have less than ten items (Briggs & Cheek, 1986). Briggs and Cheek (1986)
recommend the mean inter-item correlation value reported in SPSS as the Summary Item
Statistics table values for a short scale range between .2 and .4 (Pallant, p. 95-98). The
individual constructs are within an acceptable range, indicating that they measured what
they intended to measure (Table 4.3). However, the balance of variables in the Level of
Quality measure of Regulatory Compliance showed a slightly high correlation coefficient
of .412, indicating that some small, unspecified measure may contribute to the score.

86
Table 4.3 Reliability Summary Item Statistics
Mean Minimum Maximum Range
Maximum /
Minimum Variance N of Items
Level of Quality All*
Item Means 2.000 1.281 2.634 1.353 2.057 .197 11
Inter-Item Correlations .328 .089 .743 .654 8.340 .017 11
Clinical Engineering Effectiveness
Item Means 2.379 2.041 2.639 .599 1.293 .062 4
Inter-Item Correlations .477 .405 .579 .174 1.429 .004 4
Clinical Engineering Efficiency
Item Means 1.735 1.282 2.235 .953 1.743 .231 4
Inter-Item Correlations .403 .244 .616 .372 2.523 .023 4
Regulatory Compliance
Item Means 1.855 1.625 2.205 .580 1.357 .095 3
Inter-Item Correlations .412 .237 .743 .507 3.138 .066 3
Structural Complexity All
Item Means 2.361 1.918 3.249 1.331 1.694 .215 9
Inter-Item Correlations .377 .109 .711 .602 6.524 .023 9
Process Adequacy All*
Item Means 2.335 1.606 3.484 1.878 2.169 .385 15
Inter-Item Correlations .262 -.019 .838 .857 -43.232 .018 15
Note*: Summary Item Statistics was performed on items N>10 for complete data view. However, this method
is typically utilized for N<10. Please see Table 4.2 for complete Cronbach α reliability results.

87
Table 4.4 Reliability Descriptive Statistics
Indicators Mean
Standard
Deviation Analysis N
Inter-professional Training 1.98 .910 317
Appropriate Professional Job Training 2.13 .903 317
Uniform Standards 2.71 1.231 317
Inter-Departmental Work 1.89 .794 317
Coordination Efforts 2.16 .952 317
Coordination Evidence 2.01 .877 317
Device Consistency 2.81 1.196 317
Centrally Located Equipment Access 3.24 1.280 317
Device Failure Recognition 2.17 .863 317
Equipment Purchasing Involvement 2.26 1.122 317
Trust in Clinical Expertise 2.56 .961 317
Professional Equity 1.77 .731 317
Informal Exchange 1.60 .693 317
Formal Department Information 1.90 .787 317
Formal System Knowledge 1.88 .756 317
Manual Sanitation 1.90 .683 317
Internal Sanitation 3.41 1.041 317
Internal Standard 3.49 1.042 317
Equipment Discussion Ease 1.77 .811 317
Formal Equipment Training 2.07 .871 317
Available Operational Equipment 2.12 .846 317
Equipment Reporting Standards 2.20 .924 317
Between-Patients Sanitation Training 2.92 1.030 317
Regularly Scheduled Meetings 3.14 1.245 317
Acquisition Integration 2.40 1.175 317
Management Integration 2.63 1.127 317
Department Measures Tied to Organizational Goals 2.04 .872 317
Job Reporting Satisfaction 2.42 .999 317
Device Failure Tracking System 1.37 .538 317
Medical Device Inventory 1.28 .522 317
Implement Cost Assessment 2.05 1.043 317
Implemented Productivity Assessment 2.23 1.004 317
Regulatory Comprehension 1.62 .607 317
Regulatory Application 1.74 .670 317
Regulatory Reporting 2.21 .999 317

88
The descriptive statistics in Table 4.4 indicate that the standard deviations are less
than their respective means, as expected. The sample size of 317 cases is valid.
4.4 Design of the Study
The unit of analysis in this study is the biomedical engineering technician in a
hospital support services role for patient safety and quality assurance. A cross-sectional
and correlation-based design was formulated. Multivariate analysis was performed to
show the relationship between the multiple predictor variables (Xn) and the endogenous
variable (Y). A residual term or error (ε) depicts the difference in the actual results from
the predicted values. The following linear equation represents the generic form of
multiple linear regressions calculated through statistical software:
Yi = β0 + β1X1 + β2X2 … + βnXn + εi (4.2)
where Y = the endogenous (dependent) variable;
β = the regression coefficient;
X = the exogenous (independent) variable; and
ε = a random error or residual term.
This formal equation is translated into this study by examining the structural relationships
among the three latent variables, as follows:
Structural complexity positively affects process adequacy.
Process Adequacy = β0 + β1Structural Complexity + εi (4.3)
The level of quality is influenced directly by structural complexity and process adequacy:
Level of Quality = β0 + β1Structural Complexity + β2 Process Adequacy + εi (4.4)

89
The analysis is based on a covariance structural mode. The goodness of fit (GOF)
statistics (detailed in Section 4.6) show the adequacy of the hypothesized model, using
Analysis of Moment Structures (AMOS) and SPSS, Inc. v.18 statistical software. The
overall model fit is judged by several statistical estimates: χ2/degrees of freedom should
be less than 4, Goodness of Fit Index (GFI) >0.90; Root Mean Square Error of
Approximation (RMSEA) <0.05 or between 0.05 and 0.08; and Hoelter’s Critical N
index >200. This methodology determines what organizational factors affecting the level
of quality (LOQ) from the perspective of the Biomedical Engineering Technician’s
function in the hospital environment of care (EC).
4.4.1 Multi-Normal Distribution Assumptions
The generic model assumes that there are no correlated errors, that the factors
associated with the construct are relevant, and that the constructs of Structural
Complexity, Process Adequacy, and Level of Quality are not independent of one another.
The use of SEM with latent variables requires that the study variables with the
same construct meet all conditions of multi-normal distribution. Pallant (2007) names
those conditions: 1) sufficient sample size, 2) no multicollinearity or singularity present
in the independent variables, 3) no extreme outliers in data, 4) normality, linearity,
homoscedasticity, and independence of residuals in the distribution of scores and of the
underlying relationship between the variables, and 5) no collinearity. The sample size of
317 respondents meets the size criterion. If data assumptions were violated, the AMOS
statistical software would not calculate estimates (Arbuckle, 2009; Pallant, 2007).

90
As with the multiple linear regression assumptions (Azen & Budescu, 2009;
Daniel, 2009), SEM with latent variables has to meet certain conditions. Accepted
statistical methodologies and constraints are as follows (Pallant, 2007):
1. Linearity – the condition in which predictors and response variables indicate a
linear relationship when a straight, diagonal line is visualized from uniformly
distributed points observed on a scatterplot diagram.
2. Normality – the condition in which the error score terms are normally
distributed. Statistical methods to satisfy this criteria include the creation of
Normal Q-Q plots having a straight line derived from plots that calculate
observed scores against the expected value within ±3 standard deviation; the
Shapiro-Wilk W test that indicates a value close to 1; or interpretation of the
values for skewness (distribution symmetry) and kurtosis (peaked
distribution) values between approximately ±2 (based on 95% Confidence
Interval of 1.96). This study interprets skewness and kurtosis values.
3. Homoscedasticity (constant variance) – the condition in which the underlying
relationships between the observed and the predicted dependent variable
produce residuals (error terms) that output a residual scatterplot. The output
should have a homogenous variance indicated by a concentration of scores in
the centerpoint of zero that generally form a rectangular shape. Deviations
from this shape indicate a lack of homoscedasticity.
4. Multicollinearity – the condition in which independent variables are highly
correlated with each other, which would violate the concept of one measure
for each concept. This study follows Kaplan’s (1994) and Meyers, Gamst, and

91
Guarino’s (2006) recommendations that correlation coefficient >0.70 be
considered for elimination from the measurement model. Other research
conditions, such as high reliability and adequate sample size, may tolerate
variables that slightly exceed this measure (Grewal, Cote, & Baumgartner,
2004). Tolerance and Variance Inflation Factor (VIF) tests are also acceptable
assumption tests used to determine multicollinearity.
5. Independence of residual (error terms) – the condition in which the error terms
of the predictor variables are not autocorrelated, having values between 1.5
and 2.5 of the Durbin-Watson W test. Results in this range indicate the
independence of the error terms. This study allows common variables and
error terms to correlate in order to contain measurement errors (delta or di for
unique factors on exogenous variables; epsilon or ei for unique factors on
endogenous variables). On the measurement models and/or the structural
equation models, this correlation relationship appears in the form of a double
arrow between two variables

92
4.5 Variables The study variables are summarized in Table 4.5.
Table 4.5 Table of Study Variables
Variable Role Operational Measurement Structural Complexity
Exogenous Latent 12 factors
(4 Items each with 3 scales)
Process Adequacy Intervening Latent 15 factors (5 Items each with 3 scales)
Level of Quality Endogenous Latent 12 factors
(3 Items each with 4 scales)
Profession, Years of Experience, Education
Control 3 Respondent Variables
Number of Beds, State,
Accreditation, Urban/Rural, Facility Type, Size, Region
Control 7 Organization/Facility Variables
4.5.1 Endogenous Variable: The Level of Quality
In the Biomedical Engineering Interdepartmental (BEI) Survey, the endogenous
response variable of Level of Quality contains three major indicators of quality. They are
Clinical Engineering Effectiveness (CEEft), Clinical Engineering Efficiency (CEEfc),
and Regulatory Compliance (RC). Each construct comprises four observable items to
yield the primary measurement of the latent construct. For example, CEEft consists of
Acquisition Integration, Management Integration, Department Contribution to
Organization Objectives, and Job Reporting Satisfaction. CEEfc consists of Device
Failure Tracking Systems, Medical Device Inventory, Implemented Cost Assessment,

93
and Productivity Assessment. RC consists of Regulatory Comprehension, Regulatory
Application, Conflicting Regulatory Application, and Regulatory Reporting.
4.5.2 Exogenous Variable: Structural Complexity
The BEI Survey contains four major indicators of Structural Complexity. They
are Organizational Culture (OC), Level of Coordination (LCR), Medical Equipment
Complexity (MEC), and Interdepartmental Medical Device Management (IMDM). OC
consists of Inter-Professional Training, Appropriate Professional Job Training, and
Uniform Standards. LCR consists of Interdepartmental Work, Coordination Efforts and
Coordination Evidence. MEC consists of Knowledge Limits, Excessive Option, and
Expert Knowledge Requirements. IMDM consists of Device Consistency, Centrally
Located Equipment Access, and Device Failure Recognition.
4.5.3 Process Adequacy: An Endogenous Intervening Variable
The BEI Survey contains five major indicators of Process Adequacy. They are
Interdepartmental Collaboration (ICB), Knowledge Management (KM), Complexity of
Sanitation Methods (CSM), Interdepartmental Communication (ICOM), and
Interdepartmental Teamwork (ITM). ICB consists of Equipment Purchasing Involvement,
Expertise Trust, and Professional Equity. KM consists of Information Exchange, Formal
Department Information, and Formal System Knowledge. CSM consists of Manual
Sanitation, Internal Sanitation, and Internal Standard. ICOM consists of Equipment
Discussion Ease, Formal Equipment Training, and Available Operational Equipment.

94
ITM consists of Equipment Reporting Standards, Between-Patients Sanitation Training,
and Regular Meetings.
4.5.4 Operational Definitions
Table 4.6 below depicts the specific indicators and scales from the Biomedical
Engineering Interdepartmental Survey used to analyze the biomedical engineering
technician profession. Specific indicators are provided for the three major latent
constructs of Structural Complexity, Process Adequacy, and Level of Quality.

95
Table 4.6 Biomedical Engineering Interdepartmental Survey Three Major Latent Constructs, Scales, and Ordinal Response Indicators
Endogenous Latent Construct: Level of Quality Indicator Equivalent Scales
Clinical Engineering Effectiveness
CEEft
Acquisition Integration CEEft1 Biomedical engineers are integrated in the medical equipment purchasing process.
Management Integration CEEft2 Biomedical engineers are integrated into facility management (e.g., Central Sterile, Infection Control, Management Information Systems).
Department Contribution to Organization Objectives
CEEft3 Biomedical engineers set and achieve department goals based on organizational objectives.
Job Reporting Satisfaction CEEft4 Biomedical engineers are satisfied with reporting authorities.
Clinical Engineering Efficiency
CEEfc
Device Failure Tracking System
CEEfc1 Biomedical engineering tracks device failure through a repair work order system.
Medical Device Inventory CEEfc2 Biomedical engineering maintains an inventory of medical devices.
Implemented Cost Assessment
CEEfc3 Biomedical engineering measures cost using generally accepted metrics (e.g., labor cost/hour; labor cost/repair; total cost/repair; cost/bed supported; number of medical devices/bed supported; or cost of support as a percentage of the Acquisition Value of Capital Inventory.
Productivity Assessment CEEfc4 Biomedical engineering measures labor costs as a function of productivity (number of hours worked on completed or uncompleted jobs/total available hours.
Regulatory Compliance RC Regulatory Comprehension RC1 Biomedical engineering understands medical
equipment regulatory policy. Regulatory Application RC2 Biomedical engineering is able to apply medical
equipment regulatory policy. Conflicting Regulatory Application
RC3 Biomedical engineers must sometimes choose between medical equipment regulation compliance and patient-centered outcomes.
Regulatory Reporting RC4 All departments have access to hospital acquired infection data.

96
Exogenous Latent: Construct Structural Complexity Indicators Equivalent Scales
Organizational Culture OC Inter-professional Training
OC1 The organization values contributions to other staff members’ professional development.
Appropriate Professional Job Training
OC2 I have been provided clear training to perform my job function.
Uniform Standards OC3 Standards are applied equally across all departments
Level of Coordination LCR Interdepartmental Work LCR1 I receive and/or provide inter-departmental input in
order to successfully complete work. Coordination Efforts LCR2 Efforts have been made to value inter-departmental
solutions to systemic issues. Coordination Evidence LCR3 Inter-departmental coordination has resulted in
visible positive benefits. Medical Equipment Complexity
MEC
Knowledge Limits MEC1 I have limited knowledge of all of the equipment functions available to me.
Excessive Options MEC2 There are excessive operations on equipment that increase the difficulty of use.
Expert Knowledge Requirements
MEC3 I require outside assistance to understand operation and/or maintenance.
Interdepartmental Medical Device Management
IMDM
Device Consistency IMDM1 Medical devices (models and types) are consistent across departments.
Centrally Located Equipment Access
IMDM2 The biomed department is centrally located for easy access.
Device Failure Recognition
IMDM3 I receive and/or provide training to recognize medical device failure.

97
Intervening Variable (Latent Construct): Process Adequacy Indicators Equivalent Scales
Interdepartmental Collaboration
ICB
Equipment Purchasing Involvement
ICB1 I receive and/or provide advice on new equipment purchases.
Expertise Trust ICB2 I trust the equipment/clinical knowledge of other departments.
Professional Equity ICB3 I recognize other departments as professional equals.
Knowledge Management
KM
Informal Exchange KM1 I share informal knowledge to benefit patient care. Formal Department Information
KM2 I have access to formal knowledge within the department.
Formal System Knowledge
KM3 I have access to cross-functional knowledge through electronic or other methods.
Complexity of Sanitation Methods
CSM
Manual Sanitation CSM1 We utilize manual sanitation methods on the surface of medical equipment.
Internal Sanitation CSM2 New high technology internal sanitation methods that cleanse and sanitize internal parts of medical equipment have been introduced to the facility.
Internal Standard CSM3 High technology internal sanitation methods have been adopted as standard.
Interdepartmental Communication
ICOM
Equipment Discussion Ease
ICOM1 I can easily discuss equipment issues.
Formal Equipment Training
ICOM2 I receive and/or provide training on the proper way to operate equipment.
Available Operational Equipment
ICOM3 I receive and/or provide clean, operational equipment in a timely fashion.
Interdepartmental Teamwork
ITM
Equipment Reporting Standards
ITM1 I receive and/or provide detailed information regarding out of service equipment.
Between-Patients Sanitation Training
ITM2 I receive and/or provide training to properly clean and sanitize equipment between patient uses.
Regular Meetings ITM3 Nursing and biomedical engineering conduct regularly scheduled meetings on equipment issues.

98
Ordinal Response Options1
Indicators Equivalent Scales Indicators Equivalent Scales
1 1 Strongly Agree 2 2 Agree 3 3 Neither Agree or Disagree 4 4 Disagree 5 5 Strongly Disagree
Note 1: Response options are consistent for all latent variables.
4.5.5 Control Variables
The BEI Survey incorporated several control variables in consideration of the
differences among respondents and facilities. Three control variables were used to
distinguish respondent characteristics with regard to profession, years of experience and
highest level of education. Note that the unit of analysis in this study is the biomedical
engineering technician in hospital support services. Five control variables were used to
distinguish facility characteristics with regard to state, Joint Commission accreditation
status, the number of operational beds, facility type, and general facility location (Table
4.7). Two additional facility variables were created from the survey responses: hospital
bed size and regional location. Complex hospital size indicators derived by the Agency
for Healthcare Research and Quality are based on four factors: number of beds, location,
region, and teaching status. This study did not obtain teaching status information, and
regional distributions by states also varied from AHRQ study samples. For example,
AHRQ considered the District of Columbia a Southern entity, whereas this study
categorizes DC as in the Northeast. (This method resulted in a relatively equal regional
distribution and will add future statistical value because of the ability to perform
ANOVA on regional categories.) The AHRQ generic hospital size categories were

99
derived using location, and number of operational beds designated in three categories 1)
small 0-25, 2) medium 26-150, and large >150 (AHRQ, 2010).
Table 4.7 Biomedical Engineering Interdepartmental Survey Respondent and Facility Control Variables and Their Attributes
Control Variables Variable Attribute and Response Options Respondent Profession Categorical: Biomedical Engineering Technician, Nurse,
Quality Years of Experience Categorical: 0-2 years, 3-4 years, 5+ years Highest Level of Education Categorical: High School Graduate/GED; Associate of
Arts, Associate of Science; Bachelor of Arts, Bachelor of Science; Graduate (Master or Doctorate).
Facility State Categorical: 50 United States and D.C. Joint Commission Accreditation Categorical: Yes, No, Other. Operational Beds Continuous Facility Type Categorical: Public, Private, Non-Profit, University
Affiliated General Facility Location Categorical: Rural, Urban* Zip Code if Urban Categorical/Continuous Size* Categorical: Small 0-25, Medium 26-150, Large >150 Region* Categorical: Northeast (Connecticut, Delaware, Maine,
Maryland, Massachusetts, New Hampshire, New Jersey, New York, Pennsylvania, Rhode Island, Vermont, and Washington, DC.); Midwest (Illinois, Indiana, Iowa, Kansas, Michigan, Minnesota, Missouri, Nebraska, North Dakota, Ohio, South Dakota, and Wisconsin); Southern (Alabama, Arkansas, Kentucky, Louisiana, Mississippi, Oklahoma, Tennessee, and Texas ); Southeast (Florida, Georgia, North Carolina, South Carolina, Virginia, and West Virginia); and Western (Alaska, Idaho, Montana, Oregon, Washington, Wyoming, Arizona, California, Colorado, Hawaii, Nevada, New Mexico, and Utah).
Note*: Size and Region were created using Number of Operational Beds and State data, respectively.
A multivariate correlation statistical procedure interpreted data from responses to
the BEI survey, to measure and analyze the relationships between the predictor variables
and the Level of Quality (LOQ), and the LOQ using selected healthcare outcomes

100
recognized in the BMET field. The unit of analysis was the biomedical engineering
technician (BMET) hospital support service. Minimal data cleansing was necessary to
enhance the quality of the data sample, primarily by removing surveys that were initiated
but only viewed. Reliability testing was conducted to ensure the internal reliability of the
data. Threats to external validity appear minimal because of the representation of
respondents from across the United States.
4.6 Structural Equation Modeling and Goodness of Fit Metrics
SEM relies on a graphic depiction of data elements and Confirmatory Factor
Analysis (CFA) to validate components for significance. A generic model of the
aggregated factors of Structural Complexity and Process Adequacy is created in order to
study their impact on the potential of biomedical engineering technician hospital support
services to reduce systemic adverse events and compliance problems that reduce the
quality of patient care.
The determinants of Structural Complexity, Process Adequacy and the Level of
Quality were derived from Donabedian's theoretical premise, the literature and
preliminary statistical analysis, to ensure that data met assumptions such as normal
distribution discussed in 4.4.1. The regression weight or lambda factor loadings were set
to 1 in order to allow each construct to vary, because they are independent constructs.
Using the Analysis of Moment Structures (AMOS) computer program, a generic
measurement model was created for each construct: Structural Complexity, Process
Adequacy, and Level of Quality. Confirmatory Factor Analysis (CFA) was applied to
each model to assess how well the common variables (X1-X9; Y1-Y20) obtained from the
BEI Survey represent the three latent constructs in the study population.

101
CFA is based on the premise that the researcher has formulated the study
constructs and variables on the basis of “knowledge of the theory, empirical research, or
both, [postulating] relations between the observed measures and the underlying factors a
priori and then testing this hypothesized structure statistically” (Byrne, 2001, p.6). The
relationship of the underlying latent constructs with the observed variables is an
important metric called factor loading. Normally, a factor loading contribution of .50, or
50% contribution, is generally accepted (Sahin, Yilmaz, & Lee, 2007; Lin, Chow, Madu,
Kuei, & Yu, 2005) as a preliminary indication that the models fits the data in the
population. Elimination of variables with <0.50 factor loadings helps to produce a
parsimonious model from which to generate an overall congeneric model combining all
measurement model components. Schumacker and Lomax (2004, p. 212) argue that
preferred indicators should have loadings of .7 or higher on the latent variables. For the
purposes of this survey study, 0.50 factor loadings are acceptable. Subsequent statistical
analysis to determine a goodness of fit is required for a final assessment of the strength
and direction of the relationships between the hypothesized constructs and the observable
variables (Gallagher, Ting, & Palmer, 2008; Hu & Bentler, 1999; Hair, Anderson, Tatham,
& Black, 1998; Bollen, 1989; Browne & Cudek, 1989).
Table 4.8 lists acceptable parameters from which to determine the adequacy of the
measurement model in relation to the data. Although there are instances where exact
criteria are debated, most statisticians agree on the need to assess the model from more
than one criterion. (Byrne, 2001, p. 79-88 defines Goodness of Fit indicators and
provides a detailed comparison of alternatives.)
.
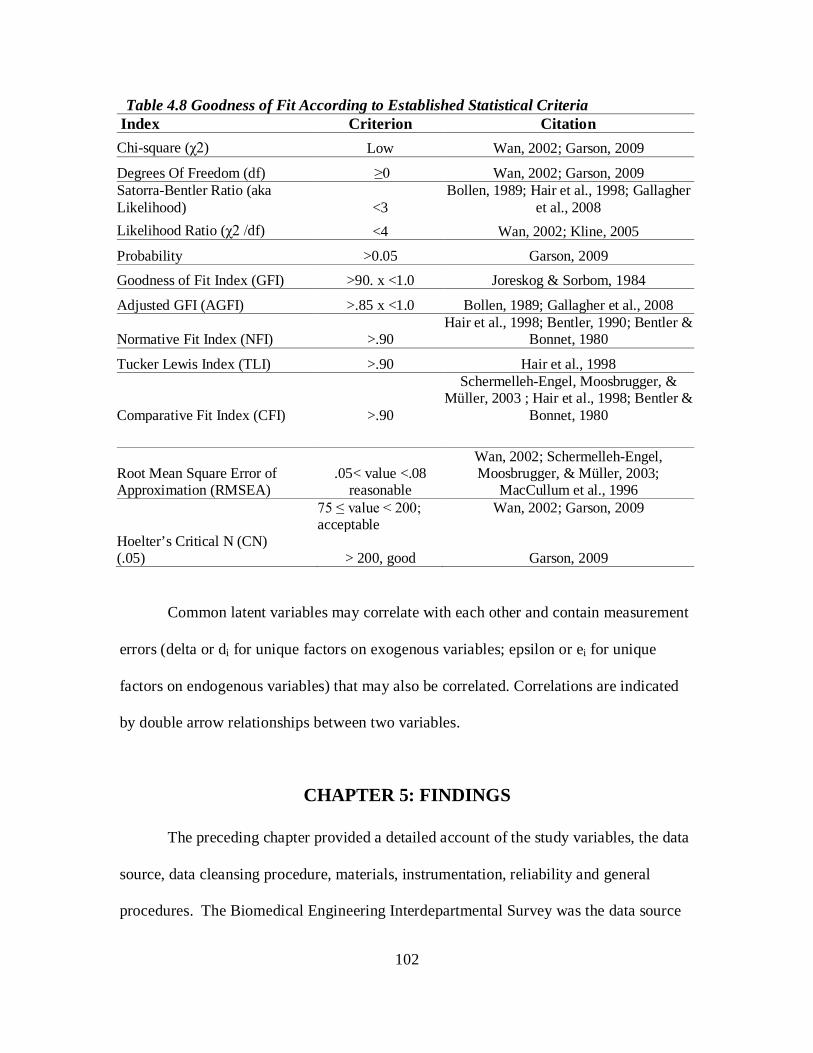
102
Table 4.8 Goodness of Fit According to Established Statistical Criteria Index Criterion Citation Chi-square (χ2) Low Wan, 2002; Garson, 2009
Degrees Of Freedom (df) ≥0 Wan, 2002; Garson, 2009 Satorra-Bentler Ratio (aka Likelihood) <3
Bollen, 1989; Hair et al., 1998; Gallagher et al., 2008
Likelihood Ratio (χ2 /df) <4 Wan, 2002; Kline, 2005
Probability >0.05 Garson, 2009
Goodness of Fit Index (GFI) >90. x <1.0 Joreskog & Sorbom, 1984
Adjusted GFI (AGFI) >.85 x <1.0 Bollen, 1989; Gallagher et al., 2008
Normative Fit Index (NFI) >.90 Hair et al., 1998; Bentler, 1990; Bentler &
Bonnet, 1980
Tucker Lewis Index (TLI) >.90 Hair et al., 1998
Comparative Fit Index (CFI) >.90
Schermelleh-Engel, Moosbrugger, & Müller, 2003 ; Hair et al., 1998; Bentler &
Bonnet, 1980
Root Mean Square Error of Approximation (RMSEA)
.05< value <.08 reasonable
Wan, 2002; Schermelleh-Engel, Moosbrugger, & Müller, 2003;
MacCullum et al., 1996
75 ≤ value < 200; acceptable
Wan, 2002; Garson, 2009
Hoelter’s Critical N (CN) (.05) > 200, good Garson, 2009
Common latent variables may correlate with each other and contain measurement
errors (delta or di for unique factors on exogenous variables; epsilon or ei for unique
factors on endogenous variables) that may also be correlated. Correlations are indicated
by double arrow relationships between two variables.
CHAPTER 5: FINDINGS The preceding chapter provided a detailed account of the study variables, the data
source, data cleansing procedure, materials, instrumentation, reliability and general
procedures. The Biomedical Engineering Interdepartmental Survey was the data source

103
for the measurements of Structural Complexity, Process Adequacy, and the Level of
Quality latent variables. The SEM model was formulated based on the multivariate
structural relationship among the three latent constructs. This chapter provides findings
from the descriptive analyses of the BEI survey data.
5.1 Descriptive Statistics Table 5.1 presents the descriptive statistics for the final dataset (N=317).
(Appendix Tables D 1 and D 2 contain original pre-cleansing Descriptive Statistics of
N=395. No significant statistical differences in data were found). Descriptive statistics—
mean, standard deviation, variance, range of scores, kurtosis and skewness verify the
normal distribution of the data.
The reported mean for the first variable in Organizational Culture (OC1), which is
how the biomedical engineering technician believes the organization values contributions
to other staff members' professional development, is 1.98%. The highest mean statistic is
in the category of Process Adequacy-Regularly Scheduled Meetings (ITM3), at 3.14%,
rating the BMET perception of whether nurses and BMETs conduct regularly scheduled
meetings on equipment issues. The lowest mean statistic is in the category of Regulatory
Compliance-Regulatory Application (RC2), at 1.74%. All items for the final study
sample show a full range of options selected from 1 to 5. Further, mean standard errors
are less than the mean statistic, as expected in normally distributed data. Finally, the
lowest standard deviation (0.787) is in the category of Process Adequacy-Formal
Department Information.

104
Of the original 395 records, 43 blank records were removed from the dataset. An
additional 35 were removed due to incomplete data. Several observed variables from
each latent construct were removed from the final dataset due to nonparametric data.
Variables removed from Level of Quality are Clinical Engineering Effectiveness-
Management Integration (CEEft2); Clinical Engineering Efficiency-Device Failure
Tracking (CEEfc1), Medical Device Inventory (CEEfc2) and Productivity Assessment
(CEEfc4). Variables removed from Process Adequacy are Interdepartmental
Collaboration observed variables of Expertise Trust (ICB2) and Professional Equity
(ICB3), Knowledge Management-Informal Exchange (KM1) and Formal System
Knowledge (IKM3), and the Interdepartmental Communication variable of Equipment
Discussion Ease (ICOM1). All variables of Process Adequacy-Complexity of Sanitation
Methods were excluded from the final dataset. Those items are Manual Sanitation
(CSM1), Internal Sanitation (CSM2), and Internal Standard (CSM3).

105
Table 5.1 Descriptive Statistics: N=317 BEI Survey
N
Statistic
Range
Statistic
Minimum
Statistic
Maximum
Statistic
Mean Std.
Deviation
Statistic
Variance
Statistic Statistic
Std.
Error
Structural Complexity
1 Inter-professional
Training
317 4 1 5 1.98 .051 .910 .829
2 Appropriate
Professional Job Training
317 4 1 5 2.13 .051 .903 .815
3 Uniform Standards 317 4 1 5 2.71 .069 1.231 1.515
4 Inter-Departmental
Work
317 4 1 5 1.89 .045 .794 .630
5 Coordination Evidence 317 4 1 5 2.01 .049 .877 .769
6 Device Failure
Recognition
317 4 1 5 2.17 .048 .863 .745
Process Adequacy
7 Equipment Purchasing
Involvement
317 4 1 5 2.26 .063 1.122 1.259
8 Formal Department
Information
317 4 1 5 1.90 .044 .787 .620
9 Formal Equipment
Training
317 4 1 5 2.07 .049 .871 .758
10 Available Operational
Equipment
317 4 1 5 2.12 .048 .846 .716
11 Regularly Scheduled
Meetings
317 4 1 5 3.14 .070 1.245 1.550
Level of Quality
12 Acquisition Integration 317 4 1 5 2.40 .066 1.175 1.380
13 Department Measures
Tied to Organizational
Goals
317 4 1 5 2.04 .049 .872 .761
14 Job Reporting
Satisfaction
317 4 1 5 2.42 .056 .999 .998
15 Implement Cost
Assessment
317 4 1 5 2.05 .059 1.043 1.089
16 Regulatory Application 317 4 1 5 1.74 .038 .670 .449
17 Regulatory Reporting 317 4 1 5 2.21 .056 .999 .999
Valid N (listwise) 317

106
The symmetry of distribution (skewness) and the peakedness of the distribution
are confirmed in Table 5.2, with a reported range of standard error from .137 to.273
approximating 0, which indicates normal distribution. Reported ranges in the distribution
that approximate 0 and are within ±2 also indicate normal distribution within each
variable, based on the 95% Confidence Interval of ±1.96. Range of skewness -.077 to
1.117; range of kurtosis -1.197 to 1.859. Negative skews and kurtosis indicate a shift of
data to the right.
Table 5.2 Additional Descriptive Statistics: N=317 BEI Survey Descriptive Statistics
N Skewness Kurtosis
Statistic Statistic Std. Error Statistic Std. Error
Inter-professional Training 317 1.177 .137 1.623 .273
Appropriate Professional Job
Training
317 .832 .137 .432 .273
Uniform Standards 317 .234 .137 -1.120 .273
Inter-Departmental Work 317 1.117 .137 1.859 .273
Coordination Evidence 317 .775 .137 .357 .273
Device Failure Recognition 317 .994 .137 1.170 .273
Equipment Purchasing
Involvement
317 .897 .137 .044 .273
Formal Department
Information
317 .996 .137 1.764 .273
Formal Equipment Training 317 1.087 .137 1.588 .273
Available Operational
Equipment
317 .930 .137 1.146 .273
Regularly Scheduled
Meetings
317 -.077 .137 -1.197 .273
Acquisition Integration 317 .629 .137 -.487 .273
Department Measures Tied
to Organizational Goals
317 1.043 .137 1.243 .273
Job Reporting Satisfaction 317 .627 .137 .132 .273
Implement Cost Assessment 317 .834 .137 -.126 .273
Regulatory Application 317 .748 .137 1.356 .273
Regulatory Reporting 317 .536 .137 -.266 .273
Valid N (listwise) 317

107
5.2 Correlation Statistics The Spearman rho results confirm that multicollinearity, or high similarity in
measurement, does not exist in variable relationships characterized by correlation
coefficients >.70 (Kaplan, 1994; Meyers et al., 2006). Exceptions are noted.
Spearman rho results on the individual latent constructs of Structural Complexity,
Process Adequacy and Level of Control indicate a positive correlation with statistical
significance achieved at .01 (2-tailed). (Appendix Tables D3-D5). The highest/lowest
correlation for Structural Complexity is Inter-Professional Training and Appropriate
Professional Behavior (.554) with Inter-Professional Training and Uniform Standards
(.345). The balance of variables ranged from .375 to .496. The highest/lowest correlations
for Process Adequacy are Formal Department Information with Formal Equipment
Training (.461), and Available Operational Equipment with Equipment Purchasing
Involvement (.152). The balance of variables ranged from .215 to .432. Finally, the
highest/lowest correlations for Level of Quality are Department Measures Tied to
Organizational Goals with Job Reporting Satisfaction (.523) and Implement Cost
Assessment with Regulatory Reporting (.208).
In addition to correlations between latent constructs, control variables were also
analyzed against each construct. Although multicollinearity was established in the control
variables since two variables were constructed from existing measures, no significant
relationships were found. (Extended correlation analysis results are available upon
request.)
5.2.1 Correlation Between Structural Complexity and Process Adequacy
Normally, performing a correlation matrix analysis on latent constructs is

108
prohibitive due to large numbers of variables being tested. In this study, the observed
variables were significantly reduced, which allowed presentation of the information.
Table 5.3 Spearman Correlation Coefficients of Structural Complexity and Process Adequacy, N=317
Process
Adequacy
Equipment
Purchasing
Involvement
Formal
Department
Information
Formal
Equipment
Training
Available
Operational
Equipment
Regularly
Scheduled
Meetings
Structural Complexity
Inter-professional Training .379** .336** .393** .217** .332**
Appropriate Professional Job
Training
.351** .375** .406** .225** .316**
Uniform Standards .262** .295** .342** .231** .394**
Inter-Departmental Work .367** .331** .445** .264** .331**
Coordination Evidence .397** .375** .424** .329** .324**
Device Failure Recognition .273** .362** .461** .335** .394**
**. Correlation is significant at the 0.01 level (2-tailed). Table 5.3 shows many positive statistically significant relationships at p=.01 (2-
tailed) between Structural Complexity and Process Adequacy, ranging from .217 to .461.
The largest relationship is between Formal Equipment Training and Device Failure
Recognition. The smallest relationship is between Available Operational Equipment and
Inter-Professional Training. Formal Equipment Training also correlates with three other
variables >.4. They are Appropriate Professional Job Training (.406), Inter-Departmental
Work (.445), and Coordination Evidence (.424).
5.2.2 Correlation Analysis of Structural Complexity and Level of Quality
The correlated coefficients of these latent constructs are particularly interesting
because they represent the relationship between the predictor (Structural Complexity) and
the outcome variables (Level of Quality).

109
Table 5.4 Spearman Correlation Coefficient Table of Structural Complexity and Level of Quality, N=317
Level of
Quality
Acquisition
Integration
Department
Measures Tied
to
Organizational
Goals
Job
Reporting
Satisfaction
Implement
Cost
Assessment
Regulatory
Application
Regulatory
Reporting
Structural Complexity
Inter-Professional
Training
.348** .432** .467** .232** .319** .222**
Appropriate Professional
Job Training
.373** .361** .417** .214** .232** .147**
Uniform Standards .290** .370** .464** .252** .272** .183**
Inter-Departmental
Work
.405** .493** .379** .254** .347** .208**
Coordination Evidence .430** .385** .432** .295** .362** .315**
Device Failure
Recognition
.322** .331** .401** .206** .318** .263**
**. Correlation is significant at the 0.01 level (2-tailed).
Table 5.4 indicates the relationships between Structural Complexity and Level of
Quality indicators; they range from .147 to .493. The largest relationship is between Inter-
Department Work and Department Measures Tied to Organizational Goals. The smallest
relationship is between Appropriate Professional Job Training and Regulatory Reporting.
Job Reporting Satisfaction also correlates with five other variables >.4: Inter-
Professional Training (.467), Uniform Standards (.464), Coordination Evidence (.432),
Appropriate Professional Job Training (.417) and Device Failure Recognition (.401).
5.2.3 Correlation Analysis of Process Adequacy and Level of Quality
Correlation coefficients were calculated for the intervening variable Process
Adequacy and the endogenous variable Level of Quality. The results shown in Table 5.5
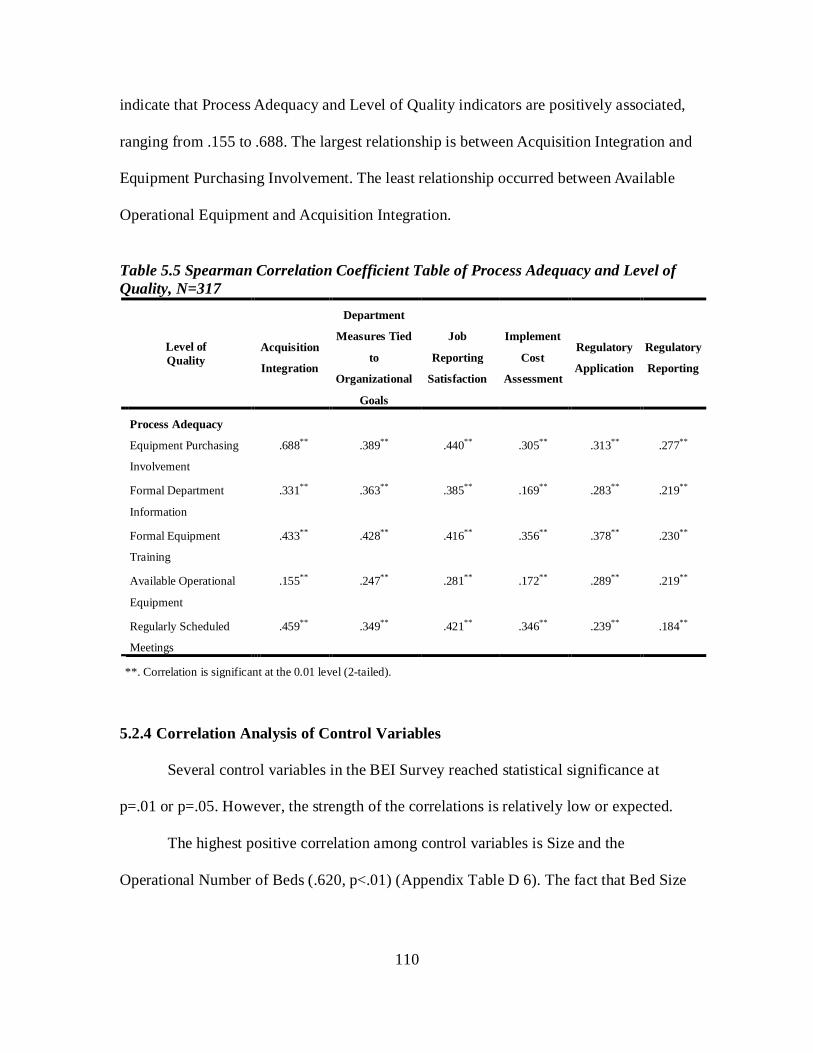
110
indicate that Process Adequacy and Level of Quality indicators are positively associated,
ranging from .155 to .688. The largest relationship is between Acquisition Integration and
Equipment Purchasing Involvement. The least relationship occurred between Available
Operational Equipment and Acquisition Integration.
Table 5.5 Spearman Correlation Coefficient Table of Process Adequacy and Level of Quality, N=317
Level of Quality
Acquisition
Integration
Department
Measures Tied
to
Organizational
Goals
Job
Reporting
Satisfaction
Implement
Cost
Assessment
Regulatory
Application
Regulatory
Reporting
Process Adequacy
Equipment Purchasing
Involvement
.688** .389** .440** .305** .313** .277**
Formal Department
Information
.331** .363** .385** .169** .283** .219**
Formal Equipment
Training
.433** .428** .416** .356** .378** .230**
Available Operational
Equipment
.155** .247** .281** .172** .289** .219**
Regularly Scheduled
Meetings
.459** .349** .421** .346** .239** .184**
**. Correlation is significant at the 0.01 level (2-tailed).
5.2.4 Correlation Analysis of Control Variables
Several control variables in the BEI Survey reached statistical significance at
p=.01 or p=.05. However, the strength of the correlations is relatively low or expected.
The highest positive correlation among control variables is Size and the
Operational Number of Beds (.620, p<.01) (Appendix Table D 6). The fact that Bed Size

111
(Small 0-25, Medium 26-150, and Large > 150) is strongly correlated with the Number of
Operational Beds is expected.
The highest negative correlation among control variables in the BEI Survey is
between Location Type (Rural or Urban) and the Number of Operational Beds reporting
-0.344, p<.01. This result is also expected, since many rural hospitals have small
numbers of beds.
Many negative correlations between the control variables were noted; the least
correlated indicators are Region (Northeast, Midwest, Southern, Southeast, and Western)
and whether or not the facility had Joint Commission Accreditation (-0.132, p<.05).
Though Joint Commission Accreditation has some statistical significance with Regional
location, the relationship is not strong.
The lowest positive correlation is Bed Size (Small 0-25, Medium 26-150, Large
>150) with Facility Type (Public, Private, Non-Profit, University Affiliated) (.163,
p<.01). In this instance, facility type is statistically significant in relation to bed size, but
the relationship is very small. Cumulatively, the control variables do not contribute to any
additional, significant explanation of the latent variables.
5.3 Measurement Models A generic measurement model was developed and validated for each of the latent
constructs derived from Donabedian’s Triad in order to achieve the best fit of the model
to the data. The analysis and final measurement models of the three latent variables are
detailed below.
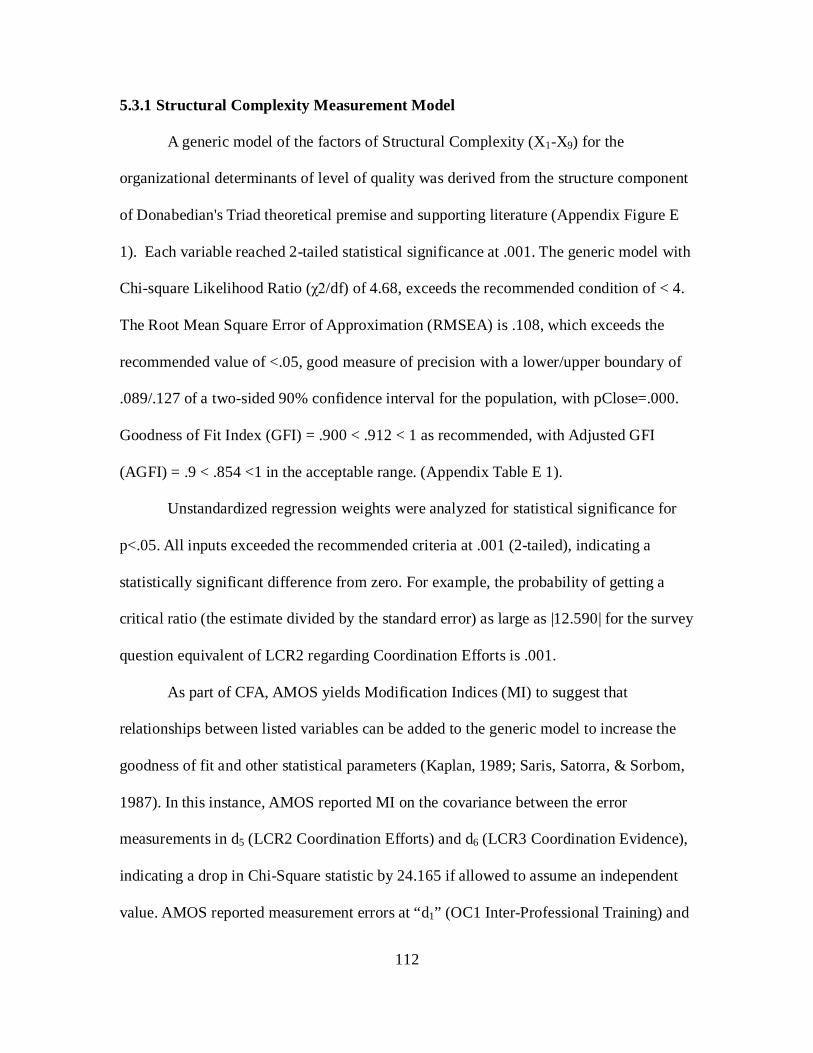
112
5.3.1 Structural Complexity Measurement Model
A generic model of the factors of Structural Complexity (X1-X9) for the
organizational determinants of level of quality was derived from the structure component
of Donabedian's Triad theoretical premise and supporting literature (Appendix Figure E
1). Each variable reached 2-tailed statistical significance at .001. The generic model with
Chi-square Likelihood Ratio (χ2/df) of 4.68, exceeds the recommended condition of < 4.
The Root Mean Square Error of Approximation (RMSEA) is .108, which exceeds the
recommended value of <.05, good measure of precision with a lower/upper boundary of
.089/.127 of a two-sided 90% confidence interval for the population, with pClose=.000.
Goodness of Fit Index (GFI) = .900 < .912 < 1 as recommended, with Adjusted GFI
(AGFI) = .9 < .854 <1 in the acceptable range. (Appendix Table E 1).
Unstandardized regression weights were analyzed for statistical significance for
p<.05. All inputs exceeded the recommended criteria at .001 (2-tailed), indicating a
statistically significant difference from zero. For example, the probability of getting a
critical ratio (the estimate divided by the standard error) as large as |12.590| for the survey
question equivalent of LCR2 regarding Coordination Efforts is .001.
As part of CFA, AMOS yields Modification Indices (MI) to suggest that
relationships between listed variables can be added to the generic model to increase the
goodness of fit and other statistical parameters (Kaplan, 1989; Saris, Satorra, & Sorbom,
1987). In this instance, AMOS reported MI on the covariance between the error
measurements in d5 (LCR2 Coordination Efforts) and d6 (LCR3 Coordination Evidence),
indicating a drop in Chi-Square statistic by 24.165 if allowed to assume an independent
value. AMOS reported measurement errors at “d1” (OC1 Inter-Professional Training) and

113
“d2” (OC2 Appropriate Professional Job Training) with MI of 22.788; and d2 (OC2
Appropriate Professional Job Training) and d5 (LCR2 Coordination Efforts), with MI of
17.545. Intermittent modifications to the generic model resulted in a -.15 correlation at d2
(OC2) and d5 (LCR2). Ultimately, d5 was removed as the common component. The d8
(IMDM2 Centrally Located Equipment Access) was also removed because of its low
contribution to the variance at .07, resulting in the final and revised measurement model
of Structural Complexity.
The researcher retained the factors at d7 (IMDM1 Device Consistency) despite a
.36 factor loading and low variance contribution of 13% to Structural Complexity due to
their potential relevance to Process Adequacy. All other factor loadings achieved greater
>.50. However, the delta measurement errors and d1 (OC1 Inter-Professional Training and
d2 OC2 Appropriate Professional Job Training) reduced the factor loading impact by .17.
Despite the reduction in factor loading due to the measurement error, the contribution is
greater than .50. For example, for OC1 (.72 - .17 = .55).

114
Figure 5.1 Final Revised Measurement Model of Structural Complexity
A final revised measurement model of Structural Complexity (Figure 5.1)
maintained the covariance between d1 and d2. This model achieved a significant
difference from zero at <.001 level (2-tailed) between all categories. Finally, the revised
covariances in the overall model greatly improved the goodness of fit statistics detailed
below.
Unstandardized regression weights were analyzed for statistical significance for p
< .05 from the revised final model. Statistical significance is verified at p < .001 (Table
5.6) A comparison between the standardized regression weights from the generic model
and those from the final revised Structural Complexity model reveals similarities.
However, the largest difference in standardized regression weights is in LCR3
(Coordination Evidence), with a difference of 0.058 (.716 - .774). Finally, all variance
terms for Structural Complexity (d1-d4, d6-7, d9) reach statistical significance at p<.001.
No further reasonable modifications were recommended by AMOS’s MI.

115
Table 5.6 Final Revised Measurement Model of Structural Complexity Indicators of Structural Complexity
URW Estimate
SRW Revised
SRW Generic
Standard Error
Critical Ratio
P value
Inter-Professional Training 1.000 .719 .695 Appropriate Professional Job Training .973 .705 .664 .079 12.274 ***
Uniform Standards 1.206 .641 .621 .121 9.951 *** Interdepartmental Work .832 .686 .715 .079 10.546 *** Coordination Evidence .960 .716 .774 .088 10.919 *** Device Consistency .657 .359 .378 .114 5.765 *** Device Failure Recognition .783 .593 .577 .084 9.289 *** ***<.001 (2-tailed) significance Abbreviation Notes: URW=Unstandardized Regression Weight; SRW=Standardized Regression Weight. The largest error variance in Structural Complexity can be attributed to OC1
(Inter-Professional Training), at .516. The least contribution to variance in this construct
is IMDM1 (Device Consistency), as anticipated.
The final revised Structural Complexity model Chi-square Likelihood Ratio
(χ2/df) or 2.91 meets the recommended condition for results <4 (Table 5.7). The
RMSEA, .078, is an acceptable value. The model retains good precision indicated by a
lower/upper boundary of .052/.107 of a two-sided 90% confidence interval for the
population, with pClose=.052. Goodness of Fit Index (GFI) = .900 < .965 < 1, as
recommended with Adjusted GFI (AGFI) =.9 < .926<1.

116
Table 5.7 Goodness of Fit Statistics: Structural Complexity Measurement Model Index Criterion Initial Final Chi-square (χ2) Low 126.462 37.863 Degrees Of Freedom (df) ≥.0 27 13 Likelihood Ratio (χ2 /df) <4 4.68 2.91 Probability >0.05 0.000 0.000 Goodness of Fit Index (GFI) >.90 x <1.0 0.912 0.965 Adjusted GFI (AGFI) >.90 x <1.0 0.854 0.926 Normative Fit Index (NFI) >.90 0.877 0.946 Tucker Lewis Index (TLI) >.90 0.867 0.941 Comparative Fit Index (CFI) >.90 0.900 0.963
Root Mean Square Error of Approximation (RMSEA)
≤.05 optimum or .05< value <.08
acceptable 0.108 0.078 Hoelter’s Critical N (CN) (.05) > 200 101 187
5.3.2 Process Adequacy Measurement Model A generic model of the indicators of Process Adequacy (Y1-Y11) for the
organizational determinants of level of quality was derived from the process component
of Donabedian's Triad theoretical premise and the supporting literature (Appendix Figure
E 2). Each variable reached 2-tailed statistical significance at .001. The generic models’
Chi-square Likelihood Ratio (χ2/df) of 3.139 meets the recommended condition for
results <4. The RMSEA is .110 which exceeds the recommended value of <.05, with a
good indication of precision with a lower/upper boundary of .095/.125 of a two-sided
90% confidence interval for the population, with pClose=.000. Goodness of Fit Index
(GFI)=.900 < .892< 1 is slightly less than the recommended range and the Adjusted GFI
(AGFI)=.9 < .837 <1 also is less than the acceptable range. (Appendix Table E 2).
Unstandardized regression weights were analyzed for statistical significance at

117
p<.05. All inputs exceeded recommended criteria at p< .001 (2-tailed) significance, a
significant difference from zero. For example, the probability of getting a critical ratio as
large as |7.737| for the survey question equivalent of ITM3 regarding Regular Meetings is
.001.
AMOS yielded Modification Indices (MI) for the covariance between the epsilon
error measurements in e4 (KM2 Formal Department Information) and e5 (KM3 Formal
System Knowledge), indicating a drop in the Chi-Square statistic by 34.133 if allowed to
assume an independent value; also for e2 (ICB2 Equipment Purchasing Involvement) and
e3 (ICB3 Professional Equity), with an MI of 38.467. CSM2 Internal Sanitation was also
removed because of its low contribution to error variance at .08 or 8%, resulting in the
final measurement model of Process Adequacy. However, the researcher retained the
factor at e10 (ITM2 Between-Patients Sanitation Training) despite a low variance
contribution of .16 or 16% to Process Adequacy because of the potential relevance to the
dependent variable of Level of Quality.
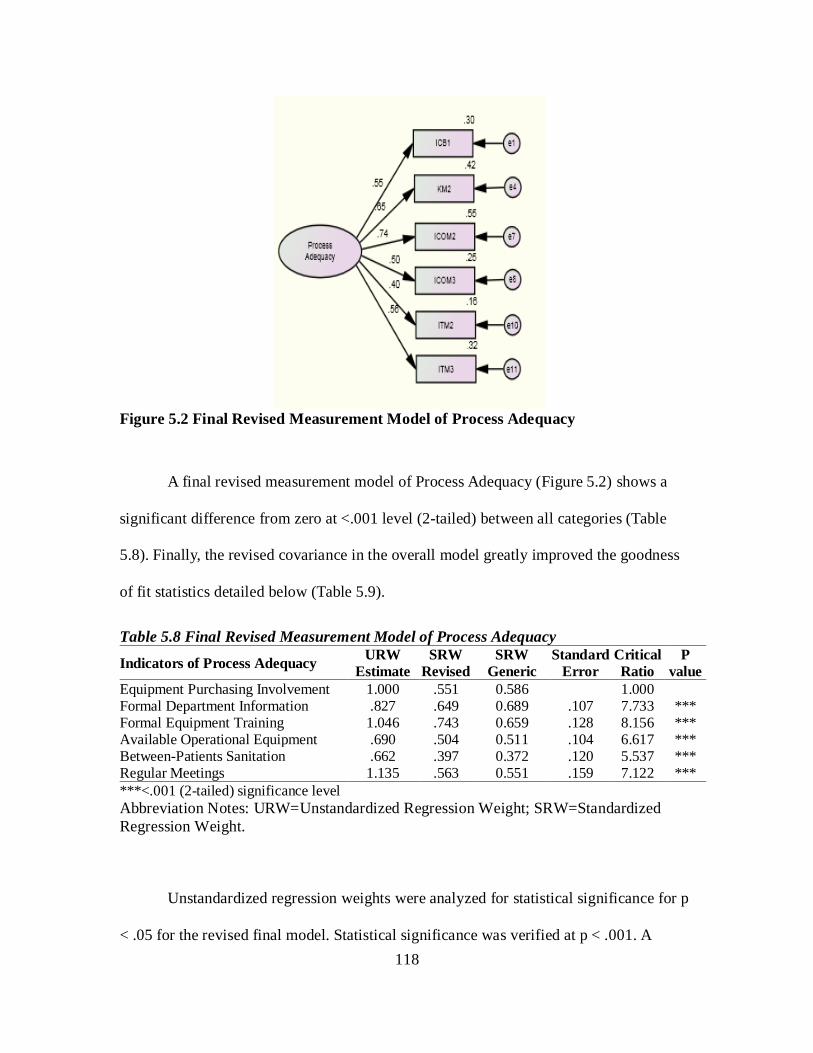
118
Figure 5.2 Final Revised Measurement Model of Process Adequacy
A final revised measurement model of Process Adequacy (Figure 5.2) shows a
significant difference from zero at <.001 level (2-tailed) between all categories (Table
5.8). Finally, the revised covariance in the overall model greatly improved the goodness
of fit statistics detailed below (Table 5.9).
Table 5.8 Final Revised Measurement Model of Process Adequacy
Indicators of Process Adequacy URW Estimate
SRW Revised
SRW Generic
Standard Error
Critical Ratio
P value
Equipment Purchasing Involvement 1.000 .551 0.586 1.000 Formal Department Information .827 .649 0.689 .107 7.733 *** Formal Equipment Training 1.046 .743 0.659 .128 8.156 *** Available Operational Equipment .690 .504 0.511 .104 6.617 *** Between-Patients Sanitation .662 .397 0.372 .120 5.537 *** Regular Meetings 1.135 .563 0.551 .159 7.122 *** ***<.001 (2-tailed) significance level Abbreviation Notes: URW=Unstandardized Regression Weight; SRW=Standardized Regression Weight.
Unstandardized regression weights were analyzed for statistical significance for p
< .05 for the revised final model. Statistical significance was verified at p < .001. A

119
comparison of the standardized regression weights from the generic model and those
from the final revised Process Adequacy model reveals similarities. However, the largest
difference in standardized regression weights is found in ICOM2 (Formal Equipment
Training), with a difference of 0.084 (.659 - .743). All measurement errors for Process
Adequacy (e1, e4, e7-8, e10-11) reached statistical significance at p<.001. No major MI were
recommended by AMOS.
The largest variance in Process Adequacy is in ICOM2 (Formal Equipment
Training), at .552. The least contribution to variance in this construct is ITM2 (Between-
Patients Sanitation Training), as anticipated from Generic model.
Table 5.9 Goodness of Fit Statistics: Process Adequacy Measurement Model Index Criterion Initial Final Chi-square (χ2) Low 211.646 29.912 Degrees Of Freedom (df) ≥.0 44 9 Likelihood Ratio (χ2 /df) <4 4.810 3.323 Probability >0.05 0.000 0.000 Goodness of Fit Index (GFI) >.90 x <1.0 0.892 0.971 Adjusted GFI (AGFI) >.90 x <1.0 0.837 0.932 Normative Fit Index (NFI) >.90 0.757 0.919 Tucker Lewis Index (TLI) >.90 0.743 0.902 Comparative Fit Index (CFI) >.90 0.795 0.941
Root Mean Square Error of Approximation (RMSEA)
≤.05 optimum or .05< value <.08
acceptable 0.110 0.086 Hoelter’s Critical N (CN) (.05) > 200 91 179 The final revised Structural Complexity model’s Chi-square Likelihood Ratio,
(χ2/df) of 3.323, meets the recommended condition for result <4. The RMSEA of .086 is
slightly higher than the acceptable range; there is good precision with a lower/upper
boundary of .053/.121 of a two-sided 90% confidence interval for the population, with

120
pClose=.038. Goodness of Fit Index (GFI)=.900 < .971 < 1, and Adjusted GFI
(AGFI)=.9 < .932<1, as recommended (Table 5.9).
5.3.3 Measurement Model for Level of Quality A generic model of the endogenous latent variable, Level of Quality (Y12-Y20)
was derived from the outcome component of Donabedian's Triad theoretical premise and
supporting literature (Appendix Figure E 3). Each variable reached 2-tailed statistical
significance at .001 (Appendix Table E 3). The generic model’s Chi-square Likelihood
Ratio (χ2/df) of 11.49 exceeds the recommended condition for results <4. The RMSEA
is .182, which exceeds the recommended value of <.05, indicating a good measure of
precision with a lower/upper boundary of .164/.201 of a two-sided 90% confidence
interval for the population, with pClose=.000. GFI=.900 < .814< 1, which is out of the
recommended range, and AGFI=.9 < .690 <1, is further from the acceptable range.
Unstandardized regression weights on the generic model were analyzed for
statistical significance for p<.05. All inputs exceeded the recommended criteria where
p<0 .001 (2-tailed) significance, indicating a significant difference from zero. For
example, the probability of getting a critical ratio as large as |9.735| for the survey
question of CEEft3 regarding Implemented Cost Assessment is .001. In addition, an
example of the interpretation of the estimate of .824 is that when the recorded rating of
the overall Implemented Cost Assessment (CEEft3) increases by 1.000, Level of Quality
will increase by .824.
AMOS yielded Modification Indices (MI) on the covariance between the epsilon
error measurements in e18 (RC1 Regulatory Comprehension) and e19 (RC2 Regulatory

121
Application), indicating a drop in Chi-Square statistic by 123.648 if allowed to assume an
independent value. Also, e12 (CEEft1 Acquisition Integration) and e13 (CEEft2
Management Integration) with an MI of 48.505. RC4 (Regulatory Reporting) were noted
for a low contribution at .17 or 17% to variance of Level of Quality, but was retained for
comparison purposes in the congeneric model. The intermittent model revealed high
correlation error rates greater than or at approximately the same factor contribution on e18
(RC1 Regulatory Comprehension) and e19 (RC2 Regulatory Application), at .64 or 64%;
on e12 (CEEft1 Acquisition Integration) and e13 (CEEft2 Management Integration), .37 or
37%. RC1 and CEEft2 were removed from the model, since each had a poor relationship
with the latent construct.
Figure 5.3 Final Revised Measurement Model of Level of Quality A final revised measurement model of Level of Quality (Figure 5.3) shows a
significant difference from zero, at <.001 level (2-tailed), between all categories. Finally,
the revised covariance in the overall model greatly improved the goodness of fit statistics
detailed below.

122
Table 5.10 Final Revised Measurement Model of Level of Quality Indicators of Level of Quality URW
Estimate SRW
Revised SRW
Generic Standard
Error Critical Ratio
P value
Acquisition Integration 1.000 .644 0.627 Department Contribution to Organization Objectives .840 .729 0.696 .087 9.598 ***
Job Reporting Satisfaction .906 .686 0.621 .098 9.280 *** Implemented Cost Assessment .731 .530 0.584 .095 7.652 *** Regulatory Application .506 .572 0.681 .062 8.137 *** Regulatory Reporting .547 .414 0.411 .088 6.196 *** ***<.001 (2-tailed) significance Abbreviation Notes: URW=Unstandardized Regression Weight; SRW=Standardized Regression Weight. Unstandardized regression weights from the revised final model were analyzed
for statistical significance for p < .05. Statistical significance was verified at p < .001
(Table 5.10). A comparison of the standardized regression weights from the generic
model and those from the final revised model of Process Adequacy reveals similarities.
However, the largest difference in standardized regression weights is in RC2 (Regulatory
Application), with a difference of 0.109 (.681 - .572). All variance errors for Process
Adequacy (e12 , e14- e16, e19-e20) reached statistical significance at p=.001 (2-tailed). No
major additional MIs were recommended by AMOS.
The largest variance in Level of Quality can be attributed to CEEft3 (Department
Contribution to Organization Objectives), at .531 or approximately 53%. The least
contribution to variance in this construct is from RC4 (Regulatory Reporting), at .172 or
approximately 17%, as anticipated from the Generic model.

123
Table 5.11 Goodness of Fit Statistics: Level of Quality Measurement Model Index Criterion Initial Final Chi-square (χ2) Low 310.153 23.851 Degrees Of Freedom (df) ≥.0 27 9 Likelihood Ratio (χ2/df) <4 11.49 2.650 Probability >0.05 0.000 0.005 Goodness of Fit Index (GFI) >.90 x <1.0 0.814 0.975 Adjusted GFI (AGFI) >.90 x <1.0 0.690 0.941 Normative Fit Index (NFI) >.90 0.684 0.944 Tucker Lewis Index (TLI) >.90 0.601 0.940 Comparative Fit Index (CFI) >.90 0.701 0.964
Root Mean Square Error of Approximation (RMSEA)
≤.05 optimum or .05< value <.08
acceptable 0.182 0.072 Hoelter’s Critical N (CN) (.05) > 200 41 225 The final revised Structural Complexity model’s Chi-square Likelihood Ratio,
(χ2/df) of 2.65, meets the recommended condition for results <4. The RMSEA .072 is
within the acceptable range; good precision indicated by a lower/upper boundary of
.038/.108 of a two-sided 90% confidence interval for the population with a pClose=.130.
GFI=.900 < .975 < 1, and AGFI=.9 < .941<1, as recommended (Table 5.11).
5.3.4 Structural Equation Model and Findings of the BEI Survey
An initial Structural Equation Model (or covariance structure model) with three
latent variables was formulated under Donabedian's Triadic theoretical premise
(Appendix Figure E 4). The measurement models of the latent constructs were analyzed
for statistical significance using Confirmatory Factor Analysis (CFA) and were presented
in the previous section. Each variable in the SEM model reached 2-tailed statistical
significance at .001, with the exception of Level of Quality in relation to Process

124
Adequacy (.003) and Level of Quality in relation to Structural Complexity (.003) (Table
5.18). The generic model’s Chi-square Likelihood Ratio (χ2/df) of 2.119 meets the
conditions for results <4. The RMSEA is .060, which is slightly above the recommended
value of <.05, with good precision indicated by a lower/upper boundary of .050/.069 of a
two-sided 90% confidence interval for the population, with pClose=.044. GFI=.900 <
.904< 1 is within the recommended range, with AGFI=.9 < .875 <1 slightly lower than
recommended.
Unstandardized regression weights on the generic model were analyzed for
statistical significance for p<.05 (Appendix Table E 4). All inputs exceeded
recommended criteria at .001 (2-tailed), indicating a statistically significant difference
from zero, except as noted, Level of Quality in relation to both Process Adequacy and
Structural Complexity reached significance at .003 <.05. The probability of getting a
critical ratio as large as |12.463| in the survey question OC2 regarding Appropriate
Professional Job Training is .001 in relation to Structural Complexity. An example of the
interpretation of the estimate of .974 is that when recorded rating of the overall
Appropriate Professional Job Training (OC2) increases by 1.000 in Structural
Complexity, Level of Quality will increase by .974.
AMOS yielded Modification Indices (MI) on the covariance between the epsilon
error measurements in e16 (CEEfc3 Implemented Cost Assessment) and e19 (RC2
Regulatory Application), indicating a marginal drop in Chi-Square statistic by 14.657 if
allowed to assume an independent value. Two factors were also removed for low variance
contribution in the SEM model. They were 1) ITM2 (Between-Patients Sanitation
Training) at .132 or 13.2% and 2) IMDM1 (Device Consistency) at .165 or 16.5%.

125
Control variables were then added to the final model as explanatory variables for
Level of Quality (Appendix Figure E 5), with SEM analysis (Appendix Table E 5).
However, none of the control variables achieved a statistically significant relationship to
Level of Quality. Though the final SEM model does not contain control variables, the
information was retained to report frequency distribution because it adds descriptive
value to the study population for future research.

126
Figure 5.4 Intermittent Revised Congeneric Structural Equation Model of Structural Complexity and Process Adequacy as Organizational Determinants of Level of Quality in the Hospital Environment of Care

127
Table 5.12 Structural Equation Model for BEI Survey, Without Controls: Latent Variable Comparisons, Lambda Factor Loading Applied to First Factor of Each Latent Construct
Predictors URW Estimate
SRW Revised
SRW Generic
Standard Error t P
Process Adequacy ← Structural Complexity1 .923 .889 .892 .103 8.929 ***
Level of Quality ← Process Adequacy2 .654 .563 .493 .191 3.426 ***
Level of Quality←Structural2 Complexity .485 .402 .473 .192 2.523 .012
***<0.001 (2-tailed) significance level Abbreviation Notes: URW=Unstandardized Regression Weight; SRW=Standardized Regression Weight. Note1: Equation 1 Process Adequacy = f (Structural Complexity) where R2=79%. Note2: Equation 2 Level of Quality = f (Structural Complexity + Process Adequacy) where R2 = 88.1%.
An intermittent revised SEM of Structural Complexity and Process Adequacy as
Organizational Determinants of Level of Quality in the Hospital Environment of Care
derived from the BEI Survey (Figure 5.4) shows a significant difference from zero at
p<0.001 (2-tailed), between all categories with the exception of the dependent variable of
Level of Quality at p=0.012 (Table 5.12). Finally, the inclusion of covariance of error
terms in the overall model greatly improved the goodness of fit statistics (Table 5.13)
detailed below.

128
Table 5.13 Revised Goodness of Fit Statistics: BEI Survey without Control Variables, Lambda Factor Loading Applied to First Factor of Each Latent Construct Index Criterion Initial Final Chi-square (χ2) Low 429.427 234.683 Degrees Of Freedom (df) ≥.0 166 113 Likelihood Ratio (χ2 /df) <4 2.586 2.076 Probability >0.05 0.000 0.000 Goodness of Fit Index (GFI) >.90 x <1.0 .878 .918 Adjusted GFI (AGFI) >.90 x <1.0 .846 .888 Normative Fit Index (NFI) >.90 .818 .891 Tucker Lewis Index (TLI) >.90 .861 .928 Comparative Fit Index (CFI) >.90 .879 .940
Root Mean Square Error of Approximation (RMSEA)
≤.05 optimum or .05< value <.08
acceptable .071 .058 Hoelter’s Critical N (CN) (.05) > 200 146 187
Unstandardized regression weights from the final SEM model were analyzed for
statistical significance for p < .05. Statistical significance was verified at p < .001. A
comparison with the standardized regression weights from the revised SEM model
reveals similarities. However, the largest difference in standardized regression weights is
in the relationship between Level of Quality and Process Adequacy, with a difference of
0.07 (.563 - .493). Finally, all variance for the revised SEM of the BEI Survey without
control variables reached statistical significance at p<.001. No major additional MI
corrections were recommended by AMOS.
Statistical analysis findings show that the latent constructs derived from
Donabedian’s Triad are significant at t>1.96, indicating an approximate standard
distribution. The positive, unstandardized regression weight of .923 for Structural
Complexity in the prediction of Process Adequacy is statistically significant at p<.001 (2-

129
tailed). In this instance, for every increase in one standard deviation in Structural
Complexity, there is a .923 increase in Process Adequacy.
Process Adequacy = f(Structural Complexity) (5.1)
Equation 5.1 demonstrates the latent variable relationship between the predictor
variable Structural Complexity and the endogenous variable of Process Adequacy.
Structural Complexity accounts for 79% of the variance in the endogenous variable
(R2=79%).
Level of Quality = f(Structural Complexity + Process Adequacy) (5.2)
The relationship between Process Adequacy and Level of Quality and Structural
Complexity with Level of Quality is demonstrated in Equation 5.2. The combined
exogenous factors on the level of quality have a variance contribution of R2=88.1%.
Process Adequacy and Level of Quality report a significant positive association at .654,
p<0.001 (2-tailed); the Structural Complexity and Level of Quality findings are .485,
p=0.012 (2-tailed).
The Goodness of Fit statistics for the revised BEI Survey without Control
Variables model (Table 5.13) show an improved final model, with Chi-square Likelihood
Ratio (χ2/df) of 2.08 meeting recommended condition for results <4. The RMSEA .058
is within the acceptable range; good precision is indicated by a lower/upper boundary of
.048/.069 of a two-sided 90% confidence interval for the population, with pClose=.094.
GFI=.900 < .918 < 1, and AGFI=.9 < .888<1, slightly less than recommended.

130
Figure 5.5 Structural Equation Model for the BEI Survey with Control Variables

131
Table 5.14 Structural Equation Model for BEI Survey, with Control Variables: Lambda Factor Loading Applied to First Factor of Each Latent Construct
Predictors URW Estimate
SRW Revised
Standard Error t P
Process Adequacy ← Structural Complexity .918 .889 .104 8.865 *** Level of Quality ← Process Adequacy .620 .534 .188 3.303 *** Level of Quality ← Structural Complexity .516 .430 .189 2.722 .006
Respondent Control Variables
Level of Quality←Profession1 - - - - - Level of Quality ←Highest Level of Education2 -.035 -.036 .037 -.936 .349 Level of Quality← Years of Experience3 -.175 -.048 .139 -1.261 .207
Facility Control Variables Level of Quality←State4 -.001 -.023 .002 -.598 .550 Level of Quality ←Joint Commission Accreditation5 .009 .006 .050 .170 .865 Level of Quality ←Facility Type6 -.014 -.015 .036 -.397 .692 Level of Quality ←Facility Location7 -.121 -.074 .063 -1.921 .055 Level of Quality ←Size8 -.026 -.015 .069 -.379 .705 Level of Quality ←Region9 .006 .010 .022 .262 .793 Level of Quality ←Operational Beds10 .000 -.031 .000 -.818 .413 ***<0.001 (2-tailed) significance level Abbreviation Note: URW=Unstandardized Regression Weight; SRW=Standardized Regression Weight. Notes on scale 1-10: 1) Biomedical Engineering Technician, no variance in this sample so item not calculated; 2) High School/General Equivalence Diploma; Associate of Arts/Associate of Science; Bachelor of Arts/Bachelor of Science; Graduate Masters or Doctorate; 3) 0-2 years, 3-4 years, and 5+ years; 4) 50 United States and the District of Columbia; 5)Yes or No; 6) Public, Private, Non-Profit, University Affiliated; 7) Rural or Urban; 8)Small 0-25, Medium 26-150, or Large >150); 9) Northeast, Midwest, Southern, Southeast, Western and 10) Continuous number of operational beds.
Statistical analysis revealed that the latent constructs derived from Donabedian’s
Triad are significant at t>1.96, indicating an approximate standard distribution when
control variables are added to the final SEM model (Table 5.14). The positive,
unstandardized regression weight of .918 for Structural Complexity in the prediction of
Process Adequacy is statistically significant at p<.001 (2-tailed). In this instance, for
every increase in one standard deviation in Structural Complexity, there is a .918 increase
in Process Adequacy. Structural Complexity accounts for 79% of the variance in the
endogenous variable (R2=79%).
The addition of the control variables has slightly increased combined contribution

132
to variance in Level of Quality of Structural Complexity and Process Adequacy, at
R2=89%. Process Adequacy and Level of Quality have a significant positive association
at .620, p<0.001 (2-tailed); the Structural Complexity and Level of Quality findings are
.516, p=0.006 (2-tailed). However, none of the control variables achieved a significant
factor loading or probability (Figure 5.5). Only one control variable is of interest: Facility
Location, (whether the organizational facility where the BMET was employed was in an
urban or rural location). Statistical significance for this variable is at t=-1.921 which
indicates non-normal distribution and probability is p=0.055 (2-tailed), slightly higher
than acceptable parameters. The final revised model without control variables is
illustrated in Section 5.4, since the researcher wished to determine the contribution of
factors that should be analyzed because of their recognized contribution to clinical
engineering quality but that were held constant due to the placement of the lambda
regression weight.
Earlier SEM models provided results that held regression weights (lambda)
constant on the first factor in each construct, which prohibited the calculation of their
specific contribution to the model. However, historically these factors have contributed to
better clinical engineering quality. Hence, the same model was allowed to regress on each
of the factors within each construct that established the least contribution: Regulatory
Application (Level of Quality); Available Operational Equipment (Process Adequacy);
and Interdepartmental Work (Structural Complexity), so that results of the potentially
leading predictors could be analyzed: Acquisition Integration (Level of Quality),
Equipment Purchasing Involvement (Process Adequacy), and Inter-Professional Training
(Structural Complexity).

133
Table 5.15 Final Structural Equation Model for BEI Survey Without Controls
Predictors URW Estimate
SRW Revised
Standard Error t P
Process Adequacy ← Structural Complexity .647 .889 .089 7.248 ***
Level of Quality ← Process Adequacy .504 .563 .161 3.136 .002 Level of Quality ← Structural Complexity .262 .402 .106 2.469 .014
Structural Complexity X1-6 Interdepartmental Work← Structural Complexity1 1.000 .687
Uniform Standards ← Structural Complexity2 1.414 .627 .141 10.062 ***
Inter-Professional Training ← Structural Complexity3 1.171 .701 .106 11.091 ***
Coordination Evidence ← Structural Complexity4 1.161 .723 .101 11.445 ***
Appropriate Professional Job Training ← Structural Complexity5 1.134 .685 .105 10.850 ***
Device Failure Recognition ← Structural Complexity6 .992 .627 .099 10.065 ***
Process Adequacy Y1-5 Available Operational Equipment ← Process Adequacy7 1.000 .469
Regular Meetings ← Process Adequacy8 1.850 .590 .264 7.009 ***
Equipment Purchasing Involvement ← Process Adequacy9 1.670 .593 .237 7.036 ***
Formal Equipment Training ← Process Adequacy10 1.576 .719 .205 7.678 ***
Formal Department Information ← Process Adequacy11 1.225 .618 .171 7.172 ***
Level of Quality Y6-11 Regulatory Application ← Level of Quality12 1.000 .531
Acquisition Integration ←Level of Quality13 2.166 .660 .259 8.371 ***
Job Reporting Satisfaction ← Level of Quality14 2.026 .722 .231 8.785 ***
Department Contribution to Organizational Objectives ← Level of Quality15
1.737 .709 .200 8.702 ***
Implemented Cost Assessment ← Level of Quality16 1.294 .441 .179 7.226 ***
Regulatory Reporting ← Level of Quality17 1.139 .406 .191 5.976 ***
***<0.001 (2-tailed) significance level Note: URW=Unstandardized Regression Weight; SRW=Standardized Regression Weight. Notes on Scale1-17: 1) I receive and/or provide interdepartmental input in order to successfully complete work, 2) Standards are applied equally across all departments, 3) The organization values contributions to other staff members’ professional development, 4) Interdepartmental coordination has resulted in

134
Predictors URW Estimate
SRW Revised
Standard Error t P
visible positive benefits, 5) I have been provided clear training to perform my job function, 6) I receive and/or provide advice on new equipment purchases, 7) I receive and/or provide clean, operational equipment in a timely fashion, 8) Nursing and biomedical engineering conduct regularly scheduled meetings on equipment issues, 9) I receive and/or provide advice on new equipment purchases, 10) I receive and/or provide training on the proper way to operate equipment,11) I have access to formal knowledge within the department, 12) Biomedical engineering is able to apply medical equipment regulatory policy, 13) Biomedical engineers are integrated in the medical equipment purchasing process, 14) Biomedical engineers are satisfied with reporting authorities, 15) Biomedical engineers set and achieve department goals based on organizational objectives, 16) Biomedical engineering measures cost using generally accepted metrics, and17) All departments have access to hospital acquired infection data. AMOS statistical analysis software shows that the latent constructs are significant
at t>1.96, indicating an approximate standard distribution (Table 5.15). The positive,
unstandardized regression weight of .647 for Structural Complexity in the prediction of
Process Adequacy is statistically significant at p<0.001 (2-tailed). The relationship
between Process Adequacy and Structural Complexity has a combined explanatory
contribution to variance for the Level of Quality at R2=0.881 or 88.1%. PA and LOQ
report a significant positive association at .504, p=0.002 (2-tailed); SC and LOQ findings
are .262, p=.012 (2-tailed).
A detailed review of the unstandardized estimates reveals that each exogenous
factor X1-6 of Structural Complexity in the prediction of Process Adequacy is statistically
significant at t>1.96, p<0.001 (2-tailed). All endogenous variables Y1-11 comprising Eta1
(Y1-5) and Eta2 (Y6-11) exhibit statistical significance at t>1.96, p<0.001. Therefore,
Process Adequacy and Structural Complexity in the prediction of LOQ are statistically
significant.
The individual factor with the greatest relationship between the SC predictor
variable and the LOQ endogenous study variable is Uniform Standards, where one
standard deviation will increase the Level of Quality by 1.414. The individual factor with

135
the greatest relationship between PA and LOQ is Regular Meetings, at 1.850. These
findings suggest that improvement in this area have the potential to nearly double
expectations for the quality of care.
The most dynamic impact from the relocation of the lambda regression weight
can be seen in the endogenous variable LOQ at Acquisition Integration. Previously held
constant, Acquisition Integration reports the highest value, 2.166, followed closely by Job
Reporting Satisfaction at 2.026. Acquisition Integration, affirming that “Biomedical
engineers are integrated in the medical equipment purchasing process” and Job Reporting
Satisfaction, “Biomedical engineers are satisfied with reporting authorities,” can have
more than double the impact on the Level of Quality.
Table 5.16 provides a summary of the squared multiple correlations of the
observed variables in the SEM for the BEI survey. The “Estimate” refers to the
percentage of contribution of variance in the model.

136
Table 5.16 Squared Multiple Correlations of the Lambda Revised Structural Equation Model of the Biomedical Engineering Interdepartmental Survey Predictors Estimate
Process Adequacy .790 Level of Quality .881
Process Adequacy
Formal Equipment Training1 .516 Formal Department Information2 .381 Equipment Purchasing Involvement3 .352 Regular Meetings4 .348 Available Operational Equipment5 .220
Structural Compliance Coordination Evidence6 .522 Inter-Professional Training7 .492 Interdepartmental Work8 .472 Appropriate Professional Job Training9 .469 Device Failure Recognition10 .393 Uniform Standards11 .393
Level of Quality Job Reporting Satisfaction12 .521 Department Contribution to Organization Objectives13 .502 Acquisition Integration14 .435 Regulatory Application15 .282 Implemented Cost Assessment16 .195 Regulatory Reporting17 .165 Notes 1-17: 1I receive and/or provide training on the proper way to operate equipment. 2I have access to formal knowledge within the department. 3I receive and/or provide advice on new equipment purchases. 4Nursing and biomedical engineering conduct regularly scheduled meetings on equipment issues. 5I receive and/or provide clean, operational equipment in a timely fashion. 6Interdepartment coordination has resulted in visible positive benefits. 7The organization values contributions to other staff members’ professional development. 8I receive and/or provide interdepartmental input in order to successfully complete work. 9I have been provided clear training to perform my job function. 10I receive and/or provide training to recognize medical device failure. 11Standards are applied equally across all departments. 12Biomedical engineers are satisfied with reporting authorities. 13Biomedical engineers set and achieve department goals based on organizational objectives. 14Biomedical engineers are integrated in the medical equipment purchasing process. 15Biomedical engineering is able to apply medical equipment regulatory policy. 16Biomedical engineering measures cost using generally accepted metrics. 17All departments have access to hospital acquired infection data.

137
5.4 Hypothesis Test Results
The primary objectives of this study were the assessment of the researcher-
developed questionnaire as a viable research instrument and specific analysis of the latent
constructs through statistical analysis. The instrument proved reliable in two separate
Cronbach Alpha analysis procedures (Sections 4.3, 5.6). Hypothesis testing showed the
modified Structural-Process-Outcome model to be measureable, identified hospital
structural characteristics and process factors that affect the quality of care in US
hospitals, and validated the relationships between the LOQ and three healthcare outcomes
(e.g., clinical effectiveness, clinical efficiency, and regulatory compliance).
Table 5.17 Summary of the Statistical Evidence in Support of Study Hypotheses Hypotheses Statements Summary of Statistical Evidence Results
Hypothesis1: Structural complexity positively affects process adequacy in the hospital environment of care.
PA←SC: p<0.001 level (2-tailed); β=.889, t=7.248, t>1.96 on all factors;
R2 = 79%.
Supported
Hypothesis2: Structural complexity positively affects the level of quality in the hospital environment of care.
LOQ←SC; p=0.014 level (2-tailed); β=.402, t=2.469, t>1.96 on all factors;
R2 = 16.2%.
Supported
Hypothesis3: Process adequacy positively affects the level of quality in the hospital environment of care.
LOQ←PA: p=.002 level (2-tailed); β=.563, t=3.136; t>1.96 on all factors;
R2 = 31.2%.
Supported
Abbreviation Notes: SC=Structural Complexity, PA=Process Adequacy, LOQ=Level of Quality, ← = direction of the relationship between constructs.

138
Table 5.17 is a summary of the statistical support detailed in Section 5.3.4 for
findings on the hypotheses.
5.5 Final Reliability Analysis SEM Model The final SEM model of the Biomedical Engineering Interdepartmental Survey
submitted to the biomedical engineering technician sample population has undergone
reliability analysis to determine the internal consistencies of the scales derived through
the calculation of the Cronbach Alpha (α) coefficient on the overall measurement. PASW
(version 18.0.0) statistical software showed a final range of Cronbach α=0.718 to 0.831
for the respondent ratings for each latent construct of Structural Complexity, Process
Adequacy, and Level of Quality indicating good internal consistency >0.7 (DeVellis,
2003) (Table 5.18). These data show that all make some contribution, since no values
were reported at zero, N=317 valid cases. Overall BEI Survey reliability Cronbach α =
0.905.

139
Table 5.18 Final SEM Cronbach Alpha Reliability Coefficient for Latent Constructs from Biomedical Engineering Interdepartmental Survey Results
Latent Constructs and Factors Initial
Cronbach's Alpha N=395; 39 Items
Final Cronbach's Alpha
N=317; 17 Items Structural Complexity Construct All 0.774 0.831
Organizational Culture 0.771 Level of Coordination 0.833 Medical Equipment Complexity -0.177 Interdepartmental Medical Device Management
0.469
Process Adequacy Constructs All 0.833 0.718
Interdepartmental Collaboration 0.644 Knowledge Management 0.748 Complexity of Sanitation Methods 0.639 Interdepartmental Communication 0.688 Interdepartmental Teamwork 0.568
Level of Quality Constructs All 0.791 0.758
Clinical Engineering Effectiveness 0.782 Clinical Engineering Efficiency 0.695 Regulatory Compliance 0.444
Overall 0.918 0.905 The complete BEI survey questionnaire contained questions for three major latent
constructs derived from Donabedian’s Triad: Structural Complexity, Process Adequacy
and Level of Quality. Structural Complexity, originally comprising four factors
(Organizational Culture, Level of Coordination, Medical Equipment Complexity, and
Interdepartmental Medical Device Management) for a total of 12 variables, was reduced
to three factors and 6 variables. The final 6 factors of Structural complexity were
Organizational Culture (three), Level of Coordination (two), and Interdepartmental
Medical Device Management (one).

140
Process Adequacy, originally comprising five factors (Interdepartmental
Collaboration, Knowledge Management, Complexity of Sanitation Methods,
Interdepartmental Communication, and Interdepartmental Teamwork) for a total of 15
variables, was reduced to four factors and five variables. The final variables of Process
Adequacy comprised Interdepartmental Collaboration (one), Knowledge Management
(one), Interdepartmental Communication (two), and Interdepartmental Teamwork (one).
Level of Quality, originally comprising three factors (Clinical Engineering
Effectiveness, Clinical Engineering Efficiency, and Regulatory Compliance) for a total of
12 variables, was reduced to six variables. The final variables of Level of Quality are
comprised Clinical Engineering Effectiveness (three), Clinical Engineering Efficiency
(1), and Regulatory Compliance (2).
5.6 Additional Findings: Intervening Status of Process Adequacy At this juncture, manipulation of the final revised SEM model can reveal the
actual role of the latent construct Process Adequacy, previously identified in this model
as an intervening variable. Determination of the status of Process Adequacy as a
mediating or moderating variable utilizes Baron & Kenny’s (1980) causal step approach
methodology.
A preliminary condition of the causal steps to determine mediation requires the
removal of the variable under consideration from the SEM model. The model adjustment
allows only the independent and dependent variables to regress (Figure 5.6).

141
Figure 5.6. Results of the Final Structural Equation Model with Proposed Mediating Construct Process Adequacy, Removed for Illustrative Purposes
A second preliminary condition for mediation is determining if there is no longer
statistical significance between the predictor and the outcome variables (Table 5.19).
Elimination of the Process Adequacy term indicates a strong relationship of .89 between
Structural Complexity and Level of Quality at t>1.96, p<0.001 (2-tailed). Since the
relationship is significant without the Process Adequacy construct, the preliminary
conditions of mediation did not occur. Consequently, it was unnecessary to perform the
causal steps interpretation of the Beta coefficient in the structural equation model for the
stimulus-response effect on the linear regression equations under the historically accepted
maximum likelihood-based method (Hayes, 2009; Baron & Kenny, 1986).

142
Table 5.19 Structural Equation Model with Proposed Mediating Variable Removed
Predictors URW Estimate SRW Standard
Error t P
Level of Quality ← Structural Complexity 1.061 .894
.108 9.841 ***
***<0.001 (2-tailed) significance level Abbreviation Notes: URW=Unstandardized Regression Weight; SRW=Standardized Regression Weight.
A preliminary consideration to determine moderation under desirable conditions
indicates that the “moderator variable be uncorrelated with both the predictor and the
criterion (the dependent variable)” and “moderators and predictors are at the same level
in regard to their role as causal variables antecedent or exogenous to certain criterion
effects” (Baron & Kenny, 1986, p. 1174). This study does not consider the intervening
variable of Process Adequacy on the same level as Structural Complexity since Process
Adequacy has been established as both an exogenous and endogenous variable (e.g.,
Process Adequacy is endogenous to Structural Complexity; Process Adequacy is
exogenous to Level of Quality). Further, correlation has been previously demonstrated
between Structural Complexity and Process Adequacy (Table 5.3) and between Process
Adequacy and Level of Quality (Table 5.5). Hence, the preliminary conditions of
moderation were not met.
In summary, the preliminary conditions of mediation and moderation have not been
met utilizing Baron & Kenny’s (1986) methodology. Consequently, Process Adequacy is an
intervening variable. However, other researchers have recently provided other
methodologies that were not performed in this analysis which may be used to provide
alternative methods for testing. In fact, several researchers suggest that these new
analysis methods may improve on the causal steps approach which may have reduced
power (Hayes, 2009; MacKinnon, Fairchild, & Fritz, 2007; Bauer, Preacher, & Gil,
143
2006). They suggest an alternative testing sequence such as the Sobel test (Sobel, 1982,
1986 as cited in Hayes, 2009), which analyzes the standard error in the direct relationship
between the predictor and the outcome that may in part account for the intervening effect.
But Hayes (2009) and MacKinnon et al. (2007) indicate that each potential replacement
struggles with weaknesses that require further examination before a new method can gain
mainstream acceptance in the statistical community.
5.7 Control Variable Frequency Distribution
The BEI Survey study directly required three respondent and five facility
demographics. In addition, respondents who identified their facility as located in an urban
area were asked to provide their zip codes. The researcher derived two additional facility
demographics from the data for Number of Operational Beds and State, to form hospital Size
and Region, respectively. Frequency distributions were calculated on all categorical variables
(Tables 5.20 and 5.21). The continuous variable of Operational Beds was calculated
separately because of the multiple responses. Operational Beds descriptive statistics are valid
at N=308, range of 0 to 5,000 beds, mean score =447.20 with a Standard Deviation of
505.418. The State Frequency Distribution is led by California having the most responses at
25, 7.9% of the total. Florida, Ohio, and Texas are tied for the second highest contribution at
21, at 6.6%. Tennessee (16, 5%) and Indiana (15, 4.7%) rounded out the top tier. The balance
of states had 2 or more responses except for Alaska, Delaware, Montana, North Dakota, and
Oklahoma, each had only one representative completing the survey. (Control variable
frequency distribution for the number of respondents by state is available upon request.)

144
Table 5.20 Biomedical Engineering Interdepartmental Survey: Frequency Distribution of the Categorical Respondent Control Variables
Control Frequency Percent Valid Percent Cumulative
Percent
Profession Biomedical Engineering
Technician
313 98.7 99.1 99.1
Nurse 2 .6 .6 99.7
Quality 1 .3 .3 100.0
Total 316 99.7 100.0 Missing 1 .3
Total N 317 100.0 Years of
Experience
0-2 years 2 .6 .6 .6
2-4 years 6 1.9 1.9 2.5
5+ years 308 97.2 97.5 100.0
Total 316 99.7 100.0 Missing 1 .3
Total N 317 100.0 Education High School 12 3.8 3.8 3.8
Associate of Arts/Associate
of Science
183 57.7 57.9 61.7
Bachelor of Arts/Bachelor
of Science
78 24.6 24.7 86.4
Graduate (Masters or
Doctorate)
43 13.6 13.6 100.0
Total 316 99.7 100.0 Missing 1 .3
Total N 317 100.0
A majority of respondents reported 5+ years of experience (97.2%), at least a 2
year education (57.7%), working at large (80.8%), non-profit (68.8%), Joint Commission
accredited (85.5%), urban facilities (67.8%) across 5 regions.
Regional representation was fairly consistent, with the Midwest achieving the
largest representation, 85, for 26.8% of the population sample. Other regions contributing
in roughly the same proportion were Southern (62, 19.6%), Northeast (58, 18.3%), and

145
the Southeast (56, 17.7%).The Western region had the least representation, 49, for 15.5%
of the sample.

146
Table 5.21 Biomedical Engineering Technician Interdepartmental Survey: Frequency Distribution of the Categorical Organizational Control Variables
Control Frequency Percent Valid Percent Cumulative
Percent
Joint
Commission
Accredited
Yes 271 85.5 86.9 86.9
No 15 4.7 4.8 91.7
Other Accredited 26 8.2 8.3 100.0
Total 312 98.4 100.0 Missing 5 1.6
Total N 317 100.0 Facility
Type
Public 43 13.6 13.8 13.8
Private 24 7.6 7.7 21.5
Non-Profit 218 68.8 69.9 91.3
University Affiliated 27 8.5 8.7 100.0
Total 312 98.4 100.0 Missing 5 1.6
Total N 317 100.0 Location
Type
Rural 97 30.6 31.1 31.1
Urban 215 67.8 68.9 100.0
Total 312 98.4 100.0 Missing 5 1.6
Total N 317 100.0 Size Small (0-25) 6 1.9 2.0 2.0
Medium (26-150) 40 12.6 13.2 15.2
Large (>150) 256 80.8 84.8 100.0
Total 302 95.3 100.0 Missing 15 4.7
Total 317 100.0 Region1 Northeast 58 18.3 18.7 18.7
Midwest 85 26.8 27.4 46.1
Southern 62 19.6 20.0 66.1
Southeast 56 17.7 18.1 84.2
Western 49 15.5 15.8 100.0
Total 310 97.8 100.0 Missing System 7 2.2
Total N 317 100.0

147
Note 1: Northeast (Connecticut, Delaware, Maine, Maryland, Massachusetts, New Hampshire, New
Jersey, New York, Pennsylvania, Rhode Island, Vermont, and Washington, DC.); Midwest (Illinois,
Indiana, Iowa, Kansas, Michigan, Minnesota, Missouri, Nebraska, North Dakota, Ohio, South Dakota,
and Wisconsin), Southern (Alabama, Arkansas, Kentucky, Louisiana, Mississippi, Oklahoma,
Tennessee, and Texas ), Southeast (Florida, Georgia, North Carolina, South Carolina, Virginia, and
West Virginia), and Western (Alaska, Idaho, Montana, Oregon, Washington, Wyoming, Arizona,
California, Colorado, Hawaii, Nevada, New Mexico, and Utah).
5.8 Response Distribution for the Observed Variables
A complete codebook of respondent answers listing the frequency distributions
and cumulative percentages for the observed variables is available for review upon
request. The data includes the variables that were eliminated due to non-normal
distribution.
5.8.1.1 Summary
The relationships among the three latent constructs, based on Donabedian’s Triad,
were analyzed. The results indicate strong support for the three major hypotheses. The
final Structural Equation Model (Figure 5.4) indicates strong, positive relationships
between constructs as statistically significant 2-tailed relationships (Table 5.15): 1)
between Structural Complexity and Process Adequacy at β=.889, t=7.248, p<0.001; 2)
between Process Adequacy and Level of Quality at β=.563, t=3.136, p=0.002; and 3)
between Structural Complexity and Level of Quality at β=.402, t=2.469, and p=0.014.
Translation of these regression findings into equation form follows.
Level of Quality = .889 Structural Complexity + .563 Process Adequacy (5.1)

148
Process Adequacy did positively and significantly statistically influence the
variability in level of quality at t>1.96, p<0.001 (2-tailed). Finally, Structural Complexity
did positively and significantly statistically influence Process Adequacy at t>1.96 on all
factors, p<0.001 (2-tailed), and Level of Quality at t>1.96, p<0.012 (2-tailed).

149
CHAPTER 6: DISCUSSION AND RECOMMENDATIONS
6.1 Discussion Donabedian’s Triad was successfully developed and applied to the biomedical
engineering technician community (BMET) in the hospital environment of care (EC), with
strong support revealed by hypothesis testing. Effects of Structural Complexity and Process
Adequacy on the prevalence of systemic adverse events and compliance problems were
demonstrated through proxy measurements of Level of Quality that incorporated measures of
Clinical Engineering Effectiveness, Clinical Engineering Efficiency, and Regulatory
Compliance. Structural Complexity has a direct and indirect, positive relationship with the
endogenous study variable Level of Quality.
Analysis revealed three statistically supported relationships with important and
unique findings. First, the relationship between Structural Complexity and Level of Quality
indicate that simple organizational changes such as applying Uniform Standards equally
across departments have the greatest potential to influence the Level of Quality in the
environment of care (EC). Structure’s effect on the Level of Quality is supported in a range
of literature in health, computer science, and manufacturing. Second, the relationship
between Process Adequacy and Level of Quality has significant findings: interdepartmental
activities that integrate skillsets can increase the Level of Quality. These findings strongly
suggest that Regular Meetings between Nursing and the BMET to discuss equipment issues
can also positively impact Level of Quality in the EC. Third, emphasizing organizational
changes that promote Interdepartmental Work and Training can elicit positive processes
associated with increased quality such as Equipment Purchasing Involvement and the
Availability of Operation Equipment.

150
The application of these findings should not be dependent on the employment status
of the BMET in Clinical Engineering. Specifically, whether the BMET is a direct hire of the
healthcare facility and/or a third party contractor should not impact the application of these
results since all BMETs must work in the environment of care.
This section discusses the research questions and hypothesis testing results in relation
to each construct. Implications of the results for the theoretical, methodological, external
policy, and hospital administrative management changes are discussed. Limitations of the
study are presented. Finally, recommendations for future research are provided.
6.1.1 Level of Quality
Overall, the constructs presented in this study are measureable, addressing research
question one: “Are the constructs Structural Complexity, Process Adequacy, and Level of
Quality, measurable?” Statistical significance and an approximate standard distribution
(t>1.96) was found between latent constructs. The relationships between Structural
Complexity and Process Adequacy, p<0.001 (2-tailed); Process Adequacy and Level of
Quality, p=0.002 (2-tailed); and predictors of Structural Complexity and the study variable of
Level of Quality, p=0.014 (2-tailed) confirm statistical significance.
Specific factors of Level of Quality in the SEM with adjusted lambda placement were
analyzed for statistical significance, at p<0.05. All inputs exceed recommended criteria, at
p<0.001 (2-tailed) indicating that measurements adequately represent the endogenous study
variable Level of Quality. In particular, two factors of the sub-group Clinical Engineering
Effectiveness have recorded estimates greater than two. Acquisition integration, which
measured to what degree “Biomedical engineers are integrated in the medical equipment
purchasing process”) has an estimate value of 2.166. Job reporting satisfaction, which

151
measured to what extent “Biomedical engineers are satisfied with reporting authorities) has a
value of 2.026. These values indicate that as each rating of overall acquisition integration or
job reporting satisfaction increases by 1.000, the Level of Quality will more than double.
A review of the survey response rate and information in a preliminary pilot study
may help place two seemingly divergent solutions with high impact in proper
perspective. Approximately two-thirds of those polled either agree or strongly agree that
biomedical engineering technicians are involved in the purchasing process. However,
BMET inclusion does not span clinical departments. Though this study did not assess
biomedical engineering at the department level, a preliminary finding in a pilot study
conducted by the author (Fiedler & Agarwal, 2009) is that although integration has
occurred in administrative functions such as purchasing or Management Information
Systems (MIS), BMETs are not integrated into areas of high patient contact such as
infection control or central sterile. In fact, only 4 of N=182 stated that they worked
regularly in another department (reported as MIS) and 9 had administrative duties
(Fiedler & Agarwal, 2009).
It should be noted that an ordinal question on Management Integration to
determine the extent to which “Biomedical engineers are integrated into facility
management (e.g., Central Sterile, Infection Control, Management Information Systems)
was eliminated in the measurement model of Level of Quality because of similarities in
measurements of acquisition integration. Using that measure instead of acquisition
integration results in a non-parametric indication, since t<1.96 does not indicate an
approximate standard distribution, and p=0.052 is slightly higher than the p<0.05
152
criterion. Future studies may consider a Poisson distribution analysis method with this
indicator.
A review of the response rate for job reporting satisfaction, which measured to what
extent “Biomedical engineers are satisfied with reporting authorities,” shows that 42.9 per
cent of the respondents agreed with this statement. But nearly as many indicated that they
‘Neither Agreed or Disagreed’ (27.8%), ‘Disagreed’ (9.1%), or ‘Strongly Disagreed’ (4.1%)
with the statement. Therefore, for nearly half of the BMETs their role in relation to other
departments appears clearly defined, while others clearly express dissatisfaction with this
facet of their duties. The disparity may be attributed to the present nature of the biomedical
engineering technician community, in that the BMET has not achieved professional status but
is making strides to do so in order to solidify a presence in the clinical environment. Also, the
possibility exists that even as BMETs report involvement, there may be organizational
cultural boundaries that put boundaries on their contributions and hence limit reporting
satisfaction in their particular facility.
Conclusions from these findings on the Level of Quality indicate that inter-
professional interaction, but not necessarily biomedical engineering integration into other
departments (which may further complicate the disparate reporting structure), will
increase the level of quality. The premise of Integrated Empirical Ethics supports the
maintenance of professional autonomy in this scenario while allowing for more
collaborative contributions by biomedical engineering technicians in clinical service
operations.
153
6.1.2 Structural Complexity Research question two asked, “What is the relationship between structural
complexity and process adequacy?” Findings support the conclusion that structural
complexity, representative of components from organizational culture, level of coordination,
and interdepartmental device management, has a positive relationship that is statistically
significant with the intervening variable of process adequacy (Section 5.6).
Statistical findings in response to research question three, which asked, “What is
the relationship between structural complexity and the level of quality in the hospital
environment of care?” lead to the conclusion that structural complexity has a statistically
significant positive relationship, both directly and indirectly, with the endogenous study
variable. The relationship between Structural Complexity and Level of Quality implies that
several simple, cost effective changes in the hospital structure can improve hospital level of
quality in terms of clinical effectiveness, efficiency and regulatory control.
The two leading factors of Structural Complexity that contribute to Level of Quality
are subscales of organizational culture: 1) uniform standards which measures the extent that
“Standards are applied equally across all departments” and 2) inter-professional training,
which measures the extent that “The organization values contributions to other staff
members’ professional development”. Organizational culture has played a distinct role in
assessing performance in hospital units such as the ICU (Minvielle et al., 2008) and clinical
engineering (Cao & Frize, 2003; Frize, 1989). A third leading Structural Complexity factor in
the prediction of Level of Quality is from the subscale of level of coordination—
coordination evidence. Coordination evidence measures the extent that “Interdepartmental
coordination has resulted in visible positive benefits”. The combination of those two terms

154
echoes forth the notions of “I’ll believe it when I see it” or “Put your money where your
mouth is.” Intuitively, respondents expect to see visible evidence of teamwork and
collaboration efforts that not only promotes professional development when a didactic
occurs, but results in visible changes. A promise of positive change is inherently different
from visible evidence, especially when standards are applied differently in departments or
only to specific personnel. Hence, structural changes that strive for common goals leading to
uniform standards should consider the benefits of inter-professional training and convergence
of ethical motivation.
6.1.3 Process Adequacy
Research question four asked, “What is the relationship between process adequacy
and the level of quality in the hospital environment of care?” Findings point to the
conclusion that the intervening variable of process adequacy has a positive relationship
that is statistically significant with the endogenous study variable.
The intervening effect of Process Adequacy (composed of interdepartmental
collaboration, knowledge management, interdepartmental communication and
interdepartmental teamwork constructs) has significant findings which reveal that
interdepartmental activities can be used to increase the Level of Quality in the EC. Not
surprisingly, the three leading factors between Process Adequacy and the Level of Quality
are a combination of subscales including interdepartmental teamwork, collaboration and
communication, suggesting regular meetings (“Nursing and biomedical engineering conduct
regularly scheduled meetings on equipment issues”), equipment purchasing involvement (“I
receive and/or provide advice on new equipment purchases”), and formal equipment training
(“I receive and/or provide training on the proper way to operate equipment”).
155
One factor of knowledge management—formal department training (“I have access to
formal knowledge with the department”) is of further note. Training for a biomedical
engineering technician consists of two-years of civilian education and an internship leading
to an Associate of Science or military training. From the author’s personal experience, a great
deal of BMET education is informal through exchanges that closely resemble
apprenticeships. Given that situation, the statistical significance of access to formal
knowledge is surprising, yet understandable due to the personal responsibility of being the
first line of defense ensuring that practitioners have operational equipment to perform their
tasks. The responsibility requires the accumulation of diverse knowledge about a vast array
of equipment types, which the informal means of apprenticeship may not achieve.
6.1.4 Clinical Effectiveness, Clinical Efficiency, and Regulatory Compliance
This study’s results are important in that they are measured against critical
evaluation performance indicators and derived from credible healthcare theorists and
experts in this field. The findings also are consistent with evaluations in the literature and
in some cases provide supplemental findings as noted previously. For example, the
finding that organizational culture influences clinical engineering effectiveness is
supported by the Frize (1989) clinical engineering model. Chuang and Inder (2009)
concur with the finding that regulatory compliance may exert less influence than
supposed, but is a necessary component for some uniformity in the delivery of health
care. The opportunity to increase efficiency through optimizing knowledge of personnel
and equipment management (Podgorelec et al., 2009) is consistent with the statistical
relevance of implemented cost assessment and biomedical engineering technician
interdependencies in this study. The incorporation of a multidisciplinary meeting to

156
increase communication and therefore patient outcomes (Ruhstaller, Roe, Thurlimann, &
Nicoli, 2006) has been validated in this study population.
The results of this study show opportunities to promote positive organizational
change through internal transparencies that improve patient outcomes (Perez & DiDona,
2009; Donabedian, 1989). Predictors identified from inter-departmental partnerships and
associated processes suggest that integration of the biomedical engineering technician
into the hospital delivery system can improve the quality of care. Administrators can
manage and improve quality through employing simple, effective and efficient solutions
such as 1) updating internal hospital policy to require regularly scheduled meetings
between nursing and biomedical staff regarding equipment issues, 2) linking the BMET
department goals to organization objectives, 3) interdepartmental reporting of hospital
acquired infections, and 4) standardizing clinical engineering practices to facilitate
increased internal and external hospital quality.
6.2 Implications
The study has implications for theory, external policy, and internal hospital
management policy. Details follow in the next sections.
6.2.1 Theoretical Implications
The theoretical contributions of the study include the instrument development and
measurement models for hospital level of quality. Donabedian’s Triad is statistically
analyzed, indicating that structural complexity and process adequacy are explanatory of the
outcome variable, level of quality. Further, the outcome measures of Quality—Effectiveness,
Efficiency, and Regulatory Compliance were defined in the context of Clinical Engineering.

157
Several statistically significant predictors of quality support an interdepartmental approach to
systemic problems; they are Uniform Standards, Inter-Professional Training, and
Coordination Evidence. The application of Integrated Empirical Ethics provides a foundation
for management resolution of divergence in internal and external controls, which can
improve hospital level of quality through consolidation.
The Assessment Measurement Classes of Organization Performance, better
known as Donabedian’s Structure-Process-Outcome Theory, have been applied to many
studies. However, the biomedical engineering technician profession’s interaction with the
nursing professional has not been explored under Donabedian’s Triad. Further, the results
of this study concerning BMET perceptions of how structural complexity and process
adequacy in the hospital EC affect the prevalence of systemic adverse events and
compliance problems will fill a gap in scientific literature on symbiotic professional
relationships in healthcare (D’Amour et al., 2005). Healthcare–long identified as different
from other organizations in their adherence to hierarchy-driven professional interactions,
has a significant symbiotic character that though heretofore recognized, has not been
quantified in literature.
6.2.2 External Policy
The implications of these results suggest several recommendations for external
policy, foremost of which is the perception about Uniform Standards (“Standards are applied
equally across all departments.”) The survey of BMETs revealed that only about 20 per cent
strongly agree with this statement and approximately 33 per cent agree. Because of the
divergent ethical and regulatory policies applied to professional affiliations rather than the
medical community at large, adapting regulatory initiatives with the same focus on patient

158
outcomes (e.g., CMS Conditions of Payment; National Patient Safety Goals; Joint
Commission Infection Control 8.10) can elicit the best initiatives to reduce systemic
adverse events and conflicting policies.
In this assessment of level of quality based on external regulatory compliance,
two of four factors remained in the final model. Regulatory reporting (“All departments
have access to hospital acquired infection data”) and regulatory application (“Biomedical
engineering is able to apply medical equipment regulatory policy”) were retained in the
model. Despite the significance of these items, the survey data shows that about one-third
of the study respondents do not have access to data on hospital-acquired infection (HAI).
Although a marked improvement from the pilot study (Fiedler & Agarwal, 2009) where
86.08% of respondents (more diversified in reported years of experience), had no access
to HAI tracking data, results from this study suggest that internal HAI reporting should
be targeted for required data sharing. Although hospitals will argue that all equipment is
treated with care, knowledge of the actual infection rates in a facility may give it the
necessary motivation to facilitate interdepartmental interaction that promotes reduction of
HAI and other adverse events.
6.2.3 Internal Hospital Administrative Management Policy
Hospital regulatory bodies like The Joint Commission, mandated by the federal
government to monitor medical facilities, have not consistently managed to mobilize
enforcement measures and adherence to their policy directives that continue to carry the
weight of mere suggestions. Healthcare policy makers must consider local, internal
mechanisms that optimize resources with more immediate impact. Hospital administrators

159
can find simple, cost-effective solutions to increase the hospital level of quality through a
cursory review of the structural complexity predictors of the level of quality, observed
through the factors of clinical effectiveness, efficiency and regulatory compliance. Such
solutions include promoting communication and collaboration through inter-professional
skills training that may help to resolve the inconsistency of standards across departments.
Additional options might include BMET inter-professional training of nurses in order to
recognize medical device failure, implementing an interim cleansing and sanitation
procedures for medical equipment, and scheduling a BMET for a certain number of hours
each week in other departments (e.g., Central Sterile, Infection Control, Facility
Maintenance) to determine regulatory conflicts that could be resolved in weekly
interdisciplinary meetings.
Items for action can also be identified by reviewing the factors of process adequacy,
for example, linking the BMET department goals to Organization Objectives, or budgeting
for equipment manuals so that BMETs can have access to critical maintenance and/or repair
information conveniently available in a department repository. When BMETs see tangible
results from interaction with management, the preceding action can become an example of
Coordination Evidence that promotes increased quality. Clinical Engineering managers may
also request that BMETs cross-reference their work order repair database with specific
manuals that match existing inventoried equipment. An absence of documentation for
medical equipment can become a task to determine if a manual exists in proximity to the
medical equipment. If so, BMETs can document the location of the manual and/or refer to
any master list that may already exist in hospital policy. Alternatively, if a manual cannot be
located, this represents an opportunity for BMETs to engage original equipment
manufacturers for needed material, information on the availability of alternative ‘green’

160
cleaning products, and perhaps a ‘refresher’ demonstration on medical equipment operation,
repair, or sanitation. These activities generate knowledge, establish communication, and
promote interdisciplinary action that leads to increased quality. Local applications of the
tools demonstrated here can help to improve long-term patient outcomes by addressing
known problems in the environment of care.
6.3 Limitations
Some potential weaknesses of the research design are in the use of cross sectional
data collected for one time period which may bring into question cause→effect
relationships. However, this limitation may be overcome in future studies enabling
longitudinal analysis. In addition, future multi-group analysis that adds nursing and
quality personnel to gauge their perceptions of interdependence could also remedy this
deficiency. The inherent limitations of perspective studies are applicable.
Other limitations are that the selected study variables may not account for an
unknown, perhaps larger causal relationship or an unknown effect on quality from
uncontrolled respondent or facility factors. Fennigkoh’s (2005) environmental facility
design is partially taken into consideration under the structural complexity construct, but
does not include a detailed incorporation of the physical environment to the extent of his
human factors perspective. The physical environment as a primary factor (air quality,
temperature, distance between co-dependent functional units, noise, lighting, patient
transport problems due to different floor styles, and varying sizes of corridors and
elevators) was not addressed here, though it contributed to a number of sentinel events
reported to the Joint Commission.

161
Another aspect that may be a topical research construct in healthcare but is not
explicitly addressed here is the cumulative culture of psychometric patient safety
associated with an organization, which may have an unspecified contribution to the level
of quality. Flin, Burns, Means, and Robertson (2006) examined the issue in an extensive
quantitative literature review which places assessments of quality safety culture in
context with patient outcomes. The authors conclude that consideration of this additional
specific perspective has been valuable in validating certain experimental studies, but
access to hospital administrative and patient records to substantiate quality is severely
limited.
In addition to detailed constructs that address a wide variety of contextual
features, other problems of information access prompted the use of proxy measures on
the Level of Quality endogenous study variable. Specifically, access to organizational
administrative data is limited because of the fear that a facility’s proprietary processes or
financial status may reflect negatively on it. For example, specific financial indicators are
often excluded, thereby prohibiting detailed cost-efficiency analysis. Also, reporting of
the prevalence of hospital-acquired infections and other sensitive organizational
information often has a significant lag time for public release of the information,
relegating this quality metric to proxy measures, as well.
One final limitation may not be readily apparent but is noteworthy. Since the
emphasis in this study is focused on medical equipment with direct patient contact, the
study does not extensively consider medical equipment used in the laboratory, which may
indirectly affect HAIs (Corner & Shaw, 1989).

162
6.4 Recommendations for Future Study
Future study recommendations include administration of the study survey to
nursing and quality professionals in order to assess their perspectives on the contribution
of clinical engineering, to validate the survey instrument across other populations, and to
gather evidence to perform an analysis of variance in unit perception (Appendix F).
Increased understanding of the BMET profession in the environment of care should
advance information sharing that quantifies the current study variables. Further, the
quantitative approach can lead to strong research designs that apply the notion of
experimental BMET integration into high patient contact departments in hospital
facilities across the United States. The goal of such research will be to establish empirical
evidence to support integration based on the theoretical premise of Organization
Performance Theory suggested by Donabedian, by existing healthcare regulations, and by
the results of this study.
6.5 Summary
In summary, the environment of care still lacks in the integration of key personnel
with the skills to help alleviate iatrogenic conditions. However, constructs relevant to the
hospital environment of care from this study has shown how multiple independent
variables that should be considered for their interactive effects in a post-hierarchical
organizational environment. The examination of the perceptions of biomedical
engineering technicians in clinical engineering, using a highly reliable and valid method
163
of structural equation modeling, has provided reasonable information from which to draw
conclusions about the effects of structural complexity and process adequacy in the BMET
profession or the hospital environment of care on the prevalence of systemic adverse
events and compliance problems. The SEM method, through path analysis and
confirmatory factor analysis, statistically defines relationships with the endogenous
variable, level of quality that can quantify the interdepartmental effects of the structure,
process, and outcomes defined in the original variables.
The study offers two overarching conclusions. First, the findings validate the
proposition that biomedical engineering technician integration can satisfy the Joint
Commission Infection Control IC.8.10 recommendation to place qualified personnel
within the infection control program as well as the Environment of Care EC.4.1 to both
collect information and to make an integrated response to patient safety problems as they
arise. Second, increasing the role of BMETs to manage systemic problems involving
medical equipment, by using statistically indicated processes of increased
communication, collaboration, and teamwork among healthcare workers, can achieve
effectiveness and efficiency through professional equity by addressing a missing
component in previous quality efforts—the interaction among patients, healthcare
personnel, and medical equipment.

164
APPENDIX A: STUDY AUTHORIZATION AND IMPLEMENTATION

165
The researcher has completed Internal Review Board University of Central Florida
Collaborative Institutional Training Initiative (CITI). This study has been evaluated and
approved by the University of Central Florida Institutional Review Board under number
SBE-10-07285 in accordance with the ethical principles of any experimentation involving
live subjects. If you have any questions regarding participant rights in research studies,
you may contact the UCF IRB by telephone at (407) 823-2901.

166
APPENDIX B: INTERNAL REVIEW BOARD LETTER OF APPROVED RESEARCH

167
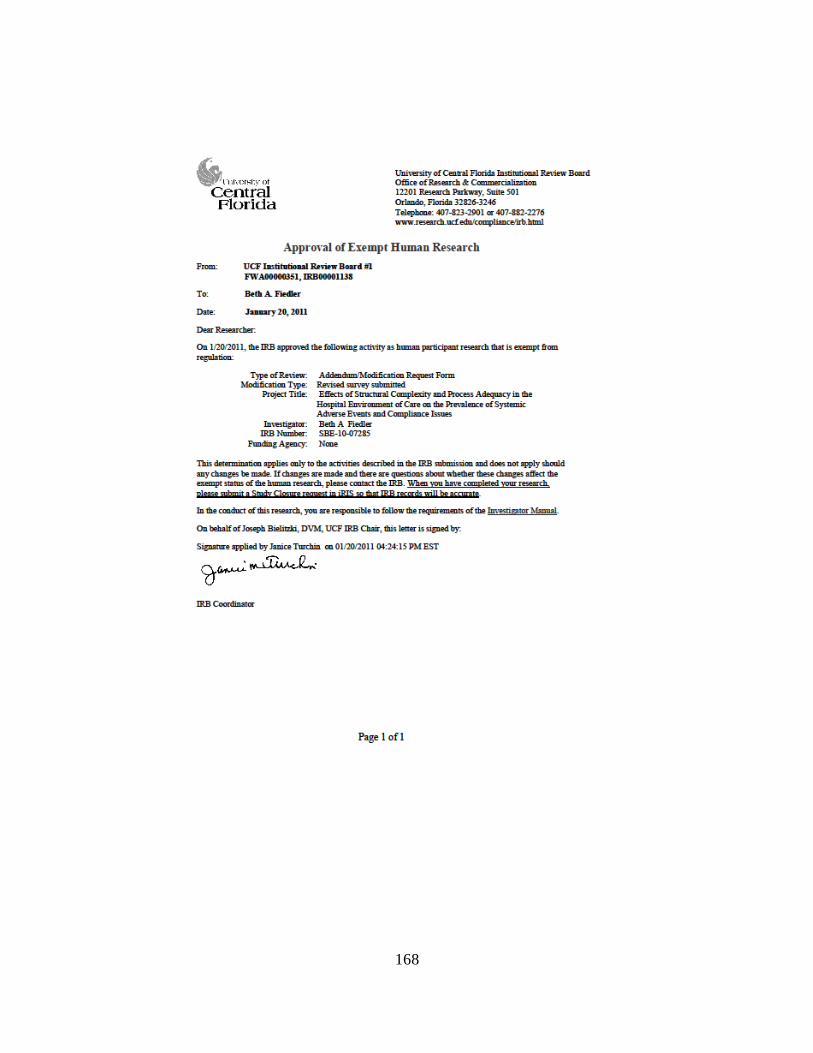
168

169
APPENDIX C: RELIABILITY ANALYSIS
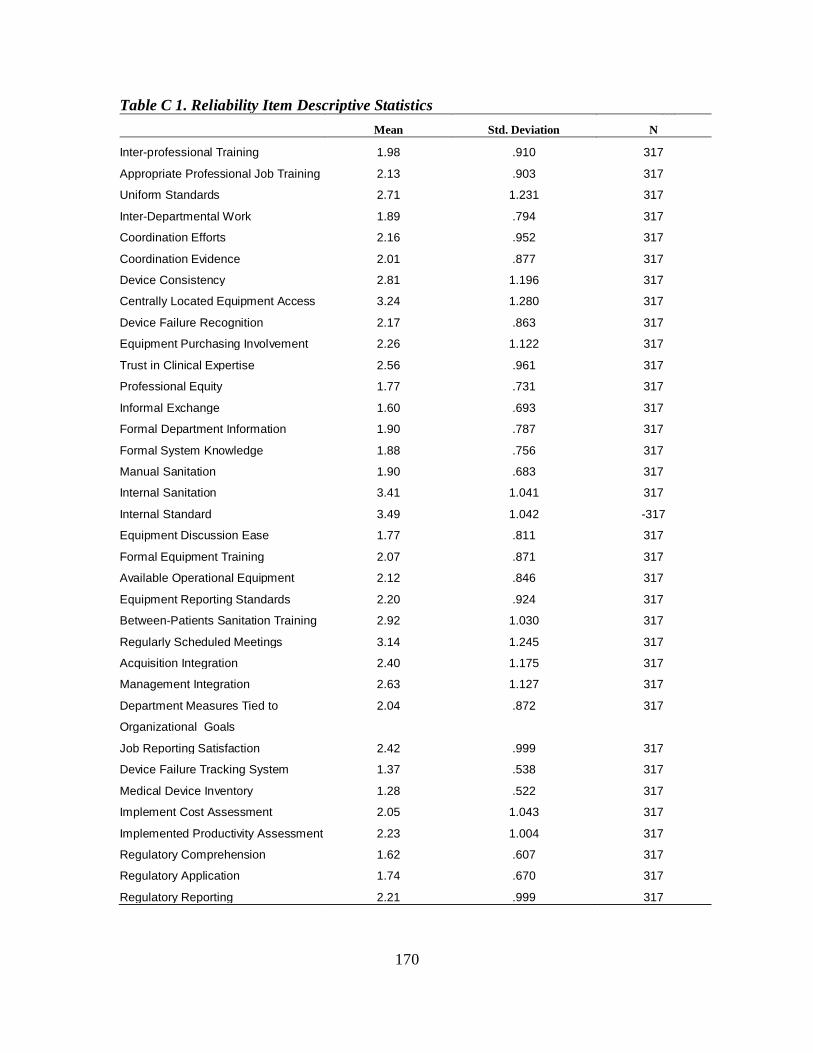
170
Table C 1. Reliability Item Descriptive Statistics
Mean Std. Deviation N
Inter-professional Training 1.98 .910 317
Appropriate Professional Job Training 2.13 .903 317
Uniform Standards 2.71 1.231 317
Inter-Departmental Work 1.89 .794 317
Coordination Efforts 2.16 .952 317
Coordination Evidence 2.01 .877 317
Device Consistency 2.81 1.196 317
Centrally Located Equipment Access 3.24 1.280 317
Device Failure Recognition 2.17 .863 317
Equipment Purchasing Involvement 2.26 1.122 317
Trust in Clinical Expertise 2.56 .961 317
Professional Equity 1.77 .731 317
Informal Exchange 1.60 .693 317
Formal Department Information 1.90 .787 317
Formal System Knowledge 1.88 .756 317
Manual Sanitation 1.90 .683 317
Internal Sanitation 3.41 1.041 317
Internal Standard 3.49 1.042 -317
Equipment Discussion Ease 1.77 .811 317
Formal Equipment Training 2.07 .871 317
Available Operational Equipment 2.12 .846 317
Equipment Reporting Standards 2.20 .924 317
Between-Patients Sanitation Training 2.92 1.030 317
Regularly Scheduled Meetings 3.14 1.245 317
Acquisition Integration 2.40 1.175 317
Management Integration 2.63 1.127 317
Department Measures Tied to
Organizational Goals
2.04 .872 317
Job Reporting Satisfaction 2.42 .999 317
Device Failure Tracking System 1.37 .538 317
Medical Device Inventory 1.28 .522 317
Implement Cost Assessment 2.05 1.043 317
Implemented Productivity Assessment 2.23 1.004 317
Regulatory Comprehension 1.62 .607 317
Regulatory Application 1.74 .670 317
Regulatory Reporting 2.21 .999 317

171
Table C 2 Reliability Item-Total Statistics
Scale Mean if
Item Deleted
Scale
Variance if
Item Deleted
Corrected Item-
Total
Correlation
Squared Multiple
Correlation
Cronbach's Alpha if
Item Deleted
1 Inter-Professional
Training
76.11 280.417 .573 .557 .920
2 Appropriate Professional
Job Training
75.97 280.749 .566 .525 .920
3 Uniform Standards 75.38 274.357 .560 .486 .920
4 Inter-Departmental Work 76.21 281.398 .626 .582 .920
5 Coordination Efforts 75.94 277.699 .634 .623 .919
6 Coordination Evidence 76.09 278.774 .654 .628 .919
7 Device Consistency 75.28 280.038 .431 .292 .922
8 Centrally Located
Equipment Access
74.85 283.700 .310 .214 .924
9 Device Failure Recognition 75.92 280.984 .587 .449 .920
10 Equipment Purchasing
Involvement
75.83 275.819 .580 .609 .920
11 Trust in Clinical
Expertise
75.53 281.997 .489 .441 .921
12 Professional Equity 76.33 286.227 .483 .450 .921
13 Informal Exchange 76.49 287.580 .453 .435 .922
14 Formal Department
Information
76.19 282.960 .571 .555 .920
15 Formal System
Knowledge
76.21 284.066 .552 .528 .921
16 Manual Sanitation 76.20 291.033 .309 .226 .923
17 Internal Sanitation 74.68 287.046 .300 .748 .924
18 Internal Standard 74.61 289.302 .235 .755 .925
19 Equipment Discussion
Ease
76.32 279.637 .679 .546 .919
20 Formal Equipment
Training
76.03 279.604 .630 .515 .920
21 Available Operational
Equipment
75.97 284.952 .456 .356 .922
22 Equipment Reporting
Standards
75.90 283.863 .449 .364 .922
23 Between-Patients
Sanitation Training
75.17 285.929 .336 .269 .923

172
Scale Mean if
Item Deleted
Scale
Variance if
Item Deleted
Corrected Item-
Total
Correlation
Squared Multiple
Correlation
Cronbach's Alpha if
Item Deleted
24 Regularly Scheduled
Meetings
74.96 273.371 .578 .473 .920
25 Acquisition Integration 75.69 272.922 .629 .654 .919
26 Management Integration 75.46 277.528 .530 .454 .921
27 Department Measures
Tied to Organizational
Goals
76.05 279.304 .639 .565 .920
28 Job Reporting
Satisfaction
75.67 275.924 .656 .517 .919
29 Device Failure Tracking
System
76.73 290.382 .438 .533 .922
30 Medical Device Inventory 76.81 292.291 .344 .478 .923
31 Implement Cost
Assessment
76.04 282.552 .429 .499 .922
32 Implemented
Productivity Assessment
75.86 287.297 .305 .410 .924
33 Regulatory
Comprehension
76.47 288.535 .476 .635 .922
34 Regulatory Application 76.36 286.282 .528 .663 .921
35 Regulatory Reporting 75.89 283.573 .420 .272 .922

173
APPENDIX D: ASSUMPTION TESTS
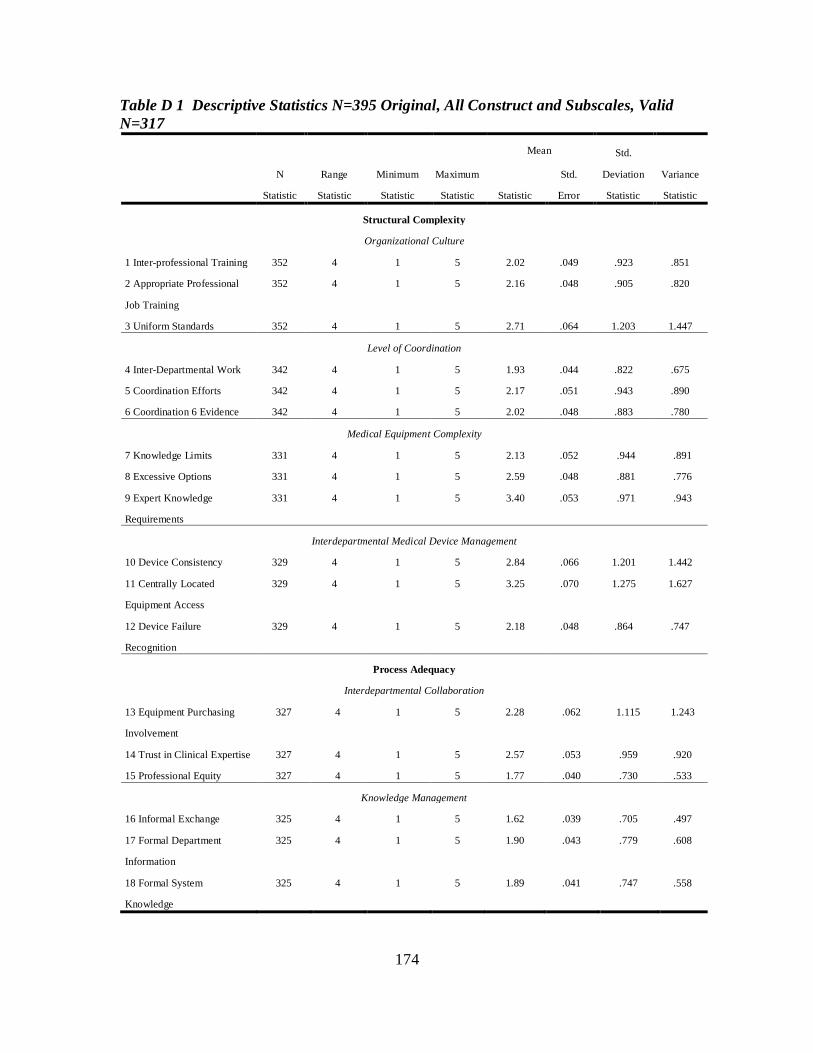
174
Table D 1 Descriptive Statistics N=395 Original, All Construct and Subscales, Valid N=317
N
Statistic
Range
Statistic
Minimum
Statistic
Maximum
Statistic
Mean Std.
Deviation
Statistic
Variance
Statistic Statistic
Std.
Error
Structural Complexity
Organizational Culture
1 Inter-professional Training 352 4 1 5 2.02 .049 .923 .851
2 Appropriate Professional
Job Training
352 4 1 5 2.16 .048 .905 .820
3 Uniform Standards 352 4 1 5 2.71 .064 1.203 1.447
Level of Coordination
4 Inter-Departmental Work 342 4 1 5 1.93 .044 .822 .675
5 Coordination Efforts 342 4 1 5 2.17 .051 .943 .890
6 Coordination 6 Evidence 342 4 1 5 2.02 .048 .883 .780
Medical Equipment Complexity
7 Knowledge Limits 331 4 1 5 2.13 .052 .944 .891
8 Excessive Options 331 4 1 5 2.59 .048 .881 .776
9 Expert Knowledge
Requirements
331 4 1 5 3.40 .053 .971 .943
Interdepartmental Medical Device Management
10 Device Consistency 329 4 1 5 2.84 .066 1.201 1.442
11 Centrally Located
Equipment Access
329 4 1 5 3.25 .070 1.275 1.627
12 Device Failure
Recognition
329 4 1 5 2.18 .048 .864 .747
Process Adequacy
Interdepartmental Collaboration
13 Equipment Purchasing
Involvement
327 4 1 5 2.28 .062 1.115 1.243
14 Trust in Clinical Expertise 327 4 1 5 2.57 .053 .959 .920
15 Professional Equity 327 4 1 5 1.77 .040 .730 .533
Knowledge Management
16 Informal Exchange 325 4 1 5 1.62 .039 .705 .497
17 Formal Department
Information
325 4 1 5 1.90 .043 .779 .608
18 Formal System
Knowledge
325 4 1 5 1.89 .041 .747 .558

175
N Range Minimum Maximum Mean
Std.
Deviation Variance N
Statistic Statistic Statistic Statistic Statistic Std. Error Statistic Statistic
Complexity of Sanitation Methods
19 Manual Sanitation 321 4 1 5 1.90 .039 .694 .481
20 Internal Sanitation 321 4 1 5 3.40 .058 1.039 1.079
21 Internal Standard 321 4 1 5 3.49 .058 1.037 1.076
Interdepartmental Communication
22 Equipment Discussion
Ease
322 4 1 5 1.79 .046 .823 .678
23 Formal Equipment
Training
322 4 1 5 2.08 .049 .884 .781
24 Available Operational
Equipment
322 4 1 5 2.13 .048 .852 .727
Interdepartmental Teamwork
25 Equipment Reporting
Standards
321 4 1 5 2.21 .052 .930 .866
26 Between-Patients
Sanitation Training
321 4 1 5 2.93 .058 1.033 1.067
27 Regularly Scheduled
Meetings
320 4 1 5 3.14 .070 1.247 1.555
Level of Quality
Clinical Engineering Effectiveness
28 Acquisition Integration 319 4 1 5 2.41 .066 1.178 1.387
29 Management Integration 319 4 1 5 2.64 .063 1.126 1.269
30 Department Measures
Tied to Organizational Goals
319 4 1 5 2.04 .049 .873 .762
31 Job Reporting Satisfaction 319 4 1 5 2.43 .056 1.000 1.000
Clinical Engineering Efficiency
32 Device Failure Tracking
System
319 3 1 4 1.37 .030 .538 .290
33 Medical Device Inventory 319 3 1 4 1.28 .029 .522 .272
34 Implement Cost
Assessment
319 4 1 5 2.06 .059 1.048 1.097
35 Implemented Productivity
Assessment
319 4 1 5 2.24 .056 1.008 1.017

176
N Range Minimum Maximum Mean
Std.
Deviation Variance N
Statistic Statistic Statistic Statistic Statistic Std. Error Statistic Statistic
Regulatory Compliance
36 Regulatory
Comprehension
317 3 1 4 1.62 .034 .607 .368
37 Regulatory Application 317 4 1 5 1.74 .038 .670 .449
38 Competing Regulatory
Application
317 4 1 5 2.81 .057 1.018 1.036
39 Regulatory Reporting 317 4 1 5 2.21 .056 .999 .999
Valid N (listwise) 317

177
Table D 2 Additional Initial Descriptive Statistics N=395 Original, All Construct and Subscales, Valid N=317
N Skewness Kurtosis
Statistic Statistic Std. Error Statistic Std. Error
Structural Complexity
Organizational Culture
Inter-professional Training 352 1.098 .130 1.333 .259
Appropriate Professional Job
Training
352 .763 .130 .249 .259
Uniform Standards 352 .212 .130 -1.068 .259
Level of Coordination
Inter-Departmental Work 342 1.055 .132 1.402 .263
Coordination Efforts 342 .779 .132 .253 .263
Coordination Evidence 342 .752 .132 .258 .263
Medical Equipment Complexity
Knowledge Limits 331 .862 .134 .228 .267
Excessive Options 331 .262 .134 -.222 .267
Expert Knowledge
Requirements
331 -.403 .134 -.522 .267
Interdepartmental Medical Device Management
Device Consistency 329 .068 .134 -1.266 .268
Centrally Located Equipment
Access
329 -.192 .134 -1.221 .268
Device Failure Recognition 329 .978 .134 1.092 .268
Process Adequacy
Interdepartmental Collaboration
Equipment Purchasing
Involvement
327 .883 .135 .028 .269
Trust in Clinical Expertise 327 .612 .135 -.170 .269
Professional Equity 327 .908 .135 1.329 .269
Knowledge Management
Informal Exchange 325 1.394 .135 3.407 .270
Formal Department
Information
325 1.000 .135 1.849 .270
Formal System Knowledge 325 .903 .135 1.436 .270
Complexity of Sanitation Methods
Manual Sanitation 321 .866 .136 1.974 .271
Internal Sanitation 321 -.148 .136 -.920 .271
Internal Standard 321 -.318 .136 -.581 .271

178
N Skewness Kurtosis
Statistic Statistic Std. Error Statistic Std. Error
Interdepartmental Communication
Equipment Discussion Ease 322 1.285 .136 2.319 .271
Formal Equipment Training 322 1.061 .136 1.383 .271
Available Operational
Equipment
322 .925 .136 1.061 .271
Interdepartmental Teamwork
Equipment Reporting
Standards
321 .885 .136 .663 .271
Between-Patients Sanitation
Training
321 .195 .136 -.733 .271
Regularly Scheduled
Meetings
320 -.067 .136 -1.204 .272
Level of Quality
Clinical Engineering Effectiveness
Acquisition Integration 319 .611 .137 -.529 .272
Management Integration 319 .359 .137 -.714 .272
Department Measures Tied
to Organizational Goals
319 1.033 .137 1.211 .272
Job Reporting Satisfaction 319 .622 .137 .110 .272
Clinical Engineering Efficiency
Device Failure Tracking
System
319 1.339 .137 2.251 .272
Medical Device Inventory 319 1.949 .137 4.481 .272
Implement Cost Assessment 319 .828 .137 -.156 .272
Implemented Productivity
Assessment
319 .570 .137 -.428 .272
Regulatory Compliance
Regulatory Comprehension 317 .581 .137 .341 .273
Regulatory Application 317 .748 .137 1.356 .273
Competing Regulatory
Application
317 .266 .137 -.546 .273
Regulatory Reporting 317 .536 .137 -.266 .273
Valid N (listwise) 317

179
Table D 3 Spearman Rho Correlation Matrix Structural Complexity, N=317
Inter-
Professional
Training
Appropriate
Professional
Job Training
Uniform
Standards
Inter-
Departmental
Work
Coordination
Evidence
Device
Failure
Recognition
.
1 Appropriate
Professional Job
Training
.554** 1.000
2 Uniform
Standards
.522** .496** 1.000
3 Inter-
Departmental Work
.440** .448** .375** 1.000
4 Coordination
Evidence
.474** .416** .403** .495** 1.000
5 Device Failure
Recognition
.345** .429** .380** .398** .421** 1.000
**. Correlation is significant at the 0.01 level (2-tailed).
Abbreviation Notes: Correlation Coefficient (CC); Significant, 2-tailed, (Sig.).

180
Table D 4. Spearman Rho Correlation Matrix Process Adequacy, N=317
Equipment
Purchasing
Involvement
Formal
Department
Information
Formal
Equipment
Training
Available
Operational
Equipment
Regularly
Scheduled
Meetings
1 Equipment Purchasing
Involvement
1.000
.
2 Formal Department
Information
.364** 1.000
3 Formal Equipment
Training
.361** .461** 1.000
4 Available Operational
Equipment
.153** .336** .369** 1.000
5 Regularly Scheduled
Meetings
.344** .281** .432** .215** 1.000
**. Correlation is significant at the 0.01 level (2-tailed).
Abbreviation Notes: Correlation Coefficient (CC); Significant, 2-tailed, (Sig.).
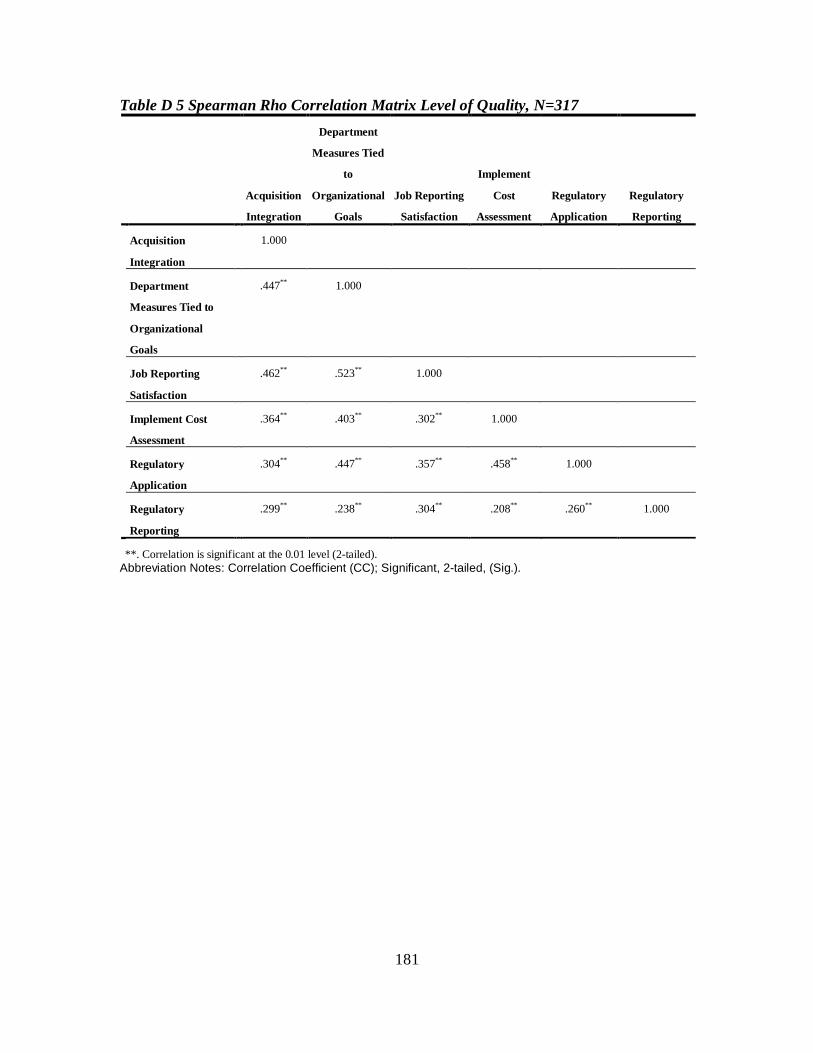
181
Table D 5 Spearman Rho Correlation Matrix Level of Quality, N=317
Acquisition
Integration
Department
Measures Tied
to
Organizational
Goals
Job Reporting
Satisfaction
Implement
Cost
Assessment
Regulatory
Application
Regulatory
Reporting
Acquisition
Integration
1.000
Department
Measures Tied to
Organizational
Goals
.447** 1.000
Job Reporting
Satisfaction
.462** .523** 1.000
Implement Cost
Assessment
.364** .403** .302** 1.000
Regulatory
Application
.304** .447** .357** .458** 1.000
Regulatory
Reporting
.299** .238** .304** .208** .260** 1.000
**. Correlation is significant at the 0.01 level (2-tailed). Abbreviation Notes: Correlation Coefficient (CC); Significant, 2-tailed, (Sig.).

182
Table D 6 Spearman Correlation Coefficient Table of Control Variables 1 2 3 4 5 6 7 8 9 10
1 Profession CC 1.000
2 Years of Experience
CC .016 1.000
3 Education Level
CC .116 .003 1.000
4 State CC .085 .063 .112* 1.000
5 The Joint Commission accredited
CC .022 .118* .015 .135* 1.000
6 Number of Operational Beds
CC .023 .049 .134* .078 .217** 1.000
7 Facility Type CC .016 .034 .069 .053 .049 .222** 1.000
8 Location Type
CC .038 .022 .172** .074 .106 .344** .042 1.000
9 Size CC .024 .054 .133* .083 .130* .620** .163** .292** 1.000
10 Region CC .085 .022 .090 .190** .132* .021 .012 .045 .008 1.000
*. Correlation is significant at the 0.05 level (2-tailed).
**. Correlation is significant at the 0.01 level (2-tailed).
Abbreviation Notes: Correlation Coefficient (CC); Significant, 2-tailed, (Sig.); Bold facing indicates negative correlations.
Notes1-10: 1Biomedical Engineering Technician (future study options include Nurse and Quality personnel. 2 0-2 Years, 3-
4 years, 5+ years. 3 High School/GED; Associate of Arts, Associate of Science; Bachelor of Arts, Bachelor of Science;
Graduate (Master or Doctorate). 4United States and Washington, DC. 5Joint Commission affiliated accreditation. 6Actual
number of beds (not part of stored equipment or pending expansion). 7Public, Private, Non-Profit, University affiliated
facility. 8Rural or Urban general location. 9Bed Size Small 0-25; Medium 26-150; and Large>150. 10Northeast (
Connecticut, Delaware, Maine, Maryland, Massachusetts, New Hampshire, New Jersey, New York, Pennsylvania,
Rhode Island, Vermont, and Washington, DC.); Midwest (Illinois, Indiana, Iowa, Kansas, Michigan, Minnesota, Missouri,
Nebraska, North Dakota, Ohio, South Dakota, and Wisconsin), Southern (Alabama, Arkansas, Kentucky, Louisiana,
Mississippi, Oklahoma, Tennessee, and Texas ), Southeast (Florida, Georgia, North Carolina, South Carolina, Virginia,
and West Virginia), and Western (Alaska, Idaho, Montana, Oregon, Washington, Wyoming, Arizona, California,
Colorado, Hawaii, Nevada, New Mexico, and Utah).

183
APPENDIX E: REGRESSION ANALYSIS

184
Figure E 1. Generic Initial Measurement Model of Structural Complexity

185
Table E 1 Generic Measurement Model of Structural Complexity
Predictors URW Estimate
SRW Generic
Standard Error
Critical Ratio P
Inter-Professional Training ← Structural Complexity 1.000 .695
Appropriate Professional Job Training ← Structural Complexity
.948 .664 .088 10.717 ***
Uniform Standards ← Structural Complexity 1.208 .621 .120 10.061 ***
Structural Complexity Inter-Departmental Work ← Structural Complexity .897 .715 .078 11.464 ***
Coordination Efforts ← Structural Complexity 1.196 .795 .095 12.590 ***
Coordination Evidence ← Structural Complexity 1.073 .774 .087 12.304 ***
Device Consistency ← Structural Complexity .715 .378 .115 6.244 ***
Centrally Located Device Failure ← Structural Complexity .515 .255 .122 4.228 ***
Device Failure Recognition ← Structural Complexity .787 .577 0.08 9.382 ***
***.001 (2-tailed) significance level Abbreviation Notes: URW=Unstandardized Regression Weight; SRW=Standardized Regression Weight.

186
Table E 1A Squared Multiple Correlations of the Generic Measurement Model of Structural Complexity
Predictor R2 Device Failure Recognition .332 Centrally Located Equipment Access .065 Device Consistency .143 Coordination Evidence .599 Coordination Efforts .632 Inter-Departmental Work .511 Uniform Standards .385 Appropriate Professional Job Training .441 Inter-Professional Training .483

187
Figure E 2 Generic Measurement Model of Process Adequacy

188
Table E 2 Generic Measurement Model of Process Adequacy
Predictors URW Estimate
SRW Generic
Standard Error
Critical Ratio P value
Equipment Purchasing Involvement←Process Adequacy 1.000 .586
Expertise Trust←Process Adequacy .679 .465 .100 6.778 ***
Professional Equity←Process Adequacy .493 .443 .076 6.522 ***
Formal Department Information←Process Adequacy .824 .689 .091 9.027 ***
Formal System Knowledge←Process Adequacy .767 .667 .087 8.845 ***
Internal Sanitation←Process Adequacy .462 .292 .102 4.524 ***
Formal Equipment Training←Process Adequacy .872 .659 .099 8.774 ***
Available Operational Equipment←Process Adequacy .657 .511 .090 7.306 ***
Equipment Reporting Standards←Process Adequacy .687 .489 .097 7.056 ***
Between-Patients Sanitation Training←Process Adequacy .582 .372 .104 5.614 ***
Regular Meetings←Process Adequacy 1.043 .551 .135 7.737 ***
***.001 (2-tailed) significance level Abbreviation Notes: URW=Unstandardized Regression Weight; SRW=Standardized Regression Weight.

189
Table E 2A Squared Multiple Correlations of the Generic Measurement Model of Process Adequacy
Predictor R2 Regular Meetings .303 Between-Patients Sanitation Training .138 Equipment Reporting Standards .239 Available Operational Equipment .261 Formal Equipment Training .434 Internal Sanitation .085 Formal System Knowledge .445 Formal Department Information .474 Professional Equity .197 Expertise Trust .216 Equipment Purchasing Involvement .344

190
Figure E 3 Generic Measurement Model of Level of Quality

191
Table E 3 Generic Measurement Model of Level of Quality Predictors
URW
Estimate SRW
Generic Standard
Error Critical Ratio P
Acquisition Integration ← Level of Quality 1.000 .627
Management Integration ← Level of Quality .836 .547 .103 8.081 ***
Department Contribution to Organization Objectives ← Level of Quality
.824 .696 .085 9.735 ***
Job Reporting Satisfaction ← Level of Quality .841 .621 .094 8.940 ***
Implemented Cost Assessment ← Level of Quality .827 .584 .097 8.523 ***
Productivity Assessment ← Level of Quality .581 .426 .089 6.529 ***
Regulatory Comprehension ← Level of Quality .519 .630 .057 9.043 ***
Regulatory Application ← Level of Quality .619 .681 .065 9.583 ***
Regulatory Reporting ← Level of Quality .557 .411 .088 6.319 ***
***.001 (2-tailed) significance level Abbreviation Notes: URW=Unstandardized Regression Weight; SRW=Standardized Regression Weight.
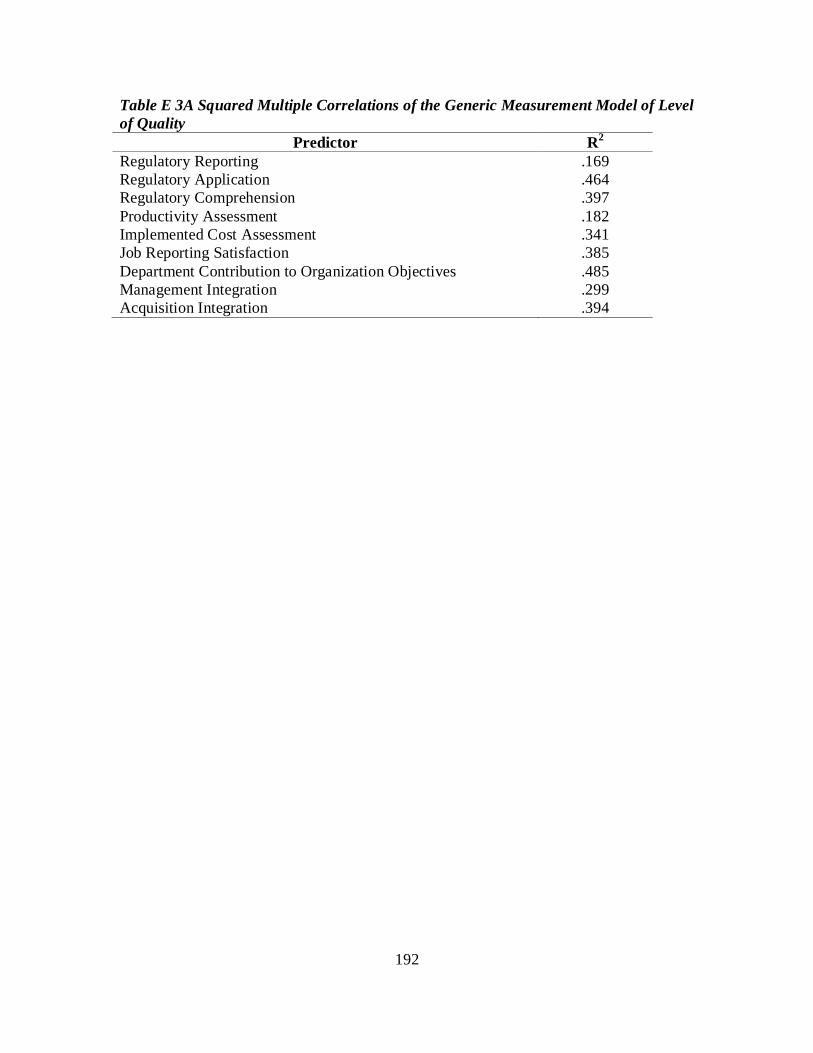
192
Table E 3A Squared Multiple Correlations of the Generic Measurement Model of Level of Quality
Predictor R2 Regulatory Reporting .169 Regulatory Application .464 Regulatory Comprehension .397 Productivity Assessment .182 Implemented Cost Assessment .341 Job Reporting Satisfaction .385 Department Contribution to Organization Objectives .485 Management Integration .299 Acquisition Integration .394

193
Figure E 4 Initial Congeneric Structural Equation Model for the BEI Survey

194
Table E 4 Initial Structural Equation Model of the BEI Survey Without Control Variables
Predictors URW Estimate
SRW Generic
Standard Error
Critical Ratio P
Process Adequacy ← Structural Complexity .940 0.892 .106 8.887 *** Level of Quality ← Process Adequacy .561 0.493 .187 2.993 .003 Level of Quality ← Structural Complexity .579 .473 .196 2.955 .003
Level of Quality Acquisition Integration ← Level of Quality 1.000 .659 Department Contribution to Organization Objectives ← Level of Quality .808 .711 .075 10.789 ***
Job Reporting Satisfaction ← Level of Quality .937 .720 .086 10.904 ***
Implemented Cost Assessment ← Level of Quality .625 .460 .085 7.357 ***
Regulatory Application ← Level of Quality .478 .548 .055 8.626 *** Regulatory Reporting ← Level of Quality .535 .411 .081 6.622 ***
Structural Complexity Inter-Professional Training ← Structural Complexity 1.000 .689
Appropriate Professional Job Training ← Structural Complexity .974 .677 .078 12.463 ***
Uniform Standards ← Structural Complexity 1.221 .622 .122 10.010 *** Interdepartmental Work ← Structural Complexity .872 .689 .079 10.985 ***
Coordination Evidence ← Structural Complexity 1.006 .720 .088 11.421 ***
Device Failure Recognition ← Structural Complexity .775 .406 .116 6.683 ***
Inter-Professional Training ← Structural Complexity .862 .626 .086 10.072 ***
Process Adequacy Equipment Purchasing Involvement ← Process Adequacy Formal Department Information ← Process Adequacy
1.000 .592
.740 .622 .084 8.775 *** Formal Equipment Training ← Process Adequacy .947 .719 .098 9.696 ***
Available Operational Equipment ← Process Adequacy .618 .483 .086 7.216 ***
Regular Meetings ← Process Adequacy .565 .363 .100 5.650 *** Equipment Purchasing Involvement ←Process Adequacy Formal Department Information ← Process Adequacy
1.121 .595 .132 8.503 ***
***<.001 (2-tailed) significance Abbreviation Notes: URW=Unstandardized Regression Weight; SRW=Standardized Regression Weight.

195
Figure E 5 Revised Structural Equation Model for the BEI Survey with Control
Variables
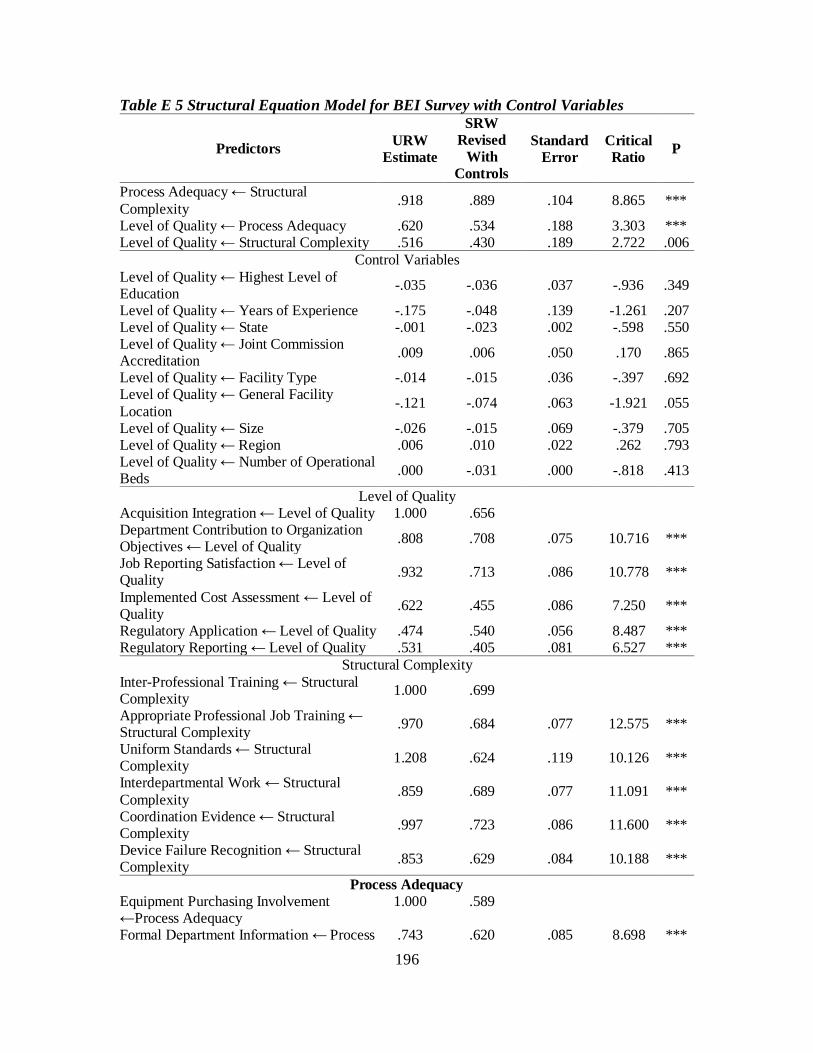
196
Table E 5 Structural Equation Model for BEI Survey with Control Variables
Predictors URW Estimate
SRW Revised
With Controls
Standard Error
Critical Ratio P
Process Adequacy ← Structural Complexity .918 .889 .104 8.865 ***
Level of Quality ← Process Adequacy .620 .534 .188 3.303 *** Level of Quality ← Structural Complexity .516 .430 .189 2.722 .006
Control Variables Level of Quality ← Highest Level of Education -.035 -.036 .037 -.936 .349
Level of Quality ← Years of Experience -.175 -.048 .139 -1.261 .207 Level of Quality ← State -.001 -.023 .002 -.598 .550 Level of Quality ← Joint Commission Accreditation .009 .006 .050 .170 .865
Level of Quality ← Facility Type -.014 -.015 .036 -.397 .692 Level of Quality ← General Facility Location -.121 -.074 .063 -1.921 .055
Level of Quality ← Size -.026 -.015 .069 -.379 .705 Level of Quality ← Region .006 .010 .022 .262 .793 Level of Quality ← Number of Operational Beds .000 -.031 .000 -.818 .413
Level of Quality Acquisition Integration ← Level of Quality 1.000 .656 Department Contribution to Organization Objectives ← Level of Quality .808 .708 .075 10.716 ***
Job Reporting Satisfaction ← Level of Quality .932 .713 .086 10.778 ***
Implemented Cost Assessment ← Level of Quality .622 .455 .086 7.250 ***
Regulatory Application ← Level of Quality .474 .540 .056 8.487 *** Regulatory Reporting ← Level of Quality .531 .405 .081 6.527 ***
Structural Complexity Inter-Professional Training ← Structural Complexity 1.000 .699
Appropriate Professional Job Training ← Structural Complexity .970 .684 .077 12.575 ***
Uniform Standards ← Structural Complexity 1.208 .624 .119 10.126 ***
Interdepartmental Work ← Structural Complexity .859 .689 .077 11.091 ***
Coordination Evidence ← Structural Complexity .997 .723 .086 11.600 ***
Device Failure Recognition ← Structural Complexity .853 .629 .084 10.188 ***
Process Adequacy Equipment Purchasing Involvement ←Process Adequacy Formal Department Information ← Process
1.000 .589
.743 .620 .085 8.698 ***

197
Predictors URW Estimate
SRW Revised
With Controls
Standard Error
Critical Ratio P
Adequacy Formal Equipment Training ← Process Adequacy .954 .721 .099 9.627 ***
Available Operational Equipment ← Process Adequacy .606 .471 .086 7.032 ***
Regular Meetings ← Process Adequacy 1.113 .588 .133 8.363 *** ***<.001 (2-tailed) significance Abbreviation Notes: URW=Unstandardized Regression Weight; SRW=Standardized Regression Weight.

198
APPENDIX E 1: DETAILED REGRESSION ANALYSIS

199
Table E 1.1 Structural Equation Model for BEI Survey Without Controls, Structural Complexity Predictors of Process Adequacy, Lambda Factor Loading Applied to First Factor of Each Latent Construct
Predictors URW Estimate
SRW Revised
SRW Generic
Standard Error t P
Process Adequacy ← Structural Complexity .923 .889 .892 .103 8.929 ***
Structural Complexity (Eta 1) Inter-Professional Training1 1.000 .701 .701 .689
Appropriate Professional Job Training2 .969 .685 .685 .677 12.594 ***
Uniform Standards3 1.208 .627 .627 .622 10.177 *** Inter-Departmental Work4 .854 .687 .687 .689 11.091 *** Coordination Evidence5 .992 .723 .723 .720 11.612 *** Device Failure Recognition6 .847 .627 .627 .626 10.180 ***
Process Adequacy (Eta 2) Equipment Purchasing Involvement7 1.000 .593 .593 .592
Formal Department Information8 .734 .618 .618 .622 8.719 ***
Formal Equipment Training9 .944 .719 .719 .719 9.672 ***
Available Operational Equipment10 .599 .469 .469 .483 7.036 ***
Regular Meetings11 1.108 .590 .590 .595 8.430 *** ***<0.001 (2-tailed) significance level Abbreviation Notes: URW=Unstandardized Regression Weight; SRW=Standardized Regression Weight. Note on Scale1-11: 1) The organization values contributions to other staff members’ professional development, 2) I have been provided clear training to perform my job function, 3) Standards are applied equally across all departments, 4) I received and/or provide inter-departmental input in order to successfully complete work, 5) Inter-departmental coordination has resulted in visible positive benefits, 6) I receive and/or provide training to recognize medical device failure, 7) I receive and/or provide advice on new equipment purchases, 8) I have access to formal knowledge within the department, 9) I receive and/or provide training on the proper way to operate equipment, 10) I received and/or provide clean, operational equipment in a timely fashion, and 11) Nursing and biomedical engineering conduct regularly scheduled meetings on equipment issues.
A detailed review of the findings of the predictor variable of Structural
Complexity in relation to Process Adequacy is demonstrated in Table E 1.1. (Note, the
first factors in each category were allowed to regress at lambda=1 and hence, do not
report probability or estimated t values.) First, the unstandardized regression weights for

200
each exogenous factor X1 to X6 of Structural Complexity in the prediction of Process
Adequacy is statistically significant at t>1.96, p<0.001. The individual factor with the
greatest impact within Structural Complexity is Uniform Standards where one standard
deviation increase will increase Process Adequacy by 1.208. Second, the unstandardized
regression weights for each endogenous factor Y1 to Y5 of Eta 2 is statistically significant
at t>1.96, p<0.001. Structural Complexity accounts for 79% of the variance in the
endogenous variable (R2=79%).

201
Table E 1.2 Structural Equation Model for BEI Survey Without Controls, Process Adequacy (Eta 2) Predictors of Level of Quality (Eta 3), Lambda Factor Loading Applied to First Factor of Each Latent Construct
Predictors URW Estimate
SRW Revised
SRW Generic
Standard Error t P R2
Level of Quality ← Process Adequacy .654 .563 .493 .191 3.426 *** .312
Level of Quality (Eta 3) Acquisition Integration1 1.000 .660 .659
Department Contribution to Organization Objectives2 .802 .709 .711 .075 10.751 ***
Job Reporting Satisfaction3 .935 .722 .720 .086 10.908 *** Implemented Cost Assessment4 .598 .441 .460 .085 7.052 ***
Regulatory Application5 .462 .531 .548 .055 8.371 *** Regulatory Reporting6 .526 .406 .411 .081 6.532 ***
Process Adequacy (Eta 2) Equipment Purchasing
Involvement7 1.000 .593 .592
Formal Department Information8 .734 .618 .622 .084 8.719 ***
Formal Equipment Training9 .944 .719 .719 .098 9.672 *** Available Operationa1
Equipment10 .599 .469 .483 .085 7.036 ***
Regular Meetings11 1.108 .590 .595 .131 8.430 *** ***<0.001 (2-tailed) significance level Abbreviation Notes: URW=Unstandardized Regression Weight; SRW=Standardized Regression Weight. Note on Scale1-11 : 1) Biomedical engineers are integrated in the medical equipment purchasing process, 2) Biomedical engineers set and achieved department goals based on organizational objectives, 3) Biomedical engineers are satisfied with reporting authorities, 4) Biomedical engineering measures cost using generally accepted metrics, 5) Biomedical engineering is able to apply medical equipment regulatory policy, 6) All departments have access to hospital acquired infection data, 7) I receive and/or provide advice on new equipment purchases, 8) I have access to formal knowledge within the department, 9) I receive and/or provide training on the proper way to operate equipment, 10) I received and/or provide clean, operational equipment in a timely fashion, and 11) Nursing and biomedical engineering conduct regularly scheduled meetings on equipment issues.
Table E 1.2 provides the findings of the predictor variable of Process Adequacy in
relation to the Level of Quality. First, the unstandardized regression weights for each
exogenous factor Y1 to Y5 of Process Adequacy in the prediction of Level of Quality is
statistically significant at t>1.96, p<0.001 (2-tailed). The individual factor with the
greatest impact within the exogenous variable is Regular Meetings where one standard

202
deviation increase will increase Level of Quality by 1.108. Second, the unstandardized
regression weights for each endogenous factors of Eta 3 (Y6 to Y11) is statistically
significant at t>1.96, p<0.001 (2-tailed). Process Adequacy accounts for 31.2% of the
variance in the endogenous variable (R2=31.2%).

203
Table E 1.3 Structural Equation Model for BEI Survey Without Controls, Structural Complexity Predictors (Eta 1) of Level of Quality (Eta 3), Lambda Factor Loading Applied to First Factor of Each Latent Construct
Predictors URW Estimate
SRW Revised
SRW Generic
Standard Error t P
Level of Quality ← Structural Complexity .485 .402 .473 .192 2.523 .012
Level of Quality (Eta 3) Acquisition Integration1 1.000 .660 .659
Department Contribution to Organization Objectives2 .802 .709 .711 .075 10.751 ***
Job Reporting Satisfaction3 .935 .722 .720 .086 10.908 *** Implemented Cost Assessment4 .598 .441 .460 .085 7.052 ***
Regulatory Application5 .462 .531 .548 .055 8.371 *** Regulatory Reporting6 .526 .406 .411 .081 6.532 ***
Structural Complexity (Eta 1) Inter-Professional Training7 1.000 .701 .689
Appropriate Professional Job Training8 .969 .685 .677 .077 12.594 ***
Uniform Standards9 1.208 .627 .622 .119 10.177 *** Inter-Departmental Work10 .854 .687 .689 .077 11.091 ***
Coordination Evidence11 .992 .723 .720 .085 11.612 *** Device Failure Recognition12 .847 .627 .626 .083 10.180 ***
***<0.001 (2-tailed) significance level Note: URW=Unstandardized Regression Weight; SRW=Standardized Regression Weight. Note on Scale1-13: 1) Biomedical engineers are integrated in the medical equipment purchasing process, 2) Biomedical engineers set and achieved department goals based on organizational objectives, 3) Biomedical engineers are satisfied with reporting authorities, 4) Biomedical engineering measures cost using generally accepted metrics, 5) Biomedical engineering is able to apply medical equipment regulatory policy, 6) All departments have access to hospital acquired infection data, 7) The organization values contributions to other staff members’ professional development, 8) I have been provided clear training to perform my job function, 9) Standards are applied equally across all departments, 10) I received and/or provide inter-departmental input in order to successfully complete work, 12) Inter-departmental coordination has resulted in visible positive benefits, 13) I receive and/or provide training to recognize medical device failure.
The relationship of the predictor variables of Structural Complexity in relation to
the Level of Quality are found in Table E 1.3. First, the unstandardized regression
weights for each exogenous factors X1 to X6 of Structural Complexity in the prediction of
Level of Quality is statistically significant at t>1.96, p<0.001 (2-tailed). The individual
factor with the greatest impact within the exogenous variable is Regular Meetings where
one standard deviation increase will increase Level of Quality by 1.108. Second, the

204
unstandardized regression weights for each endogenous factors of Eta 3 (Y6 to Y11) is
statistically significant at t>1.96, p<0.001 (2-tailed). Structural Complexity accounts for
16.2% of the variance in the endogenous variable (R2=16.2%).

205
Table E 1.4 Structural Equation Model for BEI Survey Without Controls, Process Adequacy (Eta2), Lambda Factor Loading Applied to First Factor of Each Latent Construct
Predictors URW Estimate
SRW Revised
SRW Generic
Standard Error t P
Equipment Purchasing Involvement1 1.000 .593 .592
Formal Department Information2 .734 .618 .622 .084 8.719 ***
Formal Equipment Training3 .944 .719 .719 .098 9.672 ***
Available Operation Equipment4 .599 .469 .483 .085 7.036 ***
Equipment Regular Meetings5 1.108 .590 .595 .131 8.430 ***
***<0.001 (2-tailed) significance level Abbreviation Notes: URW=Unstandardized Regression Weight; SRW=Standardized Regression Weight. Notes on scale1-5: 1) I receive and/or provide advice on new equipment purchases, 2) I have access to formal knowledge within the department, 3) I receive and/or provide training on the proper way to operate equipment, 4) I received and/or provide clean, operational equipment in a timely fashion, and 5) Nursing and biomedical engineering conduct regularly scheduled meetings on equipment issues. A detailed review of the findings of the intervening variable of Process Adequacy
is demonstrated in Table E 1.4. The unstandardized regression weights for each factor Y1
to Y5 is statistically significant at t>1.96, p<0.001 (2-tailed). The individual factor with
the greatest impact is Formal Equipment Training contributing to 51.6% of the variance
(R2=51.6%).

206
Table E 1.5 Structural Equation Model for BEI Survey Without Controls Structural Complexity (Eta1), Lambda Factor Loading Applied to First Factor of Each Latent Construct
Predictors URW Estimate
SRW Revised
SRW Generic
Standard Error t P
Inter-Professional Training1 1.000 .701 .689
Appropriate Professional Job Training2
.969 .685 .677 .077 12.594 ***
Uniform Standards3 1.208 .627 .622 .119 10.177 *** Inter-Departmental Work4 .854 .687 .689 .077 11.091 ***
Coordination Evidence5 .992 .723 .720 .085 11.612 ***
Device Failure Recognition6 .847 .627 .626 .083 10.180 *** ***<0.001 (2-tailed) significance level Abbreviation Notes: URW=Unstandardized Regression Weight; SRW=Standardized Regression Weight. Note on Scale1-6: 1) The organization values contributions to other staff members’ professional development, 2) I have been provided clear training to perform my job function, 3) Standards are applied equally across all departments, 4) I received and/or provide inter-departmental input in order to successfully complete work, 5) Inter-departmental coordination has resulted in visible positive benefits, and 6) I receive and/or provide training to recognize medical device failure.
A detailed review of the findings of the intervening variable of Structural
Complexity is demonstrated in Table F 1.5. The unstandardized regression weights for
each factor X1 to X6 is statistically significant at t>1.96, p<0.001 (2-tailed). The
individual factor with the greatest impact is Coordination Evidence contributing to 52.2%
of the variance (R2=52.2%).

207
APPENDIX F: BIOMEDICAL ENGINEERING INTERDEPARTMENTAL SURVEY INSTRUMENT

208

209

210

211

212

213

214
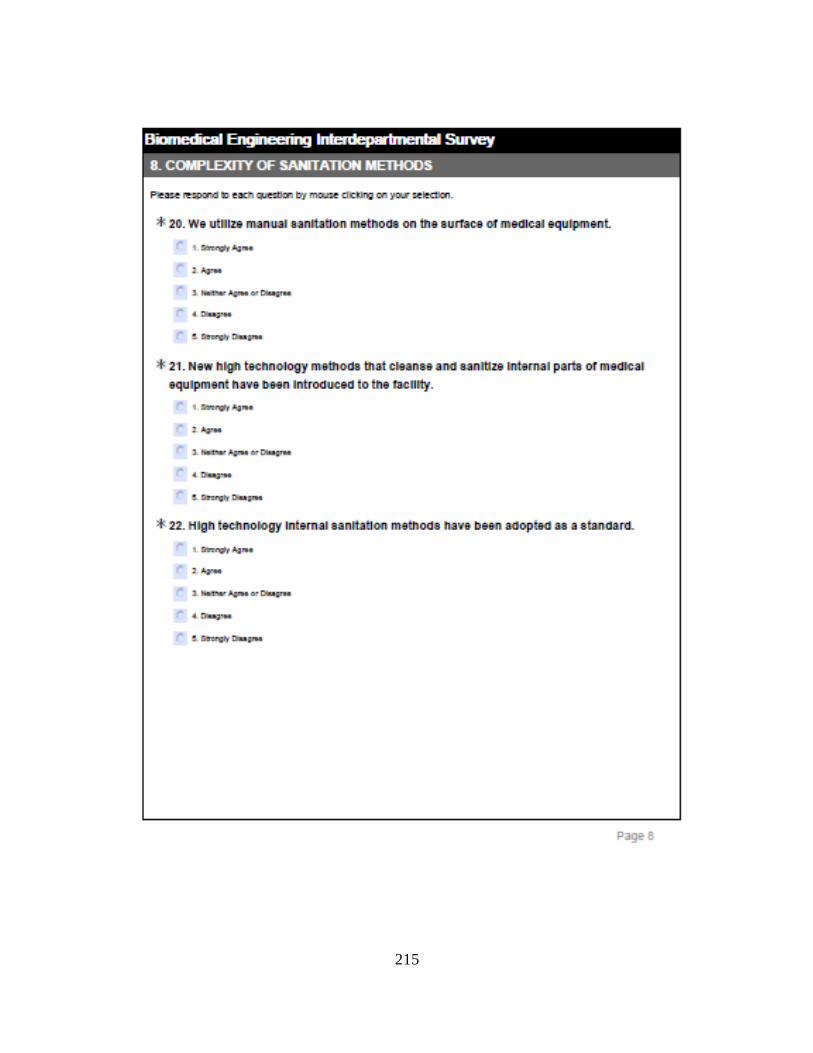
215

216

217

218

219

220

221

222
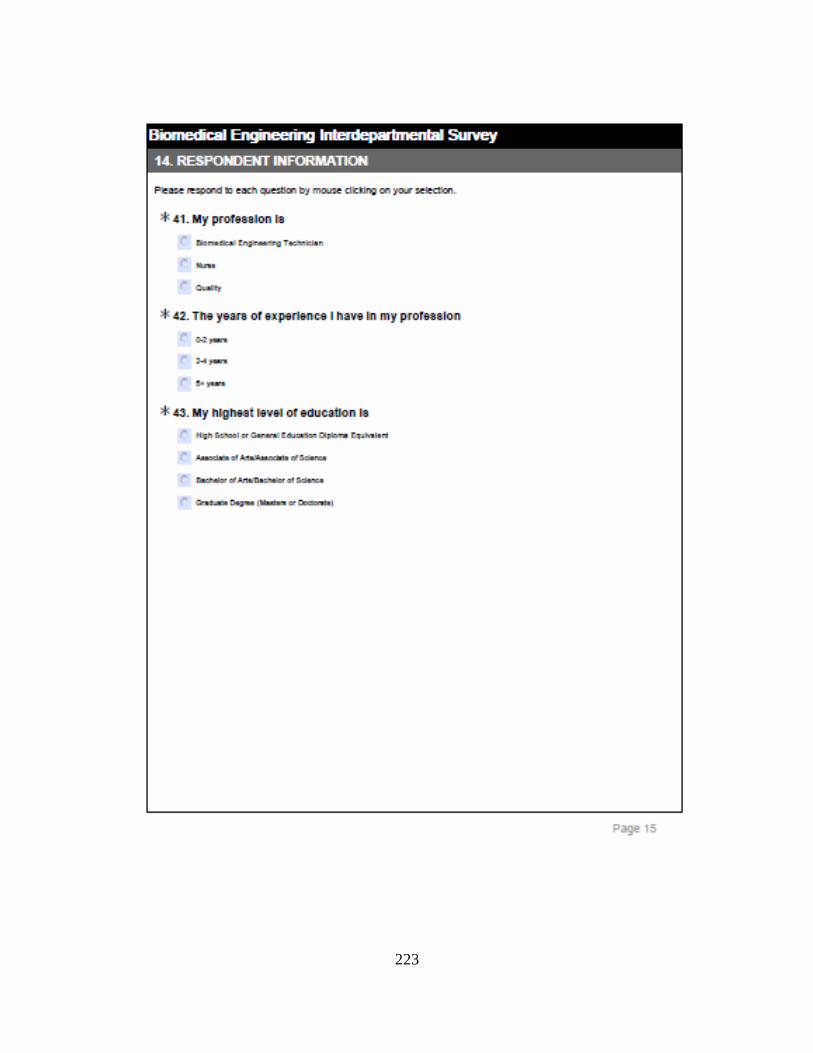
223

224

225

226

227

228
LIST OF REFERENCES Abma, T.A., Baur, V.E., Molewijk, B., & Widdershoven, G.A.M. (2010). Inter-ethics:
Towards an interactive and interdependent bioethics. Bioethics, 24(5): 242-255.
Abma, T. A, Molewijk, B. & Widdershoven, G.A.M. (2009). Good care in ongoing dialogue.
Improving the quality of care through moral and responsive evaluation. Health Care
Anal, 17: 217-235. DOI: 10.1007/s10728-008-0102-z.
Agency for Healthcare Research and Quality. (2008). Patient Safety Indicators Technical
Specifications Version 4.2 (Revised September 2010). Rockville, MD: Agency for
Healthcare Research and Quality. Accessed January 20, 2011
http://www.qualityindicators.ahrq.gov/modules/PSI_TechSpec.aspx.
Agnew, J., Komaromy, N., & Smith, R. (2006). Healthcare Institution Risk Assessments:
Concentration on 'Process' or 'Outcome?' Journal of Risk Research, 9(5), 503-523.
Alaszewski, A. & Harrison, L. (1988). Literature Review: Collaboration and Co-ordination
between welfare agencies. British Journal of Social Work, 18: 635-647.
Alavi, M. & Leidner, D.E. (2001). Review: Knowledge management and knowledge
management systems: Conceptual foundations and research issues. MIS Quarterly,
25(1): 107-136.
Allegranzi, B., Storr, J., Dziekan, G., Leotsakos, A., Donaldson, L., & Pittet, D. (2007). The
first global patient safety challenge "Clean Care is Safer Care": from launch to
current progress and achievement. Journal of Hospital Infection, 65(S2): 115-123.
American Medical Association (AMA). (2004). Council on Ethical and Judicial Affairs.
Code of Medical Ethics: Current Opinions with Annotations, 2004-2005 Edition.

229
Andersen, J.A. (2006). Leadership, personality and effectiveness. Journal of Socio-
Economics, 35(6): 1078-91.
Anderson, J.T. (1992). A risk-related preventative maintenance system. Journal of Clinical
Engineering, 17(1): 65-68.
Anderson, B.M., Rasch, M., Hochlin, K., Jensen, F.-H., Wismar, P., Fredrickson, J.-E.
(2006). Decontamination of rooms, medical equipment and ambulances using an
aerosol of hydrogen peroxide disinfectant. Journal of Hospital Infection, 62: 149-155.
Arah, O.A., Klazinga, N.S., Delnoij, D.M.J., Ten Asbroek, A.H.A., and Custers, T. (2003).
Conceptual frameworks for health systems performance: a quest for effectiveness,
quality, and improvement. International Journal for Quality in Health Care, 15(5):
377-398.
Arbuckle, J.L. (2009). AMOS user’s guide (Version 18.0.0)[Software]. Available from
http://amosdevelopment.com.
Azen, R., & Budescu, D. (2009). Applications of multiple regression in psychological
research. In R.E. Millsap and A. Maydeu-Olivares (Eds.), The SAGE Handbook of
Quantitative Methods in Psychology (pp. 285-310).
Baker, T. (2003). Journal of clinical engineering roundtable: debating the medical device.
Preventive maintenance dilemma and what is the safest and most cost-effective
remedy. Journal of Clinical Engineering, 28: 183-190.
Bakuzonis, C.W., Bogner, M.S., Clarke, J.T., Cooper, J., Fennigkoh, L., Hyman, W.A.,
Kusinitz, A., & Scales, G. (2007). Advancing Patient Safety in 2007: What Can We
Do to Help? Biomedical Instrumentation & Technology, 41(1): 68-70.
Ballard, D.I. & Seibold, D.R. (2006). The experience of time at work: relationship to

230
communication load, job satisfaction, and interdepartmental communication.
Communication Studies, 57(3)317-340.
Baran, L. (2004). Ask the safety expect: JCAHO infection control goals. Managing Infection
Control, 56-67.
Baron, R. M., & Kenny, D. A. (1986). The moderator-mediator variable distinction in social
psychological research: Conceptual, strategic, and statistical considerations. Journal
of Personality and Social Psychology, 51, 1173-1182.
Bauer, D. J., Preacher, K. J., & Gil, K. M. (2006). Conceptualizing and testing random
indirect effects and moderated mediation in multilevel models: New procedures and
recommendations. Psychological Methods, 11: 142-163.
Beckett, C.D. & Kipnis, G. (2009). Collaborative communication: Integrating the SBAR to
improve quality/patient safety outcomes. Journal of Healthcare Quality, 31(5): 19-
28.
Bentler, P.M. (1990). Comparative fit indices in structural models. Psychological Bulletin,
107: 238-246.
Bentler, P.M. & Bonnet, D.G. (1980). Significance tests and goodness of fit in the analysis of
covariance structures. Psychological Bulletin, 88:588-606.
Beyea, S. C. (2009). Health information technology and medical devices. AORN Journal,
89(3): 603-605.
Blegen, M.A., Sehgal, N.L., Alldredge, B.K., Gearhart, S., Auerbach, A.A., & Wachter, R.M.
(2010). Improving safety culture on adult medical units through multidisciplinary
teamwork and communication interventions: The TOPS Project. Quality and Safety
in Health Care, 19: 346-350. doi: 10.1136/qshc.2008.031252.
Bollen, K. A. (1989), Structural Equations with Latent Variables. Wiley, New York.

231
Bowles, R. (2008). Biomedical equipment technicians. Waco, TX: TSTC Publishing.
Brady, A-M., Redmond, R., Curtis, E., Fleming, S., Keenan, P., Malone, A-M., & Sheerin, F.
(2009). Adverse events in health care: A literature review. Journal of Nursing
Management, 17: 155-164.
Briggs, S.R. & Cheek, J.M. (1986). The role of factor analysis in the development and
evaluation of personality scales. Journal of Personality, 54: 106-48.
Browne, M.W. & Cudeck, R. (1993). Alternative ways of assessing model fit. In K.A. Bollen
& J.S. Long [Eds.] Testing structural equation models. Newbury Park, CA: Sage,
136-62.
Brush, L.C. (1993). Creating an effective clinical engineering team. Journal of Clinical
Engineering, 18(2): 139-147.
Brush, L.C. (1994). A survey of CE/BMET attitudes. Journal of Clinical Engineering, 19(2):
117-123.
Burke, J.P. (2003). Infection control—A problem for patient safety in New England. The
Journal of Medicine. 348(7): 651.
Byrne, B. M. (2001). Structural Equation Modeling with AMOS: Basic Concepts,
Applications, and Programming. Mahwah, NJ: Lawrence Erlbaum Associates,
Publishers.
Cao, X. (2003). "Assessment of clinical engineering departments in developing countries,"
Master's thesis, University of Ottawa.
Carmeli, A. & Tishler, A. (2004). The relationship between intangible organizational
elements and organizational performance. Strategic Manual Journal, 25: 1257-1278.
Carr, K.K. & Kazanowski, M.K. (1994). Factors affecting job satisfaction of nurses who
work in long-term care. Journal of Advanced Nursing, 19(5): 878-883.

232
CE-IT Integration from the IT Perspective (2009). Biomedical Instrumentation &
Technology, 43(6): 445.
Centers for Medicare and Medicaid (CMS). CMS issues final quality assessment and
performance improvement conditions of participation for hospitals. Accessed April
23, 2010 from
www.cfmc.org/files/hospital/newsletters/141/FSQ07%20IPLTCH11%20FINAL%20
07%2030%2010.pdf.
Centers for Medicare and Medicaid Services, Department of Health and Human Services,
Fiscal Year 2009 Final Inpatient Prospective Payment System Rule. Federal Register
73 (August 19, 2008).
Cheng, S.H., Ho, Y.C., & Chung, KP. (2002). Hospital quality information for patients in
Taiwan: can they understand it? International Journal for Quality in Health Care,
14(2): 155-160.
Choi, B., Poon, S.K. & Davis, J.G. (2008). Effects of knowledge management strategy on
organizational performance: A complementarily theory-based approach. Omega,
36(2): 235-1251.
Chaudhury, H., Mahmood, A, & Velente, M. (2009). The effect of environmental design on
reducing nursing and medication errors in acute care settings. Environmental and
Behavior, 41(6): 755-786. doi: 10.1177/0013916508330392.
Chuang, S. & Inder, K. (2004). An effectiveness analysis of healthcare systems using a
systems theoretic approach. BioMed Central Health Services Research, 9: 1-11.
Cohen, T., Bakuzonis, C., Friedman, S. & Roa, R.L. (1995). Benchmark indicators for
medical equipment repair and maintenance. Biomedical Instrumentation and
Technology, 29: 308-321.

233
Committee on Quality of Health Care in America, I.o.M.: Crossing the quality chasm: A new
health system for the 21st century. Washington, D.C.: National Academy Press, 2001.
Corner, G.A., & Shaw, A. (1989). Infection control when servicing medical and laboratory
equipment. Journal of Medical Engineering & Technology, 13(3): 177-180.
Corser, W.D. (1998). A conceptual model of collaborative nurse-physician interactions: The
Management of traditional influences and personal tendencies. Research and Theory
for Nursing Practice, 12(4): 325-341.
Connor, M., Ponte, P.R., & Conway, J. (2002). Multidisciplinary approaches to reducing
error and risk in a patient care setting. Critical Care Nursing Clinics of North
America, 14(4): 359-367.
Cram, N., Stephens, J-P., & Lessard, C. (2004). The Role of Clinical Engineers in Reducing
Medical Errors. Journal of Clinical Engineering, 29(1): 33-35.
Christe, B.L. (2009). Introduction to Biomedical Instrumentation: The Technology of Patient
Care. New York, NY: Cambridge University Press.
D'Amour, D., Ferrada-Videla, M., Rodriquez, L.S.M., & Beaulieu, M.D. (2005). The
conceptual basis for interprofessional collaboration: Core concepts and theoretical
frameworks. Journal of Interprofessional Care, 19(S1): 116-131.
Daniel, W.W. (2009). Biostatistics: A Foundation for Analysis in the Health Sciences (9th
ed.). Hoboken, N.J.: John Wiley & Sons, Inc.
Davis, M. (1992). Codes of ethics, professions, and conflict of interest: A case study of an
engineering profession, clinical engineering. Professional Ethics, 1(1 &2): 179-195.
De Long, D.W. & Fahey, L. (2000). Diagnosing cultural barriers to knowledge management.
Academy of Management Executive, 14(4): 113-127.

234
DeVellis, R.F. (2003). Scale development: Theory and applications (2nd edn). Thousand
Oaks, California: Sage.
Dey, P. & Hariharan, S. (2006). Integrated approach to healthcare quality management: A
case study. The TQM Magazine, 18(6): 583-605: 3-11.
Dey, P., Hariharan, S., & Clegg, B.T. (2006). Measuring the operational performance of
intensive care units using the analytic hierarchy process approach. International
Journal of Operations & Production Management, 26(8): 849-865.
Dillman, D.A., Smyth, J.D., & Chrisitan, L.M. (2009). Internet, Mail and Mixed-Mode
Surveys. The Tailored Design Method. 3rd ed. Hoboken, NJ: John Wiley & Sons, Inc.
Docque, L. (1993). A case study of a hospital quality improvement team. Retrieved from
Dissertation Abstracts International (AAT 9417657).
Donabedian, A. (2003). An Introduction to Quality Assurance in Health Care. New York:
Oxford University Press.
Donabedian, A. (1966). Evaluating the quality of medical care. Milbank Memorial Fund
Quarterly, 44(2): 166-206.
Donabedian A. (1980). Explorations in Quality Assessment and Monitoring. The Definition
of Quality and Approaches to Its Assessment. Vol. 1 Ann Arbor, MI: Health
Administration Press.
Donabedian, A. (1989). Institutional and professional responsibilities in quality assurance.
Quality Assurance in Health Care, 1(1): 3-11.
Donabedian, A. (1970). Patient care evaluation. Hospitals, 44(7): 131-136.
Donabedian A. (1988). The quality of care. How can it be assessed? Journal of the American
Medical Association, 260: 1743-1748.

235
Dondelinger, R.M. (2008). Infection control practices for biomeds. Biomedical Engineering
Instrumentation & Technology, 42(2): 122-24.
Dubois, V. (2001). Sterilization techniques for medical equipment at a health care facility.
LeVide, 56(299): 29-33.
Ebben, S.F., Gieras, I.A., & Gosbee, L.L. (2008). Harnessing Hospital Purchase Power to
Design Safe Care Delivery. Biomedical Instrumentation & Technology, 48: 326-331.
Edmond, M.B. (2009). Getting to zero: is it safe? Infection Control and Hospital
Epidemiology, 30:74-76.
Falagas, M.E. & Karageorgopoulos, D.E. (2009). Extended-spectrum beta-lactamase-
producing organisms. Journal of Hospital Infection, 73(4): 345-354.
Fennigkoh, L. (2005). Human Factors and the Control of Medical Error. Biomedical
Instrumentation & Technology, 39(4): 307-312.
Fewster-Thuente L., & Velsor-Friedrich B. (2008). Interdisciplinary collaboration for
healthcare professionals. Nursing Administration Quarterly. 32(1):40-8.
Fiedler, B.A. & Agarwal, A. (2009). Healthcare quality management: Alternative solutions
for improving environment of care. Proceedings of the Decision Sciences Institute,
3241-3246. New Orleans, LA.
Flin, R., Burns, C., Means, K, & Robertson, E.M. (2006). Measuring safety climate in health
care. Quality and Safety in Health Care, 15:109-15.
Flood, A.B., Zinn, J.S. & Scott, W.R. (2006). Organizational performance: Managing for
efficiency and effectiveness. In Stephen M. Shortell & Arnold D. Kaluzny (Eds.),
Health Care Management, Organizational Design and Behavior (pp.415-454).
Clifton Park, NY: Thomson Delmar Learning.
236
Flynn, B.B., Schroeder, R.G., & Sakakibara, S. (1994). A framework for quality management
research and an associated measurement instrument. Journal of Operations
Management, 11: 339-366.
Francis, D. (2008). Iatrogenesis: The nurse's role in preventing patient harm. Evidence-
based geriatric nursing protocols for best practice (3rd ed.) (pp. 223-255). New
York, NY US: Springer Publishing Co.
Frize, M., (1989). “Evaluating the effectiveness of clinical engineering departments in
Canadian hospitals, PhD dissertation, Erasmus University, Rotterdam, Netherlands.
Fukuda, H., Imanaka, Y., Hirose, M., and Hayashida, K. (2009). Factors associated with
system-level activities for patient safety and infection control. Health Policy, 89: 26-
36.
—(2009). Corrigendum to “Factors associated with system-level activities for patient
safety and infection control” [Health Policy 89 (2009) 26-36]. Health Policy, 92: 105.
Gallagher, D., Ting, L. & Palmer, A. (2008), “A journey into the unknown; taking the fear
out of structural equation modeling with AOMS for the first-time user”. The
Marketing Review, 8 (3): 255-275.
Garson, G. D. (2009). Factor Analysis. Assessed February 21, 2011 from
http://www2.chass.ncsu.edu/garson/pa765/statnote.htm.
Garnett, J.L., Marlowe, J., & Pandey, S.K. (2008). Penetrating the performance predicament:
Communication as a mediator or moderator of organizational culture’s impact on
public organizational performance. Public Administration Review, 68(2): 266-281.
Gold, A.H., Malhotra, A. & Segars, A.H. (2001). Knowledge management: An
organizational capabilities perspective. Journal of Management Information Systems,
18(1): 185-214.

237
Gomes, C.E., Yasin, M.M., & Lisboa, J.V. (2004). A literature review of manufacturing
performance measures and measurement in an organizational context: A framework
and direction for future research. Journal of Manufacturing Technology Management,
15(6): 511-530.
Gowen III, C.R., McFadden, K.L., Hoobler, J.M., & Tallon, W.J. (2006). Exploring the
efficacy of healthcare quality practices, employee commitment, and employee
control. Journal of Operations Management, 24:765-778.
Grewal, R., Cote, J.A., & Baumgartner, H. (2004). Multicollinearity and measurement error
in structural equation models: Implications for theory testing. Marketing Science,
23(4): 519-529.
Gurses, A., & Carayon, P. (2007). Performance obstacles of intensive care nurses. Nursing
Research, 56(3), 185-194.
Hage, J., Aiken, M., & Marrett, C.B. (1971). Organization Structure and Communications.
American Sociological Review, 36(5): 860-871.
Hagtvedt, R., Griffin, P., Keskinocak, P., & Roberts, R. (2009). A simulation model to
compare strategies for the reduction of health-care associated infections. Interfaces,
39(3): 256-269.
Hair, J. F. Jr., Anderson, R. E., Tatham, R. L. & Black, W. C. (2003). Multivariate Data
Analysis, (5th ed.), Pearson Education, New Delhi.
Halcomb, E.J, Griffiths, R., & Fernandez, R. (2008). Role of MRSA reservoirs in the acute
care setting. International Journal of Evidence-Based Healthcare, 6(1), 50-77.
Hall, A. (2008). National patient safety goals: communication is key to infection control with
equipment. Biomedical Instrumentation & Technology, 42(2), 140-141.

238
Hayes, A. F. (2009). Beyond Baron and Kenny: Statistical mediation analysis in the new
millennium. Communication Monographs, 76: 408–420.
Henderson, D.K. (2008). Patient-to-patient transmission of bloodborne pathogens in health
care: The price and perils of progress? Infection Control and Hospital Epidemiology,
29(4): 294-296.
Holm, E., Jones, M.J. (2004) Engaging the World: The Use of Empirical Research in
Bioethics and the Regulation of Biotechnology. Amsterdam: IOS Press.
Hota, B. (2004). Contamination, disinfection, and cross-colonization: Are hospital surfaces
reservoirs for nosocomial infection? Clinical infectious diseases, 39(8): 1182-1189
Hsiao, C-J., & Boult, C. (2008). Effects of quality on outcomes in primary care: A review of
literature. American Journal of Medical Quality, 23(4): 302-310.
Hu, L. & Bentler, M., (1998). Fit indices in covariance structure modeling: Sensitivity to
underparameterized model misspecification. Psychological Methods, 3(4): 424-453.
doi: 10.1037/1082-989X.3.4.424.
Hwang, R.W., & Herndon, J.H. (2007). The business case for patient safety. Clinical
Orthopedics and Related Research, 457: 21-34.
Joint Commission on Accreditation of Healthcare Organizations (JCAHO) (2001). EC
Revisions approved, annual equipment PM dropped. Environment of Care News. 4: 1,
3, 9.
Jöreskog, K.G. & Sörbom, D. (1984). LISREL-VI user’s guide (3rd ed.). Mooresville, IN:
Scientific Software.
Kaiser Family Foundation, Agency for Health Care Quality and Research, & Harvard School
of Public Health (2004). National survey on consumer's experiences with patient

239
safety and quality information. Accessed March 5, 2010 from
http://www.kff.org/kaiserpolls/pomr111704pkg.cfm.
Kaplan, D. (1989). Model modification in covariance structure analysis: Application of the
expected parameter change statistic. Multivariate Behavioral Research, 24: 285-305.
Kaufman, H., & Couzens, M. (1973). Administrative Feedback: Monitoring Subordinates’
Behavior. Washington, DC: Brookings Institute.
Kline, R. B. (2005). Principles and practice of structural equation modeling. New York, NY:
The Guilford Press.
Kohn, L.T., Corrigan, J.M., & Donaldson, M.S. (eds.) 2000. To Err is Human: Building a
Safer Health System. Report of the Institute of Medicine’s Committee on Quality of
Health Care in America. Washington, DC: National Academy Press.
Kraus, W.A. (1980). Collaboration in Organizations: Alternatives to Hierarchy. Boston,
Mass: Human Sciences Press.
Kreps, G. L. (1988). The pervasive role of information in health and health care: Implications
for health communication policy. In J. Anderson (Ed.), Communication yearbook 11
(pp. 238–276). Newbury Park, CA: Sage.
Laxmisan, A., Malhotra, S., Keselman, A., Johnson, T.R., & Patel, V.L. (2005). Decisions
about critical events in device-related scenarios as a function of expertise. Journal of
Biomedical Informatics, 38: 200-212.
Larson, E. (1999). The impact of physician-nurse interaction on patient care. Holistic Nursing
Practice, 13(2): 38-46.
Lehmann, S., Pastore, M., Rogez-Kreuz, C., Richard, M., Belondrade, M., Rauwel, G.,
Durand, F., Yousfi, R., Criquelion, Clayette, J.P., & Perret-Liaudet, A. (2009). New
hospital disinfection processes for both conventional and prion infectious agents

240
compatible with thermosensitive medical equipment. Journal of Hospital Infection,
72(4): 342-350.
Lessa, F., Tak, S., DeVader, S.R., Goswami, R., Anderson, M., Williams, I., Gensheimer,
K.F., & Srinivasan, A. (2008). Risk of infections associated with improperly
reprocessed transrectal ultrasound-guided prostate biopsy equipment. Infection
Control and Hospital Epidemiology, 29(4): 289-293.
Lewis, T., Griffith, C., Gallo, M., & Weinbren M. (2008). A modified ATP benchmark for
evaluating the cleaning of some hospital environmental surfaces. Journal of Hospital
Infection, 69(2): 156-163.
Lin, C., Chow, W.S., Madu, C.N., Kuei, C-H., Yu, P.P. (2005), A structural equation model
of supply chain quality management and organizational performance. Int. J.
Production Economics 96 (2005) 355–365.
Lindeke, L.L. & Sieckert, A.M. (2005). Nurse-physician workplace collaboration. Online
Journal Issues of Nursing, 10(1). Accessed March 1, 2010 from
www.nursingworld.org.
Lindsay, P., Schull, M., & Bronskill, S. (2002). The development of indicators to measure the
quality of clinical care in emergency departments following a modified Delphi
approach. Academy of Emergency Medicine, 9(11): 1131-1139.
Lohr, K.N., & Schroeder, S.A. (1990). A strategy for quality assurance in medicine. New
England Journal of Medicine, 322(70): 707-712.
MacKinnon, D. P., Fairchild, A. J., & Fritz, M. S. (2007). Mediation analysis. Annual Review
of Psychology, 58: 593-614.

241
MacCullum, R.C., Browne, M.W., & Sugawara, H.M. (1996). Power analysis and
determination of sample size for covariance structure modeling. Psychological
Methods, I: 130-149.
Mappes, T.A. & DeGrazia, D. (2006). Biomedical Ethics, 6th ed. New York: McGraw-Hill.
Mark, B.A., Salyer, J., & Wan, T.T.H. (2003). Professional nursing practice: Impact on
organizational and patient outcomes. Journal of Nursing Administration, 33(4): 224-
234.
Matsubara, S., Hagihara, A., & Nobutomo, K. (2008). Development of a patient safety
climate scale in Japan. International Journal for Quality in Health Care, 20(3), 211-
220.
Mayberry, R.M., Nicewander, D.A., Qin, H., & Ballard, D.J. (2008). Improving quality and
reducing inequalities: A challenge in achieving best care. World Hospitals and
Health Services, 44(3): 16-31.
Meyers, L. S., Gamst, G., & Guarino, A. J. (2006). Applied multivariate research: Design
and interpretation. Sage Publications, Inc.
McCaughey, B. (2005). Unnecessary deaths: The human and financial costs of hospital
infections, 2nd ed. Accessed February 20, 2010 from
http://www.tufts.edu/med/apua/Patients/ridbooklet.pdf.
McFadden, K.L., Towell, E.R., & Stock, G.N. (2004). Critical success factors for controlling
and managing hospital errors. The Quality Management Journal, 11(1): 61-74.
McFee, R.B. (2009). Nosocomial or hospital-acquired infections: An overview. DM Disease
–A-Month, 55 (7): 422-438.
Miller, M.R., Provonost, P., Donithan, M., Zeger, S., Zhan, C., Morlock, L., & Meyer, G.S.
(2005). Relationship between performance measurement and accreditation:

242
Implications for quality of care and patient safety. American Journal of Medical
Quality, 20(5): 239-252. DOI: 10.1177/1062860605277076.
Minvielle, E., Aaegerter, P., Dervaux, B., Boumendil, A., Retbi, A., Jars-Guincestre, M.C., &
Guidet, B. (2008). Assessing organizational performance in intensive care units: A
French experience. Journal of Critical Care, 23:236-244.
Minvielle, E., Dervaus, B., Retbi, A., Aaegerter, P., Boumendil, A., Jars-Guincestre, M.C. et
al., (2005). Culture, organization, and management in intensive care: Construction
and validation of a multidimensional questionnaire. Journal of Critical Care, 20,
126-138.
Molewijk, B. (2004). Integrated empirical ethics: In search for clarifying identities. Medicine,
Health Care and Philosophy 7: 85–87.
Molewijk, B., Abma, T., Stolper, M., & Widdershoven, G. (2008). Teaching ethics in the
clinic. The theory and practice of moral case deliberation. Journal of Medical Ethics,
34: 120-124.
Molewijk, B., Stiggelbout, A.M., Otten, W., Dupuis, H.M. and Kievit, J. (2004). Empirical
data and moral theory. A plea for integrated empirical ethics. Medicine, Health Care
and Philosophy, 7: 55-69.
Molleman, E., Broekhuis, M., Stoffels, R., & Jaspers, F. (2008). How health care complexity
leads to cooperation and effects the autonomy of health care professionals. Health
Care Analysis, 16: 329–341.
Moniz, M.J., Calvin, J., & Stankiewicz, H. (1995). Innovative communication in a
biomedical engineering department. Journal of Clinical Engineering, 20(3): 212-
217.

243
Morey, J.C., Simon, R., Jay, G.D., Wears, R.L., Salisbury, M., Dukes, K.A., & Berns, S.D.
(2002). Error reduction and performance improvement in the emergency department
through formal teamwork training: Evaluation results in the MedTeams Project.
Health Services Research, 37(6): 1553-1581.
Mullally, S. (2008). Clinical engineering effectiveness in developing world hospitals.
Retrieved from Dissertation Abstracts International (AAT MR40642).
Musschenga, A.W. (2005). Empirical ethics, context-sensitivity and contextualism. Journal
of Medicine and Philosophy, 30: 1-24.
Nanda, S., Pramanik, A., & Daswani, A. (2008). Issues in health communication in India: A
stakeholders perspective. Unpublished manuscript, Mudra Institute of
Communications Research, Ahmedabad-6, India.
National Quality Forum (NQF) (2007). Serious Reportable Events in Health Care 2006
Update: Consensus Report, NQF, Washington, DC.
Naessens JM, Campbell CR, Huddleston JM, Berg BP, Lefante JJ, Williams AR, &
Culbertson RA. (2009). A comparison of hospital adverse events identified by three
widely used detection methods. International Journal for Quality in Health Care,
21(4): 301-307.
Needleman, J., Kurtzman, E., & Kizer, K. (2007). Performance measurement of nursing care:
State of the science and the current consensus. Medical Care Research and Review,
64(2, Suppl), 10S-43S. doi: 10.1177/1077558707299260.
Pallant, J. (2007). SPSS Survival Manual, version 15, (3rd ed.). New York: Open University
Press.
Pardini-Kiely, K., Greenlee, E., Hopkins, J., Szaflarski, N.L. & Tabb, K. (2010). Improving
and sustaining core measure performance through effective accountability of clinical
244
microsystems in an academic medical center. The Joint Commission Journal on
Quality and Patient Safety, 34(9): 387-398.
Patel, P.R., Srinivasan, A., & Perz, J.F. (2008). Developing a broader approach to
management of infection control breaches in health care settings. American Journal
of Infection Control, 36(10): 685-690.
Perez, B. & DiDona, T. (2009). Assessing legislative potential to institute error transparency:
A state comparison of malpractice claims rates. Journal of Healthcare Quality, 32(3):
36-41.
Podgorelec, V., Grasic, B., & Pavlic, L. (2009). Medical diagnostic process optimization
through the semantic integration of data resources. Computer Methods and Programs
in Biomedicine, 95(2-Suppl 1): S55-S67.
Podgorelec, V., & Kokol, P. (2001). Towards more optimal medical diagnosing with
evolutionary algorithms. Journal of Medical Systems, 25(3): 195-219.
Provonost, P., Berenholtz, S., Dorman, T., Lipsett, PA. Simmonds, T., & Haraden, C. (2003)
Improving communication in the ICU using daily goals. Journal of Critical Care,
18(2): 71-75.
Quinn, M.M., & Mannion, J. (2005). Improving patient safety using interactive, evidence-
based decision support tools. The Joint Commission Journal on Quality & Patient
Safety, 31(12): 678-683.
Raju, P.S. & Lonial, S.C. (2001). The impact of quality context and market orientation on
organizational performance in a service environment. Journal of Service Research,
4(2):140-154. DOI: 10.1177/109467050142006.
Rasmussen, J. (1997). Risk management in a dynamic society: a modeling problem. Safety
Science, 27: 183-213.
245
Reason, J. (2000). Human Error: Models and Management. British Medical Journal, 320:
768-770.
Ridgway, M., Atles, L.R., & Subhan, A. (2009). Reducing Equipment Downtime: A New
Line of Attack. Journal of Clinical Engineering, 34(4): 200-204.
Romano, P.S., Mull, H.J., Rivard, P.E., Zhao, S., Henderson, W.G., Loveland, S. et al.
(2008). Validity of selected AHRQ Patient Safety Indicators based on VA national
surgical quality improvement program data. Health Services Research, 44(1): 182-
204.
Ruhstaller, T., Roe, H., Thurlimann, B., & Nicoli, J.J. (2006). The multidisciplinary meeting:
An indispensable aid to communication between different specialties. European
Journal of Cancer, 42:2459-2462. doi: 10.1016.j.ejca.2006.03.034.
Runciman, W.B., Baker, G.R., Michel, P., Dovey, S., Lilford, R.J., Jensen, N. et al. (2010).
Tracing the foundations of a conceptual framework for a patient safety ontology.
Quality and Safety in Health Care, 1.5. [Electronic] doi: 10.1136/qshc.2009.035147.
Rutala, W.A. & Weber, D.J. (2004). Disinfection and sterilization in health care facilities:
What clinicians need to know. Clinical Infectious Diseases, 39(5): 702 -709.
Sack, K. (2008, October 8). “Infection Control Guidelines Issued”. Accessed on March 20,
2009 http://www.nytimes.com/2008/10/09/us/09infection.html.
Sahin, B., Yilmaz, F., & Lee, K-H. (2007). Factors affecting inpatient satisfaction: Structural
Equation Modeling. Journal of Medical Systems, 31:9-16. doi: 10.1007/s10916-006-
9038-8.
Salamon, L.M. (2001). The Tools of Government: A Guide to the New Governance. Oxford:
Oxford University Press.

246
Saris, W.E., Satorra, A., & and Sorbom, D. (1987). The Detection and Correction of
Specification Errors in Structural Equation Models. In C. Clogg (Ed.), Sociological
Methodology 1987 (pp. 105-130). San Francisco: Jossey-Bass.
Schabrun, S., & Chipchase L. (2006). Healthcare equipment as a source of nosocomial
infection: a systematic review. Journal of Hospital Infection, 63(3): 239-245.
Schermelleh-Engel, K., Moosbrugger, H. & Müller, H. (2003). Evaluating the fit of structural
equation models: Tests of significance and descriptive goodness-of-fit measures.
Methods of Psychological Research Online, 8(2): 23-74.
Schmalenberg, C., Kramer, M., King, C., & Krugman, M. (2005).
—Excellence through evidence: Securing collegial/collaborative nurse-physician
relationships, part 1. Journal of Nursing Administration, 35(10): 450-458.
—Excellence through evidence: Securing collegial/collaborative nurse-physician
relationships, part 2. Journal of Nursing Administration, 35(10): 507-514.
Schneider, Z., Whitehead, D., & Elliot, D. (2007). Nursing and Midwifery Research:
Methods and Appraisal for Evidence Based Practice (3rd ed.). Sydney, Australia:
Elsevier.
Schonberger, R.J., 1983. Work improvement programmes: Quality control circles compared
with traditional Western approaches. International Journal of Operations and
Production Management, 3(2): 18-32.
Schumacker, Randall E. & Richard G. Lomax (2004). A beginner's guide to structural
equation modeling, (2nd ed.). Mahwah, NJ: Lawrence Erlbaum Associates.
Schutz-Stubner, S., Hauer, T., & Dettenkofer, M. (2003). Disinfection of medical products in
anaesthesia and intensive care: Sensible integration into a quality management
system. Anathesiologie & Intensivmedizen, 44(6): 442-446.

247
Scott, T., Mannion, R., Davies, H.T.O., & Marshall, M. (2003a). Implementing culture
change in health care: Theory and practice. International Journal for Quality
Management, 15(2): 111-118.
Scott, T., Mannion, R., Davies, H. & Marshall, M. (2003b). The quantitative measurement of
organizational culture in health care: A review of the available instruments. Health
Services Research, 38(3): 923-945.
Shortell SM, Rousseau DM, Gillies RR, Wagner DP, Draper EA, Knaus WA, et al. (1991).
Organizational assessment in intensive care units (ICUs): construct development,
reliability, and validity of the ICU Nurse-Physician Questionnaire. Medical Care,
29:709- 23.
Sobel, M.E. (1982). Asymptotic confidence intervals for indirect effects in structural
equation models. In S. Leinhardt (Ed.), Sociological Methodology, pp. 290-312. San
Francisco: Jossey-Bass.
Sobel, M.E. (1986). Some new results on indirect effects and their standard errors in
covariance structure models. In N. Tuma (Ed.), Sociological Methodology, pp. 159-
186. Washington, DC: American Sociological Association.
Sorensen, R., & Iedema, R. (2008). Redefining accountability in health care: Managing the
plurality of medical interests. Health (London) 12: 87-106.
SPSS, Inc. (2009, July 30). PASW Statistics (Version 18.0.0) [Computer Software]. Chicago,
IL: SPSS, Inc.
Steer, R.M. (1975). Problems in the measurement of organizational effectiveness.
Administrative Science Quarterly, 20(4): 546-58.

248
Stevenson, K.B. & Loeb, M. (2004). Performance improvement in the long-term—care
setting: Building on the Foundation of Infection Control. Infection Control and
Epidemiology, 25(1): 72-79.
Stock, G.N., McFadden, K.L., & Gowen III, C.R. (2007). Organizational culture, critical
success factors, and the reduction of hospital errors. International Journal of
Production Economics, 106: 368-392.
Subhan, A. (2005). Regulatory compliance and quality assurance. Journal of Clinical
Engineering, 30(4): 187-190.
Tenner, A.R., & DeToro, I.J. (2000). Process Redesign: The Implementation Guide for
Managers. Upper Saddle River, New Jersey: Prentice-Hall PTR.
The Joint Commission. (2010). Accreditation Program: Hospital National Patient Safety
Goals Effective July 1, 2010. Accessed January 1, 2011 from
http://www.jointcommission.org/standards_information/npsgs.aspx.
United States Association of Military Trained BMETs (n.d.). A brief history of the Military
BMET career field and training program. Accessed April 29, 2010 from
http:/www.bmets-usa.org/history.html.
U.S. Department of Health and Human Services Centers for Disease Control and Prevention
(CDC), (2003). Guidelines for environmental infection control in health-care
facilities. Accessed November 20, 2008 from
http://www.cdc.gov/ncidod/dhqp/gl_environinfection.html.
U.S. Department of Health and Human Services, Office of the Inspector General (2010,
November). Adverse events in hospitals: National incidence among Medicare
beneficiaries. OEI-06-09-00090.

249
United States Department of Labor Occupational Safety and Health (OSHA) Act of 1970
(2007, February 14). OSHSA Federal Register Final Rules 72: 7135-7221. Accessed
May 1, 2010 from http://www.osha.gov/SLTC/electrical/standards.html.
United States Veteran’s Health Administration (VHA). (2010). Accessed April 14, 2010 from
http://www1.va.gov/health/MedicalCenters.asp.
Verkerk, M.A., Lindemann, H., Maekelberghe, E., Feenstra, E.E., Hartoungh, R., & de Bree,
M. (2004). Enhancing reflection: An interpersonal exercise in ethics education.
Hastings Center Report, 34(6): 31-38.
Wakefield, M. (2008). Patient safety and medical errors: Implications for rural health care.
Journal of Legal Medicine, 23(1): 43-56.
Wan, T. T. H. (2002). Evidence-Based Health Care Management: Multivariate Modeling
Approaches. Boston, MA: Kluwer Academic Publishers.
Wang, B., Eliason, R.W., Richards, S.M., Herztler, L.W., & Koenigshof, S. (2008). Clinical
engineering benchmarking: An analysis of American acute care hospital. Journal of
Clinical Engineering, 33(1): 24-37.
Wang, B., Eliason, R.W., & Vanderzee, S.C. (2006). Global failure rate: A promising
medical equipment management outcome benchmark. Journal of Clinical
Engineering, 31(3): 145-51.
Wang, B.B., Ozcan, Y.A, Wan, T.T.H., & Harrison, J. (1999). Trends in hospital efficiency
among metropolitan markets. Journal of Medical Systems, 23(2): 83-97.
Warye, K.L. (2008). The changing paradigm of infection prevention and control.
Biomedical Engineering Instrumentation & Technology, 42(1): 53-54.

250
Waterson, P.E. (2009). Systems Analysis for Infection Control in Acute Hospitals. In P.D.
Bust (Ed.) Contemporary Ergonomics 2009 (pp. 165-173). London: Taylor &
Francis.
Weiner, B.J., Alexander, J.A., Shortell, S.M., Baker, L.C., Becker, M., & Geppert, J.J.
(2006). Quality improvement implementation and hospital performance on quality
indicators. Health Services Research, 41(2): 307-334.
Wells, N.D., Johnson, R., & Salyer, S. (1998). Interdisciplinary collaboration. Clinical Nurse
Specialist, 12(4): 161-168.
West, A.N., Weeks, W.B., & Bagian, J.P. (2007). Rare adverse medical events in VA
inpatient care: Reliability limits to using patient safety indicators as performance
measures. Health Services Research, 43(1): 249-266.
Widdershoven, G., Abma, T., & Molewijk, B. (2009). Empirical ethics as dialogical
practice. Bioethics, 23(4): 236-248.
Widdershoven, G., Molewijk, B., & Abma, T. (2009). Improving care and ethics: A plea for
interactive empirical ethics. The American Journal of Bioethics, 9(6-7): 99-101.
DOI: 10.1080/15265160902893932.
Williams, J.S. (2009). Biomeds' increased involvement improves processes, patient safety.
Biomedical Instrumentation & Technology, 43(2): 121-123.
Williams, J.S. (2006). New procedures bring nurses clean, functioning equipment just in
time. Biomedical Instrumentation & Technology, 40(4): 303-304.
Williams, J.S. (2007). Roving BMETs: Improving patient safety and satisfaction.
Biomedical Instrumentation & Technology, 41(2): 135-137.
Xu, Y., Wald, A., & Cappiello, J. (1997). Effective communication and supervision in the
biomedical engineering department. Journal of Clinical Engineering, 22(5): 328-334.

251
Xyrichis A., & Lowton K. (2008). What fosters or prevents interprofessional teamworking in
primary and community care? A literature review. International Journal of Nursing
Studies, 45(1): 140-153.
Yadin, D. & Rohe, D. (1986). Clinical engineering program productivity and measurements.
Journal of Clinical Engineering, 11(6): 435-443.
Yeager, S. (2005). Interdisciplinary collaboration: The heart and soul of health care. Critical
Care Nursing Clinics of North America, 17(2) 143-8.