Embed Size (px)
Citation preview
Effects of haemolysis, icterus and lipaemia on coagulation tests as
performed on Stago STA-Compact-Max analyserA. WOOLLEY*, J.-L. GOLMARD†, S. KITCHEN*
*Sheffield Haemophilia and
Thrombosis Centre, Sheffield
Teaching Hospitals NHS Trust,
Sheffield, UK†Department de Biostatistiques,
ER4/EA3974, Universit�e Paris 6
et APHP, UF de biostatistique,
GH Piti�e-Salpetri�ere, Paris,France
correspondence:
Dr Steve Kitchen, Department
of Coagulation, Royal Hal-
lamshire Hospital, Glossop Road,
Sheffield S10 2JF, UK.
Tel.: + 44 114 2712955;
E-mail:
doi:10.1111/ijlh.12498
Received 6 January 2016;
accepted for publication 18
March 2016
Keywords
Coagulation, HIL, mechanical
endpoint, APTT, PT
SUMMARY
Introduction: Haemolysis, icterus and lipaemia (HIL) may affect
haemostasis test results. This may be influenced by the level of
interfering substance and the reagents and end-point detection sys-
tem used.
Methods: We assessed the influence of HIL on prothrombin time,
activated partial thromboplastin time and fibrinogen assay using a
viscosity-based detection analyser.
Results: Spontaneous haemolysis that occurred during sample col-
lection and processing had no effect on PT with either a rabbit tis-
sue factor extract or recombinant human tissue factor reagents. In
contrast, addition of mechanically haemolysed cells impacted on PT
for the highest haemoglobin concentration.
For APTTs determined with STA�-Cephascreen� reagent, there
was no significant difference between results in haemolysed and
nonhaemolysed samples. For the other two reagents studied, APTTs
were statistically significantly shorter in haemolysed samples com-
pared with nonhaemolysed samples. This bias was clinically signifi-
cant only for STA�-PTT Automate. For all three APTT reagents, the
impact of haemolysis was sufficient to impact patient management
decisions, and in some samples, the effects of lipaemia and icterus
were not clinically significant.
Conclusion: Overall, our results confirm that PT and fibrinogen were
not clinically significantly affected by HIL. The APTTs of some
haemolysed samples were falsely normal. Haemolysed samples for
APTT determination should be rejected.
INTRODUCTION
Laboratory diagnosis is more and more prominent in
modern medicine: it is commonly accepted that
approximately 70% of all medical decisions are based
on the laboratory results. Accurate results are
therefore key for appropriate diagnosis. Limiting errors
is hence one of the major objectives of clinical labora-
tories. Sources of errors can occur in the different
steps of a test, that is pre-analytics, analytics and post-
analytics. The importance of pre-analytics has been
emphasized in past years with between one-third and
© 2016 John Wiley & Sons Ltd, Int. Jnl. Lab. Hem. 1
ORIGINAL ARTICLE INTERNATIONAL JOURNAL OF LABORATORY HEMATOLOGY
International Journal of Laboratory HematologyThe Official journal of the International Society for Laboratory Hematology
three quarters of laboratory errors being attributable
to this phase [1]. Haemolysis, icterus and lipaemia
(HIL) in patients’ specimen may interfere in the mea-
surement of many analytes, including coagulation
parameters. In vitro haemolysis which occurs during
sample collection transport or processing is a particu-
lar problem as it is the most common source of inter-
ference in plasma samples [2].
This possible interference can be influenced by sev-
eral factors such as (i) the level of interfering sub-
stance in plasma, (ii) the assay principle and (iii) the
end-point detection system, that is optical versus vis-
cosity-based detection system (mechanical detection).
One of the requirements for a clinical laboratory is
that common interferences related to sample integrity
such as haemolysis, icterus and lipaemia be evaluated
with each reagent system. Because of limited
resources and budgetary constraints, the clinical labo-
ratory relies on the manufacturer to document HIL
estimates. The clinical relevance of the observed bias
should be reviewed [3].
In this study, the authors describe a study con-
ducted to assess the influence of haemolysis, icterus
and lipaemia on the results of three routine coagu-
lation assays, namely prothrombin time (PT), acti-
vated partial thromboplastin time (APTT) and
fibrinogen assay performed with different reagents
on a viscosity-based detection analyser. The effects
of spontaneous in vitro haemolysis on clotting tests
has been studied by analysis of rejected patient sam-
ples where haemolysis is judged to have occurred in
the samples but is not present in vivo (4) or more
commonly following addition of cell lysate to plasma
in vitro [5].
As the cause of haemolysis in rejected patient sam-
ples may be multifactorial and it is possible that addi-
tion of lysate to plasma may not replicate all the
effects of haemolysis in rejected patient samples, both
methods were studied here.
MATERIALS AND METHODS
Sample collection
Blood samples were collected in 0.109M/3.2% triso-
dium citrate anticoagulant (BD VacutainerTM Plus,
Becton Dickinson, Franklin Lakes, NJ, USA) in the
proportion 1 volume of citrate to 9 volumes of blood
and processed in accordance with the CLSI Guideline
H03-A6 ‘Procedures for the collection of diagnostic
blood specimens by venipuncture’ and with the CLSI
guideline H21-A5 ‘Collection, transport, and process-
ing of blood specimens for testing plasma-based coag-
ulation assays and molecular haemostasis assays’[6]
by centrifugation at room temperature for 15 min at
2000 g.
All experiments were carried out on residual mate-
rial remaining after the completion of any diagnostic
tests in accordance with local ethical committee
requirements at the site where samples were col-
lected.
Haemolysis interference
Interference of haemolysis was studied in two differ-
ent ways: spontaneous in vitro haemolysis judged to
have occurred during sample collection transport or
processing and spurious haemolysis.
Spontaneous haemolysis
This part of the haemolysis study is based on the com-
parison of assay results in rejected patient samples,
received haemolysed samples by the investigating lab-
oratory and a replacement nonhaemolysed sample
obtained from the same patient within 4 h of the first
(i.e. haemolysed) sample. The absence of haemolysis
in the replacement samples was taken as an indication
that the haemolysis had occurred in vitro.
The level of haemolysis was semiquantitatively esti-
mated based on the measurement of haemoglobin
concentration using a XN-10TM (Sysmex, Kobe, Japan).
The levels of plasma haemoglobin were at levels sub-
stantially below those present in whole blood samples,
and due to the lack of precision of haematology coun-
ters for such low haemoglobin concentrations, num-
bers were converted into semiquantitative units
defined as follows:
• < 0.3 g/L: no significant haemolysis
• 0.3 – 1.0 g/L: (+)
• 1.1 – 3 g/L: (++)
• > 3.0 g/L: (+++)
This semiquantitative scale is in agreement with
equivalent semiquantitative scales proposed by others
[2, 3].
© 2016 John Wiley & Sons Ltd, Int. Jnl. Lab. Hem.
2 A. WOOLLEY, J.-L. GOLMARD AND S. KITCHEN | EFFECTS OF INTERFERING SUBSTANCES ON COAGULATION TESTS
Spurious/Mechanical haemolysis
Nonhaemolysed plasma samples referred to the labo-
ratory covering a wide range of PT (12 to 50 s), APTT
(30 to 80 s) and fibrinogen concentrations (1 to 8
g/L) were selected to prepare plasma pools of a mini-
mal volume of 8 mL. All samples had to be pooled
within 4 h of sample collection.
Each pool was divided into four 2 mL-aliquots:
equal volumes of packed red cells were added to each
aliquot after which one sample (H0) was kept non-
haemolysed (reference), whereas incremental haemol-
ysis was artificially created in the three other aliquots
(H1, H3 and H5) by aspiration of anticoagulated blood
(1 time, 3 times and 5 times, respectively) through a
fine needle connected with an insulin syringe. Ali-
quots were then centrifuged before immediate testing
for plasma haemoglobin, PT, APTT and fibrinogen.
Icterus interference
Leftover plasma samples without icterus covering a
wide range of PT (12 to 50 s), APTT (30 to 50 s) and
fibrinogen (1 to 8 g/L) were selected to constitute
plasma pools of a minimal volume of 8 mL. All sam-
ples had to be pooled within 4 h of sample collection.
From each pool, four aliquots of 2 mL were pre-
pared, B0, B5, B20 and B40 spiked with exogenous
bilirubin (Sigma-Aldrich, Saint Louis, MO, USA) to
achieve a final bilirubin concentration of 0, 5, 20 and
40 mg/dL, respectively, and then tested for PT, APTT
and fibrinogen. Spiking was performed in such a man-
ner that spiking-induced pool dilution was identical
for the four bilirubin concentrations.
Lipaemia interference
Leftover plasma samples without lipaemia covering a
wide range of PT (12 to 50 s), APTT (30 to 50 s) and
fibrinogen (1 to 8 g/L) were selected to constitute
plasma pools of a minimal volume of 8 mL. All sam-
ples had to be pooled within 4 h of sample collection.
From each pool, four aliquots of 2 mL were pre-
pared, L0, L200, L500 and L1000 spiked with an
exogenous triglyceride standard solution (Lipofundin
S 20%, B. Braun SpA, Milan, Italy) to achieve a final
concentration of 0, 200, 500 and 1000 md/dL,
respectively, and then tested for PT, APTT and fibrino-
gen. Spiking was performed in such a manner that
spiking-induced pool dilution was identical for the
four triglyceride concentrations.
Coagulation assays
All the assays were performed using an STA-Compact-
Max� analyser (Stago, Asni�eres sur Seine, France).
All reagents were from Stago (Asni�eres sur Seine,
France).
All assays were performed according to the manu-
facturer’s instructions.
All tests were run in duplicate, except for the
paired haemolysed samples that were run in singlicate
as volume of some samples was insufficient to per-
form tests in duplicates.
PT
Two different PT reagents were used in parallel:
• STA�-Neoplastine CI Plus 10, rabbit brain thrombo-
plastin,
• STA�-Neoplastine R, human recombinant thrombo-
plastin.
APTT
Three different APTT reagents were used in parallel:
• STA�-PTT Automate� 5, cephalin prepared from
rabbit cerebral tissue + silica activator
• STA�-Cephascreen� 10, cephalin prepared from rab-
bit cerebral tissue + polyphenolic activator,
• STA�-C.K. Prest� 5, cephalin prepared from rabbit
cerebral tissue + kaolin activator
Fibrinogen
One reagent, STA�-Liquid Fib, titrated human calcium
thrombin, was used for the measurement of fibrinogen.
Statistics
The main objective of the study was to check for pos-
sible clinically significant interferences. The main sta-
tistical analyses were therefore based on equivalence
© 2016 John Wiley & Sons Ltd, Int. Jnl. Lab. Hem.
A. WOOLLEY, J.-L. GOLMARD AND S. KITCHEN | EFFECTS OF INTERFERING SUBSTANCES ON COAGULATION TESTS 3

tests. Difference tests were also performed, as sec-
ondary analyses.
Equivalence test was performed to evaluate the
clinical relevance of potential statistical difference.
This relies on clinical acceptance criteria determined
according to the CLSI C56-A guideline [3]. Accord-
ingly, a clinically significant interference is evidenced
when the test result in the presence of the interfering
substance differs more than 1.96 9 (CVa2 + CVw2)1/
4 from the result without the interfering substance
(CVa is the analytical coefficient of variation, and
CVw is the within-subject biological variation) [7].
Briefly, CVa was given by the manufacturer; it corre-
sponds to the intraassay variability of each reagent.
CVw has been determined as the mean of observed
biological variation published in three different papers
[8–10].
In these conditions, the maximum acceptable bias
(MAB) was determined as follows:
• PT: 8.6%,
• APTT: 9.2%,
• Fibrinogen: 16.7%.
Equivalence analyses were based on the confidence
interval method; that is, the equivalence was signifi-
cant if the 95% confidence interval of the CV was
included in the equivalence interval, computed as
[� MAB; + MAB]. CV and their 95% confidence
intervals were computed from means and standard
errors estimated by ANOVAs followed by Dunnett’s
tests for all the analyses except the one of sponta-
neous in vitro haemolysis. Spontaneous haemolysis
was coded as a binary variable (i.e. presence/absence)
and it was analysed by paired Student’s t-tests.
RESULTS
Haemolysis interference
Haemolysed paired samples
Forty pairs of samples (spontaneous in vitro haemoly-
sis versus nonhaemolysed) were available and tested
with all the reagents for PT, APTT and fibrinogen.
Haemolysis distribution across samples was as fol-
lows:
• (+): 15 samples,
• (++): 19 samples,
• (+++): 6 samples.
Table 1 and Figures 1–6 depict the results obtained
for the different assays.
No significant difference was observed between the
results obtained in haemolysed versus nonhaemolysed
sample groups with both PT reagents, namely STA�-
Neoplastine CI Plus and STA�-Neoplastine R, and for
fibrinogen measured using the STA�-Liquid Fib
reagent.
Table 1. Summary of results obtained for nonhaemolysed versus haemolysed paired samples. Rejected patient
samples in which haemolysis had occurred spontaneously in vitro during blood sample collection and processing
were analysed and results compared with replacement nonhaemolysed samples from the same subjects. The two
samples were collected within 4 h of each other
PT (s) APTT (s)
Fibrinogen
(g/L)
STA�-
Neoplastine�
CI Plus
STA�-
Neoplastine� R
STA�-PTT
Automate�STA�-
Cephascreen�STA�-C.K.
Prest�STA�-
Liquid Fib
Nonhaemolysed Min 11.9 12.9 29.5 25.0 25.1 1.94
Max 32.8 63.2 99.7 60.6 67.1 9.45
Mean 16.6 20.3 44.4 36.8 32.5 5.22
Median 14.3 16.6 40.2 35.2 30.2 5.38
Haemolysed Min 12.0 12.3 23.1 21.8 20.8 1.84
Max 36.5 68.8 79.3 62.9 65.9 9.91
Mean 16.6 20.7 41.6 36.2 31.5 5.38
Median 14.2 16.6 38.6 34.1 29.3 5.02
© 2016 John Wiley & Sons Ltd, Int. Jnl. Lab. Hem.
4 A. WOOLLEY, J.-L. GOLMARD AND S. KITCHEN | EFFECTS OF INTERFERING SUBSTANCES ON COAGULATION TESTS

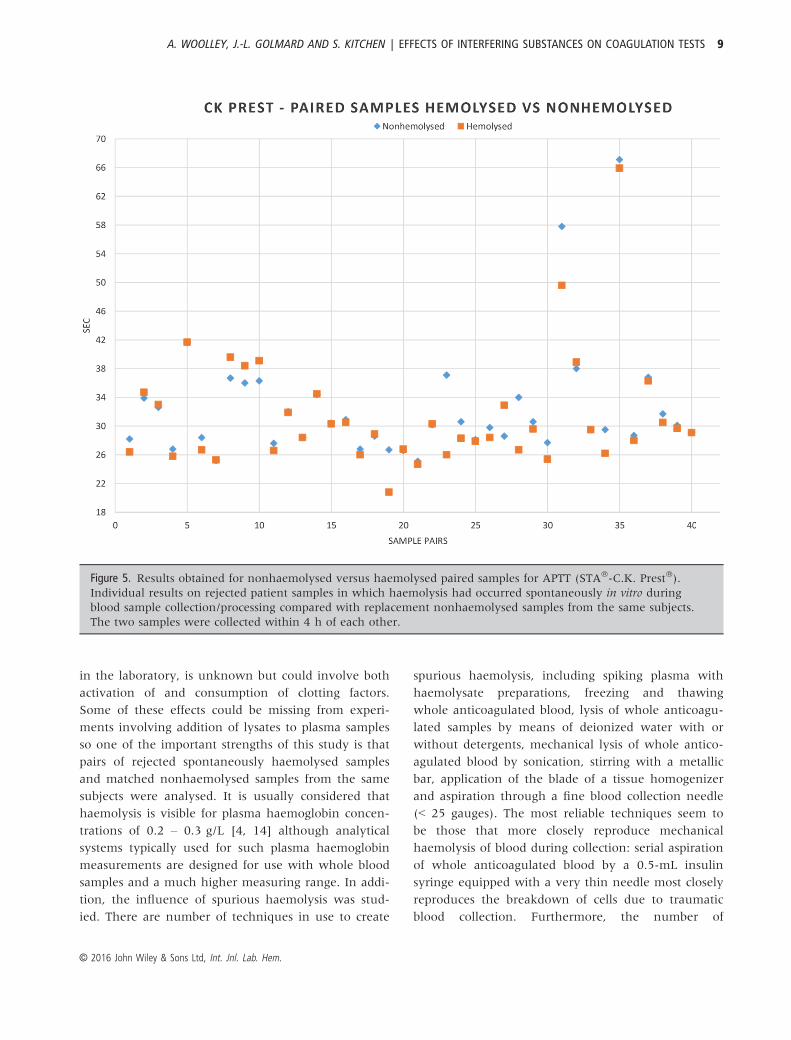
In contrast, APTT was statistically significantly
shorter in haemolysed versus nonhaemolysed samples
with two test reagents, STA�-PTT Automate� and
STA�-C.K. Prest� (P = 0.0289 and 0.0382 respec-
tively), but not with STA�-Cephascreen�. However,
this difference was demonstrated to be not clinically
significant for STA�-C.K.Prest�.
Results of clinical relevance analysis in paired sam-
ples for haemolysis are displayed in Table 2.
No correlation was observed between the level of
haemolysis and the test result variation for all assays
whatever the reagent used (data not shown).
Spurious/mechanical haemolysed samples
No statistical difference was observed between H1
and H3 versus H0 pools for PT measured using
either STA�-Neoplastine� CI Plus or STA�-
Neoplastine� R. In contrast, PT was statistically dif-
ferent between H5 and H0 (P = 0.0117 and
P = 0.0001 for STA�-Neoplastine� CI Plus and
STA�-Neoplastine� R, respectively). However, these
differences were demonstrated to be not clinically
significant.
APTT was not significantly impacted by haemolysis
regarding H1 versus H0 whatever the reagent used.
APTT was significantly shorter for H3 and H5 with
STA�-PTT Automate� (P = 0.0024 for H3 and 0.0014
for H5). However, these differences were demonstrated
to be not clinically significant. In contrast, no statisti-
cally significant difference was observed for the differ-
ent levels of mechanical haemolysis when APTT was
measured using either STA�-Cephascreen�, or STA�-
C.K.Prest�. Provoked haemolysis had no significant
impact on the fibrinogen assay result using the STA�-
Liquid Fib reagent.
Clinical relevance analysis for mechanical haemoly-
sis is depicted in Table 3.
Icterus interference
Icterus had no statistically significant impact on PT
measured using STA�-Neoplastine CI Plus, or STA�-
Neoplastine R.
Figure 1. Results obtained for nonhaemolysed versus haemolysed paired samples for PT (STA�-Neoplastine� CI
Plus). Individual results on rejected patient samples in which haemolysis had occurred spontaneously in vitro
during blood sample collection/processing compared with replacement nonhaemolysed samples from the same
subjects. The two samples were collected within 4 h of each other.
© 2016 John Wiley & Sons Ltd, Int. Jnl. Lab. Hem.
A. WOOLLEY, J.-L. GOLMARD AND S. KITCHEN | EFFECTS OF INTERFERING SUBSTANCES ON COAGULATION TESTS 5

Regarding APTT, a statistically significant differ-
ence was observed between the B5 pools and the B0
reference pools (P = 0.0050), but not between the
B20 and B40 versus B0 pools when APTT was mea-
sured using STA�-PTT Automate reagent. No signifi-
cant impact of icterus was observed for APTT
measured using STA�-Cephascreen� reagent, what-
ever the level of icterus was (B5, B20 or B40 versus
B0). Finally, only the lowest level of icterus (B5)
had no impact on APTT measured using STA�-
C.K.Prest� reagent, while B20 and B40 spiked pools
significantly differed from B0 with this reagent
(P = 0.0001 for B20 and P < 0.0001 for B40). How-
ever, these differences were demonstrated to be not
clinically significant.
Icterus did not significantly impact the fibrinogen
assay result at the two lowest bilirubin concentrations
(B5 and B20). However, fibrinogen assay result was
impacted for the highest tested bilirubin concentration
(for B40 P = 0.0015). Nevertheless, these differences
were demonstrated to be not clinically significant.
Clinical relevance analysis for icterus interference
is depicted in Table 4.
Lipaemia interference
Only the lowest triglyceride concentration (L200)
had no impact on PT measured with STA�-Neoplas-
tine CI Plus, whereas the two highest concentrations
(L500 and L1000) significantly affected the PT result
(P = 0.0403 and 0.0028, respectively). In contrast,
lipaemia had a significant effect only on PT mea-
sured using the STA�-Neoplastine R reagent for the
highest level L1000 (P = 0.0238). However, these
differences were demonstrated to be not clinically
significant.
Lipaemia had no impact on APTT measured with
either STA�-PTT Automate� or STA�-C.K.Prest�. In
contrast, lipaemia at the two highest concentrations
(L500 and L1000) significantly affected APTT results
generated using STA�-Cephascreen� reagent (P =
0.0054 and 0.0005, respectively). However, these
Figure 2. Results obtained for nonhaemolysed versus haemolysed paired samples for PT (STA�-Neoplastine� R).
Individual results on rejected patient samples in which haemolysis had occurred spontaneously in vitro during
blood sample collection/processing compared with replacement non-haemolysed samples from the same subjects.
The two samples were collected within 4 h of each other.
© 2016 John Wiley & Sons Ltd, Int. Jnl. Lab. Hem.
6 A. WOOLLEY, J.-L. GOLMARD AND S. KITCHEN | EFFECTS OF INTERFERING SUBSTANCES ON COAGULATION TESTS

differences were demonstrated to be not clinically sig-
nificant.
Finally, lipaemia had no impact on fibrinogen assay
results when measured with STA�-Liquid Fib.
Clinical relevance analysis for lipaemia is depicted
in Table 5.
DISCUSSION
Important diagnostic and therapeutic decisions are
based on laboratory test results. However, many vari-
ables may affect plasma-based coagulation test results.
Haemolysis, lipaemia and icterus are common condi-
tions in clinical laboratories: indeed, they have been
reported to affect up to 19.5%. 0.3%. and 0.3%,
respectively, of samples referred to coagulation
laboratories [11]. To date, most laboratories use auto-
mated analysers to analyse screening tests of
haemostasis including PT, APTT and fibrinogen. In
general, the principle of detection system can be
divided into two categories: electromechanical and
photo-optical methods. It is known that the photo-
optical method can be limited by a high degree of
coloured or particulate interferences in plasma sam-
ples. Coagulation test results from these samples could
lead to erroneous or undetectable errors [12].
There are multiple ways an interfering substance
may impair the reliability of a test result: this depends
on the nature of the interfering substance, the nature
of the analyte and the principle of the assay including
the detection method. Indeed, interference can derive
from absorbance of the interfering substance at
Figure 3. Results obtained for nonhaemolysed versus haemolysed paired samples for APTT (STA�-PTT Automate�).
Individual results on rejected patient samples in which haemolysis had occurred spontaneously in vitro during
blood sample collection/processing compared with replacement nonhaemolysed samples from the same subjects.
The two samples were collected within 4 h of each other.
© 2016 John Wiley & Sons Ltd, Int. Jnl. Lab. Hem.
A. WOOLLEY, J.-L. GOLMARD AND S. KITCHEN | EFFECTS OF INTERFERING SUBSTANCES ON COAGULATION TESTS 7

wavelengths that are commonly used for the optical
detection in coagulation analysers [2]. Besides this
analytical interference, the interfering substance or
interfering substance-related components can induce a
direct interference with haemostasis. For instance,
phospholipid membranes from haemolytic red cells
may interfere with the coagulation reaction by provid-
ing a phospholipid-rich surface that accelerates coagu-
lation reactions [4]. Platelet activation by haemolysed
red cells can impact on coagulation test results, indi-
cating that effects will not be restricted to those
induced by change in the colour of the plasma sam-
ples under analysis [13].
In contrast to photo-optical detection systems, vis-
cosity-based detection systems (VBDS) also referred to
as mechanical or electromechanical detection systems
may overcome at least some of the analytical interfer-
ence limitations. The aim of this study was to assess
the sensitivity of various PT and APTT reagent and of
one fibrinogen assay run on a VBDS to haemolysis,
icterus, and lipaemia.
The results demonstrate that interfering substances
may impact assays differently depending on (i) the
parameter, (ii) the specific reagent used to run an
assay, (iii) the nature of the interfering substance, and
(iv) the level of the interfering substance.
The impact of sequential changes in patient sam-
ples that might occur in the interval between the
occurrence of in vitro haemolysis, for example during
sample collection, and receipt/analysis of that sample
Figure 4. Results obtained for nonhaemolysed versus haemolysed paired samples for APTT (STA�-Cephascreen�).
Individual results on rejected patient samples in which haemolysis had occurred spontaneously in vitro during
blood sample collection/processing compared with replacement nonhaemolysed samples from the same subjects.
The two samples were collected within 4 h of each other.
© 2016 John Wiley & Sons Ltd, Int. Jnl. Lab. Hem.
8 A. WOOLLEY, J.-L. GOLMARD AND S. KITCHEN | EFFECTS OF INTERFERING SUBSTANCES ON COAGULATION TESTS
in the laboratory, is unknown but could involve both
activation of and consumption of clotting factors.
Some of these effects could be missing from experi-
ments involving addition of lysates to plasma samples
so one of the important strengths of this study is that
pairs of rejected spontaneously haemolysed samples
and matched nonhaemolysed samples from the same
subjects were analysed. It is usually considered that
haemolysis is visible for plasma haemoglobin concen-
trations of 0.2 – 0.3 g/L [4, 14] although analytical
systems typically used for such plasma haemoglobin
measurements are designed for use with whole blood
samples and a much higher measuring range. In addi-
tion, the influence of spurious haemolysis was stud-
ied. There are number of techniques in use to create
spurious haemolysis, including spiking plasma with
haemolysate preparations, freezing and thawing
whole anticoagulated blood, lysis of whole anticoagu-
lated samples by means of deionized water with or
without detergents, mechanical lysis of whole antico-
agulated blood by sonication, stirring with a metallic
bar, application of the blade of a tissue homogenizer
and aspiration through a fine blood collection needle
(< 25 gauges). The most reliable techniques seem to
be those that more closely reproduce mechanical
haemolysis of blood during collection: serial aspiration
of whole anticoagulated blood by a 0.5-mL insulin
syringe equipped with a very thin needle most closely
reproduces the breakdown of cells due to traumatic
blood collection. Furthermore, the number of
Figure 5. Results obtained for nonhaemolysed versus haemolysed paired samples for APTT (STA�-C.K. Prest�).
Individual results on rejected patient samples in which haemolysis had occurred spontaneously in vitro during
blood sample collection/processing compared with replacement nonhaemolysed samples from the same subjects.
The two samples were collected within 4 h of each other.
© 2016 John Wiley & Sons Ltd, Int. Jnl. Lab. Hem.
A. WOOLLEY, J.-L. GOLMARD AND S. KITCHEN | EFFECTS OF INTERFERING SUBSTANCES ON COAGULATION TESTS 9

aspirations is directly linked to the degree of damaged
blood cells and cell-free haemoglobin, so that an arbi-
trary scale of haemolysis can be easily and suitably
reproduced [2]. In vitro haemolysis in rejected patient
samples is likely to be derived from a number of
mechanisms including this type of mechanical
haemolysis.
Spontaneous haemolysis that occurred during sam-
ple collection and processing had no effect on PT in
our study for either the rabbit tissue factor extract or
recombinant human tissue factor reagents, namely
STA�-Neoplastine� CI Plus and STA�-Neoplastine� R,
respectively. In contrast, addition of mechanically
haemolysed cells impacted statistically significantly
PT for the highest haemoglobin concentration. Any
test result reported by the laboratory as a single
number actually represents a range of numbers that
has a definable dispersion. Therefore, statistically sig-
nificance of the difference between two different con-
ditions is easily reached, but may not be of clinical
significance. As a consequence, the clinical relevance
of the observed bias should be reviewed instead [7].
This approach allows a more relevant comparison of
results obtained in samples containing a potentially
interfering substance. When looking at the clinical rel-
evance of the observed difference between the highest
haemolysis level studied and the nonhaemolysed ref-
erence pools for PT, it was demonstrated that the bias
would have no clinical impact.
The results obtained in this study for haemolysis
indicate that not only the analyte has to be taken into
account, but also the particular test used for the
Figure 6. Results obtained for nonhaemolysed versus haemolysed paired samples for fibrinogen (STA�-Liquid Fib).
Individual results on rejected patient samples in which haemolysis had occurred spontaneously in vitro during
blood sample collection/processing compared with replacement nonhaemolysed samples from the same subjects.
The two samples were collected within 4 h of each other.
© 2016 John Wiley & Sons Ltd, Int. Jnl. Lab. Hem.
10 A. WOOLLEY, J.-L. GOLMARD AND S. KITCHEN | EFFECTS OF INTERFERING SUBSTANCES ON COAGULATION TESTS
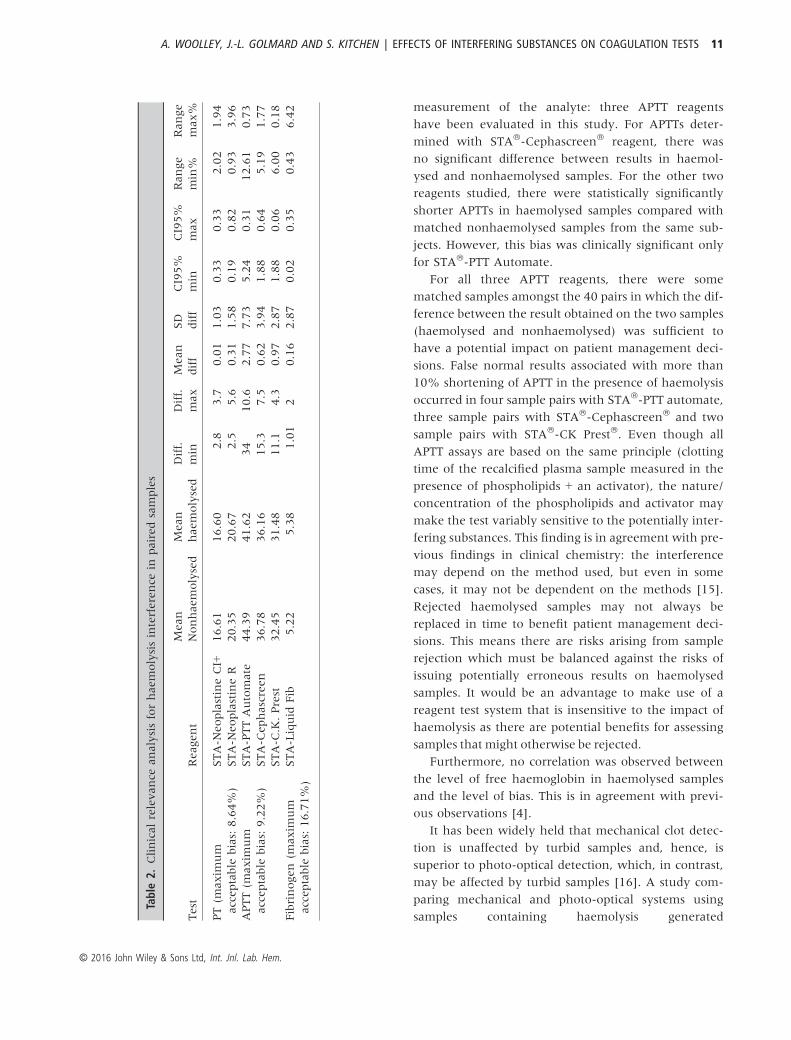
measurement of the analyte: three APTT reagents
have been evaluated in this study. For APTTs deter-
mined with STA�-Cephascreen� reagent, there was
no significant difference between results in haemol-
ysed and nonhaemolysed samples. For the other two
reagents studied, there were statistically significantly
shorter APTTs in haemolysed samples compared with
matched nonhaemolysed samples from the same sub-
jects. However, this bias was clinically significant only
for STA�-PTT Automate.
For all three APTT reagents, there were some
matched samples amongst the 40 pairs in which the dif-
ference between the result obtained on the two samples
(haemolysed and nonhaemolysed) was sufficient to
have a potential impact on patient management deci-
sions. False normal results associated with more than
10% shortening of APTT in the presence of haemolysis
occurred in four sample pairs with STA�-PTT automate,
three sample pairs with STA�-Cephascreen� and two
sample pairs with STA�-CK Prest�. Even though all
APTT assays are based on the same principle (clotting
time of the recalcified plasma sample measured in the
presence of phospholipids + an activator), the nature/
concentration of the phospholipids and activator may
make the test variably sensitive to the potentially inter-
fering substances. This finding is in agreement with pre-
vious findings in clinical chemistry: the interference
may depend on the method used, but even in some
cases, it may not be dependent on the methods [15].
Rejected haemolysed samples may not always be
replaced in time to benefit patient management deci-
sions. This means there are risks arising from sample
rejection which must be balanced against the risks of
issuing potentially erroneous results on haemolysed
samples. It would be an advantage to make use of a
reagent test system that is insensitive to the impact of
haemolysis as there are potential benefits for assessing
samples that might otherwise be rejected.
Furthermore, no correlation was observed between
the level of free haemoglobin in haemolysed samples
and the level of bias. This is in agreement with previ-
ous observations [4].
It has been widely held that mechanical clot detec-
tion is unaffected by turbid samples and, hence, is
superior to photo-optical detection, which, in contrast,
may be affected by turbid samples [16]. A study com-
paring mechanical and photo-optical systems using
samples containing haemolysis generated
Table
2.Clinicalrelevance
analysisforhaemolysisinterference
inpairedsamples
Test
Reagent
Mean
Nonhaemolysed
Mean
haemolysed
Diff.
min
Diff.
max
Mean
diff
SD
diff
CI95%
min
CI95%
max
Range
min%
Range
max%
PT(m
axim
um
acceptable
bias:8.64%
)
STA-N
eoplastineCI+
16.61
16.60
�2.8
3.7
�0.01
1.03
�0.33
0.33
�2.02
1.94
STA-N
eoplastineR
20.35
20.67
�2.5
5.6
0.31
1.58
�0.19
0.82
�0.93
3.96
APTT(m
axim
um
acceptable
bias:9.22%
)
STA-PTTAutomate
44.39
41.62
�34
10.6
�2.77
7.73
�5.24
�0.31
�12.61
�0.73
STA-C
ephascreen
36.78
36.16
�15.3
7.5
�0.62
3.94
�1.88
0.64
�5.19
1.77
STA-C
.K.Prest
32.45
31.48
�11.1
4.3
�0.97
2.87
�1.88
�0.06
�6.00
�0.18
Fibrinogen(m
axim
um
acceptable
bias:16.71%
)
STA-Liquid
Fib
5.22
5.38
�1.01
20.16
2.87
�0.02
0.35
�0.43
6.42
© 2016 John Wiley & Sons Ltd, Int. Jnl. Lab. Hem.
A. WOOLLEY, J.-L. GOLMARD AND S. KITCHEN | EFFECTS OF INTERFERING SUBSTANCES ON COAGULATION TESTS 11

mechanically or by freeze thaw [17] reported much
more marked prolongation of PT and APTT for the
optical system, although reading optical end-points at
570 nm reduced the impact of haemolysis when com-
pared to optical readings at 405 nm. This study did
not include any testing of samples in which haemoly-
sis had occurred in patient samples during their col-
lection and processing.
Although not being a head-to-head comparison
between these two types of detection systems, this
Table 3. Clinical relevance analysis for spurious haemolysis
Test Reagent
Haemolysis
Level Mean
Mean
diff
SD
diff
Range
min
Range
max
Range
min%
Range
max%
PT (maximum
acceptable bias: 8.64%)
STA-Neoplastine
CI+ (mean H0:
21.02)
H1 21.03 0.01 0.18 �0.34 0.37 �1.62 1.72
H3 21.03 0.01 0.18 �0.34 0.37 �1.62 1.72
H5 21.57 0.55 0.18 0.20 0.91 0.94 4.29
STA-Neoplastine
R (mean H0: 28.41)
H1 28.42 0.01 0.29 �0.56 0.58 �1.96 2.04
H3 27.8 �0.61 0.29 �1.18 �0.05 �4.14 �0.15
H5 27.05 �1.36 0.29 �1.93 �0.80 �6.78 �2.79
APTT (maximum
acceptable bias: 9.22%)
STA-PTT Automate
(mean H0: 43.76)
H1 42.61 �1.15 0.65 �2.43 0.13 �5.55 0.30
H3 41.36 �2.4 0.65 �3.68 �1.13 �8.40 �2.57
H5 41.23 �2.53 0.65 �3.81 �1.26 �8.70 �2.86
STA-Cephascreen
(mean H0: 34.72)
H1 34.32 �0.4 0.39 �1.16 0.37 �3.36 1.06
H3 34.5 �0.22 0.39 �0.98 0.55 �2.84 1.58
H5 35.41 0.69 0.39 �0.07 1.46 �0.22 4.20
STA-C.K. Prest
(mean H0: 31.32)
H1 31.06 �0.26 0.58 �1.39 0.88 �4.45 2.80
H3 30.95 �0.37 0.58 �1.50 0.77 �4.80 2.45
H5 32.62 1.3 0.58 0.16 2.44 0.52 7.78
Fibrinogen (maximum
acceptable bias: 16.71%)
STA-Liquid Fib
(mean H0: 4.285)
H1 4.33 0.05 0.06 �0.06 0.17 �1.52 3.77
H3 4.31 0.02 0.06 �0.09 0.14 �2.15 3.14
H5 4.21 �0.07 0.06 �0.18 0.04 �4.36 0.92
Table 4. Clinical relevance analysis for icterus interference
Test Reagent
Icterus
level Mean
Mean
diff
SD
diff
Range
min
Range
max
Range
min%
Range
max%
PT (maximum
acceptable bias: 8.64%)
STA-Neoplastine
CI+ (mean B0: 13.62)
B5 13.53 �0.09 0.07 �0.22 0.06 �1.65 0.40
B20 13.54 �0.07 0.07 �0.21 0.07 �1.58 0.47
B40 13.52 �0.09 0.07 �0.23 0.05 �1.72 0.33
STA-Neoplastine
R (mean B0: 14.63)
B5 14.6 �0.03 0.12 �0.26 0.21 �1.78 1.38
B20 14.56 �0.07 0.12 �0.30 0.17 �2.05 1.11
B40 14.35 �0.28 0.12 �0.51 �0.05 �3.49 �0.34
APTT (maximum
acceptable bias: 9.22%)
STA-PTT Automate
(mean B0: 37.47)
B5 36.5 �0.97 0.28 �1.52 �0.42 �4.07 �1.11
B20 37.14 �0.33 0.28 �0.88 0.23 �2.36 0.61
B40 38.11 0.64 0.28 0.08 1.20 0.21 3.20
STA-Cephascreen
(mean B0: 31.27)
B5 31.07 �0.2 0.14 �0.47 0.08 �1.53 0.26
B20 31.13 �0.14 0.14 �0.41 0.14 �1.34 0.45
B40 31.53 0.26 0.14 �0.01 0.54 �0.06 1.73
STA-C.K. Prest
(mean B0: 29.72)
B5 29.78 0.06 0.14 �0.21 0.34 �0.72 1.14
B20 30.38 0.66 0.14 0.38 0.94 1.29 3.15
B40 30.73 1.01 0.14 0.73 1.29 2.46 4.33
Fibrinogen (maximum
acceptable bias: 16.71%)
STA-Liquid Fib
(mean B0: 4.34)
B5 4.32 �0.02 0.05 �0.10 0.08 �2.48 1.66
B20 4.23 �0.11 0.05 �0.19 �0.02 �4.51 �0.38
B40 4.16 �0.18 0.05 �0.26 �0.09 �6.15 �2.01
© 2016 John Wiley & Sons Ltd, Int. Jnl. Lab. Hem.
12 A. WOOLLEY, J.-L. GOLMARD AND S. KITCHEN | EFFECTS OF INTERFERING SUBSTANCES ON COAGULATION TESTS

study illustrates that VDBS is not influenced by icterus
and lipaemia interferences to an extent which would
create clinically relevant bias in the result of PT, APTT
and Fibrinogen. This absence of interference to
haemolysis for PT and kaolin-cephalin APTT is in
agreement with previous findings [4]. Indeed, only
one APTT reagent generated a clinically relevant bias
for the highest haemolysis level tested. For the three
reagents studied, there were between two and four
individual samples amongst 40 pairs (5 -10%) in
which haemolysis (in the range <0.5 – 2.1 g/L free
plasma haemoglobin) led to a 10% or greater reduc-
tion in APTT and which normalized what should be a
prolonged result. Individual centres need to take these
effects into account when establishing policy on sam-
ple acceptance and rejection. The vast majority of
haemolysed specimens detected in clinical laboratories
are only mildly haemolytic (i.e. with cell-free haemo-
globin < 0.6 g/L) [18]. In contrast to what has been
described for fibrinogen measured in a grossly
haemolysed plasma sample using a photo-optical
detector, the fibrinogen level was not clinically signifi-
cantly affected by haemolysis in our study [12]. Initial
visual observation of samples upon receipt in the lab-
oratory for processing should be retained as detection
of incorrect sample tubes and grossly haemolysed or
lipaemic specimens by initial observation can initiate
the replacement of unacceptable specimens and
reduce overall turnaround time (TAT) [3].
CONCLUSION
Reporting accurate results is a critical concern for clin-
ical laboratories. It is therefore important that the lab-
oratory staff be aware of potentially clinically relevant
bias due to interferences. HIL is a group of the most
commonly observed source of interferences. Over the
past years, visual inspection of plasma samples has
been the system for detection and reporting of HIL
interference. However, there are some limitations to
this inspection, including the difficulty to adequately
identify HIL. The aim of this study was to evaluate
the absence of clinically relevant bias induced by HIL
interference for PT, APTT and fibrinogen measured
with different reagents using a VBDS analyser. These
results confirm that PT and fibrinogen are not clini-
cally significantly affected by HIL. The APTTs of some
haemolysed samples were falsely normal with one
reagent more affected than two others. Haemolysed
samples should be continuously rejected. Conversely,
Table 5. Clinical relevance analysis for lipaemia interference
Test Reagent
Lipaemia
level Mean
Mean
diff
SD
diff
Range
min
Range
max
Range
min%
Range
max%
PT (maximum
acceptable bias: 8.64%)
STA-Neoplastine
CI+ (mean L0: 16.95)
L200 16.67 �0.28 0.18 �0.63 0.08 �3.72 0.43
L500 16.49 �0.46 0.18 �0.81 �0.11 �4.79 �0.64
L1000 16.3 �0.65 0.18 �1.00 �0.30 �5.91 �1.76
STA-Neoplastine
R (mean L0: 20.00)
L200 19.8 �0.2 0.32 �0.83 0.44 �4.16 2.17
L500 19.5 �0.5 0.32 �1.13 0.14 �5.66 0.67
L1000 19.1 �0.9 0.32 �1.53 �0.27 �7.66 �1.34
APTT (maximum
acceptable bias: 9.22%)
STA-PTT Automate
(mean L0: 38.66)
L200 38.51 �0.15 0.29 �0.71 0.42 �1.86 1.09
L500 38.23 �0.43 0.29 �0.99 0.14 �2.58 0.37
L1000 38.69 0.03 0.29 �0.53 0.60 �1.39 1.55
STA-Cephascreen
(mean L0: 31.79)
L200 31.49 �0.3 0.15 �0.59 �0.01 �1.85 �0.03
L500 31.29 �0.5 0.15 �0.79 �0.21 �2.48 �0.66
L1000 31.16 �0.63 0.15 �0.92 �0.34 �2.89 �1.07
STA-C.K. Prest
(mean L0: 28.87)
L200 28.75 �0.12 0.13 �0.37 0.14 �1.29 0.46
L500 28.75 �0.12 0.13 �0.37 0.14 �1.29 0.46
L1000 28.76 �0.11 0.13 �0.36 0.15 �1.25 0.50
Fibrinogen (maximum
acceptable bias: 16. 7%)
STA-Liquid Fib
(mean L0: 4.71)
L200 4.27 �0.00 0.06 �0.11 0.11 �2.75 2.58
L500 4.34 0.07 0.06 �0.04 0.19 �1.00 4.33
L1000 4.35 0.07 0.06 �0.03 0.19 �0.90 4.43
© 2016 John Wiley & Sons Ltd, Int. Jnl. Lab. Hem.
A. WOOLLEY, J.-L. GOLMARD AND S. KITCHEN | EFFECTS OF INTERFERING SUBSTANCES ON COAGULATION TESTS 13

from a clinical standpoint, lipaemia and icterus did
not significantly affect APTT measured with the differ-
ent reagents tested in combination with a VBDS anal-
yser.
ACKNOWLEDGEMENTS
The authors are grateful to Diagnostica Stago for pro-
viding reagents and funding to conduct this study.
REFERENCES:
1. Bonini P, Plebani M, Ceriotti F, Rubboli F.
Errors in laboratory medicine. Clin Chem
2002;48:691–8.
2. Lippi G, Plebani M, Favaloro EJ. Interfer-
ence in coagulation testing: focus on spuri-
ous hemolysis, icterus, and lipemia. Semin
Thromb Hemost 2013;39:258–66.
3. Clinical and Laboratory Standards Institute
(CLSI).Hemolysis, Icterus, and Lipemia/Tur-
bidimetry Indices as Indicators of Interfer-
ences in Clinical Laboratory Analysis:
Approved Guideline. CLSI: document C56-
A. Wayne (PA), USA; 2012.
4. Laga AC, Cheves TA, Sweeney JD. The effect
of specimen hemolysis on coagulation test
results. Am J Clin Pathol 2006;126:748–55.
5. Lippi G, Ippolito L, Favaloro EJ. Technical
evaluation of the novel preanalytical mod-
ule on instrumentation laboratory ACL
TOP: advancing automation in hemostasis
testing. J Lab Autom 2013;18:382–90.
6. Clinical and Laboratory Standards institute
(CLSI). Collection, Transport, and Process-
ing of Blood specimen for Testing Plasma-
Based Coagulation Assays and Molecular
Hemostasis Assays: Approved Guideline -
Fifth Edition. CLSI: document H21-A5.
Wayne (PA), USA; 2008.
7. Fraser CG. Test result variation and the
quality of evidence-based clinical guideli-
nes. Clin Chim Acta 2004;346:19–24.
8. Desirable Biological Variation Database
Specifications Desirable Biological Variation
Database Specifications[August 19, 2015].
https://www.westgard.com/bio-
database1.htm].
9. Chen Q, Shou W, Wu W, Guo Y, Zhang Y,
Huang C, Cui W. Biological and analytical
variations of 16 parameters related to coag-
ulation screening tests and the activity of
coagulation factors. Semin Thromb Hemost
2015;41:336–41.
10. Dot D, Miro J, Fuentes-Arderiu X. Within-
subject and between-subject biological vari-
ation of prothrombin time and activated
partial thromboplastin time. Ann Clin Bio-
chem 1992;29:422–5.
11. Salvagno GL, Lippi G, Bassi A, Poli G, Guidi
GC. Prevalence and type of pre-analytical
problems for inpatients samples in coagula-
tion laboratory. J Eval Clin Pract
2008;14:351–3.
12. Tantanate CTM, Tientadakul P. Influence
of Plasma Interferences on Screening Coag-
ulogram and Performance Evaluation
of the Automated Coagulation Analyzer
Sysmex CS-2100i. Siriraj Med J 2011;63:
151–6.
13. Helms CC, Marvel M, Zhao W, Stahle M,
Vest R, Kato GJ, Lee JS, Christ G, Gladwin
MT, Hantgan RR, Kim-Shapiro DB. Mecha-
nisms of hemolysis-associated platelet acti-
vation. J Thromb Haemost 2013;11:2148–
54. PubMed PMID: 24119131. Pubmed
Central PMCID: 3947421.
14. Lippi G, Guidi GC, Mattiuzzi C, Plebani M.
Preanalytical variability: the dark side of
the moon in laboratory testing. Clin Chem
Lab Med 2006;44:358–65.
15. Grafmeyer DBM, Manchon M, Levillain P.
The influence of bilirubin, haemolysis and
turbidimetry on 20 analytical tests per-
formed on automatic analysers: results of
an interlaboratory study. Eur J Clin Chem
Clin Biochem 1995;33:31–52.
16. Tekkesin N, Kilinc C. Optical and mechani-
cal clot detection methodologies: a compar-
ison study for routine coagulation testing. J
Clin Lab Anal 2012;26:125–9.
17. D’Angelo G, Villa C, Tamborini A, Villa S.
Evaluation of the main coagulation tests in
the presence of hemolysis in healthy sub-
jects and patients on oral anticoagulant ther-
apy. Int J Lab Hematol 2015;37:819–33.
18. Lippi G, Avanzini P, Zobbi V, Ippolito L.
Influence of mechanical hemolysis of blood
on two D-dimer immunoassays. Blood Coa-
gul Fibrinolysis 2012;23:461–3.
© 2016 John Wiley & Sons Ltd, Int. Jnl. Lab. Hem.
14 A. WOOLLEY, J.-L. GOLMARD AND S. KITCHEN | EFFECTS OF INTERFERING SUBSTANCES ON COAGULATION TESTS