Embed Size (px)
Citation preview

TECHNICAL REPORT NATIOK/TR-82/041
«car
>,..,
EFFECTS OF GENDER, FRAME LENGTH, AND PARTICIPATION TIME
ON LOAD CARRYING BEHAVIOR
BY PHILIP E. MARTIN
RICHARD C. NELSON AND
IN-SIK SHIN
DHTI C BIOMECHANICS LABORATORY FLECTEMk THE PENNSYLVANIA STATE UNIVERSITY DEC 2 2 1982 ! W UNIVERSITY PARK, PENNSYLVANIA
B _ AUGUST mt
UNITED STATES ARMY NATICK RESEARCH & DEVELOPMENT LABORATORIES
NATICK, MASSACHUSETTS 01760
APPROVED FOR PUBLIC RELEASE; DISTRIBUTION UNLIMITED.
INDIVIDUAL PROTECTION LABORATORY IPL-257
Wm *m

1 »
V .• ■ ■*:?■■■■*
i.
I Approved fop public release) distribution unlimited.
| Citation of trade names in this report doe« not I constitute an official indorsement or approval of the I use of such items«
I Destroy this report vhen no longer needed. Do not i **-•'.- return it to the originator.
T"
%
)

UNCLASSIFIED SECURITY CLASSIFICATION OF THIS PAGE (Whan Date Entered)
REPORT DOCUMENTATION PAGE READ INSTRUCTIONS BEFORE COMPLETING FORM
1. REPORT NUMBER
NATICK/TR-82/041 2. GOVT ACCESSION NO 3. RECIPIENT'S CATALOG NUMBER
4. TITLE (and Subtitle)
EFFECTS OF GENDER, FRAME LENGTH, TIME ON LOAD CARRYING BEHAVIOR
AND PARTICIPATION 5. TYPE OF REPORT ft PERIOD COVERED
Final Report for period (Dec 30, 1980 to Aug 31,
6. PERFORMII
IPL-257 G ORG. REPORT NUMBER
7. AUTHORS)
Philip E. Martin, Richard C. Nelson, and In-Sik Shin
B. CONTRACT OR GRANT NUMBERf«)
DAAK60-81-C-0018
S. PERFORMING ORGANIZATION NAME Af4D ADDRESS
Biomechanics Laboratory The Pennsylvania State University University Park, Pennsylvania
10. PROGRAM ELEMENT, PROJECT, TASK AREA & WORK UNIT NUMBERS
1L162723AH98AJ007
11. CONTROLLING OFFICE NAME AND ADDRESS
US Army Natick Research & Development Laboratories ATTN: DRDNA-ICCH Natick, Massachusetts 01760 14. MONITORING AGENCY NAME ft ADDRESS<i/ different from Controlling Office)
12. REPORT DATE
August 1982 13. NUMBER OF PAGES
15. SECURITY CLASS, (of this rmport)
Unclassified 15a. DECLASSIFI CATION/DOWN GRADING
SCHEDULE
16. DISTRIBUTION STATEMENT (of this Report)
roved for public release; distribution unlimited.
17. DISTRIBUTION STATEMENT (of the abstract entered in Block 20, if different from Report)
16. SUPPLI ITARY NOTES
19. KEY WORDS (Continue on reverse side it necessary and identify by block number)
Load Carrying Loads Backpacks Gender Frame Length
Body sizes Males Females Military Personnel Sizes (Dimensions)
Physical performance Movement Capabilitiei
20. ABSTRACT (Coattoua aa rererme «Mi ft WWWM9 ami identify by block number)
This study was conducted to determine the effects of backpack frame length on the movement capabilities of men and women. The tests included walking and running on a treadmill, an agility run around obstacles, reaction movements to the left and right, ladder climbing, and standing stability. Subjects performed these tests while outfitted in a utility shirt and trousers, combat boots, a PASGT helmet, the ALICE fighting gear, and an ALICE backpack containing 20 lb of military clothing and equipment. The length of the backpack's external
DO .ETi, 1473 :m ©f- ? OBSOLETE UNCLASSIFIED SECURITY CLASSIFICATION OF THIS PAGE (Whan Data Bntarad)

UNCLASSIFIED tCCUWITY CLASSIFICATION OF THIS PAOC(TTh«»» Dmlm Kslirvd)
frame was varied and each subject was tested under four conditions: standard 20-in. frame (20), frame length equal to waist back length (P), frame length 2 in. less than waist back length (P-2), and frame length 2 in. greater than waist back length (P + 2). The subjects rated the P-2 condition as being less comfortable than the other\chree, but there were few significant effects on performance attributable to the frame length variable. There was a tendency for agility run performance to be poorest under the P-2 condition. During treadmill running, the angular motion of the trunk was greater under the P than under the 20 condition, and the relative angular motion of the backpack with respect to the trunk was somewhat greater for the 20 than for the P condition. None of these differences were considered to be major. It was concluded that, with a 20-lb pack load, no advantage is gained in terms of physical performance by using a frame length other than the standard 20 in. length.
UNCLASSIFIED
SECURITY CLASSIFICATION OF THIS PAGE(T»7i«n Dmtm Entifd)
* ----- w>1: •#.
■*-

PREFACE
This is the final report of research performed under Contract Number DAAJC6O-fr/-C-0O|frwith the Individual Protection Laboratory» US Army Natick Research and Development Laboratories, Natick, Massachusetts. It contains a description of the procedures and results for this project on the Biomechanics of Load Carrying Behavior. The work was formulated and directed by Drs. Carolyn K. Bensel and Richard F. Johnson, Human Factors Group, Individual Protection Laboratory. Dr. Bensel was the contract monitor and Dr. Johnson was the alternate.
The authors would like to express their appreciation to several indivi- duals for their assistance during this project. Mr. Wlodzimierz Erdmann, Mr. Daron Shepard and Ms. Dorothy Campolongo, who have special expertise in the area of anthropometry, provided valuable assistance during that phase of the project. Mr. Li Cheng Zhi, Mr. Krzysztof Kedzior, and Mr. Yasuhiko Tokuhara contributed their talents throughout the data collection and data processing portions of the project. Mr. John Palmgren provided technical assistance particularly for the cinematography procedures used for the analyses of walking and running gaits. Ms. Catherine Lendrim contributed greatly with respect to administrative and secretarial functions associated with the project. Dr. Elsworth R. Buskirk, Director of the Laboratory for Human Performance Research, made available treadmill equipment and other necessary facilities in Noll Laboratory on the Penn State Campus for the walking ana running experiments. Finally, Lt. Col. Arthur S. Dervaes III, Professo* of iiilitary Science, assisted the experimenters in obtaining subjects for this study and also provided testing facilities used for the physical performance testing. The cooperation of these individuals and the quality of their assistance were greatly appreciated.
DTIC ÄELECTE % DEC 2 2 1982
B ^J
Accession For ST IS üR.U'1
r T', \>
. ri.w:
+ n a
P€R -CAU*-***-
AvMi!■i Liity Codes .cV."Ul .'tua/or
Dist j Special
&

TABLE OF CONTENTS
PREFACE
LIST OF FIGURES
LIST OF TABLES
INTRODUCTION
EXPERIMENTAL PROCEDURES
Subjects Frame Conditions Testing Protocol Anthropometric Measures Physical Performance Tests
Agility Run Reaction Movement Test Ladder Climb
Walking and Running Gait Analyses Easy Standing Stability Test Subjective Evaluation of Backpack-Frame Comfort Statistical Procedures
RESULTS
Anthropometry Physical Performance Tests
Agility Run Reaction Movement Right and Left Ladder Climb
Discontinuous Analysis of Treadmill Walking Stride Length and Stride Rate Single Leg Contact, Double Support, and Swing Times Trunk Angle
Continuous Analysis of Treadmill Walking Discontinuous Analysis of Treadmill Running
Effect of Frame Condition and Participation Time for the Men
Effect of Gender, Frame Condition, and Participation Time
Continuous Analysis of Treadmill Running Easy Standing Stability Tust Subjective Assessment of Backpack-Frame Comfort
DISCUSSION AND RECOMMENDATIONS
REFERENCES
APPENDICES
A. Individual Waist Back Length and Personalized Frame Length Data
B. Descriptions of the Anthropometric Variables C. ANOVA Summary Tables
Page
1
4
11
11
11 13 16 16 17 17 17 18 18 28 28 30
31
31 33 33 34 35 35 35 36 37 38 41 43
43
46 49 50
52
55
57
57
59 63
1 fc

LIST OF FIGURES
Figure 1. Four of the eleven backpack frame lengths available for use in this study. Frames varied from 13 to 23 inches in one-inch increments.
Figure 2. Subject performing treadmill walking. Note the markers placed on the body and pack to facilitate analysis of the cine films.
Figure 3. Test area and the filming setup for treadmill walking and running.
Figure 4. Construction of hip and knee angles from coordinate point information obtained from cine film.
Figure 5. The rating form used in the assessment of the subjective evaluations of the four backpack-frame conditions. Shown on the form is a sample rating by one subject.
Figure 6. Plot of the simple main means for trunk angle demonstrating the Gender Time interaction.
Figure 7, Hip-knee angle-angle diagram comparing the average men's and women's lower extremity angular patterns.
Figure 8. Plot of the simple main means for single leg contact time demonstrating the Gender Frame interaction.
Page
15
20
21
25
30
38
42
45

LIST OF TABLES
Page
Table 1. Physical Characteristics of the Sample Subjects 12
Table 2. Comparison of Sample Subjects with Military Personnel 13
Table 3. Average Frame Lengths (in.) for the P, P-2, and P4-2 14 Conditions
Table 4. Physical Characteristics of the Subjects 18 Completing the Physical Performance Tests
Table 5. Physical Characteristics of the Subjects for the 26 Temporal-Kinematic Analysis of Walking
Table 6. Physical Characteristics of the Subjects for the 27 Temporal-Kinematic Analysis of Running
Table 7. Physical Characteristics of the Subjects for 27 the Continuous Analyses of Walking and Running
Table 8. Physical Characteristics of the Subjects for 29 Easy Standing
Table 9. Anthropometric Characteristics of the Men 32
Table 10. Anthropometric Characteristics of the Women 32
Table 11. Gender and Frame Means for Agility Run (sec.) 34
Table 12. Gender and Frame Means for Reaction Movement 34 Right (sec.)
Table 13. Gender and Frame Means for Reaction Movement 34 Left (sec.)
Table 14. Gender and Frame Means for Ladder Climb (sec.) 35
Table 15. Mean Stride Length and Stride Rate Values during 36 Walking for Gender, Frame Condition, and Participation Time
Table 16. Mean Swing Leg Contact, Double Support, and 37 Swing Times during Walking for Gender, Frame Condition, and Participation Time
Table 17. Mean Values of the Angle of Trunk Inclination during 37 Walking for Gender, Frame Condition, and Participation Time
1, ■£';■ ■''.'>
MmtBrntrntm

LIST OF TABLES (continued)
Page
Table 18. Gender and Frame htans of Cumulative Vertical 39 Motion of the Hip for Walking (m)
Table 19. Gender and Frame Means of Cumulative Angular 39 Displacement of the Trunk during Walking (deg)
Table 20. Gender and Frame Means of Cumulative Relative 39 Linear Motion of the Backpack during Walking (m)
Table 21. Gender and Frame Means of Cumulative Relative 40 Angular Motion of the Backpack during Walking (deg)
Table 22. Gender and Frame Means of Maximum Hip Angle 40 during Walking (deg)
Table 23. Gender and Frame Means of Minimum Hip Angle 40 during Walking (deg)
Table 24. Gender and Frame Means of Maximum Knee Angle 41 during Walking (deg)
Table 25. Gender and Frame Means of Minimum Knee Angle 41 during Walking (deg)
Table 26. Mean Stride Length, Stride Rate, and Swing Time 44 Values during Running for Gender, Frame Condition, and Participation Time
Table 27. Mean Single Leg Contact and Trunk Angle Values 45 during Running for Gender, Frame Condition, and Participation Time
Table 28. Gender and Frame Means of Cumulative Vertical 46 Motion of the Hip during Running (m)
Table 29. Gender and Frame Means of Cumulative Angular 47 Displacement of the Trunk during Running (deg)
Table 30. Gender and Frame Means of Cumulative Relative 47 Linear Motion of the Backpack during Running (m)
Table 31. Gender and Frame Means of Cumulative Relative 47 Angular Motion of the Backpack during Running (deg)
Table 32. Gender and Frame Means of Maximum Hip Angle 48 during Running (deg)
Table 33. Gender and Frame Means of Minimum Hip Angle 48 during Running (deg)
i i ii «■

LIST OF TABLES (continued)
Page
Table 34. Gender and Frame Means of Maximum Knee Angle 48 during Running (deg)
Table 35. Gender and Frame Means of Minimum Knee 49 Angle'during Running (deg)
Table 36. Mean CPX, CPY, and CPT Values during Easy Standing 50 for Gender, Frame Condition, and Participation Tims
Table 37. Mean Subjective Ratings of Comfort for Gender and 51 Frame
Table 0-1. ANOVA Summary of Agility Pun for Gender and Frame 64
Table C-2. ANOVA Summary of Reaction Movement Right for 65 Gender and Frame
Table C-3. ANOVA Summary of Reaction Movement Left for Gender 66 and Frame
Table C-4. ANOVA Summary of Ladder Climb for Gender and 67 Frame
Table C-5. ANOVA Summary of Stride Length during Walking for 68 Gender, Frame, and Participation Time
Table C-6. ANOVA Summary of Stride Rate during Walking for 69 Gender, Frame, and Participation Time
Table C-7. ANOVA Summary of Single Leg Contact Time during 70 Walking for Gender, Frame, and Participation Time
Table C-8. ANOVA Summary of Double Support Time during Walking 71 for Gender, Frame, and Participation Time
Table C-9. ANOVA Summary of Swing Time during Walking for 72 Gender, Frame, and Participation Time
Table C-10. ANOVA Summary of Trunk Angle during Walking for 73 Gender, Frame, and Participation Time
Table C-ll. ANOVA Summary for Cumulative Linear Hip Motion 74 during Walking
Table C-12. ANOVA Summary for Cumulative Trunk Angular Motion 74 during Walking
Table C-13. ANOVA Summary for Cumulative Linear Pack Motion 75 during Walking

LIST CF TABLES (continued)
Fage
Table C-14. ANOVA Summary for Cumulative Angular Fack Motion 75 during Walking
Table C-15. ANOVA Summary for Maximum Hip Angle during Walking 76
Table C-16. ANOVA Summary for Minimum Kip Angle during Walking 76
Table C-17. ANOVA Summary for Maximum Knee Angle during Walking II
Table 013. ANOVA Nummary for Minimum Knee Angle during Walking 77
Table C-19. ANOVA Summary of Stride Length during Running 78 for Frame and Participation Time (men only)
Table C-20. ANOVA Summary of Stride Rate during Running for 79 Frame and Participation Time (men only)
Table C-21. ANOVA Summary of Single Leg Contact Time during 80 Running for Frame and Participation Time (men only)
Tablt C-zi. ANOVA Summary of Swing Time during Running for 81 Frame and Participation Time (men only)
Table C-23. ANOVA Summary of Trunk Angle during Running 82 for Frame and Participation Time (men only)
Table C-2A. ANOVA Summary of Stride Length during Sinning for 83 Gender, Frame, and Participation Time
"'able G-25, ANOVA Summary of Stride Rate during Running for 8'» Gender, Frame, and Participation Time
Table C-26. ANOVA Summary of Swing Time during Running for 85 Gender, Frame, and Participation Time
Table C-2/. ANOVA Summary of Single Leg Contact Time during 86 Running for Gender, Frame, and Participation Time
Table C-28. ANOVA Summary of Trunk Angle during Running for 87 Gender, Frame, and Participation Time
Table C-29. ANOVA Summary for Cumulative Linear Hip Motion 88 During Running
Table C-30. ANOVA Summary for Cumulative Angular Displacement 88 of the Trunk during Running
Table C-31. ANOVA Summary for Cumulative. Relative Linear Motion 89 of the Backpack during Running
■ i i

*
LIST OF TABLES (continued)
Table C-32. MOV A Suamary for Cumulative Relative Angular Motion of the Backpack during Running
Table C-33. ANOVA Summary for Maximum Hip £ngle during Running
Table C~34. ANOVA Summary for Minimum Hip Angle during Running
Table C-35. ANCVA Summary for Maximum Knee Angle during Running
Table C-36. ANOVA ftu&na&ry for Minimum Knse Angle during Running
Table C-37. ANOVA Sumuary of CPY. for Gender, Frame and Participation Time
Table C-38. ANOVA Sunnnary of CPY for Gender, Frame, and Participation Time
Table G-39. ANOVA Summary of CPT for Gender, Frame and Participation Time
Table C-4(/. ANOVA Summary for Subjective Evaluations after the Performance Tests
Table C-41. ANOVA Summary for Subjective. Evaluations after Treadmill Walking
Table C-42. ANOVA Summary for Subjective Evaluation», after Treadmill Running
Table C-43. ANOVA Summary for Subjective Evaluations after Easy Standing
Page
89
90
90
91
91
92
93
94
95
95
96
96
i i »mil rt**J

Effects of Gender, Frame Length, and Participation Time on Load Carrying Behavior
INTRODUCTION
During the last few years, the U.S. Army Natick Research and Development Laboratories have funded research to evaluate the current Army load carrying system, the All-Purpose Lightweight Individual Carrying Equipment (ALICE), and other personal load-carrying systems through the application of biomechanical techniques. To date, however, there has been no biomechanical research which has examined the influence of backpack frame length on load carrying behavior. The ALICE load carrying system uses a standard frame which is 20 inches (50.8 cm) long and is not adjustable to fit the particular body dimensions of the load-carrier.
The .ALICE system was developed for and tested on military men. Thus, it was this population that was addressed when determining the most appropriate frame length for the system. Since the ALICE load carrying system was adopted for use in 1973, however, the role of women in the military has been greatly expanded. Because the body size of females is generally smaller than that of males, the range of body sizes for the entire military population has been expanded. This may suggest that a single frame size may not be appropriate for the entire population. Consequently, the major emphasis of this project was to examine the effect of backpack frame length on physical performance. More specifically, it was the: purpose of this project to determine if a single frame length is adequate for both males and females of the military population and, if so, whether the standard 20-inch frame is the most appropriate length.
EXPERIMENTAL PROCEDURES
m
Subjects
in order to fully examine the backpack frame length question, a series of four experimental tests were used. These four test series, which will be described in detail later in this report, included anthropometry measures, physical performance tests, walking and running gait analyses, and easy standing stability measures. A subject pool of twenty males and twenty females was developed for the project. For eac'u of the tests, a subset of this subject pool was used which meant that the characteristics of the sample under investigation varied slightly from test to test. The twenty men and twenty women who formed the subject pool were all students in the Army R.O.T.C. Program at The Pennsylvania State University. Because of thäir interest in the research and their experience in the military, these subjects were considered to be highly motivated and ideally suited foi the research project. In addition, it was felt that the subjects < ave only their best efforts throughout the testing.
The means and standard deviation values for four variables which describe in part the physical characteristics of the sample subjects are presented in Table 1. The results of statistical comparisons of the male and female subjects for these variables are also included. These results show that the males were significantly greater in stature (X diff. * 9.6 cm), weight (X diff. = 10.0 kg), and waist back length (X diff. =2.9 cm), and had a significantly smaller proportion of body fat (X diff. - 4.1%) than the female subjects. The difference between the men and wou>en in waist back length is particularly important since this immediately suggests that a single backpack frame length may not be appropriate for both sexes.
11
«*J

Table 1
Physical Characteristics of the Sample Subjects
Men (N - ■ 20)
i S.D.
177.1 4.8
71.3 7.5
17.3 4.0
46.8 2.3
Women (N - 20)
X S.D. t
Stature (cm)
Body Weight (kg)
Body Fat (%)
Waist Back Length (cm)
167.5 5.2 6.09*
61.3 8.2 4.00*
21.4 4.3 5.36*
43.9 2.1 4.11*
* P < 0.05
Table 2 contains mean and standard deviation values for height and weight for both the sample subjects and for the Array population. These values were used to assess the degree of similarity between the sample and the population. The population data for the men came from the results published by White and Churchill, while those data for the women were taken from the work of Churchill, Churchill, McConville, and White. A simple t-test was used to make statistical comparisons between the sample and population data. The t-values have also been included in Table 2.
The results of these comparisons showed that the men of_the project sample were slightly taller (X diff. - 2.6 cm) and lighter (X diff. * 0.9 kg) than the men of the Army population. Both of these differences, however, were not statistically significant indicating that the average body size of tne sample men was similar to that of the population. The comparisons of the sample and population data for women showed that the sample women were taller (X diff. - 4.5 cm) and somewhat heavier (X diff. - 1.3 kg) than the population women. The difference in weight was found to be nonsignificant, but the difference in stature was significant at the 0.05 level. While this stature difference was not considered to be an exceptionally large one, it
^fhite, R.M. and E. Churchill. The Body Size of Soldiers: US Army Anthropo- metry - 1966 (Tech. Rep. 72-51-CE). Natick, Mass: US Army Natick Laboratories,
December 1971.
2Churchiil, E., T. Churchill, J.T. McConville and R.M. White. Anthropometry of Women in the US Army - 1977: Report No. 2 - The Basic Univariate Statistics (Tech. Rep. NATICX/TR-77/Ö24). Natick, Mass: US Army Natick Research and Development Command, Jwis 1977.
12

does suggest that the women of the sample deviate slightly from the average body size of the female military population.
A more detailed discussion of the anthropometric characteristics of the sample subjects will be presented later as the results of a series of anthropometric measures are discussed. In addition, mean and standard devia- tion values for height, weight, and percent body fat for each of the subsets of the subject pool will be presented in the description of the four experi- mental test series. It should be noted that no attempt was made to compare each of the sample subsets with the military population.
Table 2
Comparison of Sample Subjects with Military Personnel
P «tf ect Sample Array Population
N X S.D. N X S.D. t
Men
Stature (cm) 20 177.1 4.8 6682 174.5 6.6 1.77
Body Weight (kg) 20 71.3 7.5 6677 72.2 10.6 0.41
Women
Stature (cm) 20 167.5 5.2 1331 163.0 6.3 3.08*
Body Weight (kg) 20 61.3 8.2 1331 60.0 8.7 0.68
P < 0.05
Frame Conditions
Each subject completed the physical performance, walking and running, and the easy standing test sessions using four different backpack frame lengths. These four frame lengths consisted of the standard twenty inch frame (20), a personalized frame size (P), a frame two inches shorter than the personalized frame (P-2), and a frame two inches longer than the personalized frame (P+2). The personalized frame size for each subject was directly related to the waist back length* measure obtained during the anthropometric test session. In order to establish a criterion to be used in determining the personalized frame size, a limited number of male and female subjects tried various frame sizes. Based on their subjective feelings of comfort and the point at which the lower back strap of the frames made contact with the lower back or pelvic region of the body, it was determined that a correction factor of 1.25 inches (3.18 cm)
*The waist back length measure was defined to be the distance from the first cervicale to the level of the umbilicus following the contour of the back. It will be discussed in more detail later in this report when the anthropometric measures are explained and the results of these measures are presented.
13
•s.
mam

should be added to the waist back length measure. Rounded to the nearest inch, the sum of these two values was then used as the personalized frame length. The P-2 and P+2 frame sizes allowed for comparisons of frames, which in general could be considered to be too short or too long, with the standard 20-inch frame and the P frame which was considered to be ideally fitted to the individual. Table 3 contains mean and standard deviation values for the P, P-2, and P+2 frame lengths for the male and female sample subjects. As can be seen, the mean value for the P condition for the men was quite close to 20 inches which is the standard frame length currently in use. In fact, for ten of the twenty male subjects, the P frame was determined to be 20 inches. This situation may have reduced the magnitude of any differences between the 20 and the P conditions for the men. However, this result in itself may suggest that the 20-inch frame is the appropriate length for many men. A similar but less pronounced situation waB found for the P+2 condition for the women. In this case, seven of the twenty female subjects used a 20-inch frame as the P+2 frame. Appendix A contains the values for waist back length, the predicted personalized frame lengths, and the assigned personalized frame length (from rounding to the nearest inch) for each subject.
Table 3
Average Frame Lengths (in inches), for the P, P-2, and P+2 Conditions
Frame
Men Women
X S.D.
P
P-2
P+2
19.70 0.86
17.70 0.86
21.70 0.86
18.55 1.00
16.55 1.00
20.55 1.00
Throughout the testing of each subject, the only modification of the load carrying system that was made was the change in frame size. Frames were available in one inch increments in length beginning at 13 inches (33.02 cm) and continuing up to 23 inches (58.42 cm). Figure 1 shows four of these frame sizes. The frames were identical in construction with the exception of the length differences. The order in which each subject used the four frame lengths was randomly determined so as to eliminate any effects related to ordering.
Two field packs, one with a carrying capacity of approximately 32 kg and the other with a capacity of approximately 23 kg, were developed as part of the ALICE load carrying system. Either pack can be used on the frame. The pack with the lesser capacity, which weighs 1.10 kg, was chosen for this study. It was loaded
14

»* *1.
,; g<
a» en r-i OJ rQ tfl O r-t *J •H nj CO > fH «Ü
0 w o
^3 ^ 4-1 H-i 00 0 T3 (U CD H -H
M 0) CO I > M cn . U-l <U CO s •u ^5 3 Ö * o n <u B) Pn B R« <i> . M !•< a • <-> < CO ^ Ü •° ^ •H
d d 4J ►d <i) CO o > Ö 01 CO ••-' . H -H 1 ' cy ,c 0)
£5 ö a) o •3 H 4J «H a
•H •W <U 0 w C/3
3 a) H XI d H o o o d
Pü UH «H
5
15
H« tt4

with Army clothing and equipment items totalling 9.07 kg. The load consisted of a cold weather sleepiv z bag, a pneumatic mattress, a rain poncho, socks, an undershirt, and a waterproof clothes bag. This single load was used throughout the testing. The combined weight of the frame, pack, and pack load was approximately 12 kg. The subjects wore underwear, socks, utility shirt and trousers, combat boots, a PASGT helmet, and the fighting gear components of the ALICE system. They also carried a simulated M-16 rifle. The fighting gear included a water-filled canteen with its cover, an intrenching tool and carrier, and two small arms ammo cases containing 1.75-kg sandbags. The total weight of the fighting gear was 6.65 kg. The weight born by the subjects, including all clothing and equipment, was approximately 26 kg.
Testing Protocol
In order to provide a complete description of the physical characteristics of the subjects and to adequately examine the influence of backpack frame length on performance, four series of tests were used in this project. These included anthropometric measures in which sixteen body measures were taken; physical performance tests which included an agility run, ladder climb, and reaction movement test; cinematographical analysis of walking and running gaits on a treadmill; and an easy standing stability test performed on an instrumented force platform. Each of these test series is described in detail below.
Anthropometric Measures
The body size and dimensions of all subjects were estimated using a series of sixteen anthropometric measures. These included stature, body weight, percent body t^t, waist back lengths cervicale height, shoulder height, crotch height, waist height, buttock height, sitting height, shoulder circumference, chest circumference at scye, chest/bust circumference, waist circumference, hip circumference, and interscye breadth. With the exception of waist back length and percent body fat calculation, all measures were performed in accordance with the measurement definitions provided in the 1966 and 1977 reports on the anthropometry of U.S. Army men and women (ref. 1 and 2). This allowed for a more detailed examination of the representativeness of the sample subjects with respect to the military population than was provided earlier in this report. For waist back length, the 1966 and 1977 reports provide different definitions of this measure for males and females. In this study, waist back length was similarly defined for both men and women and was considered to be the distance along the surface of the back from the 7th cervical vertebra to the level of the waist as indicated by the level of the navel. This definition differs slightly from those used in 1966 and 1977 and may have influenced the statistical comparisons of waist back length measures of this study with those from the 1966 and 1977 reports. Howiver, it was felt that the definition used in this study more precisely defined the measure than the somewhat nebulous definitions used in the 1966 and 1977 studies. Since the 1966 and 1977 anthropometry reports do not include measures of percent body fat, the calculation of body fat was performed using the formula of Allen et al.3 This formula is based on a knowledge of body weight, ten skinfold
Allen, T.H., M.T. Peng, K.P. Chen, T.F. Huang, and H.S. Fang. Prediction of total adiposity from skinfolds and the curvilinear relationship between external and internal adiposity. Metabolism 5:346-352, 1956.
16

thickness measurements, and body surface area. The definitions and the measurement procedures for each of the sixteen anthropometric measures are presented in Appendix B of this report.
The equipment used in obtaining the anthropometric measures consisted of a medical scale for body weight, an anthropometer for the various measures of height and the interscye breadth measure, and a steel tape for the waist back length and the fi.e circumference measures. The skinfold measures were taken using Lange Skinfold Calipers. Three separate measurements of each anthro- pometric variable were taken. An average of these three measurements represented the reported value for each variable for each subject. In the case of percent body fat, the average of each of the skinfold measures was used in the calcula- tion of percent fat.
Physical Performance Tests
The test movements selected for use in this project represent a subset of those tests used in a previous study on the effects of gender and load on per- formance reported by Nelson and Martin.^ These included an agility run, a reaction movement test, and a ladder climb. All of the experimental movements were performed in the Armory Building on the Penn State campus. Each of these tests is described as follows:
Agility Run. A series of four padded circular obstacles 106.7 cm high with a diameter of 20.3 cm was placed 304.8 cm apart with the first located 304.8 cm from the starting line. Each subject initiated a trial upon their own volition. As the subjects left the starting line, they broke a beam of a photocell system which started an electronic timing unit. All subjects were instructed to pass on the right side of the first obstacle, to weave through the remaining obstacles, passing around the last obstacle, and then to weave through the obstacles on the return to the starting area. The timer was stopped when the subjects broke the beam of the photocell system a second time as they passed through the starting area on the return. Two trials were com- pleted by each subject.
Reaction Movement Test. The reaction movement test required the subject to respond to a directional light signal by turning either to the right or left and sprinting 4.6 m. Each performed four trials, two to the right and two to the left. The subject initially assumed a ready position straddling a line which was midway between two sets of photocells placed 9.1m apart, and facing the directional light signal unit. For each trial, the subject was given a "ready" command shortly before the light stimulus was presented. An electronic timer was started when the light came on and stopped as the subject broke the beam of the photocell system on either the right or left side. To avoid anticipation, the length of time between the ready signal and the light stimulus was varied. In addition, the right and left trials were randomly mixed.
■i
*Nelson, R.C. and P.E. Martin. Volume I. Effects of Gender and Load on Combative Movement Performance (Tech. Rep. NATICK/TR-82/011). Natick, Massachusetts: US Army Natick Research and Development Laboratories, February 1982.
% 17 i
I i i

Ladder Climb. A vertical ladder 5.5m high with rungs 57.2 cm wide and 30.5 cm apart was constructed for this test. Subjects assumed a starting position in which the left foot was placed on the first rung of the ladder and the right foot held down a foot switch. The subjects were allowed to position their hands in a manner which was comfortable to them. They started upon their own volition and, by releasing the foot switch, triggered an elect- ronic timing unit. They were instructed to climb up the ladder as quickly as possible with an alternating step technique, which assured that foot contact was made with each rung. The ladder was instrumented with a photocell system such that the timer was stopped when the subject's foot broke a beam at the level of the ninth rung (304.8 cm level). Two trials were performed.
For each of these tests t-.he performance score used in the statistical analyses was the mean of the two trials. In addition, the reaction movement test was treated as two separate tests as the movements to the right and to the left were considered separately in the data analysis.
The subset of the total sample pool that completed all aspects of the physicr.l performance tests consisted of nineteen males and eighteen females. Because only three subjects of the sample pool were unable to complete the performance tests, the average physical characteristics of this subsample were nearly identical to those of the total sample. The physical characteris- tics of stature, weight, percent body fat, and waist back length are shown in Table 4 and can be compared with those values for the total sample in Table 1.
Table 4
Physical Characteristics of the Subjects Completing the Physical Performance Tests
Men (n - 19)
X S.D,
Stature (cm) 177.0 4.9
Body Weight (kg) 71.3 7.7
Percent Body Fat (%) 17.7 3.7
Waist Back Length (cm) 46.7 2.4
Women (n - 18)
X S.D.
167.3 5.5
60.1 7.8
20.8 4.1
43.7 2.2
Walking and Running Gait Analyses
Because a foot soldier may spend a significant amount of time walking or running, it is important to have some knowledge as to how the mechanics of the gait cycle are altered due to various configurations of the load carrying
18

system. Previous work by Martin and Nelson^ examined the differences in gait between males and females and the influence of different load carrying systems and different load weights on the mechanics of walking at 6.4 km/hr. In addition, Nelson, Clarke, and Hinrichs^ examined the influence of gender, body size, and load carrying system on various aspects of the ground reaction force patterns during walking at 4.8 km/hr and running at 8,0 km/hr. Neither study, however, looked at how frame length might influence the patterns of gait.
Standard high speed cinematography procedures were used to film each sub- ject as they walked at 4.8 km/hr or ran at 8.0 km/hr on a motor-driven tread- mill. A single Locam camera manufactured by Redlake Corporation was used and a planar analysis was comp] ted since it was assumed that the body motions occurred primarily in a single plane during locomotion. For the walking trials, a camera speed of 40 frames per second was used and, for the running, the camera speed was 60 frames per second. A timing unit manufactured in the Penn State Bio- mechanics Laboratory was placed in the field of view so that the camera speed could be calibrated. Reference markers were also placed in the field of view to identify the subject and trial condition. In addition, special markers were placed on several critical body locations so as to facilitate the digitizing of the films. Markers were located over estimates of the joint centers for the ankle, knee, hip, and shoulder joints. In addition, two markers were placed on the pack so that the relative motion of the pack with respect to the body could be assessed. Figures 2 and 3 show the experimental setup used for the filming of the walking and running gaits.
In addition to manipulating the frame length used in the load carrying system, it was also possible to sample the subjects' performance more than one time during their walk or run to see if their mechanics changed as a function of time. For the 4.8 km/hr walking trials, this was accomplished by having the subjects walk on the treadmill for eighteen minutes. During this eighteen-minute walk, each subject was filmed three times - at the four-, eleven-, and eighteen-minute points. Since most of the subjects had never walked or run on a treadmill before, it was felt that the four minutes from the initiation of the trial until the first filming would allow the subjects to adapt to the treadmill and assume a normal gait pattern. Each subject was also given a short orientation to the treadmill which included mounting the treadmill, a brief walk, and dismounting the treadmill prior to the first walking trial.
A similar protocol was used in the filming of the 8.0 km/hr running trials except that the subjects' time on the treadmill was reduced because of the greater demands of these trials. The men were filmed three times during a
Martin, P.E. and R.C. Nelson. Volume III. Effects of Gender, Load, and Backpack on the Temporal and Kinematic Characteristics of Walking Gait (Tech. Rep. NATICK/ TR-82/021). Natick, Massachusetts: US Army Natick Research and Development Laboratories, April 1982.
Nelson, R.C, T.E. Clarke, and R.N. Einrichs. An Investigation into the Bioroechanics of Load Carrying; The Effects of Gender, Body Size, and Backpack on Load Carrying Behavior. Natick, Massachusettsi US Army Natick Research and Development Laboratories, in preparation.
19

Figure 2. Subject performing treadmill walking . Note the markers placed on the body and pack to facilitate analysis of the cine films.
20

N ~
Figure 3.
-------- -
Test area and the filming setup for treadmill walking and running .

five-minute run, while the women were filmed twice during a three-minute run. For the men, these film periods occurred at the end of the first, third, and fifth minutes, whereas the women were filmed at the end of the first and third minutes. The shorter run time for the females was established because it was found that many of the women subjects had great difficulty in completing a five-minute run or could not complete such a run at all. While the walking trials did not prove to be particularly fatiguing for either the male or female subjects, in general, the demand of the running trials was great enough to fatigue both sexes. Because of this fatigue factor and because the running trials were completed after the walking trials, no special period of adaptation was built into the running protocol as it was in the walking. This was not considered to be a major limitation.
In all, each subject completed a total of eight trials on the treadmill, four walking and four running. In other words, one trial was performed for each frame condition used in each of the two modes of gait. These trials were arranged such that each subject performed two trials during a test day. The time in between these two trials varied somewhat depending on the physical condition of the subject, but was never less than fifteen minutes. The testing was performed such that all walking data was collected before any running data was collected. Consequently, no subject performed both treadmill walking and running during a single test day. The testing schedule was typically arranged so that two people were scheduled together for a walking test session and three people were together for a running test session. For the walking, one subject was performing a trial as the other was resting. This meant there was approximately a twenty-minute interval between trials for most subjects. For the running, one subject performed a trial as the other two subjects rested. Consequently, there was approximately fifteen minutes between running trials for most subjects. When more time for rest was needed between running trials, it was allowed. This rest time, however, was never longer than thirty minutes. It should again be noted that the order of presentation of the frame sizes was randomized for each subject for both the walking and running trials.
The films were analyzed using a Vanguard projection system with a Bendix digitizer. This system provided on-line data recording capabilities on the laboratory computer, a Digital Equipment Corporation PDP 11/34 mini-computer. Each of the filming periods was kept as brief as possible to keep the film footage to a minimum but typically was long enough to capture two complete step cycles. However, because of the large amount of digitizing required, only a single step cycle was examined. This meant that two strides were analyzed for each condition which provided two measures of each variable examined in the statistical analysis.
Two types of film analyses were performed on both the walking and running trials for this project. The first, which was discontinuous in nature, pro- vided values for six variables which described important temporal and kine- matic characteristics of the gait. These values were obtained by digitizing the locations of the four markers on the body at several critical body posi- tions during the gait cycle. These positions, which included the positions of contact of the right heel, removal of the left toe from contact, contact of the left heel, and lifting of the right toe from contact for both strides, served to subdivide the stride so that measures of the six variables could be obtained. The following definitions are provided.

Stride length in meters was measured as the distance from the point of one heel strike to the point of the next heel str:
2. Stride rate was calculated by measuring the stride time which was the time between two heel strikes, and then taking the reciprocal of the stride time. Stride rate was then represented as the number of strides completed per second.
3. Single leg contact time was measured as the time from heel strike of one leg until the foot of the same leg left the ground to begin the swing phase.
4. Double support time was the time during which both feet were in contact with the ground. This was the time from heel contact of one leg until the foot of the other leg left the ground.
5. Swing time was the time of non-support for one leg and was measured from a point when the foot of one leg left the ground until heel strike of the same leg.
6. Trunk angle was a measure of the forward inclination of the trunk at a point when the foot of one leg left the ground. The angle measured was that between the horizontal and a line connect- ing the shoulder joint and the hip joint such that a greater forward inclination of the trunk resulted in a smaller value for the angle.
The double support time variable was not included in the analysis of the 8.0 km/hr running trials since the subjects were at a point of transition between walking and running. This meant that, in some subjects, there was no double support time but a very short time in which neither foot was in contact with the treadmill. On the other hand, some subjects maintained a very short double support time and, consequently, always had at least one foot in contact with the treadmill.
The second type of film analysis that was performed in this project was one which was continuous in nature since every frame of film for one step cycle was digitized rather than a few specific positions during the cycle. For this analysis, the two markers on the pack were digitized in addition to the four markers on the body so that a total of six markers were examined. Using these coordinates, values for a number of variables were determined. These variables are defined as follows:
1. Cumulative vertical motion of the hip joint was a measure of the change in the vertical position of the hip joint for a total cycle. This measure provided an estimate of the change in the vertical position of the center of mass of the carrier- backpack system.
2. Cumulative angular displacement of the trunk was measured as the change in the angular position of the trunk over the course of a total step cycle. For this measure, the trunk angle was the angle between the vertical and the line connecting the shoulder and hip coordinates.

3. Cumulative relative linear motion of _the backpack was measured as the change in the position of the inferior marker on the backpack rel-itive to the location of the hip marker for one cycle of motion. The measure represented relative linear motion in both the horizontal and vertical directions,
4. Cumulative relative angular motion of the backpack was a measure of the change in the angular position of the backpack relative to the angular position of the trunk. This backpack angle was calculated as the angle between the vertical and the lit>e connect- ing the two markers on the backpack.
5. Maximum and minimum angles of the hip and knee joints were the maximum and minimum values for the angular position of these two joints during one cycle. These angles were measured in the manner shown in Figure 4. This was identical to the way in which these angles were calculated in Nelson, Clarke, and Hinrichs (ref. 6).
In addition to these variables, angle-angle diagrams were used to examine possible changes in the coordinated actions of the hip and knee joints due to frame length changes. Such diagrams were first proposed by Grieve? in 1969 and were used by Nelson et al. (ref. 6) in their analysis of lower limb kine- matics. Because a continuous analysis such as was used in this project requires a tremendous amount of digitizing and time to complete, this aspect of the cine film analysis was limited to two frame lengths rather than the complete group of four. It was felt that the most appropriate comparisons for the purposes of this project would be those between the standard 20-inch frame and the personalized frame (P). In addition, the number of subjects examined was limited to eight men and nine women. This sample size was reduced because only those subjects who had different frame lengths for the 20 and P frame conditions were selected.
In all, three different groups of subjects were used for the walking and running analyses. For the discontinuous type of analysis of the temporal and kinematic characteristics of the walking cycle, nineteen men and sixteen women from the sample pool served as subjects. Their physical characteristics are shown in Table 5. The group of subjects which was examined in the discontinuous type of analysis of. the 8.0 km/hr running consisted of fifteen men and fifteen women. Table 6 contains the means and standard deviations of the variables highlighting the physical characteristics of this subject group. As was noted above, the continuous type of analysis of the walking and running gaits was limited to eight men and nine women. The average physical character- istics of this group are shown in Table 7. The mean values for each of the variables for the three groups are all quite similar to those values for the total sample shown in Table 1.
Grieve, D.W. "The Assessment of Gait." Physiotherapy, pp. 452-460, November i969.
24
.*■——■ ii «■Mm«—ami

ANGLE 1 V"
ANGLE 2
Knee ANGLE 3
Ankle
Hip Angle = (angle 2)-(ingle 1)
Knee Angle = (angle 2)-(angle 3)
F'^ure A. Construction of hip and knee angles from coordinate point information obtained from cine film.
25
■ i t i

Table 5
Physical Characteristics of the Subjects for the Temporal-Kinematic Analysis of Walking
Men (n » 19) Women (n - 16)
S.D S.D
Stature (cm) 176.8 4.7 167.9 5.3
Body Weight (kg) 70.A 6.6 61.3 8.5
Percent Body Fat (%) 17.2 4.1 22.2 3.6
Waist Back Length (cm) 46.5 2.1 43.9 2.1
26

Table 6
Physical Characteristics of the Subjects for the Temporal-Kinematic Analysis of Running
Men (n - 15) Women (n ■ 15)
S.D. S.D.
Stature (cm) 176.6
Body Weight (kg) 70.1
Percent Body Fat (%) 17.3
Waist Back Langth (cm) 46.3
5.1 167.4 5.2
7.7 61.4 9.0
4.3 22.2 3.7
2.6 44.1 2.3
Table 7
Physical Characteristics of the Subjects for the Continuous Analyses of Walking and Running
Men (n " 8 ) Women (n » 9)
K S.D. S.D
: r i r i •"
Stature (cm) 174.4
Body Weight (kg) 67.9
Percftut Body Fat (%) 18.4
Waisr Back Length (cm) 45.6
27
4.1 166.1 5.8
6.2 59.1 7.7
3.6 22.2 2.4
3.0 43.3 1.6
II ll I II m*

Easy Standing Stability Test
This test was used as a measure of the postural stability of the subjects under the four different frame length conditions. In general, the equipment used and the procedures followed during the data collection were quite similar to those in previous research by Nelson% Clarke, and Hinrichs
8 and Nelson and Martin.9 The experimental set up utilized the laboratory Klstler model 9261A force platform connected on-line to the lab PDP 11/34 minicomputer. Using this system, the migration cf the center of pressure, which is the point of intersection of the subject's line of gravity and the surface of the force platform, was sampled at a frequency of 50 Hz for a ten second period. As was done for the cinematographical analysis of walking and running, more than one sampling period was used during each trial. Thus, the protocol for collecting data for any given trial was as follows: The subject was instructed to step onto the platform, assume a self-determined, comfortable stance, and then remain as motionless as possible for a three minute period. A trial was initiated when the experimenter felt that the subject had settled into a comfortable and quiet standing position. In all, three ten second samples were collected during this three minute period. The first and third samples were taken during the first ten seconds and the last ten seconds of the trial. The second or intermediate sample was collected at the halfway point of the trial. This sample was started at one minute and 25 seconds into the trial and again lasted for ten seconds.
The experimental variables that were calculated from the center of pressure data were the accumulated absolute displacements in the anterior- posterior direction (denoted as CPX), in the medial-lateral direction (CPY), and the vectoral sum of these two (CPT) which reflected the total excursion of the center of pressure. These variables are the same as those used by Nelson et al. (ref. 8) and Nelson and Martin (ref. 9) to describe stability during quiet standing.
The subjects that completed this portion of the project consisted of 18 men and 17 women. Table 8 contains the means and standard deviations for the physical characteristics of this group of subjects. By comparing these values with those in Table 1 for the entire sample of 20 men and 20 women, it can be seen that the physical characteristics of this subset of subjects are almost identical to those for the total sample.
Subjective Evaluation of Backpack-Frame Comfort
It was felt that one of the most important questions related to the frame length issue that was in need of answer was how the load-carrying system felt to the subjects during their participation in each of the various test series. This required a method that would allow for an assessment of the
Q Nelson, R.C., T.E. Clarke, and R„N. Hinrichs. An Investigation into the Biomechanics of Load Carrying: General References and Procedures. Natick, Massachusetts: US Army Natick Research and Development Laboratories, in preparation.
o Nelson, R.C. and P.E. Martin. Volume II. Effects of Gender, Load, and Backpack on Easy Standing and Vertical Jump Performance (Tech. Rep. NATICK/TR-82/016). Natick, Massachusetts: US Army Natick Research and Development Laboratories, March 1982.
28
mm

"L
subjective evaluations of each of the four frame conditions. This was done by developing a simple rating system in which the subjects were asked to rate each backpack-frame system on comfort and to give their overall impression of the system.
Table 8
Physical Characteristics of the Subjects for Easy Standing
Men (n-18) Women (n-17)
X S.D. X S.D.
Stature (cm) 176.5 A.6 167.9 5.1
Body Weight (kg) 71.2 7.9 62.0 8.7
Percent Body Fat (%) 17.3 4.3 22.4 3.5
Waist Back Length (cm) 46.8 2.4 44.2 2.1
Prior to the collection of any data, subjects were informed that they would be asked to rate each load carrying system immediately following each test session or series of trials in which a single frame condition was used. The rating form asked for an evaluation of the comfort in the region of the neck and shoulders, of the comfort in the region of the hips where the padded back strap made contact with the body, and of the overall impression of the comfort of the system. For each of these three areas, the subjects were provided with a five-point rating scale that ranged from a rating of very poor to one of excellent. They were asked to check the rating which best indicated their subjective feelings about the comfort of the pack. A sample rating form is shown in Figure 5.
In order to analyze these ratings, the rating scale was converted from one ranging from very poor to excellent to a numerical scale ranging from one to five. A rating of very poor was given a value of one whereas a rating of excellent was given the value of five. A single rating score was then calculated for each frame condition for each subject by simply summing the values for the three ratings. As an example, a subject rated the three features of the backpack-frame system following completion of the performance tests with the standard 20-inch frame as follows: average, good, and average (see Figure 5). This meant that the individual numerical ratings were 3, 4, and 3, respectively, and that the single rating score for this condition was 10. This process was repeated such that each subject had a single rating score for each of the four frame conditions for the following test series: the physical performance tests, treadmill walking, treadmill running, and easy standing. These values were then statistically analyzed to determine if any significant trends were present in the data.
29
in ' ' ■llll^^MÜI

In summary» while the issue of comfort is an important one when evaluating the frame length question, it was not a major emphasis of this project. Rather, it was considered as supplementary information which would provide a more complete understanding of how changes in frame length affect subject performance. While the rating form lacked sophistication, it was felt that it was adequate for its role in this project and that lc would provide meaningful information to support the other forms of testing.
Please rate this frame-pack system on comfort and your overall impression using the rating scale provided.
Subjective evaluation
FEATURE Very Poor Poor Average Good Excellent
1. Comfort in region of neck and shoulders
X
2. Comfort in hip region X
3. Overall impression X
Figure 5. The rating form used in the assessment of the subjective evalua- tions of the four backpack-frame conditions. Shown on the form is a sample rating by one c abject.
Statistical Procedures
Several statistical procedures were used to analyze the data collected in this project. For the comparisons of the sample men versus the sample women with respect to selected anthropometric characteristics, a standard independent t-test for the difference between two sample means was used. When comparing the anthropometric characteristics of the sample subjects with those of the Army population as represented by the 1966 and 1977 anthropometric surveys noted previously (ref. 1 and 2), the same independent _t-test formulation was used. It was felt that this was more appropriate than using a tatest for the difference between a sample mean and a population mean since the military data truly represent a large sample and not a population.
The majority of the statistical analyses performed in this project involved the use of analysis of variance (ANOVA) procedures. The program ANOVR, originally greeted by Gordon F. Pitz of Southern Illinois University
30
and modified by Dr. Paul A. Games10 of The Pennsylvania State University, was used to analyze the data from the performance, walking, running, and easy standing testing. A conventional analysis of variance logic was used to assess the results of the ANOVR outputs. Follow-up analyses using the Tukey Wholly Significant Difference (WSD) test were performed to determine where mean differences existed when significant F-values were obtained in the ANOVR procedures.
RESULTS
Anthropometry
An independent tatest for the difference between two sample means was used to determine how the physical characteristics of the sample subjects compared with the military population as indicated by the 1966 and 1977 reports of the anthropometry of Army men and women (ref. 1 and 2). Means and standard deviations for each of the sixteen anthropometric variables for the men and for Army personnel are shown in Table 9 along with the t-test results. The same information for the women is contained in Table 10.
Of the sixteen variables for which measures were taken on the sample men, only thirteen could be compared with the military data. This was because the 1966 report on the anthropometry of military men (ref. 1) did not include data for percent body fat, buttock height, and chest circumference at F,cye. Of the thirteen variables for which comparisons were made, only three showed significant _t-values for the differences between sample and population means. The sample men demonstrated significantly greater waist back length (X diff. - 1.7 cm), cervicale height (X diff. - 2.8 cm), and interscye breadth (X diff. -2.8 cm) than the military subjects. As was noted earlier in this report, the sample men were slightly taller (2.6 cm), but were also slightly lighter (0.9 kg), than the military men. Although these latter two differences were not significant, the combination of these results suggests that the sample men might have been of a slightly leaner, more mesomorphic body type than the military personnel represented in the 1966 report (ref. 1). The differences in body type, however, were quite small and, in general, the sample men were cuLxsi'lert d to be representative of the population to which results were to be e?:tr/,ipol£ued.
10 Games, P.A., G.S. Gray, W.L. Herron, A. Pentz, and G.F. Pitz. Analysis of Variance with Repeated Measures. University Park, PA: The Pennsylvania State University Computation Center, June 1979.
31
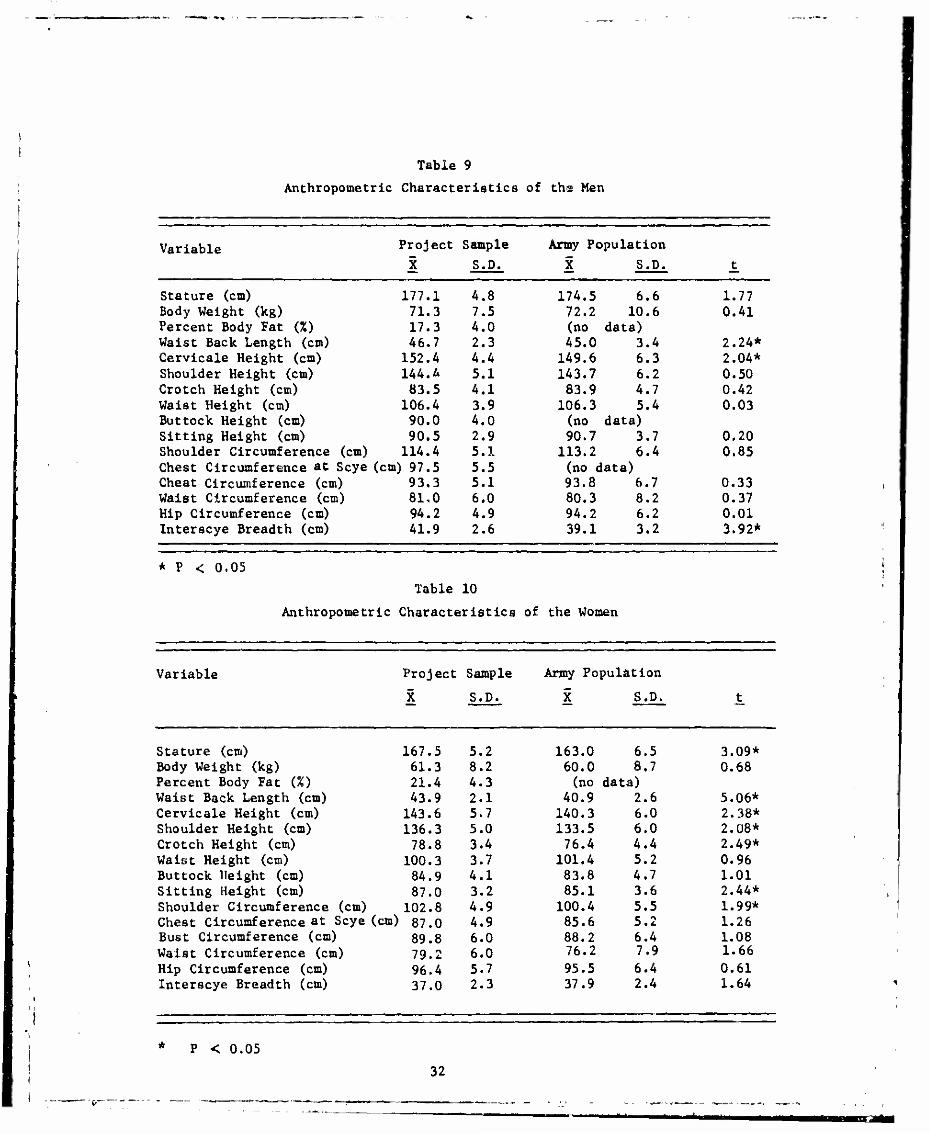
Table 9
Anthropometric Characteristics of ths Men
Variable Project Sample Army Population
X S.D. X S.D. t —* —■ — —"
Stature (cm) 177.1 4.8 174.5 6.6 1.77 Body Weight (kg) 71.3 7.5 72.2 10.6 0.41 Percent Body Fat (%) 17.3 4.0 (no data) Waist Back Length (cm) A6.7 2.3 45.0 3.4 2.24* Cervicale Height (cm) 152.A 4.4 149.6 6.3 2.04* Shoulder Height (cm) 144. A 5.1 143.7 6.2 0.50 Crotch Height (cm) 83.5 4.1 83.9 4.7 0.42 Waist Height (cm) 106.4 3.9 106.3 5.4 0.03 Buttock Height (cm) 90.0 4.0 (no data) Sitting Height (cm) 90.5 2.9 90.7 3.7 0,20 Shoulder Circumference (cm) 114.4 5.1 113.2 6.4 0.85 Chest Circumference at Scye (cm) 97.5 5.5 (no data) Chest Circumference (cm) 93.3 5.1 93.8 6.7 0.33 Waist Circumference (cm) 81,0 6.0 80.3 8.2 0.37 Hip Circumference (cm) 94.2 4.9 94.2 6.2 0.01 Interscye Breadth (cm) 41.9 2.6 39.1 3.2 3.92*
* P < 0.05
Table 10
Anthropometric Characteristics of the Women
Variable Project Sample Army Population
X S.D. X S.D. t
Stature (cm) 167.5 5.2 163.0 6.5 3.09* Body Weight (kg) 61.3 8.2 60.0 8.7 0.68 Percent Body Fat (%) 21.4 4.3 (no data) Waist Back Length (cm) 43.9 2.1 40.9 2.6 5.06* Cervicale Height (cm) 143.6 5.7 140.3 6.0 2.38* Shoulder Height (cm) 136.3 5.0 133.5 6.0 2.08* Crotch Height (cm) 78.8 3.4 76.4 4.4 2.49* Waist Height (cm) 100.3 3.7 101.4 5.2 0.96 Buttock Height (cm) 84.9 4.1 83.8 4.7 1.01 Sitting Height (cm) 87.0 3.2 85.1 3.6 2.44* Shoulder Circumference (cm) 102.8 4.9 100.4 5.5 1.99* Chest Circumference at Scye (cm) 87.0 4.9 85.6 5.2 1.26 Bust Circumference (cm) 89.8 6.0 88.2 6.4 1.08 Waist Circumference (cm) 79.2 6.0 76.2 7.9 1.66 Hip Circumference (cm) 96.4 5.7 95.5 6.4 0.61 Interscye Breadth (cm) 37.0 2.3 37.9 2.4 1.64
P < 0.05
32

For the women, it was possible to compare mean values for fifteen of the sixteen anthropometric variables measured on the sample subjects with those values from the 1977 report on the anthropometry of Army women (ref. 2). Again no data were available for percent body fat for the military population. Of the fifteen variables for which comparisons were made, significant differences were found for seven. The sample women were greater in stature (X diff. - 4.5 cm), waist back length_(X diff. - 3.0 cm), cervicale height (X diff. - 3.3 cm), shoulder height {X diff. - 2.8 cm), crotch height (X diff. - 3.0 cm), sitting height (X diff. - 1.9 cm), and shoulder circumference (X diff. - 2.4 cm) than the military women. With the exception of shoulder circumference, the differences between the sample and population seem to be closely tied to the difference in height. In general, then, the sample women tended to be somewhat larger than women of the military as represented by the subjects of the 1977 anthropometry survey (ref. 2). Although the differences between sample and Army population are not exception- ally large, these differences should be kept in mind when extending the results of this study to the general population of Army women.
Physical Performance Tests
A Two-Way Analysis of Variance (ANOVA) test with main effects of Gender and Frame Length and their interaction was applied to the performance data for each of the four tests. The mean of two trials for each of the four frame lengths was used in the statistical analysis. A conventional ANOVA logic was used to assess the results. By this logic, the interaction was examined first. The lack of a significant interaction indicated the effect of one factor was the same from level to level of the second factor. Con- sequently, the main effects sufficiently described the results of the analysis. With a significant interaction, however, an examination of the main effects no longer provided an adequate representation of the trends of the data and so a more complete internal analysis was performed. Because of an a priori interest in the main effects of Gender and Frame Length, they were examined and reported even when a significant interaction existed.
The mean values and the statistical results for the four performance tests are presented in tabular form in the discussion that follows. In all of the tables presenting the statistical results, mean values which are not connected by a vertical or a horizontal line are significantly different at the 0.05 level and those which are connected are not statistically different. When the interaction was not significant, follow-up examinations of the mean values were performed only for the main effect means, not for the individual cell means. These cell means are always included, however, for completeness. All of the ANOVA summary tables appear in Appendix C.
Agility Run. Table 11 contains the mean values for the agility run. The ANOVA results indicated there was no significant interaction between Gender and Frame Length, but the main effects for both Gender (F » 59.1) and Frame (F s 3.1) were significant. The men had significantly better (shorter) times for the agility run than the women. This difference was such that the average time for the men was 14% better than that for the women. For frame length, the results revealed that only the mean difference between condition P-2 and P+2 was significant. The P-2 condition resulted in the poorest performance while the 20, P, and P+2 conditions were all quite similar.
33

Table 11
Gender and Frame Means for Agility Run (aec.)
Gender N 20
Frame Condition
P P-2 P+2 Sex X
Male 19 7.86 7.89 7.92 7.78 7.86
Female 18 9.27 9.22 9.49 9,30 9.32
Frame X 37 8.54 8.54 8.68 8.52
Reaction Movement Right and Left. The results for the reaction movement to the right and to the left are shown in Tables 12 and 13, respectively. The results for these two tests were nearly identical. For both of the test movements, the ANOVA results showed that the F-ratios for the interaction were not significant There were also no significant differences in reaction movement performance among the four frame conditions. The differences between the average male and female performances for both tests, however, were significant (F's • 57.2 and 59.3). While the mean values for the four frame lengths were nearly identical to one another, the average performance for the men was approximately 13% better than that for the females.
Table 12
Gender and Frame Means for Reaction Movement Right (sec.)
Frame Condition
Gender N 20 P P-2 P+2 Gender X
Ma. 19 1.90 1.90 1.90 J..88 1.89
Female 18 2.19 2.19 2.20 2.17 2.19
Frame X 37 2.04 2.04 2.04 2.02
Table 13
Gender and Frame Means for Reaction Movement Left (sec.)
Frame Condition
Gender N 20 P P-2 P+2 Gender X
Male 19 1.88 1.88 1.90 1.89 1.89
Female 18 2.16 2.15 2.17 2.16 2.16
Frame X 37 2.02 2.01 2.03 2.02
34

Ladder Climb. The results of the analysis of ladder climb performance are shown in Table 14. Once again the Gender Frame Condition interaction was not significant. The results further showed that there was not a signi- ficant Frame effect although performance was somewhat better under the P condition than under the other three frame lengths. The main effect for Gender was significant (F-36.1) indicating that the men's performance was better than that of the women. While the differences between the sexes for the other three performance tests were approximately 13 to 142, the difference between the men and women for the ladder climb was far greater as the male performance exceeded that of the females by 44%.
Table 14
Gender and Frame Means for Ladder Climb (sec.)
Gender 20
Frame Condition
P P-2 P+2 Gender X
Male 19 3.28 3.22 3.29 3.18 3.24
Female 18 5.86 5.55 5.94 6.01 5.84
Frame X 37 4.54 4.36 4.58 4.56
Discontinuous Analysis of Treadmill Walking
A Three-Way Analysis of Variance test with main effects of Gender, Frame Condition, and Participation Time (corresponding to the times that samples of subject performance were taken) and their interactions was applied to the data obtained from the discontinuous type of analysis of the films of walk- ing gait. An extension of the conventional ANOVA logic used for a Two-Way ANOVA was applied to the statistical data to assess the results. Because of the large number of cell means from this design, only the main effect means are presented here unless a significant interaction was present. If an interaction was found, then selected cell means are presented in graphical
form.
Stride Length and Stride Rate. Because of the close relationship of theae"~tvo variables and the similarity of the trends found for them, their statistical results will be presented together. Table 15 contains the main means for stride length and stride rate. None of the interactions among the three main effects for either variable were significant nor was the main effect of Frame Condition. The main effects for Gender (F's - 10.4 and 10.8) and Participation Time (F's - 11.3 and 10.4), however, were statistically significant. The results showed that the men had greater stride lengths and smaller stride rates than the women. This inverse relationship between length and rate of striding is always present when stride velocity is held constant as it was in this study by means of a constant treadmill speed. The results also showed that stride length and rate for the first sampling Period (T^) differed from the lengths and rates found for the second (Til) and third (T18) samples. For the first sample, the stride length tended to be slightly shorter and the stride rate greater than the estimates of these variables for the
35
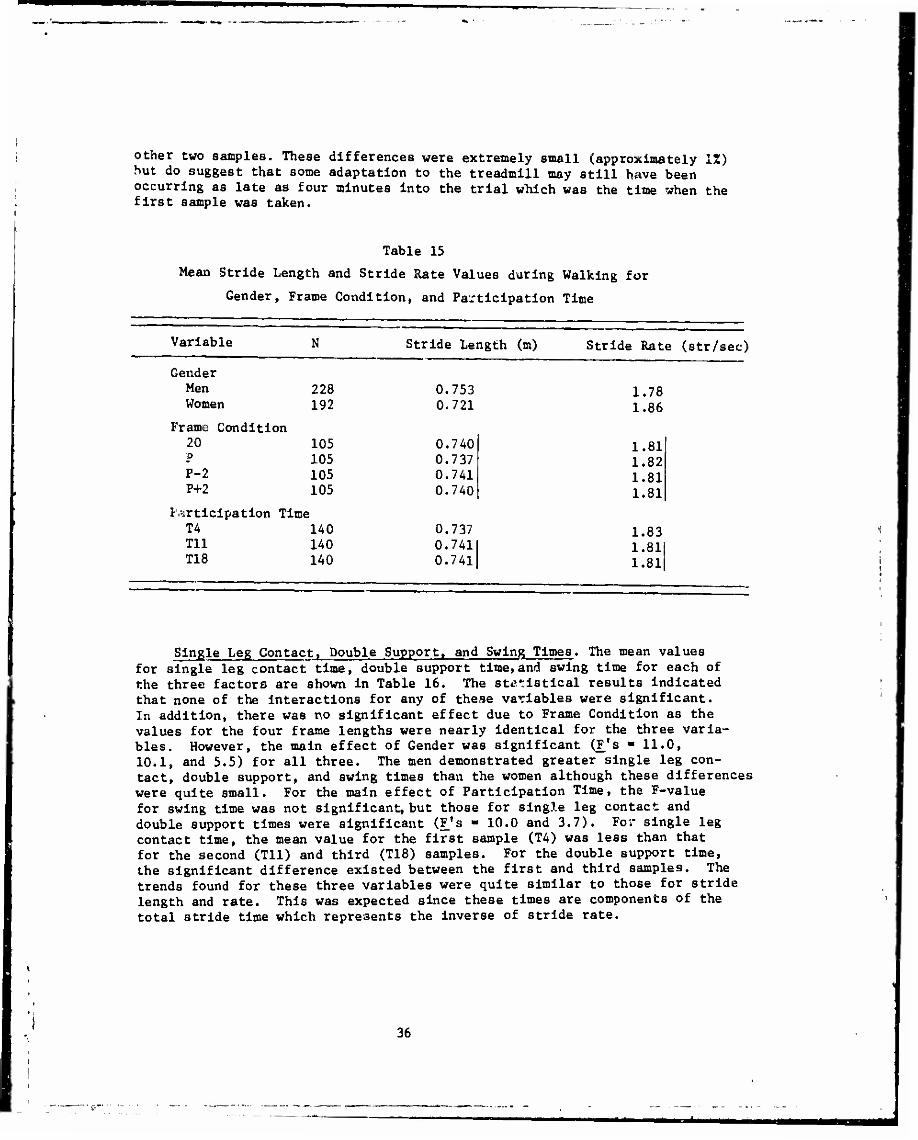
other two samples. These differences were extremely small (approximately IX) hut do suggest that some adaptation to the treadmill may still have been occurring as late as four minutes into the trial which was the time when the first sample was taken.
Table 15
Mean Stride Length and Stride Rate Values during Walking for
Gender, Frame Condition, and Participation Time
Variable N
Gender Men 228 Women 192
Frame Condition 20 105 p 105 P-2 105 P+2 105
Participation Time T4 140 Til 140 T18 140
Stride Length (m) Stride Rate (str/sec)
0.753 0.721
0 740 0 737 0 741 0 740
0.737 0.741 0.741
1.78 1.86
1.81 1.82 1.81 1.81
1.83 1.81 1.81
Single Leg Contact« Double Support, and Swing Times. The mean values for single leg contact time, double support time,and swing time for each of the three factors are shown in Table 16. The statistical results indicated that none of the interactions for any of these variables were significant. In addition, there was no significant effect due to Frame Condition as the values for the four frame lengths were nearly identical for the three varia- bles. However, the main effect of Gender was significant (F's - 11.0, 10.1, and 5.5) for all three. The men demonstrated greater single leg con- tact, double support, and swing times than the women although these differences were quite small. For the main effect of Participation Time, the F-value for swing time was not significant, but those for single leg contact and double support times were significant (F's - 10.0 and 3.7). For single leg contact time, the mean value for the first sample (T4) was less than that for the second (Til) and third (T18) samples. For the double support time, the significant difference existed between the first and third samples. The trends found for these three variables were quite similar to those for stride length and rate. This was expected since these times are components of the total stride time which represents the inverse of stride rate.
36
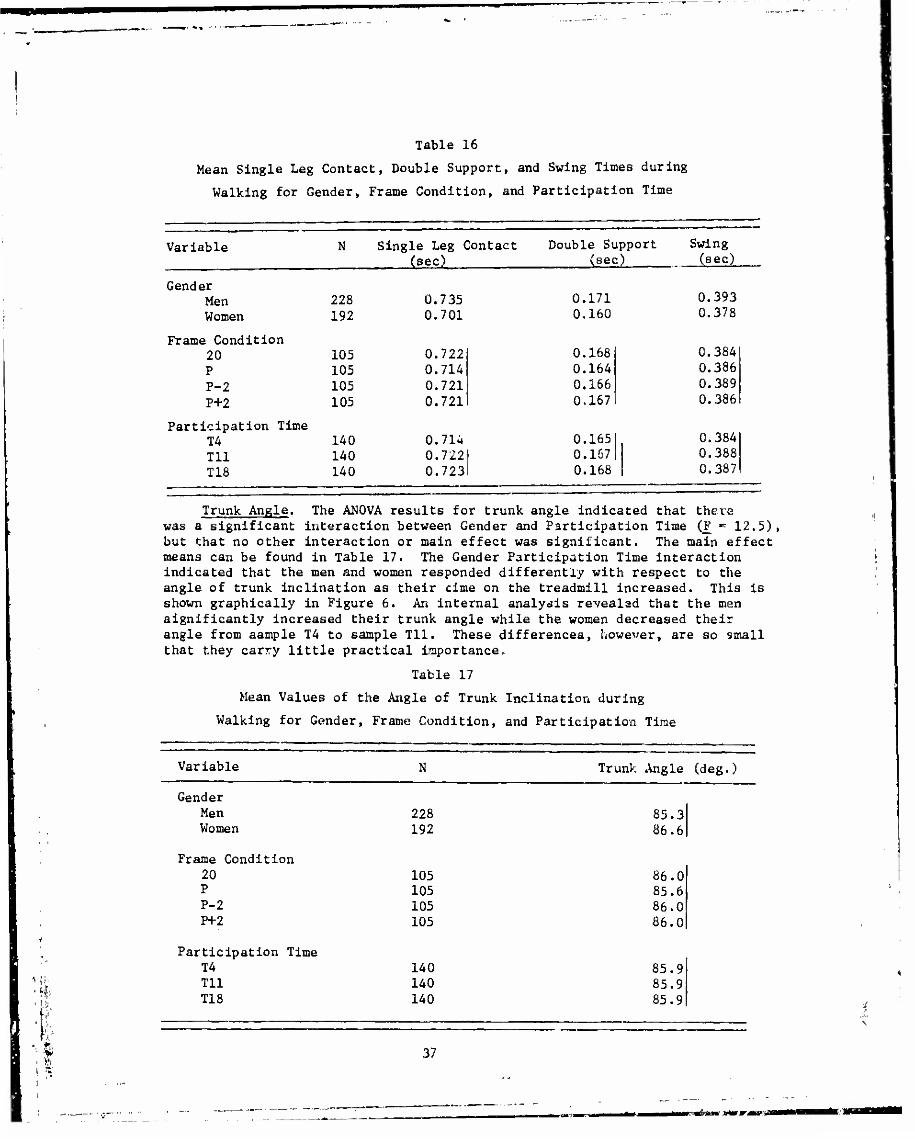
Table 16
Mean Single Leg Contact, Double Support, and Swing Times during
Walking for Gender, Frame Condition, and Participation Time
Variable Single Leg Contact (sec)
Double Support Swing (sec)
Gender Men 228 Women 192
Frame Condition 20 105 P 105 P-2 105 P+2 105
Participation Time T4 140 Til 140 T18 140
0.735 0.701
0.722 0.714 0.721 0.721
0.714 0.722 0.723
0.171 0.160
0.168 0.164 0.166 0.167
0.165 0.167 0.168
0.393 0.378
0.384 0.386 0.389 0.386
0.384 0.388 0.387
Trunk Angle. The ANOVA results for trunk angle indicated that there was a significant interaction between Gender and Participation Time (F ■* 12.5), but that no other interaction or main effect was significant. The main effect means can be found in Table 17. The Gender Participation Time interaction indicated that the men and women responded differently with respect to the angle of trunk inclination as their cime on the treadmill increased. This is shown graphically in Figure 6. An internal analysis revealed that the men significantly increased their trunk angle while the women decreased their angle from sample T4 to sample Til. These differences, however, are so small that they carry little practical importance.
Table 17
Mean Values of the Angle of Trunk Inclination during
Walking for Gender, Frame Condition, and Participation Time
Variable N Trunk Angle (deg.)
•ft
Gender Men 228 Women 192
Frame Condition 20 105 P 105 P-2 105 P+2 105
Participation Time T4 140 Til 140 T18 140
85.3 86.6
86.0 85.6 86.0 86.0
85.9 85.9 85.9
37
rrWn«M' trtWMvi

ÜJ D
, j
O z
z 84
o MEN
o WOMEN
=;^r
1 1 18
PARTICIPAT
Figure 6. Plot of the simple main means for trunk angle demonstrating the Gender-Time interaction.
Continuous Analysis of Treadmill Walking
For the continuous analysis of walking gait, only a single sample period, the intermediate or Til sample, was examined. Consequently, the effect of Participation Time was eliminated from this portion of the analysis and a Two-Way Analysis of Variance design was used. Therefore, only the main effects of Gender and Frame Condition and their interaction were examined in this part of the study» In addition, the extent of the frame length analysis was limited to two conditions, the 20 and the P frames. Because very few significant re- sults were found for the variables selected for use in the continuous analysis, the results for all of these variables will be presented together. The mean values for the main effects and for the individual cells have been tabulated
f o r e a c h va r i ab 1 e.
The ANOVA results for six of the eight variables used in this portion of the analysis showed no significant Gender Frame interaction and no signi- ficant main effects of Gender or Frame. These six variables were the cumula- tive vertical motion of the hip, cumulative angular displacement of the trunk, cumulative relative linear motion of the backpack, cumulative relative angular motion of the backpack, maximum hip angle, and minimum knee angle. The only two variables which showed significant F-ratios were minimum hip angle and maximum knee angle. For both of these variables, there was no significant interaction and no significant effect due to Frame, but there was a signifi- cant difference between the men and women. For minimum hip angle, the women
38

had a larger minimum angle than the men. This meant that they achieved a greater degree of hyperextension of the hip during the walking cycle. The men tended to have a greater value for the maximum knee angle than the women. This indicated that the men attained a greater degree of knee flexion during the step cycle. Tables 18 to 25 contain the mean values for the eight variables examined in the continuous analysis of walking.
Table 18
Gender and Frame Means of Cumulative Vertical
Motion of the Hip for Walking (m)
Frame Condition
Gender N 20 P Gender X
Men 8 0.193 0.188 0.190 Women 9 0.184 0.196 0.190 Frame X 17 0.188 0.192
Table 19
Gender and Frame Means of Cumulative Angular
Displacement of the Trunk during Walking (deg)
Frame Condition
Gender 11 20 P
Men 8 14.6 14.4
Women 9 15.2 15.0
Frame X 1/ 14.9 14.7
Gender X
14.5
11/.1
Table 20
Gender and Frame Means of Cumulative Relative Linear
Motion of the Backpack during Walking (m)
Gender
Men
Women
Frame X
N
8
9
17
Frame Condition
20 P
0.066
0.073
0.070
0.069
0.070
0.070
Gender X
0.067
0.072
,'.;■;■!.
39
' lull

Gender
Table 21
Gender and Frame Means of Cumulative Relative
Angular Motion of the Backpack during Walking (deg)
Frame Condition
N 20 P Gender X
Men 8 12.0 11.3
Women 9 11.8 11.7
Frame X 17 11.9 11.5
11.6
11.7
Table 22
Gender and Frame Means of Maximum Hip
Angle during Walking (deg)
Frame Condition
Gender N 20 P Gender X
Men 8 34.1 35.2 34.7
Women 9 31.9 31.0 31.5
Frame X 17 33.0 33.0
Tabl-j 23
Gender and Frame Means of Minimum
Hip Angle during Walking (deg)
Frame Condition
Gender N 20 P Gender X
Men 8 -9.4 -7.8 -8.6
Women 9 -14.9 -14.3 -14.6
Frame X 17 -12.3 -11.3
40

Table 24
Gender and Frame Means of Maximum Knee
___^ M ■ "
Frame Condition
Gender N 20 P Gender X
Men 8 72.1 72.1 72.1
Women 9 65.7 65.9 65.8
Frame X 17 68.7 68.8
Table 25
Gender and Frame Means of Minimum Knee
Angle during Walking (deg)
Frame Condition
Gender N 20 P Gender X
Men 8 4.1 4.3 4.2
Women 9 1.7 3.4 2.5
Frame X 17 2.8 3.8
r .., , . . ^__
r-
Since there were significant results for two of the four variables related to the hip and knee angular patterns over the course of a step cycle, Figure 7 contains an angle-angle diagram comparing the hip-knee patterns for the men and women. This diagram highlights the differences between the sexes for the minimum hip and maximum knee angles.
Discontinuous Analysis of Treadmill Running
Both Two-Way and Three-Way ANOVA designs were used in this portion of the analysis due to the slight differences that existed in the testing proto- cols for men and women. Because only two samples were taken during the running trials of the women, the Three-Way ANOVA contained only two levels of the Participation Time factor rather than three as were used in the walking. The Two-Way ANOVA design was used to assess possible trends in the men's data only. This made it possible to examine all three samples which were collected for the men during their running trials. Consequently, the Three-Way ANOVA examined the main effects of Gender, Frame Condition, and Participation Time and their interactions while the Two-Way ANOVA eliminated the Gender factor. The results of the Two-Way ANOVA will be presented first followed by the Three-Way ANOVA results.
■\ .►'■
41

HIP ANGLE (DEG)
-40
EXTENSION
# MEN
O WOM
FLEXION
■80
KNEE ANGLE (DEG)
EXTENSIO
FLEXION
i
Figure 7. Hip-knee angle-angle diagram comparing the average men's and women'8 lower extremity angular patterns.
42
■ i «fai

Effect of Frame Condition and Participation Time for the Men. The results of the Two-Way ANOVA can be summarized rather briefly since only one signifi- cant result was found for the five variables used to describe the running ßait. There were no significant interactions or main effects for stride length, stride rate, single leg contact time, or swing time. The only significant re- c 'It was found for trunk angle. While the Frame Condition Participation Time 1 teraction and the main effect of Frame were not significant, the Participation Time main effect was significant (F = 8.4). The follow-up analysis revealed that the trunk angle was slightly greater for the first sample (Tl) than for the second and third samples (T3 and T5). However, this difference was so small that it could have little practical significance. The mean values for all of the variables will be presented with the presentation of the results of the Three-Way ANOVA.
Effect of Gender, Frame Condition, and Participation Time. Once again there were few significant results for this analysis of running gait. There were no significant interactions or main effects for stride length, stride rate, and swing time. The main mean values for these three variables are shown in Table 26. For single leg contact time, only the Gender Frame Condi- tion interaction was significant (F = 3.5). All other interactions and the three main effects were nonsignificant. Figure 8 presents the appropriate cell means in graphic form to demonstrate the interaction of Gender and Frame Condition. The follow-up analysis of these means indicated that the men had a greater single leg contact time than the women,but only under the 20-inch frame condition. The main means for single leg contact time can be found in Table 27. The results for the only remaining variable, trunk angle, re- vealed there were no significant interactions and no significant main effects due to Gender and Frame Conditions. The main effect for Participation Time proved to be the only significant result for this variable as the trunk angle was greater or more upright during sample one (Tl) than during sample two (T3). Trunk angle mean values are shown in Table 27 along with those for single leg contact time.
\
! <
( ■■ i ^—«^a——■wrtia
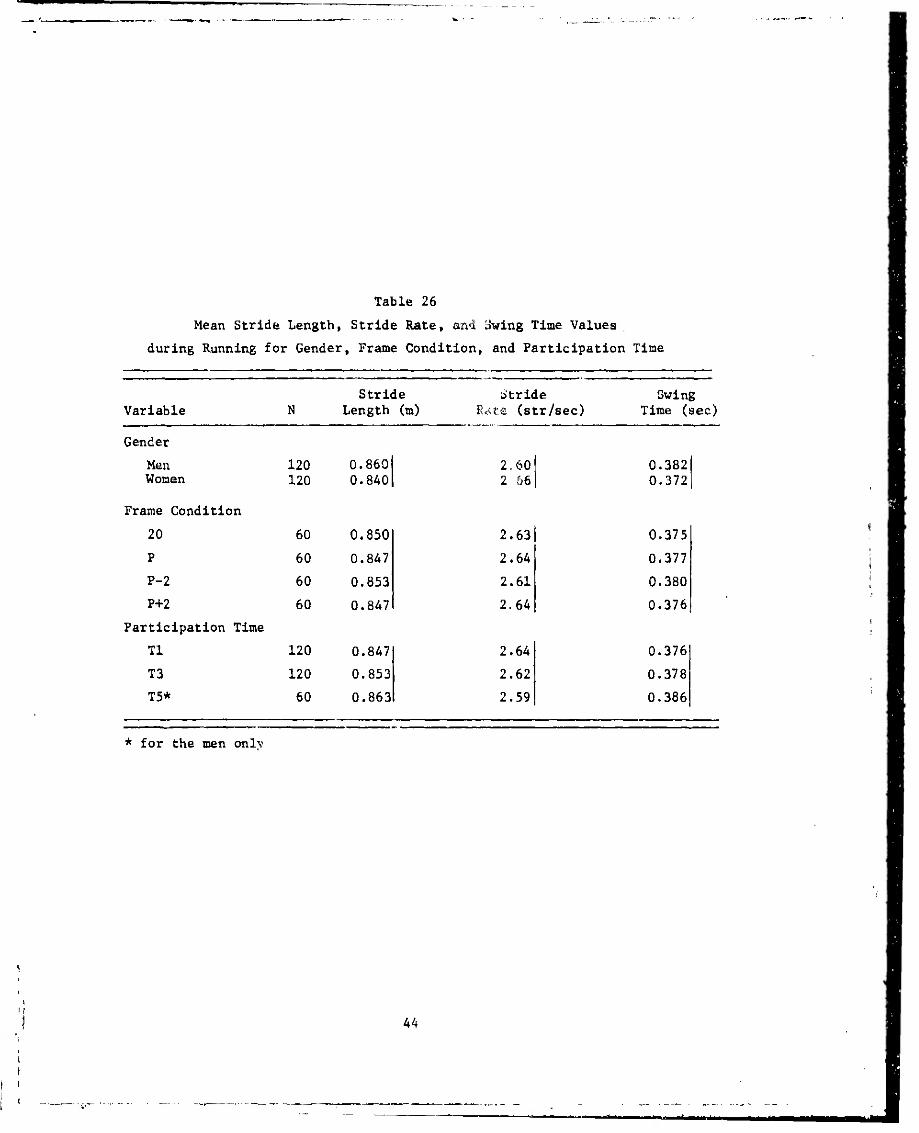
Table 26
Mean Stride Length, Stride Rate, and awing Time Values
during Running for Gender, Frame Condition, and Participation Time
Stride Stride Swing Variable N Length (m) Rrftfi (str/sec) Time (sec)
Gender
Men 120 0.860 2.60 0.382 Women 120 0.840 2 56 0.372
Frame Condition
20 60 0.850 2.63 0.375
P 60 0.847 2.64 0.377
P-2 60 0.853 2.61 0.380
P+2 60 0.847 2.64 0.376
Participation Time
Tl 120 0.847 2.64 0.376
T3 120 0.853 2.62 0.378
T5* 60 0.863 2.59 0.386
_
* for the men onlv
44
ft*

Table 27
Mean Single Leg Contact and Trunk Angle Values during
Running for Gender, Frame Condition, and Participation Time
Variable N Single
Contact Leg (sec)
Trunk Angle (deg)
Gender
Men 120 0.391 79.3
Women 120 0.383 80.0
Frame Condition
20 60 0.387 80.0
P 60 0.384 79.2
P-2 60 0.391 79.6
P+2 60 0.386 79.8
Participation Time
Tl 120 0.387 80.1
T3 120 0.387 79.2
T5* 60 0.389 78.7
* for the men only
1 \>
H u < )- 7 *"-■"
o o o UJ o w
UJ -1 UJ 2 UJ H- -J o <n
0.40-1
0.39-
0.38-
t T^-
20 P-2 T 1 P P+2
• MEN
o WOMEN
FRAME CONDITION Figure 8. Plot of the simple main means for the single leg contact
time demonstrating the Gender-Frame interaction.
45
iv;

Continuous Analysis of Treadmill Running
As was done for the continuous analysis of walking gait» a Two-Way ANOVA with main effects of Gender and Frame Condition and their interaction was used to examine the selected variables of running. The Participation Time factor was removed since only the second, or T3, sample data w»re used. In addition, the conditions of frame length were limited to the 20 and P lengthe. Consequently, the ANOVA design was identical to that used in the continuous analysis of walking. Since very few significant results were found among the eight variables of interest, the results of all eight will be presented together. Individual cell and main effect means will be pre- sented in tabular form along with the discussion of the results.
Of the eight variables under investigation, only two demonstrated significant results. Those variables for which no significant interactions and no significant main effects were found included cumulative vertical motion of the hip, cumulative relative linear motion of the backpack, maxi- mum and minimum hip angles, and maximum and minimum knee angles. The two variables which did have significant effects were the cumulative angular displacement of the trunk and the cumulative relative angular displacement of the backpack. The mean values for the eight variables can be found in Tables 28 to 35.
The results for the cumulative angular displacement of the trunk showed a lack of a significant interaction between Gender and Frame but significant main effects for both of these factors (F's ■ 8,3 and 5.0). Based on the trends of the data, the women demonstrated a greater amount of trunk motion than the men, and there was greater motion under the P frame condition than for the 20-inch condition (see Table 29). The results for the cumulative relative angular motion of the backpack showed a significant effect due to Frame (F ■» 14.5), but no significant interaction or Gender effect. For this variable, there was greater motion for the 20-inch frame than for the P frame (see Table 31). It is felt that the more backpack motion relative to the body that is present, the larger the detrimental effect on efficient movement mechanics since this additional movement must ultimately be con- trolled by the body and, therefore, may require greater energy expenditure.
Table 28
Gender and Frame Means of Cumulative Vertical Motion
of the Hip during Running (m)
Frame Condition
Gender N 20 P
Men 8 0.270 0.281
Women 9 0.251 0.237
Frame X 17 0.260 0.258
Gender X
0.276
0.244
46

Table 29
Gender and Frame Means of Cumulative Angular
Displacement of the Trunk during Running (deg)
Frame Condition
Gender N 20 P Gender X
Men 8 13.4 14.4 13.9
Women 9 16.2 18.6 17.4
Frame X 17 14.9 16.6
Table 30 Gender and Frame Means of Cumulative Relative Linear
Motion of the Backpack during Running (m)
Gender N
Frame Condition
20 P Gender X
Men 8 0.164 0.165 0.165
Women 9 0.132 0.134 0.133
Frame X 17 0.147 0.149
Table 31
Gender and Frame Means of Cumulative Relative
Angular Motion of the Backpack during Running (deg)
Gender N
Frame Condition
20 P Gender X
Men 8 24.2 19.7
Women 9 25.4 18.6
Frame X 17 25.1 19.1
22.2
22.0
IK, ,-V '
47
in i—i« K3H
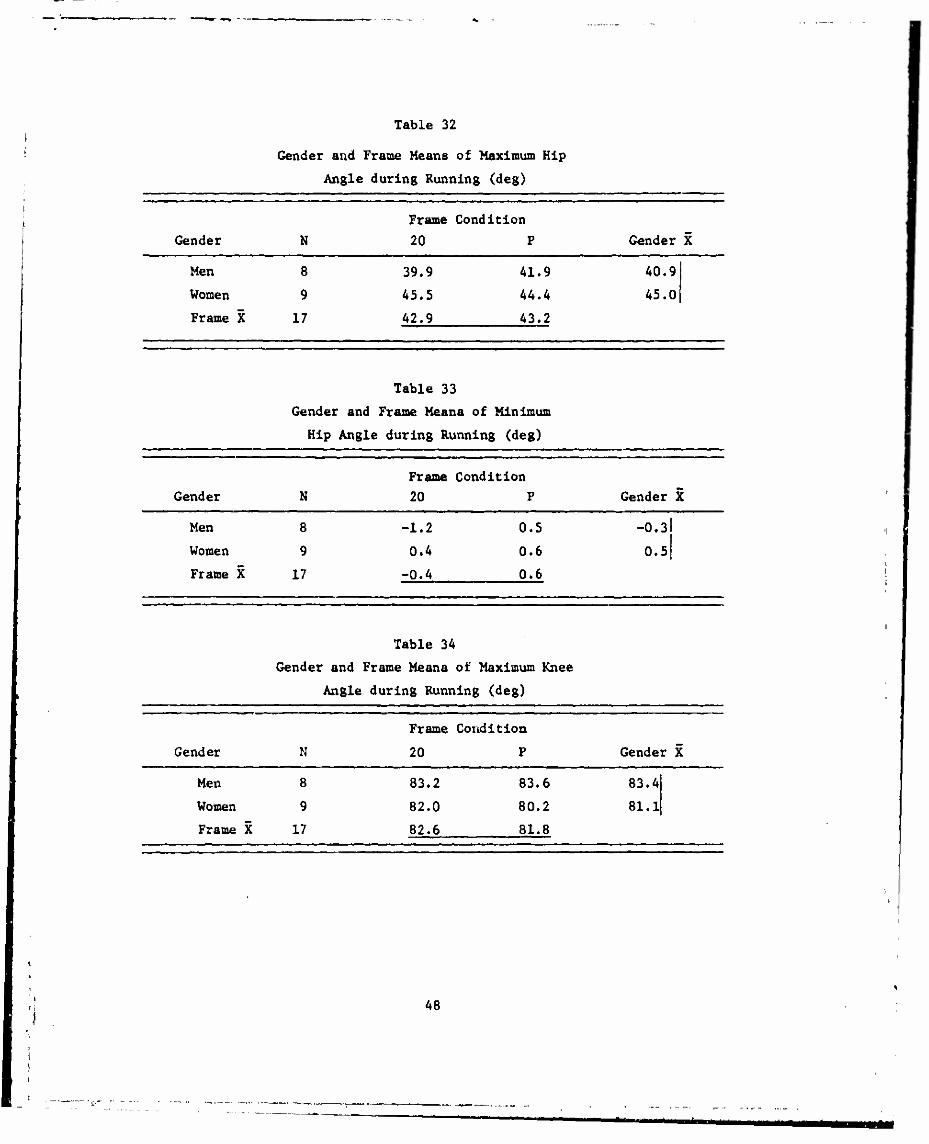
Table 32
Gender and Frame Means of Maximum Hip
Angle during Running (deg)
Frame Condition
Gender N 20 P Gender X
Men 8 39.9 41.9 40.9
Women 9 45.5 44.4 45.0
Frame X 17 42.9 43.2
Table 33
Gender and Frame Means of Minimum
Hip Angle during Running (deg)
Gender N Frame Condition
20 P Gender X
Men 8 -1.2 0.5
Women 9 0.4 0.6
Frame X 17 -0.4 0.6
-0.3
0.5
Table 34
Gender and Frame Means of Maximum Knee
Angle during Running (deg)
Gender N
Frame Condition
20 P Gender X
Men 8 83.2 83.6 83.4
Women 9 82.0 80.2 81.1
Frame X 17 82.6 81.8
48

Table 35
Gender and Frame Means of Minimum Knee
Angle during Running (deg)
Frame Condition
Gender N 20 P Gender X
Men 8 17.6 16.9 17.2
Women 9 18.8 18.8 18.8
Frame X 17 18.2 17.9
Easy Standing Stability Test
A Three-Way ANOVA design with main effects of Gender, Frame Condition, and Participation Time and their interactions was applied to the stability measures obtained from the force platform during easy standing. Three variables which defined the total center of pressure migration (CPT) and the migration in medial-lateral (CPY) and anterior-posterior (CPX) directions were the dependent measures in the analysis.
The main effect mean values and the statistical results for each of these variables are shown in Table 36. These results demonstrate that the only significant differences present for any of the variables was due to the Participation Time factor (F's - 83.6, 61.2, and 85.3). There were no significant interactions and no significant main effects due to Gender and Frame. For CPX, CPY, and CPT, the results indicated that the subjects were less stable during the first sampling period (TO) than during the second (T1.5) and third (T3) samples. It should be recalled that a trial was initiated with the first sampling period and that this sampling period was triggered when the experimenter felt that the subject had assumed a comfortable and quiet standing position. These results clearly suggest that the subjects were still making minor adjustments when the first sample was taken. It is perhaps more important in this case to note that there was no significant difference between the second and third samples for any of the three variables indicating that a relatively short trial period of three minutes has little effect on stability.
49
mm

Table 36
Mean CPX, CFY, and CPT Values during Easy Standing
for Gender, Frame Condition, and Participation Time
Variable N CPX (cm) CPY (cm) CPT (cm)
Gender
Men 216 6.80
Women 204 6.75
Frame Condition
20 105 6.70
P 105 6.91
P-2 105 6.76
P+2 105 6.73
Participa tion Time
TO 140 8.56
T1.5 140 5.80
T3 140 5.97
4.05 8.73
4.22 8.79
4.12 8.65
4.24 8.96
3.94 8.60
4.23 8.82
5.97 11.61
3.16 7.24
3.26 7.43
Subjective Assessment of Backpack-Frame Comfort
The ratings of the subjects for each of the frame conditions were submitted to a Two-Way AN0VA. These ratings were provided at the end of each testing session such that data were obtained for the following tests: performance, walking, running, and easy standing. The ratings gave additional insight into the influence that the various frame conditions had on male and female performance.
For the four tests for which ratings were collected, there were no significant Gender Frame interactions and no significant Gender effects. In addition, there was no significant effect due to Frame Condition for the performance tests. For the three remaining tests, however, the Frame factor did produce significant results (F's ■ 11.9, 5.7, and 13.3 for walking, running, and easy standing). The follow-up analyses indicated that of the four frame conditions examined, significantly poorer ratings were given for the P-2 frame than for the other three. These results are highlighted in Table 37 which contains the main mean values of Gender and Frame for the four tests.
50
m

Table 37
Mean Subjective Ratings of Comfort for Gender and Frame
Variable Performance
Tests Walking Easy
Running Standing
Gender
Men 9.86 9.34 9.73 9.31
Women 9.35 9.11 9.93 9.56
Frame Condition
20 9.16 10.09 10.17 10.23
P 10.19 9.57 10.40 9.91
P-2 9.49 7.31J 8.53 7.60i
P+2 9.62 9.97J 10.23 9.97|
51
•t«*
DISCUSSION AND RECOMMENDATIONS
The purpose of this project was to determine the influence of different frame sizes on performance for several different types of tests. The tests included a series of performance test movements, treadmill walking and run- ning, and an easy standing stability measure. Additionally, a series of anthropometric measures weie taken to fully describe the physical characteris- tics of the subjects and to compare the subjects with Army personnel. These t^ats were selected because, collectively, they require a wide range of skills and because they simulate a number of activities that a foot soldier may have to perform. The study was also designed so that the performances of men and women could be examined and so that any influence of continued participation over time could be detected. In addition, it was possible to determine if any of these three factors interacted with one another. Because the current and only frame size used in conjunction with the present load carrying system is 20 inched, a specific purpose of this study was to determine if a single frame size is adequate for both men and women and, if so, whether this 20-inch frame is the most appropriate.
The most prominent differences between the men and women were found for the performance tests. For those movements which require motion that is primarily horizontal - the agility run and reaction movements - the performance of the males exceeded that of the females by 13 to 14%. However, the one motion which was essentially vertical - the ladder climb - produced far greater differences between the sexes. For this test, the male performance was approximately 44% greater than the female performance. This is an im- portant finding and suggests that those activities which require movement directly against gravity are particularly difficult for the females and accen- tuate their physical limitations. Previous work by Nelson and Martin (ref. 4) found similar differences between males and females and., therefore, provides additional support for the conclusions regarding performance differences between men and women.
Additional differences between the sexes were found for treadmill walking at 4.8 km/hr. The results showed that the men had greater stride lengths and smaller stride rates than the females. These differences were in the range of 4 to 5% and simply indicated that, during free walking (i.e. no cadence restrictions), the women will have to generate a greater number of step cycles over a given distance than the men. This may require a greater energy expenditure by the women, particularly under conditions of heavy load in which the women would be carrying a load representing a greater percentage of their body weight than would the men. Trends present for other variables, which essentially were components of the stride time, generally paralleled those found for stride length and stride rate.
The remaining tests, which included running at 8.0 km/hr and easy standing, showed no differences between the sexes. It is important to note, however, that many of the females were unable to complete the five-minute run on the treadmill under the load condition used in this study (approximately 26 kg). Although not quantifiable, this in itself highlights the lower physical capabilities of the females with respect to the males.
52

For the entire series of tests examined in this study, very few signi- ficant effects due to Frame Condition were found. There was a tendency for agility run performance to be pooreßt under the P-2 condition, which represented the shortest frame used. During running» the angular motion of the trunk was slightly greater under the P condition than the 20 condition, and the relative angular motion of the backpack vzith respect to the trunk was somewhat greater for the 20 than for the P condition. None of the differences found among the different frame Lengehe were considered to be major and probably are of little practical importance. Based on these results, it must be concluded that the different frame conditions employed in this study had little influence on the physical performance of the men and women subjects. More specifically, there, was no evidence which suggested that the P, P-2, or P+2 frame conditions provided any performance advantages over the standard 20-inch frame. Once again it should be stated that there was some overlap between the 20 and P frame conditions for thfc men and the 20 and P+2 conditions for the women and that this nay have been partially responsible for the few differences among the frame conditions. Nevertheless, the conclusion that no advantage in terms of physical per"onrance was gained by using a frame length other than the 20-lnch frame remains a strong one. It iß Important to remember, however, that all of the data were collected when the subjects were in a nonfatigued state. It is believed that, it" different flame lengths have the potential to influence physical performance, they wouJd be more likely to do so under fatigued conditions. In addition, these conclusions in no way reflect the subjective opinions of comfort of the subjects. The comfort factor may well begin to influence performance over long periods of time and under fatigued conditions. The series of tests used in this study simulated some of the common activities of a soldier but were probably greatly inadequate with respect to the time of exposure of soldiers to these activities.
The influence of Participation Time was examined for the walking, running, and easy standing activities. The results indicated that the performance of the subjects for the first sample was different than that for the second and third samples. This was especially notable for the walking and easy standing ta3ts. These differences were believed to be due to the experimental protocol rather than to a particular and important effect due to exposure time to the tests. For the walking, most of the subjects had never been on a treadmill prior to their experiences in this study. Consequently, the differences in gait between the first and later samples were probably due to the adaptation process the subjects were going through as they became accustomed to the tread- mill. For the easy standing test, it is believed that the first sample was simply initiated too early and thereby did not allow the subjects adequate time to assume a comfortable, standing position. A more important result was chfc! lack of a difference between the last two samples from which it must be concluded that the range of participation or exposure times used in this study was not great enough to influence performance. As was noted previously, it is believed that much longer exposure times would be needed before this factor would begin to influence the physical performance of the subjects.
53
J

Another important finding of this study pertains to the presence of very few significant interactions among the three factors examined in this study. For example, one might expect that an interaction between Frame Con- dition and Participation Time might occur such that, as the subjects were exposed to the various activities for longer and longer periods of time, the differences between the performances under the various frame lengths would become greater. A similar example could be extended for a Gender Frame interaction as it might be expected that men and women would respond dif- ferently to the various frame conditions* The lack of such interactions ia itself represents a significant finding of the study.
With respect to the subjective evaluations of the lour frame conditions, there was a clear trend present in the data. This trend did not indicate that one frame was superior to all others, but rather suggested the opposite - that one frame was less comfortable than the other three. In general, the subjects rated the 20, P, and P+2 frames similarly while rating the P-2 frame significantly poorer for all tests except the performance test series. The lack of a similar trend in the performance test ratings may be related to the fact that the performance tests were conducted first and the subjects, therefore, had no basis for comparison when they rated the frames. Based on these results, it must be concluded that, in terms of comfort, frames which are too short should be avoided. Once again, however, the results did not suggest that a frame other than the standard 20-inch frame was preferred. As has already been noted, it is felt that the feelings of comfort would become much more important and influential when the exposure to the various activities is extended and the subjects become more fatigued.
Based on the results of this study, several recommendations for further study can be made. First, it is believed that similar research on the effects of frame length should be extended to include longer exposure times and also a range of loads. Related to the longer time of exposure, further tests should include the influence of fatigue. It is felt that only under conditions which produce greater demands on the physical capacities of the subjects will the influence of the various frame lengths appear and become important. In addition, it is recommended that further research should examine in more detail the subjective feeling of comfort of the subjects while involved in various physical activities. The rating form used in this study, although providing useful data, was extremely simple and thereby could provide only limited information. It is felt that such evaluations would be an important component cf any future research on .he effects that frame condition has on the performance of men and women.
54
■ •■ nMü

REFERENCES
1. White, R.M. and E. Churchill. The Body Size of Soldiers; US Army Anthro- pometry - 1966 (Tsch. Rep. 72-51-CE) Natick, Mass: US Army Natick Laboratories, December 1971.
2. Churchill, E., T. Churchill, J.T. McConville, and R.M. V.uta. Anthropo- metry of Women in the US Army - 1977: Report No. 2 - The Basic Univariate Statistics (Tech. Rep, NATICK/TR-77/024). Natick, Mass: US Army Natick Research and Development Command, June 1977.
3. Allen, T.H., M.T. Peng, K.P. Cher., T.F. Huang, and H.S. Fang. Prediction of total adiposity from t»kinfolds and th.3 curvilinear relationship between external and internal adiposity. Metabolism 5:346-352, 1956
4. Nelson, R.C. and P.E. Martin. Volume I. Effects of Gender and Load on Combative Movement Performance (Tech. Rep. NATICK/IR-82/011). Natick, Massachusetts: US Army Natick Research and Development Laboratories, February 1982.
5. Martin, P.E. and R.C. Nelsou. Volume III. Effects of Gender, Load, and Backpack on the Temporal and KJnematic Characteristics uf Walking Gait (Tech. Rep. NATICK/TR-82/021). Natick, Massachusetts: US Army Natick Research and Development Laboratories, April 1982.
6. Nelson, R.C, T.E, Clarke, and R.N. Hinrichs. An Investigation into the Biomechanics of Load Carrying: The Effects of Gender, Body Size, and Beckpack on Load Carrying Behavior. Natick, Massachusetts: US Army Natick Research aud Development Laboratories, in preparation
7. Grieve, D.W. "The Assessment of Gait." Physiotherapy, pp. 454-460, November 1969.
8. Nelson, R.C, T.E. Clarke, and R.K. riinrichs. An Investigation into the Biomechani.es of Load Carrying: General References and Procedures. Natick, Massachusetts: US Army Natick Research and Development Laboratories, in preparation.
9. Nelson, R.C. and P.E. Martin. Volume II. Effects of Gender, Load, and Backpack on Easy Standing and Vertical Jump Performance (Tech. Rep. NATICK/TR-82/016). Natick, Massachusetts: US Army Natick Research and Development Laboratories, March 1982).
10. Games, P.A., G.S. Gray, W.L. Herron, A. Pentz, and G.F. Pitz. Analysis of Variance with Repeated Measures. University Park, PA: The Pennsylvania State University Computation Center, June 1979.
55
■rMMMHMI

Appendix A
Individual Waist Back Length
and Personalized Frame Length Data
"••- IP
57
*
**?■
UMMM-M^MC'* «MR^toMMMlB

MEN
Subject Waist Back Personalized Frame Assigned Frame Number Length (cm) Length (cm) Length (in.)
1 50.9 54.1 21 2 44.8 48.0 19 3 42.7 45.9 18 4 46.5 49.7 20 5 45.0 48.2 19 6 48.2 51.4 20 7 47.1 50.3 20 8 47.0 50.2 20 9 46.3 49.5 19
10 48.1 51.3 20 11 46.0 49.2 19 12 49.1 52.3 21 13 46.4 49.6 20 14 51.3 54.5 21 15 42.3 45.5 18 16 47.7 50.9 20 17 47.0 50.2 20 18 44.1 47.3 19 19 46.6 49.8 20 20 47.8 51.0 20
WOMEN
Subject Waist Back Personalized Frame Assigned Frame Number Length (cm) Length (cm) Length (in.)
1 41.6 44.8 18 2 46.4 49.6 20 3 46.0 49.2 19 4 43.4 46.6 18 5 47.3 50.5 20 6 40.6 43.8 17 7 44.5 47.7 19 8 47.2 50.4 20 9 46.0 49.2 19
10 41.6 44.8 18 11 44.1 47.3 19 12 43.6 46.8 18 13 40.3 43.5 17 14 43.7 46.9 18 15 44.5 47.7 19 16 42.3 45.5 18 17 43.6 46.8 18 18 45.5 48.7 19 19 41.0 44.2 17 20 44.0 47.2 19
58

' *
.'s SV,.
k •& .'i*i
Appendix B.
Descriptions of the
Anthroponetric Variables
59
i1

This appendix contains a description of the measurement procedures and/or definitions of the sixteen anthropometric variables for which measures were taken in this study. These descriptions are based on the 1966 and 1977 reports on the anthropometry of Army men and women (ref. 1 and 2) with the exception of percent body fat» which was not an included measure in these reports. All height and circumference measures were taken to the nearest millimeter. Weight was measured to the nearest tenth of a kilogram.
Stature
Weight:
The subject stood erect, with heels together and head level. Stature was measured as the vertical distance from the floor to v.he top of the head (vertex). An anthropometer was used, with the anthropometer arm firmly touching the scalp to compress the hair.
The subject was weighed on scales, while wearing only shorts and t-shirt.
Percent Body Fat: Ten sklnfold sites (chin, back, chest, side, waist, abdomen, arm, thigh, knee, and calf) were measured with Lange skinfold calipers in millimeters. The method of Allen, et al. (ref 3) was used to determine the percent body fat. This technique was used by Nelson and Martin (ref 4) in an earlier study.
Waist Back Length: The subject stood erect, with head level. Waist back length
was measured as the vertical distance along the surface of the back from the cervicale point (the bony protrusion of the 7th cervical vertebra at the base of the neck) to the level of the waist as indicated by the level of the navel.
Cervicale Height: The subject stood erect, with heels together and head level. Cervical height was measured as the vertical distance from the floor to the cervicale point (the bony protrusion of the 7th cervical vertebra at the base of the neck).
Shoulder Height: The subject stood erect, with heels together and head level Shoulder height was measured as the vertical distance from the floor to the outer point (acromion) of the right shoulder.
Crotch Height The subject stood erect, with his feet initially apart and then brought together after the anthropometer was in place. Crotch height was measured as the vertical distance from the floor (or standing surface) to the crotch. An anthropometer was used, with the anthropometer arm firmly in contact with the highest point in the crotch.
Waist Height: Subject stood erect, with heels together for the men, waist height was measured as the vertical distance from the floor to the upper edge (illiac crest) of the right hip bone. For the women, the measure was the vertical distance from the floor to the level of the navel.
60

Buttock Height
Sitting Height
The subject stood erect with heels together. The measure was taken as the vertical distance from the floor to the point of maximum protrusion of the buttocks.
The subject sat erect, with head level, and with the feet resting on a surface adjusted so that the knees were bent at right angles. Sitting height was measured as the verti- cal distance from the sitting surface to the top of the head (vertex). An anthropometer was used, with the anthro- pometer arm firmly touching the scalp to compress the hair
Shoulder Circumference The subject stood erect, with his arms hanging at his sides.
The maximum horizontal circumference of the shoulders was measured at the level of the bulges of the deltoid muscles in the upper arms.
Chest Circumference at Scye:
The subject stood erect, with his arms initially raised and then lowered after tho tape was in place. The maximum hori- zontal circumference of the chest was measured with the tape high in the armpits.
Chest/Bust Circumference The horizontal circumference of the trunk was measured with
the tape passing over the nipples during normal breathing.
Waist Circumference The subject stood erect, with the abdomen relaxed. The
maximum horizontal circumference of the waist was measured at the level of the navel (omphalion).
Hip Circumference The subject stood erect, with heels together. The maximum
horizontal circumference of the hip was measured at the level of the greatest protrusion of the buttock muscles.
Interscye Breadth: The subject stood erect, with his arms at his sides. Inter-
scye breadth was measured as the horizontal distance across the surface of the back between the upper ends of the armpit creases (scye points).
ft- 61

Appendix C
ANOVA Summary Tables
■ ■ ■ »F
Y 63 * -■ " ' * U
MM^

TABLE C-l
ANOVA Summary of Agility Run for Gender and Frame
SOURCE OF VARIANCE
Between Subjects
Gender
ERROR
df
1
35
M.S.
78.515
1.328
59.119*
Within Subjects
Frame
Gender x Frame
ERROR
3
3
105
0.202
0.113
0.659
3.069*
1.716
*P< 0.05
64
*■

TABLE C-2
ANOVA Summary of Reaction Movement Right for Gender and Frame
SOURCE OF VARIANCE df M.S.
Between Subjects
Gender 1
ERROR 35
Within Subjects
Frame 3
Gender x Frame 3
ERROR 105
3.150
0.055
,-2
57.224*
0.541 x 10 2.610
0.012 x 10"2 0.058
0.207 x 10"2
.\\
*P< 0.05
65
^wa^iftalHn mtm mm

TABLE C-3
ANOVA Summary of Reaction Movement Left for Gender and Frame
SOURCE OF VARIANCE df M.S.
Between Subjects
Gender
ERROR
1
35
2.787
0.470 x 10 -1
59.273*
Within Subjects
Frame
Gender x Frame
ERROR
3
3
105
-2 0.453 x 10 2.120
0.024 x 10"2 0.110
0.214 x 10~2
*P< 0.05
* 66
i i in i MMMM

TABLE C-4
ANOVA Summary of Ladder Climb for Gender and Frame
SOURCE OF VARIANCE
*P< 0.05
df M.S.
Between Subjects
Gender 1 249.478 36.109*
ERROR 35 6.910
Within Subjects
Frame 3 Q.380 2.141
Gender x Frame 3 0.388 2.188
ERROR 105 0.177
67
Mi

mm
TABLE C-5
ANOVA Summary of Stride Length during Walking for
Gender, Frame, and Participation Time
SOURCE OF VARIANCE
Between Subjects
Gender
ERROR
df
1
33
M.S.
0.587
0.056
F
10.432*
Within Subjects
Frame 3
Gender x Frame 3
ERROR 99
0.394 x 10 1.181
0.039 x 10~2 0.115
0.334 x 10"2
Time 2
Gender x Time 2
ERROR 66
,-2 1.660 x 10 11.258*
0.027 x 10"2 0.184
0.147 x 10"2
Frame x Time 6
Gender x Frame x Time 6
ERROR 198
-2 0.065 x 10 0.524
0.105 x 10"2 0.848
0.124 x 10⁻²
*P< 0.05
68
MAM
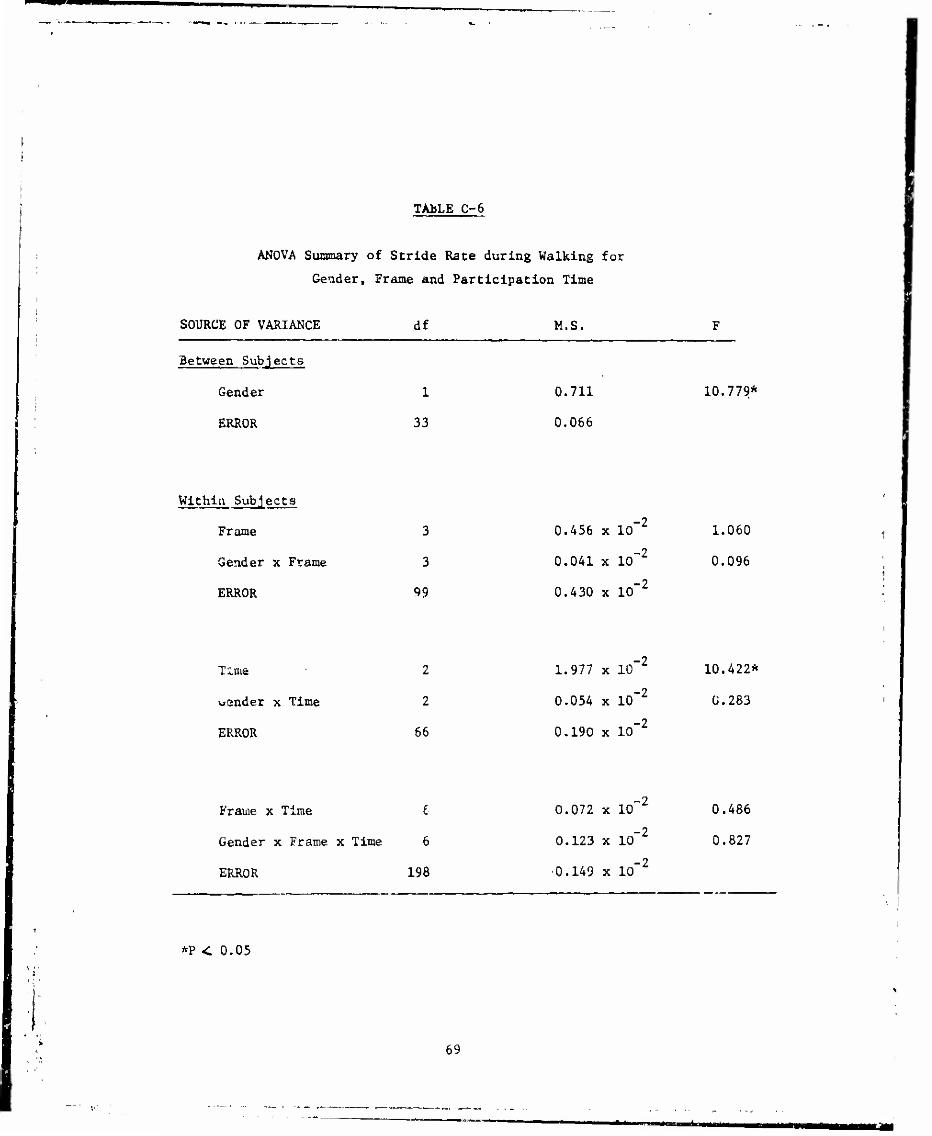
TAbLE C-6
ANOVA Summary of Stride Rate during Walking for
Gender, Frame and Participation Time
SOURCE OF VARIANCE df M.S.
Between Subjects
Gender
ERROR
1
33
0.711
0.066
10.779*
Within Subjects
Frame 3
Gender x Frame 3
ERROR 99
,-2 0.456 x 10 1.060
0.041 x 10"2 0.096
0.430 x Kf2
Time
uender x Time
ERROR
2
2
66
-2 1.977 x 10 10.422*
0.054 x 10"2 0.283
0.190 x 10"2
Frame x Time 6
Gender x Frame x Time 6
ERROR 198
0.072 x 10 -2
0.123 x 10 -2
•0.149 x 10 -2
0.486
0.827
*P < 0.05
69

TABLE C-7
ANOVA Summary of Single Leg Contact Time during Walking for
Gender, Frame, and Participation Time
SOURCE OF VARIANCE df M.S.
Between Subjects
Gender
ERROR
1
33
0.123
0.011
11.011*
Within Subjects
Frame 3
Gender x Frame 3
ERROR 99
1.310 x 10 1.485
0.660 x 10~3 0.749
0.882 x 10"3
Time 2
Gender x Time 2
ERROR 66
,-3 3.176 x 10 9.976*
0.349 x 10"3 1.097
0.318 x 10~3
Frame x Time 6
Gender x Frame x Time 6
ERROR 198
.-4 0.-165 x 10 0.051
1.662 x 10"A 0.515
3.^2'i x 10"~4
*P < 0.05
70

I I
TABLE C-8
ANOVA Summary of Double Support Time during Walking for
Gender, Frame, and Participation Time
SOURCE OF VARIANCE df M.S.
Between Subjects
Gender
ERROR
1
33
1.274 x 10 -2
0.126 x 10 -2
10.133*
Within Subjects
Frame 3
Gender x Frame 3
ERROR 99
,-3 0.253 x 10 0.574
0.721 x 10"3 1.636
0.441 x 10"3
Time 2
Gender x Time 2
ERROR 66
0.383 x 10 3.742*
0.078 x 10"3 0.765
0.102 x 10"3
Frame x Time 6
Gender x Frame x Time 6
ERROR 198
,-4 0.314 x 10 0.394
0.432 x 10~4 0.543
0.795 x 10""4
I ft
*P < 0.05
71
i i wtm

TABLE C-9
ANOVA Summary of Swing Time during Walking for
Gender, Frame, and Participation Time
SOURCE OF VARIANCE df M.S.
Between Subjects
Gender
ERROR
1
33
0.021
0.383 x 10 -2
5.529*
Within Subjects
Frame 3
Gender x Frame 3
ERROR 99
-3 0.367 x 10 0.583
0.64A x 10~3 1.020
0.631 x 10~3
Time 2
Gender x Time 2
ERROR 66
.-3 0.516 x 10 2.741
C.033 x 10~3 0.178
0.188 x 10"3
Frame x Time 6
Gender x Frame x Time 6
ERROR 198
-3 0.140 x 10 1.000
0.102 x 10~3 0.730
0.140 x 10"3
*P < 0.05
72

TABLE C-10
ANOVA Suiaaary of Trunk Angle during Walking for
Gender, Frame, and Participation Time
SOURCE OF VARIANCE df M.S. F
Between Subjects
Gender 1 176.920 2.431
ERROR 33 72.766
Within Subjects
Frame 3
Gender x Frame 3
ERROR 99
Time 2
Gender x Time 2
ERROR 66
Frame x Time 6
Gender x Frame x Time 6
ERROR 198
*P < 0.05
T: 73
A. 864 0.641
5.774 0.761
7.587
0.097 0.094
12.904 12.564*
1.032
0.619 0.587
0.523 0.496
1.054

TABLE Oll
ANOVA Summary
for Cumulative Linear Hip Motion during Walking
Source of Variance df MS
Between Subjects
Gender 1
ERROR 15
Within Subjects
Frame 1
Gender x Frame 1
ERROR 15
-5 0.279 x 10 0.002
0.143 x 10"2
0.115 x 10~3 0.514
0.594 x 10"3 2.653
0.224 x 10"3
*P < 0.05
TABLE C-12
ANOVA Summary
for Cumulative Trunk Angular Motion during Walking
Source of Variance df MS F
Between Subjects
Gender 1 3.800 0.444
ERROR 15 8.566
Within Subjects
Frame
Gender x Frame
1
1
0.350
0.381 x IQ"3 0.092
0.000
ERROR 15 3.814
*P < 0.05
74
Ms MMHI

TABLE C-13
ANOVA Summary
for Cumulative Linear Pack Motion during Walking
Source of Variance df MS
Between Subjects
Gender 1
ERROR 15
Within Subjects
Frame 1
Gender x Frame 1
ERROR 15
,-3 0.190 A 10 0.482
0.395 x 10"3
0.0 CO
0.647 x 10"4 0.459
1.411 x 10~4
*P < 0.05
TABLE C-14
ANOVA Summary
for Cumulative Angular Pack Motion during Walking
Source of Variance.
Between Subjects
df
Gender 1
ERROR 15
Within Subjects
Frame 1
Gender x Frame 1
ERROR 15
MS
-1 0.706 x 10 0.008
9.075
1.257 0.864
0.785 0.540
1.455
*P <0.05
75
if i n

TABLE C-15
ANOVA Summary
for Maximum Hip Angle during Walking
Source of Variance df MS F
Between Subjects
Gender 1 85.816 1.418
ERROR 15 60.532
Within Subjects
Frame 1 0.313 x 10""2 0.001
Gender x Frame 1 8.101 1.832
ERROR 15 4.423
*P < 0.05
TABLE C-16
ANOVA Summary
for Minimum Hip Angle during Walking
Source of Variance df MS F
Between Subjects
Gender
ERROR
Within Subjects
Frame
Gender x Frame
ERROR
1
15
1
1
15
305.406
45.596
9.466
2.136
8.525
6.696*
1.110
0.251
*P < 0.05
76
i i

Between Subjects
Gender 1
ERROR 15
Within Subjects
Frame 1
Gender x "Frame 1
ERROR 15
*P < 0.05
TABLE C-18
AUQVA Summary
for Minimum Knee Angle during Walking
Source of Variance
Between Subjects
Gender
ERROR
Within Subjects
Frame
Gender x Frame
ERROR
df
1
15
1
1
15
MS
24 383
32 624
8 397
4 570
7 364
0.747
1.140
0.621
*P < 0.05
77
» ii fm mm

TABLE C-19
ANOVA Summary of Stride Length during Running for Frame and Participation Time (men only)
Source of Variance df MS
Between Subjects
ERROR 14
Within Subjects
Frame 3
ERROR 42
Time 2
ERROR 28
Frame x Time 6
ERROR 84
0.115
0.259 x Kf2
0.589 x 10"2
0.415 x 10
0.445 x 10
0.116 x 10
0.275 x 10
-2
-2
-2
-2
0.440
0.933
0.421
*P < 0.05
78

TABLE C-20
ANOVA Summary of Stride Rate during Running for Frame and Participation Tit&e (men only)
SOURCE OF VARIANCE df M.S.
Between Subjects
ERROR
Within Subjects
14 0.217
Frame 3 0.550 x 10
ERROR 42 0.962 x 10
Time 2 0.916 x 10
ERROR 28 0.763 x 10
Frame x Time 6 0.193 x 10
ERROR 84 0.473 x 10
*P < 0.05
-2
-2
-2
-2
-2
-2
0.572
1.200
0.407
i .
79

TABLE C-21
ANOVA Summary of Single Leg Contact Time during Running for Frame and Participation Time (men only)
SOURCE OF VARIANCE df M.S.
Between Subjects
ERROR 14
Within Subjects
Frame 3
ERROR 42
Time 2
ERROR 28
Frame x Time 6
ERROR 84
0.310 x 10 -2
0.418 x 10
0.468 x 10
0.922 x 10
0.215 x 10
0.189 x 10
0.121 x 10
-3
-3
-4
-3
-3
-3
0.892
0.428
1.560
*P < 0.05
80
i iii

TABLE C-22
ANOVA Summary of Swing Time during Running for Frame and Participation Time (men only)
SOURCE OF VARIANCE df M.S. F
0.125 x lO"1
0.175 x 10"3 0.254
0.691 x 10"3
0.492 x 10"3 1.627
0.303 x 10"3
0.190 x 10"3 0.875
0.217 x 10"3
Between Sublects
ERROR 14
Within Subjects
Frame 3
ERROR 42
Time 2
ERROR 28
Frame x Time 6
ERROR 84
*P < 0.05
81
■ II ■«M^BMl——■—<—■>

^*mm
TABLE C-23
ANOVA Summary of Trunk Angle during Running for Frame and Participation Time (men only)
SOURCE OF VARIANCE df M.S. F
Between Subjects
ERROR 14 109.892
Within Subjects
Frame 3
ERROR 42
Time 2
ERROR 28
Frame x Time 6
ERROR 84
*P < 0.05
82
16.273 1.270
12.815
15.548 8.385*
1.854
0.584 0.393
1.485
"-"• <■ ■CIII> i ■■■ i i HI—itiiifTimiwMUMM

TABLE C-24
ANOVA Summary of Stride Length during Bunning for
v «csndert Frame, and Participation Time
SOURCE OF VARIANCE
p< jn Subjects
Gender
ERROR
df
1
28
M.S.
0.099
0.081
1.226
Within Subjects
Frame
Gender x Frame
ERROR
3
3
84
,-2 0.94?. x 10 1.453
0.537 x 10"2 1.216
0.442 x 10~2
Time 1
Gender x Time 1
ERROR 28
,-2 0.672 x 10 2.286
0,026 x 10"2 0.089
0.294 x 10"2
Frame x Time 3
Gender x Frame x Time 3
ERROR 84
,-2 0.040 x 10 0.168
0.332 x lO""2 1.405
0.236 x 10⁻²
*P ^ 0.05
83
im

TABLE C-25
ANOVA Summary of Stride Rate during Running for
Gender, Frame, and Participation Time
SOURCE OF VARIANCE df M.S.
Between Subjects
Gender
ERROR
1
28
0.181
0.157
1.157
Within Subjects
Frame 3
Gender x Frame 3
ERROR 84
-1 0.135 x 10 1.639
0.115 x 10"X 1.395
0.082 x 10"1
Time 1
Gender x Time 1
ERROR 28
,-2 1.568 x 10 2.950
0.060 x 10"2 0.113
0.532 x 10"2
Frame x Time 3
Gender x Frame x Time 3
ERROR 84
-2 0.079 x 10 0.185
0.558 x 10"2 1.306
0.427 x 10"2
*P < 0.05
84
jgtMMmm tLH mm

TABLE C-26
ANOVA Summary of Swing Time during Running for
Gender, Frame, and Participation Time
SOURCE OF VARIANCE df
Between Subjects
Gender
ERROR
1
28
Within Subjects
Frame 3
Gender x Frame 3
ERROR 84
Time 1
Gender x Time 1
ERROR 28
Time x Frame 3
Gender x Frame x Time 3
ERROR 84
*P < 0.05
M.S.
0.586 x 10 -2
0.719 x 10 -2
0.300 x 10 -3
-3
0.578 x 10 -4
.-4
0.815
0.644
0.511 x 10 1.098
0.466 x 10~3
0.336 x 10"3 1.390
0.120 x 10"3 0.498
0.242 x 10"3
0.573
0.501 x 10 0.496
1.009 x 10~4
85

TABLE C-27
ANOVA Summary of Single Leg Contact Time during Running for
Gender, Frame» and Participation Time
SOURCE OF VARIANCE
Between Subjects
Gender
ERROR
df
1
28
M.S.
0.336 x 10 -2
0.243 x 10 -2
1.384
Within Subjects
Frame 3
Gender x Frame 3
ERROR 84
0.051 x 10 1.665
0.106 x 10~2 3.482*
0.030 x 10"2
Time 1
Gender x Time 1
ERROR 28
-4 0.468 x 10 0.413
0.171 x 10~* 0.151
1.132 x 10~A
Time x Frame 3
Gender x Frame x Time 3
ERROR 84
0.066 x 10 -4
2.650 x 10 -4
1.053 x 10 -4
0.062
2.516
*P < 0.05
86
«favwl* MM

TABLE C-28
ANOVA Summary of Trunk Angle during Running for
Gender, Frame, and Participation Time
SOURCE OF VARIANCE d.f M.S.
Between Subjects
Gender
ERROR
1
28
26.600
96.536
0.604
Within Subjects
Frame 3
Gender x Frame 3
Error 84
7.270
18.099
7.650
0.950
2.366
Time 1
Gender x Time 1
ERROR 28
45.327 21.243*
1.926 0.903
2.134
Time x Frame 3
Gender x Frame x Time 3
ERROR 84
0.834
0.905
1.434
0.582
0.631
*P < 0.05
87
i ■■■■n «■»

TABLE C-29
ANOVA Summary
for Cumulative Linear Hip Motion uuring Running
Source of Variance
Between Subjects
Gender
ERROR
Within Subjects
Frame
Gender x Frame
ERROR
df
1
15
1
1
15
MS
0.858 x 10 -2
,-4
1.712
0.362 x 10 0.037
0.142 x 10"2 1.461
0.974 x 10"3
*P < 0.05
TABLE C-30
,AN0VA Summary
for Cumulative Angular Displacement of the Trunk during Running
Source of Variance df MS
Between Subjects
Gender 1
ERROR 15
Within Subjects
Frame 1
Gender x Frame 1
ERROR 2.5
102.596
12.333
26.529
3.764
5.277
8.319*
5.027*
0.713
*P < 0.05
38

TABLE Q31
ANOVA Summary
for Cumulative Relative Linear Motion of the Backpack during Running
Source of Variance
Between Subjects
*P <0.05
df MS
Gender 1
ERROR 15
Within Subjects
Frame 1
Gender x Frame 1
ERROR 15
-2 0.859 x 10 4.432
0.194 x 10~2
0.266 x 10™4 0.032
0.186 x 10"5 0.002
0.828 x 10"3
TABLE C-32
ANOVA Summary
for Cumulative Relative Angular Motion of the Backpack during Running
Source of Variance df MS
Between Sublects
Gender 1 0.302
ERROR 15 40.610
Within Sublects
Frame 1 304.793
Gender x Frame 1 6.154
ERROR 15 21.059
0.007
14.473*
0.292
*P < 0.05
89
il *— IWI< —1

TABLE C-33
ANOVA Summary
for Maximum Hip Angle during Running
Source of Variance df MS
Between Subjects
Gender 1
ERROR 15
Within Subiects
Frame 1
Gender x Frame 1
ERROR 13
139.897
51.777
0.777
20.572
15.982
2.702
0.049
1.287
*P < 0.05
TABLE C-34
ANOVA Summary
for Minimum Hip Angle during Running
Source of Variance
Between Subjects
Gender
ERF OR
Within Subjects
Frame
Gender K Frame
ERROR
df
1 li>
1
1
15
MS
6.035 65.591
7.538
5.081
7.037
0.092
1.071
0.722
*P< 0.05
90
*nw mtämucaam

TABLE C-35
ANOVA Summary
for Maximum Knee Angle during Running
Source of Variance df MS
Between Subjects
Gender
ERROR
Within Subjects
Frame
Gender x Frame
ERROR
1
15
1
1
15
44.957
44.018
5.320
9.294
2.713
1.021
1.961
3.426
*P 4L 0.05
TABLE C-36
ANOVA Summary
for Minimum Knee Angle during Running
Source of Variance
Between Subjects
Gender
ERROR
Within Subjects
Frame
Gender x Frame
ERROR
df
1
15
1
1
3.5
MI
21.€52
46.782
0.750
1.061
4.959
0.463
0.151
0.214
! .:
*P < 0.05
91
iiü«wwiimiMMi«iiiir \ViiM

TABLE C-37
ANOVA Summary of CPX for
Gender, Frame, and Participation Time
SOURCE OF VARIANCE
Between Subjects
Gender
ERROR
df
1
33
M.S.
0.002 x 10 -2
0.256 x 10 -2
0.009
Within Sublects
Frame 3
Gender x Frame 3
ERROR 99
,-3 0.093 x 10 0.335
0.056 x 10"3 0.202
0.028 x 10~3
Time 2
Gender x Time 2
ERROR 66
,-2 3.344 x 10 83.636*
0.093 x 10~2 2.327
0.040 x 10~2
Time x Frame 6
Gender x Frame x Time 6
ERROR 198
,-3 0.314 x 10 1.215
0.349 x 10~3 1.348
0.259 x 10~3
*P < 0.05
92
im

TABLE C-38
ANOVA Summary of CPY for
Gender, Frame, and Participation Time
I
SOURCE OF VARIANCE df M.S.
Between Subjects
Gender
ERROR
1
33
0.031 x 10~2
0.228 x 10""2
0.137
Within Subjects
Frame 3
Gender x Frame 3
ERROR 99
0.200 x 10 -3
-3
0.628
0.646 x 10 J 2.026
0.319 x 10"3
Time 2
Gender x Time 2
ERROR 66
^3 35.678 x 10"J 61.227*
0.126 x 10"3 0.217
0.583 x 10"3
Time x Frame 6
Gender x Frame x Time 6
ERROR 198
*P < 0.05
,-3 0.253 x 10" 0.678
0.486 x 10~3 1.302
0.373 x 10⁻³
93
I ii
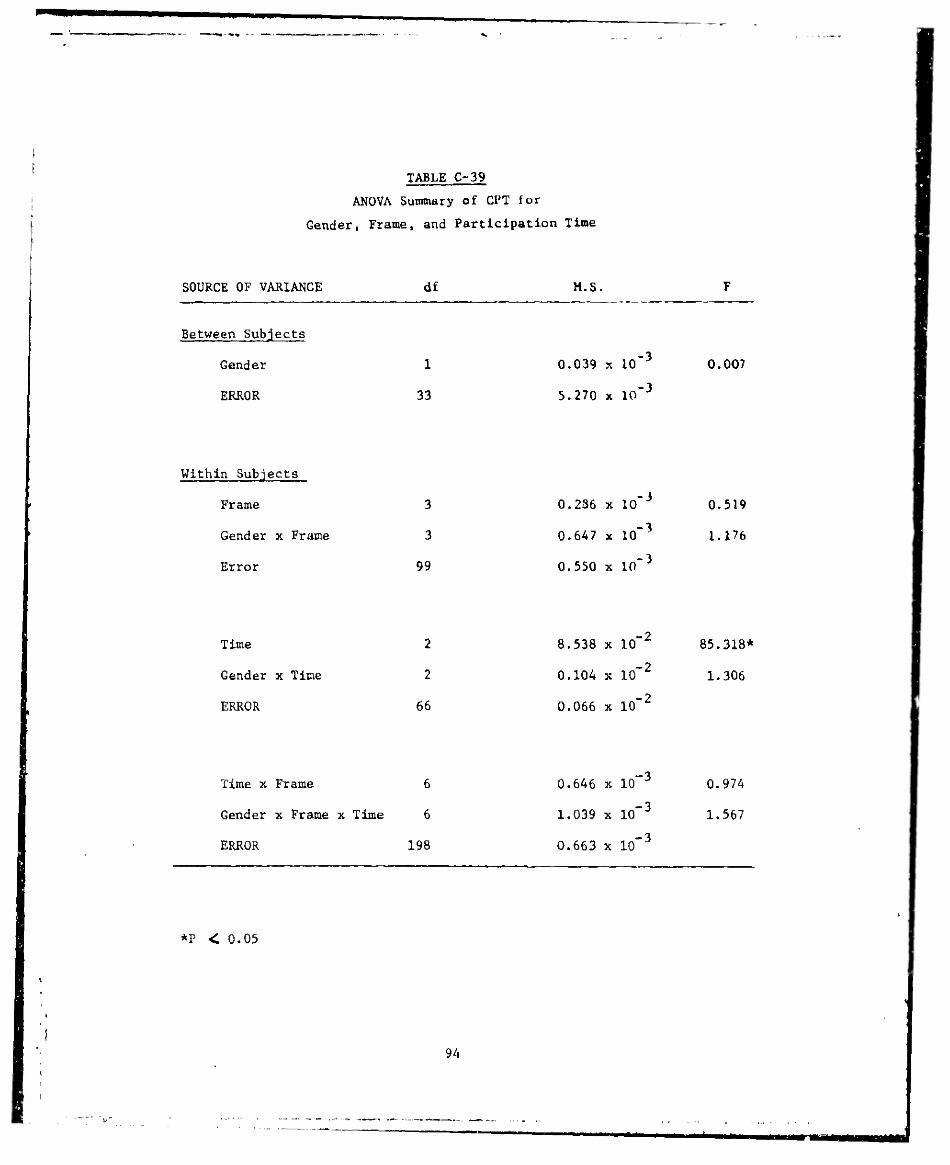
TABLE C-39
ANOVA Summary of CPT for
Gender, Frame, and Participation Time
SOURCE OF VARIANCE
Between Subjects
Gender
ERROR
df
1
33
M.S.
0.039 x 10 -3
5.270 x 10 -3
0.007
Within Subiects
Frame 3
Gender x Frame 3
Error 99
0.236 x 10 0.319
0.647 x 10"3 1.176
0.550 x 10"3
Time 2
Gender x Time 2
ERROR 66
,-2 8.538 x 10 85.318*
0.104 x 10"2 1.306
0.066 x 10"2
Time x Frame 6
Gender x Frame x Time 6
ERROR 198
0.646 x 10 0.974
1.039 x 10"*3 1.567
0.663 x 10"3
*P < 0.05
94
mi i i ■ ii

TABLE C-4Q
ANOVA Summary
for Subjective Evaluations after the Performance Tests
Source of Variance df MS
Between Subjects
Gender
ERROR
Within Subjects
Frame
Gender x Frame
ERROR
1
35
3
3
105
10.043
6.993
6.800
8.731
8.016
1.436
0.848
1.089
*P < 0.05
TABLE C-41
ANQVA Summary
for Subjective Evaluations after Treadmill Walking
Source of Variance df MS
Between Subjects
Gender 1
ERROR 33
Within Subjects
Frame 3
Gender x Frame 3
ERROR 99
1.882
8.882
59.131
7.768
4.965
0.212
11.909*
1.565
*P < 0.05
95
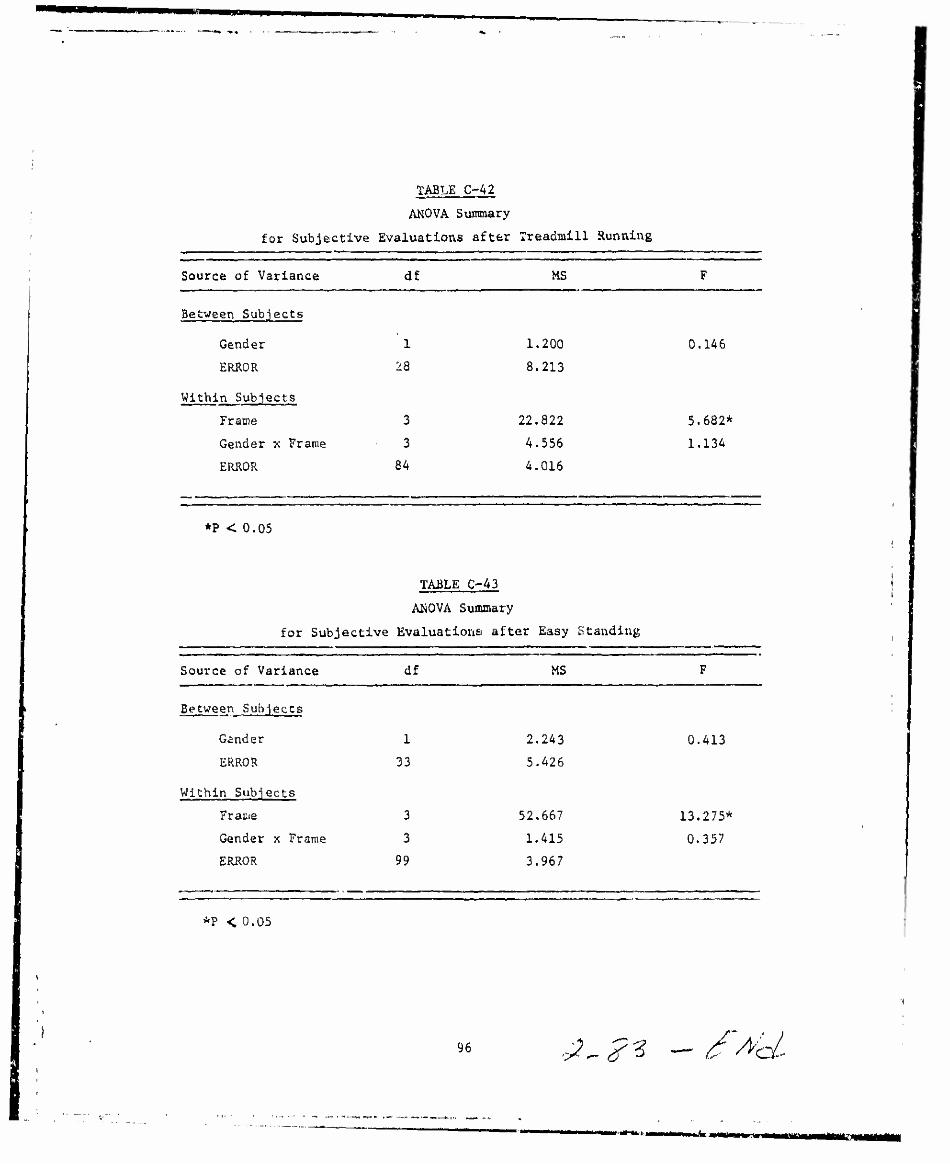
TABLE C-42
ANOVA Summary
for Subjective Evaluations after Treadmill Running
Source of Variance df MS
Between Subjects
Gender
ERROR
Within Subjects
Frame
Gender x Frame
ERROR
1
28
3
3
84
1.200
8.213
22.822
4.556
4.016
0.146
5.682*
1.134
*P < 0.05
TABLE C-43
AttOVA Summary
for Subjective Evaluations after Easy Standing
Source of Variance df MS
Between Subjects
Gander
ERROR
Within Subjects
Frame
Gender x Frame
ERROR
1
33
3
3
99
2.243
5.426
52.667
1.415
3.967
0.413
13.275*
0.357
*P < 0.05
96 £-?* fficL