Embed Size (px)
Citation preview

Informing change & promoting innovation through rigorous & collaborative research
Sean F. Reardon, Nicole Arshan, Allison Atteberry
Michal Kurlaender University of California, Davis
Stanford University
October, 2008
Institute for Research on Education Policy & Practice
This paper is part of a series of working papers focused on signi�cant education policy and practice issues.
WORKING PAPER # : 2008-10
Direct correspondence to Sean F. Reardon ([email protected]). The research reported
here was supported by a grant from the James Irvine Foundation and by the Hewlett
Foundation through a grant to the Institute for Research on Educational Policy and Practice at
Stanford University. Earlier versions of this paper were presented at the Annual Meeting of the
Society for Research on Adolescence (Chicago, IL; March 6-9 2008); the First International
Sociological Association Forum (Barcelona, Spain; September 5-8, 2008). We are indebted to
the staff of the four school districts (in particular, James Gulek, Dave Calhoun, Robert Maass,
and Peter Bell) for sharing their data and expertise with us; without their generosity and
commitment to quality research this work would not have been possible. We also bene�ted
from excellent research assistance of Noli Brazil and Demetra Kalogrides. All errors, of course,
are our own.
High Stakes, No Effects:Effects of Failing the California High School Exit Exam
Paper prepared for the Annual Meeting of the Association for Public Policy Analysis and Management,
Los Angeles, CA, November 6-8, 2008

Abstract
The increasing use of state‐mandated public high school exit exams is one manifestation
of the current movement in U.S. public schooling toward more explicit standards of instruction
and accountability. The logic of exit exams reasons that raising the bar for high school
graduation will create incentives for students to work harder in school and for schools for
increase their efforts to teach low‐achieving students. Conversely, some argue that exit exams
may discourage the lowest achieving students from staying in school if they believe they are
unlikely to ever pass the exam. In particular, failing an exit exam early in high school may
motivate students to work harder (and learn more) or may motivate them to leave school
earlier than they would have had they passed the exam. In this paper, we use student‐level
longitudinal data from four large California public school districts and a regression discontinuity
design to estimate the effect of failing a high school exit exam in 10th grade on subsequent
student achievement, persistence in high school, and graduation. We find no evidence of any
significant effect of failing the exams on high school achievement or persistence, and we find
conflicting evidence regarding the effect of failing on graduation. Our estimates are precise
enough to rule out moderate or large effects. We conclude that there is little effect—positive
or negative—of failing an exit exam early in high school, though it is important to note that our
estimates apply only to students with test scores near the exit exam passing score. There may
be sizeable effects for students with skills far from the passing score.
2

Introduction
The increasing use of state‐mandated public high school exit exams—tests each student
must pass before he or she is awarded a high school diploma—is one manifestation of the
current movement in U.S. public schooling toward more explicit standards of instruction and
accountability. Unlike some aspects of accountability systems, the accountability consequences
of failing an exit exam fall partly (or even primarily) on students, as opposed to the schools or
districts. The number of states requiring students to pass an exam to graduate has increased
from 18 in 2002 to 22 in 2007, with an additional four states intending to implement exit exams
by 2015. Soon, over 70 percent of U.S. students will soon be subject to such exam
requirements (see, e.g., Center on Education Policy, 2004, 2005; Dee & Jacob, 2006; Warren,
Jenkins, & Kulick, 2006). The effects of exit exam policies, however, remain somewhat unclear,
despite a number of recent studies. Competing notions of how such exams might influence
student and school behaviors lead to divergent predictions of how students will be affected.
Some argue, for example, that a high school exit exam requirement will create incentives both
for schools to provide better instruction to struggling students and for these students to work
harder to learn more before graduation. On the other hand, others have argued that creating
additional barriers to graduation discourages students—particularly academically and socially
disadvantaged students—from persisting in school and hence leads to increased dropout rates
and greater inequality (for discussion, see Dee & Jacob, 2006; Reardon & Galindo, 2002; Warren
et al., 2006).
In this paper, we use longitudinal data from four large California districts and a
regression discontinuity design to estimate the effect of failing a high school exit exam in 10th
3
grade on subsequent student achievement, persistence in high school, and graduation. We
begin with a discussion of the mechanisms through which exit exams might influence student
outcomes. We then review relevant research on these topics with an emphasis on
distinguishing between two strands of research: research on the effects of exit exam
requirements per se, and research on the effects of failing (relative to passing) an exit exam,
given the existence of the requirement. This paper falls under the second type of research,
which may be particularly useful for providing insight about the mechanisms though which exit
exams operate (in a companion paper in preparation, we address the first question). In the
third section of the paper, we describe the California High School Exit Exam policy and its
history in order to provide a context for the analyses that follow. Section IV briefly describes
the data, sample, and measures used in our analyses. In Section V we describe the regression
discontinuity design we use, followed by a discussion of the results of our analyses in Section VI.
I. Potential Effects of Exit Exams
By adding the requirement that students pass a test in order to graduate from high
school, exit exam policies may affect the motivation, effort, and behavior of both students and
schools. These effects may be heterogeneous, affecting high‐skill students differently than
lower‐skill students, and affecting students in some schools differently than others as a result of
differing organizational responses to the exam policies and different school norms. Moreover,
the effects of policies may operate through student and school responses early in high school,
in anticipation of the exams before the exams are administered, and they may operate later in
school, in response to student performance on initial test administrations. In order to
4

understand the possible effects of exit exams, it is necessary to consider these heterogeneous
effects.
It will be useful to formalize the mechanisms through which exit exams might operate in
a stylized model. Let , , and indicate the true skill level of student at the end of 8th,
10th, and 12th grades, respectively (more generally, let them indicate the true skill level of a
student at [a] some time point sufficiently early to be unaffected by the presence of an exit
exam policy; [b] at the time when students first take the exam; and [c] at some time sufficiently
later such that it is possible that a students’ performance on the exam might affect his/her skill
through motivational or school intervention effects). In general, the skill of student in 10th
grade will be a function of her 8th grade skill, the presence of a high school exit exam policy, and
some student specific factors:
· (1)
Here is the function describing the relationship between 8th and 10th grade skill in the
absence of the exit exam policy; is the function describing the average effect of the policy on
10th grade skills for students of skill level , and is a binary variable indicating the presence
of an exit exam requirement. We might expect that will be zero for high values of ,
because the presence of an exit exam requirement is unlikely to affect the gain in skills from 8th
to 10th grade for high‐skill students (there is no incentive for either such students or their
schools to work harder in the presence of an exit exam requirement, because they are likely to
pass the test easily).1 The functions and may vary systematically across schools and with
1 It is possible that is negative for high skill students, if the presence of the requirement induces schools to focus their curriculum and efforts on teaching lower‐level skills and/or signals to high skill students that they need not work hard.
5

respect to student characteristics as well, though we will not consider these possibilities here
for simplicity.
Now suppose that at the end of 10th grade, each student takes the exit exam for the first
time and receives—in the form of their score on the test—a signal of his or her ability to pass
the exam. Note that the observed score—call it —is an error‐prone measure of . In
general, each student’s true skill at the end of 12th grade will be a function of the student’s true
10th grade skill, the presence of the policy, and (if there is an exit exam policy) his or her
observed score on the 1 th e tiv passing s0 grad test rela e to the core :
· · (2)
Here is the function describing the relationship between 10th and 12th grade skills in the
absence of an exit exam policy; is the function describing the effect of the policy on 12th grade
skills for the average student of true 10th grade skill who passes the exam at his or her first
attempt; and is the function describing the effect of the failing the test in 10th grade given an
exit exam score . As above, , , and may vary across schools and types of students in a
more general model.
There are three parameters of interest here: the function describing the pre‐
administration effect of the policy on achievement; the function describing the post‐
administration effect of the policy on achievement (which may include effects that operate
through reduced student persistence in school); and the function describing the effect of
failing the exam at the first administration on subsequent achievement. Each of these effects
(if any exist) may be driven by multiple mechanisms, and may be heterogeneous with respect to
student ability. We discuss possible mechanisms for each of these effects in turn below.
6

The presence of an exit exam requirement may affect student skills prior to the
administration of the test in 10th grade (implying 0) in several ways. It may motivate
students—particularly lower‐skill students—to work harder, or to focus their efforts to learn
material they think may be on the test. Alternately, it might discourage some students with low
skills from persisting or working hard in school if they think it unlikely that any reasonable
amount of effort will enable them to pass (though it is more likely that a discouragement effect
would occur after the first test administration, when students have a clearer signal about the
probability of eventual success, a possibility discussed below). It also may induce schools to
alter their curricula and/or instructional practices to focus more effort on teaching the skills
measured by the test, particularly to those students most at risk of failing the test. The extent
to which schools alter their practices in response to the presence of an exit exam is likely a
function both of the skill distribution of their student population and the extent to which
schools are held accountable for their students’ performance on the exam. In general, if
schools are held accountable for students’ performance as part of an exit exam policy, we
expect that they may focus their efforts on improving the skills of low‐achieving students
(efforts that some have suggested will negatively affect students’ development of high‐order
skills and content mastery; for discussion and references, see Dee & Jacob, 2006, p. 6)
The presence of an exit exam may also affect student skills in the period following the
first administration of the exam (implying 0). Schools may reconfigure their curricula
and instructional practices to provide opportunities for students who fail the first
administration of the test to learn the material necessary to pass it later. Such reconfiguration
may benefit low‐skill students, but could also reduce students’ (including high‐skill students’)
7

opportunities for exposure to higher‐level curricula and content and so may lower achievement
for some students.
Finally, failing an exit exam at its first administration may affect students’ subsequent
achievement (implying 0). A student’s score on the first test administration serves as
a signal—to both the student and the school—of the student’s likelihood of ultimately passing
the exam prior to the end of 12th grade. This signal may affect student effort and motivation as
well as school curriculum, instruction, and remediation targeted at students who fail.
Moreover, the effects of failing may differ depending on how far below the passing score a
student’s initial test score is. For students with true abilities near the passing score, those who
fail will likely fail by a narrow margin, which may lead to increased student motivation and
effort. In addition, schools may target their instructional and remedial efforts on these
students, particularly if the schools are held accountable for ultimate passing/graduation rates
(for recent evidence, see Booher‐Jennings, 2005; Neal & Schanzenbach, 2007). On the other
hand, students near the passing score may be so likely to ultimately pass that their failure at
the first attempt induces no additional effort on their part or that of the school. For students
farther from the passing score, again the possible effects are ambiguous—students may grow
discouraged, lower their effort in school, and possibly drop out of school; or they may work
very hard to raise their skills. The exact effects for such students likely depend on local norms
and students’ assessment of the relative value of the diploma relative to the effort and time
required to ultimately pass the exam. Likewise, the response of schools to these students may
vary—schools may focus additional efforts and resources on these students; they may provide
them with curricula and instruction geared to help them pass the test; or they may provide no
8

extra instruction for these students, implicitly assuming that their skills are too far below the
passing threshold to ultimately pass.
Thus, a full description of the effects of exit exam policies would include estimation of
the functions , , and . In this paper, however, our goal is more modest. Here we seek only
to estimate , the effect of failing an exit exam, given the existence of an exit exam policy.
More specifically, given our regression discontinuity design, we estimate at , the
effect of failing for students at the margin of passing. To see this, note that in the presence of
an exit exam policy, Eq re u uation (2) d ces to
· . (3)
Under the assumption that , , and are continuous in the region of (strictly speaking,
need only be continuou th re , ves in e gion less than ) we then ha
lim lim lim . (4)
We can obtain unbiased estimates of the two limits on the left‐hand side of (4) from a
regression model; their difference yields the regression discontinuity estimate , the
estimated effect of failing the exam for students with scores at the margin of passing. We
discuss this design in more detail in section V below.
II. Prior Research on the Effects of Exit Exams
Prior research on the effects of exit exams varies in the treatment of interest (effects of
the presence of exit exam policies or the effects of failing the exam); the outcome of interest
(student achievement or dropout/persistence/graduation); and the type of data used
(individual longitudinal data or aggregate cohort data). Most prior research has estimated the
9

effect of a high school exit exam requirement on high school dropout or completion rates.
Several studies using individual‐level data from nationally‐representative samples (mostly from
cohorts of students graduating high school in the early 1990’s) found that state high school exit
exams increase high school dropout rates among low‐achieving students (Bishop & Mane,
2001; Jacob, 2001) or black males (Dee & Jacob, 2006), though one similar study found no such
effects (Warren & Edwards, 2005). In contrast, a set of studies examining the relationship
between state exit exam policies and state‐level graduation rates generally finds no effect of
exit exams on dropout rates (Carnoy & Loeb, 2002; Greene & Winters, 2004; Marchant &
Paulson, 2005; Warren & Jenkins, 2005), though at least one study finds a different result
(Amerin & Berliner, 2002). Some of these studies have important methodological
shortcomings, however, that may bias their estimated effects of exit exam policies on dropout
rates (discussed at length in Dee & Jacob, 2006; Warren et al., 2006). Two newer studies that
correct many of the methodological shortcomings of these studies, however, find that high
school dropout rates tend to increase by roughly 1 to 2 percentage points, on average, when
states implement rigorous exit exams (Dee & Jacob, 2006; Warren et al., 2006).2 Dee and Jacob
(2006) find that these effects are concentrated among black students and students in high‐
poverty schools.
The studies described above estimate the effect of exit exam requirements on student
outcomes. Fewer studies have estimated the effects of failing a high stakes exit exam on
2 Warren, Jenkins and Kulick (2006) also address why their results are inconsistent with prior analyses based on NELS data which tend to show no significant relationships between exit exams and high school completion measures. When they confine their sample to state‐years prior to 1992 (that is, when the final NELS‐88 cohort should have graduated from high school), Warren, Jenkins, and Kulick also find no significant associations. They suggest that many states have moved to more rigorous exit exams since that time and generally conclude that “the consequences of state HSEEs have changed in important ways since the NELS‐88 cohort moved through the secondary school system” (p. 146).
10

subsequent student academic outcomes. Several early studies in this area relied on student‐
level data to estimate the effect of initially failing an exit exam on high school completion. A
study using self‐reported data about exit exam results and intentions to complete high school
found that students who reported failing the initial exam expressed more doubt about their
chances of finishing high school, net of prior grade retention, academic performance, and
family background (Catterall, 1989), though this does not mean, of course, that they were in
fact less likely to finish school or that the test failure was a cause of it. Another early paper of
this type uses longitudinal student data and finds that exit exam failure is associated with
increased dropout rates, but only for students with moderately high GPA’s, a pattern the
authors interpret as evidence of a discouragement or stigma effect (Griffin & Heidorn, 1996).
Each of the two early papers described above relies on regression adjustment to
estimate the effects of failing an exit exam. Valid causal inference from such models relies on
the assumptions that the regression models contain all relevant covariates and that the
functional form of the model is correctly specified. A stronger design, from the point of view of
causal inference, is a regression discontinuity design. Because passing the exam is determined
by a sharp threshold on an observable variable (the exit exam score), it is possible to obtain
unbiased estimates of the effects of failing an exit exam for students with skill levels near the
passing threshold from a regression discontinuity model.
Several recent papers exploit the regression discontinuity design to estimate the effect
of failing an exit exam. Martorell (2005) finds that Texas students who barely fail the state exit
exam on their first attempt are no more likely to drop out of school by 12th grade than those
who just pass on their first attempt. However, he does find that students who fail the test in
11

12th grade are less likely to graduate, less likely to attend postsecondary schooling, and earn
less, on average, than their counterparts who do pass. These findings suggest no
discouragement effect—no reduction in persistence in school—of failing initially (at least
among those near the margin of passing). Martorell does not investigate whether these effects
differ among student subgroups defined by race/ethnicity, poverty, or language status.
A second recent paper uses a similar regression discontinuity design and data from
Massachusetts to estimate the effect of failing an exit exam in 10th grade (Papay, Murnane, &
WIllet, 2008). The authors find that failing the exam reduces the probability of on‐time
graduation by eight percentage points among low‐income urban students at the margin of
passing, but has no effect on the graduation rates of other students. One possible explanation
for these patterns is that schools attended by low‐income urban students may not provide
adequate remedial instruction for students who initially fail the exam, but Papay et al. cannot
test this possibility with their data. Note that their results differ from the Martorell results
using Texas data—although both papers find that failing an exam lowers graduation rates, they
find this effect for different populations. Martorell finds no effect of failing the 10th grade test
on graduation rates for those at the margin of passing in 10th grade, while Papay et al. do find
such an effect, though only for low‐income urban students. Martorell’s negative effect of
failing the exit exam is found only for students at the margin of passing the final exam
administration, in 12th grade.
Both of these recent papers provide significant improvements to our knowledge of the
effects of exit exams on student persistence and graduation. Nonetheless, neither Martorell
nor Papay et al. are able to estimate the effect of failing an exit exam on student achievement,
12
an important element in understanding the effects of exit exams.3 In fact, there is little
evidence on the effects of exit exams on achievement. One exception is Jacob (2001), who uses
NELS data to examine whether exit exam policies led to increased student achievement. He
does not find any achievement effects, again with a possible exception of students in the lowest
decile of eighth grade achievement. His estimates are estimates of the effect of the exit exam
requirement, however, not the effect of failing.
In this paper, we use a regression discontinuity design similar to that used by Martorell
(2005) and Papay (2008). In addition to examining the effects of initial exit exam failure on
persistence and graduation, we also estimate the effects of 10th grade exit exam failure on
subsequent achievement. In the next section we provide the reader a brief overview of
California’s exit exam policy.
III. The California High School Exit Exam
The California State Legislature passed Senate Bill SB2X in March 1999, requiring
California local school districts to administer a high school exit exam (the California High School
Exit Exam [CAHSEE]) and provide supplemental instruction to those students who do not
demonstrate sufficient progress toward passing the exam. The stated rationale for adopting
the exit exam law was that in order to “significantly improve pupil achievement in high school
and to ensure that pupils who graduate from high school can demonstrate grade level
competency in reading, writing, and mathematics, the state must set higher standards for high
3 Jacob (2001) uses NELS data to examine whether exit exam policies led to increased student achievement, however he does not find any achievement effects, again with a possible exception of students in the lowest decile of eighth grade achievement. His estimates are estimates of the effect of the policy, not the effect of failing.
13

school graduation” (SB2X, Section 1(b)).4
As implemented, the CAHSEE is a two‐part exam of mathematics and English language
arts (ELA) skills. The math section assesses students’ mastery of the California math content
standards for sixth and seventh grade and their Algebra I skills using a multiple‐choice format.
The ELA section is aligned with state content standards through grade ten and utilizes a
multiple‐choice format along with one essay. Both tests are administered in English, regardless
of a student’s primary language.5 Both parts are scored on a scale from 275 to 450, and
students must score at least 350 points on each part to pass the exam and earn a high school
diploma.
The test is first administered to students in the Spring of 10th grade, and students have
at least five subsequent opportunities to retake the sections they have not yet passed (twice in
11th grade and 12th grade, and at least once following the end of the 12th grade school year).
Testing dates are centrally scheduled by individual districts and the exam is administered over
the course of two days (one day for each portion). The test is untimed, though students
typically complete each section in three to four hours. Districts notify students and their
parents of their CAHSEE performance about seven weeks after the exam is administered.
Because students are told their exact score, not simply whether they passed or failed, students
who fail have some sense of how close they came to scoring the requisite 350 they need to
meet the CAHSEE requirement.
Some important aspects of the CAHSEE requirement have changed since the law was
4 http://www.leginfo.ca.gov/pub/99‐00/bill/sen/sb_0001‐0050/sbx1_2_bill_19990329_chaptered.html. 5 However, English learners must be permitted to take the CAHSEE with certain test variations if used regularly in the classroom. For example, if regularly used in the classroom, English learners must be permitted to hear the test directions in their primary language or use a translation glossary.
14

first passed. The original legislation identified the Graduating Class of 2004 (students entering
high school in the Fall of 2000) as the first graduating class subject to the CAHSEE graduation
requirement. In most districts, students scheduled to graduate in 2004 were given the
opportunity to take the CAHSEE exam in Spring of 9th grade (2001), though these students were
not required to take the exam until 10th grade. Only the Class of 2004 was offered the 9th grade
administration; after Spring 2001, the state mandated that students take the test for the first
time in the Spring of 10th grade. This meant that students in the Class of 2004 took the CAHSEE
as early as Spring 2001 (their 9th grade year) but students in the Class of 2005 did not take the
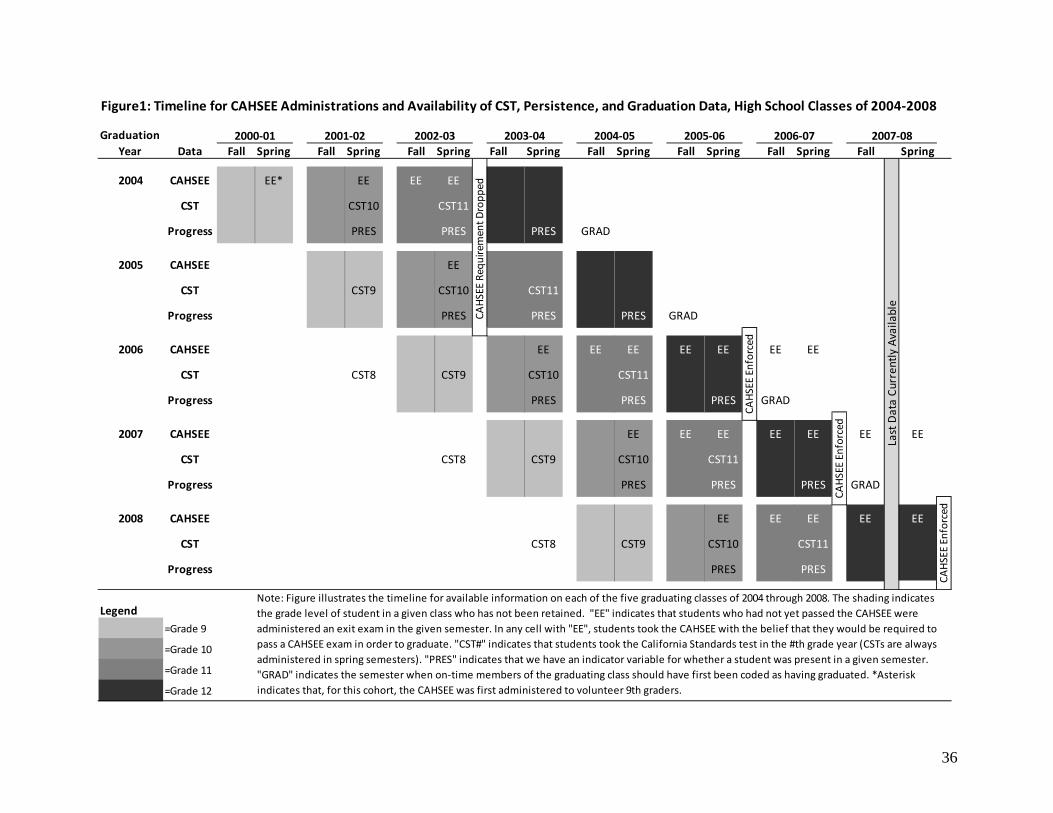
CAHSEE for the first time until Spring 2003 (their 10th grade year). Figure 1 describes the timing
of the CAHSEE administrations for modal students in each cohort.
Figure 1 here
In addition to the change in timing between the first two cohorts to take the CAHSEE,
the State Board of Education voted in July 2003 to rescale the Math section in order to “reduce
cognitive demands for mathematics questions while still assessing the same standards” (Wise
et al., 2003, p. 90) (i.e., they made the math test easier). The decision was made in response to
recommendations from an independent study report released at the end of the 2002‐03 school
year. At the same time, the Board also shortened the ELA testing to a single day.
In July of 2003, after the completion of the Spring 2002–03 administrations of the
CAHSEE (taken by 10th graders in the high school class of 2005 and by juniors in the class of
2004), the State Board of Education voted to defer the CAHSEE requirement for two years.6 As
6 In June 2000, an independent evaluation of the CAHSEE exam’s development, implementation, and effects on students recommended the implementation of the CAHSEE requirement be delayed, stating that:
15

a result, students in the Classes of 2004 and 2005 took the CAHSEE exam at least once under
the belief that passing would be required to graduate, however they were ultimately not
subject to the policy (see Figure 1 above). For those students who were in 10th grade in Spring
2004 or later, however, the CAHSEE requirement has been in place since the beginning of their
10th grade year.7 In this paper we focus on these cohorts of students in order to estimate the
effect of failing the CAHSEE under the threat of not receiving a diploma.
IV. Data
We use longitudinal student‐level data from four large California districts—Fresno, Long
Beach, San Diego, and San Francisco Unified School Districts—to investigate the effects of
failing the CAHSEE. These are four of the eight largest school districts in California, collectively
enrolling over 110,000 high school students (about 5.5 percent of high school students in the
state) annually. For our primary analyses, we use data from three cohorts of students—roughly
“The…reason for considering a delay is that schools will need more time to prepare students to meet the standards assessed by the HSEE…the key legal issue in prior challenges to high stakes test is whether students have been provided adequate instruction in the material covered by the test. Current plans call for students and schools to be fully notified about the exam and its requirement this fall, as the first affected class (the Class of 2004) enters 9th grade. This will be too late to allow very significant changes in the 9th grade curriculum for these students…” (Wise et al., 2000, p. 70)
7 A further minor complication in the CAHSEE timeline arose for the Class of 2006—the first class to ultimately be subject to the CAHSEE exam requirement. In February of their senior year (2006), a lawsuit (Valenzuela v. O’Connell) was filed on behalf of high school students who had not yet passed the CAHSEE exam. The plaintiffs alleged that students had been deprived of a fundamental right to public education and equal opportunity to pass the CAHSEE given the unequal distribution of resources across the states’ schools. Indeed, for twelve days of their final semester, students in the Class of 2006 were relieved by an Alameda Superior Court Judge from their requirement to pass the CAHSEE. This decision was quickly overturned, however, by the California Supreme Court.
One worries that the debate surrounding the legality of the CAHSEE in the Spring of 2006 may have led to some ambiguity for students about whether the CAHSEE would be enforced. However, seniors in the Class of 2006 had already completed their final administration of the CAHSEE before the twelve days when the CAHSEE requirement was temporarily suspended. For the students who entered their final semester of high school having met every graduation requirement except the CAHSEE, perhaps they saw some hope in the looming court case Valenzuela v. O’Connell, however there was never any formal indication from the California Department of Education that the CAHSEE requirement would be waived. The Superintendent of Schools, Jack O’Connell had issued several statements reaffirming his commitment to enforcing the CAHSEE exam for the Class of 2006.
16

defined as the cohorts scheduled to graduate in 2006, 2007, and 2008—for whom the CAHSEE
requirement was binding and for whom we have outcome data.
More specifically, we define a student’s cohort as the year in which he or she was
scheduled to take the CAHSEE for the first time. For almost all students, this is in the Spring of
their (first) 10th grade year, though for a very small number of students (0.6 percent of our total
sample) it occurred in the Spring of their second 9th grade year (because in some districts
repeat 9th graders were considered 10th graders for the purposes of CAHSEE testing). The
stipulation of first‐time tenth graders ensures that students who repeat tenth grade are not
assigned to more than one cohort. Thus, our analyses include students who were scheduled to
take the CAHSEE for the first time in Spring 2004, 2005, and 2006.
As described above, students in each of these cohorts were required to pass the CAHSEE
in order to graduate. We exclude from our primary analyses students from the previous two
cohorts (those in 10th grade in Spring 2002 and 2003), both of whom took the CAHSEE but for
whom it was ultimately not binding. In addition, we exclude from our analyses students
classified as special education students (roughly 10 percent of students), because these
students were not subject to the CAHSEE requirement.
Measures
We estimate the effect of failing the CAHSEE exam on three outcomes—academic
achievement, persistence to 12th grade, and graduation. We measure academic achievement
using the Spring 11th grade English Language Arts (ELA) California Standards Test (CST) score.
We use the ELA rather than the Math CST score in 11th grade because all students take the
17

same 11th grade ELA CST, but take one of a number of different subject/ content math CST tests
(e.g., Geometry, Algebra I), depending on what math course they are enrolled in. Thus, 11th
grade math scores are not comparable across students. Moreover, as we show in Appendix A,
the specific math CST test that a student takes in 11th grade is affected by his or her
performance on the 10th grade CAHSEE, meaning that comparisons of 11th grade CST math
scores of passing and failing students may be biased.
Although we cannot directly determine whether students have dropped out of high
school—because students who leave a given district prior to graduation may be dropouts or
may have left and enrolled elsewhere—we can identify whether students are present in the
district two years after first taking the CAHSEE (in the Spring of 12th grade). We construct a
binary variable indicating whether students are present in the district in a given spring semester
using data on their GPA, their CST score, and their CAHSEE score. Students with any evidence
that they were enrolled and attended school in a given term—specifically, a non‐zero GPA, a
non‐missing CST score, or a non‐missing CAHSEE score—are coded as present in the district in
that term, and not present otherwise. For students who leave the district and then return (are
coded as present in some later term), we retroactively code them as present for all terms prior
to the final one in which they are observed to be present. In addition, students who received a
diploma from the district in an earlier semester are coded as present in order that they not be
counted among leavers/dropouts in our persistence models (i.e., our “present” indicator is
coded 0 for anyone who left the district for good prior to receiving a diploma, and is coded 1 for
those who have graduated or are still enrolled at a given semester).
We use the indicator of presence in Spring of the scheduled 12th grade year as an
18

indicator of persistence in schooling. Of course, some students may not be present in the
district because they have transferred to another district. Nonetheless, if we observe that
failing the CAHSEE affects the probability that a student is present in the district in 12th grade,
we can assume that this is because failing the CAHSEE affects persistence/dropout rates. It is
unlikely that CAHSEE failure affects the probability of transferring to another district within the
state, because students will be subject to the CAHSEE requirement in any district within the
state. It is, however, possible that CAHSEE failure may affect the probability of transferring into
private schools (where the CAHSEE is not required) or even out of the state, but such effects
would likely be extremely small. Thus, we argue that any effects of CAHSEE failure on
persistence are likely due to dropout effects.
Finally, we estimate the effect of failing the CAHSEE on the probability of graduating
from the district, using a binary indicator of graduation status provided by the districts. For
both the persistence and graduation variables, we have data only for the 2004 and 2005 10th
grade cohorts, because our most recent data from the districts is from Fall 2007. For the
achievement variable (CST scores), we have data for each of the 2004‐2006 10th grade cohorts,
because this variable is collected in 11th grade (see Figure 1 above).
Descriptive Statistics
Table 1 displays basic descriptive statistics on these three cohorts, along with California
state‐level comparisons. In general, the four districts have a larger proportion of minority
students than the state as a whole, and much larger shares of English Language Learner
students than the state as a whole. With the exception of Fresno, average test scores of these
19

cohorts when they were in 8th grade and in 10th grade are roughly equal to or higher than
statewide average scores.
Table 1 here
Table 2 summarizes initial CAHSEE passing rates for subgroups of students, broken down
by cohort and district and by race/ethnicity, ELL status, gender, and 8th grade ELA proficiency
level (as defined by state standards on the state 8th grade ELA test). Overall, between three‐
and four‐fifths of students pass each of the CAHSEE exams on their first attempts. These rates
have increased slightly in each district over the three cohorts, and vary by as much as 20
percentage points among the four districts and cohorts.
Table 2 here
Within each district and cohort, white students have the highest initial passing rates on
the CAHSEE, followed by Asian students. It is interesting to note, however, that the initial pass
rates among Asian students is especially variable across districts—as low as about 45.4 percent
in one Fresno cohort but as high as 84.9 percent in one San Francisco cohort, likely a result of
the very different demographics of the Asian populations in each district. Hispanic and African‐
American students have much lower initial passing rates than their white counterparts—51.2
and 51.9 percent, respectively, when averaged across all cohorts and districts, as compared to
85.1 percent for white students.
Students designated as English Language Learners have by far the lowest passing rates
of any demographic group, with an average pass rate of only 19.8 percent (averaged across all
districts and all cohorts). Furthermore, 8th grade CST performance level is a very strong
predictor of subsequent CAHSEE pass rates (see also Kurlaender, Reardon, & Jackson, 2008; Zau
20

& Betts, 2008), which is not surprising given that the CAHSEE is intended to measure skills
largely in line with California’s middle school performance standards. Indeed, a student with an
“advanced” performance level on her 8th grade CST is virtually guaranteed to pass the CAHSEE
in all districts, whereas the pass rates for students who score “far below basic” are generally
only 10‐20 percent. Clearly, results on the 8th grade CST ELA strongly predict CAHSEE
performance two years later, albeit with some variation among districts.
We next examine descriptively the relationship between CAHSEE performance and
subsequent persistence in schooling. In Table 3, we restrict our attention to students who
belong to cohorts 2004 and 2005 (that is, students who were scheduled to graduate in 2006
and 2007), as these are the only two CAHSEE cohorts for whom we have complete data through
the end of their scheduled 12th grade year. For each spring term from 10th grade through the
year following scheduled graduation, we compute the percentages of students in eight
mutually exclusive categories, defined by whether or not the students are still present in the
district and whether they have yet passed one or both sections of the CAHSEE. For each of the
districts, in the Spring of 12th grade there are between 4 and 9 percent of students who are still
enrolled in the district but who have not yet passed both sections of the CAHSEE. Moreover, by
one year after scheduled graduation, there are between 10 and 20 percent of students who are
no longer enrolled in the district and who did not pass both sections of the CAHSEE before
leaving. Of course, some fraction of these students have transferred to other districts where
they may have subsequently passed the CAHSEE and graduated, so these should not be read as
CAHSEE‐induced dropout rates (at best they are upper bounds on such rates). Although these
descriptive analyses do not tell us what the effects of CAHSEE failure are, they do indicate that
21

a non‐trivial proportion of students struggle with passing the CAHSEE, suggesting the CAHSEE
failure effects, if any exist, could affect large numbers of students.
Table 3 here
Finally, Table 4 presents summary statistics on our three outcomes of interest. On
average, Fresno students score slightly lower than the state average on the 8th and 11th grade
ELA CST, San Francisco students score slightly above the state average, and Long Beach and San
Diego students score close to the state mean. In general, graduation rates are 60‐72 percent
(though recall that this understates the true graduation rate of the cohort, as some students
have likely transferred and graduated from other districts). The persistence rates, however, are
generally 8 to 14 percent higher than the graduation rates, indicating that a large number of
students remain in school and in the district through 12th grade, but do not graduate from the
district. It is not clear from these figures, however, to what extent, if any, this failure to
graduate is due to failure to pass the CAHSEE. Certainly some students may not graduate for
failure to accumulate sufficient credits, regardless of whether they have passed the CAHSEE or
not. The goal of our regression discontinuity is to estimate the extent to which early CAHSEE
failure may independently contribute to achievement, persistence rates, and failure to
graduate.
Table 4 here
V. Empirical Strategy
In order to obtain unbiased estimates of the effect of failing the CAHSEE initially, we rely
on a regression discontinuity strategy that compares students who score just below the CAHSEE
22

passing score in 10th grade with those who score just above. Because all pre‐test taking
characteristics of students can reasonably be assumed not to vary sharply across the passing
threshold (meaning students who just barely pass and just barely fail are essentially identical,
on average), any differences in students’ subsequent outcomes (such as later achievement
scores or dropout patterns) can then be attributed to the only thing that systematically differs
between them—failing versus passing the CAHSEE in 10th grade.
We operationalize sco the regression di ntinuity models as
350 Γ (5)
where is the outcome (CST score in 11th grade; presence in Spring 12th grade; graduation)
for student in cohort in district ; is the 10th grade CAHSEE score for student in district
and cohort ; is a continuous function of 10th grade CAHSEE scores; is a vector of student
covariates; Γ is a vector of cohort‐by‐district fixed effects; and is an error term. We fit
variations of this model with and without student covariates, using different functional forms
for (linear, quadratic, and with a linear interaction term with the passing variable), and using
different samples defined by different bandwidths around the cutoff score (25 and 50 points).
The parameter of interest here is , which indicates the average effect of failing the CAHSEE on
the outcome for a student with a score right at the margin of passing. We estimate these
models using OLS (although two of our outcomes are binary, our OLS linear probability models
provide results nearly identical to those from logistic regression models, but the OLS estimates
are much more readily interpretable).
Because there are two CAHSEE tests that students may pass or fail, we estimate four
sets of models for each outcome: we estimate the effect of failing the Math CAHSEE for those
23

students who passed the ELA CAHSEE and for those students who failed the ELA CAHSEE; and
we estimate the effect of failing the ELA CAHSEE for those students who passed the Math
CAHSEE and for those who failed the Math CAHSEE. These models allow us to investigate the
possibility that the effect of failing one test depends not only on which test it is, but also on
whether it is the only test that a student failed.
We estimate each model separately for each district‐by‐cohort sample, for all cohorts
pooled within each district, for all districts pooled within each cohort, and for all districts and
cohorts pooled. The pooled models include district, cohort, or district‐by‐cohort fixed effects as
appropriate. Our most precise estimates come from samples that include all students in each
CAHSEE cohort in all of the four districts. In addition to estimating the effect of failing the
CAHSEE on academic achievement, persistence, and graduation for the total pooled sample, we
also estimate the models separately, by race/ethnicity, gender, ELL status, and free‐/reduced‐
price lunch eligibility status to investigate whether disadvantaged populations experience
different average effects than more advantaged populations (as in Papay et al., 2008).
VI. Results
We begin by examining the estimated effects of failing the CAHSEE ELA or math exam on
subsequent achievement, persistence, and graduation.8 Throughout, it is important to recall
that these regression discontinuity estimates are estimates of the average effect of failing (vs.
passing) the exam for students with scores at the margin of passing. There is good reason to 8 As mentioned above, estimates from the regression discontinuity models depend on the assumption that student characteristics that affect outcomes vary smoothly across the cutoff score. We assess this continuity assumption with regard to observable student characteristics by fitting regression discontinuity models with pre‐10th grade student characteristics as outcome variables. Estimates from these models are shown in Appendix Table A1. We find no evidence of any systematic discontinuity in observable characteristics across the CAHSEE passing score.
24

suspect that they do not generalize to students far from passing, as we discuss in the
conclusion.
Table 5 reports the estimated effects of failing the CAHSEE ELA section. Because the
effects of failing may differ depending on whether a student fails one or both tests, we estimate
the effects separately depending on passing status on the math exam. The top panel reports
the effects of failing the ELA test for those who passed the math portion; the bottom panel
reported the effects of failing the ELA test for those who failed the math portion. Within each
panel, estimated effects within each district can be read across the rows, with the pooled
(across districts) estimates in the bottom row. Estimated effects within each cohort are
reported within each column, with the pooled (across cohorts) estimates under the headings
“2004‐2006” or “2004‐2005.” In the bottom right corner of each set of estimates is the
estimate from the full sample pooled over districts and cohorts. We focus our attention on
these. Sample N’s are reported in Appendix Table A2.
Table 5 here
On average, for students at the margin of passing, failing the ELA CAHSEE has no
significant effect on any of our three outcomes: 11th grade ELA CST scores, persistence to the
12th grade, regardless of whether they passed or failed the math CAHSEE. The point estimates
for the effect of failing the ELA exam on 11th grade ELA CST scores are very small (+1.373and ‐
1.136 among those passing or fail the math test, respectively, roughly two‐one hundredths of a
standard deviation) for the full pooled sample. In Fresno, the pooled cohort estimate shows a
significant negative effect of failing the CAHSEE, but given the large number of hypothesis tests,
we cannot rule out that this may be the result of chance. With regard to persistence through
25

12th grade, our estimates show no statistically significant effect of failing the ELA CAHSEE in 10th
grade, though the point estimates for both students passing the math exam and failing the
math exam are positive (+.030 and +.019, respectively). Likewise, there is no consistent
evidence that failing the ELA CAHSEE affects graduation rates. Only the estimates from San
Francisco suggest that students who fail the ELA exam when also failing the math exam are
significantly less likely to graduate on time when compared to students who just passed the ELA
exam when also failing the math exam. Again, however, these results should be interpreted
cautiously, given the number of hypothesis tests performed. Generally, the pooled sample
models have 80 percent power to detect effects as small as 4‐5 percentage points, so it is
possible that there are modest effects of failing that these data are insufficiently powered to
detect.
Table 6 reports estimated effects of failing the math CAHSEE exam in 10th grade. As
with the ELA CAHSEE failure, there is little evidence of any systematic effect on 11th grade
achievement.9 As above, the estimated (small) negative effect of failing the math CAHSEE
when passing the ELA CAHSEE exam in Fresno (‐4.5 points, roughly 7 percent of a standard
deviation) should be interpreted with caution, given the large number of significance tests
performed. There is also no systematic evidence of an effect on persistence of failing the math
CAHSEE, again with the exception of one district (Long Beach in this case) where the effect is
statistically significant. As above, the multiple hypothesis test caution applies.
9 As noted above, we cannot estimate the effect of failing the Math CAHSEE on 11th grade math CST scores because the 11th grade math CST test that a student takes is determined by what level of math course he or she is in, which may be affected by whether or not a student passes or fails the math CAHSEE. Indeed, Appendix Table A3 shows that the math CST test that a student takes is affected by whether he or she passes the CAHSEE; failing the math CAHSEE in 10th grade lowers the probability that a student will takes a higher‐level CST score. As a result, estimates of the effects of failing the CAHSEE on 11th grade math CST scores would be biased by the systematic differences in the tests taken.
26

Math CAHSEE failure in the 10th grade does appear to negatively affect graduation rates
for those students at the margin of passing the math exam and who failed the ELA exam;
graduation rates for such students are 5.2 percent lower if they fail the math CAHSEE than if
they pass. The estimated effects are similar in sign and magnitude in each of the districts
(ranging from ‐3 to ‐10 percentage points), but are statistically significant only in San Diego, the
largest of the districts in our sample.
Table 6 here
Appendix Table A4 reports estimates for the pooled sample from alternate model
specifications. In general, none of our conclusions change with alternate model specifications.
In sum, then, there is no evidence that CAHSEE failure significantly affects students’ subsequent
achievement or persistence in high school. There is mixed evidence regarding graduation,
however. Of the four pooled district and cohort estimates of effects on graduation, only one is
significant: failing the math CAHSEE appears to negatively affect graduation for students who
also fail the ELA CAHSEE. The inconsistency of these results, particularly given the large number
of hypotheses tested, suggests that we should not make too much of the one statistically
significant estimate from the pooled models.
Moreover, while we cannot rule out the existence of some small effects of failing the
CAHSEE on students near the passing threshold, the standard errors of our estimates are small
enough to rule out moderate to large effects (minimum detectable effects on graduation and
persistence are 4‐5 percentage points; minimum detectable effects on achievement are .03‐.04
standard deviations). Thus, if there are effects of failing a CAHSEE exam in 10th grade for
students at the margin of passing, they are not large.
27

The results above suggest little or no effect of failing the CAHSEE exam in 10th grade.
The effects of failing may be quite different at later points in high school, however. In order to
examine this, we fit regression discontinuity models to estimate the effect of failing the CAHSEE
in Spring 12th grade on subsequent graduation rates. As seen in Table 7, failing one CAHSEE
exam in the Spring of 12th grade has a large negative effect on graduation rates for students
who previously or concurrently passed the other exam, a finding consistent with Martorell
(2005). In particular, students who passed the math or ELA CAHSEE before Spring of 12th grade
but failed the other exam at the end of their senior year had graduation rates 42 and 47
percent lower, respectively, than their peers who passed the remaining exam in 12th grade.10
Table 7 here
Our final analysis investigates the effects of CAHSEE failure among student subgroups.
Table 8 reports estimates from subsamples of students by race/ethnicity, gender, free‐
/reduced‐price lunch eligibility, and ELL status. The top row of Table 8 shows the average
effects of failing the CAHSEE from the pooled analyses (these are the same as those in the
bottom right cells of each section of Tables 5 and 6). In general, there is no apparent consistent
pattern of significant effects for any subgroup. Overall, 12 of 120 subgroup effect estimates are
significant at .05, double what we would expect by chance. However, the significant
effects are not obviously clustered in any one subgroup. The only small pattern perhaps is that
black and poor students have higher persistence and graduation rates when they fail a single
test but pass the other than when they pass both (all eight point estimates are positive and five
10 Failing the CAHSEE in 12th grade does not reduce the probability of graduation by 100 percent, as one might expect, largely because many students who passed both exams did not graduate for other reasons, such as not having enough credits accumulated. In addition, a small number of students are coded as having received a diploma, despite the fact they did not pass both sections of the CAHSEE.
28

are significant for these cells). Still, we caution against over‐interpreting this constellation of
apparently significant effects, given the large number of hypothesis tests and the chance of
spurious patterns of results. More importantly, there is no evidence that failing the tests has
disproportionately negative effects for disadvantaged groups. Although the effects of failing
the math exam when also failing the ELA exam are significant for Hispanic students, females,
and low‐income students, the effects for these groups are not significantly different than for
the other groups.
Table 8 here
VII. Discussion and Conclusion
In this paper, we used a regression discontinuity design to estimate the effects of failing
a high school exit exam in 10th grade for the population of students with scores near the cutoff.
We find little evidence of any systematic positive or negative effects of failing an exit exam,
with the possible exception of a negative effect on graduation rates of failing the math exit
exam when also failing the ELA exam. However, we caution against overgeneralization of this
finding of no effects. While the regression discontinuity design provides unbiased estimation of
these effects, the estimates are strictly generalizable only to a particular subset of the
population of students who fail the exit exam—those who score near the passing score. These
estimates do not, for example, indicate the effect of failing the exam for students with very low
skills, whose scores are far from the passing threshold. For these students, it is quite plausible
29

that the effects may differ (positively or negatively) from those estimated here.11
While our results are consistent with some prior work—namely Martorell’s (2005)
analysis of the effects of failing the Texas exit exam—they are less consistent with Papay,
Murnane, and Willet’s (2008) key finding using Massachusetts data. Papay and colleagues find
that failing the Massachusetts exit exam in 10th grade reduces graduation rates of low‐income
urban students by 8 percentage point. While we do find a negative effect of failing an exam on
graduation rates in one of our four discontinuity samples (those estimating the effect of failing
the math exam when also failing the ELA exam), this effect is not restricted to low‐income
students in our four urban districts. In fact, when we restrict our sample to low‐income or
African American students, we find that failing one of the two exams in 10th grade appears to
increase graduation rates for these students by 5‐7 percentage points (with the caveat noted
above regarding the multiple hypothesis tests).
Why might exit exam failure have so little effect on subsequent educational outcomes?
One possibility is that students close to the passing threshold are likely to pass subsequently,
and so the threat of not graduating is not particularly strong for these students and thus causes
little change in their behavior or that of their schools. Indeed, Figures 2 and 3 indicate that,
for students who score just below the 350 cutoff score in spring of tenth grade, there is a low
probability that they will not ultimately pass by spring of twelfth grade. Figure 2 illustrates this
pattern by focusing on students who did not pass the math CAHSEE on their initial attempt
(spring of tenth grade) but who did pass the ELA portion. For these students, passing the math
11 In fact, in preliminary analyses comparing outcomes of low‐skill students in cohorts who were and were no required to pass the CAHSEE, we find a substantial negative effect of the CAHSEE policy on graduation rates for low‐skill students. These analyses are the subject of companion paper to this one.
30

section of the CAHSEE is the only remaining exit exam obstacle to graduation. We can see in
Figure 2 that, across the four semesters between spring of tenth grade and spring of twelfth
grade, the proportion of students who are still present but have not passed diminishes over
time and is virtually non‐existent by the final semester. Figure 3 illustrates the same pattern for
students who initially fail the ELA section but pass the math section on their first attempt.
Figures 2 and 3 here
Another possible explanation for why exit exam failure might have no effect on
subsequent educational outcomes is that, while the threat of failing causes increased student
motivation and effort as well as intervention by their schools that increase students’ cognitive
skills sufficiently to pass the test, those responses are not enough to impact student
achievement on state standardized CST tests.
In general, when a student fails on his or her first attempt at the CAHSEE in tenth grade,
California districts are expected to intervene in some way to ensure that the student has the
opportunity to acquire missing skills before they graduate. However, a great deal of variation
exists in how districts ensure that these students receive support; indeed, a great deal of
variation also seems to exist across schools within the same district, based on our conversations
with district officials in the four districts studied. Each of the four districts reports making use
of some sort of school‐level coordinator who is responsible for monitoring student intervention
plans and communicating those plans to the district. In addition, schools in each district have
created CAHSEE‐targeted remedial courses into which first‐time failers are placed in 11th grade,
though these courses may vary considerably across schools. Nonetheless, in some additional
analyses (not shown here), we find little variation among schools and districts in students’
31

initial and subsequent CAHSEE passing rates, conditional on students’ prior test scores (which
are very strong predictors of passing). This suggests that variation among schools in CAHSEE
preparation and remediation strategies yields little variation in student outcomes, though we
plan to investigate this further in order to determine if there are strategies used by some
schools that lead to better CAHSEE outcomes for students who initially fail one or both of the
tests.
Finally, it is important to note that our estimates here reflect the impact of failing the
CAHSEE exam in 10th grade, given that the exit exam policy is in place. These should not be
compared with estimates of the effect of the policy itself, which prior work suggests may lead
to higher dropout rates (Dee and Jacob, 2006; Warren et al 2006). We plan to investigate this
in a companion paper to the present one.
32
References Cited
Amerin, A. L., & Berliner, D. C. (2002). An analysis of some unintended and negative
consequences of high‐stakes testing (No. ESPL‐0211‐125‐EPRU). Tempe, AZ: Educational
Policy Resarch Unit, Education Policy Studies Laboratory, Arizona State University.
Bishop, J. H., & Mane, F. (2001). The impacts of minimum competency exam graduation
requirements on high school graduation, college attendance and early labor market
success. Labour Economics, 8(2), 203‐222.
Booher‐Jennings, J. (2005). Below the Bubble: "Educational Triage" and the Texas
Accountability System. American Educational Research Journal, 42(2), 231‐268.
Carnoy, M., & Loeb, S. (2002). Does external accountability affect student outcomes? A cross‐
state analysis. Educational Evaluation and Policy Analysis, 24, 305‐331.
Catterall, J. S. (1989). Standards and school dropouts: A national study of tests required for high
school graduation. American Journal of Education, 98(1), 1‐34.
Center on Education Policy. (2004). State High School Exit Exams: States Try Harder But Gaps
Persist. Washington, DC: Center on Education Policy.
Center on Education Policy. (2005). How have high school exit exams changed our schools?
Some perspectives from Virginia and Maryland. . Washington, DC: Center on Education
Policy.
Dee, T. S., & Jacob, B. A. (2006). Do High School Exit Exams Influence Educational Attainment or
Labor Market Performance?Unpublished manuscript.
Greene, J. P., & Winters, M. A. (2004). Pushed out or pulled up? Exit exams and dropout rates in
public high schools. New York: Manhattan Institute.
33

Griffin, B. W., & Heidorn, M. H. (1996). An examination of the relationship between minimum
competency test performance and dropping out of high school. Educational Evaluation
and Policy Analysis, 18(3), 243‐252.
Jacob, B. A. (2001). Getting tough? The impact of high school graduation exams. Educational
Evaluation and Policy Analysis, 23(2), 99‐121.
Kurlaender, M., Reardon, S. F., & Jackson, J. (2008). Middle School Predictors of High School
Achievement in Three California School Districts: California Dropout Research Project.
Marchant, G. J., & Paulson, S. E. (2005). The Relationship of High School Graduation Exams to
Graduation Rates and SAT Scores [Electronic Version]. Education Policy Analysis
Archives, 13,
Martorell, P. (2005). Do high school exit exams matter? Evaluating the effects of high school
exit exam performance on student outcomes. University of California, Berkeley.
Neal, D., & Schanzenbach, D. (2007). Left Behind by Design: Proficiency Counts and Test‐Based
Accountability National Bureau of Economic Research.
Papay, J. P., Murnane, R. J., & WIllet, J. B. (2008). The consequences of High School Exit
Examinations for Struggling Low‐Income Urban Students: Evidence from Massachusetts:
National Bureau of Economic Research.
Reardon, S. F., & Galindo, C. (2002, April). Do High‐Stakes Tests Affect Students' Decisions to
Drop Out of School? Evidence from NELS. Paper presented at the Annual Meeting of the
American Educational Research Association, New Orleans.
Warren, J. R., & Edwards, M. R. (2005). High School Exit Examinations and High School
Completion: Evidence From the Early 1990s. Educational Evaluation and Policy Analysis,
34

35
27(1), 53‐74.
Warren, J. R., & Jenkins, K. N. (2005). High School Exit Examinations and High School Dropout in
Texas and Florida, 1971 ‐ 2000. Sociology of Education, 78, 122‐143.
Warren, J. R., Jenkins, K. N., & Kulick, R. B. (2006). High School Exit Examinations and State‐Level
Completion and GED Rates, 1972‐2002. Educational Evaluation and Policy Analysis,
28(2).
Wise, L. L., DeMeyer Harris, C., Brown, D. G., Becker, D. E. S., Sun, S., & Coumbe, K. L. (2003).
California High School Exit Examination (CAHSEE): Year 4 Evaluation Report.
Sacramento, CA: Human Resources Research Organization, for the California State
Department of Education.
Wise, L. L., DeMeyer Harris, C., Sipes, D. E. S., Hoffman, G. R., & Ford, P. J. (2000). High School
Exit Examination (HSEE): Year 1 Evaluation Report. Sacramento, CA: Human Resources
Research Organization, for the California State Department of Education.
Zau, A. C., & Betts, J. R. (2008). Predicting Success, Preventing Failure: An Investigation of the
California High School Exit Exam. San Francisco, CA: Public Policy Institute of California.
Data Fall Spring Fall Spring Fall Spring Spring Fall Spring Fall Spring Fall Spring Fall Spring
2004 CAHSEE EE* EE EE EE
CST CST10 CST11
Progress PRES PRES PRES GRAD
2005 CAHSEE EE
CST CST9 CST10 CST11
Progress PRES PRES PRES GRAD
2006 CAHSEE EE EE EE EE EE EE EE
CST CST8 CST9 CST10 CST11
Progress PRES PRES PRES GRAD
2007 CAHSEE EE EE EE EE EE EE EE
CST CST8 CST9 CST10 CST11
Progress PRES PRES PRES GRAD
2008 CAHSEE EE EE EE EE EE
CST CST8 CST9 CST10 CST11
Progress PRES PRES
Legend
2003‐04
=Grade 11
CAHSEE Enforced
CAHSEE Enforced
CAHSEE Enforced
Graduation Year
2006‐07 2007‐082000‐01 2001‐02 2002‐03
Figure1: Timeline for CAHSEE Administrations and Availability of CST, Persistence, and Graduation Data, High School Classes of 2004‐2008
=Grade 12
2004‐05 2005‐06Fall
CAHSEE Requ
irement D
ropp
ed
Note: Figure illustrates the timeline for available information on each of the five graduating classes of 2004 through 2008. The shading indicates the grade level of student in a given class who has not been retained. "EE" indicates that students who had not yet passed the CAHSEE were administered an exit exam in the given semester. In any cell with "EE", students took the CAHSEE with the belief that they would be required to pass a CAHSEE exam in order to graduate. "CST#" indicates that students took the California Standards test in the #th grade year (CSTs are always administered in spring semesters). "PRES" indicates that we have an indicator variable for whether a student was present in a given semester. "GRAD" indicates the semester when on‐time members of the graduating class should have first been coded as having graduated. *Asterisk indicates that, for this cohort, the CAHSEE was first administered to volunteer 9th graders.
Last Data Cu
rrently
Available
=Grade 9
=Grade 10
36

37 37

38 38

Total White Asian Hispanic Black ELL FemaleN % % % % % % %
2004 5,489 20.6 20.1 47.9 10.6 29.4 18.4 50.0 299.1 305.1 314.42005 5,305 19.7 21.4 46.9 11.2 25.3 18.9 50.5 297.5 307.6 313.32006 5,396 17.8 19.4 50.4 11.6 23.3 10.0 51.3 297.7 310.1 311.0
2004 6,709 19.0 19.4 41.4 20.1 19.9 7.1 48.9 320.1 320.0 326.32005 6,549 18.9 19.4 41.6 19.8 17.0 7.4 49.9 332.9 325.9 326.92006 7,051 18.8 17.6 43.2 19.8 14.8 7.2 50.1 332.9 329.0 324.3
2004 9,174 28.1 20.2 37.0 14.1 15.1 9.6 49.5 295.0 326.6 330.92005 9,269 27.7 18.6 38.2 15.1 16.5 10.9 50.1 302.7 329.0 331.62006 9,392 28.9 17.8 39.0 13.7 15.5 11.1 50.3 312.4 334.9 332.6
2004 4,796 10.2 49.3 18.1 11.6 17.9 10.2 48.8 335.3 326.1 337.82005 4,776 9.1 49.1 18.1 13.3 18.3 10.7 47.5 347.4 330.7 335.72006 4,564 9.2 49.3 19.9 12.1 17.5 10.7 48.8 345.0 336.7 339.3
2004 490,465 32.5 11.1 46.0 8.1 5.1 10.2 48.7 307.4 323.3 328.12005 497,203 31.3 11.3 46.8 8.0 5.1 10.2 48.8 311.2 324.4 328.52006 515,761 30.3 11.4 47.6 7.8 5.2 10.1 48.7 311.1 328.1 328.5
Note: Students are assigned to a cohort based on the calendar year in which they first took the CAHSEE. For 99.4 percent of the sample, this occurred in Spring of 10th grade. However, in limited cases, students took the CAHSEE in an earlier grade level. Usually this occurred when a student was retained in 9th grade for a second year. Students are designated as "ELL" if they were not a native English speaker, were not initially fluent in English, and had not been redesignated fluent in Spring of 10th grade. A student was categorized as a special education student if he or she had ever received special education services or had been designated special education status at any point after 8th grade.
San
Diego
State
Total
10th Grade Cohort
San
Francisco
Long
Be
ach
10th Grade ELA
8th Grade Math
Special Eduation
Race/ Ethnicity8th
Grade ELA
Fresno
Table 1. Selected Student Demographics, by District and Tenth Grade Cohorts
Student Characteristics Average CST Scores
39

40
10th Grade Cohort 2004 2005 2006 2004 2005 2006 2004 2005 2006 2004 2005 2006N 4,479 4,300 4,858 6,233 6,062 6,544 8,298 8,255 8,349 4,308 4,266 4,074
Percent Who Pass ELA CAHSEE on First AttemptAll Non Special‐Ed 64.3 69.4 69.1 74.1 76.3 77.4 78.0 80.4 82.1 78.0 79.3 79.5
Percent Who Pass Math CAHSEE on First AttemptAll Non Special‐Ed 61.7 64.5 66.4 71.6 72.2 73.0 74.1 76.1 80.8 80.9 83.7 81.8
Percent Who Pass Both ELA and Math CAHSEE on First AttemptOverall
All Non Special‐Ed 53.1 57.0 57.9 64.7 66.0 67.2 67.8 70.3 74.4 71.7 73.4 73.1Ethnicity
White 75.6 78.2 79.5 89.2 87.7 89.8 86.8 88.4 91.8 85.9 89.0 87.1Asian 55.1 61.2 61.0 74.2 76.1 78.7 79.3 83.7 83.9 81.9 82.0 83.0Hispanic 44.7 47.6 50.5 53.5 54.7 58.4 49.9 53.6 59.1 50.5 56.0 52.8African American 42.6 48.3 48.5 54.6 56.7 54.6 54.7 60.5 64.4 43.3 46.6 46.7
ELL StatusELL 22.3 22.9 18.4 17.1 15.9 15.3 15.1 23.4 22.5 26.9 32.6 26.0Not ELL 66.3 68.4 69.0 75.8 75.6 75.5 76.3 79.2 82.8 81.3 82.3 82.9
GenderFemale 55.1 58.4 57.7 66.7 68.0 68.7 67.2 70.2 75.5 72.1 74.3 73.4Male 50.9 55.6 58.2 62.6 63.9 65.6 68.3 70.4 73.1 71.3 72.5 72.7
8th Grade ELA Performance LevelFar Below Basic 8.8 12.7 8.6 9.2 8.6 11.2 8.3 18.4 16.1 15.0 23.0 19.0Below Basic 32.4 36.6 37.2 31.3 30.4 28.7 36.2 37.4 37.2 44.2 52.0 37.6Basic 74.8 75.9 74.7 76.9 72.5 72.8 77.1 76.5 78.1 85.0 83.5 79.5Proficient 94.0 95.6 96.4 96.0 95.2 96.5 95.4 95.3 96.9 98.5 97.0 96.8Advanced 100.0 97.7 99.0 99.0 99.2 99.2 98.9 98.5 99.0 99.2 99.4 99.1
San Francisco
Note: Cell contents represent the percentage of students in each subcategory who passed either the ELA, MATH, or BOTH sections of their first CAHSEE administration. Students are assigned to a cohort based on the calendar year in which they first took the CAHSEE. For 99.4 percent of the sample, this occurred in Spring of 10th grade. However, in limited cases, students took the CAHSEE in an earlier grade level. Usually this occurred when a student was retained in ninth grade for a second year. Students are designated as "ELL" if they were not a native English speaker, were not initially fluent in English, and had not been redesignated fluent in Spring of 10th grade. A student was designated as a special education student if he or she had ever received special education services or had been designated special education status between 8th and 13th grade. This sample does not include students who were ever designated as special education status after 8th grade.
Table 2. Initial Attempt Passing Rates for Each Tenth Grade Cohort, by Student Characteristics
Fresno Long Beach San Diego

Status Spring 10 Spring 11 Spring 12 Spring 12+1
Still Present, Passed Both 54.1 63.5 64.4 1.6Still Present, Passed Math Only 7.9 6.1 3.0 0Still Present, Passed ELA Only 11.6 6.3 2.9 0Still Present, Took but Passed None 24.7 10.3 2.9 0.5Still Present, Not Yet Attempted 1.7 0.3 0.0 0.0No Longer Present, Passed Both Before Leaving . 5.4 10.5 15.0No Longer Present, Did Not Pass Both Before Leaving . 8.1 14.6 19.9No Longer Present because Graduated (Passed Both) . 0.0 1.7 61.7
Number 8,779 8,779 8,779 4,479
Spring 10 Spring 11 Spring 12 Spring 12+1
Still Present, Passed Both 64.9 73.2 73.6 1.4Still Present, Passed Math Only 6.5 3.8 1.5 0Still Present, Passed ELA Only 9.8 6.0 2.1 0Still Present, Took but Passed None 18.1 6.5 1.7 0Still Present, Not Yet Attempted 0.7 0.1 0.0 0.0No Longer Present, Passed Both Before Leaving . 4.7 11.0 15.8No Longer Present, Did Not Pass Both Before Leaving . 5.6 10.2 14.2No Longer Present because Graduated (Passed Both) . 0.0 0.0 68.2
Number 12,295 12,295 12,295 6,233
Spring 10 Spring 11 Spring 12 Spring 12+1
Still Present, Passed Both 68.0 71.9 66.4 1.5Still Present, Passed Math Only 6.0 3.3 1.3 0Still Present, Passed ELA Only 10.0 5.4 1.7 0Still Present, Took but Passed None 14.5 4.9 1.5 0Still Present, Not Yet Attempted 1.5 0.2 0.1 0.0No Longer Present, Passed Both Before Leaving . 7.1 17.8 22.3No Longer Present, Did Not Pass Both Before Leaving . 7.4 11.0 14.5No Longer Present because Graduated (Passed Both) . 0.0 0.4 60.8
Number 16,553 16,553 16,553 8,298
Spring 10 Spring 11 Spring 12 Spring 12+1
Still Present, Passed Both 71.7 78.3 75.9 2.3Still Present, Passed Math Only 9.6 5.1 2.2 0Still Present, Passed ELA Only 6.0 3.3 1.3 0Still Present, Took but Passed None 11.5 3.9 1.1 0Still Present, Not Yet Attempted 1.2 0.2 0.1 0.0No Longer Present, Passed Both Before Leaving . 3.7 10.0 13.6No Longer Present, Did Not Pass Both Before Leaving . 5.4 8.8 11.0No Longer Present because Graduated (Passed Both) . 0.0 0.8 71.8
Number 8,574 8,574 8,574 4,308
Table 3. Grade‐By‐Grade CAHSEE Status, Tenth Grade Cohorts 2004 and 2005, by District
Note: Only students in cohorts 2004 and 2005 are included in this table, with the exception of the Spring '12+1' column which is only based on the 2004 cohort. We do not have data from the 2005 cohort from the year after 12th grade (Spring 2008). Students in other cohorts either were not ultimately eligible for the CAHSEE requirement, or they have not yet completed the year after 12th grade. Students in Students are assigned to a cohort based on the calendar year in which they first took the CAHSEE. For 99.4 percent of the sample, this occurred in Spring of 10th grade. However, in limited cases, students took the CAHSEE in an earlier grade level. Usually this occurred when a student was retained in ninth grade for a second year. Note also that this sample does not include students who had ever been cate
.5
.9
.1
.1
.2
.3
.4
.3
.8
.3
.2
gorized as a special education student at any point after 8th grade.
Fresno
Long Beach
San Diego
San Francisco
41

District 2004 2005 2006
Fresno 315.5 316.4 316.2Long Beach 326.5 328.0 327.9San Diego 335.2 334.4 339.7
San Francisco 345.1 346.5 355.8State Average 328.5 328.5 331.3
Fresno 62.1 59.8 n/aLong Beach 68.2 67.2 n/aSan Diego 60.8 60.0 n/a
San Francisco 71.9 72.5 n/a
Fresno 74.8 73.7 n/aLong Beach 79.6 77.9 n/aSan Diego 71.2 71.0 n/a
San Francisco 80.0 81.8 n/a
Note: Students are assigned to a cohort based on the calendar year in which they first took the CAHSEE. For 99.4 percent of the sample, this occurred in Spring of 10th grade. However, in limited cases, students took the CAHSEE in an earlier grade level. Usually this occurred when a student was retained in ninth grade for a second year. Note also that this sample does not include students who had ever been categorized as a special education student at any point after 8th grade. The graduation information was provided by each of the districts and is distinguished here from receiving a certificate of completion. The graduation percentage present reported here include those few students (about 1.1%) who graduate early (prior to spring of 12th grade).
Table 4. Summary Statistics of Outcomes, by Tenth Grade Cohort and District
Cohort
Average 11th Grade ELA CST Score
Percent Present (or already Graduated) in Spring 12th Grade
Graduation Rate
42

DistrictFresno 2.835 ‐0.322 5.462 2.127 0.042 0.050 0.054 0.078 ‐0.007 0.044
(3.879) (4.743) (3.919) (2.364) (0.040) (0.048) (0.030) (0.043) (0.053) (0.033)
Long Beach 2.034 ‐2.118 1.544 0.506 0.078 * 0.010 0.043 0.082 0.024 0.053(3.926) (4.360) (4.325) (2.419) (0.038) (0.042) (0.028) (0.042) (0.046) (0.031)
San Diego ‐2.204 5.284 ‐5.142 ‐1.204 0.018 0.040 0.029 0.012 0.028 0.019(4.860) (4.925) (4.042) (2.619) (0.047) (0.045) (0.033) (0.050) (0.048) (0.034)
San Francisco 9.700 6.380 2.255 6.146 0.015 ‐0.042 ‐0.012 0.056 ‐0.025 0.019(5.060) (6.300) (6.340) (3.318) (0.046) (0.052) (0.034) (0.053) (0.062) (0.040)
All Districts 3.223 0.743 0.164 1.373 0.038 0.020 0.030 0.056 * 0.008 0.033(2.196) (2.494) (2.217) (1.322) (0.022) (0.023) (0.016) (0.024) (0.026) (0.017)
DistrictFresno ‐0.097 ‐7.672 ‐4.522 ‐4.491 * 0.043 0.003 0.023 0.001 0.036 0.016
(3.707) (3.958) (3.969) (2.242) (0.050) (0.051) (0.036) (0.052) (0.054) (0.038)
Long Beach ‐0.461 ‐0.161 ‐1.247 ‐0.401 0.080 ‐0.002 0.037 0.004 ‐0.080 ‐0.040(3.667) (3.560) (3.521) (2.056) (0.046) (0.046) (0.032) (0.047) (0.046) (0.032)
San Diego 2.050 ‐3.935 ‐0.967 ‐0.852 0.028 ‐0.008 0.010 ‐0.033 0.052 0.006(3.732) (3.861) (4.358) (2.272) (0.048) (0.049) (0.034) (0.045) (0.044) (0.032)
San Francisco 1.546 4.095 11.405 5.426 0.001 ‐0.066 ‐0.032 ‐0.190 * ‐0.094 ‐0.128 *(7.412) (7.927) (8.329) (4.453) (0.087) (0.094) (0.063) (0.087) (0.093) (0.062)
All Districts 0.768 ‐3.153 ‐1.518 ‐1.136 0.044 ‐0.003 0.019 ‐0.031 ‐0.007 ‐0.018(2.042) (2.101) (2.169) (1.214) (0.026) (0.027) (0.019) (0.026) (0.026) (0.018)
2004 2005
2004 2005 2004‐2005
Table 5: Estimated Effects of Failing CAHSEE ELA Section, by District and Cohort, on Achievement, Persistence, and Graduation, by Score on Math CAHSEE
When Passing Math CAHSEE
When Failing Math CAHSEE
2004‐2006 2004‐2005Graduation
2004Present, Spring of 12th Grade
Present, Spring of 12th Grade
11th Grade ELA CST
2004‐20052004‐2006 2004 2005
2005
Notes: * p<0.05, ** p<0.01, *** p<0.001. The estimated models regress the outcome variable on the centered ELA scale score, the centered ELA scale score squared, an indicator variable that equals one if a student failed the ELA exam and a vector of covariates. The above table reports the point estimate and standard error on the coefficient estimating the effect of failing the ELA CASHEE exam on each of the three outcome variables. All models restrict the sample to students scoring 300‐400 on the ELA CAHSEE. Models for students who fail the Math CAHSEE further restrict the sample to students who score 300‐349 on that exam. Models for students who pass the Math CAHSEE are limited to students who scored 350‐400 on that exam. Models that combine districts use district‐fixed effects; those combining cohorts use cohort‐fixed effects. Models combining both districts and cohorts use district by cohort‐fixed effects. All models not using the San Diego sample include the include the following covariates: English language learner classification, free lunch, gender, race/ ethnicity, Spring 10th grade GPA, and 8th Grade CST scores for both ELA and Math. Any models using the San Diego data excluded the free lunch status, as we did not have this data for SDUSD. See text for details regarding the construction of cohorts and outcome variables. All models exclude students who were classified as "Special Education" at any point.
11th Grade ELA CST2004
2004 2005 2006 2004‐2005
2005 2006Graduation
43

44
DistrictFresno ‐3.948 ‐8.404 * ‐1.263 ‐4.523 * 0.025 ‐0.023 0.000 0.038 ‐0.004 0.015
(3.687) (3.924) (3.567) (2.149) (0.037) (0.038) (0.026) (0.039) (0.042) (0.028)
Long Beach ‐4.193 3.047 ‐1.480 ‐0.769 0.044 0.066 0.052 * 0.043 0.076 * 0.056 *(3.551) (3.620) (3.709) (2.088) (0.034) (0.034) (0.024) (0.038) (0.037) (0.026)
San Diego 5.592 1.091 ‐4.824 1.048 0.001 0.045 0.021 ‐0.012 0.026 0.007(3.379) (3.586) (3.743) (2.045) (0.033) (0.033) (0.023) (0.035) (0.035) (0.025)
San Francisco 2.843 ‐2.559 4.311 1.083 ‐0.092 0.053 ‐0.017 ‐0.068 0.056 ‐0.005(5.730) (6.812) (6.775) (3.641) (0.052) (0.056) (0.037) (0.057) (0.064) (0.042)
All Districts ‐0.128 ‐0.895 ‐2.504 ‐1.103 0.005 0.035 0.020 0.007 0.037 0.023(1.912) (2.052) (2.038) (1.155) (0.019) (0.019) (0.013) (0.020) (0.021) (0.014)
DistrictFresno ‐1.773 2.820 ‐1.535 ‐0.800 0.051 ‐0.142 * ‐0.034 ‐0.053 ‐0.011 ‐0.033
(3.939) (4.395) (4.101) (2.361) (0.057) (0.065) (0.042) (0.062) (0.069) (0.045)
Long Beach ‐4.487 ‐0.744 ‐1.268 ‐2.100 ‐0.046 0.063 0.005 ‐0.034 ‐0.050 ‐0.048(3.924) (3.917) (3.985) (2.262) (0.049) (0.057) (0.037) (0.050) (0.054) (0.037)
San Diego ‐0.907 4.938 0.653 1.070 ‐0.086 ‐0.044 ‐0.062 ‐0.132 * ‐0.023 ‐0.074 *(4.446) (4.599) (4.446) (2.566) (0.059) (0.059) (0.042) (0.053) (0.051) (0.037)
San Francisco ‐6.366 ‐2.230 7.787 ‐1.876 0.051 0.016 0.014 ‐0.088 ‐0.100 ‐0.101(7.073) (7.692) (8.137) (4.265) (0.077) (0.089) (0.057) (0.081) (0.091) (0.058)
All Districts ‐2.442 1.137 0.103 ‐0.575 ‐0.011 ‐0.031 ‐0.019 ‐0.065 * ‐0.038 ‐0.052 *(2.181) (2.311) (2.268) (1.297) (0.029) (0.032) (0.021) (0.029) (0.030) (0.021)
2005 2004‐2005
Notes: * p<0.05, ** p<0.01, *** p<0.001. The estimated models regress the outcome variable on the centered math scale score, the centered math scale score squared, an indicator variable that equals one if a student failed the math exam and a vector of covariates. The above table reports the point estimate and standard error on the coefficient estimating the effect of failing the math CASHEE exam on each of the three outcome variables. All models restrict the sample to students scoring 300‐400 on the math CAHSEE. Models for students who fail the ELA CAHSEE further restrict the sample to students who score 300‐349 on that exam. Models for students who pass the ELA CAHSEE are limited to students who scored 350‐400 on that exam. Models that combine districts use district‐fixed effects; those combining cohorts use cohort‐fixed effects. Models combining both districts and cohorts use district by cohort‐fixed effects. All models not using the San Diego sample include the include the following covariates: English language learner classification, free lunch, gender, race/ ethnicity, Spring 10th grade GPA, and 8th Grade CST scores for both ELA and Math. Any models using the San Diego data excluded the free lunch status, as we did not have this data for SDUSD. See text for details regarding the construction of cohorts and outcome variables. All models exclude students who were classified as "Special Education" at any point.
2004 2005 2004‐2005 20042004 2005 2006 2004‐2006
2005
11th Grade ELA CST Present, Spring of 12th Grade Graduation
2004‐2006 2004 2004‐2005
When Failing ELA CAHSEE
2004
Table 6: Estimated Effects of Failing CAHSEE Math Section, by District and Cohort, on Achievement, Persistence, and Graduation, by Score on ELA CAHSEE
When Passing ELA CAHSEE11th Grade ELA CST Present, Spring of 12th Grade Graduation
20042005 2006 2005 2004‐2005

Effect of Failing ELA CAHSEEFor Students who:
-0.472 ***(0.040)
N 1123Passed Math CAHSEE in Spring 12 -0.197 *
(0.089)
N 259Failed Math CAHSEE in Spring 12 -0.022
(0.043)
N 713
Effect of Failing Math CAHSEEFor Students who:
-0.418 ***(0.037)
N 1336Passed Math CAHSEE in Spring 12 -0.236 **
(0.091)
N 247Failed Math CAHSEE in Spring 12 0.005
(0.041)
N 736
Table 7: Estimated Effects of Failing Spring 12th Grade CAHSEE on Graduation
Notes: * p<0.05, ** p<0.01, *** p<0.001. Models use students from all four districts in the 2004 and 2005 cohorts. All models use district by cohort‐fixed effects.The estimated models regress the outcome variable on the centered Math/ ELA scale score, the centered Math/ ELA scale score squared, and an indicator variable that equals one if a student failed the Math/ ELA exam. The above table reports the point estimate and standard error on the coefficient estimating the effect of failing the Math/ELA CASHEE exam graduating. All models restrict the sample to students scoring 300‐400 on the relevant CAHSEE exam section. See text for details regarding the construction of cohorts and outcome variables. All models exclude students who were classified as "Special Education" at any point.
Passed Math CAHSEE Before Spring 12th
Passed Math CAHSEE Before Spring 12th
45

Overall ‐1.136 0.019 ‐0.018 1.373 0.030 0.033 ‐0.575 ‐0.019 ‐0.052 * ‐1.103 0.020 0.023(1.214) (0.019) (0.018) (1.322) (0.016) (0.017) (1.297) (0.021) (0.021) (1.155) (0.013) (0.014)
By RaceWhite ‐7.272 0.065 ‐0.024 0.249 0.000 0.001 ‐0.203 0.144 0.037 ‐0.628 ‐0.033 ‐0.064
(5.670) (0.077) (0.077) (5.856) (0.061) (0.066) (6.462) (0.095) (0.090) (4.124) (0.041) (0.044)Black ‐2.006 0.035 ‐0.012 ‐2.639 0.122 ** 0.057 2.695 ‐0.051 ‐0.009 ‐3.880 0.077 * 0.068 *
(2.920) (0.041) (0.041) (3.904) (0.046) (0.049) (3.646) (0.059) (0.056) (2.714) (0.031) (0.033)Hispanic ‐0.176 0.023 ‐0.007 1.004 0.031 0.024 ‐0.894 ‐0.029 ‐0.081 ** ‐0.072 0.005 0.010
(1.552) (0.025) (0.024) (1.864) (0.024) (0.026) (1.743) (0.030) (0.028) (1.564) (0.019) (0.021)Asian ‐9.316 ** ‐0.071 ‐0.069 4.657 * 0.012 0.052 ‐3.478 ‐0.072 ‐0.056 ‐1.478 0.015 0.052
(3.576) (0.057) (0.060) (2.290) (0.027) (0.031) (3.015) (0.045) (0.051) (3.200) (0.035) (0.039)
By GenderMale ‐1.057 0.041 ‐0.028 ‐0.312 0.023 0.005 0.289 ‐0.018 ‐0.045 ‐1.907 0.025 0.037
(1.961) (0.030) (0.028) (1.794) (0.021) (0.023) (1.777) (0.028) (0.027) (2.002) (0.022) (0.024)Female ‐1.467 ‐0.005 ‐0.013 3.719 0.034 0.072 ** ‐2.201 ‐0.027 ‐0.075 * ‐0.480 0.015 0.008
(1.555) (0.024) (0.025) (1.988) (0.024) (0.026) (1.932) (0.033) (0.033) (1.382) (0.017) (0.018)
By Free Lunch StatusFree Lunch ‐1.719 0.021 ‐0.028 1.889 0.039 0.049 * ‐0.686 ‐0.022 ‐0.048 ‐2.983 0.034 0.052 *
(1.578) (0.025) (0.026) (1.636) (0.021) (0.023) (1.612) (0.027) (0.028) (1.575) (0.019) (0.021)Non‐Free Lunch ‐1.066 0.019 ‐0.076 1.815 ‐0.011 ‐0.035 ‐3.698 0.095 ‐0.038 1.332 ‐0.010 ‐0.020
(3.591) (0.051) (0.052) (3.768) (0.037) (0.042) (4.226) (0.059) (0.061) (2.972) (0.030) (0.033)
By English Language Learner StatusEnglish Language Learner 1.035 0.008 0.006 1.294 0.018 0.008 ‐0.455 ‐0.052 ‐0.060 * 1.294 0.030 0.040
(2.121) (0.036) (0.035) (2.050) (0.028) (0.032) (1.758) (0.029) (0.029) (2.612) (0.034) (0.038)Non‐English Language Learner ‐3.641 * 0.016 ‐0.022 1.152 0.026 0.040 ‐1.005 0.012 ‐0.041 ‐1.591 0.018 0.019
(1.608) (0.023) (0.024) (1.764) (0.021) (0.023) (1.932) (0.031) (0.030) (1.276) (0.014) (0.016)
Effect of Failing ELA CAHSEE
11th Grade ELA CST
Present, Spring 12th
Grade11th Grade ELA CST
Present, Spring 12th
Grade
When Passing ELA CAHSEE
11th Grade ELA CST
Present, Spring 12th
Grade11th Grade ELA CST
Table 8: Effect of Failing ELA and Math CAHSEE, by Student Subgroups, Pooled Sample Including All Districts and Cohorts
Effect of Failing Math CAHSEEWhen Failing Math CAHSEE When Passing Math CAHSEE When Failing ELA CAHSEE
Present, Spring 12th
Grade
Notes: * p<0.05, ** p<0.01, *** p<0.001. Models using presence or graduation as the dependant variable use students in the 2004 and 2005 cohorts from all four districts. Models using 11th grade ELA CST score as the dependant variable use students from all four districts in the 2004, 2005 and 2006 cohorts. All models use district by cohort‐fixed effects. Models estimating effects on subgroups limit the sample to students in that subgroup. The estimated models regress the outcome variable on the centered Math/ ELA scale score, the centered Math/ ELA scale score squared, an indicator variable that equals one if a student failed the Math/ ELA exam and a vector of covariates: English language learner classification, race/ ethnicity. The above table reports the point estimate and standard error on the coefficient estimating the effect of failing the Math/ ELA CASHEE exam on each of the three outcome variables. All models restrict the sample to students scoring 300‐400 on the relevant CAHSEE exam section. Models for students who fail the other CAHSEE exam section further restrict the sample to students who score 300‐349 on that exam. Models for students who pass the other CAHSEE exam section are limited to students who scored 350‐400 on that exam. See text for details regarding the construction of cohorts and outcome variables. All models exclude students who were classified as "Special Education" at any point.
Graduation Graduation Graduation Graduation
46

Outcome Variable:White 0.013 ‐0.026 * ‐0.011 ‐0.005
(0.012) (0.013) (0.012) (0.012)Black 0.018 0.014 0.002 0.009
(0.017) (0.016) (0.018) (0.015)Hispanic ‐0.028 0.032 ‐0.022 0.004
(0.021) (0.022) (0.024) (0.019)Asian ‐0.005 ‐0.009 0.031 ‐0.012
(0.013) (0.016) (0.016) (0.012)Male 0.017 0.012 ‐0.041 ‐0.025
(0.021) (0.022) (0.024) (0.019)Free Lunch 0.010 0.011 0.015 ‐0.012
(0.019) (0.021) (0.021) (0.019)Native English Speaker 0.040 ‐0.016 ‐0.015 ‐0.004
(0.021) (0.021) (0.023) (0.019)9th Grade ELA CST Score ‐0.330 ‐2.151 0.872 ‐1.019
(1.154) (1.213) (1.273) (1.085)Notes: * p<0.05, ** p<0.01, *** p<0.001. Models use students from all four districts in the 2004, 2005 and 2006 cohorts. All models use district by cohort‐fixed effects. The estimated models regress the outcome variable on the centered Math/ ELA scale score, the centered Math/ ELA scale score squared, and an indicator variable that equals one if a student failed the Math/ ELA exam. The above table reports the point estimate and standard error on the coefficient estimating the effect of failing the CASHEE exam on each of the outcome variables. All models restrict the sample to students scoring 300‐400 on the relevant CAHSEE exam section. Models for students who fail the other CAHSEE exam section further restrict the sample to students who score 300‐349 on that exam. Models for students who pass the other CAHSEE exam section are limited to students who scored 350‐400 on that exam. See text for details regarding the construction of cohorts and outcome variables. All models exclude students who were classified as "Special Education" at any point. The model estimating the effect of failing the exam on free lunch status excludes students from San Diego
Table A1: Effect of Failing ELA and Math CAHSEE on Student Characteristics
Effect of Failing Math CAHSEE
When Failing Math CAHSEE
When Passing Math CAHSEE
When Failing ELA CAHSEE
When Passing ELA
CAHSEE
Effect of Failing ELA CAHSEE
47

11th Grade ELA
CST
Present, Spring 12th Grade Graduates
11th Grade ELA
CST
Present, Spring 12th Grade Graduates
11th Grade ELA
CST
Present, Spring 12th Grade Graduates
11th Grade ELA
CST
Present, Spring 12th Grade Graduates
All Students 8,194 7,188 6,871 17,105 12,573 12,333 6,879 5,943 5,662 18,717 14,089 13,813
By DistrictFresno 2,341 1,991 1,674 3,952 2,877 2,637 2,014 1,690 1,409 4,278 3,170 2,894Long Beach 2,652 2,223 2,223 5,172 3,814 3,814 2,219 1,900 1,900 5,654 4,149 4,149San Diego 2,475 2,309 2,309 5,676 4,109 4,109 1,903 1,704 1,704 6,473 4,962 4,962San Franciso 726 677 677 2,305 1,825 1,825 743 661 661 2,312 1,859 1,859
By RaceWhite 568 531 504 2,413 1,801 1,753 343 311 288 2,710 2,103 2,050Black 1,557 1,414 1,353 2,277 1,746 1,723 1,036 958 912 2,851 2,246 2,209Hispanic 4,786 4,123 3,939 7,474 5,344 5,233 3,991 3,413 3,248 8,427 6,176 6,044Asian 878 751 709 3,443 2,574 2,520 1,164 954 910 3,148 2,376 2,326
By GenderMale 3,592 3,244 3,091 8,660 6,384 6,256 3,768 3,296 3,139 8,511 6,373 6,251Female 4,604 3,946 3,782 8,447 6,189 6,077 3,113 2,648 2,524 10,208 7,717 7,563
By Free LunchFree Lunch 4,701 3,982 3,720 8,313 6,012 5,840 4,233 3,571 3,335 8,809 6,417 6,221Non‐Free Lunch 1,018 901 846 3,118 2,458 2,390 744 671 626 3,436 2,717 2,637
By English Language Learner ClassificationEnglish Language Learner 3,148 2,764 2,633 2,551 2,036 1,982 3,653 3,122 2,989 2,030 1,661 1,611Non‐English Language Learn 5,043 4,423 4,237 14,551 10,535 10,349 3,226 2,821 2,673 16,681 12,425 12,199Notes: See tables 1‐3 for information on individual models. Note that sample sizes for "All Students" will be slightly larger than the sum of the district samples, as the by district models for Fresno, Long Beach and San Francisco include the free lunch control variable.
Effect of Failing Math CAHSEEWhen Passing ELA CAHSEE
Table A2: Analytic Sample Sizes for Models in Tables 5‐7
Effect of Failing ELA CAHSEEWhen Failing Math CAHSEE When Passing Math CAHSEE When Failing ELA CAHSEE
48

Outcome Variable:Missing 11th Grade Math CST 0.007 0.010 0.019 0.004
(0.016) (0.013) (0.018) (0.012)0.016 ‐0.007 0.011 ‐0.019 *
(0.016) (0.011) (0.017) (0.010)‐0.017 ‐0.015 ‐0.041 * ‐0.053 ***(0.016) (0.017) (0.017) (0.014)
Notes: * p<0.05, ** p<0.01, *** p<0.001. Models use students from all four districts in the 2004, 2005 and 2006 cohorts. All models use district by cohort‐fixed effects. The estimated models regress the outcome variable on the centered Math/ ELA scale score, the centered Math/ ELA scale score squared, and an indicator variable that equals one if a student failed the Math/ ELA exam. The above table reports the point estimate and standard error on the coefficient estimating the effect of failing the CASHEE exam on each of the outcome variables. All models restrict the sample to students scoring 300‐400 on the relevant CAHSEE exam section. Models for students who fail the other CAHSEE exam section further restrict the sample to students who score 300‐349 on that exam. Models for students who pass the other CAHSEE exam section are limited to students who scored 350‐400 on that exam. See text for details regarding the construction of cohorts and outcome variables. All models exclude students who were classified as "Special Education" at any point. The model estimating the effect of failing the exam on free lunch status excludes students from San Diego.
Table A3: Effect of Failing ELA and Math CAHSEE on 11th Grade Math CST Test Taken
Effect of Failing Math CAHSEE
When Failing Math CAHSEE
When Passing Math CAHSEE
When Failing ELA CAHSEE
When Passing ELA CAHSEE
Effect of Failing ELA CAHSEE
Took 11th Grade CST Higher than Algebra 1
Took 11th Grade CST Higher than Geometry
49

Effect of Failing ELA CAHSEE
Outcome11th Grade ELA CST ‐1.136 ‐1.75 ‐1.728 ‐1.014
(1.214) (1.126) (1.359) (1.216)Present, Spring of 12th Grade 0.019 0.002 0.012 0.019
(0.019) (0.018) (0.020) (0.019)Graduation ‐0.018 ‐0.025 ‐0.021 ‐0.017
(0.018) (0.017) (0.021) (0.018)
Outcome11th Grade ELA CST 1.373 ‐1.206 0.838 1.559
(1.322) (1.229) (1.474) (1.324)Present, Spring of 12th Grade 0.030 0.013 0.035 0.031
(0.016) (0.015) (0.019) (0.016)Graduation 0.033 ‐0.001 0.036 0.031
(0.017) (0.017) (0.020) (0.017)
Effect of Failing Math CAHSEE
Outcome11th Grade ELA CST ‐0.575 ‐0.003 ‐0.638 ‐0.579
(1.297) (1.187) (1.463) (1.298)Present, Spring of 12th Grade ‐0.019 0.003 ‐0.020 ‐0.018
(0.021) (0.019) (0.023) (0.021)Graduation ‐0.052 * ‐0.039 * ‐0.053 * ‐0.049 *
(0.021) (0.019) (0.024) (0.021)
Outcome11th Grade ELA CST ‐1.103 ‐1.545 ‐1.11 ‐1.275
(1.155) (1.185) (1.283) (1.161)Present, Spring of 12th Grade 0.020 0.020 0.030 0.022
(0.013) (0.013) (0.016) (0.013)Graduation 0.023 0.023 0.036 * 0.021
(0.014) (0.015) (0.018) (0.014)Linear term varies on each side of cut off XSample uses students scoring 325‐375 XSample uses students scoring 300‐400 X X XCovariates included X X XQuadratic term X X X XDistrict by cohort‐fixed effects X X X XNotes: * p<0.05, ** p<0.01, *** p<0.001. Models using presence or graduation as the dependant variable use students in the 2004 and 2005 cohorts from all four districts. Models using 11th grade ELA CST score as the dependant variable use students from all four districts in the 2004, 2005 and 2006 cohorts.The vector of covariates, includes English language learner classification, race/ ethnicity, 10th grade GPA and 8th grade ELA and Math CST scores. The above table reports the point estimate and standard error on the coefficient estimating the effect of failing the relevant CASHEE exam on each of the three outcome variables. All models for students who fail the other CAHSEE exam section further the sample to students who score 300‐349 on that exam. Models for students who pass the other CAHSEE exam section are limited to students who scored 350‐400 on that exam. See text for details regarding the construction of cohorts and outcome variables. All models exclude students who were classified as "Special Education" at any point.
(Model 1) (Model 2) (Model 3) (Model 4)
When Failing ELA CAHSEE
(Model 1) (Model 2)
(Model 4)
When Passing Math CAHSEE
(Model 3) (Model 4)
(Model 3) (Model 4)
(Model 1) (Model 2)
Table A4: Estimated Effects of Failing CAHSEE: Alternate Model Specifications
When Passing ELA CAHSEE
When Failing Math CAHSEE(Model 1) (Model 2) (Model 3)
50