Embed Size (px)
Citation preview

ORIGINAL RESEARCH Open Access
Effects of different protocols of hydration oncardiorespiratory parameters during exerciseand recoveryFranciele Marques Vanderlei1*, Isadora Lessa Moreno1, Luiz Carlos Marques Vanderlei2, Carlos Marcelo Pastre2,Luiz Carlos de Abreu3 and Celso Ferreira4
Abstract
Introduction: Hydration plays a key role in the physiological maintenance required by exercise.
Objective: To evaluate the behavior of heart rate (HR), systolic (SBP) and diastolic (DBP) blood pressure, pulseoxygen saturation (SpO2) and respiratory rate (RR) of young people during and after prolonged physical exercise,with and without the intake of water or isotonic solution.
Method: 31 young individuals (21.63 ± 1.86 years) were subjected to a four-step protocol with a 48-hour intervalbetween each step, namely: i) a test to determine the incremental load used in subsequent steps, ii) a controlprotocol without hydration (CP), iii) an experimental protocol with water intake (PE1), iv) an experimental protocolwith ingestion of isotonic (PE2). The protocols consisted of 10 min rest, 90 min of exercise on a treadmill at 60% ofVO2peak and 60 min of recovery. The parameters HR, SBP, DBP, RR and SPO2 were measured at rest, at 30, 60 and90 min of exercise, with the exception of RR; and at 1, 3, 5, 7, 10, 20, 30, 40, 50 and 60 min of recovery. The two-factor analysis of variance for repeated measures model was used for analysis (p<0.05).
Results: There was a moment effect for all variables in exercise (p<0.001), however, no effect was observedbetween the protocols (SBP, p=0.998; DBP, p=0.897; SpO2, p=0.077, HR=0.281) and in the interaction moment andprotocol (SBP, p=0.058; DBP, p=0.191 and SpO2, p=0.510, HR=0.496). In recovery there was also a moment effect forall variables analyzed (p<0.001). There was no effect among protocols for SBP (p=0.986), DBP (p=0.536) and RR(p=0.539), however in the SpO2 (p=0.001) and HR (p=0.033) variables, effects were observed between the protocols.Regarding the moment and protocol interaction, an effect was observed for HR (SBP, p=0.431; DBP, p=0.086; SpO2,p=0.445, RR, p=0.147, HR, p=0.022).
Conclusion: For the type of exercise performed, both the water and the isotonic solution influenced the behaviorof cardiorespiratory parameters, and independent of the type of hydration given the behavior of the parametersstudied was similar.
Keywords: Aerobic exercise, Rehydration solutions, Heart rate, Blood pressure, Respiratory rate
* Correspondence: [email protected] student in Medicine (Cardiology), Federal University of São Paulo –UNIFESP, São Paulo, SP, BrazilFull list of author information is available at the end of the article
© 2013 Vanderlei et al.; licensee BioMed Central Ltd. This is an Open Access article distributed under the terms of the CreativeCommons Attribution License (http://creativecommons.org/licenses/by/2.0), which permits unrestricted use, distribution, andreproduction in any medium, provided the original work is properly cited.
Vanderlei et al. International Archives of Medicine 2013, 6:33http://www.intarchmed.com/content/6/1/33
IntroductionDehydration caused by prolonged exercise limits theability to work [1,2] and promotes, among other things,inadequate responses of the cardiovascular, autonomicand thermoregulation systems [3-6].Different studies have shown that hydration plays an
essential role in the tolerance of prolonged exercise,suggesting that it promotes a better response to increasedbody temperature [2,7] and ensures the maintenance ofphysiological functions and the proper functioning ofhomeostatic mechanisms required by the practice of exer-cise [8,9], helping to maintain blood pressure and cardiacoutput constant, thus supporting the increase in cutane-ous blood flow and sweat rate regulation according to thebody temperature [3].Hydration can be achieved in several ways, among
them water [10], isotonic solution [11], pasteurized milk[12], infusion of pure glucose [13] and solution of puresodium chloride [14]. Currently, researchers in the fieldof thermoregulation strive to detect possible advantagesand determine cost / benefit, especially in the case ofhydration with water and isotonic solution.Drinking water provides rapid gastric emptying without
the need to adjust palatability and offers a low financialcost [8], whereas the intake of carbohydrates and electro-lytes present in isotonic solution brings additional benefitsto the ability to perform, whether by increasing energyavailability, or aiding in fluid balance and temperatureregulation [11].Considering the organic changes promoted by exercise-
induced dehydration, it is important to study the changesthat may occur during and after prolonged exercise whenwater or isotonic solution is used as a source of replace-ment. A search of the literature showed no relevant stud-ies that evaluate and compare the effects of these twoforms of hydration on cardiorespiratory parameters whenadministered equally during exercise and throughout therecovery period. It is hypothesized that regardless of therehydration solution administered, during prolongedexercise there is a lower overload of the cardiorespira-tory parameters and better recovery of these parametersafter its completion.Thus, the objective of this study was to evaluate the
behavior of the heart rate (HR), systolic (SBP) and diastolic(DBP) blood pressure, pulse oxygen saturation (SpO2) andrespiratory rate (RR) of young people during and afterprolonged physical exercise, with and without the intakeof water or isotonic solution.
MethodPopulationTo conduct this study, we analyzed data from 31 appar-ently healthy, male volunteers, with a mean age of 21.63 ±
1.86 years, and classified as active by the InternationalPhysical Activity Questionnaire (IPAQ) [15].Excluded form the study were volunteers who had at
least one of the following characteristics: smoking, use ofmedications that would influence the autonomic activityof the heart, alcoholics, patients with known metabolicand/or endocrine disorders, or a sedentary, or insuffi-ciently active or overactive lifestyle according to IPAQ.During the execution of the experimental protocol not asingle volunteer was excluded.The volunteers were informed of the objectives and pro-
cedures of this study, and after agreeing, signed a consentform. All procedures were approved by the Ethics Com-mittee of the Federal University of São Paulo via PlatformBrazil (CA0AE: 02481012.0.1001.5505) and conformedwith resolution 196/96 of the National Health Council.
Study designAll volunteers were subjected to an experimental proced-ure divided into four stages, with an interval of 48 hoursbetween each stage to allow for recovery. The first stepperformed was an incremental test on a treadmill to deter-mine peak oxygen consumption (peak VO2) and to adopt60% of this value for the load used in the other stages.In the subsequent steps the volunteers performed
three different protocols, namely the control protocol(CP), the hydration with water protocol (PE1) and thehydration with isotonic drink protocol (PE2), whichconsisted of 10 min of rest in the supine position, followedby 90 min of exercise (60% VO2peak) and 60 min ofrecovery. In CP no hydrating solution was administered,whereas in PE1 water was given, and PE2 received ahydroelectrolytic solution (Gatorade, Brazil): the liquidswere administered in 10 equal portions at regular 15-minute intervals, commencing 15 minutes after thestart of exercising until the end of the recovery period.Before performing these steps, the volunteers were
subjected to a urine collection, for analysis of the degreeof hydration, and body weight and height were measured.The body temperature was measured at the end of the restperiod prior to exercise and at the end of the exerciseperiod. For the assessment of the cardiorespiratory pa-rameters SBP, DBP, HR, SpO2 and RR were measured.All these parameters were measured at the end of the10th minute of rest pre-exercise and during exercise at30, 60 and 90 min, except for RR which was not evalu-ated in the exercise. In the recovery period all parame-ters were evaluated at 1, 3, 5, 7, 10, 20, 30, 40, 50 and60 min. The volunteers’ body weight was measuredagain at the end of the recovery period.
Incremental testThe incremental exercise test was performed on a treadmill(Super ATL, Inbrasport, Brazil), according to the maximal
Vanderlei et al. International Archives of Medicine 2013, 6:33 Page 2 of 10http://www.intarchmed.com/content/6/1/33
Bruce protocol [16], to determine peak oxygen consump-tion (peak VO2) and adopt 60% of this value for the loadused in the following steps. During this procedure, thesubjects were at rest on the mat in the standing positionin order to stabilize the initial values of the cardiorespira-tory parameters, and then the test started. To determineoxygen consumption (VO2), expired gases were analyzedby a regularly calibrated metabolic analyzer (VO2000,Medical Graphics, St. Paul, MN, USA) [10]. The VO2peakwas considered the highest VO2 achieved in the test, andverbal encouragement was used in an attempt to obtain amaximum physical effort, and the test was interrupted byvoluntary exhaustion.
Control and experimental protocolsAll protocols were performed in a room with an averagetemperature of 26.0°C ± 2.34 and humidity of 55.13 ±10.40 %, between the hours of 15 and 18 to avoid circa-dian variation. In order to ensure initial hydration con-dition, subjects ingested 500 ml of water, two hoursbefore the protocols [17]. To perform all the steps, thevolunteers were instructed to refrain from consumingcaffeine-based drinks for 24 hours before the tests andto have a light, fruit-based meal, two hours before, toavoid intense physical activities the day before the testand to be dressed in appropriate and comfortable clothing(shorts, shirt, shoes and socks).For each protocol performed, upon arrival at the col-
lection site the following were measured: the volunteers’weight, standing undressed (Plenna digital scale, TIN00,139 MAXIMA, Brazil) and height (stadiometer ES2020 - Sanny, Brazil). An HR (Polar Electro - S810i,Kempele, Finland) heart monitor was strapped over theregion of the precordium and the receiver attached tothe wrist to record this parameter and the volunteerswere asked to rest in the supine position for 10 minutes.Immediately after, the axillary temperature (thermometerBD Thermofácil, China), HR, SBP, DBP, RR and SpO2
were measured.Then, the subjects performed 90 minutes of treadmill
exercise (60% VO2peak) and at 30, 60 and 90 min theirHR, SBP, DBP, and SpO2 were measured. At the end ofthe exercise, the subjects were asked to rest in the supineposition, to begin 60 min of recovery, and the axillarytemperature was again recorded. The HR, SBP, DBP, SpO2
and RR parameters were measured at 1, 3, 5, 7, 10, 20, 30,40, 50 and 60 min of recovery. At the end of that time, theundressed subjects’ weight was measured again.The amount of water or isotonic fluid administered
during exercise and recovery in PE1 and PE2 was basedon the difference in body weight measured before andafter CP. This technique implies that the loss of one gramof body mass is equivalent to a milliliter of lost fluid [18].Furthermore, in PE1 and PE2, the measurement of the
cardiorespiratory parameters in the coinciding momentsoccurred immediately after ingestion of the respectivesolutions.
Analysis of cardiorespiratory parametersThe analysis of HR was undertaken by means of acardiac frequency counter (Polar Electro Oy - S810imodel), equipment previously validated to capture beat-to-beat HR [19,20]. A blood pressure measurement wastaken indirectly using a stethoscope (Littmann, SaintPaul, USA) and an aneroid sphygmomanometer (WelchAllyn - Tycos, New York, USA) on the left arm ofvolunteers, according to the criteria established by VIth
Brazilian Guidelines on Hypertension [21]. RR measureswere performed by counting breaths for 1 min withoutthe volunteer being aware of the process, so that theusual characteristics of breathing were not modified.SpO2 was verified by a pulse oximeter (Mindray PM-50Pulse Oximeter, China).
Statistical analysisFor the data analysis of the population’s profile thedescriptive statistical method was used and the resultswere presented as mean values, standard deviations, me-dian, minimum and maximum values. Data normalitywas assessed using the Shapiro-Wills test.For weight and body temperature, the comparison be-
tween the moments of the same protocol was performedusing the Student t test for unpaired data when the dis-tribution was normal or the Wilcoxon test for data withnon-normal distribution. For analysis between protocols,one-way ANOVA was used with post Tukey test for nor-mally distributed data or the Kruskal Wallis with Dunn’spost test for non-normal data.The comparisons of cardiorespiratory parameters be-
tween protocols (CP vs. PE1 vs. PE2) and moments(rest vs. time in exercise and rest vs. recovery time)was made by means of the variance analysis techniquefor repeated measures model in the two-factors scheme.The measurement data were checked for repeatedviolation of sphericity using Mauchly’s test and theGreenhouse-Geisser correction was used when spher-icity was violated.For analysis of the moments (rest vs. time in exercise
and rest vs. recovery time) the Bonferroni post-test forparametric distribution was used or the Dunnet post-test for nonparametric distribution, and analysis of dif-ferent moments between groups was accomplished usingOne-Way ANOVA or the Kruskal Wallis test. Statisticalsignificance was set at 5% for all analyzes, and calcula-tions were performed using SPSS software - version 13.0(SPSS Inc., Chicago, IL, USA).
Vanderlei et al. International Archives of Medicine 2013, 6:33 Page 3 of 10http://www.intarchmed.com/content/6/1/33

ResultsTable 1 shows the anthropometric characteristics of thestudy population jointly with the results obtained in theincremental test.As can be seen in Table 2, the values of initial
temperature and weight in CP differ statistically with re-spect to final values, with reduced weight and increasedtemperature. In PE1 and PE2 only a significant increasein body temperature was observed. Comparing the pro-tocols, only the final body temperature of CP showedhigher values compared to PE2 (p <0.05).The analysis showed that during exercise there was a
moment effect for all variables analyzed (p <0.001). Inthis condition no effect was observed between the pro-tocols (SBP, p = 0.998; DBP, p = 0.897; SpO2, p = 0.077,HR = 0.281) and interaction moment and protocol(SBP, p = 0.058; DBP, p = 0.191 and SpO2, p = 0.510,HR = 0.496).The results for the SBP, DBP and SpO2 variables at
rest and during exercise are shown in Figure 1 in allprotocols significant differences were observed in theSBP and DBP variables when rest is compared with 30,60 and 90 min of exercise, with the same occurring withHR. For SpO2 a significant decrease was observed at the90 min mark compared with rest in CP, while in PE2,there was a significant decrease at the times of 60 and90 min compared to rest.In recovery, the moment effect was observed for all
variables (p <0.001). There was no effect betweenprotocols for SBP (p = 0.986), DBP (p = 0.536) andRR (p = 0.539), however for the SpO2 (p = 0.001) andHR (p = 0.033) variables, effects were observed betweenthe protocols. Regarding the interaction moment and proto-col, an effect was observed only for HR (SBP, p = 0.431;DBP, p = 0.086; SpO2, p = 0.445; RR, p = 0.147; HR,p = 0.022).Significant differences were observed for SBP in CP
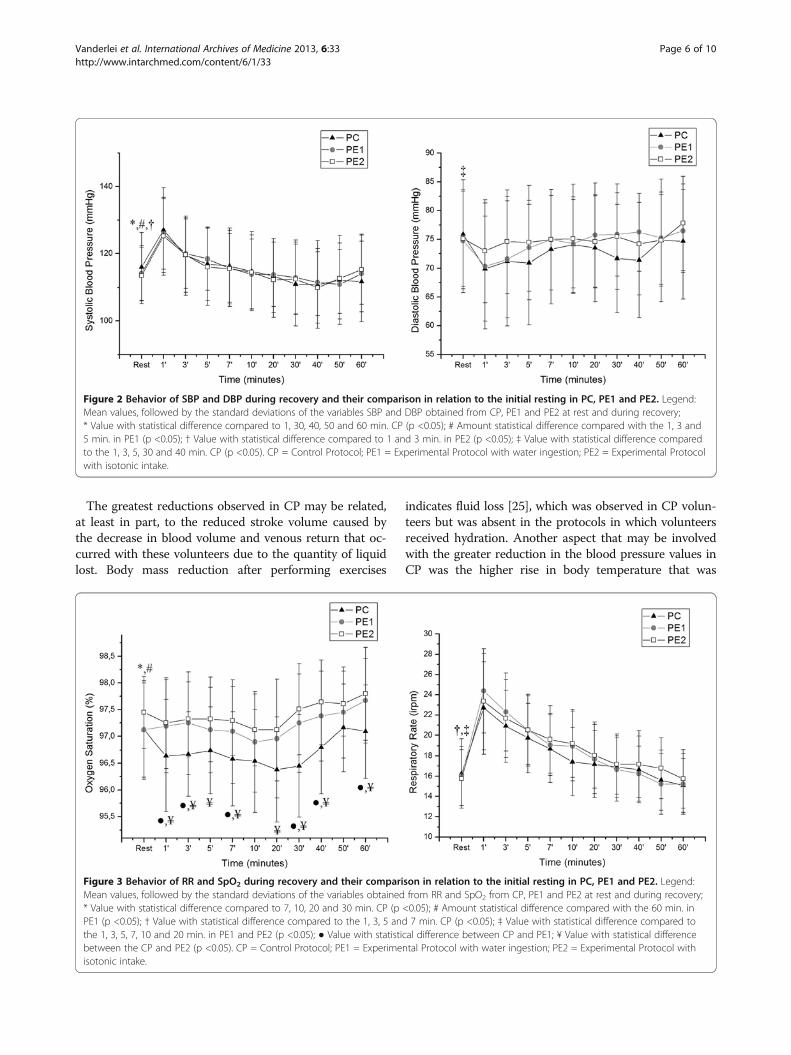
between rest and at 1, 30, 40, 50 and 60 min of recovery.
For PE1, rest differed at 1, 3 and 5 min, and in PE2 at 1and 3 min. As for DBP, only in CP did rest show signifi-cant differences compared to times 1, 3, 5, 30 and 40min (Figure 2).The results obtained for RR and SpO2 at rest and during
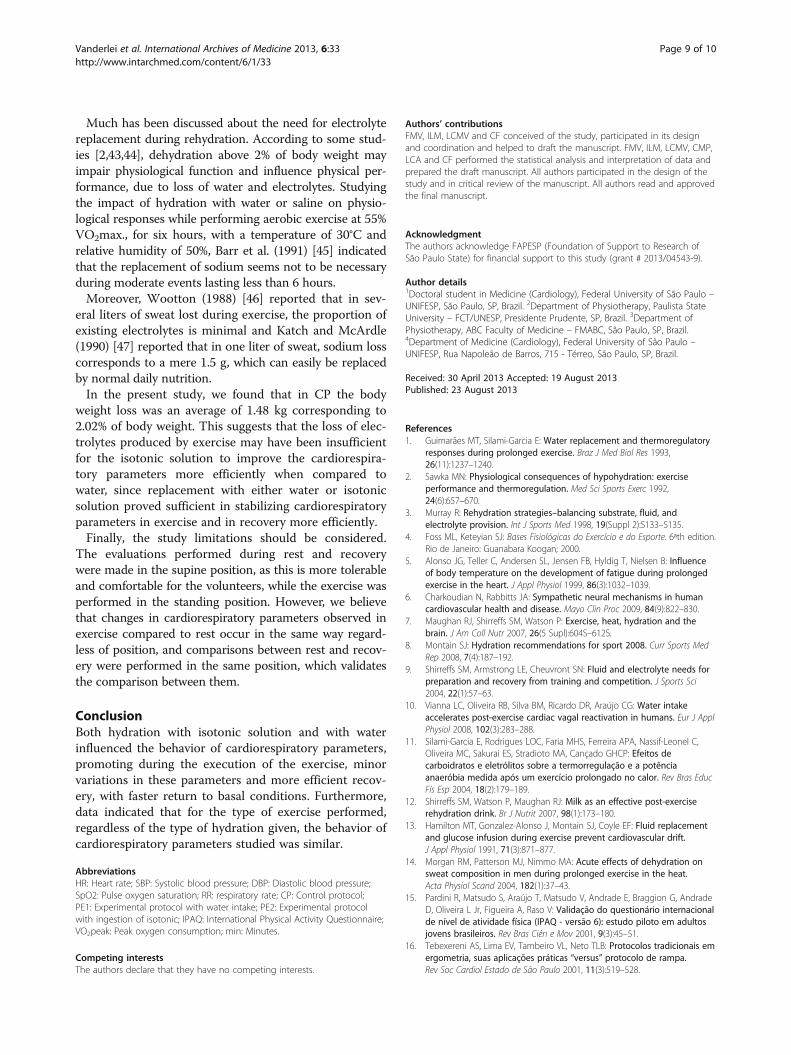
recovery are shown in Figure 3. For the SpO2 variable inCP, the values at 7, 10, 20 and 30 min were lower com-pared to rest, while in PE1, rest differed only at 60 min,showing a slight increase. In the comparison between theprotocols except at the 50 min mark, lower values of SpO2
were observed for CP compared to PE2, and the sameoccurred in the comparison between CP and PE1 at 1, 3,7, 30, 40 and 60 min. As for RR in CP, rest differed from1, 3, 5 and 7 min, while in PE1 and PE2 rest differedfrom 1, 3, 5, 7, 10 and 20 min.Figure 4 shows the behavior of HR in the three protocols
conducted during exercise (A) and recovery (B). In CPand PE2, rest was statistically different from all otherstages of recovery, while in PE1, rest differed from times 1,3, 5, 7, 10 and 30 min. In the comparison between proto-cols, the values obtained in CP were higher compared withPE1 and PE2 at 20, 40 and 50 min.
DiscussionThe present study evaluated in young individuals theinfluence of hydration carried out with water or isotonicsolution on the cardiopulmonary parameters during andafter prolonged, submaximal exercise. The results showedthat both hydration with isotonic solution and with waterinfluenced the behavior of cardiorespiratory parameters,promoting minor fluctuations in these variables duringthe execution of the exercise and more efficient recovery,with a faster return to baseline levels of these parameters.Furthermore, data indicated that for the type of exerciseperformed, regardless of the type of hydration given,the behavior of cardiorespiratory parameters studiedwas similar.During exercise there was an increase in SBP and a
reduction in DBP compared to rest. In general, duringexercise, SBP increases in proportion to the increase incardiac output [22], while DBP can reduce or maintainits values as a result of higher blood absorption bymuscle capillaries [4], so the blood pressure responsesobserved in this study are normal and expected for thetype of exercise performed.During exercise, there were reductions in SBP and
DBP between the times of 30 and 90 min, with thegreatest decreases in CP. Reductions in SBP and DBPwere also observed by other authors after two hours ofexercise in hypohydrated condition, which did not occurwhen hydration was maintained [23]. Significant reduc-tions in SBP and mean blood pressure following an hourof exercise in dehydrated condition with maintenance ofDBP were also reported in the literature [24].
Table 1 Mean values, followed by the standard deviation,and median of anthropometric variables and theincremental test of analyzed individuals
Variables Mean ± standarddeviation (Median)
Minimum - Maximum
Age (years) 21.63 ± 1.86 (22.00) 18.00 – 25.00
Weight (Kg) 72.62 ± 11.53 (72.20) 53.80 – 95.30
Height (m) 1.77 ± 0.08 (1.78) 1.60 – 1.94
BMI (Kg.m2) 22.99 ± 2.83 (22.30) 16.87 – 28.07
VO2pico (l.min-1) 3.37 ± 0.60 (3.34) 2.02 – 5.14
60% VO2pico (l.min-1) 2.02 ± 0.36 (2.00) 1.21 – 3.08
HR (bpm) 160.74 ± 10.75 (162.00) 139.00 – 179.00
Legend: BMI body mass index, kg kilograms, m meters, VO2peak peak oxygenconsumption; l liter, min minute, HR heart rate, bpm beats per minute.
Vanderlei et al. International Archives of Medicine 2013, 6:33 Page 4 of 10http://www.intarchmed.com/content/6/1/33

Table 2 Mean values, followed by the standard deviation and median, the variables weight and body temperature ofindividuals analyzed in the CP, PE1 and PE2
Variables Time CP PE1 PE2
Weight (Kg) Initial 73.03 ± 11.56* (72.90) 73.05 ± 11.40 (73.20) 72.90 ± 11.50 (72.20)
Final 71.55 ± 11.30 (71.00) 72.97 ± 11.52 (72.60) 73.08 ±11.51 (72.60)
Body Temperature (°C) Initial 36.44 ± 0.47# (36.50) 36.45 ± 0.35* (36.50) 36.30 ± 0.37# (36.50)
Final 37.20 ± 0.53† (37.20) 37.04 ± 0.45 (37.00) 36.83 ± 0.42 (36.80)
*Value statistically compared with the end (Student’s t test for paired data, p <0.05); # Value with statistical difference compared to the end (Wilcoxon test, p <0.05);† Value with statistical difference in relation to PE2 (ANOVA with Tukey posttest, p <0.05).Legend: kg kilogram; °C degrees Celsius; CP Control Protocol; PE1 Experimental Protocol with water ingestion; PE2 Experimental Protocol with isotonic intake.
Figure 1 Behavior of SBP, DBP and SpO2 during exercise and their comparison in relation to the initial resting in PC, PE1 and PE2.Legend: Mean values, followed by the standard deviation of SBP, DBP and SpO2 obtained from the CP, PE1 and PE2 at rest and during exercise;* Value with statistical difference in the 30, 60 and 90 min. in CP, PE1 and PE2 (p <0.05); # Amount statistical difference compared with the 90 min.CP (p <0.05); † Value Statistically compared to 60 and 90 min in PE2 (p <0.05). CP = Control Protocol; PE1 = Experimental Protocol with wateringestion; PE2 = Experimental Protocol with isotonic intake.
Vanderlei et al. International Archives of Medicine 2013, 6:33 Page 5 of 10http://www.intarchmed.com/content/6/1/33
The greatest reductions observed in CP may be related,at least in part, to the reduced stroke volume caused bythe decrease in blood volume and venous return that oc-curred with these volunteers due to the quantity of liquidlost. Body mass reduction after performing exercises
indicates fluid loss [25], which was observed in CP volun-teers but was absent in the protocols in which volunteersreceived hydration. Another aspect that may be involvedwith the greater reduction in the blood pressure values inCP was the higher rise in body temperature that was
Figure 2 Behavior of SBP and DBP during recovery and their comparison in relation to the initial resting in PC, PE1 and PE2. Legend:Mean values, followed by the standard deviations of the variables SBP and DBP obtained from CP, PE1 and PE2 at rest and during recovery;* Value with statistical difference compared to 1, 30, 40, 50 and 60 min. CP (p <0.05); # Amount statistical difference compared with the 1, 3 and5 min. in PE1 (p <0.05); † Value with statistical difference compared to 1 and 3 min. in PE2 (p <0.05); ‡ Value with statistical difference comparedto the 1, 3, 5, 30 and 40 min. CP (p <0.05). CP = Control Protocol; PE1 = Experimental Protocol with water ingestion; PE2 = Experimental Protocolwith isotonic intake.
Figure 3 Behavior of RR and SpO2 during recovery and their comparison in relation to the initial resting in PC, PE1 and PE2. Legend:Mean values, followed by the standard deviations of the variables obtained from RR and SpO2 from CP, PE1 and PE2 at rest and during recovery;* Value with statistical difference compared to 7, 10, 20 and 30 min. CP (p <0.05); # Amount statistical difference compared with the 60 min. inPE1 (p <0.05); † Value with statistical difference compared to the 1, 3, 5 and 7 min. CP (p <0.05); ‡ Value with statistical difference compared tothe 1, 3, 5, 7, 10 and 20 min. in PE1 and PE2 (p <0.05); ● Value with statistical difference between CP and PE1; ¥ Value with statistical differencebetween the CP and PE2 (p <0.05). CP = Control Protocol; PE1 = Experimental Protocol with water ingestion; PE2 = Experimental Protocol withisotonic intake.
Vanderlei et al. International Archives of Medicine 2013, 6:33 Page 6 of 10http://www.intarchmed.com/content/6/1/33

observed in this protocol, which is associated with vaso-dilatation and consequently reduced blood pressure [26].The decrease in SpO2 observed during the performance
of physical exercise in the three protocols may be consid-ered physiological and expected. The analyzed volunteerswere healthy and without respiratory distress, and duringmoderate or intense physical activity, the blood flowsmore quickly through the alveolar capillaries, and con-sequently there is less time for exchanges between thehemoglobin and the alveolar air, which reduces the
SpO2 [27]. Moreover, the working muscles need asteady increase in the supply of oxygen and the inabilityof the circulatory system to provide this linear distribu-tion, may also be related to the decrease in SpO2 [28].As for HR, the highest values observed during exercise
in the CP can be explained by the decrease in plasmavolume that occurs with hypohydration. This conditiondecreases the systolic volume and in compensation, HRincreases in an attempt to maintain cardiac output andhence, blood flow to the active muscles in order to meet
Figure 4 Behavior of RH during exercise (A) and recovery (B) and their comparison in relation to the initial resting in PC, PE1 and PE2.Legend: Mean values, followed by the standard deviation of the variable obtained in HR from CP, PE1 and PE2 at rest and during exercise (A) andrecovery (B). * Value with statistical difference in the 30, 60 and 90 min. CP, PE1 and PE2 (p <0.05); ● Value with statistical difference in relation toall times on CP and PE2 (p <0.05); # Value with statistical difference compared to the 1, 3, 5, 7, 10 and 30 min. in PE1 (p <0.05); ‡ StatisticallyValue CP compared aoPE1 and PE2 (p <0.05). CP = Control Protocol; PE1 = Experimental Protocol with water ingestion; PE2 = ExperimentalProtocol with isotonic intake.
Vanderlei et al. International Archives of Medicine 2013, 6:33 Page 7 of 10http://www.intarchmed.com/content/6/1/33

the metabolic needs, and to the skin, enabling the body’stemperature reduction mechanism through perspiration.[29]. Montain and Coyle (1992) [30] demonstrated thatthe increase in body temperature and heart rate, as wellas the decrease in systolic volume during exercise aredirectly related to the degree of dehydration of theindividual.Lower HR values during the execution of prolonged
exercise among individuals hydrated with water [13] orisotonic solution [31] were reported. When hydrationoccurs during exercise, it appears to reduce the increasein HR and the decrease in stroke volume [25]. Callegaroet al. (2007) [32] observed that up to 35 minutes afterthe ingestion of 500 ml water, blood pressure and vascu-lar resistance increased and HR decreased. The authorssuggest that hydration leads to an increase in the sympa-thetic vasoconstrictor and thus triggers a blood pressureresponse that stimulates the reflex vagal modulation, de-creasing HR.In all protocols immediately after exercise (1 min) SBP
values remained high in relation to rest, which occursdue to the body’s need to effectively coordinate the variousmetabolic responses, such as increased blood flow to theskeletal muscle and critical tissues such as the heart andbrain [33].The reduction in sympathetic activity and the increase
in vagal tone which occurs in recovery lead to a decreasein HR and peripheral resistance, thereby decreasingcardiac output and, therefore, SBP [33], which can beseen in the protocols performed.In CP, SBP at the end of the recovery period studied
(60 minutes) showed lower values than the basal restingrate, which may be related to water loss associated withincreased body temperature that occurs in this protocol,which promotes a greater drop in cardiac output andtherefore a greater reduction in SBP [33].DBP values did not change when comparing recovery
times with rest in the protocols where there was fluidreplacement. However, in CP, a significant drop in DBPin the first minutes of recovery was observed, whichmay be related to greater increases in body temperaturedemonstrated after exercise in this protocol. In order toassist the process of heat dissipation, the cardiovascularsystem reduces peripheral resistance, promoting vaso-dilation with concomitant reduction in DBP [7,34].Hydration with water as well as with sports drinks,
had slight effects on blood pressure, so the differencesfound throughout the recovery period may be consideredcasual. Brown et al. (2005) [35] evaluated the role ofhydration carried out at rest with water and saline onthe cardiovascular responses of healthy young men andfound that hydration had little effect on blood pressurein the course of an hour following hydration. Morenoet al. (2012) [31], when analyzing submaximal prolonged
exercise in active young individuals, also observed that theadministration of electrolytic solution ingested during theentire period of exercise and recovery, promoted highervalues of SBP in the early minutes of recovery comparedto rest, while the values of DBP remained constant.Although we did not observe interaction between
moment and protocol, differences occurred between thegroups and moments for SpO2 during the recovery period.According to González-Alonso and Calbet (2003) [36]after exercise, reduction in muscle blood flow and oxygensupply occur due to decreased cardiac output and meanblood pressure produced by the reduction in VO2max inresponse to heat. Thus, we can infer that the hydratedcondition allowed the maintenance of SpO2 by protectingthe circulatory system.As for RR, in the first minutes of recovery higher
values were observed when compared to rest. One hy-pothesis for this is that the physical and chemical stimuliproduced by exercise, such as decreasing pH, increasingthe temperature and elevation of catecholamines in theblood, promote an elevation of RR [37,38]. Furthermore,the increase in gas exchange in the alveoli which occursduring exercise promotes increased RR [37,38].In general, HR decreased progressively during the re-
covery period in the three tests, however, there are dif-ferences between protocols and interaction betweenmoment and protocol (p = 0.022), indicating that hydra-tion, independent of the solution used, provided betterHR recovery when compared to the condition withouthydration.The faster recovery of HR in the hydration protocols
used can be related to two aspects. Some authors haveshown that hydration provides increased baroreflex sen-sitivity, a sharp decrease in sympathetic activity and con-sequently increased cardiac parasympathetic modulation[39,40], which could be responsible for HR recoveringfaster. Furthermore, in the hypohydrated condition theincreased body temperature stimulates a higher sinusnode firing rate [41], which might also be implicated inthe slower HR recovery which occurred in CP.It is noteworthy that although the hydration protocols
provided better HR recovery, a return to baseline valueswas not observed. Khanna and Manna (2005) [42], afterthe administration of 100 ml of hydroelectrolytic solu-tion found that 20 min recovery were insufficient for thereturn of HR to pre-exercise values, while another studyshowed that the return to baseline conditions did notoccur after 60 min of recovery with the ingestion ofisotonic solution [31].In general, except for some casual differences, regard-
ing type, intensity and duration of the proposed exercise(submaximal aerobic, 60% of VO2max, 90 min), bothhydration with water or isotonic solution promoted thesame effects on cardiorespiratory parameters.
Vanderlei et al. International Archives of Medicine 2013, 6:33 Page 8 of 10http://www.intarchmed.com/content/6/1/33
Much has been discussed about the need for electrolytereplacement during rehydration. According to some stud-ies [2,43,44], dehydration above 2% of body weight mayimpair physiological function and influence physical per-formance, due to loss of water and electrolytes. Studyingthe impact of hydration with water or saline on physio-logical responses while performing aerobic exercise at 55%VO2max., for six hours, with a temperature of 30°C andrelative humidity of 50%, Barr et al. (1991) [45] indicatedthat the replacement of sodium seems not to be necessaryduring moderate events lasting less than 6 hours.Moreover, Wootton (1988) [46] reported that in sev-
eral liters of sweat lost during exercise, the proportion ofexisting electrolytes is minimal and Katch and McArdle(1990) [47] reported that in one liter of sweat, sodium losscorresponds to a mere 1.5 g, which can easily be replacedby normal daily nutrition.In the present study, we found that in CP the body
weight loss was an average of 1.48 kg corresponding to2.02% of body weight. This suggests that the loss of elec-trolytes produced by exercise may have been insufficientfor the isotonic solution to improve the cardiorespira-tory parameters more efficiently when compared towater, since replacement with either water or isotonicsolution proved sufficient in stabilizing cardiorespiratoryparameters in exercise and in recovery more efficiently.Finally, the study limitations should be considered.
The evaluations performed during rest and recoverywere made in the supine position, as this is more tolerableand comfortable for the volunteers, while the exercise wasperformed in the standing position. However, we believethat changes in cardiorespiratory parameters observed inexercise compared to rest occur in the same way regard-less of position, and comparisons between rest and recov-ery were performed in the same position, which validatesthe comparison between them.
ConclusionBoth hydration with isotonic solution and with waterinfluenced the behavior of cardiorespiratory parameters,promoting during the execution of the exercise, minorvariations in these parameters and more efficient recov-ery, with faster return to basal conditions. Furthermore,data indicated that for the type of exercise performed,regardless of the type of hydration given, the behavior ofcardiorespiratory parameters studied was similar.
AbbreviationsHR: Heart rate; SBP: Systolic blood pressure; DBP: Diastolic blood pressure;SpO2: Pulse oxygen saturation; RR: respiratory rate; CP: Control protocol;PE1: Experimental protocol with water intake; PE2: Experimental protocolwith ingestion of isotonic; IPAQ: International Physical Activity Questionnaire;VO2peak: Peak oxygen consumption; min: Minutes.
Competing interestsThe authors declare that they have no competing interests.
Authors’ contributionsFMV, ILM, LCMV and CF conceived of the study, participated in its designand coordination and helped to draft the manuscript. FMV, ILM, LCMV, CMP,LCA and CF performed the statistical analysis and interpretation of data andprepared the draft manuscript. All authors participated in the design of thestudy and in critical review of the manuscript. All authors read and approvedthe final manuscript.
AcknowledgmentThe authors acknowledge FAPESP (Foundation of Support to Research ofSão Paulo State) for financial support to this study (grant # 2013/04543-9).
Author details1Doctoral student in Medicine (Cardiology), Federal University of São Paulo –UNIFESP, São Paulo, SP, Brazil. 2Department of Physiotherapy, Paulista StateUniversity – FCT/UNESP, Presidente Prudente, SP, Brazil. 3Department ofPhysiotherapy, ABC Faculty of Medicine – FMABC, São Paulo, SP, Brazil.4Department of Medicine (Cardiology), Federal University of São Paulo –UNIFESP, Rua Napoleão de Barros, 715 - Térreo, São Paulo, SP, Brazil.
Received: 30 April 2013 Accepted: 19 August 2013Published: 23 August 2013
References1. Guimarães MT, Silami-Garcia E: Water replacement and thermoregulatory
responses during prolonged exercise. Braz J Med Biol Res 1993,26(11):1237–1240.
2. Sawka MN: Physiological consequences of hypohydration: exerciseperformance and thermoregulation. Med Sci Sports Exerc 1992,24(6):657–670.
3. Murray R: Rehydration strategies–balancing substrate, fluid, andelectrolyte provision. Int J Sports Med 1998, 19(Suppl 2):S133–S135.
4. Foss ML, Keteyian SJ: Bases Fisiológicas do Exercício e do Esporte. 6ªth edition.Rio de Janeiro: Guanabara Koogan; 2000.
5. Alonso JG, Teller C, Andersen SL, Jensen FB, Hyldig T, Nielsen B: Influenceof body temperature on the development of fatigue during prolongedexercise in the heart. J Appl Physiol 1999, 86(3):1032–1039.
6. Charkoudian N, Rabbitts JA: Sympathetic neural mechanisms in humancardiovascular health and disease. Mayo Clin Proc 2009, 84(9):822–830.
7. Maughan RJ, Shirreffs SM, Watson P: Exercise, heat, hydration and thebrain. J Am Coll Nutr 2007, 26(5 Supl):604S–612S.
8. Montain SJ: Hydration recommendations for sport 2008. Curr Sports MedRep 2008, 7(4):187–192.
9. Shirreffs SM, Armstrong LE, Cheuvront SN: Fluid and electrolyte needs forpreparation and recovery from training and competition. J Sports Sci2004, 22(1):57–63.
10. Vianna LC, Oliveira RB, Silva BM, Ricardo DR, Araújo CG: Water intakeaccelerates post-exercise cardiac vagal reactivation in humans. Eur J ApplPhysiol 2008, 102(3):283–288.
11. Silami-Garcia E, Rodrigues LOC, Faria MHS, Ferreira APA, Nassif-Leonel C,Oliveira MC, Sakurai ES, Stradioto MA, Cançado GHCP: Efeitos decarboidratos e eletrólitos sobre a termorregulação e a potênciaanaeróbia medida após um exercício prolongado no calor. Rev Bras EducFís Esp 2004, 18(2):179–189.
12. Shirreffs SM, Watson P, Maughan RJ: Milk as an effective post-exerciserehydration drink. Br J Nutrit 2007, 98(1):173–180.
13. Hamilton MT, Gonzalez-Alonso J, Montain SJ, Coyle EF: Fluid replacementand glucose infusion during exercise prevent cardiovascular drift.J Appl Physiol 1991, 71(3):871–877.
14. Morgan RM, Patterson MJ, Nimmo MA: Acute effects of dehydration onsweat composition in men during prolonged exercise in the heat.Acta Physiol Scand 2004, 182(1):37–43.
15. Pardini R, Matsudo S, Araújo T, Matsudo V, Andrade E, Braggion G, AndradeD, Oliveira L Jr, Figueira A, Raso V: Validação do questionário internacionalde nível de atividade física (IPAQ - versão 6): estudo piloto em adultosjovens brasileiros. Rev Bras Ciên e Mov 2001, 9(3):45–51.
16. Tebexereni AS, Lima EV, Tambeiro VL, Neto TLB: Protocolos tradicionais emergometria, suas aplicações práticas “versus” protocolo de rampa.Rev Soc Cardiol Estado de São Paulo 2001, 11(3):519–528.
Vanderlei et al. International Archives of Medicine 2013, 6:33 Page 9 of 10http://www.intarchmed.com/content/6/1/33

17. Hernandez AJ, Nahas RM: Modificações dietéticas, reposição hídrica,suplementos alimentares e drogas: comprovação de ação ergogênica epotenciais riscos para a saúde. Rev Bras Med Esporte 2009, 15(3):3–12.
18. Von Duvillard SP, Braun WA, Markofski M, Beneke R, Leithäuser R: Fluids andhydration in prolonged endurance performance. Nutrition 2004,20(7–8):651–656.
19. Vanderlei LCM, Silva RA, Pastre CM, Azevedo FM, Godoy MF: Comparison ofthe Polar S810i monitor and the ECG for the analysis of heart ratevariability in the time and frequency domains. Braz J Med Biol Res 2008,41(10):854–859.
20. Gamelin FX, Berthoins S, Bosquet L: Validity of the polar S810 heart ratemonitor to measure R-R intervals at rest. Med Sci Sports Exerc 2006,38(5):887–893.
21. Sociedade Brasileira de Cardiologia/Sociedade Brasileira de Hipertensão/Sociedade Brasileira de Nefrologia: VI Diretrizes Brasileiras de Hipertensão.Arq Bras Cardiol 2010, 95(1 supl.1):1–51.
22. Monteiro MF, Sobral Filho DC: Exercício físico e o controle da pressãoarterial. Rev Bras Med Esporte 2004, 10(6):513–516.
23. González-Alonso J, Calbet JA, Nielsen B: Muscle blood flow is reduced withdehydration during prolonged exercise in humans. J Physiol 1998,513:895–905.
24. González-Alonso J, Mora-Rodríguez R, Below PR, Coyle EF: Dehydrationreduces cardiac output and increases systemic and cutaneous vascularresistance during exercise. J Appl Physiol 1995, 79(5):1487–1496.
25. Sawka MN, Burke LM, Eichner ER, Maughan RJ, Montain SJ, Stachenfeld NS:American College of Sports Medicine position stand. Exercise and fluidreplacement. Med Sci Sports Exerc 2007, 39(2):377–390.
26. Merry TL, Ainslie PN, Cotter JD: Effects of aerobic fitness onhypohydration-induced physiological strain and exercise impairment.Acta Physiol 2010, 198(2):179–190.
27. Powers SK, Howley ET: Fisiologia do Exercício. Teoria e aplicação aocondicionamento e ao desempenho. 4th edition. São Paulo: Manole; 2005.
28. Mortensen SP, Dawson EA, Yoshiga CC, Dalsgaard MK, Damsgaard R, SecherNH, González-Alonso J: Limitations to systemic and locomotor limbmuscle oxygen delivery and uptake during maximal exercise in humans.J Physiol 2005, 566(Pt 1):273–285.
29. Carvalho T, Rodrigues T, Meyer F, Júnior AHL, Rose EH: Modificaçõesdietéticas, reposição hídrica, suplementos alimentares e drogas:comprovação de ação ergogênica e potenciais riscos para a saúde.Rev Bras Med Esporte 2003, 9(2):43–56.
30. Montain SJ, Coyle EF: Influence of graded dehydration on hyperthermiaand cardiovascular drift during exercise. J Appl Physiol 1992,73(4):1340–1350.
31. Moreno IS, Pastre CM, Papoti M, Vanderlei LCM: Efeitos da reposiçãohidroeletrolítica sobre parâmetros cardiorrespiratórios em exercício erecuperação. Motriz 2012, 18(1):165–175.
32. Callegaro CC, Moraes RS, Negrão CE, Trombetta IC, Rondon MU, Teixeira MS,Silva SC, Ferlin EL, Krieger EM, Ribeiro JP: Acute wáter ingestión increasesarterial blood pressure in hypertensive and normotensive subjects.J Hum Hypertens 2007, 21(7):564–570.
33. Le VV, Mitiku T, Sungar G, Myers J, Froelicher V: The blood pressureresponse to dynamic exercise testing: A systematic review. ProgCardiovasc Dis 2008, 51(2):135–160.
34. Kurz A: Physiology of thermoregulation. Best Pract Res Clin Anaesthesiol2008, 22(4):627–644.
35. Brown CM, Barberini L, Dulloo AG, Montani JP: Cardiovascular responses towater drinking: does osmolality play a role? Am J Physiol Regul IntegrComp Physiol 2005, 289(6):R1687–R1692.
36. González-Alonso J, Calbet JA: Reductions in systemic and skeletal muscleblood flow and oxygen delivery limit maximal aerobic capacity inhumans. Circulation 2003, 107(6):824–830.
37. Hayashi K, Honda Y, Ogawa T, Kondo N, Nishiyasu T: Relationship betweenventilatory response and body temperature during prolngedsubmaximal exercise. J Appl Physiol 2006, 100(2):414–420.
38. White MD: Components and mechanisms of thermal hyperpnea. J ApplPhysiol 2006, 101(2):655–663.
39. Charkoudian N, Halliwill JR, Morgan BJ, Eisenach JH, Joyner MJ: Influencesof hydration on post-exercise cardiovascular control in humans. J Physiol2003, 522(2):635–644.
40. Yun AJ, Lee PY, Bazar KA: Clinical benefits of hydration and volumeexpansion in a wide range of illnesses may be attributable to reductionof sympatho-vagal ratio. Med Hypotheses 2005, 64(3):646–650.
41. Crandall CG, Zhang R, Levine BD: Effects of whole body heating ondynamic baroreflex regulation of heart rate in humans. Am J Physiol HeartCirc Physiol 2000, 279(5):H2486–H2492.
42. Khanna GL, Manna I: Supplementary effect of carbohydrate-electrolytedrink on sports performance, lactate removal & cardiovascular responseof athletes. Indian J Med Res 2005, 121(5):665–669.
43. American College of Sports Medicine: Position stand: exercise and fluidreplacement. Med Sci Sports Exerc 1996, 28:i–vii.
44. Cheuvront SN, Carter R III, Sawka MN: Fluid balance and enduranceexercise performance. Curr Sports Med Rep 2003, 2(4):202–208.
45. Barr SI, Costill DL, Fink WJ: Fluid replacement during prolonged exercise:effects of water, saline or no fluid. Med Sci Sports Exerc 1991,23(7):811–817.
46. Wootton S: Nutrición y deporte. Zaragosa: Acriba; 1988.47. Katch FL, McArdle W: Nutrição, controle de peso, exercício. 2nd edition. Rio
de Janeiro: Medsi; 1990.
doi:10.1186/1755-7682-6-33Cite this article as: Vanderlei et al.: Effects of different protocols ofhydration on cardiorespiratory parameters during exercise and recovery.International Archives of Medicine 2013 6:33.
Submit your next manuscript to BioMed Centraland take full advantage of:
• Convenient online submission
• Thorough peer review
• No space constraints or color figure charges
• Immediate publication on acceptance
• Inclusion in PubMed, CAS, Scopus and Google Scholar
• Research which is freely available for redistribution
Submit your manuscript at www.biomedcentral.com/submit
Vanderlei et al. International Archives of Medicine 2013, 6:33 Page 10 of 10http://www.intarchmed.com/content/6/1/33